This publication was supported by the National Sea Grant College Program of the U.S. Department of Commerce s National Oceanic and Atmospheric
|
|
|
- Paulina Wood
- 5 years ago
- Views:
Transcription


1
2 This publication was supported by the National Sea Grant College Program of the U.S. Department of Commerce s National Oceanic and Atmospheric Administration (NOAA), Grant No. NA16RG-2195; the Florida Fish and Wildlife Conservation Commission; the Florida Department of Environmental Protection, Florida Coastal Management Program, pursuant to National Oceanic and Atmospheric Administration award number NA04NOS ; and the Federal Aid in Sport Fish Restoration Program. The views expressed are those of the authors and do not necessarily reflect the view of these organizations. Additional copies are available by contacting Florida Sea Grant, University of Florida, PO Box , Gainesville, FL, , (352) , TP 150 September 2005
3 A Recreational Boating Characterization for the Greater Charlotte Harbor Charles Sidman Coastal Planning Specialist Florida Sea Grant University of Florida Robert Swett Assistant Professor Fisheries and Aquatic Sciences University of Florida Timothy Fik Associate Professor Department of Geography University of Florida Susan Fann Editorial and GIS Specialist Florida Sea Grant University of Florida David Fann Editorial and GIS Specialist Florida Sea Grant University of Florida Bill Sargent Research Scientist Florida Fish and Wildlife Conservation Commission Fish and Wildlife Research Institute St. Petersburg, Florida
4 Table of Contents FIGURES... iii TABLES... iii ACKNOWLEDGMENTS... vii ABSTRACT... viii CHAPTERS 1. INTRODUCTION... 1 Background... 1 Study Goal and Objectives... 1 Study Region MAIL SURVEY... 5 Survey Instrument... 5 Sample Design... 6 Sample Selection... 6 Survey Return Breakdown GIS DATABASE DEVELOPMENT Spatial Database Design MAPPING BOATING PATTERNS General Clustering Patterns BOATER-GROUP CHARACTERISTICS Overview Boater and Use Profile: Vessel Type, Experience, and Use Rationale for Selecting Departure Sites, and Travel Routes Boater Activity Profile Perceived Congestion PERCEIVED DETRACTORS AND NEEDS Overview Detractors Needs EVALUATING MAIL SURVEY RESPONSE BIAS A Comparison of Early versus Late Responders SUMMARY ii
5 LITERATURE CITED APPENDICES FIGURES Figure 1. The Greater Charlotte Harbor Study Area... 3 Figure 2. The Charlotte Harbor Boating Region... 4 Figure 3. Greater Charlotte Harbor Ramps Surveyed... 8 Figure 4. Greater Charlotte Harbor Marinas Surveyed Figure 5. Spatial Distribution of the Greater Charlotte Harbor Dock Sample Figure 6. Example of GIS Attribute Query and Display: Nature Viewing Spots Figure 7. Example of GIS Attribute Query and Display: Reported Travel Routes Figure 8. Travel Corridors as Summarized with the GIS Figure 9. Favorite Destinations as Summarized with the GIS Figure 10. Congested Areas as Summarized with the GIS TABLES Table 1. Breakdown of Unique Tag Numbers Collected and VTRS Matches by Ramp... 7 Table 2. Breakdown of Vessel Bow Numbers Collected from Marinas... 9 Table 3. Dock Sample Selection Table 4. Survey Return Breakdown Table 5a. Vessel Type for First Trip Table 5b. Vessel Type for Second Trip Table 6. Vessel Departure Categories / Departure Sites Table 7. Average Monthly Residence per year in the State of Florida Table 8. Boating Experience in Florida (in years) Table 9. Years of Boating Experience in Florida by Departure Category Table 10. Boaters Having Completed a Boat Safety/Seamanship Course by Departure Category Table 11. Age of Boaters by Departure Category Table 12a. Boater Willingness to Participate in a Future Internet Survey Table 12b. Boater Willingness to Participate in a Future Mail Survey iii
6 Table 13. Drive Time from Home to Marina (in minutes) Table 14a. Number of Times Per Year that First-choice Ramp/Shoreline is Used to Launch a Boat Table 14b. Number of Times Per Year that Second-choice Ramp/Shoreline is Used to Launch a Boat Table 15a. Drive Time to First-choice Launch Location (in minutes) Table 15b. Drive Time to Second-choice Launch Location (in minutes) Table 16a. Average Departure Time by Departure Category (first trip) Table 16b. Average Departure Time by Departure Category (second trip) Table 17a. Trip Duration: On-Water Travel Time by Group (first trip - day trippers) Table17b. Trip Duration: On-Water Travel Time by Group (second trip - day trippers) Table17c. Trip Duration: On-Water Travel Time by Group (first trip - over-nighters) Table17d. Trip Duration: On-Water Travel Time by Group (second trip - over-nighters).. 31 Table 18a. Boat Trips: Monthly Averages and Trip Count Statistics Table 18b. Boat Trips During Peak Season by Departure Category Table 18c. Boat Trip Statistics for Year by Departure Category Table 19. Reasons for Selecting a Favorite Departure/Launch Site Table 20. Reasons for Selecting a Favorite Travel Route Table 21. Boaters Activity Statistics (entire sample) Table 22a. Boaters Activity Statistics: Boat Ramp Group Table 22b. Boaters Activity Statistics: Marina Wet Slip Group Table 22c. Boaters Activity Statistics: Marina Dry Storage Group Table 22d. Boaters Activity Statistics: Home Dock Group Table 22e. Boater s Activity Statistics: Condo Dock Group Table 23a. Analysis of Congestion: Proportion of Boaters that Indicated They Had Avoided or Left Their Favorite Spots/Destinations Due to Congestion Table 23b. Analysis of Congestion: Proportion of Boaters that Both Identified Congested Areas on Map and Indicated that They Had Avoided or Left Their Favorite Spots/Destinations due to Congestion Table 24. Boating Detractors by Primary Category iv
7 Table 25. Lack of Courtesy and/or Seamanship Detractors by Sub-Category Table 26. Excessive Regulation Detractors by Sub-Category Table 27. Congestion Detractors by Sub-Category Table 28. Altered Environment Detractors by Sub-Category Table 29. Lack of Water Access Detractors by Sub-Category Table 30. Infrastructure Deficiency Detractors by Sub-Category Table 31. Lack of Regulation/Enforcement Detractors by Sub-Category Table 32. Top-10 Detractors by Sub-Category Table 33. Boating Needs by Primary Category Table 34. Infrastructure Improvement Needs by Sub-Category Table 35. Increased Access Needs by Sub-Category Table 36. Less Regulation Needs by Sub-Category Table 37. More Regulation/Enforcement Needs by Sub-Category Table 38. Boater Education Needs by Sub-Category Table 39. Environmental Protection Needs by Sub-Category Table 40. Information Needs by Sub-Category Table 41. Top-10 Needs by Sub-Category Table 42. Response Time Statistics Table 43. Analysis of Response Times (in days) Table 44. A.M. Launch-Time Statistics Table 45. P.M. Launch-Time Statistics Table 46. Trip Duration Statistics (day trippers) Table 47. Trip Duration Statistics (over-nighters) Table 48. Weekend Trip Proportions: Proportion of Trip One Falling on a Weekend Table 49. Trip Statistics per Month and Parametric Test Results Comparing Early- versus Late-responders Table 50. Trip Statistics for the Year and Parametric Test Results Comparing Early- versus Late-responders Table 51. Percentage Breakdowns of Sub-Sample Size by Departure Group: Early and Late-responders versus the Entire Sample v
8 Table 52. Percentage Breakdowns of Departure Site Association: Early- versus Late-responders Table 53. Percentage Breakdowns of Activities: Early- versus Late-Responders Table 54. Perceived Congestion: Left Favorite Destination due to Congestion (yes to Q 19) Table 55. Number of Months per year Living in Florida (entire sample) Table 56. Number of Months per year Living in Florida (12-month residents Removed from Sample/Sub-Samples) Table 57. Number of Years Operating a Vessel in Florida Table 58. Age of Boaters Participating in Survey Table 59. Total Number of Boating Trips (per year): A Comparison of 12-month Residents versus non-12-month Residents Table 60. Age of Boaters who Participated in the Survey: A Comparison of 12-month Residents versus non-12-month Residents vi
9 Acknowledgments The Florida Fish and Wildlife Conservation Commission Fish and Wildlife Research Institute (FWRI) funded this project through a grant from the Florida Department of Environmental Protection Florida Coastal Management Program (FDEP FCMP) pursuant to National Oceanic and Atmospheric Administration (NOAA) award number NA04NOS The success of this project relied upon the individual contributions of various team members. Principal Investigators Charles Sidman and Robert Swett (Florida Sea Grant) were responsible for project administration, overall design of the questionnaire and correspondence, sample selection, the GIS database design, and reporting. Timothy Fik (Department of Geography, University of Florida) performed the statistical analyses. Susan Fann (Florida Sea Grant) conducted the content analysis. Bill Sargent (FWRI) served as project liaison, and contributed to the questionnaire, survey design, and reporting. David Fann and was responsible for the questionnaire map layout and design, and cartography. Jim Joseph of FantaSea Scuba (Englewood, Florida) and Lana Carlin conducted the marina surveys. Jim Joseph conducted the ramp surveys. Dick Tudor and James Harrison of Smart Mail Inc. (Alachua, Florida) implemented the mailing. Susan Fann, Matt Purdy, Gabriel Bolden, and Corina Guevara managed and processed attribute and spatial data from the returned questionnaires. Dorothy Zimmerman (Florida Sea Grant Communications) provided valuable editorial comments and suggestions. We especially thank the many boaters who donated their time to complete and return the questionnaire. It is our intention that this effort will be translated into planning strategies and informational products of benefit to the Greater Charlotte Harbor boating communities. vii
10 Abstract This report documents the methods and procedures implemented, during February through September 2005, to survey and characterize boaters who recreate in the Greater Charlotte Harbor region (Charlotte and Lee County waterways), on the basis of trip departure category (marina wet slip, marina dry storage, public ramp, and private dock). Vessel and boat trailer registration numbers collected at area marinas and boat ramps were used to obtain names and mailing addresses from the State s Vessel Title Registration System (VTRS) for marina and ramp samples. Names and mailing addresses for waterfront parcel owners obtained from County tax records were compared to the VTRS to identify the dock sample (those waterfront parcel owners that also own a boat). A map-based questionnaire was mailed to a random sample of 6,944 area boaters. Questionnaire recipients marked the start and end point of their last two recreational boating trips, traced their travel routes, identified their favorite boating destinations, and the primary activities that they engaged in while at a particular destination. In addition, much descriptive data about boaters trips, including preferences for selecting trip departure sites, destinations, and travel routes, favorite activities, vessel types, and the timing, duration, and frequency of trips, was collected and linked to the mapped data. A content analysis identified important issues and needs from the perspective of the boating community. Lastly, an analysis that compared the responses of early and late responders to the survey was undertaken to evaluate the potential effects of non-response bias; late responders were used as a surrogate for non-responders. This information is intended to be used for resource management and planning applications, and as the basis for developing map based products intended to improve boating experiences and instill resource stewardship. viii
11 Chapter 1. Introduction Background Boating is a key element in Florida s coastal lifestyle and growth phenomena. Florida currently ranks third in the nation in recreational boat registrations, with almost 900,000 pleasure boats registered or titled, according to the Florida Department of Highway Safety and Motor Vehicles 2005 Vessel Registration data sales database. This represents approximately one boat for every 17 residents. More importantly, with over 22 million estimated participants, Florida is ranked the number one destination for marine recreation - including saltwater boating with an estimated 4.3 million participants - in the United States (Leeworthy & Wiley, 2001). The everincreasing number of boaters and the diversity of recreational boating activities that now take place within Florida s coastal bays, estuaries, and waterways have had positive economic but negative environmental consequences (Leston, 2002; Antonini, Fann & Roat, 1999). Florida s coastal counties face a major planning dilemma; how to balance growth in boating and associated coastal development with conservation and management of estuarine resources. As demand for the use of Florida s waterways increases, so does the need for enhanced public access, public safety, and environmental protection. There is, however, little information available to resource managers and planners that describes the preferences and use patterns of the boating community. This study builds upon previous work conducted in the Charlotte Harbor and Tampa and Sarasota Bay boating regions (Sidman & Flamm, 2001; Sidman, Fik, & Sargent, 2004) by refining the questionnaire design, developing a sample selection method to target specific boater groups, and implementing a mail survey to characterize boater preferences, activities, and water-use patterns for the high-use Greater Charlotte Harbor boating region that includes Lemon Bay to Estero Bay. Information obtained from this study is intended to enhance resource management and planning applications, and contribute to educational products that can improve boating experiences and encourage resource stewardship. This report documents the data collection, compilation, and analysis of a mail survey to characterize recreational boating in the Greater Charlotte Harbor. It presents (1) the questionnaire and related correspondence; (2) the sample design and results of the mailing; (3) a GIS density analysis that depicts the spatial distribution and clustering of trip information reported by survey respondents; (4) a set of descriptive statistics that characterizes boating groups, activities, and perceived problems, and solutions to problems; and (5) a comparative analysis of information reported by early versus late responders to the survey to evaluate survey non-response bias. Study Goal and Objectives This project s goal is to characterize the preferences, activities, and water-use patterns of boaters on the basis of trip departure type (i.e., marina wet-slip, dry storage facility, ramp, or private dock). Specific objectives include (1) developing a survey instrument and accompanying correspondence; (2) identifying target boater groups by trip departure type; (3) implementing a mail survey of a random sample of target boater groups; (4) constructing spatial databases that 1
12 identify trip departure sites, destinations, travel routes, and congested areas; (5) developing a database structure to link boater activities, preferences, and trip-profiles to the spatial databases; and (6) comparing the responses of early and late responders to the survey to evaluate nonresponse bias. Study Region The Greater Charlotte Harbor study region extends approximately 70 miles from Englewood (Lemon Bay) in the north to Bonita Springs (Estero Bay) in the south, in Charlotte, and Lee counties (Figure 1). An estimated 61,540 pleasure boats are currently registered in the study region according to the Florida Department of Highway Safety and Motor Vehicles, Vessel Title Registration System 2005 data sales database. Recreational boaters are attracted to this region by its many barrier islands and protected waters that provide excellent opportunities for small-craft fishing, nature viewing, and picnicking/socializing along barrier island beaches and exposed sand spits (Figure 2). The study region comprises roughly 1,450 square miles of the Gulf of Mexico, and interior bay waters that include Lemon Bay, the Manatee and Peace rivers, Greater Charlotte Harbor, Pine Island Sound, San Carlos Bay, the Caloosahatchee River, and Estero Bay. 2


13 Figure 1. The Greater Charlotte Harbor Study Area. 3


14 Figure 2. The Charlotte Harbor Boating Region. 4
15 Chapter 2. Mail Survey Survey Instrument The mail survey is an established method for acquiring spatial and behavioral information from the perspective of the boating community (Antonini, Zobler, Sheftall, Stevely & Sidman, 1994; Antonini, West, Sidman & Swett, 2000; Falk, Graefe, Drogin, Confer, & Chandler. 1992; Sidman, Fik, & Sargent, 2004; West 1982). A mail survey distributed to a randomly selected group is preferred over focus interviews with experts or convenience sampling (e.g., interviews at launch ramps), because it is proven to capture a wider and more representative cross-section of a population (Dillman, 1978; 1991). This is especially true of a boater population that is known to be diverse in terms of activities and/or characteristics (Sidman, Antonini, Saures, Jones & West, 2000). In addition to reducing the potential for sample bias, a mail survey offers greater flexibility to obtain both spatial and behavioral information than methods of strict observation such as aerial surveys (Sidman & Flamm, 2001). The survey questionnaire developed for this study was patterned after similar, previous studies (Falk et al., 1992; Sidman & Flamm, 2001; Sidman, Fik, & Sargent, 2004; West, 1982;) and was designed to (1) capture spatial information regarding trip departure sites, favorite boating destinations, intervening travel routes, and congested areas; (2) characterize boaters with respect to the types of vessels owned and used, activity preferences, and the timing, frequency and duration of their recreational outings; and; (3) identify problems, and needs from the perspective of the boating community (see Appendix A for the survey instrument and associated correspondence). The survey instrument was a two-sided 17 X 22 inch questionnaire that folded in quarters to 8.5 X 11 inches. The questionnaire contained a map (1:160,000 scale; 1 inch is about 2.5 miles) of the Greater Charlotte Harbor region on one side; the reverse side consists of 27 questions divided into the following topical areas: 1. Description of primary vessel 2. Description of last two pleasure boating trips 3. Description of favorite boating destinations and activities 4. Description of survey respondent 5. Open questions to identify perceived problems and needs The following additional items were included with each mailed questionnaire. 1. A cover letter that explained the study 2. A Charlotte Harbor Boater s Guide developed by the FWRI 3. A postage paid return envelope with postal permit indicia 4. A mailing envelope that includes return address and postage permit indicia In addition, a 4 X 6 card was mailed approximately two weeks after the initial mailing as a reminder to survey recipients to complete and return the questionnaire. 5
16 A beta-version of the survey instrument was mailed to six local boating experts who agreed to review and complete the questionnaire. Reviewer comments and suggestions were used to improve the content of the questionnaire. The questionnaire asked survey recipients to mark, on the map, the location of the trip departure site, travel routes, favorite destinations, and congested areas associated with their last two pleasure boating trips. Complementary questions allowed recipients to characterize their last two trips according to vessel type, the departure date and time, and time spent on the water. In addition, recipients were asked the number of days per month that they take trips and the primary activities that they engaged in while at a particular destination. They were also asked to identify and rank reasons for selecting departure sites, travel routes, and favorite destinations. Finally, a series of open-ended questions addressed problems and needed improvements. Sample Design The sample design was developed to acquire group-specific information that can be used to compare and contrast use patterns among four discrete boater populations that actively use the Greater Charlotte Harbor region: Users of (1) marina wet slips, (2) dry storage facilities, (3) public boat ramps, and (4) private docks. The sample size required for each of the four boater groups is a function of the desired confidence interval and confidence level. Given a total population of finite size, N, a tolerable error amount, e, and a desired confidence level as specified by the normal random variate, z, the required sample size, n, for estimating a population proportion, p, is determined by: n = N z 2 p(1-p) (N-1)e 2 + z 2 p(1-p) A minimum sample size of 384 was required for each of the four boater groups, based on a tolerable error of +/-.05 and a confidence level of 95 percent (z = 1.96). This sample size was considered adequate, at the stated error and confidence level, for a population that is finite and does not exceed 2,000,000 (McCall, 1982). A gross sample of 2,000 boaters for each of the four categories was targeted to ensure obtaining 384 returns for each boater group. This ratio assumes a return rate of approximately 20 percent, based on return rates from previous surveys of southwest Florida boaters (Antonini et al., 1994, 2000; Sidman & Flamm, 2001; Sidman, Fik, & Sargent, 2004). Sample Selection Vessel and boat trailer registration numbers collected at area marinas and boat ramps were used to obtain names and mailing addresses from the State s Vessel Title Registration System (VTRS), maintained by the Florida Department of Highway Safety and Motor Vehicles (DHSMV) for the marina wet slip, dry storage facility, and public ramp samples. The names and addresses of owners of documented vessels were obtained from the United States Coast Guard Documented Vessel database that is available on-line. 6
17 During March May 2005, Florida Sea Grant personnel visited 25 Charlotte and Lee County ramps (Figure 3) and wrote down 2,135 unique license plate numbers of both the boat trailer and the towing vehicle. This information was compared to the VTRS database maintained by the DHSMV to provide 1,504 VTRS matches for names and mailing addresses of Charlotte and Lee County ramp patrons (Table 1). Table 1. Breakdown of Unique Tag Numbers Collected and VTRS Matches by Ramp. County Ramp Name Number of Unique Tags VTRS Matches Placida Eldred's 8 6 El Jobean Laishley Park Darst Park 5 3 Harbour Heights Park 7 4 Charlotte Ponce De Leon Park Punta Gorda Park 2 2 Riverside 2 2 Spring Lake Park Port Charlotte Beach Ainger Creek Park TOTAL Burnt Store Marina Burnt Store Road Ramp 16 9 Cape Coral Yacht Club Centennial Park Marina Harbor Hideaway Marina Horton Park Lee Imperial River Lovers Key Matlacha Park Pineland Marina Punta Rassa Sanibel Island D&D Bait and Tackle TOTAL 1,512 1,064 During February March 2005 Florida Sea Grant contracted personnel visited 50 marinas (Figure 4) located in Charlotte and Lee Counties to record bow numbers from vessels stored in wet slips and in dry stack storage facilities. Florida Sea Grant personnel logged bow numbers from 1,283 vessels moored in wet slips and 3,870 vessels kept in dry storage facilities (Table 2). The name and hailing port of documented vessels were also obtained and used to acquire additional owner names and addresses from the Coast Guard documented vessel database. In addition, one marina provided a list of names and addresses for its patrons, and two marinas stipulated that they generate mailing lists and conduct the mailing. These three marinas did not distinguish between wet-slip or dry-storage type. As such, a total of 1,069 vessels were placed in an unknown marina storage type category. 7


18 Figure 3. Greater Charlotte Harbor Public Ramps Surveyed. 8
19 Table 2. Breakdown of Vessel Bow Numbers Collected from Marinas County Ramp Name Wet Slip* Dry Storage Unknown Ainger Creek Marina 5 0 Cape Haze Marina Bay Chadwick Cove Marina 8 0 Fishermen s Village 3 0 Gasparilla Marina Gator Creek Marine 0 21 Charlotte Gulf Coast Marine Center 0 37 Marine Max 2 17 Palm Island Marina Punta Gorda Marina 6 22 Stump Pass Marina Weston s Resort 9 0 TOTALS Boca Grande Marina 6 0 Bonita Bay Marina Club Burnt Store Marina Caloosa Isle Marina 6 62 Cape Coral Yacht Basin 56 0 Centennial Harbour Marina 50 0 Ft. Myers Yacht Basin Deep Lagoon Fish Tale Marina Fish Trap Marina 8 0 Ft. Myers Beach Marina Gulf Gateway Marina 8 22 Gulf Star/Dumont Marine 9 41 Harbor Hideaway 8 0 Jack s Marine South 5 12 Jensen s Twin Palm Marina 10 0 Marinatown Marina 0 0 Mc Carthy s Marina 6 0 Lee Olde Fish House Marina 0 3 Paradise Yacht Club 0 0 Peppertree Point Marina 0 0 Pineland Marina 3 16 Prosperity Pointe Marina 32 0 Rialto Harbor Marina 8 0 Salty Sam s Marina Sanibel Marina Semmer Docks 19 0 Snook Bight Marina St. James Marina 3 0 Sweetwater Landing Tarpon Point Marina 91 0 The Inn Marina The Marina at Cape Harbour Tween Waters Inn 8 0 Uncle Henry s Marina 6 0 Viking Marina 0 0 Whidden s Marina 8 0 TOTALS 1,088 2,993 1,069 9


20 Figure 4. Greater Charlotte Harbor Marinas Surveyed. 10
21 Names and mailing addresses for waterfront parcel owners obtained from county tax records were compared to the VTRS to identify the private dock sample (i.e., those waterfront parcel owners who also owned a boat). A sample of private dock owners was selected by means of matching the mailing addresses contained in the VTRS to waterfront parcel addresses obtained from Sarasota, Lee and Charlotte county property tax records. The owner s name, street number, street name, and zip code obtained from county tax records were combined and compressed (i.e., no spaces) into one concatenated field. A similar compression procedure was undertaken for VTRS owner name, address, and zip code fields. Compressed name and address information for all waterfront parcels was then linked to the corresponding compressed VTRS information to identify matches. Matches ensured that only those waterfront parcel owners who also own boats were sampled (Table 3). An ArcGIS program downloaded from the ESRI website was used to select a random spatial sample of 2000 private dock owners from the 9,794 VTRS matches (Figure 5). The size of the dock samples was increased by 15 percent to ensure that minimum sample sizes were retained after implementing address validation procedures. Table 3. Dock Sample Selection. Docks County VTRS Matches % Total Sample Needed # of % Add Total Sub- Sample Sarasota 218 2% Charlotte 4,274 44% , Lee 5,302 54% 1, ,242 TOTALS 9, % 2, ,300 11


22 Figure 5. Spatial Distribution of the Greater Charlotte Harbor Private Dock Sample. 12
23 Survey Return Breakdown Questionnaires were mailed in waves from May 27 through June 27, Smart Mail Services Inc. validated boater addresses and conducted the mailing. A breakdown of survey mailings and returns is presented by boater group (i.e., marina (wet and dry storage), public ramp, and private dock) in Table 4. A total of 1,473, surveys were returned by August 15, 2005, of which, 1,447 could be used for the statistical or spatial analyses (27 surveys could not be used). The number of returned surveys exceeded the target number of 384 for each boater-group (i.e., when marina wet and dry storage groups were combined). This translated to an overall return rate of 20.6%. Table 4. Survey Return Breakdown. User Group Mailed Returned Useable % Return Marina (wet and dry storage) 3, Public Ramp 1, Private Dock 2, Other na 10 na TOTALS* 6,944 1, Average *A total of 1,447 surveys were returned by August 15, Ten respondents listed other for boater group type. 13
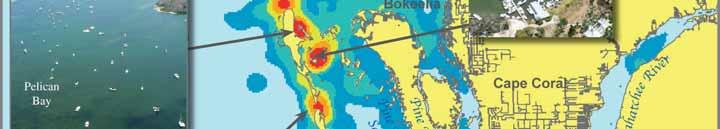
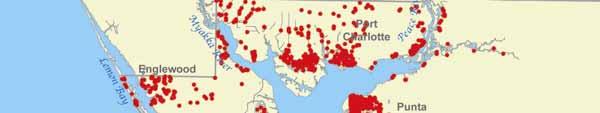
24 Chapter 3. GIS Database Development Spatial Database Design Questionnaire recipients were asked to mark the start and end point of their last two pleasure boating excursions and trace their entire travel routes on a map, as well as to identify their favorite boating destinations and annotate the map with the primary activities that they engaged in while at a particular destination. Data collected from 1,447 surveys were digitized into the ESRI ArcGIS geographic information system (GIS). This translated to a sample of 2,817 travel routes, 2,817 trip departure sites, 3,909 favorite boating destinations, and 1,825 locations of perceived congestion. Spatial information was digitized on-screen using a 1:24,000 scale shoreline, United States Geological Survey Digital Orthophotograph Quarter Quad imagery, and the positions of marinas, ramps, navigation aids, and artificial reefs, as background themes, to enhance the accuracy of digitized data. Trip departure sites and congested spots were digitized as point features with each record coded with the survey control number and the trip number (i.e., first or second trip). Favorite destinations were digitized as point features and were coded with the survey control number, the trip number (i.e., first or second trip), and the activities that a respondent engaged in at each favorite destination. Travel routes were digitized as line features with the following attribute information coded: Survey control number, trip number (i.e, first or second trip), round trip (or one way); if round trip, then the same route out and back, and whether or not the trip extended beyond the study area. The database structure allows information from survey questions to be linked to digitized spatial information by the use of the survey control number (ID), which uniquely identified spatial and attribute information provided by each survey respondent. The selection and display of favorite destination point data within the GIS is illustrated in Figure7. A close-up of the southern Charlotte Harbor boating area is displayed in the GIS view. Red dots represent departure sites identified by survey respondents; green dots represent favorite destinations; yellow dots represent a sub-set of favorite destinations where survey respondents reported that they like to nature view. The Select by Attributes window - upper left corner of Figure 7 - illustrates a GIS database query that selects and displays those favorite destination points that are associated with nature viewing (e.g., NV = Y ). The Selected Attributes of Destinations window - lower left corner of Figure 6 - displays all linked database records in yellow. These records share the same survey control number (ID) that meet the query criterion of nature viewing (NV). As can be seen in the resulting GIS view, Pelican Bay is a prime reported destination for nature viewing. Reported travel routes within the southern Charlotte Harbor boating region are displayed in Figure 7. Pink lines represent travel routes digitized from returned surveys; red and green dots illustrate departure sites and favorite destinations, respectively. The blue lines depicted in the GIS view represent two travel routes that have been selected for display. The corresponding database records that are linked to the two travel routes via the survey control number ID are highlighted blue in the Attributes of Routes database window - lower left of Figure 7. 14

25 Figure 6. Example of GIS Attribute Query and Display: Nature Viewing Spots. 15

26 Figure 7. Example of GIS Attribute Query and Display: Reported Travel Routes. 16
27 Chapter 4. Mapping Boating Patterns General Clustering Patterns This chapter presents the results of a GIS analysis that mapped the distribution or spread of the digitized trip information as density of occurrence. Continuous density surfaces generated by the GIS illustrate the degree of concentration or clustering of digitized trip information. General clustering patterns for travel routes, destinations, and congested areas were mapped and described using the following mapping resolution parameters: 200 meter grid cells and a search radius of 805 meters (one-half mile). Route densities are depicted in Figure 8. The greatest density of vessel traffic is restricted to the Intracoastal Waterway within the lower Caloosahatchee River, San Carlos Bay, and Pine Island Sound. Vessel traffic density is also great between the Burnt Store Marina and Boca Grande Pass. Beyond the barrier islands, the flow of boat traffic is generally dispersed, though evidence of some clustering of routes exists on the Gulf-side near the barrier islands. Figure 9 displays favorite destinations identifying the locales where respondents most like to visit on a typical recreational boating outing. The density analysis revealed several prime boating destinations: Boca Grande Pass, Pellican Bay, the Useppa Island/Cabbage Key locale, and Captiva Pass. Secondary destination areas include Redfish Pass, Stump Pass, Gasparilla Pass (near Placida), Boca Grande, and Fort Myers Beach. The Fisherman s Village Marina (near Punta Gorda), Burnt Store Marina, St. James City, Point Ybel, Lover s Key, and Bull Bay and Turtle Bay areas also represent important boating destinations. Figure 10 illustrates areas where boaters experience congestion defined in Question 20 as more boats than you prefer. The analysis shows that respondents experience the most congestion within segments of the Intracoastal Waterway (e.g., Shell Point, Miserable Mile, Pine Island Sound) and at certain passes (e.g., Boca Grande Pass, Stump Pass, and Gasparilla Pass near the Placida boat ramp), through which they must navigate en route to open Gulf waters and/or their boating destinations. It should be noted that the prominent passes also represent primary destinations for boaters in the region. 17


28 Figure 8. Travel Corridors as Summarized with the GIS. 18


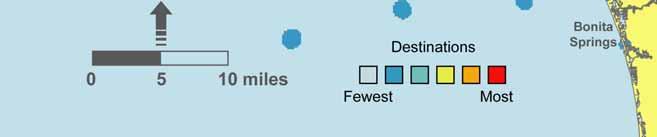
29 Figure 9. Favorite Destinations as Summarized with the GIS. 19


30 Figure 10. Congested Areas as Summarized with the GIS. 20
31 Chapter 5. Boater-Group Characteristics Overview This chapter presents an evaluation and discussion of responses to specific survey questions. Chapter sections are divided according to themes that describe (1) boater and use profiles; (2) trips and seasonality; (3) choice rationale for selecting departure sites, destinations, and travel routes; (4) activities; and (5) perceived congestion. It should be noted that while questions were arranged to follow a logical progression on the survey instrument the following results and discussion sections are arranged thematically and, therefore, questions do not necessarily follow the order in which they appeared on the survey. The descriptive analysis presented in this chapter is based on information from N=1,437 returned surveys (as of 8/15/05). A copy of the survey instrument is provided in Appendix A. Boater and Use Profile: Vessel Type, Experience, and Use Of the n=1,436 responses to Question 6 (trip 1), 43.6% used boats that fell into the open fisherman category, followed by power cruisers at 19.7%. These two boat types accounted for roughly 63% of all boats used by survey respondents. (Table 5a; Question 6). Table 5a. Vessel Type for First Trip. Frequency Percentage Vessel type count of total Jet ski % Kayak/Row/Canoe % Sailboat (no cabin) % Sailboat (with cabin) % Speed Boat (Runabout) % Speed Boat (Cigarette) % Open Fisherman % Off-shore Fisherman % Power Cruiser % Deck Boat % Pontoon % Other % n = 1,436 respondents 21
32 Of the n=1,408 survey responses to Question 6 (trip 2), 43.5% used boats that fell into the open fisherman category. Power cruisers came in at a distant second-place with 18.96%. (Table 5b; Question 6) Table 5b. Vessel Type for Second Trip. Frequency Percentage Vessel type count of total Jet ski % Kayak/Row/Canoe % Sailboat (no cabin) % Sailboat (with cabin) % Speed Boat (Runabout) % Speed Boat (Cigarette) % Open Fisherman % Off-shore Fisherman % Power Cruiser % Deck Boat % Pontoon % Other % n = 1,408 respondents Of the n=1,447 survey respondents, approximately 32% departed from a home dock. Marina dry storage accounted for 24.7% of departures, followed closely by departures from public boat ramps (at 24.5%) and marina wet slips (at 16.3%) - (Table 6; Question 11). Table 6. Vessel Departure Categories / Departure Sites. Frequency Percentage Departure Site count of total rank Boat Ramp % 3 Shore/Causeway 1 <.01% Marina Wet Slip % 4 Marina Dry Storage % 2 Home Dock % 1 Condo Dock % Other 9.62% n = 1,447 respondents 22
33 The average number of months per year that respondents reside in Florida is approximately 10.5 based on information gathered from 1,441 of the 1,449 survey respondents (Table 7; Question 21). Table 7. Average Monthly Residence per year in the State of Florida. n = 1,441 respondents Average number of months living in Florida = months Standard Deviation = 3.04 months 95% confidence interval: {10.34 to months} Survey respondents had, on average, a little over 13.5 years of recreational boating experience in Florida (Table 8; Question 22). Table 8. Boating Experience in Florida (in years). Statistic Years boating Average Standard Deviation Minimum 0.25 Maximum 70 Median 9 Mode 5 n = 1,447 Note: The 95% confidence interval for years boating experience: {12.9 years < avg. < 14.2 years}. 23
34 Respondents that began their trips from public boat ramps tended to have the greatest amount of boating experience in Florida, as measured in years (with 17.4 years experience, on average). All remaining groups had boating experience that fell well below the mean of years. Boaters launching from marinas tended to have a lesser amount of boating experience in Florida in comparison to boaters launching from public access ramps or private docks (Table 9; Question 22). Table 9. Years of Boating Experience in Florida by Departure Category. (in years) Departure Category n mean std. dev. median min max Boat Ramp * Shore/Causeway** Marina Wet Slip Marina Dry Storage Home Dock Condo Dock * Denotes above-average experience-- exceeds the mean (> 13.59yrs) ** Too small of a sample size to evaluate Roughly 75% of n=1,432 respondents indicated that they have had a boating safety or seamanship course. Boaters that launched from public ramps tended to be the least likely group to have had a boating safety or seamanship course. Boaters departing from marina wet slips or home docks were more likely to have had a boating safety or seamanship course than those departing from dry storage, public boat ramps or condo docks (Table 10; Question 23). Table 10. Boaters Having Completed a Boat Safety/Seamanship Course by Departure Category. Departure Category n Yes percentage Above Average? Boat Ramp No Shoreline/Causeway 1* 1 - na Marina Wet Slip Yes Marina Dry-Storage No Home Dock ,9 Yes Condo Dock No Overall 1,432 1, (average) * Too small of a sample size to evaluate 24
35 Survey respondents were, on average, 58 years of age (Table 11; Question 24). Respondents that departed from marinas and private docks were slightly older than the average survey respondent (Table 11; Question 24). Public boat ramp users tended to be markedly younger than respondents associated with other departure categories (Table 11; Question 24). Table 11. Age of Boaters by Departure Category. (in years) Departure Category n Average Std. Dev. Median Min Max Boat Ramp Shoreline/Causeway na na na na Marina Wet-Slip * Marina Dry Storage * Home Dock * Condo Dock * Overall 1, * Denotes above-average value Willingness to participate in a future Internet survey was highest for boaters that departed from marina dry storage facilities. All other departure groups fell below the average willingness to participate figure of 66.9%. Respondents that launched from public boat ramps had the lowest willingness to participate percentage with 63.4%. Nevertheless, willingness to participate in a future Internet-based survey was approximately 63% or higher for all departure groups (Table 12a; Question 25a). Table 12a. Boater Willingness to Participate in a Future Internet Survey. Departure Category n yes percentage above avg.? Boat Ramp % No Shoreline/Causeway na Marina Wet Slip % No Marina Dry Storage % Yes Home Dock % No Condo Dock % No Overall n = 1, % (average) 25
36 Willingness to participate in a future mail survey was highest for boaters that launched from public boat ramps, followed by marina dry storage facilities (90.9% and 89.0%, respectively). All other departure groups fell below the average willingness to participate figure of 87.8%. Respondents that departed from condo docks had the lowest willingness to participate percentage with 72.2%. Nevertheless, willingness to participate in a future mail survey was very high across the board with an average for all departure groups of almost 88% -- a figure that is significantly higher than the percentage of respondents that were willing to participate in the Internet-based survey (Table 12b; Question 25b). Table 12b. Boater Willingness to Participate in a Future Mail Survey. Departure Category n yes percentage above avg.? Boat Ramp % Yes Shoreline/Causeway na Marina Wet Slip % No Marina Dry Storage % Yes Home Dock % No Condo Dock % No Overall n = 1,222 1, % (average) Survey respondents that departed from marinas traveled, on average, 33 minutes from home to the marina from where their trips started (Table 13; Question 13). Table 13. Drive Time from Home to Marina (in minutes). Statistic Drive Time (min.) Average Standard. Deviation % confidence interval {29.3 to 37.1 min.) Median 15 n = 771 respondents 26
37 Survey respondents launching from public ramps or shorelines (including marina ramps) tended to launch approximately 29 times per year from their first-choice launch site (Table 14a; Question 14). Table 14a. Number of Times Per Year that First-choice Ramp/Shoreline is Used to Launch a Boat. Statistic number of times/year Average Standard. Deviation % confidence interval {26.0 to 32.2} Minimum 1 Maximum 270 Median 20 n = 408 respondents Survey respondents launching from ramps or shorelines (including marina ramps) tended to launch approximately 13 times per year from their second-choice launch site (Table 14b; Question 14). Table 14b. Number of Times Per Year that Second-choice Ramp/Shoreline is Used to Launch a Boat. Statistic number of times/year Average Standard. Deviation % confidence interval {11.2 to 15.4} Minimum 0 Maximum 200 Median 10 n = 298 respondents 27
38 The average drive time to boaters first-choice launch location/ramp is approximately 42 minutes based on 432 responses to Question 15, as a follow-up to Question 14 (Table 15a; Question 15). Table 15a. Drive Time to First-choice Launch Location (in minutes). Statistic Drive time (min.) Average Standard. Deviation % confidence interval {36.8 to 47.5} Minimum 0 Maximum 480 Median 20 n = 432 respondents The average drive time to boaters second-choice launch location/ramp is approximately 43 minutes based on 329 respondents to Question 15, as a follow-up to Question 14 (Table 15b; Question 15). Table 15b. Drive Time to Second-choice Launch Location (in minutes). Statistic Drive time (min.) Average Standard. Deviation % confidence interval {37.6 to 48.2} Minimum 0 Maximum 390 Median 30 n = 329 respondents 28
39 The average AM start time for the first trip was highly sensitive to departure category, with boaters that depart from public boat ramps launching earliest during the morning hours - at approximately 7:10AM, on average. Boaters departing from home docks were the next earliest to begin their trips (at approximately 8:03AM, on average), followed by boaters departing from marina dry storage facilities (at 8:08AM, on average). (Table 16a; Question 2, AM and PM) Table 16a. Average Departure Time by Departure Category (first trip). Average value AM AM PM PM overall Departure Category n hour time hour time time AM Boat Ramp :10* :27 8:37 Shoreline/Causeway : Marina Wet Storage : :57 9:37 Marina Dry Storage : :05 10:14 Home Dock : Condo Dock : :25 9:40 All groups 1, : :40 9:37 * Denotes a departure time that is well below the average The average AM start time for the second trip was also highly sensitive to departure category, with boaters that departed from boat ramps (as observed for the first trip), launching earliest during the morning hours -- at approximately 7:03AM, on average; followed by boaters departing from home docks (at 7:31AM, on average). (Table 16b; Question 2, AM and PM) Table 16b. Average Departure Time by Departure Category (second trip). Average Value AM AM PM PM overall Departure Category n hour time hour time time AM Boat Ramp :03* :54 8:57 Shoreline/Causeway : Marina Wet Storage : ;14 10:17 Marina Dry Storage : :14 10:10 Home Dock * :50 10:22 Condo Dock : :24 9:45 All groups 1, : :22 9:57 * Denotes a departure time that is well below the average 29
40 Boaters launching from a public ramp tended to spend more time on the water than those departing from other locations for trips of 24 hours or less in duration (based on survey responses for the first trip). Boaters that departed from public boat ramps and private condo docks were above average in terms of the number of on-water travel hours for the first trip, with 6.9 and 5.5 hours, respectively (Table 17a; Question 3). Table 17a. Trip Duration: On-Water Travel Time by Group (first trip day trippers) (Trip duration < 24 hours). (in hours) Departure Category n mean 95% C.I. median Boat Ramp * {6.5 to 7.2} 6 Shoreline/Causeway Marina Wet Slip {4.3 to 5.3} 4 Marina Dry Storage {4.2 to 4.8} 5 Home Dock {4.9 to 5.4} 5 Condo Dock * {4.1 to 6.9} 5.5 Overall n = 1, {5.2 to 5.6} 5 * Denotes above-average on-water travel time/trip duration Boaters launching from a public ramp tended to spend more time on the water than those departing from other locations, for trips of 24 hours or less in duration (based on survey responses for the second trip); with 6.4 hours per trip, on average. Boaters that departed from public boat ramps and private condo docks were, once again, above average in terms of the number of on-water travel hours for the second trip, with the remaining categories showing less than average on-water trip durations (Table 17b; Question 3). Table 17b. Trip Duration: On Water Travel Time by Group (second trip day trippers) (Trip duration < 24 hours). (in hours) Departure Category n mean 95% C.I. median Boat Ramp * {6.1 to 6.8} 6 Shoreline/Causeway Marina Wet Slip {4.2 to 5.0} 4 Marina Dry Storage {4.3 to 4.9} 4 Home Dock {4.7 to 5.4} 5 Condo Dock * {3.8 to 6.8} 5 Overall n = 1, {5.0 to 5.4} 5 * Denotes above-average on-water travel time/trip duration 30
41 Boaters departing from marina wet slips tended to spend more time on the water than those departing from other locations, for trips of greater than 24 hours in duration (based on survey responses for the first trip); with trips that averaged approximately 128 hours (5.3 days) in duration (Table 17c; Question 3). Table 17c. Trip Duration: On-Water Travel Time by Group (first trip - overnighters) (Trip duration > 24 hours). (in hours) Departure Category n mean 95% C.I. median Boat Ramp {35.5 to 51.8} 33 Shoreline/Causeway Marina Wet Slip * {86.3 to 169.6} 72 Marina Dry Storage {36.0 to 94.2} 48 Home Dock {62.2 to 124.7} 72 Condo Dock {34.1 to 85.8} 54 Overall n = {74.7 to 112.0} 60 * Denotes above-average on-water travel time/trip duration Boaters departing from marina wet slips tended to spend more time on the water than those departing from other types of facilities, for trips of greater than 24 hours in duration (based on survey responses for the second trip); with trips averaging approximately 127 and 274 hours (5.3 and 11.4 days) in duration, respectively (Table 17d; Question 3). [Note: the results for boaters departing from condo docks are suspect due to small sample size; and the estimated value for the mean may be somewhat overstated.] Table 17d. Trip Duration: On-Water Travel Time by Group (second trip - overnighters) (Trip duration > 24 hours). (in hours) Departure Category n mean 95% C.I. median Boat Ramp {35.0 to 49.0} 32 Shoreline/Causeway Marina Wet Slip * {83.5 to 171.0} 72 Marina Dry Storage {39.2 to 62.3} 42 Home Dock * {70.9 to 150.1} 48 Condo Dock** * { to 853.9} 127 Overall n = {78.7 to 121.1} 48 * Denotes above-average on-water travel time/trip duration; ** Results based on small sample size (note wide confidence interval) 31
Archival copy: for current recommendations see or your local extension office.
 This is a publication of the Florida Sea Grant College Program, supported by the National Sea Grant College Program of the United States Department of Commerce, National Oceanic and Atmospheric Administration
A publication of the University of Florida Sea Grant Program (project numbers and ). The project was funded by Bay County through
. The project was funded by Bay County through") A publication of the University of Florida Sea Grant Program (project numbers 00067209 and 00069999). The project was funded by Bay County through the University of Florida Bay County Extension Program;
A publication of the University of Florida Sea Grant Program (project numbers 00067209 and 00069999). The project was funded by Bay County through the University of Florida Bay County Extension Program;
Another essential characteristic of boat channel geography is the form and spacing of channel
 Another essential characteristic of boat channel geography is the form and spacing of channel segments.some channels are simple, and others are complex. The channel systems include: finger canals or basins;
RESEARCH Massachusetts Recreational Boater Survey. Project Summary
 Coastal and Marine Spatial Planning RESEARCH Project Summary 2010 Massachusetts Recreational Boater Survey The 2010 Massachusetts Recreational Boater Survey gathered spatial and economic data relating
Final Report, October 19, Socioeconomic characteristics of reef users
 Socioeconomic Study of Reefs in Southeast Florida - Executive Summary By Hazen and Sawyer in association with Florida State University and National Oceanic and Atmospheric Administration, October 19, 2001
MARKET STUDY FOR BOATING ON THE MINNESOTA WATERS OF LAKE SUPERIOR
 MARKET STUDY FOR BOATING ON THE MINNESOTA WATERS OF LAKE SUPERIOR MARKET STUDY FOR BOATING ON THE MINNESOTA WATERS OF LAKE SUPERIOR CANADA Minnesota Apostle Islands Isle Royale Lake Superior Michigan Wisconsin
JUNEAU SECOND CHANNEL CROSSING WATERWAY USER SURVEY RESULTS
 JUNEAU SECOND CHANNEL CROSSING WATERWAY USER SURVEY RESULTS PREPARED FOR: HDR Alaska, Inc. PREPARED BY: Juneau Anchorage December 2003 TABLE OF CONTENTS Executive Summary...1 Introduction and Methodology...2
1999 On-Board Sacramento Regional Transit District Survey
 SACOG-00-009 1999 On-Board Sacramento Regional Transit District Survey June 2000 Sacramento Area Council of Governments 1999 On-Board Sacramento Regional Transit District Survey June 2000 Table of Contents
Nancy Montes Robert Swett Charles Sidman Tim Fik
 Nancy Montes Robert Swett Charles Sidman Tim Fik A publication of the University of Florida Sea Grant Program. The project was funded by the Southeast Regional Office NOAA Fisheries Services pursuant to
Marine Recreational and Commercial Industries and Activities in Lee and Charlotte Counties: Economic Consequences and Impacts
 Marine Recreational and Commercial Industries and Activities in Lee and Charlotte Counties: Economic Consequences and Impacts Betty Staugler Florida Sea Grant Extension Marine Agent & Chuck Adams Florida
RESIDENTS AND USERS SPEAK
 Planning for Waterway Access in Taylor County, Florida: RESIDENTS AND USERS SPEAK TP - 177 Science Serving Florida s Coast Florida Sea Grant College Program PO Box 110409 University of Florida Gainseville,
MEMORANDUM. Existing Operations. City of Clearwater. Michael Herrman. Date: January 26, Seminole Boat Launch Overview. M&N Job No.
 1509 W. Swann Avenue, Suite 225 Tampa, FL 33606 (813) 258-8818 Fax (813) 258-8525 www.moffattnichol.com MEMORANDUM To: From: City of Clearwater Michael Herrman Date: Subject: Seminole Boat Launch Overview
SOUTH CAROLINA ELECTRIC & GAS COMPANY COLUMBIA, SOUTH CAROLINA
 SOUTH CAROLINA ELECTRIC & GAS COMPANY COLUMBIA, SOUTH CAROLINA SALUDA HYDROELECTRIC PROJECT (FERC NO. 516) BOATING DENSITY STUDY PLAN FINAL SEPTEMBER 2006 Prepared by: SOUTH CAROLINA ELECTRIC & GAS COMPANY
Appendix 9 SCUBA diving in the sea
 Appendix 9 SCUBA diving in the sea Firth of Clyde Forum SMRTS2015 Final Report 195 March 2016 Appendix 9 SCUBA diving in the sea Table A9.1: Summary of sample confidence levels Responses Spatial data Questionnaire
Appendix 21 Sea angling from the shore
 Appendix 21 Sea angling from the shore LUC SMRTS2015 Final Report 342 March 2016 Appendix 21 Sea angling from the shore Table A21.1: Summary of sample confidence levels Responses Spatial data Questionnaire
Survey of Recreational Boater Safety in Ohio During 1999
 Survey of Recreational Boater Safety in Ohio During 1999 Leroy J. Hushak The Ohio State University Ohio Sea Grant College Program Technical Summary Series Publication OSHU-TS-030 2000 Ohio Sea Grant College
For-hire Data Collection. Gulf of Mexico Fishery Management Council Red Snapper For-hire Advisory Panel December 2-3, 2014 Tampa, FL
 For-hire Data Collection Gulf of Mexico Fishery Management Council Red Snapper For-hire Advisory Panel December 2-3, 2014 Tampa, FL Southeast Region Recreational Surveys MRIP For-hire Survey APAIS/CHTS
Charter Boat Fishing in Lake Michigan: 2017 Illinois Reported Harvest
 Illinois Department of Natural Resources Division of Fisheries Charter Boat Fishing in Lake Michigan: 2017 Illinois Reported Harvest Steven R. Robillard Illinois Department of Natural Resources Lake Michigan
Evaluating the Influence of R3 Treatments on Fishing License Sales in Pennsylvania
 Evaluating the Influence of R3 Treatments on Fishing License Sales in Pennsylvania Prepared for the: Pennsylvania Fish and Boat Commission Produced by: PO Box 6435 Fernandina Beach, FL 32035 Tel (904)
Charter Boat Fishing in Lake Michigan: 2015 Illinois Reported Harvest
 Illinois Department of Natural Resources Division of Fisheries Charter Boat Fishing in Lake Michigan: 2015 Illinois Reported Harvest Steven R. Robillard Illinois Department of Natural Resources Lake Michigan
Coastal and marine recreation in New England is ingrained in the region s economic and
 RECREATION Coastal and marine recreation in New England is ingrained in the region s economic and social fabric. Recreation on the ocean and coast includes many of New Englanders most time-honored and
Inlet Specific and Seasonal Variation in Vessel Use Patterns: The case of the Northeast Florida Region
 Inlet Specific and Seasonal Variation in Vessel Use Patterns: The case of the Northeast Florida Region Nancy Montes Robert Swett University of Florida Automatic Identification System (AIS) Ships 300 or
The Mid-Atlantic Recreational Boater Survey
 The Mid-Atlantic Recreational Boater Survey April 2016 Mid-Atlantic Recreational Boater Survey 1 CONTENTS 30TABOUT THE SPONSORS30T... 2 30TEXECUTIVE SUMMARY30T... 3 30TSURVEY OVERVIEW30T... 5 30TECONOMIC
Tennessee Black Bear Public Opinion Survey
 Tennessee Black Bear Public Opinion Survey Executive Summary 2012 Survey TWRA Technical Report 12 02 This electronic publication was developed by the Tennessee Wildlife Resources Agency s Division of Wildlife
Specialized Survey Methods for Recreational Reef Fish Fisheries in Florida
 Specialized Survey Methods for Recreational Reef Fish Fisheries in Florida Beverly Sauls, Research Scientist Fish and Wildlife Research Institute Marine Fisheries Research Saint Petersburg, FL Reef Fish
The Montana Expression 2018: MT Residents Use of Fishing Access Sites & Public Lands and Waterways Values
 University of Montana ScholarWorks at University of Montana Institute for Tourism and Recreation Research Publications Institute for Tourism and Recreation Research 3- Kara Grau The University of Montana
APPENDIX A SURVEY FORM
 APPENDIX A SURVEY FORM The following information will be used to help us categorize and predict future boating interest and participation. This information will not be associated with your name. NEW JERSEY
Appendix 22 Sea angling from a private or chartered boat
 Appendix 22 Sea angling from a private or chartered boat LUC SMRTS2015 Final Report 359 March 2016 Appendix 22 Sea angling from a private or chartered boat Table A22.1: Summary of sample confidence levels
Socioeconomic Profile and Spatial Analysis of Fisheries in the three central California National Marine Sanctuaries
 Socioeconomic Profile and Spatial Analysis of Fisheries in the three central California National Marine Sanctuaries Overview and Assessment of CDFG Fisheries Data for use in the Joint Management Plan Review
Cycle journeys on the Anderston-Argyle Street footbridge: a descriptive analysis. Karen McPherson. Glasgow Centre for Population Health
 Cycle journeys on the Anderston-Argyle Street footbridge: a descriptive analysis Karen McPherson Glasgow Centre for Population Health March 2017 Key points: There were 116,334 cycle journeys made using
METHODOLOGY. Signalized Intersection Average Control Delay (sec/veh)
") Chapter 5 Traffic Analysis 5.1 SUMMARY US /West 6 th Street assumes a unique role in the Lawrence Douglas County transportation system. This principal arterial street currently conveys commuter traffic
Chapter 5 Traffic Analysis 5.1 SUMMARY US /West 6 th Street assumes a unique role in the Lawrence Douglas County transportation system. This principal arterial street currently conveys commuter traffic
Redondo Beach Boat Launch Ramp Facility
 Redondo Beach Boat Launch Ramp Facility Feasibility Report for the California Department of Boating and Waterways 2015 Grant Cycle For the City of Redondo Beach Submitted by March 13, 2014 Table of Contents
Recreational Fishing License Sales in Florida:
 Recreational Fishing License Sales in Florida: 1990-2000 1 Kristina Stephan and Chuck Adams 2 Introduction The recreational fishing industry is an important natural resource-based industry in Florida.
CLEARWATER COMPREHENSIVE BOATING PLAN PUBLIC OUTREACH MEETING 2. December 16, 2015
 CLEARWATER COMPREHENSIVE BOATING PLAN PUBLIC OUTREACH MEETING 2 December 16, 2015 Introduction Project Team City of Clearwater Bill Morris Director of Marine and Aviation Kyle Brotherton Planning and Development
Fishery Dependent Data Collection Office of Science and Technology
 Fishery Dependent Data Collection Office of Science and Technology MREP Southeast St. Petersburg, Florida April 22, 2014 Gordon Colvin Summary Overview of Fishery-Dependent Sampling Methods: four basic
2014 Life Jacket Wear Rate Observation Study featuring National Wear Rate Data from 1999 to 2014
 2014 Life Jacket Wear Rate Observation Study featuring National Wear Rate Data from 1999 to 2014 Produced under a grant from the Sport Fish Restoration and Boating Trust Fund, administered by the U.S.
Socioeconomic Values of Reefs in Monroe County
 Chapter 6: Socioeconomic Values of Reefs in Monroe County This chapter describes the Socioeconomic Value of Artificial and Natural Reefs in Monroe County to residents and visitors. Monroe County includes
Recreational Saltwater Fishing Industry Trends and Economic Impact January 2007
 Document was created exclusively for RISAA and the information contained herein is not to be disclosed without their expressed permission Recreational Saltwater Fishing Industry Trends and Economic Impact
Angler Spending on Fishing-related Durable Goods: Results from the 2014 Marine Recreational Fishing Expenditure Survey
 Angler Spending on Fishing-related Durable Goods: Results from the 2014 Marine Recreational Fishing Expenditure Survey Sabrina Lovell1, James Hilger2, and Scott Steinback3 NAAFE 2015 Ketchikan, AK 1US
California Boater Card FAQ
 California Boater Card FAQ California BOATER CARD Q: What is a California Boater Card? A: The California Boater Card shows that its holder has successfully taken an approved boating safety course and passed
Safety Assessment of Installing Traffic Signals at High-Speed Expressway Intersections
 Safety Assessment of Installing Traffic Signals at High-Speed Expressway Intersections Todd Knox Center for Transportation Research and Education Iowa State University 2901 South Loop Drive, Suite 3100
OR DUNGENESS CRAB FISHERY:
 E 55 OR DUNGENESS CRAB FISHERY: an economic analysis of productivity and profitability David S. Liao Joe B. Stevens OREGON STATE UNIVERSITY SEA GRANT COLLEGE PROGRAM Publication no. ORESU-T-75-005 AGRICULTURAL
South Florida Algal Bloom Sampling Results July
 South Florida Algal Bloom Sampling Results July Sample Date Samples Collected By Samples Analyzed By Sampling Location (Latitude and Longitude) Depth (Meters) Algae ID (Type of Blue Green Algae) Microcystin
A SURVEY OF 1997 COLORADO ANGLERS AND THEIR WILLINGNESS TO PAY INCREASED LICENSE FEES
 Executive Summary of research titled A SURVEY OF 1997 COLORADO ANGLERS AND THEIR WILLINGNESS TO PAY INCREASED LICENSE FEES Conducted by USDA Forest Service Rocky Mountain Research Station Fort Collins,
An Application of Signal Detection Theory for Understanding Driver Behavior at Highway-Rail Grade Crossings
 An Application of Signal Detection Theory for Understanding Driver Behavior at Highway-Rail Grade Crossings Michelle Yeh and Jordan Multer United States Department of Transportation Volpe National Transportation
Running Southwest Florida Beaches. By Eddie Underhill
 Running Southwest Florida Beaches By Eddie Underhill Intro: 1. For years I have been running Fort Myers Beach. I live at Fairview Isles, so I start at the beach here in front of the Gullwing Hotel and
Appendix 13 Rowing and sculling in the sea
 Appendix 13 Rowing and sculling in the sea Steve Thompson SMRTS2015 Final Report 251 March 2016 Appendix 13 Rowing and sculling in the sea Table A13.1: Summary of sample confidence levels Responses Spatial
MONROE COUNTY NEW YORK
 MONROE COUNTY NEW YORK Intersection Accident Database Enhancement Project (UPWP 4380) FINAL January 2008 Prepared By: Prepared For: Bergmann Associates 200 First Federal Plaza 28 East Main Street Rochester,
The Economic Impact of Recreational Fishing in the Everglades Region
 The Economic Impact of Recreational Fishing in the Everglades Region Prepared for: The Everglades Foundation Prepared by: Tony Fedler, Ph.D. For the Bonefish and Tarpon Trust December 2009 Table of Contents
Susitna-Watana Hydroelectric Project Document ARLIS Uniform Cover Page
 Alaska Resources Library & Information Services Document ARLIS Uniform Cover Page Title: Wildlife harvest analysis study, Study plan Section 10.20 : Final study plan SuWa 200 Author(s) Personal: Author(s)
Angling in Manitoba (2000)
") Angling in Manitoba (2000) TABLE OF CONTENTS Page Introduction 1 Angler Profile 2 Angling Effort 7 Catch and Harvest 10 Angling Expenditures 13 Bait Use 16 Nonresident Trip Characteristics 18 Angling in
Angling in Manitoba (2000) TABLE OF CONTENTS Page Introduction 1 Angler Profile 2 Angling Effort 7 Catch and Harvest 10 Angling Expenditures 13 Bait Use 16 Nonresident Trip Characteristics 18 Angling in
The Economics of Atlantic Highly Migratory Species For-Hire Fishing Trips July - November 2013 Clifford Hutt and George Silva
 The Economics of Atlantic Highly Migratory Species For-Hire Fishing Trips July - November 2013 Clifford Hutt and George Silva U.S. Department of Commerce National Oceanic and Atmospheric Administration
Appendix H Recreation and Tourism (Chapter 8) Contents. List of Tables
 Contents. List of Tables") Appendix H Recreation and Tourism (Chapter 8) Contents Trends Data... H-2 CA DMV records... H-2 CA DFG Hunting/Fishing Licenses... H-2 USDA Agricultural Tourism... H-4 United States Forest Service... H-6
Appendix H Recreation and Tourism (Chapter 8) Contents Trends Data... H-2 CA DMV records... H-2 CA DFG Hunting/Fishing Licenses... H-2 USDA Agricultural Tourism... H-4 United States Forest Service... H-6
Determining coral reef impacts associated with boat anchoring and user activity
 Determining coral reef impacts associated with boat anchoring and user activity Protect Our Reefs Grant Interim Report October 1, 2008 March 31, 2009 Donald C. Behringer 1, Thomas K. Frazer 1, Robert A.
HISTORICAL DEVELOPMENT OF SOUTHWEST FLORIDA WATERWAYS The Boating Geography of Southwest Florida Before Coastal Development
 Lemon (Volume 1) Gasparilla Gasparilla Boca Grande Gasparilla The "Cut Off" Boca Nueva (Little Gasparilla ) Devilfish Key Cayo Pelau Gasparilla to San Carlos (45 miles) HISTORICAL DEVELOPMENT OF SOUTHWEST
Orange County MPA Watch A n n u a l R e p o r t
 Orange County MPA Watch 2 0 1 5 A n n u a l R e p o r t WHAT IS AN MPA? Marine Protected Areas (MPAs) are discrete geographic marine or estuarine areas designed to protect or conserve marine life and habitat.
California Boater Card FAQ
 California Boater Card FAQ California BOATER CARD Q: What is a California Boater Card? A: The California Boater Card shows that its holder has successfully taken an approved boating safety course and passed
CHAPTER 10 TOTAL RECREATIONAL FISHING DAMAGES AND CONCLUSIONS
 CHAPTER 10 TOTAL RECREATIONAL FISHING DAMAGES AND CONCLUSIONS 10.1 INTRODUCTION This chapter provides the computation of the total value of recreational fishing service flow losses (damages) through time
The Economic Significance of Florida Bay. Dr. Andrew Stainback GEER April Coral Springs, Florida
 The Economic Significance of Florida Bay Dr. Andrew Stainback GEER April 17-20 Coral Springs, Florida The Economic Significance of Florida Bay o Florida Bay provides numerous benefits that directly impact
2010 Pedestrian and Bicyclist Special Districts Study Update
 2010 Pedestrian and Bicyclist Special Districts Study Update Pedestrian and Bicyclist Special Districts Program Overview H-GAC s Special Districts Program aims to provide strategic investments in pedestrian
3 ROADWAYS 3.1 CMS ROADWAY NETWORK 3.2 TRAVEL-TIME-BASED PERFORMANCE MEASURES Roadway Travel Time Measures
 ROADWAYS Approximately 6 million trips are made in the Boston metropolitan region every day. The vast majority of these trips (80 to percent, depending on trip type) involve the use of the roadway network
Issues facing this region include the status of the Sluice Creek tide gates, various tidal wetlands, and locations of public access:
 5.6 Guilford Point to Madison Town Line Existing Resources This region extends from Guilford Point to the Madison town line. Named places include Grass Island and the East River. Residential, commercial,
HIGH YIELD ANGLERS IN RTO13: A SITUATION ANALYSIS EXECUTIVE SUMMARY
 HIGH YIELD ANGLERS IN RTO13: A SITUATION ANALYSIS EXECUTIVE SUMMARY PREPARED FOR TOURISM NORTHERN ONTARIO BY Research Resolutions & Consulting Ltd. MARCH 2013 2 INTRODUCTION As one of the ways to increase
Comments The Plan for Port Whitby
 Comments The Plan for Port Whitby April 24th, 2013 Community Meeting #2 Summary Report Prepared by GLPi April 29th, 2013 1 Introduction The purpose of the Port Whitby Secondary Plan Update, Community Improvement
Recreational Boating Feasibility and Capacity Study
 TOURISTICS + Shoreplan Engineering Limited were retained by: Town of Oakville; City of Burlington; and Regional Municipality of Halton. Note: Throughout the presentation boat lengths are identified in
Waterfront User Needs Assessment & Detailed Design RESPONSE TO COMMENTS
 Waterfront User Needs Assessment & Detailed Design RESPONSE TO COMMENTS Town of Cobourg Presentation to Council Monday July 3, 2018 4 PM 1 Response topics Opportunity to clarify and correct misinterpretations
Wildlife Ad Awareness & Attitudes Survey 2015
 Wildlife Ad Awareness & Attitudes Survey 2015 Contents Executive Summary 3 Key Findings: 2015 Survey 8 Comparison between 2014 and 2015 Findings 27 Methodology Appendix 41 2 Executive Summary and Key Observations
Hook Selectivity in Gulf of Mexico Gray Triggerfish when using circle or J Hooks
 Hook Selectivity in Gulf of Mexico Gray Triggerfish when using circle or J Hooks Alisha M. Gray and Beverly Sauls SEDAR43- WP- 09 25 March 2015 This information is distributed solely for the purpose of
Cost-Earnings Data Collection for the Hawaii Small Boat Fishery
 Cost-Earnings Data Collection for the Hawaii Small Boat Fishery Dr. Hing Ling (Michel) Chan JIMAR, University of Hawaii Dr. Minling Pan Pacific Islands Fisheries Science Center Mar 29, 2017 2017 NAAFE
San Patricio County Guided Fishing Market Research
 Guided Fishing Market Research San Patricio County, TX Miles Philips, Extension Specialist Texas A&M Agrilife Extension College Station, TX T: 979-845-1023 E: mdphillips@ag.tamu.edu http://fishing.tamu.edu
2019 Market Outlook. Jeff Tumbarello Director SWFL REIA Broker/Owner Steelbridge Realty LLC
 2019 Market Outlook Jeff Tumbarello Director SWFL REIA Broker/Owner Steelbridge Realty LLC Data from MLS (exported 1/14/2019 9:26 AM) and public records. Trended with Microsoft excel. Unless otherwise
Orange County MPA Watch A n n u a l R e p o r t
 Orange County MPA Watch 2 0 1 4 A n n u a l R e p o r t WHAT IS AN MPA? Marine Protected Areas (MPAs) are discrete geographic marine or estuarine areas designed to protect or conserve marine life and habitat.
Aerial Surveys Of Recreational Boating Activity In Collier County
 Aerial Surveys Of Recreational Boating Activity In Collier County Final Report Submitted To: Collier County Environmental Services Department 2800 North Horseshoe Drive Naples, FL 34104 Submitted By: Jay
METROPOLITAN TRANSPORTATION PLAN OUTREACH: INTERACTIVE MAP SUMMARY REPORT- 10/03/14
 METROPOLITAN TRANSPORTATION PLAN OUTREACH: INTERACTIVE MAP SUMMARY REPORT- 10/03/14 INTRODUCTION This document summarizes the results of the online interactive mapping exercise implemented by MIG for the
Rainy Lake Open-water Creel Survey:
 Rainy Lake Open-water Creel Survey: 21 11 Darryl McLeod District Update 212-1 Introduction An open-water creel survey was conducted on the Ontario portion of Rainy Lake from May 15 th (the opening of the
FOR SALE. 35± ACRES / Prime Riverfront Development Site. North Bank Of Caloosahatchee River YOUR LOCAL MARKET EXPERT SIZE: 35 Acres PRICE: $3,200,000
 North Bank Of Caloosahatchee River DOWNTOWN FT MYERS North EXIT 141 CALOOSAHATCHEE RIVER (Gulf Access) 80 31 BAYSHORE RD EXIT 143 SIZE: Lee County Civic Center 35 Acres PRICE: $3,200,000 STRAP #: 24-43-25-00-00019.0000
Modal Shift in the Boulder Valley 1990 to 2009
 Modal Shift in the Boulder Valley 1990 to 2009 May 2010 Prepared for the City of Boulder by National Research Center, Inc. 3005 30th Street Boulder, CO 80301 (303) 444-7863 www.n-r-c.com Table of Contents
LAKE ONTARIO FISHING AND FISH CONSUMPTION
 LAKE ONTARIO FISHING AND FISH CONSUMPTION by Nancy A. Connelly, Research Specialist, Cornell University Department of Natural Resources and Diane Kuehn, Extension Specialist, New York Sea Grant INTRODUCTION
Analysis of Run-Off-Road Crashes in Relation to Roadway Features and Driver Behavior
 Analysis of Run-Off-Road Crashes in Relation to Roadway Features and Driver Behavior Ertan Örnek University of Wisconsin, Madison Traffic Operations Lab 141 NW Barstow Street Waukesha, WI 53187 ornek@wisc.edu
Economic Analysis of Marine Recreational Fishing at NOAA Fisheries
 Economic Analysis of Marine Recreational Fishing at NOAA Fisheries Office of Science & Technology Sabrina Lovell Recreational Fisheries Economist March 8, 2017 Presented at EAA Seminar: Sustainable fisheries
Overview of Florida s Cooperative East Coast Red Snapper Tagging Program, SEDAR41-DW10. Submitted: 1 August 2014
 Overview of Florida s Cooperative East Coast Red Snapper Tagging Program, 2011-2013 Russell B. Brodie, Justin J. Solomon, Richard Paperno, Theodore S. Switzer, Cameron B. Guenther, and Beverly Sauls SEDAR41-DW10
Chapter 14: Conducting Roving and Access Site Angler Surveys
 Manual of Fisheries Survey Methods II: with periodic updates : Conducting Roving and Access Site Angler Surveys Roger N. Lockwood Suggested citation: Lockwood, Roger N. 2000. Conducting roving and access
The Great Calusa Blueway
 The Great Calusa Blueway February 10-16, 2018 Start: Koreshan State Historic Site End: Pine Island Total Distance: 57 miles Trip Fee: Includes camping, meals, and shuttle. $700/adults $675/seniors (65+)
Travel and Rider Characteristics for Metrobus
 Travel and Rider Characteristics for Metrobus 040829040.15 Travel and Rider Characteristics for Metrobus: 2012-2015 Overview The Miami Dade County Metropolitan Planning Organization (MPO) conducted a series
North Coast Corridor:
 North Coast Corridor: Connecting People, Transportation & Environment Legislative Hearing: 11.8.10 1 North Coast Corridor Region s Lifeline A Regional Strategy Mobility, Economy & Environment North Coast
Planning Daily Work Trip under Congested Abuja Keffi Road Corridor
 ISBN 978-93-84468-19-4 Proceedings of International Conference on Transportation and Civil Engineering (ICTCE'15) London, March 21-22, 2015, pp. 43-47 Planning Daily Work Trip under Congested Abuja Keffi
ADOT Statewide Bicycle and Pedestrian Program Summary of Phase IV Activities APPENDIX B PEDESTRIAN DEMAND INDEX
 ADOT Statewide Bicycle and Pedestrian Program Summary of Activities APPENDIX B PEDESTRIAN DEMAND INDEX May 24, 2009 Pedestrian Demand Index for State Highway Facilities Revised: May 29, 2007 Introduction
The Route 29 Corridor Study was initiated at the request of Virginia s Commonwealth
 CHAPTER 2: Study Background and approach The Route 29 Corridor Study was initiated at the request of Virginia s Commonwealth Transportation Board in response to requests from members of the General Assembly
MINNESOTA DEPARTMENT OF NATURAL RESOURCES DIVISION OF FISH AND WILDLIFE SECTION OF FISHERIES. Completion Report
 Minnesota Study 4 Job 849 March 2011 MINNESOTA DEPARTMENT OF NATURAL RESOURCES DIVISION OF FISH AND WILDLIFE SECTION OF FISHERIES Completion Report Mail survey of angler attitudes pertaining to Northern
HARBOR INFRASTRUCTURE INVENTORIES Caseville Harbor, Michigan
 HARBOR INFRASTRUCTURE INVENTORIES Caseville Harbor, Michigan Harbor Location: Caseville Harbor is located at the mouth of the Pigeon River on the east shore of Saginaw Bay, about 17 miles southwest of
Marine Debris from Land to Sea: Holistic Characterization, Reduction and Education Efforts in New Hampshire
 Marine Debris from Land to Sea: Holistic Characterization, Reduction and Education Efforts in New Hampshire ABSTRACT Over time, the focus of marine debris research and work has shifted away from simply
Gulf of Mexico Oil Spill
 Bulletin 1204 May 2013 Estimation of the Baseline for Assessment of Economic Impacts of the Gulf of Mexico Oil Spill on Mississippi s Commercial Fishing Sector Discrimination based upon race, color, religion,
APRIL 2017 LIVE BAIT
 K STATE OF ALABAMA DEPARTMENT OF CONSERVATION AND NATURAL RESOURCES MARINE RESOURCES DIVISION POST OFFICE BOX 189 DAUPHIN ISLAND, ALABAMA 36528 TEL (251861-2882 FAX (251) 861-8741 APRIL 2017 LIVE BAIT
DUXBURY WAVE MODELING STUDY
 DUXBURY WAVE MODELING STUDY 2008 Status Report Duncan M. FitzGerald Peter S. Rosen Boston University Northeaster University Boston, MA 02215 Boston, MA 02115 Submitted to: DUXBURY BEACH RESERVATION November
Missouri Non Native Aquatic Species and Watercraft Survey, October 2009
 Missouri Department of Conservation Missouri Non Native Aquatic Species and Watercraft Survey, October 9 Timothy J. Banek and Shelly N. Colatskie March 11 This project was funded by the U.S. Fish and Wildlife
Independent Economic Analysis Board. Review of the Estimated Economic Impacts of Salmon Fishing in Idaho. Task Number 99
 IEAB Independent Economic Analysis Board Roger Mann, Chair Noelwah R. Netusil, Vice-Chair Kenneth L. Casavant Daniel D. Huppert Joel R. Hamilton Lon L. Peters Susan S. Hanna Hans Radtke Review of the Estimated
BOATING VISITORS SURVEY SCREENER/TALLY SHEET. Interview Location (circle county): Palm Beach Broward Dade Monroe
: Palm Beach Broward Dade Monroe") BOATING VISITORS SURVEY SCREENER/TALLY SHEET Interviewer: _ Interview Location (circle county): Palm Beach Broward Dade Monroe Site Location: 1. Are you a permanent resident of (county of interview)? YES
BOATING VISITORS SURVEY SCREENER/TALLY SHEET Interviewer: _ Interview Location (circle county): Palm Beach Broward Dade Monroe Site Location: 1. Are you a permanent resident of (county of interview)? YES
DOT HS September Crash Factors in Intersection-Related Crashes: An On-Scene Perspective
 DOT HS 811 366 September 2010 Crash Factors in Intersection-Related Crashes: An On-Scene Perspective DISCLAIMER This publication is distributed by the U.S. Department of Transportation, National Highway
Department of Agricultural and Resource Economics, Fort Collins, CO
 July 2011 EMPR 11-01 Department of Agricultural and Resource Economics, Fort Collins, CO 80523-1172 http://dare.colostate.edu/pubs WHAT IS THE VALUE OF A FISHING TRIP? A COMPARISON OF PUBLIC AND PRIVATE
TESTIMONY OF THOMAS O KEEFE, PhD PACIFIC NORTHWEST STEWARDSHIP DIRECTOR ON BEHALF OF AMERICAN WHITEWATER
 TESTIMONY OF THOMAS O KEEFE, PhD PACIFIC NORTHWEST STEWARDSHIP DIRECTOR ON BEHALF OF AMERICAN WHITEWATER OREGON STATE HOUSE House Committee on Transportation Policy Representative Caddy McKeown, Chair