Kootenay Lake Fisheries Advisory Team Workshop Summary, May 15/16, 2018
|
|
|
- Robyn Hensley
- 5 years ago
- Views:
Transcription


1 Kootenay Lake Fisheries Advisory Team Workshop Summary, May 15/16, 2018 Final Report October 2018 Prepared for BC Ministry of Forests, Lands, natural Resource Operations and Rural Development Victoria Street Nelson BC V1L 4K3 Prepared by Lotic Environmental Ltd 2193 Mazur Road Cranbrook, BC V1C 6V9
2 Kootenay Lake Fisheries Advisory Team Workshop Summary, May 15/ Suggested Citation McPherson, S Kootenay Lake Fisheries Workshop Summary, May 15/16, Prepared by Lotic Environmental Ltd. for the BC Ministry of Forests, Lands, Natural Resource Operations and Rural Development, Nelson. ii
3 Kootenay Lake Fisheries Advisory Team Workshop Summary, May 15/ Acknowledgements I wish to thank all of the scientists and managers comprising the Kootenay Lake Fisheries Advisory Team for their valued input. Their fisheries knowledge and expertise specific to Kootenay Lake were used directly to prepare this report. I would also like to express my appreciation to Jeff Burrows and Matt Neufeld, for their guidance, review, and technical contributions to this report. It has been a pleasure facilitating this important process. Please do not hesitate to contact me with any inquiries about this document. Sherri McPherson (BSc, RPBio) Senior Aquatic Biologist Sherri.mcpherson@lotic.co Cover photos: Kootenay Lake (left), Kokanee (top right, Fish and Wildlife Compensation Program), Gerrard rainbow trout (bottom right, Barrie Kovish). iii
4 Kootenay Lake Fisheries Advisory Team Workshop Summary, May 15/ Table of Contents Suggested Citation... ii Acknowledgements... iii 1 Introduction Background information and biological response update Kokanee Kootenay Lake spawner numbers, potential egg deposition, fry production (Matt) Kokanee in-lake estimates (Tyler/David) Piscivores (Matt) Gerrard Rainbow Trout spawner abundance trends and biological data Bull Trout spawner abundance trends and biological data Rainbow Trout fishery trends and inferred in-lake abundance Bull Trout fishery trends and inferred in-lake abundance In-lake sampling (diet, genetics, age structure, fecundities, age at lake entry, etc.)8 2.3 Nutrient restoration program update (Kristen) Review of actions, triggers, and implementation...12 Action 1 - Kokanee supplementation...12 Action 2 Meadow Creek Kokanee egg incubation...15 Action 3 - Kokanee Angling Closure...15 Action 4 - Nutrient Program...15 Action 5 - Mysis Removal...15 Action 6 - Predator Management - Rainbow Trout...16 Action 7 - Predator Management Bull Trout...16 Action 8 Predator conservation Gerrard Rainbow Trout...16 Action 9 - Predator conservation Bull Trout Effective actions taken since round-table discussion Areas requiring potential improvement/updates guided by key questions Should we stock Kokanee fry or eggs? What Kokanee sources are suitable to stock, and where are they suitable to stock? Stocking background Stocking discussion Stocking options poll Would a more assertive piscivore reduction accelerate Kokanee recovery? Piscivore background How many Kokanee do Bull Trout and Rainbow Trout eat and what are the predicted impacts of these management actions? Predator control options poll There is partial funding for modelling support through Freshwater Fisheries Society. Is this required, and what direction should this take? Model discussion: Model recommendation Do we continue with the nutrient program? Are any changes required? Nutrient program discussion Nutrient program recommendation What is the required monitoring program over the next 3 years to track response? Monitoring program recommendations Conclusions...43 iv
5 Kootenay Lake Fisheries Advisory Team Workshop Summary, May 15/ List of Tables Table 1. Kokanee supplementation before (2015) and after development of the Action Plan (2016, 2017). Highlighted locations were not specifically identified in the Action Plan Table 2a. Egg plant / fry stocking sampling matrix and identification method. TM=thermal mark; DNA = genetic analysis Table 3. Probability of spawning estimates...18 Table 4. Among-site Kokanee genetic differentiation between Kootenay Lake Meadow Creek, and all other site samples. Samples added this year indicated in italics Table 5. Kokanee egg stocking options and associated risks to genetic structure in Meadow Creek...24 Table 6. Estimated annual consumption of Kootenay Lake Kokanee (kg of Kokanee consumed per predator), using two methods. The first (H. Ward, pers. comm.) assumes stomach contents represent 24-h of consumption and expands consumption data by predator size category. The second uses a temperature range to estimate min/max evacuation rate and consumption over 24 h with all predator sizes pooled Table 7. Bull Trout spawners and potential surplus...32 Table 8. Kootenay Lake Action Plan Summary, List of Figures Figure 1. Kootenay Lake, and locations of relevance... 2 Figure 2. Total Kokanee escapement, North Arm Kootenay Lake (FLNRORD, data on file) Figure 3. Acoustic abundance trends for age 0 and age 1-3+kokanee from fall surveys of Kootenay Lake (2017 data are preliminary) Figure 4. Kokanee biomass density estimate for Kootenay Lake... 5 Figure 5. Gerrard Rainbow Trout escapement (spawner) and juvenile abundance estimates (juvenile estimates from Andrusak, adult escapement from Nelson FLNRORD) Figure 6. Kootenay Lake Bull Trout escapement estimates Figure 7. Kootenay Lake fishing effort (from KLRT data) Figure 8. Rainbow Trout catch per unit effort (KLRT data)... 7 Figure 9. Bull Trout catch trend data Figure 10. Gerrard age structure from scale analysis ( ) Figure 11. Rainbow Trout diet composition in (RBT all), and in 1973, corresponding with low and high Kokanee abundance, respectively Figure 12. Kootenay Lake phosphorus loading, Daphnia and Kokanee (FLNRORD data on file) Figure 13. Kokanee egg deposition versus fall fry estimates, Figure 14. In-lake Kokanee age 0-1 survival Figure 15. Predator abundance estimated by KLRT questionnaire (calibrated by creel) Figure 16. Gerrard spawner abundance...19 Figure 17. Cycles in Gerrard spawner mean fork length (left) and fecundity (right) Figure 18. Piscivore monitoring ( ) diet composition - % composition by mass...21 Figure 19. Poll results for stocking options...26 Figure 20. Bull Trout management options Figure 21. Rainbow Trout management options Figure 22. Kokanee consumption estimates, based on predator/prey weight relationship, and % occurrence in diet data Figure 23. Predator management options compared to stocking benefits (assumes 35% eyed egg to fall fry survival and assumptions in Figure 22; might be an underestimate) Figure 24. Predator management options and associated Kokanee consumption reductions...32 v
6 Kootenay Lake Fisheries Advisory Team Workshop Summary, May 15/ Figure 25. Bull Trout spawner removal options and poll outcome (15 participants voted) Figure 26. Bull Trout in-lake removal options and poll outcome (18 participants voted) Figure 27. Rainbow Trout in-lake removal options and poll outcome (14 participants voted) Figure 28. Zooplankton production - Daphnia...38 Figure 29. Mysis and Kokanee (top slides), Mysis biomass in Kootenay and Okanagan lakes (bottom; J. Burrows) Appendices Appendix A. Kootenay Lake Fisheries Advisory Team meeting attendance Appendix B. Kootenay Lake advisory team presentation (prepared by Matt Neufeld, Tyler Weir, David Johner, Jeff Burrows, Eva Schindler, Hillary Ward, Kristen Peck, Steve Arndt and Robert Bison) vi
7 Kootenay Lake Fisheries Advisory Team Workshop Summary, May 15/ Introduction Kootenay Lake supports one of British Columbia s most important large lake sport fisheries. The trophy sized Gerrard Rainbow Trout (Gerrard) are prized by anglers, and are important economically and recreationally. Bull Trout, which also grow to a large size, are highly valued as well. The Gerrard fishery is in decline, with poor fish condition, and few large fish. Current data indicates that a leading cause for this is an imbalance between predator (Gerrard and Bull Trout) and prey (Kokanee) abundance. The objective of the Kootenay Lake Fisheries Advisory Team (KLAT) is develop and implement the Kootenay Lake Action Plan (the Plan), which is aimed at recovering populations of Kokanee, Gerrard, and Bull Trout. The Team has met and developed plans over the last few years, starting in 2015, with two workshop summary reports (Lotic Environmental Ltd , 2 ); and resuming in 2016, with the development of the Kootenay Lake Action Plan (Redfish Consulting Ltd 2016; the 2016 Action Plan) 3. The 2016 Action Plan was comprehensive, identifying actions, tools, triggers/measures/targets; rationale, benefits/risk; and rank. Following two years of Action Plan implementation, the Region invited the KLAT to participate in a workshop on May 15/ , in Nelson BC. The objectives of the workshop were to: 1. Review associated biological response, 2. Review any additional new data. 3. Provide recommendations on actions required to aid fish population recovery KLAT are members based on their fisheries science and management expertise/responsibility pertinent to benefitting Kootenay Lake fisheries. The KLAT are representatives from: the Ktunaxa Nation; Freshwater Fisheries Society of BC (FFSBC); BC Wildlife Federation; BC Ministry of Environment (BC MoE); and BC Ministry of Forests, Lands, Natural Resource Operations and Rural Development (FLNRORD). Members in attendance at the May 15/16 workshop are identified in Appendix A. This report is a summary of the May 2018 workshop. An overview map of Kootenay Lake, showing locations of relevance is provided below (Figure 1). 1 Lotic Environmental Ltd Kootenay Lake fisheries meeting summary, March 12/13, Prepared for the Ministry of Forests, Lands and Natural Resource Operations. 2 Lotic Environmental Ltd Kootenay Lake Fisheries Meeting Summary, October 2, Prepared for the Ministry of Forests, Lands and Natural Resource Operations. 3 Redfish Consulting Ltd Kootenay Lake Action Plan. Prepared for the Ministry of Forests, Lands and Natural Resource Operations 1

8 Kootenay Lake Fisheries Advisory Team Workshop Summary, May 15/ Gerrard R. - upstream in Lardeau R watershed Figure 1. Kootenay Lake, and locations of relevance 2

9 Kootenay Lake Fisheries Advisory Team Workshop Summary, May 15/ Background information and biological response update Historical background information and data were presented, showing the biological responses since implementation of the 2016 Plan. Presentations were all encompassing, including: Kokanee and piscivore spawner and in-lake estimates, piscivore fishery trends, other piscivore in-lake sampling data, Kootenay Lake Kokanee dynamics with a stock recruitment approach, and the nutrient restoration program Appendix B. This information was presented by Matt Neufeld, Tyler Weir, David Johner, Jeff Burrows, Eva Schindler, Hillary Ward, Kristen Peck, Rob Bison and Steve Arndt. Highlights of these presentations are largely provided in this section, with some material also nestled in subsequent sections (Section 3 - Review of actions, triggers, and implementation; Section 4 - Effective actions taken since round-table discussion; and Section 5 - Areas requiring potential improvement/updates guided by key questions). 2.1 Kokanee Kootenay Lake spawner numbers, potential egg deposition, fry production (Matt) Kokanee spawner count data has been collected since 1964 (and since 1980 for comparable modern lake and tributary conditions) for both the Lardeau River and Meadow Creek populations (north arm tributaries). In 2011, the number of observed spawners was 1.7 million fish. Since 2011, spawner numbers have been declining steadily, with the lowest count on record in 2017 at 12,074 fish (Figure 2). In 2018, Kokanee spawners are not expected to recover, with spawner predictions between 30,000 and 40,000. Figure 2. Total Kokanee escapement, North Arm Kootenay Lake (FLNRORD, data on file). 3
10 Kootenay Lake Fisheries Advisory Team Workshop Summary, May 15/ Other indications of declining Kokanee population status, from spawning stream monitoring data were: Kokanee spawner biomass has been low since 2015, with 2017 biomass at <0.5 kg/ha. In contrast, the highest spawner biomass was >5 kg/ha in Egg deposition has been lower than normal in recent years. Approximately 150 million eggs were deposited in 2011, and there were less than 25 million in 2015 to 2017 (including supplemented transplants from outside of Kootenay Lake). Kokanee data from spawning tributaries that indicate normal and/or compensatory life-stages during recent years were: Since 2014, spawner fork length has been the highest of all years sampled. In 2017, mean spawner fork length was 300 mm. Egg to fry survival has been normal or (higher than normal) since In 2017, egg to fry survival was 40%. Finally, spring fry to fall fry survival is typical and not low Kokanee in-lake estimates (Tyler/David) Kokanee in-lake abundance data from fall acoustic surveys showed a marked decline in age 1 to 3+ aged fish since 2012 (Figure 3). Abundance in 2017 for age 1 to 3+ Kokanee was the lowest of all years sampled (< 0.5 million fish). This was a contrast to 2012, which had approximately 2.4 million age 1-3+ Kokanee, and to 2009, which had greater than 15 million. Figure 3. Acoustic abundance trends for age 0 and age 1-3+kokanee from fall surveys of Kootenay Lake (2017 data are preliminary). Other items of potential concern for Kokanee evident from in-lake monitoring results were: Kokanee biomass density estimates showed a decline in in-lake values since In 2011 Kokanee biomass was approx. 8 kg/ha, and in 2017 biomass was <1 kg/ha (Figure 4). Size and condition (Fulton s K) of age 1 Kokanee has been well below average since 2013, which was unexpected given the abundant zooplankton available over this period. This could be a symptom of a change in feeding behaviour required to avoid predation. Age at maturity has been dominated by age 3 and has not shifted to age 2. Low densities and excellent zooplankton resources should have led to rapid growth and earlier 4
11 Kootenay Lake Fisheries Advisory Team Workshop Summary, May 15/ maturation. No change in age at maturity is likely a result of poor age 1 size/growth. Kokanee that survived beyond age 1 grew exceptionally well. Age 0-1 survival has been consistently at an all-time low since 2012 (~5-7%). Figure 4. Kokanee biomass density estimate for Kootenay Lake. Kokanee results that indicated normal values relative to the historical dataset were: Age 0 Kokanee abundance was within the normal range of previous years sampled values were nearly 10 million fish (Figure 3). Age 0 Kokanee mean fork length has been above average since 2012 (2015 and 2016 were record highs), indicating fry have been benefiting from the increased zooplankton availability. Age 2 and older Kokanee (in-lake and spawner) size has been at record highs in recent years, indicating the expected compensatory growth has occurred during the period of reduced abundance. 2.2 Piscivores (Matt) Gerrard Rainbow Trout spawner abundance trends and biological data From data collected at Gerrard River and throughout the Lardeau River, there were several indications of declines in the Gerrard Rainbow Trout population in recent years: Spawner abundance has declined in the last two years. Spawner abundance peaked in 2012 (~1500 fish), and this steadily declined to be ~300 fish in 2016 and ~190 fish in 2017 (Figure 5). Juvenile (age 1+) numbers were low following a very similar trend to spawner numbers. Gerrard Rainbow Trout spawner size has declined. Mean fork lengths in 2016 and 2017 were 58 and 53 cm, respectively; whereas, the range from 1979 to 2015 was cm. 5
12 Kootenay Lake Fisheries Advisory Team Workshop Summary, May 15/ RBT spawners (#) RBT juvenile abundance (#) Figure 5. Gerrard Rainbow Trout escapement (spawner) and juvenile abundance estimates (juvenile estimates from Andrusak, adult escapement from Nelson FLNRORD). Spawner mean age was relatively stable, at years in 2016 and Although the current in-lake (age 1-4) survival is unknown, as a result of the declining juvenile supply, future in-lake abundance reductions are possible Bull Trout spawner abundance trends and biological data Bull Trout spawner abundance, as measured in index tributaries, found 2017 to be similar to 2013 (~3500 fish; Figure 6) showed a large increase since 2015 (~1250 fish). It is unclear whether this represents changes in spawning frequency, or actual changes to in-lake bull trout abundance. In 2017, the most spawners were in Hamill Creek and Kaslo River, representing over half of all spawners of those streams counted (index streams). Figure 6. Kootenay Lake Bull Trout escapement estimates. 6
13 Kootenay Lake Fisheries Advisory Team Workshop Summary, May 15/ Rainbow Trout fishery trends and inferred in-lake abundance Kootenay Lake Rainbow Trout (KLRT) creel survey data showed a decline in effort from 2013 to 2016 (~40,000 - ~15,000 angler days per year, respectively; Figure 7). The recent communication/outreach and daily quota increases have only resulted in slightly more harvest. This was evident by a reduction in release rate from 65% in 2014/15 to 55% in 2016/17. The catch per unit effort data (CPUE), indicated ~ 1 rainbow trout caught per rod day. Figure 7. Kootenay Lake fishing effort (from KLRT data). Other Rainbow Trout catch trends from KLRT data were: The Rainbow Trout CPUE increased over time for all size classes (Figure 8). This was matched by the increase in < 2 kg age class CPUE since The large size classes (2 to >7 kg) are now gone, with the catch being generally small fish. Since 2015, there has been a departure between the CPUE and catch trends. While the CPUE has increased, the estimated numbers of fish caught has declined. Figure 8. Rainbow Trout catch per unit effort (KLRT data) 7
14 Kootenay Lake Fisheries Advisory Team Workshop Summary, May 15/ Bull Trout fishery trends and inferred in-lake abundance The general Bull Trout CPUE has increased over time (Figure 9). However, similarly to Rainbow Trout, the largest size classes (5 to >7 kg) are now gone, and the catch is now mostly small fish (<2 kg). Since 2015, there has also been declining numbers of Bull Trout caught overall. Figure 9. Bull Trout catch trend data In-lake sampling (diet, genetics, age structure, fecundities, age at lake entry, etc.) To better inform recovery actions, the piscivore monitoring program was expanded in 2015 to include: genetic structure of mixed stock Rainbow Trout fishery (% Gerrard versus insectivores in catch), age structure, diet, maturation rate (% ripe) by ecotype, fecundity, and age at entry to lake. A summary of results are as follows: Genetics from 921 fish (from across 18 reference samples, and 6 mixed stock (i.e. in the lake), identified that approximately 75% of the catch were Gerrards. These results have been relatively stable since Morphometric measures and diet confirmed genetics: o Kokanee were a significant portion of diet only for Gerrards, while Mysis and zooplankton were more important for insectivores o Piscivores had a larger mouth to head ratio (i.e., to eat Kokanee). Scale analysis of data available in , suggested expected in-lake age structure, despite the lack of large fish (Figure 10). 8
15 Kootenay Lake Fisheries Advisory Team Workshop Summary, May 15/ Figure 10. Gerrard age structure from scale analysis ( ). Gerrard fecundity showed a significant decrease from historic samples, concurrent with fish size. In fecundity was as high as 14,000 eggs, while in fecundity was <2000 eggs. Piscivore monitoring of diet composition, measured as % composition by mass, revealed the following: o In 2015 to 2017, Kokanee made up a higher proportion of the Bull Trout diet (68%), than the Rainbow Trout diet (22%). Insects were the highest proportion of the Rainbow Trout diet (36%). o There were seasonal shifts in diet, with Bull Trout consuming more Kokanee in the spring (90%) than fall (65%). The fall Bull Trout diet was supplemented by Mysis. Rainbow Trout diet was more diverse, or opportunistic; in the spring it was mostly insects (40%), followed by Mysis (26%), and Kokanee (28%). In the fall, the Rainbow Trout diet shifted to Mysis (35%), Kokanee (27%), and zooplankton (18%). o Rainbow Trout diet under conditions of low Kokanee abundance was different than under higher Kokanee abundance (measured historically). Specifically, there is a current shift to Mysis and zooplankton to offset low Kokanee availability (Figure 11). This outcome has implications for Kokanee recovery, namely, that even at unchanged future predator density, Rainbow Trout consumption of Kokanee will likely increase concurrent with Kokanee abundance increases. 9
16 Kootenay Lake Fisheries Advisory Team Workshop Summary, May 15/ Figure 11. Rainbow Trout diet composition in (RBT all), and in 1973, corresponding with low and high Kokanee abundance, respectively. Gerrard rearing origin and age at lake entry were reviewed using otolith microchemistry. The study is still underway, and includes both Gerrards and insectivores to validate the approach, provide contrast, and identify if signatures differ between groups. The hypothesis is that: if fry in excess to Lardeau River capacity do not contribute to Gerrards caught in the lake fishery, then high Gerrard abundance and Kokanee collapse is driven by a change to Gerrard in-lake survival (between age 1+ and 3). If fry do contribute to Gerrards caught in the lake fishery, then a change in survival did not necessarily contribute to Kokanee collapse. o POST WORKSHOP INFO: Following the workshop a participant provided that the hypothesis about Gerrard juveniles may not be the only plausible explanation for the Kokanee decline. It is presented because it is the only data available. For example, could be Bull Trout or Sturgeon or other predators that responded to increased productivity over time. Sturgeon eat a lot of kokanee. 2.3 Nutrient restoration program update (Kristen) The nutrient restoration program replaces nutrients lost behind upstream reservoirs, restoring the lake to natural productivity. Nutrient additions commenced in the North Arm in 1992, and in the South Arm in Monitoring has been ongoing since the start of the nutrient additions, and has included: water temperature, Secchi depth, water quality, phytoplankton, primary production, zooplankton, mysids, Kokanee hydroacoustics (two surveys per year), Kokanee trawl (fall survey), Kokanee spawner escapement in Duncan/Lardeau and South Arm tributaries, and Bull Trout redd surveys (in 2011, 2013, 2015 and 2017, tributaries in addition to the Kaslo and Keen tributaries). The Kokanee and Bull Trout redd count information was presented in other sections of this document. Key nutrient monitoring results were: Phytoplankton (both edible and inedible) bio-volume (mm 3 /L) has been consistent, with seasonal variation within a sampling season. Zooplankton biomass, presented as annual mean Daphnia biomass from April to October, reveal higher than average values since Daphnia is a preferred food source for 10

17 Kootenay Lake Fisheries Advisory Team Workshop Summary, May 15/ Kokanee and these results indicate that there is above average food available. Daphnia has increased likely due to a lack of grazing pressure from Kokanee. Mysids and Kokanee both eat zooplankton. In the absence of high Kokanee biomass, there is a risk that the mysid population could increase. However, the monitoring results indicate that the mysid standing crop biomass has been stable. Kokanee spawner counts were conducted in South Arm tributaries (Crawford, Boulder, Goat, Summit, and Midge creeks). These tributaries, in 2017, made up 5 to 10 % of Kokanee spawners from Kootenay Lake. POST WORKSHOP INFO: o Although historic South Arm spawner data are limited, South Arm Kokanee are not believed to have comprised this high of a proportion of total spawners in recent history. This suggests that South Arm spawning Kokanee survived at a higher rate than North Arm spawners for one or more cohorts. The reason(s) are unknown, but could include reduced competition from formerly strong North Arm stocks (including significantly increased egg to fry survival resulting from much larger spawners), and possibly lower Bull Trout numbers. There is currently insufficient data to determine whether South Arm spawner replacement is consistently higher than that of North Arm spawners, or what years it has been. o This seems to assume the South Arm fry remain in South Arm. These could be strays from North Arm or Libby entrainment. Genetics could help answer these questions. Over the years of nutrient restoration program, there has been annual variation in phosphorus inputs to the lake (fertilizer and input from the Kootenai/y River and Duncan River provide the annual input). Figure 12 illustrates the pattern of Kokanee spawners, Daphnia biomass, and phosphorus inputs to the lake since The figure illustrates the pattern shift of Daphnia increasing from 2013 through 2017, while Kokanee spawners decreased from previous years. When Kokanee populations increase, it is expected that the trend in Daphnia biomass will decrease as there would be additional grazing pressure. Figure 12. Kootenay Lake phosphorus loading, Daphnia and Kokanee (FLNRORD data on file). 11
18 Kootenay Lake Fisheries Advisory Team Workshop Summary, May 15/ Review of actions, triggers, and implementation Action 1 - Kokanee supplementation Trigger (to enact an improvement action): < thousand spawners; age 0-1 survival of <11%. Action: > 5 million eyed eggs were stocked annually in Meadow Creek in 2016 and 2017 (Table 1). Implementation details: An important consideration was the genetic source suitability of the stocked eggs. The 2016 Action Plan identified suitable genetic sources as Whatshan, Kinbasket Reservoirs and Lussier River. Since 2016, more than half of transplanted Kokanee departed from these recommended sources. Table 1. Kokanee supplementation before (2015) and after development of the Action Plan (2016, 2017). Highlighted locations were not specifically identified in the Action Plan. Year Source Location Eyed egg % number Contribution Total Hill Creek 477,398 43% 2015 Koocanusa (Lussier and Norbury) 493,371 44% 1,113,006* Interior Brood Lakes 142,237 13% Whatshan 603,164 9% Fairmont (Columbia) 1,569,888 23% Hill Creek 1,381,059 20% ,759,574** Koocanusa (Lussier, Norbury, 1,203,857 18% and Bull) Interior Brood Lakes 2,001,606 30% 2017 Whatshan 240,270 3% Fairmont (Columbia) 1,238,740 14% Hill Creek 6,496,339 75% Interior Brood Lakes 726,544 8% Legend: *Combined eyed egg and fry planting **Eyed eggs only 8,701,893** Monitoring results: There are several questions the monitoring program should answer, including: are stocking efforts meeting with success, what is success, is survival similar to wild Kokanee, and is there an increase in overall Kokanee survival? 1. Spawning channel a. Supplementation (egg stocking) is significant contributor to overall egg supply (30-60% of all eggs) in the past two years. b. The egg deposition crash has roughly corresponded with escapement. 12
. e.")
19 Kootenay Lake Fisheries Advisory Team Workshop Summary, May 15/ c. Transplanted eyed egg-to-fry survival in Meadow Creek was 60-90%; this was as good as or better than typical channel survival. d. Although fall fry supply had decreased, it was not too far outside historic lows (Figure 13). e. As of fall 2017, in-lake Kokanee 0-1 survival remained low (~5%), despite the start of Kokanee supplementation (Figure 14). Eggs 300,000, ,000, ,000, ,000, ,000,000 50,000,000 Total Egg Deposition (including stocking) Fall Fry Estiamte 35,000,000 30,000,000 25,000,000 20,000,000 15,000,000 10,000,000 5,000,000 Fry Year Figure 13. Kokanee egg deposition versus fall fry estimates, Figure 14. In-lake Kokanee age 0-1 survival. 2. It takes two years from when eggs are planted to see if a signal is received in the lake. Inlake monitoring of stocked Kokanee survival was presented as a sampling matrix (Table 2a,b): a. The 2015 cohort (1 million combined fry/eggs) was heat marked (or thermal marked - TM). These fish will spawn in 2018 and
 were not heat marked, but there is 2018 funding to look at the feasibility of genetics analysis to evaluate this year class survival c. The 2017 cohort (8.")
20 Kootenay Lake Fisheries Advisory Team Workshop Summary, May 15/ b. The 2016 cohort (6.8 million eggs) were not heat marked, but there is 2018 funding to look at the feasibility of genetics analysis to evaluate this year class survival c. The 2017 cohort (8.7 million eggs) were, for the most part, heat marked. The 2019 trawl will be the first data available for this cohort, although effort will be made to extract otoliths from the fry caught in the trawl in Table 2a. Egg plant / fry stocking sampling matrix and identification method. TM=thermal mark; DNA = genetic analysis. stocking Metric type fall fall fall fall fall fall ee survival/abundance as age 1+ (trawl sample analysis) n=0 DNA TM ee survival/abundance as age 2+ spawner TM DNA TM ee survival/abundance as age 3+ spawner TM DNA TM ee survival to spawn (using cumulative age 2-4 spawner abundance) TM DNA fry Fall age 0 abundance n=2 n/a fry survival/abundance as age 1+ (trawl sample analysis) ns n=0 n/a fry survival/abundance as age 2+ spawner ns TM n/a fry survival/abundance as age 3+ spawner DNA TM n/a fry survival to spawn (using cumulative age 2-4 spawner abundance) DNA TM n/a Table 2b continued. Egg plant / fry stocking sampling matrix. POST WORKSHOP INFO: Otoliths from the 2016 and 2017 trawl caught fish >~90 mm have been analyzed for temperature marks, but the data have been inconclusive. Overall, the team was not yet 100% confident in the ability to identify thermal marks. Sampling age 0 otoliths was planned for 2018 in addition to older age classes. Analysis of reference samples of known TM d fish was planned for further evaluation of the method. Ultimately, it was expected that spawner samples would be the most informative as survival to spawn was identified as the most viable metric to evaluate overall success. 14
21 Action 2 Meadow Creek Kokanee egg incubation Trigger: None Kootenay Lake Fisheries Advisory Team Workshop Summary, May 15/ Action: Upgrade Meadow Creek hatchery to increase incubation capacity above 5 million. Implementation details: 1. Completed actions - ~1 million eggs were incubated in 2017; FFSBC has also increased capacity to ~8 million through upgrades/staff and facility planning (this may not sustainable indefinitely). 2. Meadow Creek is considered a poor/last option for incubation. This is because there are no alarms, there are egg quality issues, and cold water pushes egg plants to occur late. 3. Egg supply is more limiting than incubation space, as there are only so many wild eggs available by source; and collection/egg management is also intensive and uses a lot of resources. Action 3 - Kokanee Angling Closure Trigger: <140,000 spawners; age 0-1 <11% Action: Maintained Kokanee daily quota=0. Implemented in 2015, and continued to 2018 Action 4 - Nutrient Program Trigger: None Action - Continued implementation of current program (late April through early to mid-september) Action 5 - Mysis Removal Trigger: Explore feasibility, removal if density > 463 ind/m 2 (2 SD > mean). Action: Evaluate feasibility of Mysis removal Implementation details: The KLAT evaluated options of a removal program in A feasibility review is now in development. 15
22 Action 6 - Predator Management - Rainbow Trout Kootenay Lake Fisheries Advisory Team Workshop Summary, May 15/ Trigger: <140,000 Kokanee spawners; age 0-1 Kokanee survival <11% Action: Increase harvest, through Recreational Fishery Regulations Implementation details: 1. Implemented Rainbow Trout daily harvest quota increase (increased to 4 fish/day in 2015 and then 5/d in 2018; still only 1>50cm) 2. KLRT Rainbow Trout harvest rate increased ~14% between 2015 and 2017, as a result of regulations and outreach combined. 3. Effort declines resulted in a decrease in overall Rainbow Trout harvest (from ~9,000 to 4,000 in the same period). 4. Additional predator removal options briefly mentioned but not defined in Action Plan. Action 7 - Predator Management Bull Trout Trigger: <140,000 kokanee spawners; age 0-1 survival <11% Action: Increase harvest through Recreational Fishery Regulations Implementation details: 1. Regional biologists recommended a harvest increase to 2 Bull Trout / day (only 1 >50 cm) in Due to stakeholder opposition, management decided not to proceed. 2. In 2018, the daily catch quota increase was approved at 2 Bull Trout / day (only 1 >50 cm). 3. It is now too soon to estimate changes in release rate that would indicate success. 4. Additional predator removal options briefly mentioned but not defined in Action Plan. Action 8 Predator conservation Gerrard Rainbow Trout Trigger 1: spawners; action not triggered Action 1: Reduce exploitation though regulations Trigger 2: < spawners in two consecutive years; action not triggered Action 2a: Hatchery Supplementation Gene Banking to sustain Gerrard populations if population collapse imminent. Action 2b: Reduce exploitation though regulations. Action 9 - Predator conservation Bull Trout Trigger: Escapement < 50 spawners in Kaslo River and < 500 spawners in lake-wide index; action not triggered. Action: Reduce exploitation though regulations. 16

23 Kootenay Lake Fisheries Advisory Team Workshop Summary, May 15/ Effective actions taken since round-table discussion 1. There has been public support of the Action Plan because the actions are connected to clear and accountable tools, triggers, and measures. It is good to have it clearly laid out in this way. 2. FLNRORD s KLRT questionnaire does a good job of estimating fishing effort. People have not gone fishing more. There were 38,000 anglers in 2012 and ~17,000 in There have been fewer guided trips, fewer locals fishing, less people catching and releasing the big fish. Now smaller fish mainly available, those angling to keep, or at least land, a very large rainbow are largely fishing elsewhere. 3. Angler composition still people coming from elsewhere to fish; type of people might be different. Anecdotal evidence that people are moving over to Arrow Lakes to catch big fish. 4. What stands out is higher juvenile Rainbow Trout survival, less people on lake, less spawners. 5. Juvenile Rainbow Trout production has also been declining. Number of trout rearing in the lake (or trout at large) was estimated using the Peterson mark recapture method: The method uses maturing gonads as a mark. The number of trout are estimated by expanding the number of spawners by the ratio of trout sampled the previous year to the number ripe in that sample. The Marking session (spawning) occurs after recapture session (previous year of observations) reverse order compared to typical mark-recapture estimation projects. a. Using this method, the number of Rainbow Trout at large was 1,328 fish in 2016, and 5,461 in It is difficult to reconcile these numbers with apparent trout abundance estimated by KLRT questionnaire (calibrated by creel) of 50,000, for the consumption analysis, which indicates much higher trout numbers (Figure 15). b. The probability of spawning estimates by age class were provided (Table 3). Figure 15. Predator abundance estimated by KLRT questionnaire (calibrated by creel). 17

24 Kootenay Lake Fisheries Advisory Team Workshop Summary, May 15/ Table 3. Probability of spawning estimates 6. Uncertain what the Rainbow Trout (age 1-4) in lake survival is. a. A tagging program using coded wire can give a direct estimate of survival. This would allow for a time series of information to be started. b. Acoustic tags produced survival rates. How do they compare? c. Need to be careful about using CPUE from KLRT to describe populations. Will plummet and see a lot less Rainbow Trout in the lake. Lots of small fish all the same size, and clumped into 1 size class. i. Get an age sample from a creel to verify, angler catch age structure. ii. People still buy the tag (for keeping a Rainbow Trout >50 cm), less because they expect a large trout and more to contribute funds for the fishery or fisheries management. This tag is important, as it gives survey data. Would have to go to a general survey without tag system. This data provides a time series of KLRT and angler and catch rates. Have found that guide and KLRT data are similar. 7. Incentives are needed to bring people back to the lake. Require an outreach to anglers to harvest more predators, as there are lots of Rainbow Trout and Bull Trout. a. People do not attend the public meetings, and are thus not getting the information. Lots of people are still throwing these fish back. b. Harvey put this out through the Fish & Wildlife Club. Can also put on society blog. c. Parasites on Rainbow Trout? Tape worm observed in creel caught fish. Certainly they are present; however, not as bad as in 2007 or This does also discourage people from harvesting. 8. Rob Bison presentation Examining Kootenay Lake Kokanee dynamics with a stock recruitment approach: a. Recruitment anomalies evident. These may be related to fertilization of the lake. b. Rainbow Trout are reacting to the prey abundance, with weight dropping with time. c. Bull Trout not as apparent; do they impart a stabilizing effect on the dynamics? d. Predator covariates - why use catch and not CPUE? i. If corrected for fish size, CPUE resembles catch for predator abundance. Considers tolerance of anglers to fish given the size of the fish they are catching. Takes size response out of CPUE trend. e. Question moving forward KLRT is currently the only metric for in-lake abundance. Are we collecting the correct data, how do we best use it? 18
25 Kootenay Lake Fisheries Advisory Team Workshop Summary, May 15/ f. Gerrard spawner abundance is not that low (Figure 16). Predator numbers seem only slightly lower than they were before, except their size and condition is much lower (Figure 17). Figure 16. Gerrard spawner abundance Figure 17. Cycles in Gerrard spawner mean fork length (left) and fecundity (right). 9. When fertilization began Kokanee increased, then predators increased. This is typical in large lakes. The predators soak up the Kokanee dynamics in growth, but not in terms of number. 10. Predator numbers/ consumptive potential waiting to soak up stocked fish. Would it have been better to get predators down by not supplementing Kokanee? Lake Pend Oreille did both - egg plant and reduce predators. Some discussion about what worked both or just predator reduction? 11. Not just the number of anglers - it s also exposure, lower effort is getting older age classes. Catch rates are good, but still so low at <1 Rainbow Trout per day. Available age data has been partitioned. Catch consists of some 3 year olds, mostly 4 year olds, and fewer older years. No one is limiting out at 5 per day. However, back in 2000 s, when fishing was good, people didn t harvest 5 large trout per year (the annual limit); limits did not reduce harvest because rates were so low. 12. There is an age shift in size distributions. An independent monitoring program using mark recapture should be undertaken to look at size at age. 13. The Kurota model projections suggested a need to harvest Gerrards even harvest older and bigger ones. Also applies to Bull Trout. Seems Rainbow Trout respond fast. As soon as Kokanee come back the Rainbow Trout are expected to return. 19
26 Kootenay Lake Fisheries Advisory Team Workshop Summary, May 15/ Evidence of predator prey cycling dynamics evidenced at other lakes, for example: At Shushwap Lake the Rainbow Trout starve every 4 years; they double their fecundity in bursts. At Arrow and Quesnel lakes, the Rainbow Trout have a cycle of being in low numbers and small, and then as soon as the Kokanee came back, the Rainbow Trout come back. 15. Suggestion to put more emphasis on Bull Trout for reducing predation, as they are more plastic than Gerrards. 16. Bull Trout are consuming lots of Kokanee, even when there are not that many available: a. Bull Trout have an advantage over Rainbow Trout to find Kokanee, because they are a better predator at low light. b. Typically catch Bull Trout deep (+200 ft depth distribution). Bull Trout come to surface during the spring, where there are mysids and Kokanee. 17. Is fertilization a lever? Nutrients were deliberately reduced from 1997 through 2000 and zooplankton biomass decreased. Zooplankton biomass needs to be maintained to support Kokanee for recovery. a. While fertilizing, productivity of zooplankton varies (Daphnia). There is currently higher than long term average zooplankton biomass and productivity, since it is not getting grazed down. 18. Piscivore monitoring of diet composition, measured as % composition by mass, revealed the following (Figure 18): a. In 2015 to 2017, Kokanee made up a higher proportion of the Bull Trout diet (68%), than the Rainbow Trout diet (22%). Insects were the highest proportion of the Rainbow Trout diet (36%). b. There were seasonal shifts in diet, with Bull Trout consuming more Kokanee in the spring (90%) than fall (65%). The fall Bull Trout diet was supplemented by Mysis. Rainbow Trout diet was more diverse, or opportunistic; in the spring it was mostly insects (40%), followed by Mysis (26%), and Kokanee (28%). In the fall, the Rainbow Trout diet shifted to Mysis (35%), Kokanee (27%), and zooplankton (18%). c. Rainbow Trout diet under conditions of low Kokanee abundance was different than under higher Kokanee abundance (measured historically). Specifically, there is a current shift to Mysis and zooplankton to offset low Kokanee availability (Figure 11). This outcome has implications for Kokanee recovery, namely, that even at unchanged future predator density, Rainbow Trout consumption of Kokanee will likely increase concurrent with Kokanee abundance increases. 19. The Kurota model results hinted at an advantage for small rainbow survival over Kokanee after 2005 in the lake, perhaps due to new South Arm nutrient additions as the timing is the same (and we suspect other hypotheses are less likely no evidence of angling regulation changing catch or harvest, limited evidence of Rainbow Trout fry surviving, some Lardeau evidence of one very strong parr cohort). However, it is not clear what advantage 1 3 year old Rainbow Trout would have over Kokanee. 20
 diet composition - % composition by mass")
27 Kootenay Lake Fisheries Advisory Team Workshop Summary, May 15/ Figure 18. Piscivore monitoring ( ) diet composition - % composition by mass 21
28 Kootenay Lake Fisheries Advisory Team Workshop Summary, May 15/ Areas requiring potential improvement/updates guided by key questions 5.1 Should we stock Kokanee fry or eggs? 1. Kokanee are surviving well from eyed eggs to emergent fry (40% in 2017). 2. However, age 0-1 survival is low at 5-7%. 3. Still waiting for results to show the success of fry stocking. 4. Raise fish to a larger sizes before planting? Is there an opportunity to increase capacity for the FFSBC? It would cost $10 million to build a new facility on Meadow Creek. Stocking Kokanee eggs versus fry - group decision Overall, eggs are surviving well coming out of the gravel (age 0-1 is the bottleneck). Therefore no need to change course right now, so continue to stock eggs as opposed to fry. 5.2 What Kokanee sources are suitable to stock, and where are they suitable to stock? Stocking background Matt provided background on stocking sources and genetic suitability to help inform this question: 1. Brood source options were initially screened for undesirable phenotypic expression that would make them clearly divergent from Meadow Creek, which included: a. Anadromy b. Shoal spawners c. Spawner age differences (i.e. 1+ or 5+ spawners etc.) d. Genetic analysis completed (some components after Action Plan developed) 2. Action Plan identified Whatshan, Kinbasket Reservoirs and Lussier River as sources and 2017 stocking departed from Action Plan recommendations (Table 4). 4. New genetic results suggested Hill Creek more appropriate than Koocanusa (Okanagan genetic component). 5. Kokanee egg stocking options and associated risks to genetic structure in Meadow Creek were presented as a decision making tool (Table 5). The order of risk is likely appropriate, no one can really identify risk level. Discussion around options included concerns over genetic risk, but also cost/benefit and risks associated with feeding predators 22

29 Kootenay Lake Fisheries Advisory Team Workshop Summary, May 15/ Table 4. Among-site Kokanee genetic differentiation between Kootenay Lake Meadow Creek, and all other site samples. Samples added this year indicated in italics. 23
30 Table 5. Kokanee egg stocking options and associated risks to genetic structure in Meadow Creek Risk to Genetic Structure in Meadow Creek Kootenay Lake Fisheries Advisory Team Workshop Summary, May 15/ Option Description Sources Forecast Egg Supply None 1 No Kokanee stocking Only natural production None Low 2 Use only sources that are not significantly different Whatshan, Kinbasket, 1,500, High 6 Incorporate statistically significant different sources, but limit relative proportion of those stocks to be a maximum of 49% (i.e. 51% from mostly pure Kootenay Lake strains) Incorporate statistically significant different sources, but limit relative proportion of those stocks to be a maximum of 49% (i.e. 51% from mostly pure Kootenay Lake strains) to Meadow Creek, remainder to Sout Arm Tribs Incorporate significantly different sources; no limit of relative proportion Incorporate anywhere you can get eggs efficiently (notable include Koocanusa Tribs) no limits on relative contribution (potentially above FFSBC capacity to collect) Above plus Hill Creek and Brood Lakes 3,000,000 Above plus Hill Creek and Brood Lakes 3 million for Meadow; additional 6 million for South Arm Same as above ~ 9 million Above plus Lussier, Norbury > 9 million 2018 Brood Collection fo KL - Order of Preference Suitability Collection Location Potential Egg Supply Most Suitable Whatshan/Kinbasket (Fairmont); same as MC 1,500,000 Bridge Lake (100% MC; F2 generation from ~150 F) 1,000,000 Deka Lake (85% MC and 15% Hill; F2 generation from ~150 F) 400,000 Hill Creek 6,000,000 Sulphurous Lake (100% Hill; F2 Generation from ~150 F) 250,000 Least Suitable Koocanusa (Lussier/Norbury/Bull) 1,500,000 10,650,000 Likely above FFSBC capacity to collect 24
31 Kootenay Lake Fisheries Advisory Team Workshop Summary, May 15/ Stocking discussion In support of no stocking or multistep approach: 1. Stocking could simply feed the predators, prolonging their survival and the predator problem. Diminishing gains. 2. The predators also appear to be putting more energy into fecundity, thus being more efficient with the limited food available. 3. Two-step process suggested: a) first get the predators down this summer, and see outcome of predator reduction, then b) place eggs. Probably will not remove Bull Trout in time for fall stocking. 4. Diet and consumption data suggests there is significant Kokanee consumption by Rainbow Trout. 5. How much can we reduce predation on subsequent age classes (age 1)? Lake Pend Oreille provides case history with three predators including non-native Lake Trout (as opposed to two at Kootenay Lake). A commercial fishery for Lake Trout on the spawning beds is what worked for them. All three predators were suppressed in the lake. Recovery didn t occur until they got rid of predators. All the Kootenay Lake predators spawn in streams, which should simplify suppression. In support of low stocking number approaches (using Whatshan and Fairmont brood): 1. Look at risk versus reward. Kootenay Lake has had good survival of egg-fry and spring fryfall fry, but after that survival is low (5-7% survival for age 0-1, and continued similarly low survival for age 1-2). Have not seen a difference overall since stocking began in There appears to be a low reward, thus perhaps we shouldn t take on high risk brood. Brood eggs from Cariboo (Deka Lake) have low survival of eggs, due to temperature. Right now, doubled number of interior brood lake spawners, but still do not have a lot of fish. Would feel more comfortable going to sources that are genetically more suitable for Meadow Creek. There are both genetic and environmental aspects to the decision. 2. Support to minimize the potential to dilute the local genetics. We know survival is low because of predators, and also maybe because of lost local adaptation. Was there introgression of alleles into the local population? 3. In 2017, 60% of eggs were from fish that came from outside Kootenay Lake, meaning the chance of diluting out local stock is significant. Should thus deal with mortality risk before putting non-native genetics into Meadow Creek. 4. Concern that taking eggs from non-desirable places will not lead to a long term, self-sustaining population of these individuals. 5. Considered low risk if using closely related Kokanee - if it is not successful, then the stocked fish will simply become fish food. 6. More likely to have Kokanee respond earlier with augmentation. 7. Stocking gives another option. Potential win-win, can shorten recovery if both egg stocking and predator control work concurrent. 8. Unquantified risk and irreversible genetic changes if high risk genetics methods are chosen. Risk reward are we willing to take on risk to be a year ahead? 9. Conserve the stock and conserve the genetics. 25
. 2. Introgression is naturally occurring.")
32 In support of higher risk genetic stocking approaches: Kootenay Lake Fisheries Advisory Team Workshop Summary, May 15/ A certain percentage of Kokanee are also coming from Koocanusa Reservoir (they return to Kootenai R. in Idaho and Montana to spawn). 2. Introgression is naturally occurring. Hasn t this already occurred with the last 3 years of work? 3. It is unknown if they will home back to spawning stream. 4. Considered an insurance measure. 5. Need to increase prey, because Parkinson study found with fewer prey, predators become more efficient Stocking options poll Hillary W. set up an online poll (using menti.com) for the three options, with the KLAT casting their votes from their phones or computers at the workshop. The outcome was split nearly equally amongst the options with 6 votes to not stock, 6 votes to stock only the best genetic sources, and 5 votes to stock as many eggs as possible (Figure 19). It is important to note that at least some votes for the option to stock only the best genetic sources (1.5 million) were cast with the intent that either that option or no stocking were acceptable options (i.e. if stocking is to occur it should only include the best genetic sources). In that light, the results from the poll can be interpreted as 35% choosing not to stock any, while another 35% of the KLAT felt some stocking was preferable or acceptable if limited to only the preferred sources. Combined, 70% were not in favour of stocking as many as possible from higher risk genetic sources. Figure 19. Poll results for stocking options 26


33 Kootenay Lake Fisheries Advisory Team Workshop Summary, May 15/ Would a more assertive piscivore reduction accelerate Kokanee recovery? Piscivore background Matt presented summary overheads for both Bull Trout (Figure 20) and Rainbow Trout (Figure 21). Information provided included current actions being implemented, additional removal options, and pros and cons for the options. Figure 20. Bull Trout management options. 27

34 Kootenay Lake Fisheries Advisory Team Workshop Summary, May 15/ Figure 21. Rainbow Trout management options. 28
35 Kootenay Lake Fisheries Advisory Team Workshop Summary, May 15/ How many Kokanee do Bull Trout and Rainbow Trout eat and what are the predicted impacts of these management actions? 1. Steve A. presented the results of two methods used to estimate biomass of Kokanee consumed, using diet data collected in spring and fall. Overall the results were similar with larger Bull Trout consuming over 10 kg of Kokanee annually and larger Rainbows up to 5 kg (Table 6). Table 6. Estimated annual consumption of Kootenay Lake Kokanee (kg of Kokanee consumed per predator), using two methods. The first (H. Ward, pers. comm.) assumes stomach contents represent 24-h of consumption and expands consumption data by predator size category. The second uses a temperature range to estimate min/max evacuation rate and consumption over 24 h with all predator sizes pooled 4. Predator % Kokanee in Average predator size Kokanee consumption (kg/year) species diet (kg; range) Method 1 Method 2 1 (0-2) Bull Trout (2-5) (5-7) (>7) Rainbow Trout (0-2) (2-5) (5-7) (>7) Hillary Ward s analysis revealed that based on estimated predator abundance and diet data (see Section 4), Kokanee consumption in was estimated to be ~56,000 kg/year by Rainbow Trout and 35,000 kg/year by Bull Trout (Figure 22). It was noted that values for prior years, outside of the diet study, were likely underestimates. 4 He and Wurtsbaugh (1993) Trans. Am. Fish. Soc. 122: ; Diana (1979) Can. J. Zoology 57:

36 Kootenay Lake Fisheries Advisory Team Workshop Summary, May 15/ Figure 22. Kokanee consumption estimates, based on predator/prey weight relationship, and % occurrence in diet data. 3. Diet data now does predation change when there is higher Kokanee abundance? Rainbow Trout are eating less than they used to. Thus, even at static Rainbow Trout abundance, increases in Kokanee populations from supplementation will be taken up to some degree by diet shifts back to consuming more Kokanee. Thus, there may be more benefit to remove predators than to stock eggs. 4. Steve provided a comparison of Kokanee consumption to elimination (mortality) estimates, which considered: fall biomass, elimination (tons lost between yearly estimates), predator biomass (all ages, tons), consumption (tons), consumption (both methods): a) Data shows that predator consumption is a major factor limiting Kokanee age 0-1 survival. b) Age 1-2 elimination estimates may be biased high (methodological limits) and consumption estimates low (if smaller prey are digested prior to sampling); if either of these is true the impact of predators is higher than estimated. c) Strengthens fact that lake needs management of predators to help Kokanee survival. 5. Consumption estimates show higher Kokanee consumption by estimated total Rainbow Trout population, but this is because there are more of them. 6. Suggestion to not remove Rainbow Trout. Numbers are going to go down sooner or later given the low amount of Kokanee as food. 7. Bull Trout have multiple age classes (stream rearing, lake sub-adults and adults, stream spawners), not going to hit all age classes unless there are both in-lake and stream reductions. 8. Once things turn around then do not need to stock Kokanee anymore, because in-lake survival is expected to increase. 9. Based on 2016 to 2017 KLRT creel and previous exploitation rate study, there are ~49,000 Rainbow Trout, and ~9,000 Bull Trout (Figure 15). a. Disagreement identified for Bull Trout numbers, but Rainbow Trout numbers seem accurate. 30
37 Kootenay Lake Fisheries Advisory Team Workshop Summary, May 15/ b. Rainbow Trout spawning population indicates a small run with small fish, which is worrisome. Why aren t the 4 and 5 year olds maturing? Is it because they cannot get past and put enough energy into the gonads? Are we impacting big spawners, as there are very few large fish? Suggest shifting fishery to the 45,000 Rainbow Trout cohort (<2 kg); proportion under 50 cm. 10. Some advice on targets: above Gerrard targets are correct; pulled levers with Rainbow Trout already with catch limits, do not think it would benefit to reduce Gerrard spawners further. Maintain the KLRT (maybe make it free). 11. Matt provided predator management options and associated stocking equivalencies (Figure 23), as well as Kokanee consumption reductions information (Figure 24). a. Harvest of 13,000 Rainbow Trout and Bull Trout is equivalent to 13 million eggs, and we ve been stocking 6 million. Incentive program for anglers would be beneficial. Lake Pend Oreille paid per fish head. Figure 23. Predator management options compared to stocking benefits (assumes 35% eyed egg to fall fry survival and assumptions in Figure 22; might be an underestimate). 31

38 Kootenay Lake Fisheries Advisory Team Workshop Summary, May 15/ Figure 24. Predator management options and associated Kokanee consumption reductions. Rainbow Trout spawner harvest 1. Total 250 spawners based on 2017 estimates, therefore, feasible to remove 50% or 125 spawners. This option was not discussed in any detail and did not have any apparent support. Bull Trout spawner harvest 1. Bull Trout are considered resilient, as long as the habitat is there. 2. If you open up the streams to general fishing, there are some risks (build permanent expectations when temporary reductions are the action, for one example). 3. There is room to reduce spawners without impacting recruitment. For example, there is a surplus of 2,159 Bull Trout spawners (Table 7). Table 7. Bull Trout spawners and potential surplus Kaslo and Keen All Kootenay Lake Tribs 2017 redds spawners 1049 Surplus (n) Surplus (%) 3421 Surplus (n) Surplus (%) Spawners required for 5 redd/km % % Spawners required for 7.5 redd/km % % Spawners required for 10 redd/km % % 4. Would not impact Bull Trout viability, if only adults were targeted after they have spawned. 5. Also, Bull Trout do not prey on Kokanee until age 3-4. Thus, there would be a reserve of future supply. 6. How much rearing capacity is in the stream? Relationship for the Kaslo River, might not transfer over to other tributaries; risk to applying Kaslo data more broadly. 32
39 Kootenay Lake Fisheries Advisory Team Workshop Summary, May 15/ Kaslo River and Keen Creek combined make up 30% of the spawning population. Hamill Creek contributes to another 20%+ of the spawning population. 8. Combined with Duncan, these three systems make up >70% of measured escapement. 9. Hamill might be too big for a kelt fence at the bottom end. Could still put anglers in that stream: a) Unrealistic to get a regulation change to allow anglers to catch Bull Trout on tributaries in short time frame. b) Could harvest with a scientific collection permit. This would allow for better data collection, and help ensure stock structure is not damaged by overharvest. But could be seen as favoritism (who gets the permits). 10. Bull Trout spawner removal target: a) Decide on a percentage, like 75% of fish. When conditions were good, they were spawning every year. b) Via a kelt fence, can tag other 25%. This will put a large number of marks in the lake, to help estimate the Bull Trout population. 11. Acoustic tags may be a monitoring option. Could selectively pass females so you have less impact on future populations. Already have a Bull Trout redd counting crew on the Kaslo River. 12. Consider hiring contract anglers, to harvest Bull Trout in Duncan River and other streams in a prescribed way. Do in-lake harvest to help, although not as efficient. In-lake predator control options 1. Free Gerrard surcharge stamps from Province. 2. Gill netting no sense of where the fish would be concentrated. Could put in front of spawning tributaries for a few weeks. Could attract fish into net using flashers and vibration. However, gill nets are not selective (kill kokanee too), and are thus not a good idea, as we cannot control the catch. Likely significant risk, cost and uncertainty around this method. 3. Changing fishing regulations can take a long time, to both implement and then reverse. Also, the changes do not show up for many anglers who don t check for in-season changes on-line, until the regulations are printed. Also, such an angler might not notice when a temporary change goes back to more restrictive regulations. 4. General fishery promotion to the public may only have ancillary benefits, not huge gains. 5. Lottery or bounty does not provide the same opportunity to gather information and control the outcome. However: a. Can request that people prove that they caught a fish, by returning heads. b. Could have a bunch of high reward tags. c. Could have a bounty, which is what they did on Lake Pend Oreille. d. Could have a lottery style reward system 6. Reward tag/lottery program as an incentive to harvest fish, as currently 75% of fish are being released. a) To encourage increased public fishing. b) Put enough tags that people would be interested to participate (to kill all fish captured, and reduce the release rate). c) If anglers do the work, it would result in a bigger impact than hiring guides. d) Strategy to recapture the tags? With lottery, every fish head could be an entry for a lottery. 33
40 Kootenay Lake Fisheries Advisory Team Workshop Summary, May 15/ There are some sensitive Bull Trout and Rainbow Trout in the area that are not in Kootenay Lake, and people could cheat. Want to ensure some level of control. Could thus subsample for genetics for Kootenay stock, or the winner s head could be genetically tested (to ensure it is from Kootenay Lake). $10,000 prize, or more. e) Could see people going fishing more if there were 10 prizes for $10,000 available. It is recognized that it would be a conflict of interest for provincial government employees). f) Can choose to target Bull Trout and or Rainbow Trout. Seems to be a bit more risk averse for Rainbow Trout than Bull Trout. g) Although increasing interest in the sport is a good thing, the potential liability of a bounty is high. Could set a maximum per person for the lottery (10 heads a person)? h) Potentially remove ~ 2000 Bull Trout all age classes (assume 25% effort increase and most Bull Trout harvested), and 5,600 Rainbow Trout all age classes. 7. Hire a contract angler to harvest fish is a low impact option already used: a) Pay $500 per day, or ~$80k for the 2.5 year program. b) Previous contractor, harvested with a collection permit for diet study etc. He caught ~800 fish over 3 years, and on average caught fish/d. c) Can also pay per head? d) This contractor can also tag fish, to help with monitoring. e) Can hire 2 or 3 contractors, depending on budget and target. f) Will Directed removal by guides is socially undesirable, if culled and thrown out. Would suggest fish to go to a soup kitchen. 8. Fishing derby is another option. Do we get information from the derbies? 9. Could hire someone to conduct creel checks at boat launch (e.g., on Saturdays). They would pay out $80 a head. Probably do not want public bringing fish to the office. This person can also be at the derbies. 10. Bull Trout total catch rates in 2016 ~3000/yr based on adjusted KLRT estimate, ~1500 released. 11. Consider asking guide to kill every fish when out with clients; maybe they need to be paid as well for this. 12. As per Quesnel Lake program, tag as many as you can catch. Then start to collect Rainbow Trout size, age, and maturity data. 13. Good to get both anglers and guides involved. There may be poor optics to giving guides all the opportunities. Yet, can lose control by giving to the recreational fishery. 14. Consider option to open Bull Trout fishery on Duncan River (1,500 to 2,000 fish). Would allow opportunity for the anglers. The local club would like that idea. 15. Be careful about devaluing what you value. Encourage fishing. Communication is key. 16. Overall, select in-lake fishing incentive options that are actually legal, since many of the above free-form brainstorm ideas are not legal (such as paying a licenced angler $ per head). How to best synchronize stocking Kokanee with predator management? Overall goal is to recover Kokanee as rapidly as possibly, and ensure long term sustainability of Rainbow Trout and Bull Trout. Do not want further erosion of Gerrards. A variety of options were presented: 34
41 Kootenay Lake Fisheries Advisory Team Workshop Summary, May 15/ Harvest Bull Trout since they currently have a healthy population. Need to determine to what degree Bull Trout can be reduced without impacting their long-term sustainability. 2. Start by not putting eggs in (so as to not feed the predators) and deal with predators first. Synchronization required, if resources are limited. a) If group suggests no stocking the funding could go towards something else (cost of 10 million eggs, or 500,000 fry = $240k). b) Start reducing predators in lake. c) Then plant eggs that are most genetically similar, d) Then in fall conduct predator removal (bottleneck is 0-1 yrs olds). e) Then monitor. 3. Both supress predators and plant eggs, since there are hints from data that focus on egg planting is not working. Feedback takes a long time, but there is a risk in having this issue continuing. Thus, it was suggested to be heavy handed for the shortest amount of time. a) Stock as many eggs as you can. b) Implement predator control of Bull Trout only at this time. The bar isn t even moving much based on predator management options (e.g., total Kokanee consumption change), thus hit predators as hard, for as short of a period as possible. Rationale for not targeting Rainbow Trout: There is a contingent of young Gerrards not available to the fishery (in river up to 3 years). Those populations are decent coming out of Lardeau River (40,000 1 yr old Gerrards). Would have to take a lot out of the lake from angling compared to Bull Trout. There is a disconnect with this and the low amount of spawners. Expecting a natural precipitous decline of Rainbow Trout, as there is currently a lot of standing crop from the previous years when populations of kokanee were healthy, but supply has declined recently. We know there are 250 Rainbow Trout and 3,500 Bull Trout spawners. There are currently liberal Rainbow Trout regulations now (5 fish/day under 50 cm) Predator control options poll Overall, there appeared to be consensus to reduce predators especially Bull Trout regardless of the method details. Online polls were set-up to evaluate the options for Bull Trout spawner removal, Bull Trout in-lake removal, and Rainbow Trout in-lake removal (Figure 24 - Figure 26). The following options were most highly favoured by the voters: Bull Trout spawners - removal at a kelt fence, and removal under a special collection permit/first Nations harvest. Note, 3 participants did not vote, it was not determined if this indicated that doing nothing was the option they favoured. Bull Trout in-lake removal - Angler reward (lottery head return), and fishery promotion (derby). Rainbow Trout in-lake removal both contract angling and fishery promotion were equally high. Note, 4 participants did not vote, it was not determined if this indicated that doing nothing was the option they favoured. 35

. Figure 26.")
. Figure 27.")
42 Kootenay Lake Fisheries Advisory Team Workshop Summary, May 15/ Figure 25. Bull Trout spawner removal options and poll outcome (15 participants voted). Figure 26. Bull Trout in-lake removal options and poll outcome (18 participants voted). Figure 27. Rainbow Trout in-lake removal options and poll outcome (14 participants voted). 36
43 Kootenay Lake Fisheries Advisory Team Workshop Summary, May 15/ There is partial funding for modelling support through Freshwater Fisheries Society. Is this required, and what direction should this take? Model discussion: 1. Brett provided an overview of the Kurota Model: a. Model is quite complicated. b. Does not have Bull Trout in it, but otherwise it fits all data available for Kootenay Lake. c. It can project scenarios forward in time, like adding eggs and removing predators. d. The model fits the time series and is a tool to help explore options. It allows for exploration of stability questions, and what policies to implement to avoid future collapse. e. Want to use this model to support decisions, but in current state is not easily useable. f. The group could apply for post doc support to work on the model and other issues. This would provide directed manpower from someone who is not in government. g. There is no current tool to trust. h. Can put a user friendly front end on the Kurota model, as it should be able to be used by more than just one person. 2. The modeller should be someone who is a long-term employee who will see it through into the future. The capacity should be available in house. 3. Although not an employee, Joe Thorley works locally in the Kootenays. 4. The bigger picture for the model is seen as: a place for structured thoughts, a tool that provides options for management decisions, and a tool that identifies what additional information is needed. We need to be able to correct or adapt the model so the predicted outcome comes closer to the observed outcome. We should be able to improve it over time. 5. The model should include Bull Trout. 6. The ability to incorporate field component outcomes into the model is also required (e.g., to understand outbreak of Gerrards). It is an ultra-complex model; it may be better to have a simple model. Brett s model example at the meeting might be almost what is required. 7. Obtain data on Lake Pend Oreille bio energetics, or other data to possibly help the model Model recommendation 1. There was general support for the development of a model. A subcommittee will be formed to decide how to best apply the money to this task. The committee will be Brett, Trevor, Hillary, Paul, Rob, Jeff and Matt. Inform Kristen/Eva if any of the nutrient restoration program data is used, and how it will be utilized in the model. 37
44 Kootenay Lake Fisheries Advisory Team Workshop Summary, May 15/ Do we continue with the nutrient program? Are any changes required? Nutrient program discussion The nutrient restoration program replaces nutrients lost behind upstream reservoirs. Nutrient additions commenced in the North Arm in Fertilization was initiated in the South Arm in 2004, and was fully implemented in The fertilization program objective is to replace nutrients lost from upstream impoundments to provide algal populations that support zooplankton as a food source for kokanee. 1. There was a period of really good fishing following South Arm fertilization, and an outburst of Rainbow Trout abundance over a period of years (indexed by escapement time series and KLRT, figures elsewhere in this summary). However, the fishing regulations changed at the same time. There might have been other things that lined up perfectly that were not measured, that resulted in the good supply of Kokanee and more Rainbow Trout. 2. Has fertilization been a destabilizing factor (e.g., for Kokanee/ Rainbow Trout cycles in time series change in age 1-3 Rainbow Trout survival)? 3. What are the trends evident in other interior lakes? Are there larger climatic influences at play? a. POST WORKSHOP INFO: Trends in other interior lakes are being evaluated, and in general most years during the mid-late 2000 s were above average to excellent for Kokanee productivity. There is some evidence pointing to larger climatic influences at play on Kokanee and lower trophic levels. 4. Since the implementation of the South Arm nutrient additions, Daphnia production increased in both the North and South arm in 2006 and 2007, decreased in 2008 in both arms, increased in both arms in 2009, was average in the South Arm and increased in the North Arm in 2010, was average in both arms in 2011, increased in the North Arm in 2012 (Figure 28). Production was high during 2013 to 2017 due to lack of kokanee grazing pressure. Figure 28. Zooplankton production - Daphnia 5. Since South Arm nutrient additions, age 0 to 1 kokanee survival ranged from 18% to 31% from 2004 to 2011, with the exception of 63% in Juvenile Rainbow Trout survival or 38
45 Kootenay Lake Fisheries Advisory Team Workshop Summary, May 15/ supply increased during this period, but it is not clearly linked to a period of excellent kokanee survival. However, Kokanee did go through a three year period of exceptionally high standing crop biomass from (also preceded by the highest spawner biomass on record in 2008). 6. Effect of nutrients on invertebrate production - Kootenay Lake does not have any significant diet component from benthic invertebrate production. Terrestrial insects are seen in the predator diet. This is during the period of lake entry, and also period of high mortality. However, nutrient restoration is not likely affecting terrestrial insects. Bigger climate patterns are more likely at play Nutrient program recommendation 1. No specific changes to the nutrient program were identified. 2. Future options to evaluate nutrient program impacts on Rainbow Trout dynamics was seen as useful. 3. Eva and Kristen may have some data that could benefit the modelling program. This perhaps, could inform future potential fertilization or other improvements. 5.6 What is the required monitoring program over the next 3 years to track response? The monitoring plan as presented in the 2016 Action Plan was reviewed in brief at the end of the meeting. The discussion focussed on the Enhanced Monitoring Plan, not the Routine Monitoring Plan. 1. Kokanee a. Use thermal marks to identify wild from hatchery fish (on spawners and in-lake fish). i. Also look at otoliths. b. Increased trawl surveys to capture juvenile Kokanee i. To get an adequate sample of the population. Since all are one age class, can reduce to 3 layers from 5. ii. Harder in spring, because the layer is spread out. Requires more effort. 2. Gerrard Rainbow Trout a. Juvenile abundance (S-R and annual production). HCTF and FWCP funded. b. There is a shift in size at each age due to reduced growth. An independent monitoring program, should be undertaken to look at size and age. c. Measure survival rate of Rainbow Trout by age now, versus past ( acoustics), to estimate current age 1-4 in lake survival. d. Conduct Rainbow Trout stock assessment. e. Genetic analysis of Rainbow Trout stock composition (fishery admixture) f. Diet should we continue collect fish from the lake and get samples or not? i. Derbies are one venue to get samples. ii. Do we want to know exploitation rates? What is important to measure? Are we happy with a snapshot in time? It was pretty stable. 39
46 Kootenay Lake Fisheries Advisory Team Workshop Summary, May 15/ iii. Might be good to have a signal, test if Rainbow Trout are refocussing on Kokanee following Bull Trout reductions. Could be used to indicate if predator reduction is working. Nice to have. iv. Is opportunistic with derby enough? Is it misleading to take a few samples? Right now not enough effort outside of derby. Best design is to control location (spread over the lake) and timing through contract angling. v. Regarding sample size, we already have a baseline. Just need a subsample of the population (e.g., fish). Do not need to analyze each fish. Maybe also do not need to do every year. Will be interesting when the Kokanee comes back. g. In lake age structure have data from guides, continue to do this. 3. Bull trout a. Redd counts (full lake survey required; frequency?) i. Eva has some funding for this year for some tributaries. ii. Same index streams? iii. Only measure of whether any success in temporarily reducing Bull Trout abundance. iv. Would do in 2019 to measure changes from the new actions. v. Should monitor all streams as much as possible, as it is most reliable data. vi. Unlikely to see a change, maybe not needed every year. vii. Some is funded already, more data is better. viii. Maximize data coming out of kelt fence ix. High priority on streams where reduction efforts occur, as well on controls. 4. Mysis a. Research on diel vertical migration (for both Kokanee and Mysis) suggested in the Action Plan for , required? i. Didn t do partly because it would be very intensive. Lot of work and time. ii. They migrate up through the water column at night. 20% of Rainbow Trout diet. iii. Has their behavior, numbers, or productivity changed? Biomass is the same. Could get that information (Kirsten). iv. Overall, nice to know, but not necessary. Some do not see it forming a management decision. b. Should there be further development on a Mysis removal project (pilot)? i. Jeff provided background information (Figure 29). 40
, Mysis biomass in Kootenay and Okanagan lakes (bottom; J. Burrows). The hope is to gain better conditions for Kokanee. Main Lake Mysis compete with Kokanee, a negative.")

47 Kootenay Lake Fisheries Advisory Team Workshop Summary, May 15/ Biomass (mg/m 2 ) Kootenay Okanagan Figure 29. Mysis and Kokanee (top slides), Mysis biomass in Kootenay and Okanagan lakes (bottom; J. Burrows). The hope is to gain better conditions for Kokanee. Main Lake Mysis compete with Kokanee, a negative. West Arm, isn t deep enough for mysids to avoid predation, a positive. Overall, need to remove 30% of Mysis biomass, to get to a tipping point for Kokanee. Ktunaxa is developing a feasibility report. Almost completed. ii. Mysis are cannibalistic. Do not want to upset an equilibrium that is stable. iii. Rationale for not removing Mysids: Mysids may not be a problem, as there is no evidence of a major impact on Kokanee. However: Based on removal efforts on Okanagan Lake, there is no evidence that removal will have an improvement. Concern that we would never get Mysid production down enough. Limited market; have been trying for 20 years. Hard to finding permittees to do it on Okanagan Lake. Predator removal should be the focus, do not want to pull too many levers at once. iv. Rationale for considering mysid removal: Additional Mysis abundance (in piscivore diet) has appeared. Since there is competition between Kokanee and Mysis, it would be a concern if the Mysis population has increased or become more productive. 41
48 Kootenay Lake Fisheries Advisory Team Workshop Summary, May 15/ Diet has changed mysids are supporting Rainbow Trout and Bull Trout; maybe the productivity would change if they were removed/reduced. Okanagan Lake only removed one third of the full amount recommended. Modelling guidance was to remove 30% of Mysis biomass not 10%. So it hasn t even been tested in Okanagan Lake, yet. Also, the business model is not the right approach. Mysids could be treat as invasive species. If you pay people to do this, then they would, versus relying on a weak and unreliable business. Maybe the Columbia Basin Trust (CBT) could provide funding. Do pilot studies astronomical cost, not much more to invest at this point. Half of nutrient investment goes into mysis. Predators are going to go after Kokanee first over mysids. Do we need the feasibility study in place if mysids increase? Is a feasibility study applicable to investment and resources to do pilots? v. Overall thought was to finish the existing feasibility study. This would be useful to help make an informed decision moving forward. 5. Fishery a. Creel census (KLRT mail-out and/or full lake) i. KLRT is currently the only metric for in-lake abundance. Are we collecting the correct data, how do we best use it? ii. Get an age sample from angler caught fish iii. A creel census is used to measure annual effort, catch, and harvest estimates. iv. Is it worth it now, or in the next few years to implement a full lake on the ground creel survey? Would be useful to hire someone to conduct a creel survey some days at boat launches. It would also be a promotion tool. This person could also attend the derby. From an education and public communication perspective, a creel survey would be very valuable. v. Overall thought was to proceed as above with both a KLRT mail out, and a creel census as described above. b. Exploitation rates i. We know this will be low. ii. Trying to drive change in exploitation rates through lottery; one way to measure success. iii. Al - If sufficient samples, it is important to gather data on size at age, age composition, mortality rates. This should be an integrated program, with control of the collection of samples, reach sample size both spatially and temporally (contract angling) Monitoring program recommendations Overall, there was consensus for a continued Enhanced Monitoring Program. Since many suggestions were not well fleshed out, and there was not time to address this in detail, recommendations and design review will be further evaluated. A decision to proceed will be made if resourced and a high priority. 42
49 Kootenay Lake Fisheries Advisory Team Workshop Summary, May 15/ Conclusions This section is a post workshop summary, and was prepared by Matt Neufeld Overall, the Kootenay Lake Fisheries Advisory Team remains very committed to understanding the processes and implementing actions to recover the Kootenay Lake Gerrard fishery. This meeting allowed members to review data and analysis completed since 2016, as well as review Action Plan actions and triggers. The objective of the meeting was to develop recommendations to Regional Management, on required changes to the Action Plan actions to increase the chance of short term Kokanee recovery. In general, no significant changes to actions or triggers were identified. However, predator management and Kokanee stocking actions were discussed in detail (two most significant recovery levers), and refined actions and/or advice provided. In relation to Kokanee stocking, the Action Plan identified stocking of 5 million eggs as the action, triggered by low kokanee abundance/survival. However, after meeting discussions, members were polled in relation to support of three levels of suggested stocking effort. In this poll, there was a lack of consensus support for action plan targets, with the majority (70%) supporting either no stocking or reduced stocking (1-2 million using best genetic sources). There were a number of reasons for support by the majority to stock fewer than 5 million eggs, including the risk of feeding predators, genetic risk to future kokanee populations (non-meadow genetic impacts), low cost benefit given current survival rates (don t know what survival rates will be one year after stocking), and others. The 2016 Action Plan, had identified predator conservation and management actions (to increase or reduce predator numbers), but because of the concern over low future predator abundance at the time, detail was only identified for conservation actions. However, Diet Data collected after Action Plan development identified significant Kokanee consumption by Bull Trout (70% of current diet), while Rainbow Trout diet was only comprised of ~20% kokanee. Analysis to reconstruct inlake population size over time, and then use diet data to index Kokanee consumption by both species, suggested that Rainbow Trout and Bull Trout are consuming almost equal amounts of Kokanee currently, when scaled to estimated abundance by species. Therefore, reducing either population would have benefits for Kokanee survival. However, the prevailing opinion of advisory team members was that there was risk to further Rainbow Trout reduction actions (beyond the current angling regulation changes in effect for daily quota), because although estimated in-lake abundance in reasonably high, spawner escapement for the entire Gerrard population is currently only ~200 adults. Additionally, recent low spawner abundance and juvenile supply may soon be apparent in the lake in the form of in-lake population reductions. Bull Trout on the other hand are less abundant in the lake (rear to age 2-4 in tributaries), however their spawning populations are currently very strong (~3500 in 2017) and geographically diverse. Stock recruit data collected on the Kaslo River (Andrusak ) suggests that given 2017 Bull Trout spawner return estimates on that system, that ~50% of the spawners were surplus to production needs, and therefore short term Bull Trout reductions likely come at little risk to future Bull Trout supply. As a result of this data, advisory team members had the consensus opinion that reductions in Bull Trout populations would benefit Kokanee recovery, and come at no significant risk to these populations in the short term. When members were polled with options for reductions, there was no consensus on the approach. 5 Andrusak, G.F Kootenay Lake Bull Trout Productivity and Capacity for Defining Management Reference Points-CAT # Prepared for the Habitat Conservation Trust Foundation and the Ministry of Forests, Lands and Natural Resource Operations, Victoria, BC. January pp+ 43
50 Kootenay Lake Fisheries Advisory Team Workshop Summary, May 15/ In general, the prevailing opinion of advisory team members was that reducing Bull Trout populations in the short term, in addition to some level of Kokanee stocking was the most likely approach to recover Kokanee populations quickly. It was clear that the opinion of many was that Kokanee stocking without predator reductions had a low chance of success given recent data, and potential risk of prolonging recovery (by feeding predators). The original Kootenay Lake Action Plan provided status and recovery tables outlining recovery tools, triggers/measures, rationale, benefits/risk, and priorities (Redfish Consulting Ltd 2016). In addition to that above, a summary of actions implemented since 2016 and recommendations from this workshop has been provided in updated recovery tables for Kokanee, Gerrard Rainbow Trout, and Bull Trout (Table 8 a-c). The original routine and enhanced monitoring table is also provided, with updates pending further internal management review and decision (Table 8 d). 44
51 Table 8. Kootenay Lake Action Plan Summary,
52 Table 8a. Kokanee Action Plan Summary, Objective Action Tools Trigger Measure Rationale 2016 Benefit/Risk Maintain main lake fishery closure for Kokanee No Supplementation Recreational Fishery Regulations Natural resiliency and recovery KO escapement < 140,000, age 0 to age 1 survival < 11%, KLRT > 2 kg RBT CPUE mod-high NA KO escapement >65-140K NA This action will ensure no mortality from angling occurs on the main lake Kokanee population during the recovery Allow ecosystem to recover naturally High benefit to increase probability of Kokanee recovery. Main lake Kokanee fishery is not considered to be highly valued Reduced cost, no genetic concern, prolong recovery, prolong recovery of fishery 2016 Rank High Implementation In , maintained Kokanee daily quota=0. Low Benefit/Risk/Comment 2018 Rank - - Stocking could simply feed the predators, prolonging their survival and the problem. Thus, follow multi-step process to reduce predators first, then stock. Moderate (35%) Recovery of Kokanee Supplementation - general Supplementatio n (option a) Egg plant and/or fry release - general Stock eggs from meadow genetic sources (1.5 million) KO escapement < 140,000, age 0 to age 1 survival < 11%, < 17.0 million fry, KLRT > 2 kg RBT CPUE mod-high KO escapement > K Reduce recovery time for low abundance KO cohorts (brood 2015 and 2016) Increase probability of survival of the Kokanee, with an estimated egg to fry survival of near 70%. FFSBC has a limited capacity to incubate eggs at their facilities. High > 5 million eyed eggs were stocked annually in Meadow Creek in 2016 and However, more than half of the eggs departed from the low risk genetic recommended sources Eyed eggs to emergent fry are surviving well (40% in 2017). Therefore continue to stock eggs. Past stocking results indicate the reward of stocking is low; thus, avoid risk of diluting genetics, to ensure long term self-sustaining KO population. High (70%) Moderate (35%) Supplementatio n (option b) Stock the greatest number of eggs, including from non- Meadow genetic sources (6 million) Plant as many eggs as possible as an insurance measure to increase KO population. Low (30%)
53 Table 8a. Kokanee Action Plan Summary, Objective Action Tools Trigger Measure Rationale 2016 Benefit/Risk Recovery of Kokanee MCSC hatchery to support supplementation Kootenay Lake Nutrient Restoration Program Mysis removal MCSC facility Continue to modify seasonal and weekly nutrient addition amounts and finetune timing of nutrient additions in spring and fall Test fishery to remove Mysis similar to Okanagan Lake Increase capacity beyond 5.0 million eggs, ability to use "green eggs" for out-planting and imprinting at MCSC Analysis of annual monitoring data; Stratification (spring) of lake, de-stratification (fall) of lake, temperature and light Increase in biomass and density 2 SD over long term average (168 ind/m 2 ) would be 463 ind/m 2 > 2.0 million eggs Variable annual phosphorus (25-47 tonnes) and nitrogen ( tonnes in North Arm and tonnes in the South Arm) KO escapement > K Increase FFSBC hatchery capacity > 5.0 million by incubating at MCSC Replace Nutrients Lost through the creation of upstream impoundments to Improve efficiency and biological uptake of nutrients for phytoplankton to zooplankton to ensure Kokanee food supply Remove >30% of the total Mysis biomass to reduce Kokanee competition and increase Kokanee survival Increased capacity egg incubation capacity of >5 million eggs available Take advantage of seasonal changes in climate to facilitate better growing conditions for phytoplankton Mysis of requires over 30% of the total biomass to be removed before a benefit to Kokanee can be realized. Substantial costs would be associated with the development of the Mysis suppression Rank Low High Low Implementation ~1 million eggs were incubated in 2017; FFSBC has also increased capacity to ~8 million through upgrades/staff and facility planning. Continued implementation of current program (late April through early to mid-september). A Mysis removal feasibility review is in development Benefit/Risk/Comment 2018 Rank Support to finish feasibility - Predator Management - see Gerrard and Bull trout tables Recreational Fishery Regulations KO escapement < 140,000, age 0 to age 1 survival < 11%, KLRT > 2 kg RBT CPUE high KO escapement > 140,000 Further removal of predators may provide additional benefits to the recovery of Kokanee through increased survival. Increase impact to predator population. May have limited improvement for Kokanee. Low In 2018, BT quota was increased to 2/day. In 2015, RBT daily harvest quota increased to 4 fish/day, and then 5 fish/day in Only 1 >50 cm for both species. Low survival (5%) for age 0-1, continued for age 1-2 KO. High
54 Table 8b. Gerrard Rainbow Trout Action Plan Summary, Objective Action Tools Triggers, Measure and Target Rationale 2016 Benefit/Risk Recovery of Gerrard Rainbow Trout Recovery of Gerrard Rainbow Trout Recovery of Gerrard Rainbow Trout Predator Mgmt for kokanee Recreational Angling Regulations Gerrard Rainbow Trout population Viability Hatchery Augmentation Spawner harvest Recreational fishery regulations to zero retention of Rainbow Trout > 50 cm Collect individuals for hatchery rearing Use hatchery augmentation to recover population Remove spawners from tributary streams. Gerrard escapement LRP < AUC Gerrard escapement LRP < AUC Gerrard escapement LRP < AUC KO: <140,000 spawners; age 0-1 survival <11%. Gerrard conservation: escapement < AUC in 2 consecutive years. Implement a precautionary approach that ensures conservation levels, reduce all mortality from fishery Secure future viability and persistence of Gerrard Rainbow Trout population by obtaining individuals from current population for hatchery rearing Facilitate recovery of population 166 spawners estimated in Potentially 66, or ~30%, could be removed and still meet conservation trigger. Reduce the recovery time of predators, reduce mortality when population is critically low Hatchery risk of relatively new stock. Genetic insurance policy if population decreases further Hatchery augmentation may have negative effects to remaining wild stock, reduced fitness and productivity. May increase predation on recovering Kokanee Rank High Implementation RBT daily harvest quota increased to 4 fish/day in 2015 and then 5 fish/d in 2018; only 1>50 cm Benefit/Risk/Comment 2018 Rank - - Mod Low Option not discussed in detail, as no apparent support. Low
55 Table 8b. Gerrard Rainbow Trout Action Plan Summary, Objective Action Tools Triggers, Measure and Target Rationale 2016 Benefit/Risk 2016 Rank Implementation 2018 Benefit/Risk/Comment 2018 Rank Predator Mgmt for kokanee Removal through contract angling - - Low impact option. Previously completed successfully. Contractor can also tag fish, to help with monitoring. On its own, does not adress the value of promoting fishing to the public. Costly per fish Moderate (42%) In-lake removal Removal through fishery promotion (derby) Removal through angler reward (lottery, bounty etc). KO: <140,000 KO spawners; age 0-1 survival <11%. Gerrard conservation: escapement spawners, and/or < AUC in 2 consecutive years. KO consumption by RBT in ~56,000 kg/yr. Goal is to reduce predator numbers in the lake. Currently 75% of fish are being released. General caution for all options since: few spawners, expecting natural decline, and catch regs are liberal May not have huge gains, but many anglers could result in a bigger impact than hiring guides. Reward/tag program identified as an incentive (e.g., 10 prizes for $10k ). Prizes require gaming licence Bounty/paying a licenced angler $ per head is not legal. With lottery, every fish head could be entry, with genetic testing to confirm from lake if needed. Could hire someone to collect heads at boat launch and conduct creel survey. Risk to small spawner population from added removal. Moderate (42%) Low (14%)
56 Table 8c. Bull Trout Action Plan Summary, Objective Action Tools Trigger, Measure or Target Rationale 2016 Benefit/Risk 2016 Rank Recovery of Bull Trout Mortality Reduction on Bull Trout Recreational fishery regulations to zero retention of Bull Trout > 50 cm LRP 50/500 Implement a precautionary approach that ensures conservation levels are being met by reducing all mortality from recreational fishery on Kootenay Lake. Reduce the recovery time of predators, reduce mortality when population is critically low Implementation 2018 Benefit/Risk/Comment 2018 Rank Moderate Bull trout mgmt for kokanee Spawner harvest in tributary streams Remove spawners using kelt fence. Remove spawners using angling regulation changes. Remove spawners using scientific collection permits/first Nations harvest. KO: <140,000 spawners; age 0-1 survival <11%. BT conservation: escapement <50 spawners in Kaslo R., <500 spawners in lake wide index. In 2017, 1049 spawners in Kaslo and Keen creeks, and 3421 spawners lake wide, thus surplus. BT are considered resilient, as long as habitat is available. Would not impact viability if only adults were targetted after spawning. BT do not prey on KO until age 3-4, so gives a few years of reprieve for KO. Need to determine target (75% of fish?) Can harvest target amount of fish and then tag remaining, to help with in-lake monitoring. Risk of building a permanent expectations, when temporary reductions are the action. Unrealistic to get a regulation change in short time frame. Alternative to angling regulation change. Would allow for better data collection, provide control to ensure no overharvest. Could be seen as favouritism. High (100%) High (67%) Moderate (53%)
57 Table 8c. Bull Trout Action Plan Summary, Objective Action Tools Trigger, Measure or Target Rationale 2016 Benefit/Risk 2016 Rank Implementation 2018 Benefit/Risk/Comment 2018 Rank Do nothing Low (0%) Angler reward (lottery - head return) Every fish head could be an entry, with genetic testing of the winner to confirm its from lake. Could hire someone to collect heads at boat launch and conduct creel survey. Entries and prizes require gaming licence. High (78%) Bull trout mgmt for kokanee In-lake removal Fishery promotion (derby) KO consumption by BT in KO: <140,000 spawners; age estimated to be ~ 35,000 survival <11%. BT kg/yr. Goal is to reduce conservation: escapement <50 predator numbers in the lake. Contract angling. spawners in Kaslo R. and <500 Currently 75% of fish are being spawners in lake wide index. released. Many anglers could result in a bigger impact than hiring guides. Reward/tag program identified as an incentive (e.g., 10 prizes for $10k). Low impact option. Previously completed successfully. Contractor can also tag fish, to aid in monitoring. On its own, does not address the value of promoting fishing to the public. Moderate (61%) Moderate (50%) Regulation daily quota increase) Angler reward (bounty, other). - - In 2015, recommended increase opposed by stakeholders. In 2018, the daily catch quota increased to 2 Bull Trout / day (only 1 >50 cm) 'Risk of building a permanent expectation, when temporary reductions are the action. Unrealistic to get a reg change in short time frame. Does not provide opportunity to gather as much information and control catch outcome. Paying a licenced angler $ per head is not legal. Moderate (44%) Low (16%)
58 Table 8d. Routine and enhanced monitoring Action Routine Monitoring (annual) Timing Measures Estimation of spawner abundance in Meadow Creek Fall Determine total run size & obtain biological data Estimation of spawner abundance in Duncan & Lardeau rivers Fall Estimate spawner abundance Kokanee KL Nutrient Program Calculate egg deposition for MC & L&D rivers Fall Estimation of total egg deposition Conduct counts on SA streams Fall Spawner counts on selected index streams Acoustic surveys Spring/Fall Annual estimates of in-lake Kokanee abundance Trawl surveys Fall estimates of size, growth and condition of juvenile Kokanee Fry enumeration at MCSC Spring Annual estimates of fry production Gerrard rainbow trout daily counts at Gerrard Spring Annual AUC estimate of number of spawners Gerrard Rainbow Trout Conduct annual KLRT survey Annual Catch and effort statistics Bull Trout Redd surveys on Kaslo River and lake-wide Fall Estimate spawner numbers, trend data Annual monitoring program of primary & secondary trophic levels and kokanee acoustics and trawl and spawner enumeration on the Duncan/Lardeau and South Arm tributaries Annual Water quality, phytoplankton taxonomy, primary production, zooplankton and mysid abundance, biomass, kokanee acoustic and trawl surveys and spawner surveys on Duncan/Lardeau and South Arm tributaries (listed above in the kokanee section) KL Fishery Main lake currently closed to Kokanee harvest Annual conserve as many potential Kokanee spawners as possible Annual regulations Annual Manage predator populations Action Enhanced Monitoring ( ) Timing Measures Release ~0.5 million fry in spring 2016 Spring Increased numbers of spawners in 2019 Estimate planted eyed egg survival rates Spring Determination of survival rate Increase # of flights for Lardeau counts to 3 per spawning season Fall Improved accuracy of spawner estimates Kokanee Predator Food Habits Rainbow Trout Bull Trout Mysis Increase trawl surveys to capture juvenile Kokanee Spring/Fall Increase sample size for growth and condition determinations Conduct bank counts on Lardeau River Fall Improved accuracy of spawner estimates Collect 5.0 million eggs Fall Produce 5.0 million eyed eggs for implanting into Meadow Creek Evaluate survival rate of egg plants Fall Egg-to-fry survival rate and estimation of fry numbers produced Track thermal marks in hatchery fry vs wild fry Fall % of fry with thermal marks Food habits of smaller predators Summer Determine extent of Kokanee predation Genetic analysis of rainbow trout stock composition Annual Identification of Gerrards vs non-gerrards Lardeau river snorkel survey of juvenile RB during low abundance Spring Determination of stock productivity at low abundance Redd surveys of Index streams Fall Estimate spawner numbers, trend data Kaslo River snorkel survey of juvenile BT Fall Determination of stock productivity at low abundance Monitor abundance and biomass of Mysis shrimp Summer Estimate of mysid abundance and biomass Mysis and Kokanee research on diel vertical migration and develop a Mysis suppression plan (feasibility etc). Summer Determine if migration has changed under low Kokanee abundance. Prepare suppression action plan if suppression triggered. KL Fishery Creel census/klrt questionnaire Annual Annual effort, catch and harvest estimates for Rainbow and Bull Trout
59 Kootenay Lake Fisheries Advisory Team Workshop Summary, May 15/ Appendix A. Kootenay Lake Fisheries Advisory Team meeting attendance. Name Title Affiliation May 15 May 16 Committee Harvey Andrusak President BC Wildlife Federation x x Steve Arndt Fisheries Biologist FLNRORD, Nelson x x Dr. Paul Askey Fisheries Scientist FFSBC, Penticton x x Robert Bison Holger Bohm Fisheries Stock Assessment Biologist Section Head, Fish and Wildlife FLNRORD, Kamloops x x FLNRORD, Cranbrook x x Jeff Burrows Senior Fish Biologist FLNRORD, Nelson x x Adrian Clarke Vice President of Science FFSBC, Victoria x x Dr. Trevor Davies Stock Assessment Specialist FLNRORD, Victoria x x David Johner Large Lake Technician FLNRORD, Victoria x x Alan Martin Director of Strategic Initiatives BC Wildlife Federation x x Matt Neufeld Fish Biologist FLNRORD, Nelson x x Kristen Peck Fish Restoration Biologist FLNRORD, Nelson x x Mike Ramsay FLNRORD, Williams Associate Director, Fisheries Lake x x Eva Schindler Section Head - Fish & Wildlife FLNRORD, Nelson Compensation Program x x Unit Head, Applied Dr. Brett van Poorten MoE, Vancouver Freshwater Ecology Research x x Dr. Hillary Ward Fisheries Stock Assessment Biologist FLNRORD, Penticton x x Dr. Will Warnock Tyler Weir Observer Michael Zimmer Senior Aquatic Biologist Large Lake Ecosystem Specialist Biologist Ktunaxa Nation Council, Cranbrook FLNRORD, Victoria x x Okanagan Nation Alliance Fisheries Department, Castlegar x x x 1 x 1 Tia Scott Administration FLNRORD, Nelson x x 1: Participated via conference call Affiliation: BC MoE BC Ministry of Environment FFSBC - Freshwater Fisheries Society of BC FLNRORD - BC Ministry of Forests, Lands, Natural Resource Operations, and Rural Development 46
60 Kootenay Lake Fisheries Advisory Team Workshop Summary, May 15/ Appendix B. Kootenay Lake advisory team presentation (prepared by Matt Neufeld, Tyler Weir, David Johner, Jeff Burrows, Eva Schindler, Hillary Ward, Kristen Peck, Steve Arndt and Robert Bison).

61 Contributions by: Matt Neufeld, Hillary Ward, Steve Arndt, Tyler Weir, Kristin Peck, Jeff Burrows, Rob Bison
62 Acknowledgments for funding Nutrient program funding (FWCP, KTOI, BC Hydro, MoE, FLNRORD) Action plan implementation and enhance monitoring (FFSBC, FLNRORD, FWCP, and HCTF) Acknowledgments for contributors too many to list truly a collaborative, multi-faceted effort to recovery Kootenay Lake. We thank all Advisory Team members, research technicians, FFSBC staff, FWCP nutrient program delivery team, external contractors delivering monitoring components..
63 Background/Biological Response Update Review Actions, Triggers, and Implementation update from (what did we do?) Provide some analysis/ideas to help inform discussions around Key Questions.
64 Kokanee Spawners Kootenay Kokanee Escapement Spawner Trends Total Kokanee Escapement North Arm Kootenay Lake ,500,000 2,000,000 Lardeau kokanee spawner returns Meadow Creek Total Escapement 1,500,000 1,000, ,000 40,626 17,961 12,074 - Slide from Basset
65 Abundance (millions) Abundance (millions) Kootenay Kokanee In-Lake Abundance Age 0 pop Figure 5. Acoustic abundance trends for age 0 and age 1-3+ kokanee from fall surveys of Kootenay Lake data are preliminary Age Figure 6. Acoustic abundance trends for age 1-3+ kokanee from fall surveys of Kootenay Lake from 2012 to data are preliminary.
66 Biomass (kg/ha) Spawners In-Lake Figure 6. Kokanee biomass density estimates for Kootenay lake.
67 Mean Fork Length (mm) Age 0 Age 1 Age 2 Spawners Figure 1. Mean fork length of trawl caught age 0-2 kokanee from fall trawl sampling in Kootenay Lake, and mean spawner fork length from Meadow Creek spawning channel. Fork lengths from trawl captured fish are corrected to an October 1 st standard.
68 Mean Fork Length (deviations from mean) 2.5 Age 0 Age Figure 2. Trends in standardized mean lengths for age 0 and age 1 kokanee from fall trawling in Kootenay lake.
69 Fulton s K (Deviations from mean) Fulton's K Age 2 Age 1 Age Figure 3. Fulton s condition factor trends for fall trawl caught kokanee in Kootenay Lake during post fertilization years Age Figure 4. Trend in standardized condition (Fulton s K) for fall trawl caught age 1 kokanee in Kootenay Lake during post fertilization years.
70 Table 1. Spawner counts and number of predicted spawners based on acoustic targets >-37 db from year prior. Observed spawner number is meadow creek escapement + peak Lardeau count. Spawner year Observed spawners Predicted spawners pred/obs , , % ,764,100 1,962, % ,255,843 1,190,265 95% , ,626 49% , , % ,961 27, % ,626 40, % ,137 22, % k
71 Age 0 to 1 Survival Egg to fall fry survival Egg deposition (millions) 1.4 Egg to fall fry survival Spawner year - 70% 60% 50% 40% 30% 20% 10% 0% Age 1 Year
72 Declining Gerrard spawner size and abundance Spawner age relatively stable Juvenile supply also down; Future in-lake abundance impacts; need for RB reduction? Juvenile Estimates Andrusak, FLNRORD data on file Adult Escsapment Nelson FLNRORD data on file Future in-lake abundance reductions likely as a result of declining juvenile supply Unknown what the current in-lake (age 1-4) survival looks like Gerrard Spawner Bio Data Year Mean FL (cm) mean Wt (Kg) Mean Age Sample Size
73 Bull trout spawner abundance similar to 2013; large increase South arm tribs remain a small contributor Central and North tributaries strong (Hamill Creek and Kaslo River half of all spawners) FLNRORD Nelson data on file various sources
74 Effort Declines 40,000 to 15,000 angler days Recent outreach/daily quota increase = more harvest No strong evidence for daily quota changes affecting exploitation Fits with CPUE data: ~1 RB per rod day average Daily Quota = 4 Possession = 2 Daily Quota = 2 + barbless Daily Quota = 4 Daily Quota = 5 and outreach
75 Large size classes now gone general RB CPUE increase over time? Recent departure between CPUE and catch trends Catch now all small
76 general BT CPUE increase over time? Largest size classes now gone Recent departure between CPUE and catch trends Catch now all small
77 Objectives were to better inform recovery actions, included identifying; Genetic structure of mixed stock RB fishery (% Gerrard vrs. Insectivores in catch) age structure, current diet, maturation rate (% ripe) by ecotype, fecundity, and age at entry to lake. Fish samples collected by an angling guide, using standard large lake fishing methods Total of 580 angler days effort expended between Fall of 2015 and 2017 Total of 641 RB and 181 BT captured Subsequent analysis in-progress or complete
 A total of 921 fish across 25 distinct samples (18")


78 Key data to help interpret in-lake abundance trends (KLRT) A total of 921 fish across 25 distinct samples (18 reference site samples; 6 mixed stock fishery) Genetics methods successful differentiating fishery samples (2 distinct groups; Gerrards and other RB) ~99% assignment rate ~75% of catch are Gerrards; relatively stable between
, but high assignment error used")
79 Morphometric measures and diet, partitioned by genetic results, showed expected contrast (confirmed genetics) Kokanee represent a significant portion of diet only for piscivores Mysis and Zooplankton more important for insectivores Piscivores have larger mouth/head ratio; larger mouth to capitalize on kokanee Morphometric difference significant (large sample size), but high assignment error used as a tool to differentiate groups
80 Age structure data only, suggests expected in-lake age structure. No truncated age structure as a result of kokanee declines and historic large fish. Fecundities Significant decrease from historic samples, concurrent with fish size samples (Irvine 1978; Andrusak 2015) Piscivores

81 Seasonal shifts in diet apparent Kokanee - BT in spring: May 2018 (13 in one 2Kg fish, 92 in 11 fish) Insects for RB in spring, mysis/zooplankton in Fall Mysis consumption Kokanee most significant portion of BT diet; Insects most significant portion of RB diet
82 RB diet at low kokanee abundance different that historic sample at higher kokanee supply Current shift to mysis and zooplankton to offset kokanee in diet Implications for kokanee recovery: even at static predator density in the future, RB kokanee consumption will likely increase concurrent with KO abundance increases do we account for this in predictions; does this argue for predator reductions along with KO stocking?
83 Otolith Microchemistry (along with genetic assignment) used to identify Gerrard age at entry to Kootenay Lake Includes Gerrards and insectivores to allow validation of approach and provide contrast; do signatures differ between genetic groups? If fry, in excess to Lardeau River capacity do not contribute to Gerrards caught in the lake fishery, then S-R data suggests that high Gerrard abundance and kokanee collapse driven by a change to in-lake survival (between age 1+ and 3) Validation of age at lake entry via microchem (provide support for scale age estimates) Analysis in progress; Capture signal for all RB similar (all captured in Kootenay Lake); rearing signals differ. Gerrards group (one watershed of production) Insectivore group (many watersheds, many signatures) Still need to finish interpretation/ages
84 Water temperature, Secchi Water quality Phytoplankton, primary production Zooplankton Mysids Kokanee hydroacoustic (two surveys per year) and trawl (fall survey) Spawner escapement Duncan/Lardeau and South Arm tributaries 2017 Bull trout redd surveys (additional tributaries to Kaslo/Keen surveys (funded by HCTF)

85 Annual Phytoplankton Biomass Integrated 0-20m , Apr- Nov Rich ard Kirb y FWCP/KTOI Eco-Logic

86 Kootenay Lake Results Zooplankton FWCP/KTOI Limno-Lab
87 mg/m3 per day Zooplankton production - Daphnia 20 North Arm South Arm B_new 15 West Arm KTOI Limno-Lab
88 mg/m3 per day Zooplankton production - Daphnia North Arm South Arm West Arm B_new KTOI Limno-Lab


89 Kootenay Lake Results Mysids FWCP/KTOI Limno-Lab

 KTOI FLNRORD, Crystal Springs Consulting, Redfish Consulting,")
90 Year Crawford Boulder Goat Summit Midge** Photo credit: CCRFIC * * 0* 2386* 14* 158* Photo credit: CCRFIC * 0 59* 0 378* * entire tributary counted to barrier; other counts are index locations ** Midge is genetically different from other tributaries (MC stock) KTOI FLNRORD, Crystal Springs Consulting, Redfish Consulting, CCRIFC
91 Tonnes of P or Daphnia biomass (ug/l) Kokanee spawners (*1000) P from fertilizer Duncan R P Kootenai R P Average Daphnia biomass Kokanee spawners Year 0
92


93 Action stock 5 million eyed eggs in Meadow Creek Trigger - <140,000 spawners; age 0-1 <11% Stocking delivered in
94 2016 Identified genetic sources suitable (Action Plan) Whatshan, Kinbasket Reservoirs and Lussier River 2015 locations - Source Location Egg/Fry Number % Contr. Hill Creek 477,398 43% Koocanusa (Lussier and Norbury) 493,371 44% Interior Brood Lakes 142,237 13% Total 1,113, locations - Source Location Eyed Egg Number % Contr. Whatshan 603,164 9% Fairmont (Columbia) 1,569,888 23% Hill Creek 1,381,059 20% Koocanusa (Lussier, Norbury and Bull 1,203,857 18% Interior Brood Lakes 2,001,606 30% Total 6,759,574 50% 2017 locations - Source Location Eyed Egg Number % Contr. Whatshan 240,270 3% Fairmont (Columbia) 1,238,740 14% Hill Creek 6,496,339 75% Interior Brood Lakes 726,544 8% Total 8,701,893 83%
95 Eggs Eggs Fry 300,000, ,000,000 Total Egg Deposition (including stocking) Fall Fry Estiamte 35,000,000 30,000, ,000, ,000,000 25,000,000 20,000,000 15,000, ,000,000 10,000,000 25,000,000 Egg Stocking Wild Egg Deposition 50,000,000 5,000,000 20,000, Year Egg deposition crash (roughly tracks escapement) - Fry supply decreases, but not well outside historic lows (supply is OK?). - 15,000,000 10,000,000 Supplementation (egg stocking) significant contributor to overall egg supply (30-60% of all eggs) in the past two years 5,000, Year
96 Are stocking efforts meeting with success? What is success? Success survival similar to wild kokanee? Increase in overall kokanee survival? Eyed Egg to fry measured in Meadow Creek 60-90% survival; as good or better than wild survival to out-migrating fry In-Lake Stocked Cohort Survival 2015 cohort heat marks; too small to detect? (1 million combined fry/egg stocking) spawners in cohort Genetics required (6.8 million egg stocking), 2018 feasibility analysis cohort Heat marks, 2019 trawl first data available (8.7 million egg stocking) In-Lake kokanee 0-1 survival remains ~5%
97 Egg plant/fry stocking - sampling matrix stocking Metric type fall fall fall fall fall fall ee survival/abundance as age 1+ (trawl sample analysis) n=0 DNA TM ee survival/abundance as age 2+ spawner TM DNA TM ee survival/abundance as age 3+ spawner TM DNA TM ee survival to spawn (using cumulative age 2-4 spawner abundance) TM DNA fry Fall age 0 abundance n=2 n/a fry survival/abundance as age 1+ (trawl sample analysis) ns n=0 n/a fry survival/abundance as age 2+ spawner ns TM n/a fry survival/abundance as age 3+ spawner DNA TM n/a fry survival to spawn (using cumulative age 2-4 spawner abundance) DNA TM n/a Stocking Heat Brood year fry year Type Marked Number comment ee Y 477,000 TM Band - III_III ee N 6,800,000 ee Y (89%) 8,700,000 TM Band - IIII ee tbd fry N 92,541 All -> Crawford, DNA from spawners fry Y 635,000 TM Band - III_III (30,000 -> Crawford) fry N 80,000 All -> Crawford * Hatchery fry are closer in size to the smallest wild age 1 at time of stocking in spring DNA = no heat mark, would require DNA analysis (if a viable method) n/a = no TM, DNA not likely possible ns = not sampled
98 Count fall trawl sampling Potential hatch fry size range? unaged (no structures) heat marked (age 0-hatchery fry) no heat mark (scale aged 1) Fork Length (mm)
99 Action - upgrade of MC Hatchery to increase incubation capacity above 5 million Tigger none Complete - ~1 million eggs incubated in 2017; FFSBC capacity ~8 million through upgrades/staff and facility planning (maybe not sustainable into the future?) Meadow Creek poor/last option for incubation (no alarms, egg quality issues, cold water pushes plants late) Egg supply is more limiting that incubation space (only so many wild eggs available by source; collection/egg management also big time sink)
100 Kokanee Angling Closure Action maintain kokanee daily quota=0 Trigger - <140,000 spawners; age 0-1 <11% Implemented in 2015, continued Nutrient Restoration Program Action - Continue current implementation program (plus fall application?) Trigger none Program delivered fall program?...
101 Actions evaluate feasibility, mysis removal Trigger explore feasibility, removal if density/biomass > 463 ind/m2 (2 SD > mean). Feasibility study in development
102 Action Recreational Fishery Regulations Trigger - <140,000 spawners; age 0-1 <11% Implemented RBT daily quota increase (increased to 4/day in 2015 and then 5/d in 2018; still only 1>50cm) KLRT RB harvest rate increased ~14% between 2015 and 2017 (regulations and outreach combined) Effort declines resulted in a decrease in overall RB harvest (~9,000 to 4,000 in the same period)
103 Action Recreational Fishery Regulations Trigger - Trigger - <140,000 spawners; age 0-1 <11% Regional biologists recommended an increase to 2/d (only 1>50cm) in 2015, management decision not to proceed (stakeholder opposition) In 2018 daily catch quota increase met with approval, 2/d (only 1>50cm) implemented Too soon to index changes in release rate that would indicate success
104 Gerrards Action - reduce exploitation though regulations; Trigger< spawners; action not triggered Hatchery Supplementation Gene Banking Trigger - < spawners in two consecutive years; action not triggered Bull Trout Action - reduce exploitation though regulations; Trigger escapement < 50/500 spawners in Kaslo River and lake-wide index respectively; action not triggered

105
106 What kokanee sources are suitable to stock and where are they suitable to stock? Brood source options initially screened for undesirable phenotypic expression; clearly divergent from Meadow Creek Anadromy Shoal spawners Spawner age differences (i.e. 1+ or 5+ spawners etc.) Genetic analysis completed (some components after Action Plan developed) Action Plan identified Whatshan, Kinbasket Reservoirs and Lussier River as sources stocking departed from Action Plan recommendations; new genetic results suggested Hill Creek more appropriate than Koocanusa (Okanagan genetic component) Discussion required to: Confirm/modify Action Plan recommendations on brood sources Identify preferred options to combine stocking location and brood sources to manage risk
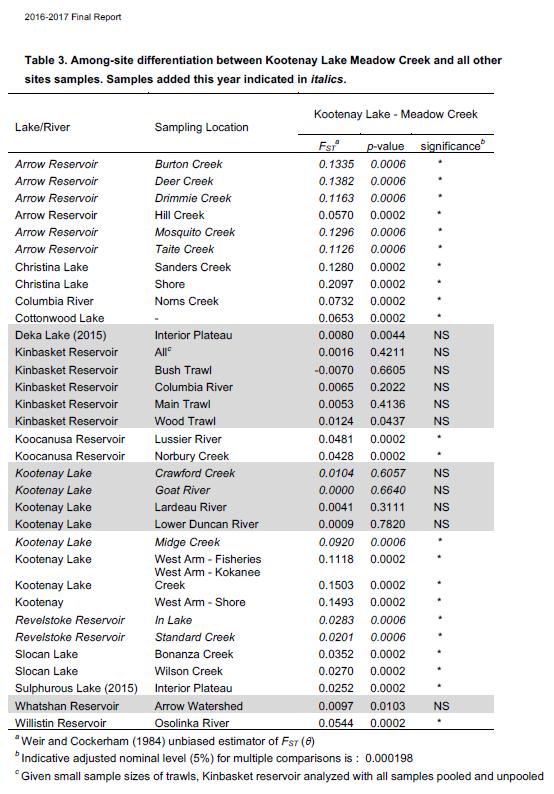
107
108 Risk to Genetic Structure in Meadow Creek Option Description Sources Forecast Egg Supply None 1 No Kokanee stocking Only natural production None Low 2 Use only sources that are not significantly different Whatshan, Kinbasket, 1,500, High 6 Incorporate statistically significant different sources, but limit relative proportion of those stocks to be a maximum of 49% (i.e. 51% from mostly pure Kootenay Lake strains) Incorporate statistically significant different sources, but limit relative proportion of those stocks to be a maximum of 49% (i.e. 51% from mostly pure Kootenay Lake strains) to Meadow Creek, remainder to Sout Arm Tribs Incorporate significantly different sources; no limit of relative proportion Incorporate anywhere you can get eggs efficiently (notable include Koocanusa Tribs) no limits on relative contribution (potentially above FFSBC capacity to collect) Above plus Hill Creek and Brood Lakes 3,000,000 Above plus Hill Creek and Brood Lakes 3 million for Meadow; additional 6 million for South Arm Same as above ~ 9 million Above plus Lussier, Norbury > 9 million 2018 Brood Collection fo KL - Order of Preference Suitability Collection Location Potential Egg Supply Most Suitable Whatshan/Kinbasket (Fairmont); same as MC 1,500,000 Bridge Lake (100% MC; F2 generation from ~150 F) 1,000,000 Deka Lake (85% MC and 15% Hill; F2 generation from ~150 F) 400,000 Hill Creek 6,000,000 Sulphurous Lake (100% Hill; F2 Generation from ~150 F) 250,000 Least Suitable Koocanusa (Lussier/Norbury/Bull) 1,500,000 10,650,000 Likely above FFSBC capacity to collect
109 Robs modeling and trend data..
110 Examining Kootenay Lake Kokanee Dynamics with a Stock Recruitment Approach Kootenay Lake Advisory Team Meeting May 15-16, 2018 Nelson, BC
111 Outline Kokanee Recruitment Anomalies Cycles Predator Covariates. Why catch? Kokanee Recruitment Predictions
112 Kokanee Stock Recruitment
113 Recruitment Anomalies
114 Cycles in Kokanee
115 Cycling in body weight is apparent in rainbow trout, but not so much in bull trout. Might bull trout impart some stabilizing effect under more normal conditions?
116 Cycles in Gerrard Rainbow
117 Cycles in Gerrard Rainbow
118 Predator Covariates, Why Catch and Not CPUE? Normally we would expect hyperstable CPUE in open access fisheries if the effort has the potential to be responsive to catch rates. But we also expect angler response to fish size to have an effect on CPUE.
119 Predator Covariates, Why Catch and Not CPUE? Effort response to CPUE does not appear strong If we correct for fish size, CPUE resembles Catch which is more consistent with Gerrard Abundance.
120 Gerrard spawner abundance is not that low
121 Predator numbers seem only slightly lower than they were before, except their condition is much lower.
122 Future Kokanee Recruitment Predictions
123 Kokanee Recruitment (thousands) Kokanee Recruitment (thousands) Predator Biomass Covariate Kokanee Recruitment Year Observed Rt (thousands) Predicted Rt (thousands) KLRT Catch of Pisc (all size classes, tonnes) 1 year after kokanee brood year t, r with kokanee recruitment residuals is Predator Abundance Covariate Observed Rt (thousands) Predicted Rt (thousands) Kokanee Recruitment Year KLRT Catch of Pisc (all size classes, in numbers) 1 year after kokanee brood year t, r with kokanee recruitment residuals is
124 Is predator number rather than biomass a better covariate? Biomass Number All anomalies included
125 Is predator number rather than biomass a better covariate? Biomass Number All anomalies included
126 Is predator number rather than biomass a better covariate? Biomass Number All anomalies included Recent outliers excluded
127 Recruitment Anomalies
128 End
129 Would a more assertive piscivore reduction accelerate kokanee recovery; Rainbow Trout Bull Trout If yes, what number and which method/size/age/stage? Slides to follow management action options (what feasible options available and what removal potential), kokanee consumption by predators (diet and predator trend data) combination of diet and potential removal to look at scale of benefit of management actions Benefit scaled to current kokanee mortality
130 Implemented BT daily quota increase in 2018 (increase to 2/d only 1>50cm) Additional Removal Options: Lake Angling Regulations (further daily quota increase) Potential Removal 800 all ages (~1,600 all sizes released based on KLRT and creel comparison; not all release based on daily quota) Cons time to implement, poor data on impact, low angler effort currently (<1/2 highs) and catch rate (1/2 BT/angler day on average) Pros may increase angler effort/satisfaction, low cost Tributary Angling Regulation Changes Potential Removal up to 50%+ (1,200 spawners) Cons - time to implement, poor data on impact, poor control of removal target Pros angler opportunities, low cost Kelt fence removal from high abundance tribs (including Duncan flip bucket) Potential Removal - up to all spawners (50% = 1,700, access to 1,200 or so; likely low impact to juvenile production) Cons - high $, only mature individuals (sub-adults not targeted) Pros - good control of removal target, good data on impact
131 Additional Removal Options: In-Lake Reward Program Potential Removal ~2,000 all age classes (assume 25% effort increase and most BT harvested) Cons mod-high $, poor optics around blue listed spp., likely requires angling regulation change for full effect Pros poor control over removal target, good data on impact, sub-adults also targeted In-Lake gill netting Removal Potential unknown Assumed low Cons high $, non-selective (likely high kokanee mortality), likely low catch rates Pros targets all age classes, good control of removal target, data on impact Controlled selective removal from tributaries (permitted recreation angling/fn selective harvest) Removal Potential - up to all spawners (likely 50% =~1,200 spawners) Cons moderate control over target (may not achieve), Pros Low $, good data on impact in retrospect

132 Kaslo and Keen All Kootenay Lake Tribs 2017 redds spawners 1049 Surplus (n) Surplus (%) 3421 Surplus (n) Surplus (%) Spawners required for 5 redd/km % % Spawners required for 7.5 redd/km % % Spawners required for 10 redd/km % % Figure from - Andrusak, G.F Draft Kootenay Lake Bull Trout Productivity and Capacity for Defining Management Reference Points-CAT # Prepared for the Habitat Conservation Trust Foundation and the Ministry of Forests, Lands and Natural Resource Operations, Nelson, BC. January pp+
133 Implemented RBT daily quota increase (increased to 4 and then 5/d; only 1>50cm) Additional Removal Options: Lake Angling Regulations (further daily quota increase) Potential Removal 800 all ages (~4,600 all sizes released based on KLRT and creel comparison; not all release based on daily quota) Cons time to implement, poor data on impact, low angler effort currently (<1/2 highs) and catch rate (1 RB/angler day on average) Pros may increase angler effort/satisfaction, low cost Spawner removal Potential Removal 125 spawners (50% removal feasible; # based on 2017 spawner estimates) Cons - high $, only mature individuals (sub-adults not targeted), already small spawner population, low impact, ~80% natural mortality Pros - good control of removal target, good data on impact In-Lake Reward Program Potential Removal ~5,600 all age classes (assume 25% effort increase and most RB harvested Cons mod-high $, estimates likely biased high; future conservation concerns with coming years abundance based on juvenile supply in 2014 and on as well as 250 spawners part of targeted cohort. Pros - poor control of removal target, good data on impact, sub-adults also targeted
134 How many kokanee do Bull Trout and Rainbow eat? What are the predicted impacts of these management actions?
 KLRT Catch Time Series 2010-2011 > 7kg < 2kg RB 2-5kg RB 5-7kg RB Sum RB RB Catch 19,249 8,793 4,487 1,375 33,904 Assumptions about vulnerability to angling at age: RB - 50% Age 3,")
135 Reconstructing Predator Abundance Numbers at Age in 2011 (Andrusak et al.) KLRT Catch Time Series > 7kg < 2kg RB 2-5kg RB 5-7kg RB Sum RB RB Catch 19,249 8,793 4,487 1,375 33,904 Assumptions about vulnerability to angling at age: RB - 50% Age 3, 100% Age 4+ Total Vulnerable Population = 93,568 BT - 50% Age 4, 100% Age 5+ Catch is an index of abundance C = qn
136 Reconstructing Predator Abundance KLRT Catch Abundance Year < 2kg 2-5kg 5-7kg RB RB RB > 7kg RB < 2kg RB 2-5kg RB 5-7kg RB > 7kg RB ,703 6,914 3,785 2,229 66,106 19,282 10,557 6, ,020 4,952 1, ,256 13,811 4,380 2, ,549 4,123 1, ,365 11,500 3,231 1, ,582 5,938 1, ,456 16,559 4, ,609 5,151 2, ,742 14,366 6,609 2, ,508 4,825 Catch 2,595 1,211 Abundance 40,461 13,456 7,236 3, ,092 3,944 1,844 1,005 30,934 10,999 5,142 2, ,401 4,688 2,106 1,171 N = C/q 48,529 13,074 5,874 3, ,856 5,406 1, ,954 15,077 4,982 1, ,122 4,778 1, ,752 13,324 3, ,913 7,530 2, ,379 21,000 6,454 1, ,249 8,793 4,487 1,375 53,684 24,523 12,512 3, ,631 8,867 5,207 2,193 51,958 24,729 14,521 6, ,714 8,586 4,915 1,871 54,979 23,946 13,707 5, ,059 8,200 4,470 1,379 83,830 22,867 12,467 3, ,086 3, ,895 9,170 1, ,316 1, ,871 3, ,482 1, ,967 3,
137 In-Lake Abundance Reconstructing Predator Abundance 160, ,000 Rainbow Bull Trout 120, ,000 80,000 60,000 40,000 20,
138 Prey Weight (g) Kokanee Consumption How many kokanee do Bull Trout and Rainbow eat? Two methods explored: 1) Predator/prey wt relationship, and % occurrence in diet data y = ln(x) Individual Consumption (kg per year) Size Bin % of Diet Fish <2kg 2-5 kg 5-7 kg >7 kg BT RB Predator Weight (g) Bull Trout Observed in diet data
 2 temperature assumptions (surface, Kinbasket Bull T. study) Pre-digested prey weight 3.")
 Caveats: - temperature assumptions - Spring and Fall sampling only - may underestimate consumption of smaller")
139 2) Temperature, evacuation rate method Photo by Karen Bray 1. Determine Kokanee FL pre-digested weight 2. Estimate rate of evacuation (He and Wurtsbaugh 1993) 2 temperature assumptions (surface, Kinbasket Bull T. study) Pre-digested prey weight 3. Estimate daily and annual KO consumption (Diana 1979) Min/max depending on assumed temperature Results: Annual consumption kg KO/kg Rainbow kg KO/kg Bull (sizes pooled; average of 5 sampled periods) Caveats: - temperature assumptions - Spring and Fall sampling only - may underestimate consumption of smaller prey (<10 g) especially at higher temperatures (detection reduced if <<24 hours to evacuate) Photo by Rob Fox
140 Kokanee Consumption Individual Consumption Size Bin % of Diet Fish <2kg 2-5 kg 5-7 kg >7 kg BT RB Based on evacuation rate, temperature, etc Size Bin Pred/prey and % diet occurrence <2kg 2-5 kg 5-7 kg >7 kg BT RB X Year Abundance < 2kg RB 2-5kg RB 5-7kg RB > 7kg RB ,106 19,282 10,557 6, ,256 13,811 4,380 2, ,365 11,500 3,231 1, ,456 16,559 4, ,742 14,366 6,609 2, ,461 13,456 7,236 3, ,934 10,999 5,142 2, ,529 13,074 5,874 3, ,954 15,077 4,982 1, ,752 13,324 3, ,379 21,000 6,454 1, ,684 24,523 12,512 3, ,958 24,729 14,521 6, ,979 23,946 13,707 5, ,830 22,867 12,467 3, ,895 9,170 1, ,871 3, ,967 3,
141 Kokanee Consumption (kg x10 3 per year) Kokanee Consumption 250 1) Predator/prey wt relationship, and % occurrence in diet data Likely Underestimate remember previous diet comparison Rainbow 200 Bull Trout 150 Current Diet Study Period
142 In-lake reward program - BT and RB RB In-lake reward program - remove 5,600 all ages RB Spawner Removal - Remove 125 spawners RB Angling Regulations - Remove 800 all ages BT In-lake reward program all ages BT Tribtuary Angling Regulations or Kelt Fence - Remove 50% (1,200 spawners) BT Lake Angling Regulations - Remove 800 all ages Predator Abundance Equiv. Number of Kokanee Stocked (Miillions, Eyed Eggs) Assumes 35% EE to Fall Fry Survival: might be an underestimate
143 In-lake reward program - BT and RB RB In-lake reward program - remove 5,600 all ages RB Spawner Removal - Remove 125 spawners RB Angling Regulations - Remove 800 all ages BT In-lake reward program all ages BT Tribtuary Angling Regulations or Kelt Fence - Remove 50% (1,200 spawners) BT Lake Angling Regulations - Remove 800 all ages Predator Abundance - 20,000 40,000 60,000 80, ,000 Consumption (kg of Kokanee Per Year)
144 Estimated Fall Biomass, Elimination (mortality) and Consumption for Kootenay Lake Kokanee Photo by Karen Bray Fall Biomass Kokanee Elimination (tons) Predator Biomass Consumption Consumption Year (tons) (all ages; tons) (tons; Diana method) (predator size method) Age 0 Age 1 Age 0-1 Age 1-2 Age 0-2 Rainbow Bull Rainbow Bull Total Rainbow Bull Total mean weight x number lost Results: 1. Consumption estimates can explain the age 0-1 elimination for 2015, but not Consumption is half or less of elimination if you include age 1-2 in elimination. Considerations: 1. Age 1-2 elimination is probably overestimated because it uses the mean weight between fall age 1 and fall age 2, and most are likely consumed prior to reaching the midway point. 2. Consumption estimates may be biased low due to underestimation of small prey, and no summer data (higher temperature = higher consumption?)
145 Full time series of consumption/biomass removed not yet completed (must scale diet to historic KO consumption/interpret KO biomass estimates). Useful? Confirm collapse mechanism (i.e. consumption on a scale that matches reductions during colapse) Eliminate some collapse hypotheses (i.e. pike minnow mortality, IHN, others?)
146 Do we require additional tools for evaluating egg supply and predator abundance levels required for recovery? There is partial funding for modelling support, is this required, and what direction should this take? Kurota Model Update and front end? PDA Bio Energetics? Others?
147 Would Mysis suppression per Aran Kay 2002 thesis accelerate recovery? Should we seek to implement?


148 Main Lake Mysis compete with kokanee Most Mysis evade predation through diurnal vertical migration A negative West Arm Entrained Mysis are a key food item for many fish Mysis may try to evade predation but lose A positive There has been no science paradigm shift. These are still relevant ecosystem interactions. Kootenay Lake Action Plan Suppress Mysis if triggered Develop a suppression plan B. Briscoe, JB - photos
 Biomass pelagic Mysis at large = 200 350 t (?")
149 Main Lake Mysis compete with kokanee Mysis 20% of both piscivore s diet ( < 5% prior to kokanee collapse) kokanee 20% of rb, 70% of bt diet Biomass kokanee at large = 42 t (2017), 62 t (2016) Biomass kokanee eaten = = 91 t (2016) Biomass pelagic Mysis at large = t (?) ( ) Biomass Mysis eaten 65 t not accounting for increased digestion/evacuation rate of Mysis compared to kokanee B. Briscoe
150 Biomass (mg/m 2 ) Biomass (mg/m 2 ) Kootenay Okanagan KL1 KL2 KL3 KL4 KL5 KL6 KL7 KL Year OK1 OK3 OK6


151 Rob Serrouya, Leo DeGroot
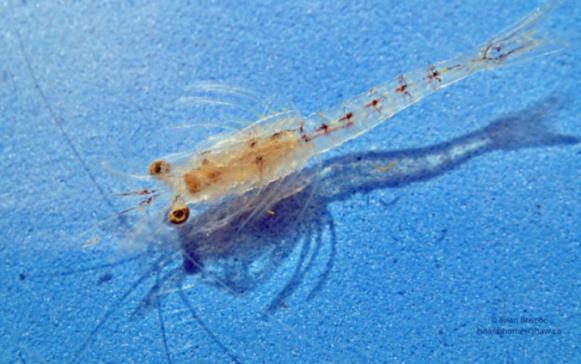
152
Kootenay Lake Update and Actions Matt Neufeld and Jeff Burrows Ministry of Forests, Lands and Natural Resource Operations - Nelson
 Kootenay Lake Update and Actions 2015 Matt Neufeld and Jeff Burrows Ministry of Forests, Lands and Natural Resource Operations - Nelson History Leading to 2015 Kokanee Gerrard Rainbow Kootenay Lake Fishery
Kootenay Lake Kokanee and other Fish 2017 Status
 Kootenay Lake Kokanee and other Fish 2017 Status Friends of Kootenay Lake 5th Annual Kootenay Lake Summit November 2017 Matt Neufeld and Jeff Burrows BC Fish and Wildlife Nelson Outline Kootenay Lake Fish
FWCP External Projects Delivered by Stakeholders and First Nations
 FWCP External Projects Delivered by Stakeholders and First Nations 2013-2014 For more information contact FWCP-Columbia program manager, Trevor Oussoren Trevor.oussoren@bchydro.com 250-365-4551 2013-2014
Dauphin Lake Fishery. Status of Walleye Stocks and Conservation Measures
 Dauphin Lake Fishery Status of Walleye Stocks and Conservation Measures Date: December, 21 Dauphin Lake Fishery Status of Walleye Stocks and Conservation Measures Background: Walleye stocks in Dauphin
Koocanusa Reservoir Kokanee Spawner Index
 Koocanusa Reservoir Kokanee Spawner Index - 2005 Authored by: Harald Manson Fisheries Biologist Updated by: Louise Porto MSc., RPBio. Fisheries Biologist Columbia Basin Fish & Wildlife Compensation Program
MINISTRY OF ENVIRONMENT ENVIRONMENTAL STEWARDSHIP DIVISION FISH AND WILDLIFE BRANCH. Horsefly River Angling Management Plan
 MINISTRY OF ENVIRONMENT ENVIRONMENTAL STEWARDSHIP DIVISION FISH AND WILDLIFE BRANCH Horsefly River Angling Management Plan January 30 th, 2006 Area/Fishery Description The Horsefly River watershed provides
Fish and Wildlife Compensation Program Trevor Oussoren, program manager, Columbia region. CRT Workshop, Fauquier, June 15, 2013
 Angus Glass Fish and Wildlife Compensation Program Trevor Oussoren, program manager, Columbia region. CRT Workshop, Fauquier, June 15, 2013 The Fish and Wildlife Compensation Program is a partnership of:
Grande Ronde Basin Spring Chinook Salmon Captive Broodstock Program: F 1 Generation
 Grande Ronde Basin Spring Chinook Salmon Captive Broodstock Program: F 1 Generation Tim Hoffnagle, Rich Carmichael, Joseph Feldhaus, Deb Eddy, Nick Albrecht and Sally Gee Oregon Department of Fish and
KOOCANUSA KOKANEE ENUMERATION (2003) Prepared by: W. T. Westover Fisheries Biologist
 Prepared by: W. T. Westover Fisheries Biologist") KOOCANUSA KOKANEE ENUMERATION (2003) Prepared by: W. T. Westover Fisheries Biologist Ministry of Water, Land and Air Protection 205 Industrial Road G, Cranbrook, B. C. V1C 7G5 December, 2003 INTRODUCTION
KOOCANUSA KOKANEE ENUMERATION (2003) Prepared by: W. T. Westover Fisheries Biologist Ministry of Water, Land and Air Protection 205 Industrial Road G, Cranbrook, B. C. V1C 7G5 December, 2003 INTRODUCTION
Agenda Item Summary BACKGROUND. Public Involvement ISSUE ANALYSIS. Attachment 1
 Agenda Item Summary Attachment BACKGROUND Between 996 and 03 white sturgeon fisheries in the Columbia River downstream from Bonneville Dam were managed under a series of management accords between the
NEVADA DEPARTMENT OF WILDLIFE STATEWIDE FISHERIES MANAGEMENT
 NEVADA DEPARTMENT OF WILDLIFE STATEWIDE FISHERIES MANAGEMENT FEDERAL AID JOB PROGRESS REPORTS F-20-48 2012 LAKE TAHOE WESTERN REGION Contents NEVADA DEPARTMENT OF WILDLIFE, FISHERIES DIVISION ANNUAL PROGRESS
The Fishery. Newfoundland Region Stock Status Report D2-05
 Fisheries Pêches and Oceans et Océans DFO Science Newfoundland Region Stock Status Report D2-05 ATLANTIC SALMON INSULAR NEWFOUNDLAND, SOUTHWEST COAST, SALMON FISHING AREAS 12-13 Background Salmon Fishing
THE CONFEDERATED TRIBES OF THE WARM SPRINGS RESERVATION OF OREGON
 THE CONFEDERATED TRIBES OF THE WARM SPRINGS RESERVATION OF OREGON To: Branch of Natural Resources P.0. Box C, Warm Springs, Oregon 97761 Phone (541) 553-2002/2003 Fax (541) 553-1994 The Independent Science
Fish Lake Informational Meeting. Dan Wilfond, Fisheries Specialist Deserae Hendrickson, Area Fisheries Supervisor MN DNR Fisheries - Duluth
 Fish Lake Informational Meeting Dan Wilfond, Fisheries Specialist Deserae Hendrickson, Area Fisheries Supervisor MN DNR Fisheries - Duluth Why are we here tonight? Provide background info on fish community
Staff, Organizations Directly Affected (including but not limited to):
:") 3-2-02.01 Steelhead Stream Classification Effective Date: December 13, 2005 This Policy Replaces: None. Staff, Organizations Directly Affected (including but not limited to): Ministry of Water, Land and
3-2-02.01 Steelhead Stream Classification Effective Date: December 13, 2005 This Policy Replaces: None. Staff, Organizations Directly Affected (including but not limited to): Ministry of Water, Land and
Rivers Inlet Salmon Initiative
 Rivers Inlet Salmon Initiative 5-YEAR BUSINESS PLAN C AS E F O R S U P P O R T M AR C H 2 0 1 5 Dedication Rick Hansen had been inspired to go to Rivers Inlet in July 2010 by his good friend, and fellow
NEVADA DEPARTMENT OF WILDLIFE STATEWIDE FISHERIES MANAGEMENT
 NEVADA DEPARTMENT OF WILDLIFE STATEWIDE FISHERIES MANAGEMENT FEDERAL AID JOB PROGRESS REPORTS F-20-49 2013 LAKE TAHOE WESTERN REGION NEVADA DEPARTMENT OF WILDLIFE, FISHERIES DIVISION ANNUAL PROGRESS REPORT
Kirt Hughes Washington Department of Fish and Wildlife Region 6 - Fish Program Manager
 Kirt Hughes Region 6 - Fish Program Manager Habitat Hatcheries Harvest Clean Water Act Shorelines Harvest Hydro Habitat Forest Practices Non-regulatory Programs Water Supply & Conservation Growth Management
NEVADA DEPARTMENT OF WILDLIFE STATEWIDE FISHERIES MANAGEMENT
 NEVADA DEPARTMENT OF WILDLIFE STATEWIDE FISHERIES MANAGEMENT FEDERAL AID JOB PROGRESS REPORTS F-20-52 2016 Lake Tahoe Rainbow Trout Study WESTERN REGION NEVADA DEPARTMENT OF WILDLIFE, FISHERIES DIVISION
Lakelse Sockeye Recovery Program
 Lakelse Sockeye Recovery Program The Ninth Annual BC Interior Stewardship Workshop May 7 th and 8 th, 2013 DFO North Coast Resource Restoration Unit Presentation Overview History/background Stock and habitat
Current projects for Fisheries Research Unit of Minnesota Department of Natural Resources
 Current projects for Fisheries Research Unit of Minnesota Department of Natural Resources MAJOR RESOURCE ISSUES IN THE DIVISION OF FISHERIES Status of Fish Populations To effectively manage fish populations,
Conservation Limits and Management Targets
 Conservation Limits and Management Targets Setting conservation limits The use of conservation limits (CLs) in England and Wales (E&W) has developed in line with the requirement of ICES and NASCO to set
APPENDIX 2.1 Lake Sturgeon - Mitigation and Enhancement
 APPENDIX 2.1 Lake Sturgeon - Mitigation and This page is intentionally left blank. Lake Sturgeon Mitigation and As a provincial crown corporation providing electric energy and natural gas service, Manitoba
Assessment Summary Report Gulf of Mexico Red Snapper SEDAR 7
 Assessment Summary Report Gulf of Mexico Red Snapper SEDAR 7 Stock Distribution: Red snapper are found throughout the Gulf of Mexico, the Caribbean Sea, and from the U.S. Atlantic Coast to northern South
Wild Steelhead Coalition Richard Burge Conservation VP September 11, 2006
 Wild Steelhead Coalition Richard Burge Conservation VP September 11, 2006 The following are talking points for the WDFW SEPA Scoping Meetings regarding the preparation of the State-wide and the Puget Sound
2015 Winnebago System Walleye Report
 215 Winnebago System Walleye Report Adam Nickel, Winnebago Gamefish Biologist, March 216 As winter passes in the rear view mirror, it won t be long until the spring rush of the 216 walleye run is here.
NEVADA DEPARTMENT OF WILDLIFE STATEWIDE FISHERIES MANAGEMENT
 NEVADA DEPARTMENT OF WILDLIFE STATEWIDE FISHERIES MANAGEMENT FEDERAL AID JOB PROGRESS REPORTS F-20-52 2016 LAKE TAHOE WESTERN REGION NEVADA DEPARTMENT OF WILDLIFE, FISHERIES DIVISION ANNUAL PROGRESS REPORT
Benchmark Statement Respecting the Fish, Fish Habitat and Fisheries of Fish and Little Fish Lake, within the Taseko River Watershed.
 Benchmark Statement Respecting the Fish, Fish Habitat and Fisheries of Fish and Little Fish Lake, within the Taseko River Watershed. Information Supporting the Environmental Assessment of the Prosperity
Spurdog (Squalus acanthias) in the Northeast Atlantic
 in the Northeast Atlantic") ICES Advice on fishing opportunities, catch, and effort Northeast Atlantic Published 11 October 2016 9.3.17 Spurdog (Squalus acanthias) in the Northeast Atlantic ICES stock advice ICES advises that when
ICES Advice on fishing opportunities, catch, and effort Northeast Atlantic Published 11 October 2016 9.3.17 Spurdog (Squalus acanthias) in the Northeast Atlantic ICES stock advice ICES advises that when
Status of Kokanee Populations in the Kootenai River in Idaho and Montana and South Arm Kootenay Lake, British Columbia
 Status of Kokanee Populations in the Kootenai River in Idaho and Montana and South Arm Kootenay Lake, British Columbia Report Prepared for: Kootenai Tribe of Idaho Report Prepared by: Randy Ericksen and
WFC 10 Wildlife Ecology & Conservation Nov. 29, Restoration Ecology: Rivers & Streams. Lisa Thompson. UC Cooperative Extension
 Restoration Ecology: Rivers and Streams WFC 10 29 Nov 2010 Restoration of ecosystems often involves creating new systems with only partial resemblance to the original ecosystems Lisa Thompson Fisheries
Ecology and control of invasive Northern Pike in the Columbia River, Canada
 Ecology and control of invasive Northern Pike in the Columbia River, Canada Brian Heise, Daniel Doutaz, Matthias Herborg, Matt Neufeld, David Derosa, Jeremy Baxter 19 th International Conference on Aquatic
Invasive Fish in the Cariboo Region. Russell Bobrowski Fisheries Biologist, BC Gov Cariboo Region Dec 19, 2017
 Invasive Fish in the Cariboo Region Russell Bobrowski Fisheries Biologist, BC Gov Cariboo Region Dec 19, 2017 Cariboo - Fishery Combination of productive lake and river fisheries 700 lakes with known game
STOCK STATUS OF SOUTHERN BLUEFIN TUNA
 7 th Expert Consultation on Indian Ocean Tunas, Victoria, Seychelles, 9-14 November, 1998 STOCK STATUS OF SOUTHERN BLUEFIN TUNA Tsuji, S. 1 Introduction The Commission for the Conservation of Southern
Big Canyon 67 miles upstream. 38 miles upstream
 TEXOMA STRIPED BASS MANAGEMENT/RESEARCH Texoma is one of only about 1 reservoirs in the country that has a naturally reproducing striped bass population. Texoma is set off further from most reservoirs
PRE-SEASON PLANNING FOR FRASER SALMON and STOCKS OF CONCERN. Forum on Conservation and Harvest Planning for Fraser Salmon January 22, 2010
 PRE-SEASON PLANNING FOR FRASER SALMON and STOCKS OF CONCERN Forum on Conservation and Harvest Planning for Fraser Salmon January 22, 2010 2 Outline South Coast Chinook Status Management Actions Recovery
OKANAGAN LAKE FISH MANAGEMENT PLAN SUMMARY
 lin,'roduction 1990-1995 OKANAGAN LAKE FISH MANAGEMENT PLAN SUMMARY B.C. Environment's Fisheries Branch looks after the province's freshwater fish. In Okanagan Lake, game fish inventories reveal an alarming
Winnebago System Walleye Report. Adam Nickel, Winnebago System Gamefish Biologist, August 2018
 2017-18 Winnebago System Walleye Report Adam Nickel, Winnebago System Gamefish Biologist, August 2018 The Winnebago System continues to boast a self-sustaining walleye population that serves as one of
Little Kern Golden Trout Status:
 Little Kern Golden Trout Status: The Little Kern Golden trout (LKGT) was proposed for federal listing as Threatened under the Endangered Species Act (ESA) on September 1, 1977 by the U. S. Fish and Wildlife
Know Your River Conwy Salmon & Sea Trout Catchment Summary
 Know Your River Conwy Salmon & Sea Trout Catchment Summary Introduction This report describes the status of the salmon and sea trout populations in the Conwy catchment. Bringing together data from rod
Chesapeake Bay Jurisdictions White Paper on Draft Addendum IV for the Striped Bass Fishery Management Plan
 Chesapeake Bay Jurisdictions White Paper on Draft Addendum IV for the Striped Bass Fishery Management Plan Maryland Department of Natural Resources, District of Columbia s Fisheries and Wildlife Division,
***Please Note*** April 3, Dear advisory committee members:
 April 3, 29 Dear advisory committee members: The fifth meeting of the CHF advisory committee will be held April 13 in Grants Pass from 6:-8:3 PM, and the purpose of this document is to help committee members
FISHERIES BLUE MOUNTAINS ADAPTATION PARTNERSHIP
 FISHERIES A warming climate, by itself, substantially affects the hydrology of watersheds in the Blue Mountains. Among the key hydrologic changes projected under all scenarios for the 2040s and beyond
Hatcheries: Role in Restoration and Enhancement of Salmon Populations
 Hatcheries: Role in Restoration and Enhancement of Salmon Populations Hatcheries play a large role in the management, ecology, and evolution of Pacific salmon. Why were/are they built? What are the assumptions
ASSESSMENT OF THE WEST COAST OF NEWFOUNDLAND (DIVISION 4R) HERRING STOCKS IN 2011
 HERRING STOCKS IN 2011") Canadian Science Advisory Secretariat Science Advisory Report 212/24 ASSESSMENT OF THE WEST COAST OF NEWFOUNDLAND (DIVISION 4R) HERRING STOCKS IN 211 Context Figure 1. Map of unit areas of NAFO Division
Canadian Science Advisory Secretariat Science Advisory Report 212/24 ASSESSMENT OF THE WEST COAST OF NEWFOUNDLAND (DIVISION 4R) HERRING STOCKS IN 211 Context Figure 1. Map of unit areas of NAFO Division
Proposed 2018 Fisheries Management Measures to Support Recovery of Interior Fraser River Steelhead
 Proposed 2018 Fisheries Management Measures to Support Recovery of Interior Fraser River Steelhead 22-March-2018 Spawning escapements of two Interior Fraser River steelhead stocks, Thompson and Chilcotin
NEVADA DEPARTMENT OF WILDLIFE STATEWIDE SPORT FISHERIES MANAGEMENT
 NEVADA DEPARTMENT OF WILDLIFE STATEWIDE SPORT FISHERIES MANAGEMENT FEDERAL AID JOB PROGRESS REPORT F-20-53 2017 RUBY MOUNTAIN & EAST HUMBOLDT HIGH MOUNTAIN LAKES NEVADA DEPARTMENT OF WILDLIFE, FISHERIES
Advice June 2012
 2.4.1 Advice June 212 ECOREGION STOCK Iceland and East Greenland Beaked redfish (Sebastes mentella) in Subareas V, XII, and XIV and NAFO Subareas 1+2 (Deep pelagic stock > 5 m) Advice for 213 The advice
Don Pedro Project Relicensing
 Don Pedro Project Relicensing M ODESTO I RRIGATION D ISTRICT TURLOCK I RRIGATION D ISTRICT FERC PROJECT N O. 2299 Resident Fish in Don Pedro Reservoir Don Pedro Reservoir Fish Stocking (1971-Present) CDFG
NATIVE FISH CONSERVATION PLAN FOR THE SPRING CHINOOK SALMON ROGUE SPECIES MANAGEMENT UNIT
 Attachment 4 NATIVE FISH CONSERVATION PLAN FOR THE SPRING CHINOOK SALMON ROGUE SPECIES MANAGEMENT UNIT Figures in Draft Plan of February 28, 27 Figure 1. Map of the Rogue River Basin. PASSAGE ESTIMATES
Introduction: JadEco, LLC PO BOX 445 Shannon, IL 61078
 Introduction: was contacted to collected data on the fishery for Lake Holiday. AC Electroshocking was conducted at 2 locations on September 28, 2015. Fish population data was collected for a total of 100
CHAPTER 10 TOTAL RECREATIONAL FISHING DAMAGES AND CONCLUSIONS
 CHAPTER 10 TOTAL RECREATIONAL FISHING DAMAGES AND CONCLUSIONS 10.1 INTRODUCTION This chapter provides the computation of the total value of recreational fishing service flow losses (damages) through time
BURBOT IN THE KOOTENAI RIVER, IDAHO: A STORY OF SUCCESS
 BURBOT IN THE KOOTENAI RIVER, IDAHO: A STORY OF SUCCESS T.J. Ross, Ryan Hardy, and Andy Dux, Idaho Department of Fish and Game Shawn Young, Nate Jensen, and Sue Ireland, Kootenai Tribe of Idaho OVERVIEW
2016 Fraser River Stock Assessment and Fishery Summary Chinook, Coho and Chum
 2016 Fraser River Stock Assessment and Fishery Summary Chinook, Coho and Chum 1 Background and Stock Assessment 2 Fraser River Chinook - Background Diverse group of populations exhibit a wide range of
ASMFC Stock Assessment Overview: Red Drum
 Purpose The purpose of this document is to improve the understanding and transparency of the Commission s stock assessment process and results. It is the first of several that will be developed throughout
Ad Hoc Review Group IP(06)12 FINAL. Implementation Plan. European Union (Denmark)
12 FINAL. Implementation Plan. European Union (Denmark)") Ad Hoc Review Group IP(06)12 FINAL Implementation Plan European Union (Denmark) 1. Introduction 1.1 The National management Plan for Salmon in Denmark In 2004 the Danish Forest and Nature Agency in co-operation
Ad Hoc Review Group IP(06)12 FINAL Implementation Plan European Union (Denmark) 1. Introduction 1.1 The National management Plan for Salmon in Denmark In 2004 the Danish Forest and Nature Agency in co-operation
ALASKA DEPARTMENT OF FISH AND GAME DIVISION OF COMMERCIAL FISHERIES NEWS RELEASE
 ALASKA DEPARTMENT OF FISH AND GAME DIVISION OF COMMERCIAL FISHERIES NEWS RELEASE Sam Cotten, Commissioner Scott Kelley, Director Contact: Cordova ADF&G Steve Moffitt, PWS Finfish Research Biologist 401
NEVADA DEPARTMENT OF WILDLIFE STATEWIDE FISHERIES MANAGEMENT
 NEVADA DEPARTMENT OF WILDLIFE STATEWIDE FISHERIES MANAGEMENT FEDERAL AID JOB PROGRESS REPORTS F-20-50 2014 BILK CREEK RESERVOIR WESTERN REGION 1 NEVADA DEPARTMENT OF WILDLIFE, FISHERIES DIVISION JOB PROGRESS
ATLANTIC SALMON NEWFOUNDLAND AND LABRADOR, SALMON FISHING AREAS 1-14B. The Fisheries. Newfoundland Region Stock Status Report D2-01
 Fisheries Pêches and Oceans et Océans DFO Science Newfoundland Region Stock Status Report D2-01 ATLANTIC SALMON NEWFOUNDLAND AND LABRADOR, SALMON FISHING AREAS 1-14B Background There are 15 Atlantic salmon
NEVADA DEPARTMENT OF WILDLIFE STATEWIDE FISHERIES MANAGEMENT
 NEVADA DEPARTMENT OF WILDLIFE STATEWIDE FISHERIES MANAGEMENT FEDERAL AID JOB PROGRESS REPORTS F-20-52 2016 REDBAND TROUT EASTERN REGION NEVADA DEPARTMENT OF WILDLIFE, FISHERIES DIVISION ANNUAL JOB PROGRESS
JadEco, LLC PO BOX 445 Shannon, IL 61078
 Introduction: With the assistance of Lake Holiday staff and volunteers, we were able to conduct an AC electrofishing survey on May 8, 27. Water temperatures were 2.3 C (8.5 F) and water clarity was decent
Justification for Rainbow Trout stocking reduction in Lake Taneycomo. Shane Bush Fisheries Management Biologist Missouri Department of Conservation
 Justification for Rainbow Trout stocking reduction in Lake Taneycomo Shane Bush Fisheries Management Biologist Missouri Department of Conservation December 14, 2017 Lake Taneycomo was formed by the construction
Hatchery Scientific Review Group Review and Recommendations
 Hatchery Scientific Review Group Review and Recommendations Walla Walla River Summer Steelhead Population and Related Hatchery Programs January 31, 2009 Note: Spawning reaches likely vary from those depicted.
Know Your River Conwy Salmon & Sea Trout Catchment Summary
 Know Your River Conwy Salmon & Sea Trout Catchment Summary Introduction This report describes the status of the salmon and sea trout populations in the Conwy catchment. Bringing together data from rod
RIVER CONONISH INVERTEBRATE SURVEY Dr Kjersti Birkeland
 RIVER CONONISH INVERTEBRATE SURVEY 26 Dr Kjersti Birkeland Background The Cononish, the upper reaches of the River Dochart, should be very important for spring salmon but surveys by the Tay District Salmon
ICES Advice on fishing opportunities, catch, and effort Celtic Seas and Greater North Sea ecoregions Published 30 June 2016
 ICES Advice on fishing opportunities, catch, and effort Celtic Seas and Greater North Sea ecoregions Published 30 June 2016 5.3.57 Sea bass (Dicentrarchus labrax) in divisions 4.b c, 7.a, and 7.d h (central
Fish Conservation and Management
 Fish Conservation and Management CONS 486 Managing biotic communities Gardening, poisoning, and shocking what would PETA think? Chapter 10 Ross Managing biotic communities Topics Organism additions Organism
Minnesota Department of Natural Resources Fisheries Division, Lake Superior Area
 Minnesota F-9-R(P)- Study 4 Job 616 Minnesota Department of Natural Resources Fisheries Division, Lake Superior Area Coaster Brook Trout Status in Minnesota-Lake Superior Tributaries Following Regulation
PROGRESS REPORT NEW HAMPSHIRE S MARINE FISHERIES INVESTIGATIONS MONITORING OF THE RAINBOW SMELT RESOURCE AND WINTER ICE FISHERY
 PROGRESS REPORT State: NEW HAMPSHIRE Grant: F-61-R-21/F16AF0163 Grant Title: NEW HAMPSHIRE S MARINE FISHERIES INVESTIGATIONS Project 2: MARINE RECREATIONAL FISHERIES MONITORING Job 1: MONITORING OF THE
Trout stocking the science
 Trout stocking the science Godfrey Williams Environment & Business Manager (Fisheries) September 2014 Background! 2003 National Trout & Grayling strategy! Native trout waters & Wild fishery protection
Hatchery Scientific Review Group Review and Recommendations
 Hatchery Scientific Review Group Review and Recommendations Lochsa River Spring Chinook Population and Related Hatchery Programs January 31, 2009 Lochsa River Spring Chinook Population Report Page - 1
STUDY PERFORMANCE REPORT
 SUDY PERFORMANCE REPOR State: Michigan Project No.: F-81-R-1 Study No.: 495 itle: Assessment of lake trout populations in Michigan waters of Lake Superior Period Covered: October 1, 1999 to September 3,
2016 Fraser River Chinook Key Information for Management. FN Forum March 8-10 Nanaimo, BC
 2016 Fraser River Chinook Key Information for Management FN Forum March 8-10 Nanaimo, BC 1 Outline Provide background information, management objectives and fisheries management approach for: Fraser Spring
HADDOCK ON THE SOUTHERN SCOTIAN SHELF AND IN THE BAY OF FUNDY (DIV. 4X/5Y)
") Canadian Science Advisory Secretariat Science Advisory Report 26/47 HADDOCK ON THE SOUTHERN SCOTIAN SHELF AND IN THE BAY OF FUNDY (DIV. 4X/5Y) Context Haddock (Melanogrammus aeglefinus) are found on both
Canadian Science Advisory Secretariat Science Advisory Report 26/47 HADDOCK ON THE SOUTHERN SCOTIAN SHELF AND IN THE BAY OF FUNDY (DIV. 4X/5Y) Context Haddock (Melanogrammus aeglefinus) are found on both
Okanagan Sockeye Reintroduction
 Okanagan Sockeye Reintroduction Backgrounder Elders accounts, and other forms of Traditional Ecological Knowledge (TEK) tell us that many species of salmon once came into the Okanagan Valley and tell us
9.4.5 Advice September Widely distributed and migratory stocks Herring in the Northeast Atlantic (Norwegian spring-spawning herring)
") 9.4.5 Advice September 212 ECOREGION STOCK Widely distributed and migratory stocks Herring in the Northeast Atlantic (Norwegian spring-spawning herring) Advice for 213 ICES advises on the basis of the
9.4.5 Advice September 212 ECOREGION STOCK Widely distributed and migratory stocks Herring in the Northeast Atlantic (Norwegian spring-spawning herring) Advice for 213 ICES advises on the basis of the
STUDY PERFORMANCE REPORT
 STUDY PERFORMANCE REPORT State: Michigan Project No.: F-81-R-1 Study No.: 436 Title: Vital Statistics of walleye in Saginaw Bay Period Covered: October 1, 1999 to September 30, 2000 Study Objective: To
Conditions affecting the 2011 and 2012 Fall Chinook Adult Returns to Spring Creek National Fish Hatchery.
 FISH PASSAGE CENTER 1827 NE 44 th Ave., Suite 240, Portland, OR 97213 Phone: (503) 230-4099 Fax: (503) 230-7559 http://www.fpc.org/ e-mail us at fpcstaff@fpc.org MEMORANDUM TO: Liz Hamilton, NSIA FROM:
Burbot Conservation Aquaculture: A Decade of Advancements in the. Kootenai Region
 Burbot Conservation Aquaculture: A Decade of Advancements in the Neil Ashton University of Idaho Kootenai Region Photo by Eric Engbretson Burbot: The Only Freshwater Cod Burbot (Lota lota) Common Ling
Yale Reservoir Kokanee (Oncorhynchus nerka) Escapement Report 2016
 Escapement Report 2016") Yale Reservoir Kokanee (Oncorhynchus nerka) Escapement Report 2016 North Fork Lewis River Hydroelectric Project Yale FERC No. 2071 Prepared by: Jeremiah Doyle, PacifiCorp April 4, 2017 1.0 INTRODUCTION
Yale Reservoir Kokanee (Oncorhynchus nerka) Escapement Report 2016 North Fork Lewis River Hydroelectric Project Yale FERC No. 2071 Prepared by: Jeremiah Doyle, PacifiCorp April 4, 2017 1.0 INTRODUCTION
Managing Chesapeake Bay s Land Use, Fish Habitat, and Fisheries: Studies. Jim Uphoff & Margaret McGinty, Fisheries Service
 Managing Chesapeake Bay s Land Use, Fish Habitat, and Fisheries: Positive Image and or Negative Graphic Case Studies Jim Uphoff & Margaret McGinty, Fisheries Service Maryland Fisheries Service has been
Hatchery Scientific Review Group Review and Recommendations
 Hatchery Scientific Review Group Review and Recommendations Willamette McKenzie Spring Chinook Salmon Population and Related Hatchery Programs January 31, 2009 Columbia River Hatchery Reform Project -
Kenai River Sockeye Escapement Goals. United Cook Inlet Drift Association
 Kenai River Sockeye Escapement Goals United Cook Inlet Drift Association 2014 Evaluating Sockeye Escapement Goals in the Kenai River Utilizing Brood Tables and Markov Tables This presentation pertains
Job Performance Report, Project F-73-R-9 Subproject II: SALMON AND STEELHEAD INVESTIGATIONS Study I: Salmon Spawning Ground Surveys
 FEDERAL AID IN FISH RESTORATION Job Performance Report, Project F-73-R-9 Subproject II: SALMON AND STEELHEAD INVESTIGATIONS Study I: Salmon Spawning Ground Surveys By Judy Hall-Griswold, Fishery Technician
The UK Experience with use of Triploids for Restocking
 The UK Experience with use of Triploids for Restocking Management of Brown Trout (Salmo trutta) Stocking in England and Wales Dr Brian Shields Senior Fisheries Scientist GENIMPACT 19 th to 21 st April
CALIFORNIA DEPARTMENT OF FISH AND WILDLIFE RECOMMENDATIONS ON ADDITIONAL WINTER-RUN PROTECTIONS IN 2016 OCEAN FISHERIES
 Agenda Item E.1 CDFW Supplemental Report April 216 CALIFORNIA DEPARTMENT OF FISH AND WILDLIFE RECOMMENDATIONS ON ADDITIONAL WINTER-RUN PROTECTIONS IN 216 OCEAN FISHERIES In April 215, CDFW recommended
During the mid-to-late 1980s
 The 2001 Yellow Perch Report by Rick Kubb During the mid-to-late 1980s the yellow perch popula tions in Lake Erie were among the highest on record. Limit catches by fishermen were extremely common during
Burbot Conservation Aquaculture at The Kootenai Tribe of Idaho s Hatchery 2 - Twin Rivers Hatchery
 Burbot Conservation Aquaculture at The Kootenai Tribe of Idaho s Hatchery 2 - Twin Rivers Hatchery KVRI Board Meeting 15October2018 Nathan Jensen njensen@kootenai.org 208-267-1689 Some General Burbot Biology
3.4.3 Advice June Barents Sea and Norwegian Sea Cod in Subareas I and II (Norwegian coastal waters cod)
") 3.4.3 Advice June 2013 ECOREGION STOCK Barents Sea and Norwegian Sea Cod in Subareas I and II (Norwegian coastal waters cod) Advice for 2014 ICES advises on the basis of the Norwegian rebuilding plan,
3.4.3 Advice June 2013 ECOREGION STOCK Barents Sea and Norwegian Sea Cod in Subareas I and II (Norwegian coastal waters cod) Advice for 2014 ICES advises on the basis of the Norwegian rebuilding plan,
REDFISH CONSULTING LIMITED Nelson, British Columbia May 2006
 ANALYSIS OF GERRARD RAINBOW TROUT SIZE, AGE, FECUNDITY AND GROWTH DATA by H. Andrusak and G. Andrusak REDFISH CONSULTING LIMITED Nelson, British Columbia May 2006 SUMMARY In late 2003 and most of 2004,
Plaice (Pleuronectes platessa) in Division 7.e (western English Channel)
 in Division 7.e (western English Channel)") Celtic Seas and Greater North Sea ecoregions Published 30 June 2016 Version 2: 15 May 2017 5.3.51 Plaice (Pleuronectes platessa) in Division 7.e (western English Channel) ICES stock advice ICES advises
Celtic Seas and Greater North Sea ecoregions Published 30 June 2016 Version 2: 15 May 2017 5.3.51 Plaice (Pleuronectes platessa) in Division 7.e (western English Channel) ICES stock advice ICES advises
ALASKA DEPARTMENT OF FISH AND GAME DIVISION OF COMMERCIAL FISHERIES NEWS RELEASE
 ALASKA DEPARTMENT OF FISH AND GAME DIVISION OF COMMERCIAL FISHERIES NEWS RELEASE Sam Cotten, Commissioner Scott Kelley, Director Contact: Cordova ADF&G Steve Moffitt, PWS Finfish Research Biologist 401
Salmon age and size at maturity: Patterns and processes
 Salmon age and size at maturity: Patterns and processes 1. Age Designation 2. Variation among populations 1. Latitude 2. Within regions 3. Within watersheds 3. Variation within populations 1. Smolt size
2014 Winnebago System Walleye Report
 1986 1988 199 1992 1994 1996 1998 2 22 24 26 28 21 212 214 Number of YOY WAE / Trawl 214 Winnebago System Walleye Report Adam Nickel, Winnebago Gamefish Biologist, 18 March 215 The spring rush of 215 will
Mountain Caribou Recovery Implementation Plan. Predator/Prey Component. Terms of Reference
 Mountain Caribou Recovery Implementation Plan Predator/Prey Component Terms of Reference These Terms of Reference (ToR) support the October 2007 BC Mountain Caribou Recovery Implementation Plan. They are
Rogue Winter Steelhead
 Rogue Winter Steelhead Existing Populations The Rogue Winter Steelhead SMU includes eight populations within the Klamath Mountains Province (KMP) in southwest Oregon (Table 93). None of the populations
Advice June, revised September Herring in Division IIIa and Subdivisions (Western Baltic spring spawners)
") 6.4.15 Advice June, revised September 21 ECOREGION STOCK North Sea and Baltic Herring in Division IIIa and Subdivisions 22 24 (Western Baltic spring spawners) Advice for 211 Management Objective (s) Catches
6.4.15 Advice June, revised September 21 ECOREGION STOCK North Sea and Baltic Herring in Division IIIa and Subdivisions 22 24 (Western Baltic spring spawners) Advice for 211 Management Objective (s) Catches
Advice June 2014
 5.3.23 Advice June 2014 ECOREGION STOCK Celtic Sea and West of Scotland Plaice in Division VIIa (Irish Sea) Advice for 2015 Based on ICES approach to data-limited stocks, ICES advises that catches should
Year Avg. TAC Can Others Totals
 SKATE IN DIVISIONS 3L, 3N, 3O AND SUBDIVISION 3Ps Background There are 8 to 1 species of skate in the waters around Newfoundland. Of these, thorny skate (Raja radiata) is by far the most common, comprising
Application of a New Method for Monitoring Lake Trout Abundance in Yukon: Summer Profundal Index Netting (SPIN)
") Application of a New Method for Monitoring Lake Trout Abundance in Yukon: Summer Profundal Index Netting (SPIN) Prepared by: Lars Jessup Nathan Millar November 2011 Application of a New Method for Monitoring
Application of a New Method for Monitoring Lake Trout Abundance in Yukon: Summer Profundal Index Netting (SPIN) Prepared by: Lars Jessup Nathan Millar November 2011 Application of a New Method for Monitoring