Coventry and Warwickshire Labour Market Summary
|
|
|
- Penelope Marshall
- 6 years ago
- Views:
Transcription


1 Coventry and Warwickshire Labour Market Summary April 2013
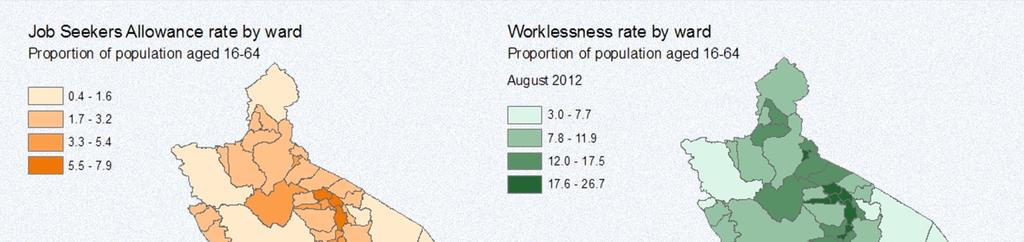
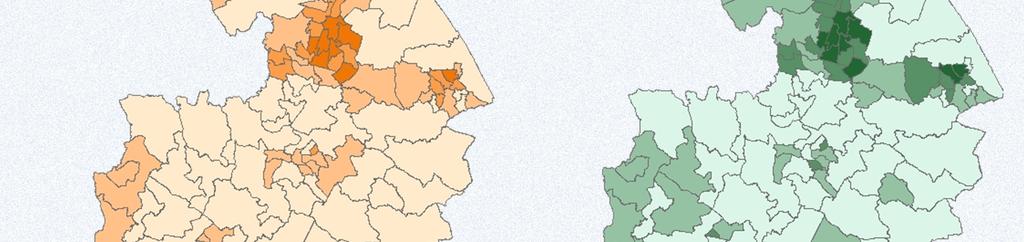
2 Introduction The Observatory has been commissioned to produce a quarterly labour market summary for the Coventry and Warwickshire sub-region. The briefing contains information on Job Seekers Allowance claimants, vacancies and worklessness data as well as the key messages emerging from the data. Figures relate to Coventry and Warwickshire combined unless stated otherwise. Please contact the Observatory using the links at the foot of this page if you have any queries. Key Messages In the last quarter the number of JSA claimants peaked at 18,150 in February before falling to 17,758 in March. This trend is repeated across all age groups of JSA claimants. The percentage of JSA claimants in Coventry and the Warwickshire districts/boroughs fell between March 20 and March Between August 2011 and August 20 the number of working age benefit claimants fell by 4%. Foleshill Ward has the highest rates for JSA and worklessness. Glossary JSA = Job Seekers Allowance ESA = Employment and Support Allowance Notified Vacancy = these have not been included as the final update of the Jobcentre Vacancy series on Nomis dataset was released in November 20. Out of Work Benefit = a range of benefits paid to those who are economically inactive, such as Incapacity Benefit Worklessness = people who are unemployed or economically inactive, and who are in receipt of working age benefits
3 Job Seekers Allowance JSA Claimant Trend Latest JSA Claimant Totals 20,000 Coventry Nuneaton & Bedworth Stratford-on-Avon North Warwickshire Rugby Warwick March 2013 % quarterly change % yearly change Coventry 9, North Warwickshire ,000 Nuneaton & Bedworth 3, ,000 Rugby 1, Number of JSA Claimants 14,000,000 10,000 8,000 6,000 Stratford-on-Avon Warwick 1, Latest JSA Claimant Rates Stratford-on-Avon Warwick 1.3% 1.8% 4,000 North Warwickshire Rugby 2.3% 2.3% 2,000 Nuneaton & Bedworth Coventry 3.8% 4.7% 0 Apr- May- Jun- Jul- Aug- Sep- Oct- Nov- Dec- Jan- 13 Feb- 13 Mar- 13 0% 1% 2% 3% 4% 5% Percentage of the working age population
4 Job Seekers Allowance JSA Claimants by Age JSA Claimants by Duration Percentage of economically active population in age group Number of claimants Under 3 months Between 3 and 6 months Between 6 months and 1 year More than 1 year 0 Mar-11 Jun-11 Sep-11 Dec-11 Mar- Jun- Sep- Dec- Mar-13 0 Mar-11 Jun-11 Sep-11 Dec-11 Mar- Jun- Sep- Dec- Mar-13
5 Out of work benefits ( worklessness ) Worklessness Trend (Aug 20) Worklessness Rates by Area (Aug 20) 90,000 80,000 JSA ESA & incapacity benefits Lone parent Other Claimants % of working age population Coventry 34, North Warwickshire 4, Claimants of out of work benefits 70,000 60,000 50,000 40,000 30,000 20,000 10,000 0 Feb- 10 May- 10 Aug- 10 Nov- 10 Feb- 11 May- 11 Aug- 11 Nov- 11 Feb- May- Aug- Nuneaton and Bedworth, Rugby 6, Stratford-on-Avon 5, Warwick 7, Benefit Claimants by Type and Area (Aug 20) Percentage of Claimants 100% 80% 60% 40% 20% 0% Coventry JSA ESA & incapacity benefits Lone parent Other North Warwickshire Nuneaton & Bedworth Rugby Stratford-on- Avon Warwick


6 Coventry and Warwickshire Labour Market Summary April 2013
7 Job Seekers Allowance rate by ward Coventry March 2013 Job Seekers Allowance rate by ward Warwickshire March 2013 Foleshill 7.9 St Michael s 7.2 Binley and Willenhall 6.8 Longford 6.2 Radford 6.0 Upper Stoke 5.9 Henley 5.8 Holbrook 4.7 Lower Stoke 4.4 Camp Hill 7.5 Abbey 7.1 Wem Brook 6.9 Brownsover South 5.6 Bede 5.4 Bar Pool 5.2 Newbold 5.1 Crown 4.8 Benn 4.7 Wyken 4.4 Kingswood 4.5
8 Worklessness rate by ward Coventry August 20 Proportion of resident population aged Foleshill 26.7 Binley and Willenhall 24.6 Longford 22.4 Henley 20.9 Radford 20.3 St Michael s 20.0 Upper Stoke 18.1 Holbrook 17.3 Lower Stoke 17.0 Wyken 15.9 Worklessness rate by ward Warwickshire August 20 Proportion of resident population aged Abbey 24.8 Wem Brook 24.7 Camp Hill 24.6 Bede 20.2 Newbold 19.8 Brownsover South 19.6 Bar Pool 19.5 Kingswood 18.5 Atherstone Central 18.3 Crown 17.5
Coventry & Warwickshire Labour Market Summary
 Coventry & Warwickshire Labour Market Summary July 2 Coventry & Warwickshire Labour Market Summary July 2 research@warwickshire.gov.uk Coventry & Warwickshire Labour Market Summary July 2 Introduction
Coventry and Warwickshire Labour Market Summary
 Coventry and Warwickshire Labour Market Summary October 2 Coventry and Warwickshire Labour Market Summary October 2 research@warwickshire.gov.uk Coventry and Warwickshire Labour Market Summary October
COMPARISON OF FIXED & VARIABLE RATES (25 YEARS) CHARTERED BANK ADMINISTERED INTEREST RATES - PRIME BUSINESS*
 CHARTERED BANK ADMINISTERED INTEREST RATES - PRIME BUSINESS*") COMPARISON OF FIXED & VARIABLE RATES (25 YEARS) Fixed Rates Variable Rates FIXED RATES OF THE PAST 25 YEARS AVERAGE RESIDENTIAL MORTGAGE LENDING RATE - 5 YEAR* (Per cent) Year Jan Feb Mar Apr May Jun Jul
COMPARISON OF FIXED & VARIABLE RATES (25 YEARS) Fixed Rates Variable Rates FIXED RATES OF THE PAST 25 YEARS AVERAGE RESIDENTIAL MORTGAGE LENDING RATE - 5 YEAR* (Per cent) Year Jan Feb Mar Apr May Jun Jul
Indices of Multiple Deprivation 2015
 Warwickshire Observatory Briefing Note: Indices of Multiple Deprivation 2015 Introduction The new English Indices of Deprivation 2015 (IMD 2015) have recently (30/09/15) been released by the Department
2018 HR & PAYROLL Deadlines
 th (by payment date) EPAF 3rd PARTY FEEDS WTE Approval 2018 HR & PAYROLL s Normal Payroll day s 2017 B1-26 3 * 13-Dec-17 15-Dec-17 n/a n/a n/a 28-Dec-17 29-Dec-17 11:00 AM 16-Dec-2017 29-Dec-2017 JAN 2018
Utility Debt Securitization Authority 2013 T/TE Billed Revenues Tracking Report
 Utility Debt Securitization Authority 2013 T/TE Billed Revenues Tracking Report Billing Budgeted Billed Dollar Percent Month Revenues Revenues Variance Variance Jan 2018 11,943,180.68 12,697,662.47 754,481.79
Wisconsin 511 Traveler Information Annual Usage Summary January 3, Wisconsin 511 Phone Usage ( )
") Wisconsin 511 Traveler Information 211 Annual Usage Summary January 3, 212 Overall to-date Summary 36 months of operation 1,16,63 total calls the 1 Million mark was passed on December 3, 212 3,627,527
Wisconsin 511 Traveler Information 211 Annual Usage Summary January 3, 212 Overall to-date Summary 36 months of operation 1,16,63 total calls the 1 Million mark was passed on December 3, 212 3,627,527
1 PEW RESEARCH CENTER
 1 SEPTEMBER 2018 POLITICAL SURVEY FINAL TOPLINE SEPTEMBER 18-24, 2018 N=1,754 QUESTIONS 1-2, 7-8, 11-13, 28 PREVIOUSLY RELEASED NO QUESTIONS 3-6, 9-10, 14-27, 29-32, 34-43, 47-49 QUESTION 33 HELD FOR FUTURE
2018 Annual Economic Forecast Dragas Center for Economic Analysis and Policy
 2018 Annual Economic Forecast Dragas Center for Economic Analysis and Policy PRESENTING SPONSOR EVENT PARTNERS 2 The forecasts and commentary do not constitute an official viewpoint of Old Dominion University,
GAZIFÈRE INC. Prime Rate Forecasting Process 2015 Rate Case
 Overview A consensus forecast is used to estimate the prime rate charged by commercial banks. As the prime rate is subject to competitive pressures faced by individual lenders and is set on an individual
MAR DASHBOARD MAR. Compliant % Breakdown Mar % Late % On-time MAR APR MAY JUN JUL AUG SEP OCT NOV DEC
 Positive Response Compliance 215 Compliant 215 Non-Compliant 216 Compliant 216 Non-Compliant 1% 87% 96% 86% 96% 88% 97% 89% 89% 88% 86% 92% 93% 94% 96% 94% 8% 6% 4% 2% 13% JAN 4% 14% FEB 4% 12% 3% 11%
Foreign overnights in the Nordic countries 2015
 Foreign overnights in the Nordic countries 2015 Sources: Statistics Statistics Statistics Statistics July 2016 VISIT FINLAND STATISTICS Contents Foreign overnights in the Nordic countries.4 Overnights
Bicycle Crashes. Number of Bike Crashes. Total Bike Crashes. are down 21% and severe bike crashes down 8% since 2013 (5 years).
.") Bicycle Crashes The City of Fort Collins is well known for its bike culture, and there is a strong focus on encouraging increased riding. Bike safety is an important component of supporting these efforts.
Bicycle Crashes The City of Fort Collins is well known for its bike culture, and there is a strong focus on encouraging increased riding. Bike safety is an important component of supporting these efforts.
Babson Capital/UNC Charlotte Economic Forecast. May 13, 2014
 Babson Capital/UNC Charlotte Economic Forecast May 13, 2014 Outline for Today Myths and Realities of this Recovery Positive Economic Signs Negative Economic Signs Outlook for 2014 The Employment Picture
Little Athletics NSW. 2018/2019 Season. Age Group Information Handbook / 1
 Little Athletics NSW Age Group Information Handbook 2018/2019 Season / 1 Little Athletics NSW 2018/19 Season Age Group Information Handbook Introduction From the commencement of the 2018/2019 competition
Producer Price Index - Agriculture (PPI-A) (January March 2001)
 (January March 2001)") Producer Price Index - Agriculture (PPI-A) (January March 2001) Introduction The Producer Price Index-Agriculture (PPI-A) gives a measure of the average change in the selling prices which producers receive
Producer Price Index - Agriculture (PPI-A) (January March 2001) Introduction The Producer Price Index-Agriculture (PPI-A) gives a measure of the average change in the selling prices which producers receive
FREEDOM OF INFORMATION REQUEST
 FREEDOM OF INFORMATION REQUEST REQUEST NUMBER: FOI Request 003905-16 REQUEST DETAILS: As part of my research I am requesting information on the numbers of 'strip searches' that have taken place within
JAN DASHBOARD. Positive Response Compliance JAN. Compliant Tickets : On-Time Performance Analysis. January % Late.
 Positive Response Compliance 216 Compliant 216 Non-Compliant 217 Compliant 217 Non-Compliant 1% 96% 97% 8% 6% 4% 2% 4% 3% FEB MAR APR MAY JUN JUL AUG SEP OCT NOV DEC 8% Late Compliant Tickets : On-Time
Short-Term Transit Ridership and Revenue Forecasting
 Short-Term Transit Ridership and Revenue Forecasting presented to The 5 th Transportation Research Board Conference on Innovations in Travel Modeling presented by Cambridge Systematics, Inc. Feng Liu,
DEC DASHBOARD. Positive Response Compliance DEC. Compliant Tickets : On-Time Performance Analysis. December % Late.
 Positive Response Compliance 215 Compliant 215 Non-Compliant 216 Compliant 216 Non-Compliant 1% 87% 96% 86% 96% 88% 97% 89% 97% 89% 98% 88% 97% 86% 96% 92% 97% 93% 97% 94% 97% 96% 97% 94% 97% 8% 6% 4%
NCC Cable System Order
 Order # 62508883 Flight s 03/13/18-04/01/18 Syscode 2107 Agency Canal Partners Media System Name Spectrum/DISH- I+ Tampa-St. Pete, FL Advertiser Levine For Governor Phone (301) 951-2620 Credit Update 03/13/18
KC Scout Kansas City s Bi-State Transportation Management Center
 KC Scout Kansas City s Bi-State Transportation Management Center Operations Report May 216 This report contains statistical and operational data of activities at the Scout TMC for the period Sunday, May
3. EXCEL FORMULAS & TABLES
 Fall 2017 CS130 - Excel Formulas & Tables 1 3. EXCEL FORMULAS & TABLES Fall 2017 Fall 2017 CS130 - Excel Formulas & Tables 2 Cell References Absolute reference - refer to cells by their fixed position.
State of American Trucking
 State of American Trucking October 11, 2018 Rod Suarez Economic Analyst American Trucking Associations rsuarez@trucking.org Business Cycles U.S. Expansions Duration October 1949 - July 1953 May 1954 -
Southwest Ohio Regional Economy in Context. Richard Stock, PhD. Business Research Group
 Southwest Ohio Regional Economy in Context Richard Stock, PhD. Business Research Group State of the Metro Area (in January Each Year) Total Employment has slowly increased in the last three years after
Bluetongue Disease (BT)
") Bluetongue Disease (BT) Analysis of ADNS data since 01/2018 Reporting period: 2018-01-01 2018-12-09 Data query: 2018-12-10 AGES DSR Austrian Agency for Health and Food Safety www.ages.at Parameters Data
Bluetongue Disease (BT) Analysis of ADNS data since 01/2018 Reporting period: 2018-01-01 2018-12-09 Data query: 2018-12-10 AGES DSR Austrian Agency for Health and Food Safety www.ages.at Parameters Data
NEVADA SLOT MACHINES: HISTORICAL HOLD PERCENTAGE VARIATIONS ANNUAL AND MONTHLY HOLD PERCENTAGES, CENTER FOR GAMING RESEARCH, NOVEMBER 2017
 NEVADA SLOT MACHINES: HISTORICAL HOLD PERCENTAGE VARIATIONS ANNUAL AND MONTHLY HOLD PERCENTAGES, 2004-2017 CENTER FOR GAMING RESEARCH, NOVEMBER 2017 Executive Summary Hold percentage the portion of money
Danish gambling market statistics First quarter 2017
 Danish gambling market statistics First quarter 2017 6. juni 2017 Danish gambling market statistics 1 Introduction The Danish gambling market underwent a partial liberalisation in 2012, with the markets
PROPOSED EP BOWLS CALENDAR; January 2019 Version 2 Approved 22 November 2018
 PROPOSED EP BOWLS CALENDAR; January 2019 Version 2 Approved 22 November 2018 Jan 19 Monday Tuesday Wednesday Thursday Friday Saturday Sunday 1 2 3 4 5 6 Week 1 NEW YEARS DAY EP Bowls Coaching Course EP
FOR RELEASE: TUESDAY, DECEMBER 11 AT 4 PM
 Interviews with 1,002 adult Americans conducted by telephone by Opinion Research Corporation on December 6-9, 2007. The margin of sampling error for results based on the total sample is plus or minus 3
Economic Overview. Melissa K. Peralta Senior Economist April 27, 2017
 Economic Overview Melissa K. Peralta Senior Economist April 27, 2017 TTX Overview TTX functions as the industry s railcar cooperative, operating under pooling authority granted by the Surface Transportation
Step On Stage Dance Company
 September 207 Aug 207 3 4 5 6 7 8 9 0 2 3 4 6 7 8 9 20 22 23 24 25 26 27 28 29 30 Oct 207 3 4 5 6 7 8 9 0 2 3 4 6 7 8 9 20 2 29 30 3 4 5 6 7 8 9 Labour Day 0 2 3 4 6 Dance Starts 7 8 9 20 22 23 October
President and Chief Executive Officer Federal Reserve Bank of New York Washington and Lee University H. Parker Willis Lecture in Political Economics
 The U.S. Economic Outlook Chartspresented by WilliamC Dudley Charts presented by William C. Dudley President and Chief Executive Officer Federal Reserve Bank of New York Washington and Lee University H.
nipigon.net Township of Nipigon 2018 Community Profile
 nipigon.net Township of Nipigon V 1.0 February 2018 2018 Nipigon nipigon.net nipigon.net Township of Nipigon nipigon.net Township of Nipigon nipigon.net Township of Nipigon nipigon.net Township of Nipigon
VEHICLE / PEDESTRIAN COLLISIONS
 VEHICLE / PEDESTRIAN COLLISIONS HRM: April 018 DISCLAIMER: All figures presented in this report reflect the information held on HRP systems at the time of data extraction and are subject to change without
Nasdaq Dubai AED TRADING HOLIDAYS AND SETTLEMENT CALENDAR 2018 For Equities Outsourced to the DFM (T+2)
") NasdaqDubai Circular No: 14 /2018 Date of Issue: 13 March 2018 Date of Expiry : Upon issue of replacement Circular Nasdaq Dubai AED TRADING HOLIDAYS AND SETTLEMENT CALENDAR 2018 For Equities Outsourced
NasdaqDubai Circular No: 14 /2018 Date of Issue: 13 March 2018 Date of Expiry : Upon issue of replacement Circular Nasdaq Dubai AED TRADING HOLIDAYS AND SETTLEMENT CALENDAR 2018 For Equities Outsourced
REVENUE & RIDERSHIP REPORT SEPTEMBER 2018
 REVENUE & RIDERSHIP REPORT SEPTEMBER 2018 Year-to-date passenger revenue 1.3% above last year Year-to-date ridership 2.1% below last year 1,500 SEPTA RIDERSHIP PERFORMANCE Average Daily Rides in 000's
Offaly GAA Master Fixtures Plan 2018
 Dates for knockout stages of Championships will finalised, where possible, week commencing August 20th Consideration will be given to a U19 Hurling blitz in May, 11, 12 or 13 a side, and without county
JULY 2013 RIDERSHIP REPORT MTA METRO-NORTH RAILROAD EXECUTIVE SUMMARY
 Ridership Report JULY 2013 RIDERSHIP REPORT MTA METRO-NORTH RAILROAD EXECUTIVE SUMMARY July July 2013 Total MNR System Ridership was 7.346 million vs. 7.439 million in July 2012, a decrease of 92,959 passengers
Greater Manchester Police Hate Crime and Hate Incident Data 01/04/14 to 31/03/15
 Greater Manchester Police Hate Crime and Hate Incident Data 01/04/14 to 31/03/15 The data within this document is taken from a live database, and there is the potential that the information contained within
PUBLIC MEETINGS. Please see the City of Geneva Public Meeting Guide for more information regarding City Council and Committee of the Whole meetings.
 PUBLIC MEETINGS Citizens are welcome and encouraged to attend all City of Geneva public meetings. Public meeting guests are also urged to participate in any of the City s many public meetings that take
Understanding Rider Differences in Mileage and Riding Frequency through the MSF100 Motorcyclists Naturalistic Study.
 2/18/216 Understanding Rider Differences in Mileage and Riding through the MSF1 Motorcyclists Naturalistic Study January 13, 214 Mac McCall Shane McLaughlin Motorcycle Research Group 1 Overview Objective
GALLUP NEWS SERVICE GALLUP POLL SOCIAL SERIES: WORLD AFFAIRS
 GALLUP NEWS SERVICE GALLUP POLL SOCIAL SERIES: WORLD AFFAIRS -- FINAL TOPLINE -- Timberline: 937008 IS: 954 Princeton Job #: 17-02-002 Jeff Jones, Lydia Saad February 1-5, 2017 Results are based on telephone
Frederick Ross. Real Estate Market Overview. Presented by: Kevin Thomas Senior Vice President. Frederick Ross. Company.
 Frederick Ross Real Estate Market Overview Presented by: Kevin Thomas Senior Vice President Frederick Ross Company January 2003 Business Consumers Source: BEA, Ross Research Housing...Bust or Rust? 2001
A review of 2015 fatal collision statistics as of 31 December 2015
 A review of fatal collision statistics as of 31 December This report summarises the main trends in road fatalities that have emerged in. This has been prepared by the Road Safety Authority following analysis
ROYAL MONETARY AUTHORITY OF BHUTAN MONTHLY STATISTICAL BULLETIN
 ROYAL MONETARY AUTHORITY OF BHUTAN MONTHLY STATISTICAL BULLETIN Macroeconomic Research and Statistics Department Vol. XVIl, No.3 March 2018 CONTENTS Preface....01 Bhutan s Key Economic Indicators..02 Table
GALLUP NEWS SERVICE GALLUP POLL SOCIAL SERIES: WORLD AFFAIRS
 GALLUP NEWS SERVICE GALLUP POLL SOCIAL SERIES: WORLD AFFAIRS -- FINAL TOPLINE -- Timberline: 937008 JT: 165 Princeton Job #: 18-02-002 Jeff Jones, Lydia Saad February 1-10, 2018 Results are based on telephone
ROYAL MONETARY AUTHORITY OF BHUTAN MONTHLY STATISTICAL BULLETIN
 ROYAL MONETARY AUTHORITY OF BHUTAN MONTHLY STATISTICAL BULLETIN Department of Macroeconomic Research and Statistics Vol. XVIl, No.9 September 2018 CONTENTS Preface....01 Bhutan s Key Economic Indicators..02
GALLUP NEWS SERVICE GALLUP POLL SOCIAL SERIES: WORK AND EDUCATION
 GALLUP NEWS SERVICE GALLUP POLL SOCIAL SERIES: WORK AND EDUCATION -- FINAL TOPLINE -- Timberline: 937008 IS: 786 Princeton Job #: 16-08-012 Jeff Jones, Lydia Saad August 3-7, 2016 Results are based on
ROYAL MONETARY AUTHORITY OF BHUTAN MONTHLY STATISTICAL BULLETIN
 ROYAL MONETARY AUTHORITY OF BHUTAN MONTHLY STATISTICAL BULLETIN Department of Macroeconomic Research and Statistics Vol. XVIl, No.11 November 2018 CONTENTS Preface....01 Bhutan s Key Economic Indicators..02
Properties. terc.ucdavis.edu 8
 Physical Properties 8 Lake surface level Daily since 1900 The lowest lake level on record was 6,220.26 feet on Nov. 30, 1992. Since 1900, lake level has varied by more than 10 feet. Lake level typically
Offaly GAA Master Fixtures Plan 2018
 The Championship dates are for Senior, Senior B and Intermediate. Dates for knockout stages of Championships will finalised, where possible, week commencing August 20th Dates for Junior will be added when
September 2017 MLS Statistical Report. Residential Inventory
 September 217 MLS Statistical Report Residential Inventory 2 2 1 1 21 216 217 Summary Inventories: Residential inventory is down 1%, Lots / Land inventory is down 13% and commercial inventory was down
2018 Program 20/10/17
 DAY DATE CLUB EVENT ZONE 10 EVENT RNSW BOWLS EVENT BOWLS AUS EVENT REMARKS. 01-Jan New Year's Day New Year's Day 02-Jan Fours Entries Open 03-Jan 04-Jan 05-Jan 06-Jan 07-Jan 08-Jan 09-Jan 10-Jan 11-Jan
African swine fever in domestic pigs and wild boar (ASF)
") African swine fever in domestic pigs and wild boar (ASF) Analysis of ADNS data since 01/2018 Reporting period: 2018-01-01 2018-12-09 Data query: 2018-12-10 AGES DSR Austrian Agency for Health and Food
African swine fever in domestic pigs and wild boar (ASF) Analysis of ADNS data since 01/2018 Reporting period: 2018-01-01 2018-12-09 Data query: 2018-12-10 AGES DSR Austrian Agency for Health and Food
2018 Annual Economic Forecast Dragas Center for Economic Analysis and Policy
 2018 Annual Economic Forecast Dragas Center for Economic Analysis and Policy PRESENTING SPONSOR EVENT PARTNERS 2 The forecasts and commentary do not constitute an official viewpoint of Old Dominion University,
NASDAQ DUBAI TRADING HOLIDAYS AND SETTLEMENT CALENDAR 2018 For Equities Outsourced to the DFM (T+2)
") Nasdaq Dubai Circular No : 71/17 Date of Issue : 24 December 2017 Date of Expiry : Upon issue of replacement Circular NASDAQ DUBAI TRADING HOLIDAYS AND SETTLEMENT CALENDAR 2018 For Equities Outsourced
Nasdaq Dubai Circular No : 71/17 Date of Issue : 24 December 2017 Date of Expiry : Upon issue of replacement Circular NASDAQ DUBAI TRADING HOLIDAYS AND SETTLEMENT CALENDAR 2018 For Equities Outsourced
US Economic Activity
 US Economic Activity GDP has been in positive territory for seven consecutive quarters, and the advance estimate shows the US economy grew at a 1.0% rate in the fourth quarter 2015. US Economic Activity
b Number issued 200,000 (marked with * in the attached appendix) Exercise price is as set out in the appendix
 Exercise price is as set out in the appendix") www.sli-systems.com Level 1, EPIC 78 106 Manchester Street Christchurch New Zealand Phone: 0800 754 797 Fax:03 961 3262 22 May 2018 Client Market Services NZX Limited WELLINGTON By NZ MAP NOTIFICATION
www.sli-systems.com Level 1, EPIC 78 106 Manchester Street Christchurch New Zealand Phone: 0800 754 797 Fax:03 961 3262 22 May 2018 Client Market Services NZX Limited WELLINGTON By NZ MAP NOTIFICATION
FOR RELEASE: FRIDAY, MARCH 30 AT 5 AM
 Interviews with 1,014 adult Americans conducted by telephone by ORC International on March 24-25, 2012. The margin of sampling error for results based on the total sample is plus or minus 3 percentage
Traffic Safety Basic Facts 2008
 More than 5.000 people died in road traffic accidents involving HGVs in 2006 1 (EU-14 plus the Czech Republic, Estonia, Hungary Malta and Poland) Traffic Safety Basic Facts 2008 and Buses (HGVs) are defined
3. EXCEL FORMULAS & TABLES
 Winter 2017 CS130 - Excel Formulas & Tables 1 3. EXCEL FORMULAS & TABLES Winter 2017 Winter 2017 CS130 - Excel Formulas & Tables 2 Cell References Absolute reference - refer to cells by their fixed position.
Calendar On US Federal Reserve Holidays, no settlements will take place for USD.
 NASDAQ Dubai Notice No: NASDAQ Dubai Trading Holidays and Settlement Calendar 2012 Date of Issue: NASDAQ Dubai TRADING HOLIDAYS AND SETTLEMENT CALENDAR 2012 For Derivatives, Exchange Traded Commodities,
Greater Las Vegas Snapshot by Sale Type Last Month's Sold
 Available Units Pending Units Las Vegas Market Update - February 2018 Greater Las Vegas Snapshot by Sale Type Last Month's Sold Units Median List Price Average List Price Median Sold Price Average Sold
SWISS reports stable load factors
 SWISS Corporate Communications Phone: +41 (0)848 773 773 Fax: +41 (0)44 564 2127 communications@swiss.com SWISS.COM Media release Zurich Airport, October 10, 2008 SWISS reports stable load factors SWISS
SWISS Traffic Figures May 2004
 SWISS Traffic Figures May 2004 SWISS continues seat load factor improvement in May SWISS s load factor for May was 4.8 percentage points better than for the same period last year. Seat load factor for
2017 Nebraska Profile
 2017 Nebraska Profile State, 9 NEW Regions, 93 Counties, plus 31 Cities Three Volumes Demographic Change in the State Economic Influences at Work Housing Statistics and Trends Summary of Findings Discuss
Bird strikes Swedish Airspace
 Bird strikes Swedish Airspace 1998-2005 Nordic Birdstrike Committee Arlanda 2006-09-21 Jörgen Andersson Jörgen Andersson, Swedish CAA 1 Objective Occurrence reports Bird population Birdstrikes between
Danish gambling market statistics Third quarter, 2017
 Danish gambling market statistics Third quarter, Third Quarter, 7. december Third Quarter, Danish gambling market statistics 1 Indhold A. Introduction... 2 B. Quarterly market statistics for the Danish
Personnel Benchmarking Author: Ed Rehkopf
 Author: Ed Rehkopf 2009 Club Resources International Table of Contents Background.................................. 1 Purpose.................................... 1 Sources of Information............................
Producer Price Index - Agriculture (PPI-A) (April - June 2003)
 (April - June 2003)") Producer Price Index - Agriculture (PPI-A) (April - June 20) 1. Introduction The Producer Price Index-Agriculture (PPI-A) gives a measure of the average change in the selling prices which producers receive
Producer Price Index - Agriculture (PPI-A) (April - June 20) 1. Introduction The Producer Price Index-Agriculture (PPI-A) gives a measure of the average change in the selling prices which producers receive
Greater Las Vegas Snapshot by Sale Type Last Month's Sold
 Available Units Pending Units Las Vegas Market Update - April 2018 Greater Las Vegas Snapshot by Sale Type Last Month's Sold Units Median List Price Average List Price Median Sold Price Average Sold Price
KC Scout Kansas City s Bi-State Transportation Management Center
 KC Scout Kansas City s Bi-State Transportation Management Center Operations Report August- 215 This report contains statistical and operational data of activities at the Scout TMC for the period Saturday,
Danish gambling market statistics Third quarter 2018
 Danish gambling market statistics Third quarter, Third quarter 5. december Content A. Introduction... 1 B. Overview over market developments in third quarter of... 2 C. Online casinos... 5 Developments
May 2018 MLS Statistical Report
 Jan Feb Mar Apr May Jun Jul Aug Sep Oct Nov Dec January February March April May June July August Septem October Novem Decemb Days on Market The graph on the right illustrates the drastic decline in the
Traffic Safety Basic Facts 2008
 In 2006 1, more than 4.700 seniors died in road traffic accidents in 14 European countries. Fatalities of elderly people in road traffic accidents reduced by over 3 between 1997 and 2006. Traffic Safety
Clubhouse Reservations Calendar
 January 2018 1 New Year's Day 2 3 4 5 6 7:00 8:00 PM Bible Study Feb 2018 7 8 9 10 11 12 10:00 AM 12:00 PM Annual Meeting 13 14 15 Martin Luther King 16 21 22 23 7:00 8:00 PM Bible Study 10:00 AM 12:00
Danish gambling market statistics First quarter 2018
 Danish gambling market statistics First quarter, 2018 First quarter 2018 28. juni 2018 Indhold A. Introduction... 1 B. Overview over market developments in first quarter of 2018... 2 C. Online casinos...
Greater Las Vegas Snapshot by Sale Type Last Month's Sold
 Available Units Pending Units Las Vegas Market Update - July 2018 Greater Las Vegas Snapshot by Sale Type Last Month's Sold Units Median List Price Average List Price Median Sold Price Average Sold Price
Greater Las Vegas Snapshot by Sale Type Last Month's Sold
 Available Units Pending Units Las Vegas Market Update - June 2018 Greater Las Vegas Snapshot by Sale Type Last Month's Sold Units Median List Price Average List Price Median Sold Price Average Sold Price
National and Regional Economic Outlook. Central Southern CAA Conference
 National and Regional Economic Outlook Central Southern CAA Conference Dr. Mira Farka & Dr. Adrian R. Fleissig California State University, Fullerton April 13, 2011 The Painfully Slow Recovery The Painfully
Greater Las Vegas Snapshot by Sale Type Last Month's Sold
 Available Units Pending Units Las Vegas Market Update - December 2018 Greater Las Vegas Snapshot by Sale Type Last Month's Sold Units Median List Price Average List Price Median Sold Price Average Sold
Agricultural Weather Assessments World Agricultural Outlook Board
 Texas (8) Missouri (7) South Dakota (6) Kansas (5) Nebraska (5) North Dakota (5) Oklahoma (5) Kentucky (4) Montana (4) California (3) Minnesota (3) New York (3) Pennsylvania (3) Tennessee (3) Wisconsin
Agricultural Weather Assessments World Agricultural Outlook Board
 Texas (8) Missouri (7) South Dakota (6) Kansas () Nebraska () North Dakota () Oklahoma () Kentucky (4) Montana (4) California (3) Minnesota (3) New York (3) Pennsylvania (3) Tennessee (3) Wisconsin (3)
Regional Spread of Inbound Tourism
 Regional Spread of Inbound Tourism Foresight issue 157 VisitBritain Research 1 Contents Introduction Summary Key metrics by UK area Analysis by UK area Summary of growth by UK area Scotland Wales North
EXNING & NEWMARKET ELECTORAL DIVISION PROFILE This Division comprises All Saints, Exning and St Mary s wards
 EXNING & NEWMARKET ELECTORAL DIVISION PROFILE 2017 This Division comprises All Saints, Exning and St Mary s wards www.suffolkobservatory.info 2 Crown copyright and database rights 2017 Ordnance Survey
WORKFORCE LOCAL AREA EMPLOYMENT STATISTICS (LAUS)
") AUGUST 2018 WORKFORCE LOCAL AREA EMPLOYMENT STATISTICS (LAUS) 1,200,000 1,100,000 1,000,000 900,000 Labor Force Employment 1,152,626 1,116,938 800,000 700,000 600,000 500,000 2016 to 2017: 35957 (3.1%)
AUGUST 2018 WORKFORCE LOCAL AREA EMPLOYMENT STATISTICS (LAUS) 1,200,000 1,100,000 1,000,000 900,000 Labor Force Employment 1,152,626 1,116,938 800,000 700,000 600,000 500,000 2016 to 2017: 35957 (3.1%)
TABLE 1. REAL GDP AND GROWTH RATES IN THE ESCWA REGION AT CONSTANT 1995 PRICES, (Millions of US dollars and percentages) Percentage change
 Percentage change") TABLE 1. REAL GDP AND GROWTH RATES IN THE ESCWA REGION AT CONSTANT 1995 PRICES, 2001-2004 (Millions of US dollars and percentages) Percentage change Country/area 2000 2001 2002 2003 a/ 2004 b/ 2001 2002
TABLE 1. REAL GDP AND GROWTH RATES IN THE ESCWA REGION AT CONSTANT 1995 PRICES, 2001-2004 (Millions of US dollars and percentages) Percentage change Country/area 2000 2001 2002 2003 a/ 2004 b/ 2001 2002
UNIVERSITY OF CALIFORNIA Economics 134 DEPARTMENT OF ECONOMICS Spring 2018 Professor David Romer
 UNIVERSITY OF CALIFORNIA Economics 134 DEPARTMENT OF ECONOMICS Spring 2018 Professor David Romer LECTURE 2 OVERVIEW OF THE GREAT DEPRESSION January 22, 2018 I. THE 1920S A. GDP growth and inflation B.
REVENUE & RIDERSHIP REPORT NOVEMBER 2017
 REVENUE & RIDERSHIP REPORT NOVEMBER 2017 November ridership and revenue 1.9% and 2.2% below budget Depressed ridership last November from a six-day City Transit strike Year-to-date revenue 3.2% and ridership
SEASONAL PRICES for TENNESSEE FEEDER CATTLE and COWS
 SEASONAL PRICES for TENNESSEE FEEDER CATTLE and COWS Tammy L. McKinley Extension Specialist Agricultural & Resource Economics economics.ag.utk.edu AE16-06 July 2016 TABLE OF CONTENTS Seasonal : Introduction...
New Growth Segments for the Air Cargo Industry
 Page 1 New Growth Segments for the Air Cargo Industry 4 th Air Cargo Economics Conference Prague, April 22-23, 2004 Page 2 Assumptions Primary commodity sectors and their growth Perishables: are they really
RTC TRANSIT OPERATING STATISTICS RTC RIDE RTC RAPID RTC INTERCITY SIERRA SPIRIT
 RTC TRANSIT OPERATING STATISTICS RTC RIDE RTC RAPID RTC INTERCITY SIERRA SPIRIT April 2016 RTC TRANSIT OPERATING STATISTICS REPORT TABLE OF CONTENTS RTC Transit Highlights... Page ii RTC Transit Summary...
WATER WELL DRILLER AND PUMP INSTALLER LICENSING REPORT ADVISORY BOARD MEETING January 5, 2018
 WATER WELL DRILLER AND PUMP INSTALLER LICENSING REPORT ADVISORY BOARD MEETING January 5, 2018 Water Well Driller and Pump Installer FY 14 FY 15 FY 16 FY 17 1 st Quarter FY 18 New Licenses Issued 92 73
 A Brief Analysis of the Impact of the El Niño Southern Oscillation (ENSO) Cycle In specific areas around East Timor In the Climate Change section of Seeds of Life, we believe it would be beneficial for
SOLTRANS BOARD MEETING SUPPLEMENTAL REPORTS / HANDOUTS January 15, 2015 MEETING HANDOUTS
 SOLTRANS BOARD MEETING SUPPLEMENTAL REPORTS / HANDOUTS January 15, 2015 MEETING HANDOUTS Agenda Item 10 January 2015 System Improvements Update - PowerPoint Presentation Agenda Item 12 Construction Projects
WORKFORCE LOCAL AREA EMPLOYMENT STATISTICS (LAUS)
") AUGUST 2016 WORKFORCE LOCAL AREA EMPLOYMENT STATISTICS (LAUS) 1,150,000 1,100,000 1,050,000 1,000,000 950,000 900,000 850,000 800,000 750,000 700,000 Labor Force Employment June 2015 to June 2016: 36,504
AUGUST 2016 WORKFORCE LOCAL AREA EMPLOYMENT STATISTICS (LAUS) 1,150,000 1,100,000 1,050,000 1,000,000 950,000 900,000 850,000 800,000 750,000 700,000 Labor Force Employment June 2015 to June 2016: 36,504
Child Road Safety in Great Britain,
 Child Road Safety in Great Britain, 21-214 Bhavin Makwana March 216 Summary This short report looks at child road casualties in Great Britain between 21 and 214. It looks at how children travel, the geographical
UK Integrated Behaviour Change Programmes
 UK Integrated Behaviour Change Programmes 17 th November 2009 ACT TDM Summit Conference Daniel Johnson, Transport for London Nicky Ward, Steer Davies Gleave Structure 1. UK travel behaviour change 2. An
Utah Ag Bankers Conference Alfalfa and Dairy Outlook
 Utah Ag Bankers Conference Alfalfa and Dairy Outlook Dillon M Feuz Utah State University Extension Feb 2018 Hay Market Most data provided by USDA- AMS, NASS & FAS 1990 1990 1991 1991 1992 1992 1993 1994