Florida Fish and Wildlife Conservation Commission
|
|
|
- Jodie Brianne Williamson
- 6 years ago
- Views:
Transcription

1 Florida Fish and Wildlife Conservation Commission Florida Gulf Coast Oyster Disaster Report May 2013
2 Table of Contents Section Page Executive Summary 4-8 Introduction Request for Fishery Failure 9 Florida Fishery Failure Actions 10 Oyster Reef Habitat 11 Oyster Resource Regulation 11 Overview of Oyster Fishery 12 Harvest Reports Historic Harvests Modifications to Harvests Related to Deep Water Horizon Oil Spill Recent Harvest Declines Exacerbated Natural Disaster 17 Overview of Drought and River Discharge Recovery Impacts to Coastal Oyster Habitats Resource Surveys Summary Resource Surveys Impacts to Populations Summary of Impacts to Populations 31 Conclusion 31 2
3 Impacts to Oyster Marine Resources Landing Revenues Pounds of Meat Landed Conclusion 34 Figures Tables References
4 OYSTER FISHERY DISASTER CONCLUSION Executive Summary The rapid and unprecedented commercial oyster fishery failure on Florida s Gulf coast was the result of upstream consumption and water management policies in the Apalachicola- Chattahoochee-Flint River Basins, which exacerbated the impact of severe drought conditions experienced in the Southeast United States. These factors are outside of the fishery manager s control. The mechanisms for this disaster have not been quantified, but include increased oyster predators and disease resulting from increased salinities and decreased oyster nutrition from decreased freshwater input. From September 2012 through February 2013, revenues and pounds of oyster meats from commercial harvest have steadily declined monthly with an overall decline in revenue of 43 percent and pounds of oyster meat of 58 percent. It is abundantly clear that the decline in revenue and pounds of oyster meat will continue in the months of March 2013 through August 2013, predicted to approach 100 percent. The documented collapse of 80 percent% total oyster biomass greater than 25 mm in length and a 67 percent reduction in legal sized oysters per square meter on the major commercial reefs has resulted in a serious disruption affecting future production. The commercial oyster fishery failure was not the result of fishery management and or enforcement practices. Oyster recovery is possible and has historical precedence. The State of Florida will develop a detailed recovery plan in consultation with the oyster industries, local governments and state agencies. This recovery plan will exceed the fiscal capabilities of the State of Florida, and the degree of success will depend on assistance pursuant Section 312(a) of the Magnuson- Stevens Fishery Conservation and Management Act. It is expected that under ideal conditions full recovery from this fishery failure will take five years and significant fiscal assistance. 4
5 Recovery from this serious disruption affecting future production will be longer if the number of low river flow days in future years remains high, and sustainable recovery could be precluded altogether if low flow days increase. RATIONALE and HISTORIC MANAGEMENT Oysters and oyster reef habitats are renewable natural resources and are ecologically and economically important to the State of Florida and in particular Franklin County. Oyster resource harvests, commercially and recreationally, are regulated by the Florida Fish and Wildlife Conservation Commission (FWC). These regulations rely on established monitoring protocols conducted by the Florida Department of Agriculture and Consumer Services (DACS) and are based upon previous State Board of Conservation Reports. Concern for the historic sustainable oyster fishery was initiated by a late Summer 2012 routine survey conducted by the DACS indicating low harvestable stock and extremely low sub-legal stock, suggesting a fishery collapse was imminent. Extensive reports from people employed in the commercial oyster industry in the Fall 2012 indicated a lack of harvestable resources and observations of sick or dying oyster stocks from the Cedar Key Region throughout the Florida Panhandle, but focusing on Apalachicola Bay, suggested a discrete large scale mortality event had occurred. Because over 90 percent of Florida s oysters are produced from the Apalachicola Bay System, much of the information and data presented in this report is from this Bay System, other bay systems on Florida s west coast are similarly situated. OYSTER FISHERY DISASTER FINDINGS The cause of the oyster decline is a lack of freshwater flow into rivers and estuaries. Freshwater input has significantly declined due to upstream consumption and water management actions. Minimum managed flows have occurred nearly one-third of the time on the Apalachicola River over the past five years. This is twice as frequent as the time period of and more than ten times as frequent before construction and management of the Buford Dam which established Lake Lanier in Georgia (1923 to1955). Freshwater input has significantly declined due to the impact of upstream consumption and water management actions that exacerbate severe and prolonged drought 5
6 conditions. The Southeast United States has been the driest on record for the last two years. Upstream consumption reduces the volume of water flowing in the Apalachicola River. Maximum consumption typically occurs during drought conditions and upstream reservoir operations become more conservative. As less water enters upstream systems, water that is available is captured and retained in upstream federal and nonfederal reservoirs and impoundments. Due to lack of freshwater input, salinities on oyster fishing grounds have significantly increased resulting in poor conditions for oyster growth and survival since May Prolonged relatively freshwater conditions, typical of estuaries have not been observed since at least February 2010, resulting in increased predator abundance, increased disease and decreased nutrition. Florida resource managers have conducted surveys of indicator oyster reefs since Such information is used to reliably predict trends in oyster production; to monitor oyster population dynamics, including recruitment, growth, natural mortality, and standing stocks; and to determine impacts of climatic events such as hurricanes, floods and droughts on oyster resources. Sampling for 2012 (July and October) demonstrated that oyster populations are currently insufficient to support commercial harvesting. Overall densities of oyster biomass greater than 25 mm in length have been reduced 80 percent and legal sized oysters have been reduced 67 percent. The severe decline in pounds of oyster meat harvested began in September 2012, when an initial drop near 29 percent of historic September levels was observed. This decline in harvest relative to historic monthly averages has continued to become more severe. A nearly 80 percent decline was noted in February 2013, compared with historic February harvests. This rapid decline is projected to be near 100 percent, relative to historic levels, in the foreseeable future. This decline is clear evidence of a Commercial Fishery Failure. September 2012 resulted in an initial drop in landed value of over 9 percent of historic September levels. A nearly 71 percent decline was noted in February 2013 compared with historic levels in February. This rapid decline is projected to be near 100 percent, relative to historic levels, in the foreseeable future. This decline is clear evidence of a serious disruption affecting future production. Based on sampling results, the proactive conservation provision in the FWC oyster requiring closure of the Apalachicola Bay System to commercial harvest on Saturdays 6
7 and Sundays from November 17 th through May 31 st was implemented on November 16, In the 2011 DACS resource assessment, juvenile sub-legal oysters less than one year old (young of the year) were at historically high abundances. Based on this assessment, no changes in management were warranted, despite a trend of increasing effort in the fishery. Increased effort was not reflected in increased harvests. Though oysters are a naturally variable stock, the severity of the decline since September 2012 was not reasonably predictable nor was it foreseeable, based on the 2011 assessment. This is indicative of a Fishery Resource Failure. Commercial oyster fishing pressure prior to the collapse was well below allowable levels: less than 20 percent of the licensed participants actually fish on any given day and typically they report harvesting half of the established 20-bag limit. Florida s emergency actions in 2010 in response to the Deep Water Horizon (DWH) oil spill did not result in increased landings or overharvest. As part of the Florida response, the University of Florida (UF) initiated an independent Oyster Recovery Team, which incorporated virtually all segments of society with an interest in the health of Apalachicola Bay, Florida s largest oyster producing estuary. The FWC scientific and management staff participated in the development of this report. This report also generated a status and trends evaluation and stock assessment for Apalachicola Bay oysters. The UF report indicated the 2012 decline in oyster landings and recruitment of juvenile oysters is unprecedented during the period of data analyzed and has likely involved recruitment failure or high mortality of small oysters. The UF report indicated there is no evidence that the harvesting of sub-legal oysters has or would lead to overfishing... unless the sub-legal harvest has been unregulated and extremely high. The UF report concluded that recruitment overharvest did not play a role in the fishery failure as the decline in sub-legal abundance, sudden as it was, cannot be attributed to reduced spawner abundance (i.e., adult population) and/or larval supply. The UF stock assessment indicated that the current [3 ] size limit is generally sufficient for maximizing yield. 7
8 The UF report indicated because of the low abundance of sub-legal oysters in 2012 there is a high likelihood that legal-sized oysters will be in low abundance in 2013 and likely in 2012 as well. The UF Oyster Recovery Team did not find evidence that toxins related to the Deep Water Horizon oil spill reduced oyster stocks. Oyster recovery is possible. Oyster resources in the Apalachicola Bay System were decimated in 1985 by Hurricane Elena and full recovery took five years following significant oyster reef construction and rehabilitation activities. Recovery is highly dependent on federal disaster funding. 8
9 Introduction Request for Fishery Failure The severe and cumulative impacts of natural and manmade disasters have taken a tremendous biological and economical toll on Florida s Gulf Coast oyster habitat, oyster resources, oyster harvesters and oyster processors. This report focuses on the impacts to oyster habitat and oyster resources from prolonged low river discharges during On September 9, 2012, Florida Governor Rick Scott requested the Secretary of the United States Department of Commerce (USDC) declare a commercial fishery failure due to a fishery resource failure for Florida s oyster harvesting areas in the Gulf of Mexico pursuant to Section 312(a) of the Magnuson-Stevens Fishery Conservation and Management (Appendix 1). The Governor s request was based on a letter and report from the Florida Department of Agriculture and Consumer Services (DACS) detailing historically low productivity and survival and predicting severe economic losses for the oyster industries (Appendix 1). The losses are so severe and unprecedented that the report outlines concerns that oyster habitat losses could perpetuate forward to future harvest years resulting in permanent or at least long-term loss in productivity if not complete collapse of the industry. Similar collapses in the calico scallop fishery and hard clam fishery, in which the infrastructure is eroded, have already resulted in the loss of 4,000 to 6,000 shellfish industry jobs in Florida since the mid-1980s. An estimated 2,000 oyster industry members make their living directly harvesting oysters and or processing oysters on Florida s Gulf coast. It is unknown how many total jobs are dependent directly or indirectly on these oyster industries. The results of this resource assessment report coupled with extensive resource management experience led Florida to request the commercial fishery failure prior to the full impacts of the disaster unfolding. Simply put, Florida did not intend to wait to see the economic devastation that was predicted. The predicted devastation has occurred. Florida s request was in recognition that the impacts on habitat and economy exceeded the State of Florida s capacity to address alone. 9
10 Florida Fishery Failure Actions In addition to the Florida request to USDC for declaration of a fishery failure, the State of Florida s actions were immediate and wide ranging. The University of Florida (UF) implemented The Oyster Recovery Team with three objectives: (1) determine the status of the oyster resources and possible reasons for observed oyster decline, (2) provide suggestions about future oyster fishing and management, and (3) foster sustainable use of oyster resources by the industry. This Team issued a report dated April 24, 2013, including findings and recommendations (Appendix 2). The Governor s Office announced that Florida received a $2.7 million National Emergency Grant from the United States Department of Labor to provide temporary employment for dislocated oyster fishers as well as education and job retraining opportunities. The Florida Fish and Wildlife Conservation Commission (FWC) was able to assist the temporary employment effort after receiving a Legislative budget amendment to purchase up to $35,000 for necessary supplies that the National Emergency Grant could not provide. FWC staff presented an overview of the oyster situation to the FWC Commissioners and has provided the Commissioners with updates at each subsequent Commission Meeting. FWC and DACS met on two separate occasions with the National Oceanic and Atmospheric Administration National Marine Fisheries Services (NOAA Fisheries) Southeast Regional Office to gather information on the disaster assistance guidelines (Appendix 3) and to discuss data needs in support of the Florida fishery failure request. FWC traveled to Washington, D.C. to participate in the annual Gulf Oyster Industry Council s meetings and provided briefings on oyster issues to 25 Gulf of Mexico State Congressional Offices. All Congressional Offices indicated they would be supportive should the USDC declare a fishery failure. FWC, UF and the Florida Department of Environmental Protection (DEP) were requested to present information about the oyster situation to Committees of the Florida Senate and the Florida House of Representatives. The State of Florida does not have the necessary fiscal resources to address this disaster alone, hence the formal request for assistance pursuant to Section 312(a) of the Magnuson-Stevens Fishery Conservation and Management Act. 10
11 Oyster Reef Habitat Oysters are an ecologically important species. Oyster reefs provide habitat for marine organisms, such as mussels, barnacles and algae; refuge for marine animals such as shrimp, small fishes and crabs; and nursery habitat for marine species such as flounder and black sea bass. Some fish attach their eggs to oyster shells (oyster toad fish, gobies and blennies). Many of Florida s prized fish such as red drum, spotted seatrout and sheepshead use oyster reefs to prey on the wide variety of food that the reefs provide, generating a complex food web. Because oysters build structure on otherwise soft sediments that would bury other stationary organisms, their presence results in a vital micro-environment within Florida s important bay systems. Oysters consume algae by filtering water at a rate of about two gallons per hour. In abundance, oysters help clarify the water. Increasing water clarity also allows seagrass to receive more sunlight. Plentiful seagrasses increase oxygen levels, reduce wave energy and shoreline loss, and provides quality habitat for aquatic life. Oyster Resource Regulation Oyster resources in Florida are regulated by the FWC. The FWC s Oyster Rule (Chapter 68B-27, Florida Administrative Code, Appendix 4) provides for oyster harvest seasons, size limits, bag limits, gear and special management considerations for the Apalachicola Bay System. DACS assists FWC by monitoring oyster resources in the Apalachicola Bay System. Commercial harvest of oysters requires a Saltwater Products License (individual or vessel) issued by FWC and if fishing in the Apalachicola Bay System an additional license issued by DACS, the Apalachicola Bay Oyster Harvesting License, is required for all individuals onboard the vessel. FWC Division of Law Enforcement enforces oyster regulations on state waters. Commercial oysters must be sold to a processor possessing an FWC issued Wholesale Dealers License and a DACS issued Shellfish Processing Plant Certification License. Wholesale Dealers first receiving oysters from commercial harvesters are required to report all Saltwater Products received (FWC Reporting Requirements for the Marine Fisheries Information System Rule Chapter 68E-5, Florida Administrative Code). 11
12 Overview of Oyster Fishery Oysters are harvested using wooden flat bottom vessels 20 to 25 feet in length using hand tongs. Generally, two fishers are present on each vessel. For example, in the Apalachicola Bay System, in 2007 through 2011, a DACS conducted count of oyster harvesting vessels actively harvesting (Figure 1) showed an average of 184 vessels (range of vessels 70 to 421). In 2007 through 2011, an average of 1,067 unique commercial fishers sold oysters under a Saltwater Products License from the Gulf of Mexico (903 from the Apalachicola Bay System and 164 from the rest of the Gulf). Those who harvest oysters from Apalachicola must also possess an Apalachicola Bay Oyster Harvesting License. In 2007 through 2011, there was an average of 1,489 Apalachicola Bay Oyster Harvesting Licenses issued (Table 1). Most oyster fishers have many years of experience in the commercial oysters industry and many are proud multigenerational oyster fishers. The harvested oysters must legally be landed at an approved and licensed Certified Shellfish Processor. In 2007 through 2011, there was an average of 31 Certified Shellfish Processors receiving oysters from the Gulf of Mexico. Expanding on a methodology used by the University of Florida (2010), a rough estimate can be made that approximately 2,000 individuals participate directly in the oyster fishery on an annual basis. Most oyster harvesters are highly specialized and only harvest oysters. In 2007 through 2011, an average of 76.4 percent of all Gulf of Mexico oyster fishers harvested only oysters, while 82.6 of Apalachicola Bay oyster fishers harvested only oysters. The value oyster fishers receive for other species compared with the value of oysters is low. In 2007 through 2011 Gulf wide, an average of 22.6 percent of the total fishing income received by Gulf of Mexico oyster fishers was from species other than oysters, while Apalachicola oyster fishers received only 11.7 percent of their fishing income from species other than oysters. Commercial oyster harvesters not currently harvesting multiple species face difficulties entering other commercial fisheries. Commercial harvest of species other than oysters requires differently constructed vessels, a restricted species endorsement and other endorsements and or certificates. 12
13 Historic Harvests Over 90 percent of Florida commercially harvested oysters and approximately ten percent of the oysters nationally are produced in the Apalachicola Bay System. Historic harvests, from 1960 to 1985, albeit under a different data collection methodology, reported harvests averaging 3.8 million pounds landed per year in Franklin County. Recently, annual Gulf of Mexico dockside landings of oyster meat from 2007 through 2011 averaged 2,697,196 pounds (Table 2), approximately 90 percent of which comes from the Apalachicola Bay System, with a dockside landings in dollar value from 2007 through 2011 averaging $7,347,115 (Table 3). Landings data used in this report is from Wholesale Dealers in 11 of the 23 Florida coastal Gulf counties (Bay, Citrus, Dixie, Escambia, Franklin, Gulf, Lee, Levy, Santa Rosa, Wakulla and Walton) and two inland counties (Alachua and Suwannee). These were the Gulf Counties reporting landings data in 2007, 2008, 2009, 2010 and or Monthly landings data from the Gulf of Mexico ranged from 150,000 to 300,000 pounds. Raw landings data summaries are provided in Appendix 5. Landings data and anecdotal information suggests that wholesalers limit landings to ten bags per fisher daily in a form of self-regulation based on market demand. In addition, in the Apalachicola Bay System, in 2007 through 2011, a DACS-conducted count of oyster harvesting vessels actively harvesting on the survey day (Figure 1) showed an average of 184 vessels (range of vessels 70 to 421). Therefore, on any given day, only about 20 percent of the license holders were probably active. In the summer of 2010, the period of time for which the state of Florida relaxed its weekend harvest rule, the number of daily fishers reported by DACS was roughly half of normal, approximately 100 boats per day, and total landings were less than the most recent five year average. As discussed in the following section, the data suggests that actions taken by the state of Florida to ease the economic burden of the perceived impact of DWH were not enough to compensate for the reduced demand for seafood, as harvests that summer were still reduced. 13
14 For the period 2007 through 2012, the number of license holders and the number of reported trips has roughly doubled, but the harvests have held steady at approximately 2,000,000 pounds. Two potential explanations include reduced catch per unit effort or socioeconomic shifts. The best fishery-independent data available suggests there was a slight downward trend in available resources on the most commonly fished reefs, but this decline was not universal and was not sufficient for most fishers to seek alternate reefs, such as those commonly restored or cultched by DACS. The very short-term data indicated that the abundance climbed from 2009 through 2011, though perhaps not significantly. Again, this evidence, while circumstantial, suggests that any decline in oyster abundance, if it occurred, was less influential than the self-regulation drivers for this fishery. Further evidence from the DACS fisheryindependent data shows only a weak relationship between the abundance of sublegal oysters (25-75mm) and legally harvestable oysters and that in the 2011 survey, sub-legal oysters were at the highest level ever recorded. There are many hypotheses for the increase in license holders without large increases in harvests. Most relate to the perception that programs such as crop insurance for aquaculture and the Emergency Disaster Recovery Program (EDRP) process will require proof that the person has worked in the fishery to receive subsequent aid. Similar theories could be related to the perception that quotas may prevent entry if regulations are tightened on the fishery. Modifications to Harvest Related to Deep Water Horizon Oil Spill In response to the 2010 oil spill in the Gulf of Mexico, Florida s Governor Rick Scott issued Executive Order Numbers 10-99, (Appendix 6) and numerous subsequent ones extending these Orders. The Orders specify that the Governor delegates to agencies: to deviate from the statutes, rules, ordinances and orders they administer, and I delegate to such agencies the authority to waive or deviate from such statutes, rules and ordinances or orders to the extent that such actions are needed to cope with this emergency. Oil that was transported into oyster harvesting areas in Louisiana and Mississippi required these areas to be closed to harvesting for purposes of human health protection. Reopening 14
15 criteria developed for oyster harvesting areas was very stringent and there were concerns that it would take a long time to reopen such areas to harvesting if they were closed. The concern was valid as seen by extended closures of oyster harvesting areas in Louisiana and Mississippi. Based on those concerns, the oyster industry requested FWC and DACS to consider modifying harvest seasons in the Pensacola Bay System and the Apalachicola Bay System. In response, DACS requested that FWC open the Pensacola Bay System during the seasonally closed months of July through September; FWC opened the Pensacola Bay System for harvesting from July 3, 2010, to September 30, 2010, a total of 99 days more than the typical season. DACS requested that FWC open the Apalachicola Bay System summer area (June, July and August) early; FWC opened the Apalachicola Bay System for harvesting from May 21, 2010, through June 1, 2010, a total of 11 extra days. DACS requested that FWC open the Apalachicola Bay System summer area (June, July and August) on Saturdays and Sundays; FWC opened the Apalachicola Bay System summer area for harvesting on Saturdays and Sundays from June 5, 2010, through August 31, 2010, a total of 26 extra days. DACS requested FWC open the Apalachicola Bay System winter area (September through May) early; FWC opened the Apalachicola Bay System winter area for harvest from June 18, 2010, through August 31, 2010, a total of 73 extra days. No request was received for modification of any other oyster regulations (like size limits, bag limits or gear type). Such requests would not have been deemed in the best interest of oyster conservation. In addition, FWC extended the 2010 license year from July 1, 2010, through September 30, 2010, for renewal of existing Saltwater Products Licenses and Wholesale Dealer Licenses. DACS extended the 2010 Apalachicola Bay Oyster Harvesting License from July 1, 2010, through August 31, 2010, for existing license holders and waived any associated late fee. There have been reports of extensive overharvest and undersized harvest of oysters, but none of the harvest changes would have changed daily limits, size limits or open closed harvest areas. Much of the misconception about overharvest likely stems from actions taken by Florida, which may have diverted law enforcement to DWH response activities. There are also no actual data that support these claims. Review of commercial landings shows the pounds of oyster meat landed in 2010 (2,163,474) were less than the pounds landed in 2009 (2,874,959), 2011 (2,990,916), and the most recent 15
16 2007 to 2011 five year average (2,697,196). Pounds of meat landed in 2010 were less than landings in 2007, 2008, 2009 and 2011 (Table 2). Reduced landings for 2010 might be explained by: (1) depressed market demand resulting from lack of consumer confidence in the safety of Gulf of Mexico seafood due to the oil spill and/or (2) oyster harvesters participation in the oil spill vessels of opportunity program protecting the coastline from spilled oil. Harvest levels for 2011 and 2012 (preliminary) are representative of the harvest levels in 2007, 2008 and Florida s emergency actions in response to the oil spill did not result in increased landings or overharvest. After the 2010 temporary oyster season modifications in response to the oil spill, all oyster harvesting regulations reverted back to those previously in place. Current regulations are provided in Appendix 4. Oyster harvesting 7 days a week during the Apalachicola Bay System summer area (June, July and August) was implemented June 1, Recent Harvest Declines As stated earlier, monthly Apalachicola landings hover around 200,000 pounds, exhibit some seasonal decline in summer, and some variability year-to-year, but are quite variable on monthto-month basis, and are probably reflective of vagaries of the marketplace. The harvest observed in the winter season was comparable to the winter season, with around 250,000 pounds per month, or slightly more than the five year average, but not exceptionally so. Even the initial drop from August to September 2012 is not unprecedented, as the fishery is subject to wide monthly swings. However, the continued decline through February 2013, with the accompanying decline in trips (an indication that current catch per trip is not profitable), the indication from the industry that no or limited harvestable stock is available, and the huge decline in sub-legal oysters available to grow into 2013 harvestable oysters (as indicated in the DACS fishery-independent surveys), suggests that a collapse of the fishery has occurred. The Apalachicola Bay Oyster Situation Report published by the University of Florida (2013) indicated that the 2012 decline in oyster landings in the second half of the year was 16
17 unprecedented during the period in which they analyzed data, and likely involved recruitment failure or high mortality of small oysters from predators or some type of episodic disease or pathogen. Although there is concern about harvest of sub-legal sized oysters, modeling conducted by UF researchers lead them to believe that there is no evidence that harvest of sub-legal oysters in the catch has caused the trends we see in the data unless the sub-legal harvest has been unregulated and extremely high. It is FWC s contention that while harvest of sub-legal oysters does occur, the fact that the Apalachicola oyster satisfies the half-shell oyster market at competitive prices is testament to the conclusion that this practice is not unregulated, and that it is not occurring at rates that substantially differ from the past. The Report also noted that recruitment overharvest did not play in the fishery failure as the decline in sub-legal abundance, sudden as it was, cannot be attributed to reduced spawner abundance (i.e., adult population) and/or larval supply based on the available data we have examined. Exacerbated Natural Disaster As previously stated, the severe and cumulative impacts of natural and manmade disasters have taken a tremendous biological and economical toll on Florida s Gulf Coast oyster habitat, oyster resources, oyster harvesters and oyster processors. The report focuses on the impacts to oyster habitats and oyster resources from prolonged low river discharges during Much of the information presented in this report is from the Apalachicola Bay System. Other Florida Gulf of Mexico bay systems are similarly situated. Overview of Drought and River Discharge River flows into bays are important. Natural river flows are variable annually and seasonally and affect bay productivity by providing essential nutrients that form the base of the food web. Natural seasonal variation in freshwater flows is needed to keep river channels, floodplains and bays healthy and productive. Seasonal floodplain inundation is essential for nutrient transport to bays. For example, in the Apalachicola River Basin there are more than 400 miles of floodplain sloughs, streams and ox-bow lakes. River flows moderate salinity in bays and provide 17
18 nutrients for the bay s food web that are essential for oyster survival and growth. Within bay systems, salinity determines distribution of marine habitats and organisms. Extended low river flows increase bay salinity resulting in reduction of oyster habitat and oysters due to the lack of nutrients and food, increased predation and increased natural disease. Higher salinities also typically result in decreased survival of settled spat, and all subsequent life stages. River flow affects/controls the residence time of freshwater in bay systems. For example, based on historic average, the Apalachicola River accounts for 45 percent of the fresh water flow on the western coast of Florida. Extreme extended low river flows during the summer used to be very rare but are now very common. For example, from 2008 through 2012, very low daily flows (<6,000 cubic feet per second recorded at Chattahoochee, Florida) during the summer (June 1 through September 30) for the Apalachicola River were 40 percent more common than during the summer from 1989 through 2007 (60 percent greater than 1975 through 1988 and 85 percent greater than 1923 through 1955) (Figure 2). Upstream consumption in Georgia has reduced the amount of water flowing to the Apalachicola River. This consumption occurs primarily in the form of municipal and industrial withdrawals from the Chattahoochee River near Atlanta and primarily to support agriculture use throughout the Lower Flint Basin. Consumption is somewhat seasonal but typically peaks during drought conditions. During low flow periods, upstream consumption significantly diminishes the volume of water reaching the Apalachicola River. In addition, the U.S. Army Corps of Engineers (COE) controls the flows on the Apalachicola- Chattahoochee-Flint River Basin system (Figure 3) through three major reservoirs on the Chattahoochee River. During the timeframe, the COE s Revised Interim Operating Procedures (ROIP), resulting in lower flows for longer duration (figure 4). The resulting significantly lower flows were inadequate to lower salinity, causing increased oyster disease, predators and decreased oyster health. Figures 5, 6, 7 and 8 provide examples of how river flow and river management actions impact salinity on oyster reefs in Apalachicola Bay. 18
19 These factors substantially exacerbate the impact of drought conditions, which were evident from (Figure 9). Recovery Since 1986, the Gulf States Marine Fisheries Commission (GSMFC) has had the responsibility of administrative support and coordination of the Gulf State-Federal Fisheries Management Program. The Interjurisdictional Fisheries Program promotes interjurisdictional fisheries management among the Gulf States through the cooperative development of fishery management plans (FMPs). The states are requested to implement FMP recommendations through consistent regulations wherever possible and to address research and data needs with cooperative collection efforts. In 2012, the GSMFC completed FMPs for oysters (GSMFC, 2012). The Oyster FMP provides the most comprehensive and recent information, practices and recommendations for the Gulf of Mexico, including the West Coast of Florida. The growth rate of oysters is initially as high as 10 mm per month, but decreases with age. Growth is highest during the first six months after setting and gradually declines throughout the life of the oyster (Heffernan 1962, Hofstetter 1962, 1977, Galtsoff 1964 and Berrigan 1988). In the Gulf of Mexico, oysters typically reach harvest size (76 mm or 3 inches) in 18 to 24 months from setting (Berrigan 1988, 1990). For example, in 1985, commercial quantities of oysters from the Apalachicola Bay System were destroyed by Hurricane Elena. Under newly established oyster recovery regulations (68B , Florida Administrative Code), limited commercial oyster harvesting was permitted beginning about one year later. Full recovery took five-years after significant oyster reef construction and rehabilitation activities. Recovery was dependent on requested and granted federal disaster funding. Florida began cultch planting on public reefs as early as 1914 to help ensure high productivity from its public reefs and has maintained an aggressive shell-planting program since Because Florida s public oyster reefs account for percent of the oysters landed in the state, management has focused on increasing production from public reefs. Resource-directed 19
20 management practices have included oyster reef construction and rehabilitation (by depositing processed and mined shells on depleted oyster reefs), transplanting juvenile oysters to more favorable growing waters, and relaying market-sized oysters to minimize public health risks. Enhancing substrate by replacing cultch material (hard substrate suitable for attachment of settling oysters) has long been accepted as a beneficial management practice, and gives resource managers the opportunity to mitigate resource losses, increase production, and contribute direct economic benefit to fisheries-dependent communities (Whitfield (1973), Futch (1983) and Berrigan (1988, 1990)). Using the Apalachicola Bay System as an example, approximately 4.2 million bushels of cultch and oyster shells were planted between 1949 and 1972 (Whitfield 1973), another 1.7 million bushels were added during (Futch 1983), and more than 3.5 million bushels were deposited from (FDACS unpublished data). Whitfield (1973) estimated that the potential annual value of shell plants could approximate $3,200 per acre based on a potential harvest of 400 bushels per acre. In a later report, Berrigan (1990) estimated a benefit cost ratio of almost 21:1 and a benefit of $8,500 per acre for restored oyster reefs in Apalachicola Bay. Increases in river flows and reductions in upstream consumption are required for environmental conditions on the Florida Gulf Coast to be more favorable to oyster survival. As an example, in January 2013 through mid-april 2013, the Apalachicola River basin received large amounts of rainfall resulting in much needed increased freshwater transport to the Bay System. Therefore, recovery of oyster resources is probable if the river is allowed to approximate the historic conditions under which oyster populations evolved. It is expected that under ideal conditions, full recovery from this fishery failure will take five years and a significant fiscal investment in oyster reef construction and rehabilitation activities as well as other types of assistance. Recovery time will be delayed if the number of low river flow days in future years remains high or increases. A detailed recovery plan and assistance needs will be developed by FWC in consultation with the oyster industries, local governments, DACS, DEP, UF and the appropriate Florida Water Management Districts. This recovery plan will exceed the fiscal capabilities of the State of 20
21 Florida, hence the formal request for assistance pursuant to Section 312(a) of the Magnuson- Stevens Fishery Conservation and Management Act. 21
22 Impacts to Coastal Oyster Habitats Resource Surveys The Florida Department of Agriculture and Consumer Services (DACS) has conducted oyster resource surveys on the principal oyster-producing reefs in the Apalachicola Bay System since This information is used by Florida resource managers to reliably predict trends in oyster production; to monitor oyster population dynamics, including recruitment, growth, natural mortality and standing stocks; and to determine the impacts of climatic events such as hurricanes, floods and droughts on oyster resources. Data from oyster population sampling allows resource managers to compare the relative condition of standing stocks over time using a defined sampling protocol. The oyster resource survey protocol is provided (Appendix 7). Because the main goal of the sampling is to predict trends in the commercial fishery, the sample protocol is not random, but concentrated where populations of oysters exist. The Standard Oyster Resource Management Protocol (SORMP) provides a calculation to estimate production based on the density of legal size oysters collected during a defined sampling interval. Production estimates exceeding 400 bags of oysters per acre is applied as an indicator of healthy oyster reefs capable of sustaining commercial harvesting. Continuous monitoring and data analyses have allowed resource managers to develop a scale using defined sampling protocol to determine the relative condition of oyster resources based on estimated production parameters. The Standard Oyster Resource Management Protocol (SORMP) provides that estimated production exceeding 400 bags of oysters per acre is applied as an indicator of healthy oyster reefs capable of sustaining commercial harvesting. Accordingly, oyster populations are 1) capable of supporting limited commercial harvesting when stocks exceed 200 bags per acre, 2) below levels necessary to support commercial harvesting when stocks fall below 200 bags per acre, and 3) considered depleted when marketable stocks are below 100 bags per acre. Generally, production from Cat Point Bar has been the most accurate indicator of oyster production in Apalachicola Bay, but East Hole Bar and St. Vincent Bar are also reliable indicators of the condition of oyster resources throughout 22
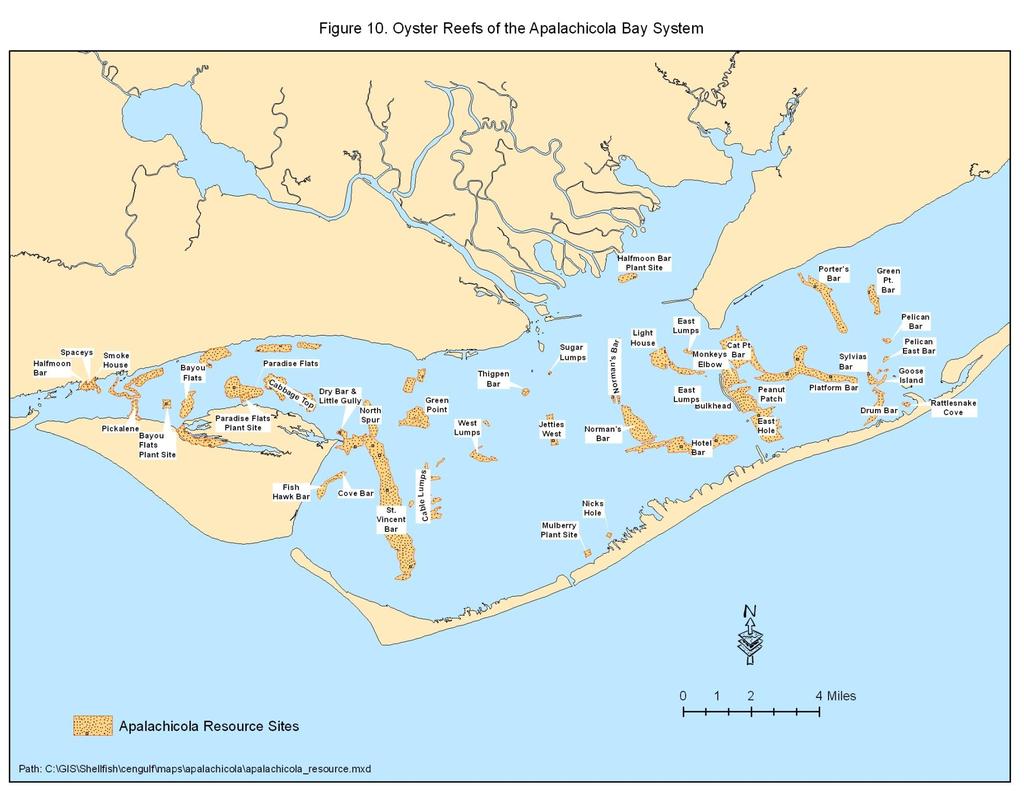
23 the Bay. This scale forms the basis for the Standard Oyster Resource Management Protocol provided in Subsection 68B , FAC, which has been used as the criteria for setting the number of harvesting days in the Winter Harvesting Season in Apalachicola Bay. DACS conducted oyster resource assessments on the commercially important oyster reefs in Apalachicola Bay during July 2012 (Appendix 1). DACS conducted follow-up resource assessments in October Figure 10 depicts the oyster reefs of the Apalachicola Bay System. Commercially important reefs included Cat Point Bar, East Hole Bar and the St. Vincent Bar and Dry Bar reef complex. Oyster resource assessments were also conducted on three recently rehabilitated reefs, and on shallow and intertidal reefs in St. Vincent Sound. Production estimates for July 2012 from Cat Point Bar (287 bags per acre) and East Hole Bar (294 bags per acre) were the lowest production estimates reported in the past 20 years prior to the opening of the Winter Harvesting Season (winter seasons are September 1 through May 31 in the Apalachicola Bay System, Wakulla County, Levy County and Dixie County; October 1 through June 30 for all other Gulf Coast areas). Further decline in production estimates were documented for October 2012 from Cat Point Bar (115 bags per acre) and East Hole Bar (50 bags per acre). Similarly, production estimates from St. Vincent Bar and Dry Bar (bags per acre) demonstrated depressed production estimates. Further decline in production estimates were documented for October 2012 from Dry Bar (28 bags per acre). Estimated oyster population parameters for Cat Point Bar, East Hole Bar and St. Vincent Dry Bar were below levels generally observed on these reefs prior to opening the Winter Harvesting Season, and suggest that stocks are not sufficiently abundant at this time to support commercial harvesting throughout the Winter Harvesting Season. Therefore, in accordance with FAC 68B , commercial harvest of oysters from Apalachicola Bay was suspended during the weekends for most of the winter season. Factors affecting estimated production parameters on individual reef complexes are discussed later in this section. Cat Point Bar and East Hole Bar have historically been the primary producing reefs in Apalachicola Bay. These reefs form a contiguous reef system (except for the Intracoastal Waterway), which extends north to south across St. George Sound and separates the sound 23
24 from Apalachicola Bay. Over the past 20 years, landings from these reefs have been critical to supporting the oyster fishery in the region. Oyster density and estimated production showed marked declines in July 2012 and in October 2012 on Cat Point Bar when compared with 2011 (Figure 11). Estimated production declined from 417 bags per acre in August 2011 to 287 bags per acre in July 2012 and declined to 115 bags per acre in October 2012 (Table 4). Oyster densities decreased substantially from 430 oysters per square meter in August 2011 to 64 oysters per square meter in July 2012 and to 40 oysters per square meter in October 2012 (Table 4). The decrease in oyster density reflects poor recruitment, as well as severely reduced number of oysters in the juvenile size classes, and is indicative of the degraded quality of reef substrate and structure (Figures 11 and 12). Cat Point and East Hole Bar have been subject to a combination of factors that have adversely affected oyster populations, oyster reef habitat and the oyster fishery. Oyster populations over much of the reef area are depleted and the quality of the substrate is degraded to a point where spat settlement and recruitment have been disrupted. Stress associated with prolonged high salinity and high natural mortality and predation has markedly reduced standing stocks of juvenile, sub adult and adult oysters (Figure 12). Fishing efforts merely exacerbated this natural mortality. The Dry Bar and St. Vincent Bar complex is a large contiguous reef system in western Apalachicola Bay. This reef complex provides a substantial portion of the Bay s landings during normal years, but fishing pressure was sporadic during 2011 and The estimated production for Dry Bar-St. Vincent (Table 4) indicated a substantial reduction from 323 bags per acre in August 2011 to 215 bags per acre in July 2012 and further reduction to 28 bags per acre in October Samples were collected from the little Gully area on Dry Bar, because no live oysters were collected on St. Vincent Bar. St. Vincent Bar, extending from Dry Bar southward was considered to be depleted of marketable oysters (Figure 12). The oyster population on St. Vincent Bar was likely decimated by stress associated with high salinity, disease and predation. Fishing pressure has declined as a result of reduced standing stocks of market-size oysters over the entire reef complex during the past two years. The current condition of oyster resources on Dry Bar is not expected to be at levels that will sustain commercial harvesting during the Winter Harvesting Season. 24
25 Estimated production parameters for the reef complexes in the western portion of the Bay and the area called the Miles (Spacey s Flats, Eleven Mile Bar, Picolene Bar) indicate that standing stocks of market size oysters are at various levels. Standing stocks on some reefs will support commercial harvesting, while other reefs show signs of severe stress and depletion. Oyster reefs, including North Spur, Green Point and Cabbage Lumps Plant Sites are in moderately good condition, with standing stocks and production at levels that will support limited commercial harvesting. The October 2012 resource assessment showed production estimate declines in bags per acre from North Spur and Green Point. These plant sites have been planted with processed oyster shells within the last three years, and the substrate remains in good condition; size frequency distributions are typical of healthy oyster populations. However, these reefs are small and overall production will be limited. Also, oysters on these reefs will likely be subject to intense predation while salinity levels remain high. Oyster populations on shallow and intertidal reefs in the Miles are also severely stressed, showing signs of intense predation and natural mortality. Bars in northwestern Apalachicola Bay and eastern St. Vincent Sound, including Green Point, North Spur and Cabbage Lumps are more strongly influenced by river flows than bars located further away from the river mouth. Prevailing flows and circulation patterns move plumes of freshwater westward from the river over these reefs before they are dispersed throughout the Bay and St. Vincent Sound. Size frequency distributions for oyster standing stocks are strong indicators of the health of oyster populations and are useful for predicting fishery trends. Size distributions among oyster populations are used to evaluate recruitment to the population, recruitment of juveniles to market size, growth, survival and potential production. Accordingly, size frequency distributions can be used to evaluate oyster depletion events. Current analyses of size frequency distributions and oyster standing stocks indicate that oyster populations on the major producing reefs in Apalachicola Bay are experiencing an on-going depletion event. 25
26 Summary Resource Surveys The DACS sampling for East Hole Bar in October 2012 resulted in 50 bags per acre production estimate. October 2012 sample results for Dry Bar were 28 bags per acre. The SORMP indicates that oyster populations are considered depleted when marketable oyster stocks are below 100 bags per acre. October 2012 sampling at Cat Point Bar resulted in 115 bags per acre. The SORMP indicates oyster populations are considered insufficient to support commercial harvesting when stocks are below 200 bags per acre. October 2012 sampling at North Spur resulted in 215 bags per acre. The SORMP indicates that oyster populations exceeding 200 bags per acre, but less than 400 bags per acre, are capable of supporting limited commercial harvesting. These reductions formed the basis of the DACS report which predicted that stocks were not sufficiently abundant to support commercial harvesting throughout the Winter Harvesting Season. These reduced levels of harvestable oyster stocks are insufficient to support commercial harvesting. Average densities of oysters greater than 25 mm in length per square meter for 2012 (July and October averaged) were compared with the previous five-year average (2006 or 2007 through 2011) densities for major commercial reefs Cat Point Bar, East Hole Bar and Dry Bar. Reductions were 75.1 percent at Cat Point Bar, 77.2 percent at East Hole Bar and 85.9 percent at Dry Bar. The overall reduction was 80.1 percent. These reductions formed the basis of the DACS report which predicted that stocks were not sufficiently abundant to support commercial harvesting throughout the Winter Harvesting Season. Comparing only October 2012 sampling data with the previous five-year average, densities of oysters greater than 25 mm in length per square meter percent reductions were 80.8 percent at Cat Point Bar, 79.6 percent at East Hole Bar and 92.9 percent at Dry Bar. The overall reduction was 85.4 percent. This sudden and dramatic downward reduction in oyster biomass greater than 25 mm indicates that recovery of the fishery will take time. Average density of legal sized oysters per square meter for 2012 (July and October averaged) were compared with the previous five-year average (2006 or 2007 through 2011) densities for 26
27 the major commercial reefs of Cat Point Bar, East Hole Bar and Dry Bar. Reductions were 58.7 percent at Cat Point Bar, 66.9 percent at East Hole Bar and 75.8 percent at Dry Bar. The overall reduction was 67.3 percent. These reductions formed the basis of the DACS report which predicted that stocks were not sufficiently abundant to support commercial harvesting throughout the Winter Harvesting Season. Comparing only October 2012 sampling data with the previous five-year average, densities of legal sized oysters per square meter percent reductions were 76.6 percent at Cat Point Bar, 90.3 percent at East Hole Bar and 99.3 percent at Dry Bar. The overall reduction was 87.2 percent. This sudden and dramatic downward reduction in harvestable oyster biomass indicates that commercial oyster harvesting will be limited. Impacts to Populations Data analyses and observations on the major reef complexes showed substantial losses of oyster populations over the past two years, with severe declines in oyster densities, standing stocks and production estimates. Declining populations can be attributed to less than optimal environmental conditions in the Bay, and increased predation and mortality and weak recruitment. Fishing efforts merely exacerbated this mortality. It is evident from divers observations that many reefs in Apalachicola Bay are showing the negative effects of decreased freshwater flow rates from the Apalachicola River over the past two years, including depressed recruitment and increased oyster mortality (predation, disease and stress associated with high salinity regimes). Additionally, the long-term impairment of reef structure (reef elevations, shell matrix and shell balance) is of serious concern. Each of the factors contributing to oyster depletion in Apalachicola Bay is discussed below. Low Freshwater Inflow and Elevated Salinity Adverse environmental conditions can have a devastating effect on oyster populations; high salinity is among the most detrimental factors. Because oysters are sessile animals, they are not capable of moving when environmental conditions become less than optimal or sometimes lethal. While oysters can tolerate a range of salinities, prolonged exposure to less than optimal conditions will adversely impact affected 27
28 populations. Exposure to elevated salinities for extended periods, affects reproductive potential, spatfall, recruitment, growth and survival. River discharge is essential for productive oyster populations in Apalachicola Bay, and influences four critical determinants of survival. First, survival depends upon salinity regimes that are suitable for oysters to reproduce, grow and survive. Freshwater discharge into the Bay is essential, as productive oyster populations require a balance of fresh water and marine waters. Intermediate salinities, within the oyster s tolerance limits, is the single most important factor influencing oyster populations in Apalachicola Bay, providing the most energetically favorable conditions for growth and especially survival of pelagic larvae. Second, flooding in the flood plain and river discharge into the Bay are essential for supplying nutrients and detritus necessary to nourish and sustain food webs and trophic dynamics within the estuarine system, particularly the production of phytoplankton. Third, river discharge is a critical factor driving fluctuations in salinity levels that prevent destructive predators with marine affinities from becoming established in the Bay. Periodic freshening reduces the abundance of predators and both detrimental factors appear to have a lag time of at least one to two years to fully manifest their impacts. Fourth, the prevalence of at least one critical disease, dermo (Perkinsus marinus), and probably many parasites, flourishes when higher than normal salinities persist for long periods without periodic freshets. The critical influence of river discharge was severely diminished during the past two years. The region and much of the drainage basin have been subject to extensive drought during 2011 and These conditions exacerbated by upstream consumption and reservoir operations resulted in low river stages and low river discharge rates. Although, environmental conditions improved with relatively normal river discharge in 2009 and early 2010, and abundant spatfall was reported on Cat Point and East Hole Bars during 2010, oyster resources have not rebounded completely. Low flow conditions have persisted in the Apalachicola River Basin since August Decreased river discharge has contributed to stress on oyster populations in Apalachicola Bay. Reduced freshwater input into Apalachicola Bay has seriously affected oyster populations in the Bay. Poor recruitment and poor survival can be directly attributed to a prolonged high salinity 28
29 environment, which is also confirmed by the presence of marine predators, primarily stone crabs and Florida rock snails (oyster drills). The predators are present in great numbers and are currently overwhelming oyster populations throughout Apalachicola Bay. Petes et al. (2012) and Wilber (1992) investigated the effects of reduced freshwater flows on oyster populations in Apalachicola Bay and reported adverse impacts resulting from low river flows. Natural Mortality and Predation The combination of high salinity and high water temperatures are known to severely stress oyster populations and may result in massive mortality events. It is highly likely that these environmental factors have contributed substantially to natural mortality and low recruitment in the Bay. High salinity and high water temperatures also correlate with the increased prevalence and intensity of the oyster parasite, Perkinsus marinus. This parasite (dermo) is often associated with oyster mortality in the hotter summer months and is commonly described as Summer Mortality Syndrome in Florida. The Department participates in the Oyster Sentinel Program in the Gulf and monitors the presence and intensity of dermo in oysters in Apalachicola Bay. Samples collected in 2012 were not infected with higher than normal intensities, but typically high prevalence, about 97 percent, may make these oysters more susceptible if a discrete stress occurred in late summer. Observations by divers confirmed the presence and abundance of stone crabs (Menippe mercenaria), on the primary oyster reefs in Apalachicola Bay. Stone crab burrows are easy to recognize and the appetite of these destructive predators is obvious. Stone crab burrows are surrounded by living and dead oysters, the result of crabs actively foraging and bringing live oysters to their burrows. The shells of devoured oysters are also present and form a ring around these burrows. Examining dead oyster shells provides confirmation of the crushing action of stone crabs on the shell of oysters. Stone crabs are considered the primary predators of oysters when salinities remain high for extended periods and crab populations become established on oyster reefs. Observations and sampling confirmed the presence and abundance of the Florida rock snail (Stramonita haemastoma; formerly Thais haemastoma), a destructive snail commonly referred to as an oyster drill. Oyster drills are considered one of the most serious oyster predators along Florida s Gulf Coast, and have become established in 29
30 Apalachicola Bay over the past two years. Reports from oystermen suggest that drills are more abundant than at any time in recent memory. It appears that drill populations are moving farther into the estuary as oyster populations in the more marine portions of the Bay are depleted. High numbers of drills were found wherever viable oyster populations were observed. The presence and establishment of snail populations correlate with prolonged high salinity waters. It is also disturbing that drills are completing their life cycles within the estuary, since egg cases, juvenile, sub adult and adult snails are abundant on the oyster reefs. Additionally, the Florida crown conch (Melongena corona), was commonly observed on the oyster reefs. These conchs are also known to be serious oyster predators with marine affinities. Mud crabs of various species are also common predators on oyster reefs, generally attacking spat and smaller juvenile oysters. Increased stress associated with high salinity regimes act to exacerbate the level and intensity of predation by weakening oysters. Prolonged periods of high salinity result in natural mortality from predation which can have a significant impact on oyster populations and result in serious economic losses, to commercial oyster fisheries. The presence and abundance of marine predators on oyster reefs in Apalachicola Bay were visually observed during the long duration of high salinity conditions within the estuary. Harvesting Pressure Declining oyster population parameters can be associated with harvesting, as well as environmental influences and natural mortality. Reported oyster landings for Franklin County increased marginally over 2010 in production. Harvesting levels were not excessive under normal environmental conditions. Harvesting pressure is most evident when environmental conditions are less than optimal, recruitment is low, and natural mortality is high. The Apalachicola Bay Oyster Situation Report published by the University of Florida indicated that the 2012 decline in oyster landings in the second half of the year was unprecedented during the period in which they analyzed data, and likely involved recruitment failure or high mortality of small oysters from predators or some type of episodic disease or pathogen. Although there is concern about illegal harvest of sub-legal sized oysters, modeling conducted by UF researchers lead them to believe that there is no evidence that harvest of sub-legal oysters in the catch has caused the trends we see in the data unless the sub-legal harvest has been unregulated and extremely high. It is our contention that while the harvest 30
31 of sub-legal oysters does occur at low rates, the fact that the Apalachicola oyster satisfies the half-shell oyster market at competitive prices is testament to the conclusion that this practice is not widespread, and that it is not occurring at rates that differ from the past. The Report also noted that recruitment overharvest did not play a role in the fishery failure as the decline in sub-legal abundance, sudden as it was, cannot be attributed to reduced spawner abundance (i.e., adult population) and/or larval supply based on the available data we have examined. Summary impacts to Populations The substantial losses of oyster populations over the past two years, with severe declines in oyster densities, standing stocks and production estimates can be attributed to less than optimal environmental conditions. Reduced river discharge rates and high salinity have resulted in increased predation and mortality and weak recruitment. Fishing efforts merely exacerbated this mortality. The long-term impairment of reef structure (reef elevations, shell matrix and shell balance) is of serious concern. Conclusion These sudden and dramatic reductions of sub-legal and legal sized oyster biomasses have resulted in a commercial fishery failure and a serious disruption affecting future production. The causes of this commercial fishery failure were the direct result of prolonged low freshwater inflows into the Bay due to upstream consumption and water management policies, exacerbated by prolonged drought conditions. The cause was not related to fishery management. 31
32 Impacts to Oyster Marine Resources Landing Revenues The landing data (value in dollars and pounds of oyster meat) evaluated in this report were reported by Wholesale Dealers in 11 of the 23 Florida coastal Gulf counties (Bay, Citrus, Dixie, Escambia, Franklin, Gulf, Lee, Levy, Santa Rosa, Wakulla, Walton) and two inland counties (Alachua, Suwannee) from January 2007 through February 2012 (FWC Marine Fisheries Information System, 2013). Raw data landing summaries are provided in Appendix 5. This landing data represents the oyster production from the Florida Gulf of Mexico for January 2007 through February In an effort to avoid unnecessary delay in the disaster review process, FWC and the National Oceanic and Atmospheric Administration National Marine Fisheries Services (NOAA Fisheries) agreed on the following data and procedures for evaluating the value dollar decline to the commercial oyster industry on the Florida Gulf Coast. FWC documented landing data dollar value for the months of September 2012 through February 2013 (Table 5). These dollar values were compared with the previous five-year average baseline monthly landing dollar values (Tables 6 and 7). Monthly baseline dollar values for September through December for all years were adjusted to the corresponding 2012 month dollar value. Monthly baseline dollar values for January through February of all years were adjusted to the corresponding 2013 month dollar value. The United States Bureau of Labor Statistics Consumer Price index was used to adjust dollar values (Appendix 8). The percentage reduction dollar value for each month was determined (Table 8). The percentage reduction in oyster dollar value has rapidly declined from September 2012 through February 2013 (September 9.1 percent, October 18.5 percent, November 36.9 percent, December 63.5 percent, January 55.4 percent, February 70.9 percent) compared with the respective previous five-year monthly averages. This reduction in value confirms the predictions of the DACS report that stocks were not sufficiently abundant to support commercial harvesting throughout the Winter Harvesting Season. 32
33 Due to unfavorable environmental conditions in Florida Gulf Coast bay systems, this documented monthly downward dollar value trend is expected to continue throughout the Winter Harvesting Seasons, ending in some Counties on May 31, 2013 and in other Counties on June 30, The overall percentage reduction in dollar value for the months of September 2012 through February 2013 was 43.2 percent compared with the respective previous five-year monthly averages. The overall downward percentage reduction trend in dollar value demonstrated September 2012 through February 2013 has significantly exceeded 35 percent. Further reduction in dollar value is expected to continue as each additional month is evaluated. Figure 13 shows the observed percentage reduction in dollar value for September 2012 through February Linear regression analysis predicts 87.0 percent reduction in dollar value for March 2013, 99.8 percent reduction in dollar value for April 2013 and 100 percent reduction in dollar value for May through August 2013 (R 2 = 0.91). Pounds of Meat Landed Also evaluated was the dependent fishery landing data for pounds of oyster meat landed for the months of September 2012 through February 2013 (Table 9). Pounds of oyster meat landed for the months of September 2012 through February 2013 were compared with the previous five-year average monthly pounds of oyster meat (Tables 10 and 11). The percentage reduction in harvest for each month was determined (Table 12). The reduction in pounds of oyster meat harvested has rapidly declined from September 2012 through February 2013 (September 28.6 percent, October 42.4 percent, November 54.8 percent, December 71.6 percent, January 66.3 percent, February 79.6 percent) compared with the respective previous five-year monthly averages. This reduction confirms the predictions of the DACS report that stocks were not sufficiently abundant to support commercial harvesting throughout the Winter Harvesting Season. 33
34 Due to unfavorable environmental conditions in Florida Gulf Coast bay systems, this documented monthly downward trend in pounds of oyster meat landed is expected to continue throughout the Winter Harvesting Seasons, ending in some Counties on May 31, 2013, and in other Counties on June 30, The overall percentage reduction in pounds of oyster meat landed for the months of September 2012 through February 2013 was 58.0 percent compared with the respective previous five-year monthly averages. Figure 14 shows the observed percentage reduction in pounds of meat for September 2012 through February Linear regression analysis predicts 91.6 percent reduction in pounds of meat for March 2013 and 100 percent reduction in pounds of meat for April through August 2013 (R 2 = 0.92). The percentage reduction in pounds of oyster meat landed for the months of September 2012 through February 2013 (58.0 percent) was higher compared with the percentage reduction in dollar value for the months of September 2012 through February 2013 (43.2 percent). This difference is explained by the increase in price oyster harvesters have received as a result of the reduction in oysters harvested. Conclusion Based on the rapid and unprecedented reductions in oyster revenues and pounds of oyster meat harvested a commercial fishery failure is undeniable. As stated in the previous section, the causes of this commercial fishery failure were not fishery management related and were the direct result of prolonged low freshwater inflows into the Bay as a result of upstream consumption and water management actions, exacerbated by severe drought conditions. 34
35 FIGURES 1. Commercial Oyster Vessel Counts Apalachicola Bay 2007 through 2012 (DACS). 2. Apalachicola River Extreme Low Flows (FWC). 3. Apalachicola, Chattahoochee and Flint Rivers Drainage Basin (UF). 4. Apalachicola River Historic Baseline Flows (DEP). 5. Average Monthly River Flow and Average Monthly Salinity at Dry Bar 1992 through 2012 (DEP). 6. Average Daily River Flow and Average Monthly Salinity at Dry Bar 2003 through 2004 (Normal) (DEP). 7. Average Daily River Flow and Average Monthly Salinity at Dry Bar 2011 through 2012 (Drought) (DEP). 8. Average Salinity at Cat Point Bar Before RIOP ( ) and After RIOP ( ) (DEP). 9. Drought Southeast United States in November 2012 (UF). 10. Oyster Reefs of the Apalachicola Bay System. 11. Oysters per Quadrat (Cat Point 2007 through 2012). 12. Oysters per Quadrat (Cat Point-CP, East Hole-EH, and Dry Bar-DB Summer 2012 and Fall 2012 Surveys). 13. Observed Percentage Reduction in Dollar Value for September 2012 through February 2013 and Predicted Reduction in Dollar Value for March 2013 through August Observed Percentage Reduction in Pounds of Meat for September 2012 through February 2013 and Predicted Reduction in Pounds of Meat for March 2013 through August
36 Number of Boats Figure 1. Commercial Oyster Vessel Counts Apalachicola Bay 2007 through 2012 (DACS) Date 36

37 Average # of days <6,000 cfs, Apalachicola R. at Chattahoochee FL Average % duration <6,000 cfs, Apalachicola R. at Chattahoochee FL Figure 2. Apalachicola River Extreme Low Flows (FWC). Extreme Low Flow in Summer Previously Very Rare Now Very Common Duration of Summer Flows <6,000 cfs in low-flow and drought years* of four time periods 100% 80% 60% 40% 20% Pre-Lanier Post-West Point % *Low-flow and drought years: lowest 1/3 of years in each period based on average Jun 1-Sep 30 flow i.e. lowest 11 of 33 years , lowest 5 of 14 years , lowest 6 of 19 years , lowest 2 of 5 years

38 Figure 3. Apalachicola, Chattahoochee and Flint Rivers Drainage Basin (UF). Drainage Basin Boundary Lake Lanier AL GA Chattahoochee River Flint River FL Apalachicola River Apalachicola Bay 38
39 Flow (cubic feet per second) Figure 4. Apalachicola River Historic Baseline Flows (DEP). Apalachicola River Historic Baseline Flows 60,000 50,000 40,000 30,000 20,000 10,000 0 DRY DROUGHT 5000 CFS- COE Drought Operations Jan Feb Mar Apr May Jun Jul Aug Sep Oct Nov Dec 6 39
40 Jan-92 Aug-92 Mar-93 Oct-93 May-94 Dec-94 Jul-95 Feb-96 Sep-96 Apr-97 Nov-97 Jun-98 Jan-99 Aug-99 Mar-00 Oct-00 May-01 Dec-01 Jul-02 Feb-03 Sep-03 Apr-04 Nov-04 Jun-05 Jan-06 Aug-06 Mar-07 Oct-07 May-08 Dec-08 Jul-09 Feb-10 Sep-10 Apr-11 Nov-11 Jun-12 Riverflow (cfs) Salinity (ppt) Figure 5. Average Monthly River Flow and Average Monthly Salinity at Dry Bar 1992 through 2012 (DEP). Average Monthly Apalachicola Riverflow at Chattahoochee, FL and Average Monthly Salinity at Dry Bar ( ) Riverflow Dry Bar Salinity Linear ( Riverflow) Linear ( Dry Bar Salinity) Month 40
41 1/1/2003 2/1/2003 3/4/2003 4/4/2003 5/5/2003 6/5/2003 7/6/2003 8/6/2003 9/6/ /7/ /7/ /8/2003 1/8/2004 2/8/2004 3/10/2004 4/10/2004 5/11/2004 6/11/2004 7/12/2004 8/12/2004 9/12/ /13/ /13/ /14/2004 Salinity (ppt) River flow (cfs) Figure 6. Average Daily River Flow and Average Monthly Salinity at Dry Bar 2003 through 2004 (Normal) (DEP) Average Daily Riverflow at Chattahoochee, FL and Daily Salinity at Dry Bar ( ) Normal Riverflow Dry Bar Salinity Date 41
42 1/1/2011 1/22/2011 2/12/2011 3/5/2011 3/26/2011 4/16/2011 5/7/2011 5/28/2011 6/18/2011 7/9/2011 7/30/2011 8/20/2011 9/10/ /1/ /22/ /12/ /3/ /24/2011 1/14/2012 2/4/2012 2/25/2012 3/17/2012 4/7/2012 4/28/2012 5/19/2012 6/9/2012 6/30/2012 7/21/2012 8/11/2012 9/1/2012 9/22/ /13/ /3/ /24/ /15/2012 River flow (cfs) Salinity (ppt) Figure 7. Average Daily River Flow and Average Monthly Salinity at Dry Bar 2011 through 2012 (Drought) (DEP) Average Daily Riverflow at Chattahoochee, FL and Daily Salinity at Dry Bar ( ) - Drought Riverflow Dry Bar Salinity Date 42
43 1/1 1/15 1/29 2/12 2/26 3/11 3/25 4/8 4/22 5/6 5/20 6/3 6/17 7/1 7/15 7/29 8/12 8/26 9/9 9/23 10/7 10/21 11/4 11/18 12/2 12/16 12/30 Salinity (ppt) Figure 8. Average Salinity at Cat Point Bar Before RIOP ( ) and After RIOP ( ) (DEP). Average Salinity at Cat Point before ( ) and after ( ) Pre-RIOP Average Post-RIOP Average Residual Date 43

44 Figure 9. Drought Southeast United States in November 2012 (UF). 44
45
Texas Water Resources Institute
 Texas Water Resources Institute November/December 1982 Volume 8 No. 6 A Precise Environment By Lou Ellen Ruesink, Editor, Texas Water Resources Aquarium enthusiasts know just how particular fish are about
SOCIETAL GOALS TO DETERMINE ECOSYSTEM HEALTH: A FISHERIES CASE STUDY IN GALVESTON BAY SYSTEM, TEXAS
 SOCIETAL GOALS TO DETERMINE ECOSYSTEM HEALTH: A FISHERIES CASE STUDY IN GALVESTON BAY SYSTEM, TEXAS Anthony S. Pait, NOAA, National Centers for Coastal Ocean Science Thomas P. O Connor, David R. Whitall,
Status and Trends Report: 2012 Penaeid Shrimp Species Account FL FWCC FWRI SEDAR-PW6-RD July 2014
 Status and Trends Report: 2012 Penaeid Shrimp Species Account FL FWCC FWRI SEDAR-PW6-RD52 11 July 2014 Status and Trends Report: 2012 Penaeid Shrimps Species Account Florida Fish and Wildlife Conservation
The 2010 BP Oil Disaster Pacific States Marine Fisheries Commission 63 rd Annual Meeting August 24, 2010
 The 2010 BP Oil Disaster Pacific States Marine Fisheries Commission 63 rd Annual Meeting August 24, 2010 Larry Simpson Gulf States Marine Fisheries Commission Oil Spill On April 20, 2010, the Deepwater
Reef Fish Amendment 32 Gag and Red Grouper
 AMENDMENT GUIDE 11/2/11 Reef Fish Amendment 32 Gag and Red Grouper Provisions in the Magnuson-Stevens Fishery Conservation and Management Act require regional fishery management councils to develop annual
CHAPTER Committee Substitute for Committee Substitute for Senate Bill No. 1318
 CHAPTER 2016-200 Committee Substitute for Committee Substitute for Senate Bill No. 1318 An act relating to shellfish harvesting; amending s. 597.010, F.S.; revising provisions directing the Department
Management of Shellfish Aquaculture and Propagation in Massachusetts Waters
 Management of Shellfish Aquaculture and Propagation in Massachusetts Waters Chris Schillaci Aquaculture and Propagation Project Massachusetts Division of Marine Fisheries Shellfish In Massachusetts Massachusetts
Gulf of Mexico Oil Spill
 Bulletin 1204 May 2013 Estimation of the Baseline for Assessment of Economic Impacts of the Gulf of Mexico Oil Spill on Mississippi s Commercial Fishing Sector Discrimination based upon race, color, religion,
Go to Reference with Economic Statistics for US by Region and State. NOAA summary of fisheries of the US by state
 Go to Reference with Economic Statistics for US by Region and State Fisheries Economics of the United States 2014 Economics and Sociocultural Status and Trends Series U.S. Department of Commerce National
Biological Review of the 2014 Texas Closure
 Biological Review of the 2014 Texas Closure Report to the Gulf of Mexico Fishery Management Council by James M. Nance, Ph.D. Southeast Fisheries Science Center Galveston Laboratory January 2015 Introduction
The Fisheries Reform Act of The Joint Legislative Commission on Seafood and Aquaculture March 30, 2010
 The Fisheries Reform Act of 1997 The Joint Legislative Commission on Seafood and Aquaculture March 30, 2010 History July 1, 1994 Moratorium on Commercial Fishing Licenses Based on wide range of concerns
Sustainable Fisheries and Seafood in the Gulf of Mexico. Damon C. Morris, Ph.D.
 Sustainable Fisheries and Seafood in the Gulf of Mexico Damon C. Morris, Ph.D. Louisiana Department of Wildlife and Fisheries 1857: First Conservation Law in Louisiana Passed 1909: Louisiana Board of Commissioners
Agenda Item Summary BACKGROUND. Attachment 1
 Agenda Item Summary Attachment 1 BACKGROUND Oregon s recreational abalone fishery was suspended by emergency rule beginning January 1, 2018. This suspension was due to 1) low densities of red abalone,
THE OYSTER RESOURCE IN NORTH CAROLINA
 THE OYSTER RESOURCE IN NORTH CAROLINA NC DIVISION OF MARINE FISHERIES November 2010 History of Oysters in North Carolina Wide distribution of shell middens indicates utilization by Native Americans Early
Atlantic Highly Migratory Species; Atlantic Bluefin Tuna Fisheries. AGENCY: National Marine Fisheries Service (NMFS), National Oceanic and Atmospheric
, National Oceanic and Atmospheric") This document is scheduled to be published in the Federal Register on 05/11/2018 and available online at https://federalregister.gov/d/2018-09960, and on FDsys.gov Billing Code: 3510-22-P DEPARTMENT OF
This document is scheduled to be published in the Federal Register on 05/11/2018 and available online at https://federalregister.gov/d/2018-09960, and on FDsys.gov Billing Code: 3510-22-P DEPARTMENT OF
National Oceanic and Atmospheric Administration. Fisheries of the Caribbean, Gulf of Mexico, and South
 This document is scheduled to be published in the Federal Register on 07/13/2016 and available online at http://federalregister.gov/a/2016-16510, and on FDsys.gov Billing Code: 3510-22-P DEPARTMENT OF
Update: This document has been updated to include biological information on red snapper and information from the recent Gulf of Mexico Fishery
 Update: This document has been updated to include biological information on red snapper and information from the recent Gulf of Mexico Fishery Management Council (Gulf Council) meeting. Author: Luiz Barbieri
Florida Seagrass Integrated Mapping and Monitoring Program
 Florida Seagrass Integrated Mapping and Monitoring Program - 2004 The following document is composed of excerpts taken from the 2011 publication, Seagrass Integrated Mapping and Monitoring for the State
2001 REVIEW OF THE ATLANTIC STATES MARINE FISHERIES COMMISSION FISHERY MANAGEMENT PLAN FOR WEAKFISH (Cynoscion regalis)
") 2001 REVIEW OF THE ATLANTIC STATES MARINE FISHERIES COMMISSION FISHERY MANAGEMENT PLAN FOR WEAKFISH (Cynoscion regalis) Plan Review Team Rick Cole, DE Louis Daniel, NC Charles Lesser, DE Rob O Reilly,
2001 REVIEW OF THE ATLANTIC STATES MARINE FISHERIES COMMISSION FISHERY MANAGEMENT PLAN FOR WEAKFISH (Cynoscion regalis) Plan Review Team Rick Cole, DE Louis Daniel, NC Charles Lesser, DE Rob O Reilly,
Oceans Humans both depend on it and threaten it with their activities
 Oceans Humans both depend on it and threaten it with their activities Oceans Water covers nearly ¾ of the Earth s surface More than 50% of the world s population lives within an hour of the coast Oceans
ADDENDUM I TO AMENDMENT 3 OF THE INTERSTATE FISHERY MANAGEMENT PLAN FOR WEAKFISH
 ATLANTIC STATES MARINE FISHERIES COMMISSION ADDENDUM I TO AMENDMENT 3 OF THE INTERSTATE FISHERY MANAGEMENT PLAN FOR WEAKFISH Prepared by the Weakfish Plan Review Team Approved October 18, 2000 TABLE OF
Implementing the New Fisheries Protection Provisions under the Fisheries Act
 Implementing the New Fisheries Protection Provisions under the Fisheries Act Discussion Paper Fisheries and Oceans Canada April 2013 Contents 1. Introduction 2. Managing Threats to Canada s Fisheries 3.
AGENCY: National Marine Fisheries Service (NMFS), National Oceanic and Atmospheric
, National Oceanic and Atmospheric") This document is scheduled to be published in the Federal Register on 05/08/2013 and available online at http://federalregister.gov/a/2013-10931, and on FDsys.gov Billing Code: 3510-22-P DEPARTMENT OF
This document is scheduled to be published in the Federal Register on 05/08/2013 and available online at http://federalregister.gov/a/2013-10931, and on FDsys.gov Billing Code: 3510-22-P DEPARTMENT OF
Draft Discussion Document. May 27, 2016
 Draft Discussion Document May 27, 2016 Action to consider modifications to the sub-acl of GB haddock allocated to the Atlantic herring fishery and associated accountability measures AP/ CMTE Input 1. Review
Auburn University. Marine Extension. & Research Center SEA GRANT EXTENSION. Circular ANR-805 MASG P
 Auburn University Marine Extension & Research Center SEA GRANT EXTENSION Circular ANR-805 MASG P-93-007 Oyster Farming In Alabama Oyster production on the east and southeast coasts of the United States
AGENCY: National Marine Fisheries Service (NMFS), National Oceanic and Atmospheric
, National Oceanic and Atmospheric") This document is scheduled to be published in the Federal Register on 05/06/2014 and available online at http://federalregister.gov/a/2014-10222, and on FDsys.gov Billing Code: 3510-22-P DEPARTMENT OF
This document is scheduled to be published in the Federal Register on 05/06/2014 and available online at http://federalregister.gov/a/2014-10222, and on FDsys.gov Billing Code: 3510-22-P DEPARTMENT OF
Atlantic Highly Migratory Species; Atlantic Bluefin Tuna Fisheries. AGENCY: National Marine Fisheries Service (NMFS), National Oceanic and Atmospheric
, National Oceanic and Atmospheric") This document is scheduled to be published in the Federal Register on 04/26/2018 and available online at https://federalregister.gov/d/2018-08783, and on FDsys.gov Billing Code: 3510-22-P DEPARTMENT OF
This document is scheduled to be published in the Federal Register on 04/26/2018 and available online at https://federalregister.gov/d/2018-08783, and on FDsys.gov Billing Code: 3510-22-P DEPARTMENT OF
Authors: Luiz Barbieri and Martha Bademan
 This is a review and discussion of a proposal to develop and implement a Gulf Offshore Recreational Fishing Permit in support of more accurate, precise, and timely catch and effort estimates for offshore
SARASOTA BAY ESTUARY PROGRAM OYSTER HABITAT MONITORING RESULTS: YEAR 1. Jay R. Leverone
 SARASOTA BAY ESTUARY PROGRAM OYSTER HABITAT MONITORING RESULTS: YEAR 1 by Jay R. Leverone Mote Marine Laboratory 1600 Ken Thompson Parkway Sarasota, Fl 34236 to Gary Raulerson Sarasota Bay Estuary Program
Chapter Saltwater Fishing Regulations
 Chapter 391-2-4 Saltwater Fishing Regulations BACKGROUND AND SYNOPSIS OF PROPOSED AMENDMENTS TO THE RULES OF THE GEORGIA DEPARTMENT OF NATURAL RESOURCES COASTAL RESOURCES DIVISION RELATING TO CHAPTER 391-2-4,
Atlantic States Marine Fisheries Commission An Overview. Tina Berger, Director of Communications
 Atlantic States Marine Fisheries Commission An Overview By Tina Berger, Director of Communications Presentation Overview Commission Overview ASMFC Programs Species Highlights American Eel Atlantic Menhaden
Office of Science & Technology
 NOAA Fisheries Highlights of FEUS 2015 Highlights from the Annual Report Fisheries Economics of the United States, 2015 Office of Science & Technology Fisheries and the Economy U.S. fisheries provide jobs,
Managing Chesapeake Bay s Land Use, Fish Habitat, and Fisheries: Studies. Jim Uphoff & Margaret McGinty, Fisheries Service
 Managing Chesapeake Bay s Land Use, Fish Habitat, and Fisheries: Positive Image and or Negative Graphic Case Studies Jim Uphoff & Margaret McGinty, Fisheries Service Maryland Fisheries Service has been
National Oceanic and Atmospheric Administration. Fisheries of the Caribbean, Gulf of Mexico, and South Atlantic;
 This document is scheduled to be published in the Federal Register on 02/05/2019 and available online at https://federalregister.gov/d/2019-01117, and on govinfo.gov BILLING CODE 3510-22-P DEPARTMENT OF
Gulf of Maine Research Institute Responsibly Harvested Seafood from the Gulf of Maine Region Report on Atlantic Sea Scallops (Inshore Canada)
") Gulf of Maine Research Institute Responsibly Harvested Seafood from the Gulf of Maine Region Report on Atlantic Sea Scallops (Inshore Canada) The fishery is managed by a competent authority and has a management
Gulf of Maine Research Institute Responsibly Harvested Seafood from the Gulf of Maine Region Report on Atlantic Sea Scallops (Inshore Canada) The fishery is managed by a competent authority and has a management
Chesapeake Bay Jurisdictions White Paper on Draft Addendum IV for the Striped Bass Fishery Management Plan
 Chesapeake Bay Jurisdictions White Paper on Draft Addendum IV for the Striped Bass Fishery Management Plan Maryland Department of Natural Resources, District of Columbia s Fisheries and Wildlife Division,
Fisheries Off West Coast States; Coastal Pelagic Species Fisheries; Annual. AGENCY: National Marine Fisheries Service (NMFS), National Oceanic and
, National Oceanic and") This document is scheduled to be published in the Federal Register on 06/30/2017 and available online at https://federalregister.gov/d/2017-13685, and on FDsys.gov Billing Code 3510-22-P DEPARTMENT OF
This document is scheduled to be published in the Federal Register on 06/30/2017 and available online at https://federalregister.gov/d/2017-13685, and on FDsys.gov Billing Code 3510-22-P DEPARTMENT OF
A presentation by the United Cook Inlet Drift Association to the Alaska State Senate Resources Committee, March 26, 2014.
 A presentation by the United Cook Inlet Drift Association to the Alaska State Senate Resources Committee, March 26, 2014. United Cook Inlet Drift Association 907-260-9436 info@ucida.org 1 In 2013, Northern
Discussion Paper: Consideration of a Registration for Self-Guided Halibut Rental Boats
 Discussion Paper: Consideration of a Registration for Self-Guided Halibut Rental Boats December 2017 1 1 Introduction... 1 2 Description of the Problem... 1 2.1 Definition of self-guided halibut rental
Certification Determination. Louisiana Blue Crab Commercial Fishery
 15 th November 2016 Certification Determination For The Louisiana Blue Crab Commercial Fishery Following a meeting of a Global Trust Certification Committee on 20 th October 2016, a positive determination
Overview of herring related findings of NCEAS Portfolio Effects Working Group
 Overview of herring related findings of NCEAS Portfolio Effects Working Group Northwest Eric Ward, Rich Brenner eric.ward@noaa.gov richard.brenner@alaska.gov September 8, 2017 Acknowledgments Thanks to
Dauphin Lake Fishery. Status of Walleye Stocks and Conservation Measures
 Dauphin Lake Fishery Status of Walleye Stocks and Conservation Measures Date: December, 21 Dauphin Lake Fishery Status of Walleye Stocks and Conservation Measures Background: Walleye stocks in Dauphin
NASCO Guidelines for the Management of Salmon Fisheries
 NASCO Guidelines for the Management of Salmon Fisheries NASCO Guidelines for the Management of Salmon Fisheries Additional copies of these Guidelines can be obtained free of charge from: The Secretary
Public Hearing Document
 Regulatory Amendment 1 to the Fishery Management Plan for the Dolphin and Wahoo Fishery of the Atlantic Modify commercial trip limits for dolphin Environmental Assessment Regulatory Impact Review Regulatory
Fisheries Off West Coast States; Coastal Pelagic Species Fisheries; Annual. AGENCY: National Marine Fisheries Service (NMFS), National Oceanic and
, National Oceanic and") This document is scheduled to be published in the Federal Register on 06/25/2018 and available online at https://federalregister.gov/d/2018-13583, and on FDsys.gov BILLING CODE: 3510-22-P DEPARTMENT OF
This document is scheduled to be published in the Federal Register on 06/25/2018 and available online at https://federalregister.gov/d/2018-13583, and on FDsys.gov BILLING CODE: 3510-22-P DEPARTMENT OF
OREGON DEPARTMENT OF FISH AND WILDLIFE REPORT ON INSEASON CHANGES
 Agenda Item E.10.a Supplemental REVISED ODFW Report 1 September 2017 OREGON DEPARTMENT OF FISH AND WILDLIFE REPORT ON INSEASON CHANGES Oregon Research Set-Aside for Yelloweye Rockfish The Oregon Department
VALUES ASSOCIATED WITH THE APALACHICOLA BAY MARINE ECONOMY
 PBTC 03-3 VALUES ASSOCIATED WITH THE APALACHICOLA BAY MARINE ECONOMY By Alan W. Hodges and Charles Adams PBTC 03-3 March 2003 POLICY BRIEF SERIES INTERNATIONAL AGRICULTURAL TRADE AND POLICY CENTER MISSION
INLAND LAKE MANAGEMENT REPORT FY Spring 2008
 INLAND LAKE MANAGEMENT REPORT FY 2008 Spring 2008 Prepared by Robert O. Andress District Fisheries Biologist E. Daniel Catchings District Fisheries Supervisor Kevin W. Baswell District Biologist Aide Department
ASMFC Stock Assessment Overview: Red Drum
 Introduction This document presents a summary of the 217 stock assessments for red drum. These assessments were initially conducted through the Southeast Data, Assessment and Review (SEDAR) process using
Marine Fisheries Management in North Carolina
 Marine Fisheries Management in North Carolina Marine Fisheries Study Committee Jan. 5, 2012 Pounds (millions) Dollars (millions) Total Commercial Landings & Value 250 200 150 100 50 0 120 100 80 60 40
Indian River Lagoon: Lessons, Challenges and Opportunities
 Indian River Lagoon: Lessons, Challenges and Opportunities Upper Chain of Lakes Lake Kissimmee Kissimmee River Indian River Lagoon Caloosahatchee Estuary Lake Okeechobee St. Lucie Estuary Mark Perry, Executive
Advancing the Gulf of Mexico Shellfish Initiative (GoMexSI)
") Advancing the Gulf of Mexico Shellfish Initiative (GoMexSI) Gulf States Marine Fisheries Commission Mississippi-Alabama Sea Grant Consortium Gulf States Marine Fisheries Commission Annual Meeting March
Advancing the Gulf of Mexico Shellfish Initiative (GoMexSI) Gulf States Marine Fisheries Commission Mississippi-Alabama Sea Grant Consortium Gulf States Marine Fisheries Commission Annual Meeting March
South Atlantic Council Issues
 South Atlantic Council Issues Review and Discussion February 8, 2018 Florida Fish and Wildlife Conservation Commission Version 2 This is a review and discussion of actions from the South Atlantic Fishery
Modeling effects of fishing closures in the Western Florida Shelf
 Modeling effects of fishing closures in the Western Florida Shelf David J. Die and Steven Saul* University of Miami * Currently SEFSC/NMFS/NOAA Outline Effects of fishing closures DWH Fishing closures
Kodiak and Alaska Peninsula Commercial Dungeness Crab Fisheries, Report to the Alaska Board of Fisheries. Michael P. Ruccio.
 Kodiak and Alaska Peninsula Commercial Dungeness Crab Fisheries, 1999 Report to the Alaska Board of Fisheries By Michael P. Ruccio and David R. Jackson Regional Information Report 1 No. 4K00-3 Alaska Department
Modifications to Gulf Reef Fish and South Atlantic Snapper Grouper Fishery Management Plans
 Tab B, No. 11b 3/19/15 Modifications to Gulf Reef Fish and South Atlantic Snapper Grouper Fishery Management Plans Draft Joint Generic Amendment DECISION DOCUMENT For the Joint Council Committee on South
2012 Maryland FMP Report (July 2013) Section 15. Red Drum (Sciaenops ocellatus)
 Section 15. Red Drum (Sciaenops ocellatus)") 1981 1983 1985 1987 1989 1991 1995 1997 1999 2001 2003 2005 2007 2009 2011 Pounds 2012 Maryland FMP Report (July 2013) Section 15. Red Drum (Sciaenops ocellatus) Chesapeake Bay FMP In 2012, red drum were
1981 1983 1985 1987 1989 1991 1995 1997 1999 2001 2003 2005 2007 2009 2011 Pounds 2012 Maryland FMP Report (July 2013) Section 15. Red Drum (Sciaenops ocellatus) Chesapeake Bay FMP In 2012, red drum were
Atlantic States Marine Fisheries Commission
 Atlantic States Marine Fisheries Commission Vision: Sustainably Managing Atlantic Coastal Fisheries Meeting Summary Joint ASMFC Summer Flounder, Scup and Black Sea Bass Board and MAFMC March 6 & 7, 2019
Paper prepared by the Secretariat
 COMMISSION FOURTEENTH REGULAR SESSION Manila, Philippines 3 7 December 2017 REFERENCE DOCUMENT FOR REVIEW OF CMM 2005-03 AND FOR THE DEVELOPMENT OF HARVEST STRATEGIES UNDER CMM 2014-06 North Pacific Albacore
Spilling Water at Hydroelectric Projects in the Columbia and Snake Rivers How Does It Benefit Salmon?
 Spilling Water at Hydroelectric Projects in the Columbia and Snake Rivers How Does It Benefit Salmon? Hydropower development in the Columbia and Snake rivers has left its mark on salmonid populations,
Modification of American Eel Commercial Regulations and Modification of Commercial
 ENVIRONMENTAL PROTECTION DIVISION OF FISH AND WILDLIFE Notice of Administrative Change Marine Fisheries Modification of American Eel Commercial Regulations and Modification of Commercial Trip Limits for
Project Title: Fisheries Content Provider Gulf Fisheries Info (FINFO) - #127. Gulf & South Atlantic Fisheries Foundation, Inc.
 - #127. Gulf & South Atlantic Fisheries Foundation, Inc.") Project Title: Fisheries Content Provider Gulf Fisheries Info (FINFO) - #127 Grantee: Gulf & South Atlantic Fisheries Foundation, Inc. Amount of Award: $19,000 Award Period: October 3, 2013 - March 31,
Project Title: Fisheries Content Provider Gulf Fisheries Info (FINFO) - #127 Grantee: Gulf & South Atlantic Fisheries Foundation, Inc. Amount of Award: $19,000 Award Period: October 3, 2013 - March 31,
Peyton Robertson, Director, NOAA Chesapeake Bay Office Frank Dawson, Assistant Secretary, MD DNR Jeff Corbin, Assistant Secretary, VA Natural
 Peyton Robertson, Director, NOAA Chesapeake Bay Office Frank Dawson, Assistant Secretary, MD DNR Jeff Corbin, Assistant Secretary, VA Natural Resources Baywide Harvest 120 100 Harvest (Millions of Pounds)
Striped Bass and White Hybrid (x) Striped Bass Management and Fishing in Pennsylvania
 Striped Bass Management and Fishing in Pennsylvania") Striped Bass and White Hybrid (x) Striped Bass Management and Fishing in Pennsylvania Prepared by R. Lorantas, D. Kristine and C. Hobbs PFBC Warmwater Unit 2005 (stocking numbers updated after 2005) Goal:
Striped Bass and White Hybrid (x) Striped Bass Management and Fishing in Pennsylvania Prepared by R. Lorantas, D. Kristine and C. Hobbs PFBC Warmwater Unit 2005 (stocking numbers updated after 2005) Goal:
Monica Medina Deputy Director, Environment September 29, 2016
 Monica Medina Deputy Director, Environment September 29, 2016 Walton Family Foundation Commitment To Oceans At the Walton Family Foundation, we believe that conservation solutions that make economic sense
Fisheries Historic Status U.S. fishermen are granted the right to fish in public waters under the Public Trust Doctrine. Through the years, this right
 US U.S. Fisheries i Law: An Introduction Fisheries Historic Status U.S. fishermen are granted the right to fish in public waters under the Public Trust Doctrine. Through the years, this right has been
ASMFC Stock Assessment Overview: Red Drum
 Purpose The purpose of this document is to improve the understanding and transparency of the Commission s stock assessment process and results. It is the first of several that will be developed throughout
Gulf States Marine Fisheries Commission. Dave Donaldson Assistant Director
 Gulf States Marine Fisheries Commission Dave Donaldson Assistant Director Interjurisdictional Fisheries Program The purpose of the IJF Program: Promote and encourage state activities in support of management
JadEco, LLC PO BOX 445 Shannon, IL 61078
 Introduction: With the assistance of Lake Holiday staff and volunteers, we were able to conduct an AC electrofishing survey on May 8, 27. Water temperatures were 2.3 C (8.5 F) and water clarity was decent
SA New Trial Artificial Reef Project
 BACKGROUND PAPER SA New Trial Artificial Reef Project Development of options for the trial artificial reef 1. Summary CONTENTS Each year, an estimated 236,000 South Australians participate in recreational
Oceanic Society Reef Research Team: Nicole Crane, Avigdor Abelson, Peter Nelson, Giacomo Bernardi, Michelle Paddack, Kate Crosman
 The coral reef of Tamil (Yap, FSM): Preliminary ecological assessment of reef state and fish assemblages, and potential of conservation for sustainable use Report compiled by vigdor belson, Peter Nelson
Evolution of Deepwater Coral Protection in the Southeast U.S
 Evolution of Deepwater Coral Protection in the Southeast U.S Tina Udouj, Florida Fish and Wildlife Conservation Commission Roger Pugliese, South Atlantic Fishery Management Council Overview Deepwater Corals
Essential Fish Habitat
 Pacific Fishery Management Council Fact sheet: Essential Fish Habitat Habitat is the environment where an animal lives, feeds, and reproduces. Identifying fish habitat is complex because fish move through
Agenda Item Summary BACKGROUND. Public Involvement ISSUE ANALYSIS. Attachment 1
 Agenda Item Summary Attachment BACKGROUND Between 996 and 03 white sturgeon fisheries in the Columbia River downstream from Bonneville Dam were managed under a series of management accords between the
LIONFISH CONTROL PLAN
 LIONFISH CONTROL PLAN Action Items Summary 2017 LIONFISH CONTROL PLAN Action Items Summary 2017 Two species of Indo-Pacific lionfish have invaded the coastal and deep waters of the state of Florida. Lionfish
BLACK SEA BASS NORTH OF CAPE HATTERAS DEALER PERMIT ISSUE PAPER. June 12, 2008 (REVISED) (NOTE: proposed rule under construction, eff.
 (NOTE: proposed rule under construction, eff.") BLACK SEA BASS NORTH OF CAPE HATTERAS DEALER PERMIT ISSUE PAPER June 12, 2008 (REVISED) (NOTE: proposed rule under construction, eff. July 1, 2008) I. ISSUE The requirement for licensed dealers to have
BLACK SEA BASS NORTH OF CAPE HATTERAS DEALER PERMIT ISSUE PAPER June 12, 2008 (REVISED) (NOTE: proposed rule under construction, eff. July 1, 2008) I. ISSUE The requirement for licensed dealers to have
Atlantic Highly Migratory Species; Atlantic Bluefin Tuna Fisheries. AGENCY: National Marine Fisheries Service (NMFS), National Oceanic and Atmospheric
, National Oceanic and Atmospheric") This document is scheduled to be published in the Federal Register on 05/15/2015 and available online at http://federalregister.gov/a/2015-11791, and on FDsys.gov DEPARTMENT OF COMMERCE BILLING CODE 3510-22-P
This document is scheduled to be published in the Federal Register on 05/15/2015 and available online at http://federalregister.gov/a/2015-11791, and on FDsys.gov DEPARTMENT OF COMMERCE BILLING CODE 3510-22-P
Chagrin River TMDL Appendices. Appendix F
 Appendix F The following are excerpts from the Eastern Brook Trout Joint Venture s Conservation Strategy (Working Draft v.6), Conserving the Eastern Brook Trout: Strategies for Action Found at: http://www.easternbrooktrout.org/constrategy.html
Atlantic States Marine Fisheries Commission DRAFT ADDENDUM I TO THE BLACK DRUM FISHERY MANAGEMENT PLAN FOR PUBLIC COMMENT
 Atlantic States Marine Fisheries Commission DRAFT ADDENDUM I TO THE BLACK DRUM FISHERY MANAGEMENT PLAN FOR PUBLIC COMMENT Vision: Sustainably Managing Atlantic Coastal Fisheries February 2018 Public Comment
Atlantic States Marine Fisheries Commission
 Atlantic States Marine Fisheries Commission DRAFT ADDENDUM XXIV TO THE SUMMER FLOUNDER, SCUP AND BLACK SEA BASS FISHERY MANAGEMENT PLAN FOR PUBLIC COMMENT Summer Flounder Recreational Management in 2013
The Economic Gains from Reallocating Specific Saltwater Fisheries
 The Economic Gains from Reallocating Specific Saltwater Fisheries Produced for the: American Sportfishing Association By: Southwick Associates May 12, 2015 Executive Summary Allocation arrangements between
Shellfish Lease Program. February 13, Department of Environmental Quality
 Shellfish Lease Program February 13, 2016 Department of Environmental Quality NC Shellfish Lease History The State of North Carolina has provided for the private use of public trust waters for the production
Assessment Summary Report Gulf of Mexico Red Snapper SEDAR 7
 Assessment Summary Report Gulf of Mexico Red Snapper SEDAR 7 Stock Distribution: Red snapper are found throughout the Gulf of Mexico, the Caribbean Sea, and from the U.S. Atlantic Coast to northern South
Discussion on the Selection of the Recommended Fish Passage Design Discharge
 Discussion on the Selection of the Recommended Fish Passage Design Discharge Introduction The provision of fish passage is a requirement for most proposed culvert and bridge installations in Alberta, depending
17-06 BFT RECOMMENDATION BY ICCAT FOR AN INTERIM CONSERVATION AND MANAGEMENT PLAN FOR WESTERN ATLANTIC BLUEFIN TUNA
 17-06 BFT RECOMMENDATION BY ICCAT FOR AN INTERIM CONSERVATION AND MANAGEMENT PLAN FOR WESTERN ATLANTIC BLUEFIN TUNA RECALLING the Recommendation by ICCAT to Establish a Rebuilding Program for Western Atlantic
U. S. House of Representatives Committee on Resources. Subcommittee on Fisheries Conservation, Wildlife and Oceans
 U. S. House of Representatives Committee on Resources Subcommittee on Fisheries Conservation, Wildlife and Oceans Oversight Hearings on the Efforts to Introduce Non-Native Oyster Species to the Chesapeake
FISHERIES BLUE MOUNTAINS ADAPTATION PARTNERSHIP
 FISHERIES A warming climate, by itself, substantially affects the hydrology of watersheds in the Blue Mountains. Among the key hydrologic changes projected under all scenarios for the 2040s and beyond
Why has the cod stock recovered in the North Sea?
 Why has the cod stock recovered in the North Sea? Summary The expansion of European fisheries during the 1970s and 1980s resulted in high fishing pressure on stocks of cod, haddock, whiting and saithe
Critical Habitat for Atlantic Sturgeon
 Critical Habitat for Atlantic Sturgeon GARFO Presentation to the Chesapeake Bay Sustainable Fisheries Goal Implementation Team September 22, 2017 Julie Crocker NMFS GAR Protected Resources This Presentation
Modernizing Maine's Municipal Shellfish Programs. Chad Coffin President of the Maine Clammers Association
 Modernizing Maine's Municipal Shellfish Programs Chad Coffin President of the Maine Clammers Association Maine Clammers Association Represents people and fishing families who care about and rely on healthy
National Oceanic and Atmospheric Administration. Coastal Migratory Pelagic Resources of the Gulf of Mexico and Atlantic Region;
 This document is scheduled to be published in the Federal Register on 01/28/2019 and available online at https://federalregister.gov/d/2019-00225, and on govinfo.gov Billing Code: 3510-22-P DEPARTMENT
National Oceanic and Atmospheric Administration. Fisheries of the Caribbean, Gulf of Mexico, and South Atlantic;
 This document is scheduled to be published in the Federal Register on 11/02/2018 and available online at https://federalregister.gov/d/2018-23950, and on govinfo.gov BILLING CODE 3510-22-P DEPARTMENT OF
PARTIES TO THE PALAU ARRANGEMENT. 21 st ANNUAL MEETING 31 March 1 April 2016 Tarawa, Kiribati. PA21/WP.2: Purse Seine VDS TAE for
 PARTIES TO THE PALAU ARRANGEMENT 21 st ANNUAL MEETING 31 March 1 April 2016 Tarawa, Kiribati : Purse Seine VDS TAE for 2017-18 TAE Setting 1. Article 12.2 of the VDS Scheme text sets out the issues to
Oregon Department of Fish and Wildlife: Inland Fisheries - Hatchery Management
 Oregon Department of Fish and Wildlife: Inland Fisheries - Hatchery Management Primary Outcome Area: Economy & Jobs Secondary Outcome Area: Healthy Environments Program Contact: Ed Bowles, 503-947-6206
Sustainable Seas - Marine Fisheries Fisheries and Fishing
 Sustainable Seas - Marine Fisheries Fisheries and Fishing Maximum Sustainable Yield and Fishery Management Mariculture Reading: Ch 9: 9.12 Ch 14: 14.7-14.9 Ch 17: 17.1, 17.17-17.21,17.25 Graphic: Chub
APPENDIX 2.1 Lake Sturgeon - Mitigation and Enhancement
 APPENDIX 2.1 Lake Sturgeon - Mitigation and This page is intentionally left blank. Lake Sturgeon Mitigation and As a provincial crown corporation providing electric energy and natural gas service, Manitoba
ESTIMATED RETURNS AND HARVEST OF COLUMBIA RIVER FALL CHINOOK 2000 TO BY JOHN McKERN FISH PASSAGE SOLUTIONS
 ESTIMATED RETURNS AND HARVEST OF COLUMBIA RIVER FALL CHINOOK 2000 TO 2007 BY JOHN McKERN FISH PASSAGE SOLUTIONS ESTIMATED RETURNS AND HARVEST OF COLUMBIA RIVER FALL CHINOOK 2000 TO 2007 This analysis of
NOAA s Role in Chesapeake Bay
 NOAA s Role in Chesapeake Bay NOAA Chesapeake Bay Office Mission To understand, predict and explain changes in the Chesapeake Bay ecosystem, and to coordinate efforts to conserve and manage coastal and
History and Status of the Oregon Dungeness Crab Fishery
 History and Status of the Oregon Dungeness Crab Fishery History and Status of the Oregon Dungeness Crab Fishery by Darrell Demory Oregon Department of Fish and Wildlife Oregon Department of Fish and Wildlife
DMU 361 Fremont Deer Management Unit Newaygo, Oceana, N. Muskegon Counties
 DMU 361 Fremont Deer Management Unit Newaygo, Oceana, N. Muskegon Counties Area Description The Fremont Deer Management Unit (DMU 361) was established in 2013. It lies within the Southwest Region and covers