This presentation focuses on: 1. The results of the first four years of compliance monitoring of the Wheeler North Reef, 2. An evaluation of the
|
|
|
- Cory Norman
- 6 years ago
- Views:
Transcription

1 This presentation focuses on: 1. The results of the first four years of compliance monitoring of the Wheeler North Reef, 2. An evaluation of the Wheeler North Reef in 2012 with respect to the performance standards on which it is being judged. 1

2 Physical and biological performance standards were established by the CCC to evaluate the success of the Wheeler North Reef in compensating for the kelp bed resources lost due to SONGS operations. 2

3 The goal of the SONGS reef mitigation project is to replace the kelp forest resources that have been and continue to be lost due to the ongoing operations of SONGS Units 2 & 3. Performance standards are used as a measuring stick to evaluate whether the Wheeler North Reef is replacing those resources. One year of mitigation credit is given for each year that Wheeler North Reef meets the performance standards. Because damage to the San Onofre kelp forest is on going it is important that WNR provide kelp forest resources for a period of time equal to the lifetime operation of Units 2 & 3. Thus, fulfillment of the SONGS reef mitigation requirement occurs when the number of years of mitigation credit accrued by the Wheeler North Reef equals the total years of operation of SONGS Units 2 & 3, including the decommissioning period to the extent that there is continuing discharge of cooling water. 3
4 Two types of physical and biological standards are used to judge the performance of the Wheeler North Reef. 1) Absolute standards are measured against fixed value at Wheeler North Reef only, 2) Relative standards are measured at Wheeler North Reef and the two reference reefs and are used to judge whether the Wheeler North Reef is performing similar to natural reefs. 4
5 5

6 Choosing the natural reefs that are used as reference was a critical element of the mitigation project because the reference reefs are used to evaluate the success of the Wheeler North Reef. 6

7 Similar as defined in the dictionary means related in appearance, or alike though not identical. The SONGS Coastal Development Permit envisioned a more quantitative definition of similar for evaluating the performance of the reef mitigation projects relative to reference sites, and it specified that the measure of similarity be defined in the monitoring plans for these projects. After considerable discussion the definition for the measure of similarity that was chosen is that the mean value for a performance variable at Wheeler North Reef must not be significantly less than the reference reef having the lowest value for that performance variable. This definition recognizes that no two natural reefs are identical, but that any reef chosen as a reference site should serve as an acceptable standard. Because there is a certain amount of error associated with any type of sampling (especially when diving in less than favorable conditions) we determined that we needed to be at least 80% confident that the Wheeler North Reef performed as well as the lowest performing reference site. 7

8 The evaluation of each relative performance standard is based solely on a fouryear running average calculated from data collected at the Wheeler North Reef and the two reference reefs for that year and the previous three years. A 4-year running average is long enough to account for natural variation in time, but no so long that it precludes evaluating the performance of WNR within a reasonable period of time. An either /or criterion (i.e., using data from either a single year or a running average) is not appropriate in this case because the purpose for the relative standards is not for WNR to achieve a specified value that is linked to the estimated losses at the San Onofre kelp forest, but rather for WNR to produce kelp bed resources similar to those at of the reference reefs. Using an either/or criterion greatly reduces the ability to detect differences between the Wheeler North Reef and the reference reefs when such differences exist. Natural kelp forests vary greatly in their species composition and abundance and it is likely, that the reference reefs will not consistently meet all the relative standards in a given year. To avoid requiring the Wheeler North Reef to perform better than the reference reefs the Wheeler North Reef is required to meet at least as many of the relative standards as the lowest performing reference reef in a given year for that year to court towards mitigation credit. 8

9 Shown here are the performance standards by which the success of the Wheeler North Reef is being judged. Absolute standards are shown in green and relative standards are shown in black. What follows is a summary of the monitoring results as they pertain to each of these standards. 9
10 The performance standard for hard substrate is a fixed standard that requires at least 90% of the exposed rock initially present at Wheeler North Reef to remain available for the attachment by reef biota. 10
 in the same 1 m 2 quadrats used to verify the construction of Wheeler North Reef.")
11 The performance standard for hard substrate is evaluated in the following way: Measuring the footprint area (A) of Wheeler North Reef using multi-beam sonar. Estimating the percent cover of exposed rock ( P ) in the same 1 m 2 quadrats used to verify the construction of Wheeler North Reef. The product A x P is the estimate of the area of exposed hard substrate. We compare this estimate to that obtained immediately following construction of Wheeler North Reef. The SONGS coastal development permit requires that this amount not fall below 90% of what was available immediately after the reef was constructed. Divers collect percent cover data for nine different types of bottom substrate. The five categories of bottom substrates outlined in the green box are those that counted as hard substrate in our analyses. 11
12 This slide shows the two variables required to estimate the amount of exposed hard substrate on the Wheeler North Reef. Both of these variables apply only to the 154 acre subset of the Wheeler North Reef, which was the portion of the 176 acre reef that met the 150 acre standard of > 42% cover of rock. There was a slight decrease in the footprint area in the year following construction (2009), which was not unexpected as rocks settle into the soft sandy bottom. Because the footprint area of the reef is not expected to change much from yearto-year multi-beam sonar surveys are only done once every five years. The last sonar survey was done in Thus the value for reef footprint area is assumed to be the same in 2010,2011, and 2012 as it was in Unlike footprint area, the percent of the bottom covered by rock is measured every year by divers. The percent cover of rock declined from ~ 46% in 2008 to ~ 42% in 2011, before increasing in 2012 to ~ 44%. 12
13 The initial amount of hard substrate at WNR used to judge this performance standard was 70.6 acres in The small declines in footprint area and % cover of hard substrate that have occurred since then resulted in nearly a 10% decrease in the total area of hard substrate on Wheeler North Reef by An increase in the % cover of rock in 2012 resulted in the total area of hard substrate to increase from 64 acres in 2011 to 67.7 acres in 2012 (or roughly 96% of the initial amount of rock area). Thus the performance standard for reef area was met in 2012 regardless of whether the evaluation was based on data from 2012 alone or the 4-year running average ( ). 13

14 The performance standard for giant kelp is a fixed standard that requires the Wheeler North Reef to sustain 150 acres of medium-to-high density giant kelp. Medium-to-high density giant kelp is defined as at least 4 adult plants per 100 m 2. Adult plants are defined as individual plants with at least 8 fronds. These definitions for kelp are the same ones that were used to quantify the impacts to giant kelp caused by SONGS during the impact assessment phase of this project.

15 The performance standard for giant kelp is evaluated by measuring the density of giant kelp in the fixed transects across the entire Wheeler North Reef. Using these data we calculate the proportion of transects on the Wheeler North Reef that have adult kelp densities greater than or equal to 4 plants per 100 m 2. This proportion is multiplied by 176 acres (= the total footprint area of Wheeler North Reef measured in the most recent sonar survey) to obtain the total acreage of adult kelp on the Wheeler North Reef. 15
16 The area of medium-to-high density adult kelp on Wheeler North Reef increased dramatically from 19 acres in 2009 to 174 acres in This represented the growth of the young kelp that colonized in of the 92 transects sampled had at least 4 adult plants 100 per m 2 in 2010 through The acreage of giant kelp at the Wheeler North Reef exceeded the 150 acre threshold when evaluated using data from 2012, but not when using the 4-year running average (due to the small number of kelp acres in 2009 one year after construction). Because the performance standard for giant kelp is an absolute standard either the value for 2012 or the 4-year running average can be used. Thus the Wheeler North Reef met the performance standard for giant kelp in

17 The performance standard for the benthic community is a relative standard that requires the abundance and number of species of algae and invertebrates on the Wheeler North Reef to be similar to that on reference reefs in the region. 17

18 Because it is not possible to evaluate the benthic community standard using a single metric we consider 5 separate components of the benthic community when evaluating this performance standard. 1. The mean percent cover of algae per transect 2. The mean number of species of algae per transect 3. The mean percent cover of sessile invertebrates per transect 4. The mean density of mobile invertebrates per transect 5. The mean number of species of sessile and mobile invertebrates per transect. 18
19 This graph shows the percent cover of understory algae at Wheeler North Reef, Barn and San Mateo, both as a time series on the left and as the 4-year running average on the right. The colored symbols in this graph represent the mean value of each reef, and the vertical lines through the symbols represent +/- 1 standard error. This same format with the time series on the left and the 4-year average on the right for Wheeler North Reef, san Mateo and Barn will be used for all the graphs in this presentation that pertain to the relative performance standards. The 4-year times series on the left shows that the percent cover of algae at Wheeler North Reef was initially within the range observed at San Mateo and Barn in The percent cover of algae at Wheeler North Reef decreased to about 10% in 2010 when the surface canopy of giant kelp became fully established, and it remained at this low level in 2011 and In contrast, the percent cover of algae at the two reference sites increased substantially during the four years of monitoring, most notably in As with all the relative standards the 4-year running average is used to evaluate whether Wheeler North Reef has met this performance standard. The different trajectories of algae at Wheeler North Reef and the reference reefs leads to a 4-year running average of algal percent cover at Wheeler North Reef 19
20 that is substantially lower than that at the two reference reefs. Consequently, the Wheeler North Reef did not meet this performance standard in
21 These two graphs shows the mean number of species of algae per transect at Wheeler North Reef, Barn and San Mateo as a time series on the left and as the 4-year running average on the right The graph on the left shows that temporal trends in algal diversity were similar to those observed for algal percent cover. The average number of species per transect declined over time at Wheeler North Reef, while it increased at the two reference reefs. As a result, the 4-year running average of algal species density at Wheeler North Reef was much lower than that at Barn and San Mateo Consequently, the Wheeler North Reef did not meet the performance standard for algal diversity in
22 Plotted in these graphs is the percent cover of sessile invertebrates at Wheeler North Reef, Barn and San Mateo. As described in the previous presentation sessile invertebrates and algae compete for space and increases in the percent cover of one of these groups is typically accompanied by a decrease in the percent cover of the other group. This is exactly that pattern that we have seen at Wheeler North Reef, Barn and San Mateo. The percent cover of sessile invertebrates at Wheeler North Reef in 2009 was quite low relative to the reference reefs, but increased over time as the cover of algae decreased. By contrast the percent cover of sessile invertebrates showed a sharp decrease at Barn and San Mateo, which is the exact opposite pattern observed for algae at this sites as shown in the previous slides. Because the four-year running average of percent cover of sessile invertebrates at Wheeler North Reef was nearly identical to that at Barn and slightly higher than that at San Mateo, the Wheeler North Reef met this performance standard in
23 Much like the percent cover of sessile invertebrates, the density of mobile invertebrates at Wheeler North Reef was initially low ( < 10 m 2 ) in 2009, and has increased over time to densities > 100 individuals per m 2. In contrast the densities of mobile invertebrates at San Mateo and Barn have fluctuated much less over the four-year sampling period with densities ranging between 40 to 70 individuals per m 2. The four-year running average of mobile invertebrate density at Wheeler North Reef was intermediate between the two reference reefs, thus the Wheeler North Reef met this performance standard for
24 Plotted here is the mean number of species of sessile and mobile invertebrates combined per transect at Wheeler North Reef, San Mateo and Barn. The average number of invertebrate species per transect at the two reference reefs has declined slightly over the four-year sampling period, whereas it has steadily increased at Wheeler North Reef from a low value near 10 species per transect in 2009 to about 25 in 2012, which was slightly higher than that observed at San Mateo and Barn While the number of species of invertebrates at Wheeler North Reef is on a promising trajectory, its 4-year running average is still substantially below that of the two reference reefs due to the low numbers of species during the first couple years of its existence. Thus the Wheeler North Reef did not meet the performance standard for invertebrate diversity in
25 The next several performance standards pertain to the abundance and number of species of reef fish. The first of these standard is that The resident fish assemblage shall have a total density similar to natural reefs within the region. Resident Fish are defined as reef associated species 1 year of age or older. Resident fish include species such as small gobies that are only a could inches long as well as large predatory species such as kelp bass and black sea bass. 24

26 Reef fish are visually counted and sized by divers within 1.5 m of the bottom in a 3 m wide swath centered along each 50 m transect. Size data are used to determine if fish are > 1 year of age. Fish size data are also used to evaluate several of the other performance standards pertaining to kelp bed fishes. 25
27 The densities of resident fish have fluctuated greatly during the four years of monitoring. In 2009, 1 year after its construction, the density of fish at the Wheeler North Reef was 2 to 3 times greater than that at the reference reefs. Fish densities declined dramatically at all three reefs in 2010 and were universally low at all reefs. In the two years following this decline densities steadily increased at Wheeler North Reef and San Mateo, while at Barn they increased in 2011 and decreased in The four-year running average density of fish at Wheeler North Reef during this variable period four-year was slightly higher than that at San Mateo and Barn. Thus, Wheeler North Reef met the performance standard for resident fish density in

28 There is also a performance standard that requires the density of young-of-year fish on Wheeler North Reef be similar to natural reefs Young-of-Year Fish are defined as reef associated fish that were born in the year that they were sampled. The rationale for this performance standard is that kelp forests serve as important nursery habitat for reef associated fish and that it is important for the Wheeler North Reef to provide this important ecological function. 27
29 Plotted here are the average densities of young-of-year fish for Wheeler North Reef, San Mateo and Barn for Densities of young-of-year fish have been consistently low at all three reefs averaging only a few individuals per 100 m 2 transect. YOY densities at Wheeler North and San Mateo have been very similar and have steadily increased over the last four years. In contrast YOY density at Barn has shown alternating increases and decreases during this time much like that seen for resident fish. The four-year averages at Wheeler North Reef and San Mateo were nearly identical and larger than that observed at Barn. Thus, the Wheeler North Reef met the performance standard for YOY density in
30 Fish diversity is measured as the mean number of species of fish per transect and it includes fish of all ages (i.e., resident fish and young-of-year- fish) During the four-year sampling period fish diversity at Wheeler North Reef and San Mateo has followed a similar increasing trajectory with the number of species of fish per transect at Wheeler North higher than that at San Mateo. Fish diversity has been consistently higher at Barn during the four years of monitoring. Because the 4-yr average of fish diversity at the Wheeler North Reef was intermediate between Barn and San Mateo the Wheeler North Reef met the performance standard for fish diversity in

31 The performance standard for fish biomass is a fixed standard that requires the Wheeler North Reef to support at least 28 US tons of fish, which is the estimated reduction in the biomass of kelp bed fish caused by SONGS operations. Thus this is an absolute standard that is measured only at Wheeler North Reef. 30

32 Data on fish density and length collected from the 50 m transects are used to calculate the total standing stock of fish near the bottom on Wheeler North Reef to determine whether it supports 28 tons of reef fish. The weight of each fish counted is estimated from known relationships between length and weights for each species. The weights of all fish counted on a transect are summed to obtain an estimate of fish biomass density for each transect in units of grams per m 2 of reef. The mean biomass density averaged over all transects is multiplied by 176 acres to obtain an estimate of the standing stock of fish near the bottom at Wheeler North Reef. 31
33 Plotted here are the estimates for standing stock of bottom reef fish at the 176 acre Wheeler North Reef for each of the four years of monitoring and for the average of the four years. Temporal trends in fish standing stock resemble those observed for the density of resident fish with a decline from 2009 to 2010 and an increasing trend since The Wheeler North Reef has been far below the absolute performance standard of 28 tons in all four years with the highest value reported for 2012 when standing stock was estimated at 14 tons, or half the tonnage needed to meet the standard. Thus, the Wheeler North Reef failed to meet the performance standard for fish standing stock in 2012, regardless of whether it is evaluated using data from 2012 or the 4-year running average.
 for three common indicator species of reef fish.")
34 The rationale for the performance standard pertaining to fish reproductive rates is that for artificial reefs to be considered successful, fish must be able to successfully reproduce. Our goal in evaluating this performance standard is to estimate the annual egg production (which we refer to as annual fecundity) for three common indicator species of reef fish. The species are the California sheephead and senorita, which are wrasses that feed on invertebrates, and kelp bass, which primarily feeds on other species of fish. To estimate annual fecundity we measure egg production and body length of individuals of each species collected from Wheeler North Reef and the two reference reefs. We then standardize the values of egg production and body length across all species and reefs for a given year. These standardized data are then used to calculate a Fecundity Index for each reef in each year that represents an average fecundity index of the three species. 33
35 Plotted here is the Median Fecundity Index averaged across the three species for Wheeler North Reef, San Mateo and Barn from 2009 through Fish reproductive rates varied inconsistently among the three reefs during the 4- year period. We found that the value of the Median Fecundity Index was highest at Wheeler North Reef in 2009 and 2010, lowest at the Wheeler North Reef in 2011, and intermediate at the Wheeler North Reef in Barn showed similar erratic fluctuations in the Median Fecundity Index over time that varied asynchronously with Wheeler North Reef, while the Fecundity Index at San Mateo showed a consistent increasing trend. Despite all the erratic and asynchronous fluctuations in fish reproductive rates at the three sites their 4-year running averages of the Median Fecundity Index were nearly identical. Thus the Wheeler North Reef met the performance standard for fish reproductive rates in

36 There is also a standard for fish production. The rationale for this standard is that it is important that the Wheeler North Reef actually produce new fish and new biomass of older fish rather than simply attract older slow growing fish from other natural reefs. Production differs from standing stock in that production relates to the rate at which biomass is produced per unit time, whereas standing stock is simply a measure of the biomass that is on the reef at a particular point in time regardless of where and when it was produced. Like most organisms fish can allocate the production of new biomass to growing larger (referred to as somatic growth) or to reproduction (referred to as gonadal growth). Both of these components need to be measured to estimate the amount of fish biomass produced on a reef. We use information on fish density, size structure, and reproductive rates combined with estimates of somatic growth obtained from ear bones to calculate fish production in terms of the biomass of fish produced per area of reef per year.

37 We use five indicator species to estimate fish production on Wheeler North, San Mateo and Barn. These species were chosen because they are among the most common species of fish in the kelp forest and they represent different feeding guilds that use the reef in different ways. Blacksmith eat plankton during the day and seek shelter on the reef at night, señorita eat plankton and small invertebrates on the reef, black perch feed on small invertebrates that live on or near the bottom, sheephead feed on larger invertebrates on the bottom, and kelp bass primarily feed on other species of fish.
38 Plotted in this graph is the average annual production of these five species combined for Wheeler North, San Mateo and Barn for Temporal patterns of reef fish production at Wheeler North Reef mirrored those at San Mateo, but with slightly higher values. At both sites production was highest in 2009 at about 3 g m 2 /y before declining to < 2 g m 2 / y in It has remained near this low value for the past three years at both sites It contrast fish production at Barn has fluctuated greatly over time, but nonetheless has been greater than that observed at Wheeler North Reef and San Mateo in each of the last four years. Because fish production at Wheeler North Reef has been intermediate between Barn and San Mateo in all four years the value of its 4-year running average was also intermediate between the two reference reefs. Thus, the Wheeler North Reef met the performance standard for fish production in 2012.

39 There is also a performance standard that requires the benthic community of the Wheeler North reef to provide food for the fishes that feed on the reef in an amount that is similar to that provided by natural reefs. The way that we evaluate this performance standard is by weighing the content of the guts of two common species of fish that feed on the bottom. We then compare the mass of the gut contents relative to the mass of the fish, minus the mass of the gut contents and the reproductive organs (defined here as body mass) and use the ratio gut mass : body mass to calculate a index of food chain support that is scaled to the mass of a fish. To evaluate the Food Chain support performance standard we transform the values for the FCS index for each of the two species into a standardized FCS index and assess the performance standard using data from both species.
40 The three reefs have shown very different temporal patterns in the values of their standardized food chain support index. The standardized FCS index at Wheeler North Reef has consistently declined in each of the last four years. In contrast the FCS index at San Mateo increased from before showing a slight decline in 2012, while the FCS index at Barn remained relatively constant from before increasing in The four- year running average of the FCS at Wheeler North Reef was lower than that of both reference reefs, but not statistically lower than that at San Mateo. Consequently, the Wheeler North Reef met the performance standard for food chain support in
41 Plotted here then are the mean FCS Indexes for black perch on the left and sheephead on the right, which are the two species used to calculate the standardized FCS Index. We wanted to examine the FCS indices of these two species separately to determine their contributions to the consistent declining trend in the standardized FCS Index observed at Wheeler North Reef. It turns out both species have shown a decline in their FCS Index since The decline in Black Perch is due to a sharp decline from 2010 to 2011, whereas the decline in Sheephead has been a consistent and substantial declining trend in each of the last four years. Much of the diet of these two species consists of relatively small mobile invertebrates that often associate with algae, so the decline in algae at Wheeler North Reef may have something to do with the declines in FCS observed at Wheeler North Reef in recent years. 40

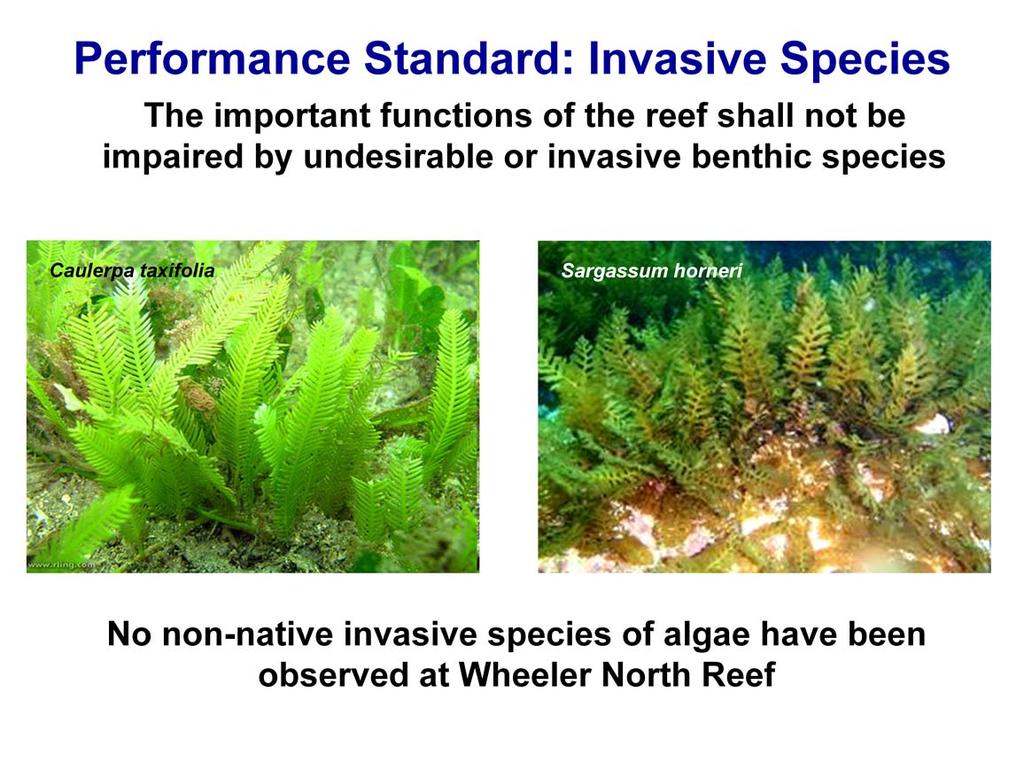
42 The final performance standard that is used to judge the success of the reef mitigation project was enacted to ensure that the important ecological functions of the Wheeler North Reef do not become impaired by invasive or undesirable species. 41

43 Important functions of the reef can include, but are not limited to: food chain support for fishes, nursery habitat for fishes as estimated by the density of youngof-year fish and primary production by giant kelp, which can be estimated from the density of kelp fronds. Undesirable or invasive species can include native species that attain very high abundances, which can be the case for dense aggregations of sea fans that can monopolize space and exclude other species, or high densities of sea urchins that can over graze the bottom and create large deforested areas commonly called sea urchin barrens. Undesirable or invasive species can also include introduced or non-native species such as the green seaweed Caulerpa which has escaped from the aquarium trade and invaded many marine habitats worldwide including some in southern California, and the brown seaweed Sargassum which was accidentally introduced from Asia and has become increasingly abundant on some reefs off southern California. 42

44 Whether they are natives or non-natives, undesirable or invasive species are those species that attain abundances that are high enough to adversely effect the normal functions of a reef. Native sea fans are one such group of species and are know to attain high abundances on artificial reefs in California. Dr. Rich Ambrose and colleagues did a broad survey of artificial and natural reefs in southern California during the 1980 s and found that giant kelp was rare or absent on reefs where sea fan abundance exceeded 10 per m 2. We refer to a density of sea fans of per 10 m 2 as the Ambrose line which indicates a potential problem for a reef with respect to its ability to support giant kelp. 43

45 Plotted here are the mean densities of sea fans at Wheeler North Reef for The vertical lines through the symbols represent the standard error of the means was a good year for sea fan recruitment and the densities of sea fans at Wheeler North Reef increased dramatically to about 6 per m 2. There has been only a slight increase in sea fan density at Wheeler North Reef since 2010 suggesting little colonization by new sea fans during the last two years. Thus sea fan density on Wheeler North Reef remains below the Ambrose line of 10 per m 2. It is worth noting that sea fans observed in the earlier study by Ambrose were mostly very large individuals that occupied a large amount of space on the bottom. In contrast, sea fans on Wheeler North Reef are mostly very small young individuals that do not yet occupy much space on the bottom (in 2012 sea fans covered < 2% of the bottom). 44

46 The destructive damage to kelp forests caused by the grazing activities of large aggregations of sea urchins has been observed in kelp forests throughout the world. Similar to the Ambrose study, Katie Arkema, a former graduate student of ours, found there was a critical density of sea urchins above which giant kelp was unable to persist. This density was about 35 urchins per m 2. For the sake of convention we refer to this density of sea urchins as the Arkema line. 45

47 Plotted here are the mean densities of sea urchins on the Wheeler North Reef, San Mateo and Barn for 2009 to We have observed very low densities of sea urchins at the Wheeler North Reef and the reference reefs so far, and the densities remain well below the Arkema line. 46
48 47

49 We conclude from these data that the important ecological functions of the Wheeler North Reef have not been impaired by invasive or undesirable species. Thus the Wheeler North Reef has consistently met this standard in all three years. 48

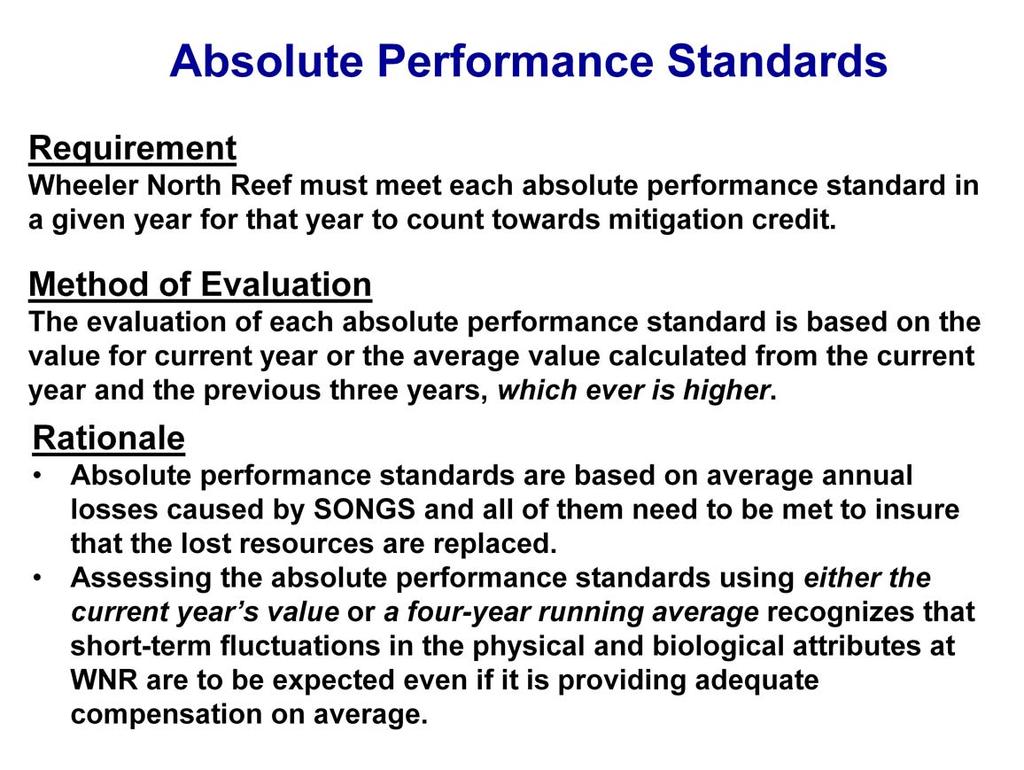
50 To receive mitigation credit for a given year the Wheeler North Reef must: 1. Meet all four absolute performance standards 2. Meet at least as many relative standards as the reference reefs 49

51 Shown here is a summary of the performance of the Wheeler North Reef for 2012 as measured by the 4 absolute performance standards and the 11 relative performance standards. The absolute performance standards are only measured at WNR using data from 2012 or the 4-year running average The relative performance standards are measured at WNR, San Mateo and Barn using only the 4-year running average. A YES means that a performance standard was met while NO means that a performance standard was not met. Wheeler North Reef met 3 of the 4 absolute standards; it failed to meet the standard for fish biomass. Wheeler North Reef met 8 of the 11 relative standards compare to San Mateo which met 7 and Barn which met 9. Thus Wheeler North Reef met as many or more relative standards than the lowest performing reference reef. However, because WNR did not meet the absolute standard for fish biomass it received no mitigation credit for

52 The plan for monitoring in 2013 is to: Continue monitoring the Wheeler North Reef, San Mateo and Barn using the same methods as in previous years, and Conduct additional analyses in Conduct additional analyses to better understand how much acreage is needed for the Wheeler North Reef to consistently meet the performance standard for fish standing stock. 51
Two types of physical and biological standards are used to judge the performance of the Wheeler North Reef 1) Absolute standards are measured against
 Absolute standards are measured against") 1 Two types of physical and biological standards are used to judge the performance of the Wheeler North Reef 1) Absolute standards are measured against fixed value at Wheeler North Reef only 2) Relative
1 Two types of physical and biological standards are used to judge the performance of the Wheeler North Reef 1) Absolute standards are measured against fixed value at Wheeler North Reef only 2) Relative
The SONGS artificial reef mitigation project is linked to the adverse effects of the SONGS single pass seawater cooling system on the San Onofre kelp
 1 Welcome to the annual public workshop to review the status and findings of the reef mitigation project for the San Onofre Nuclear Generating Station Compensating for losses to the San Onofre kelp forest
While the fishing standing stock at Wheeler North Reef has been consistently below the 28 ton requirement, data from last summer s survey showed that
 1 While the fishing standing stock at Wheeler North Reef has been consistently below the 28 ton requirement, data from last summer s survey showed that it increased by 88% in 2014. This raises the question
RECAP The performance standard for fish biomass is an absolute standard that requires the Wheeler North Reef to support at least 28 US tons of reef
 1 RECAP The performance standard for fish biomass is an absolute standard that requires the Wheeler North Reef to support at least 28 US tons of reef dwelling fish. This was the estimated reduction in
Annual Report of the Status of Condition C: Kelp Reef Mitigation in 2016 SAN ONOFRE NUCLEAR GENERATING STATION (SONGS) MITIGATION PROGRAM
 MITIGATION PROGRAM") Annual Report of the Status of Condition C: Kelp Reef Mitigation in 216 SAN ONOFRE NUCLEAR GENERATING STATION (SONGS) MITIGATION PROGRAM Annual Report of the Status of Condition C: Kelp Reef Mitigation
Annual Report of the Status of Condition C: Kelp Reef Mitigation in 216 SAN ONOFRE NUCLEAR GENERATING STATION (SONGS) MITIGATION PROGRAM Annual Report of the Status of Condition C: Kelp Reef Mitigation
Annual Report of the Status of Condition C: Kelp Reef Mitigation SAN ONOFRE NUCLEAR GENERATING STATION (SONGS) MITIGATION PROGRAM
 MITIGATION PROGRAM") 213 Annual Report of the Status of Condition C: Kelp Reef Mitigation SAN ONOFRE NUCLEAR GENERATING STATION (SONGS) MITIGATION PROGRAM 213 Annual Report of the Status of Condition C: Kelp Reef Mitigation
213 Annual Report of the Status of Condition C: Kelp Reef Mitigation SAN ONOFRE NUCLEAR GENERATING STATION (SONGS) MITIGATION PROGRAM 213 Annual Report of the Status of Condition C: Kelp Reef Mitigation
Annual Report of the Status of Condition C: Kelp Reef Mitigation SAN ONOFRE NUCLEAR GENERATING STATION (SONGS) MITIGATION PROGRAM
 MITIGATION PROGRAM") 214 Annual Report of the Status of Condition C: Kelp Reef Mitigation SAN ONOFRE NUCLEAR GENERATING STATION (SONGS) MITIGATION PROGRAM 214 Annual Report of the Status of Condition C: Kelp Reef Mitigation
214 Annual Report of the Status of Condition C: Kelp Reef Mitigation SAN ONOFRE NUCLEAR GENERATING STATION (SONGS) MITIGATION PROGRAM 214 Annual Report of the Status of Condition C: Kelp Reef Mitigation
Fish standing stock is the one performance standard that the artificial reef has never been met. This standard includes the biomass of all fish
 Fish standing stock is the one performance standard that the artificial reef has never been met. This standard includes the biomass of all fish species on the reef. Estimating the standing stock of the
JadEco, LLC PO BOX 445 Shannon, IL 61078
 Introduction: With the assistance of Lake Holiday staff and volunteers, we were able to conduct an AC electrofishing survey on May 8, 27. Water temperatures were 2.3 C (8.5 F) and water clarity was decent
Introduction: JadEco, LLC PO BOX 445 Shannon, IL 61078
 Introduction: was contacted to collected data on the fishery for Lake Holiday. AC Electroshocking was conducted at 2 locations on September 28, 2015. Fish population data was collected for a total of 100
Protect Our Reefs Grant Interim Report (October 1, 2008 March 31, 2009) Principal investigators: Donald C. Behringer and Mark J.
 Principal investigators: Donald C. Behringer and Mark J.") Investigating the role of the spotted spiny lobster (Panulirus guttatus) in the recovery of the long spined sea urchin (Diadema antillarum) on the coral reefs of the Florida Keys Protect Our Reefs Grant
Investigating the role of the spotted spiny lobster (Panulirus guttatus) in the recovery of the long spined sea urchin (Diadema antillarum) on the coral reefs of the Florida Keys Protect Our Reefs Grant
ASMFC Stock Assessment Overview: Red Drum
 Purpose The purpose of this document is to improve the understanding and transparency of the Commission s stock assessment process and results. It is the first of several that will be developed throughout
Summary of Research within Lamlash Bay No-Take Zone - Science report for COAST July
 Summary of Research within Lamlash Bay No-Take Zone - Science report for COAST July 2013 - *Picture of a spider crab (Macropodia spp) inside a plumose anemone. Taken within Lamlash Bay No-Take Zone by
12. School travel Introduction. Part III Chapter 12. School travel
 12. School travel 12.1 Introduction This chapter presents the evidence on changes in travel patterns for the journey to school in the three towns over the period of the Sustainable Travel Town project.
REGIONAL AND LOCAL VARIATION OF BOTTOM FISH AND INVERTEBRATE POPULATIONS
 M. James Allen and Robert Voglin REGIONAL AND LOCAL VARIATION OF BOTTOM FISH AND INVERTEBRATE POPULATIONS One of the projects included in our recently completed research for the EPA was an assessment of
ASMFC Stock Assessment Overview: Red Drum
 Introduction This document presents a summary of the 217 stock assessments for red drum. These assessments were initially conducted through the Southeast Data, Assessment and Review (SEDAR) process using
Fish Community and Aquatic Ecosystem Responses to the Cessation of Eurasian Watermilfoil Chemical Treatment on Lake Ellwood, Wisconsin
 Fish Community and Aquatic Ecosystem Responses to the Cessation of Eurasian Watermilfoil Chemical Treatment on Lake Ellwood, Wisconsin Greg G. Sass Wisconsin Department of Natural Resources Fisheries and
ASMFC Stock Assessment Overview: Atlantic Menhaden
 Introduction This document presents a summary of the 217 Stock Assessment Update for Atlantic menhaden. The assessment is an update to the 215 Benchmark Stock Assessment that was peer reviewed by an independent
Recommendations for Pennsylvania's Deer Management Program and The 2010 Deer Hunting Season
 Recommendations for Pennsylvania's Deer Management Program and The 2010 Deer Hunting Season March 7, 2010 Prepared for The Pennsylvania Game Commission Board of Commissioners By John Eveland RECOMMENDATIONS
Assessment Summary Report Gulf of Mexico Red Snapper SEDAR 7
 Assessment Summary Report Gulf of Mexico Red Snapper SEDAR 7 Stock Distribution: Red snapper are found throughout the Gulf of Mexico, the Caribbean Sea, and from the U.S. Atlantic Coast to northern South
DMU 361 Fremont Deer Management Unit Newaygo, Oceana, N. Muskegon Counties
 DMU 361 Fremont Deer Management Unit Newaygo, Oceana, N. Muskegon Counties Area Description The Fremont Deer Management Unit (DMU 361) was established in 2013. It lies within the Southwest Region and covers
Agenda Item Summary BACKGROUND. Attachment 1
 Agenda Item Summary Attachment 1 BACKGROUND Oregon s recreational abalone fishery was suspended by emergency rule beginning January 1, 2018. This suspension was due to 1) low densities of red abalone,
SPOTLIGHT DEER SURVEY YO RANCHLANDS LANDOWNERS ASSOCIATION ±10,400 ACRES KERR COUNTY
 SPOTLIGHT DEER SURVEY YO RANCHLANDS LANDOWNERS ASSOCIATION ±10,400 ACRES KERR COUNTY WRITTEN BY: SHANE KIEFER, CWB SARAH KAHLICH, AWB PLATEAU LAND & WILDLIFE MANAGEMENT AUGUST 1, 2016 EXECUTIVE SUMMARY
Advice June 2014
 5.3.23 Advice June 2014 ECOREGION STOCK Celtic Sea and West of Scotland Plaice in Division VIIa (Irish Sea) Advice for 2015 Based on ICES approach to data-limited stocks, ICES advises that catches should
Abalone spatial- and age-structured assessment model and projections for Zones A, B, C and D
 FISHERIES/215/AUG/SWG-AB/15 Abalone spatial- and age-structured assessment model and projections for Zones A, B, C and D A. Brandão and D.S. Butterworth Marine Resource Assessment & Management Group (MARAM)
Current Status and Management Recommendations for the Fishery in the Cloverleaf Chain of Lakes
 Current Status and Management Recommendations for the Fishery in the Cloverleaf Chain of Lakes Jason Breeggemann Senior Fisheries Biologist Wisconsin Department of Natural Resources Outline DNR fisheries
Enclosed, please find the 2018 Spotlight Deer Survey Report and Recommendations that we have prepared for your review and records.
 July 26, 2018 YO Ranchlands Landowner Association 1323 Whispering Pines Houston, TX 77055 To the Wildlife Committee: Enclosed, please find the 2018 Spotlight Deer Survey Report and Recommendations that
Evaluating the impact of fishing forage fish on predators. Ray Hilborn School of Aquatic and Fishery Sciences University of Washington
 Evaluating the impact of fishing forage fish on predators Ray Hilborn School of Aquatic and Fishery Sciences University of Washington Thanks to collaborators Thanks to funders Hilborn, Amoroso, Szuwalski
Klamath Lake Bull Trout
 Klamath Lake Bull Trout Existing Populations The Klamath Lake Bull Trout SMU is comprised of seven existing populations and four populations classified as extinct or functionally extinct (Table 189). Populations
Time Will Tell: Long-term Observations of the Response of Rocky-Habitat Fishes to Marine Reserves in Puget Sound
 Time Will Tell: Long-term Observations of the Response of Rocky-Habitat Fishes to Marine Reserves in Puget Sound Wayne A. Palsson, Robert E. Pacunski, and Tony R. Parra Washington Department of Fish and
Search for the missing sea otters
 Search for the missing sea otters Objectives: Based on a real study of sea otter declines Apply your knowledge of basic concepts of population and community ecology Interpret data from graphs and tables
HADDOCK ON THE SOUTHERN SCOTIAN SHELF AND IN THE BAY OF FUNDY (DIV. 4X/5Y)
") Canadian Science Advisory Secretariat Science Advisory Report 26/47 HADDOCK ON THE SOUTHERN SCOTIAN SHELF AND IN THE BAY OF FUNDY (DIV. 4X/5Y) Context Haddock (Melanogrammus aeglefinus) are found on both
Canadian Science Advisory Secretariat Science Advisory Report 26/47 HADDOCK ON THE SOUTHERN SCOTIAN SHELF AND IN THE BAY OF FUNDY (DIV. 4X/5Y) Context Haddock (Melanogrammus aeglefinus) are found on both
The Population Density of Diadema antillarum at Champagne Reef at Scott s Head Soufriere Marine Reserve
 The Population Density of Diadema antillarum at Champagne Reef at Scott s Head Soufriere Marine Reserve Katy Schumann Dominica 2008 Dr. Lacher Dr. Woolley ABSTRACT: The abundance of the long-spined sea
To Fish or Not to Fish? A role-playing activity based on the Marine Reserves process at the Channel Islands National Marine Sanctuary
 To Fish or Not to Fish? A role-playing activity based on the Marine Reserves process at the Channel Islands National Marine Sanctuary Introduction This role playing activity is designed to teach you about
DMU 005 Antrim County Deer Management Unit
 DMU 005 Antrim County Deer Management Unit Area Description Antrim County Deer Management Unit is in the Northern Lower Peninsula Region (NLP). It has roughly 74 square miles (47,451 acres) of public land
Testimony of Ray Hilborn to U.S. Senate subcommittee.
 Testimony of Ray Hilborn to U.S. Senate subcommittee. 24 October 2017 Ray Hilborn, Professor, School of Aquatic and Fishery Sciences, University of Washington, Seattle, WA. Qualifications I am an ecologist
EEB 122b PRACTICE SECOND MIDTERM
 EEB 122b PRACTICE SECOND MIDTERM Page 1 1. You are interested in conducting an experiment with two competing species of plants. Below are the zero-growth isoclines for the two species. C D a) Draw the
STUDY PERFORMANCE REPORT
 STUDY PERFORMANCE REPORT State: Michigan Project No.: F-80-R-7 Study No.: 230654 Title: Evaluation of brown trout and steelhead competitive interactions in Hunt Creek, Michigan. Period Covered: October
Keywords: marine habitat recovery, derelict fishing gear
 Marine habitat recovery after derelict fishing net removal. Jeff June*, Kyle Antonelis, Natural Resources Consultants, Inc. Seattle, WA. *Corresponding author: jjune@nrccorp.com Keywords: marine habitat
CHECKS AND BALANCES. OVERVIEW Students become managers of a herd of animals in a paper-pencil, discussionbased
 CHECKS AND BALANCES 5 OVERVIEW Students become managers of a herd of animals in a paper-pencil, discussionbased activity. BACKGROUND White Tailed Deer White-tailed deer have always been a part of the forest
INLAND LAKE MANAGEMENT REPORT FY Spring 2008
 INLAND LAKE MANAGEMENT REPORT FY 2008 Spring 2008 Prepared by Robert O. Andress District Fisheries Biologist E. Daniel Catchings District Fisheries Supervisor Kevin W. Baswell District Biologist Aide Department
EcoLogic Memorandum. TO: Ben Brezell; EDR FROM: Mark Arrigo RE: Possible Impacts of Dredging Snooks Pond DATE: 6/4/07
 EcoLogic Memorandum TO: Ben Brezell; EDR FROM: Mark Arrigo RE: Possible Impacts of Dredging Snooks Pond DATE: 6/4/07 Background EDR P.C. (EDR) has been contracted by a landowner to assess the feasibility
Know Your River River Afan Salmon and Sea Trout Catchment Summary
 Know Your River River Afan Salmon and Sea Trout Catchment Summary Introduction This report describes the status of the salmon and sea trout populations in the Afan catchments. Bringing together data from
Forage indicators and consumption profiles for Chesapeake Bay fishes
 Forage indicators and consumption profiles for Chesapeake Bay fishes Andre Buchheister Ed Houde Carlos Lozano Presentation to Fisheries GIT Dec 14, 2015 Outline Background & Objectives Result Highlights
PACIFIC BLUEFIN TUNA STOCK ASSESSMENT
 PACIFIC BLUEFIN TUNA STOCK ASSESSMENT SUMMARY 19-21 December 2012 Webinar PACIFIC BLUEFIN TUNA STOCK ASSESSMENT SUMMARY 1. Stock Identification and Distribution Pacific bluefin tuna (Thunnus orientalis)
CARL BLACKWELL LAKE MANAGEMENT PLAN
 CARL BLACKWELL LAKE MANAGEMENT PLAN Background Lake Carl Blackwell impounds Stillwater Creek, 10 miles west of Stillwater in Payne County, Oklahoma (Figure 1). The lake covers 3,370 surface acres and was
DMU 056 Midland County Deer Management Unit
 DMU 056 Midland County Deer Management Unit Area Description The Midland County Deer Management Unit (DMU) 056 is in the Northern Lower Peninsula (NLP) Region. It has roughly 333, 440 acres and consists
DMU 038 Jackson County
 DMU 038 Jackson County Area Description The Jackson Deer Management Unit (DMU), or DMU 038, lies in the Southern Lower Peninsula (SLP) region and covers Jackson County. The DMU consists of five percent
2015 Winnebago System Walleye Report
 215 Winnebago System Walleye Report Adam Nickel, Winnebago Gamefish Biologist, March 216 As winter passes in the rear view mirror, it won t be long until the spring rush of the 216 walleye run is here.
A REVIEW AND EVALUATION OF NATURAL MORTALITY FOR THE ASSESSMENT AND MANAGEMENT OF YELLOWFIN TUNA IN THE EASTERN PACIFIC OCEAN
 A REVIEW AND EVALUATION OF NATURAL MORTALITY FOR THE ASSESSMENT AND MANAGEMENT OF YELLOWFIN TUNA IN THE EASTERN PACIFIC OCEAN Mark N. Maunder and Alex Aires-da-Silva Outline YFT history Methods to estimate
Kenai River Sockeye Escapement Goals. United Cook Inlet Drift Association
 Kenai River Sockeye Escapement Goals United Cook Inlet Drift Association 2014 Evaluating Sockeye Escapement Goals in the Kenai River Utilizing Brood Tables and Markov Tables This presentation pertains
Why has the cod stock recovered in the North Sea?
 Why has the cod stock recovered in the North Sea? Summary The expansion of European fisheries during the 1970s and 1980s resulted in high fishing pressure on stocks of cod, haddock, whiting and saithe
Map Showing NAFO Management Units
 Map Showing NAFO Management Units Biology Are 6 species of seals in Atlantic Canadian waters, all of which occur in Newfoundland Two Arctic Species (Ringed, Bearded) Two temperate (Grey, Harbour) Two migratory
How many adult oysters are in the Great Bay Estuary and how has it changed over time?
 Indicator: in the Great Bay Estuary Question How many adult oysters are in the Great Bay Estuary and how has it changed over time? Short Answer The number of adult oysters decreased from over 25 million
Year Avg. TAC Can Others Totals
 SKATE IN DIVISIONS 3L, 3N, 3O AND SUBDIVISION 3Ps Background There are 8 to 1 species of skate in the waters around Newfoundland. Of these, thorny skate (Raja radiata) is by far the most common, comprising
SOUTH PACIFIC COMMISSION. TWENTY-SECOND REGIONAL TECHNICAL MEETING ON FISHERIES (Noumea, New Caledonia, 6-10 August 1990)
") Page 1 ORIGINAL : ENGLISH SOUTH PACIFIC COMMISSION TWENTY-SECOND REGIONAL TECHNICAL MEETING ON FISHERIES (Noumea, New Caledonia, 6-10 August 1990) STOCK STATUS OF SKIPJACK TUNA IN THE WESTERN TROPICAL
Page 1 ORIGINAL : ENGLISH SOUTH PACIFIC COMMISSION TWENTY-SECOND REGIONAL TECHNICAL MEETING ON FISHERIES (Noumea, New Caledonia, 6-10 August 1990) STOCK STATUS OF SKIPJACK TUNA IN THE WESTERN TROPICAL
DMU 072 Roscommon County Deer Management Unit
 DMU 072 Roscommon County Deer Management Unit Area Description Roscommon County Deer Management Unit is in the Northern Lower Peninsula Region (NLP). It has roughly 205,000 acres of public land which is
2014 Winnebago System Walleye Report
 1986 1988 199 1992 1994 1996 1998 2 22 24 26 28 21 212 214 Number of YOY WAE / Trawl 214 Winnebago System Walleye Report Adam Nickel, Winnebago Gamefish Biologist, 18 March 215 The spring rush of 215 will
GUIDE TO ESTIMATING TOTAL ALLOWABLE CATCH USING SIZE FREQUENCY IN CATCH, EFFORT DATA, AND MPAS
 GUIDE TO ESTIMATING TOTAL ALLOWABLE CATCH USING SIZE FREQUENCY IN CATCH, EFFORT DATA, AND MPAS Contact Rod Fujita, Director, Research and Development Oceans Program, Environmental Defense Fund 123 Mission
WORKING GROUP ON STOCK ASSESSMENTS 5 TH MEETING DOCUMENT SAR-5-08 TARGET SIZE FOR THE TUNA FLEET IN THE EASTERN PACIFIC OCEAN
 INTER-AMERICAN TROPICAL TUNA COMMISSION COMISIÓN INTERAMERICANA DEL ATÚN TROPICAL WORKING GROUP ON STOCK ASSESSMENTS 5 TH MEETING LA JOLLA, CALIFORNIA (USA) 11-13 MAY 2004 DOCUMENT SAR-5-08 TARGET SIZE
Dauphin Lake Fishery. Status of Walleye Stocks and Conservation Measures
 Dauphin Lake Fishery Status of Walleye Stocks and Conservation Measures Date: December, 21 Dauphin Lake Fishery Status of Walleye Stocks and Conservation Measures Background: Walleye stocks in Dauphin
Wildlife Ad Awareness & Attitudes Survey 2015
 Wildlife Ad Awareness & Attitudes Survey 2015 Contents Executive Summary 3 Key Findings: 2015 Survey 8 Comparison between 2014 and 2015 Findings 27 Methodology Appendix 41 2 Executive Summary and Key Observations
DMU 065 Ogemaw County Deer Management Unit
 DMU 065 Ogemaw County Deer Management Unit Area Description Ogemaw County Deer Management Unit is in the Northern Lower Peninsula Region (NLP). It has roughly 99,000 acres of public land which is about
The Aging Curve(s) Jerry Meyer, Central Maryland YMCA Masters (CMYM)
 Jerry Meyer, Central Maryland YMCA Masters (CMYM)") The Aging Curve(s) Jerry Meyer, Central Maryland YMCA Masters (CMYM) Even the well-publicized benefits of Masters Swimming cannot prevent us from eventually slowing down as we get older. While some find
The Aging Curve(s) Jerry Meyer, Central Maryland YMCA Masters (CMYM) Even the well-publicized benefits of Masters Swimming cannot prevent us from eventually slowing down as we get older. While some find
Know Your River - River Ogmore Salmon and Sea Trout Catchment Summary
 Know Your River - River Ogmore Salmon and Sea Trout Catchment Summary Introduction This report describes the status of the salmon and sea trout populations in the Ogmore catchments. Bringing together data
6/23/2010. Characteristics of Invasive Species
 Aquatic Nuisance Species Aquatic Invasive Species Exotic Aquatics Biological Roulette By the end of the 21st century, biological invasions [will] become one of the most prominent ecological l issues on
Big Canyon 67 miles upstream. 38 miles upstream
 TEXOMA STRIPED BASS MANAGEMENT/RESEARCH Texoma is one of only about 1 reservoirs in the country that has a naturally reproducing striped bass population. Texoma is set off further from most reservoirs
Atlantic croaker, Micropogonias undulatus (Linnaeus, 1766)
") Atlantic croaker, Micropogonias undulatus (Linnaeus, 1766) Although Atlantic croaker occur throughout much of Florida, they are seldom found south of Tampa Bay on the gulf coast or south of the Indian
Atlantic croaker, Micropogonias undulatus (Linnaeus, 1766) Although Atlantic croaker occur throughout much of Florida, they are seldom found south of Tampa Bay on the gulf coast or south of the Indian
Purple Sea Urchin Barrens
 Purple Sea Urchin Barrens Nancy, Cassie and Jessica Pattern Sea Urchins existing in two stable states. Crevices along coastlines feeding on kelp litter that drifts by Emerged from the crevices creating
Canadian Science Advisory Secretariat Gulf Region Science Advisory Report 2016/036
 Canadian Science Advisory Secretariat Gulf Region Science Advisory Report 2016/036 ASSESSMENT OF THE SOUTHERN GULF OF ST. LAWRENCE (NAFO DIV. 4T) SPRING AND FALL SPAWNER COMPONENTS OF ATLANTIC HERRING
DMU 006 Arenac County Deer Management Unit
 DMU 006 Arenac County Deer Management Unit Area Description The Arenac County Deer Management Unit (DMU) 006 is in the Northern Lower Peninsula (NLP) Region. It has roughly 248,320 acres and consists of
Susquehanna River Walleye Fishery
 Susquehanna River Walleye Fishery 2008 The Susquehanna River is the largest tributary to the Atlantic Ocean lying completely within the United States. It originates from the outlet of Otsego Lake in Cooperstown,
A Hare-Lynx Simulation Model
 1 A Hare- Simulation Model What happens to the numbers of hares and lynx when the core of the system is like this? Hares O Balance? S H_Births Hares H_Fertility Area KillsPerHead Fertility Births Figure
2017 Lake Winnebago Bottom Trawling Assessment Report
 217 Lake Winnebago Bottom Trawling Assessment Report Adam Nickel, Winnebago System Gamefish Biologist, March 218 There were several highlights from the 217 Lake Winnebago bottom trawling survey, including
Worldwide Office 4245 North Fairfax Drive, Suite 100 Arlington, VA 22203
 October 24, 2017 Megan Ware Atlantic States Marine Fisheries Commission 1050 North Highland Street, Suite 200A-N Arlington, Virginia 22201 [sent via email] Dear Ms. Ware and Menhaden Management Board members,
Rat Cove and Brookwood Point littoral fish survey, 2002
 Rat Cove and Brookwood Point littoral fish survey, 2 Katie Wayman 1 INTRODUCTION During the summer of 2, efforts to monitor the Otsego Lake littoral fish community continued with trap netting at both Rat
BLACK SEA WHITING, MERLANGIUS MERLANGUS EUXINUS NORDMANN
 82 BLACK SEA WHITING, MERLANGIUS MERLANGUS EUXINUS NORDMANN The taxonomic position of the Black Sea whiting like that of a great number of Black Sea fish species is rather complicated, and is still a controversial
Chesapeake Bay Jurisdictions White Paper on Draft Addendum IV for the Striped Bass Fishery Management Plan
 Chesapeake Bay Jurisdictions White Paper on Draft Addendum IV for the Striped Bass Fishery Management Plan Maryland Department of Natural Resources, District of Columbia s Fisheries and Wildlife Division,
Relation between coral reef degradation and the Overexploitation of coral reef fishes in El-Tur region, Egyptian Red Sea Coast
 Relation between coral reef degradation and the Overexploitation of coral reef fishes in El-Tur region, Egyptian Red Sea Coast By Manal M. Sabrah and Azza A. El-Ganainy National Institute of Oceanography
Status and Distribution of the Bobcat (Lynx rufus) in Illinois
 in Illinois") Transactions of the Illinois State Academy of Science received 9/14/99 (2000), Volume 93, #2, pp. 165-173 accepted 1/16/00 Status and Distribution of the Bobcat (Lynx rufus) in Illinois Alan Woolf 1, Clayton
Transactions of the Illinois State Academy of Science received 9/14/99 (2000), Volume 93, #2, pp. 165-173 accepted 1/16/00 Status and Distribution of the Bobcat (Lynx rufus) in Illinois Alan Woolf 1, Clayton
ATLANTIC STATES MARINE FISHERIES COMMISSION. Winter Flounder Abundance and Biomass Indices from State Fishery-Independent Surveys
 ATLANTIC STATES MARINE FISHERIES COMMISSION Winter Flounder Abundance and Biomass Indices from State Fishery-Independent Surveys Technical Committee Report to the Winter Flounder Management Board February
Conservation Limits and Management Targets
 Conservation Limits and Management Targets Setting conservation limits The use of conservation limits (CLs) in England and Wales (E&W) has developed in line with the requirement of ICES and NASCO to set
West Coast Rock Lobster. Description of sector. History of the fishery: Catch history
 West Coast Rock Lobster Description of sector History of the fishery: The commercial harvesting of West Coast rock lobster commenced in the late 1800s, and peaked in the early 1950s, yielding an annual
Full summaries of all proposed rule changes, including DMU boundary descriptions, are included in the additional background material.
 The Florida Fish and Wildlife Conservation Commission (FWC) implemented a public outreach and input process in 2013 and 2014 in management Zones A, B and C. The goal of this process was to present the
DMU 024 Emmet County Deer Management Unit
 DMU 024 Emmet County Deer Management Unit Area Description Emmet County Deer Management Unit is in the Northern Lower Peninsula Region (NLP). It has roughly 126 square miles (80,371 acres) of public land
A. SOUTHERN NEW ENGLAND / MID-ATLANTIC (SNE/MA) WINTER FLOUNDER ASSESSMENT SUMMARY FOR 2011
 WINTER FLOUNDER ASSESSMENT SUMMARY FOR 2011") A. SOUTHERN NEW ENGLAND / MID-ATLANTIC (SNE/MA) WINTER FLOUNDER ASSESSMENT SUMMARY FOR 2011 State of Stock: In 2010 the SNE/MA winter flounder stock was overfished but overfishing was not occurring. The
A. SOUTHERN NEW ENGLAND / MID-ATLANTIC (SNE/MA) WINTER FLOUNDER ASSESSMENT SUMMARY FOR 2011 State of Stock: In 2010 the SNE/MA winter flounder stock was overfished but overfishing was not occurring. The
STUDY PERFORMANCE REPORT
 STUDY PERFORMANCE REPORT State: Michigan Project No.: F-53-R-14 Study No.: 486 Title: Assessment of lake trout populations in Michigan s waters of Lake Michigan. Period Covered: April 1, 1997 to March
Redd Dewatering and Juvenile Salmonid Stranding in the Lower Feather River,
 Redd Dewatering and Juvenile Salmonid Stranding in the Lower Feather River, 2005-2006 Interim Report for NOAA Fisheries Prepared by: California Department of Water Resources Division of Environmental Services
Life history Food Distribution Management... 98
 BEAR: Table of Contents Overview Life history... 97 Food... 97 Distribution... 98 Management... 98 2010 Statistical Reports Controlled spring bear season harvest... 100 General season black bear harvest...
Central Hills Prairie Deer Goal Setting Block G9 Landowner and Hunter Survey Results
 Central Hills Prairie Deer Goal Setting Block G9 Landowner and Hunter Survey Results Table of Contents Public Surveys for Deer Goal Setting... 1 Methods... 1 Hunter Survey... 2 Demographics... 2 Population
CHAPTER 10 TOTAL RECREATIONAL FISHING DAMAGES AND CONCLUSIONS
 CHAPTER 10 TOTAL RECREATIONAL FISHING DAMAGES AND CONCLUSIONS 10.1 INTRODUCTION This chapter provides the computation of the total value of recreational fishing service flow losses (damages) through time
FISHERIES BLUE MOUNTAINS ADAPTATION PARTNERSHIP
 FISHERIES A warming climate, by itself, substantially affects the hydrology of watersheds in the Blue Mountains. Among the key hydrologic changes projected under all scenarios for the 2040s and beyond
Update: This document has been updated to include biological information on red snapper and information from the recent Gulf of Mexico Fishery
 Update: This document has been updated to include biological information on red snapper and information from the recent Gulf of Mexico Fishery Management Council (Gulf Council) meeting. Author: Luiz Barbieri
7 GULF OF ALASKA POLLOCK
 7 GULF OF ALASKA POLLOCK 7.1 Introduction For the Gulf of Alaska (GOA) pollock fishery, the Principle 1 and 2 PIs were mapped against the following indicators within the stated reports: FAM PI: Assessment
ASMFC Stock Assessment Overview: Black Drum
 Introduction This document presents a summary of the 215 benchmark stock assessment for black drum. The assessment was peerreviewed by an independent panel of scientific experts through the ASMFC integrated
Overview 10/8/2015. October Pelagic Advice Pelagic AC 7 October 2015
 October Pelagic Advice Pelagic AC 7 October 2015 John Simmonds ICES ACOM Vice Chair Overview WG 1 Blue whiting NSS herring North Sea horse makerel WG 2 Stocks Northeast Atlantic mackerel Western horse
Eurasian water-milfoil (Myriophyllum spicatum) SCUBA Dive Monitoring Survey Sand Bar Lake WBIC: Bayfield County, Wisconsin
 SCUBA Dive Monitoring Survey Sand Bar Lake WBIC: Bayfield County, Wisconsin") Eurasian water-milfoil (Myriophyllum spicatum) SCUBA Dive Monitoring Survey Sand Bar Lake WBIC: 2494900 Bayfield County, Wisconsin 6ft EWM Towers with Rooted Branch Preparing to Fall Off (Berg 2016) EWM
Eurasian water-milfoil (Myriophyllum spicatum) SCUBA Dive Monitoring Survey Sand Bar Lake WBIC: 2494900 Bayfield County, Wisconsin 6ft EWM Towers with Rooted Branch Preparing to Fall Off (Berg 2016) EWM
DMU 008 Barry County Deer Management Unit
 DMU 8 Barry County Deer Management Unit Area Description The Barry County Deer Management Unit (DMU) 8 is in the Southwest Region and was once part of the Bellevue deer management unit 38. Bellevue DMU
SWG-11-JM-10. F Limit Reference Points about Preventing Recruitment Overfishing and its Uncertainty
 11th Meeting of the Science Working Group Lima, Peru, 1-19 October 01 F Limit Reference Points about Preventing Recruitment Overfishing and its Uncertainty One of the purposes of reference points (RPs)
DMU 040 Kalkaska County Deer Management Unit
 DMU 040 Kalkaska County Deer Management Unit Area Description The Kalkaska County Deer Management Unit (DMU 040) is in the Northern Lower Peninsula Region (NLP) (Figure 1). It has roughly 170,000 acres