RBFF/CAHSS Conservation Study
|
|
|
- Dwayne Foster
- 5 years ago
- Views:
Transcription

1 RBFF/CAHSS Conservation Study December 2015
2 Contents INTRO RBFF Detailed Findings CAHSS Detailed Findings Combined Detailed Findings Appendices Pages 3-13 Pages Pages Pages Pages Background + Objectives + Methodology + Respondent Criteria + Executive Summary + Understanding Max Diff + Licensing + Conservation + Message Prioritization + Demographics + Licensing + Conservation + Message Prioritization + Demographics + Regional analyses RBFF + Segments + Beginner/Avid + Boaters + Hispanic + Gender CAHSS + Segments + Beginner/ Avid + Gender Map of regions 2
3 Background The RBFF and CAHSS boards represent a diverse set of organizations and constituencies including state departments of natural resources, manufacturers, media, and conservation organizations. Within this community of stakeholders, there s a strong belief that hunting and fishing enthusiasts are some of the most ardent supporters of conservation, and that in order to drive growth in license sales, it s critical to build awareness among anglers and shooters of the linkage between licenses and conservation. This approach doesn t necessarily reflect extant data on the subject, and such a strategy is subject to perennial debate. Previous research indicates that respondents buy licenses because it s the right thing to do. The contribution to conservation enabled by these license purchases helps to reinforce the initial purchase decision, but alone does not serve as a primary impetus. In other words, people are buying licenses because they want to get outdoors learning that money is going back into local conservation efforts is a feel-good bonus. However, none of the research to date truly examines the linkage between conservation and license purchase in detail. RBFF and CAHSS would like to gain clearer and more concrete data on respondent motivations. An in-depth examination of the issue will provide us with the necessary information to confidently move forward with clear direction for both brands and their communication strategies. 3
4 Objectives Benchmark current awareness of the connection between licenses and local conservation. How many respondents know where license proceeds are going? How does this change among our target audiences? How do our target audiences compare to both general population and avid segment? Develop a better understanding of the relative importance of conservation messaging to our primary target audiences. To what degree is this group motivated by this message? How does that motivation vary among our target audiences? How does that motivation compare to both the general population and avid segment? Ascertain to what degree being motivated by conservation correlates with actual license purchase. 04 Gain insight into what type of conservation messages are most relevant and motivating to our audience(s), and where they would be most receptive to these messages. 4

5 Methodology & Structure 15 minute online survey, utilizing the following sample structure N=1540 Fielded: September 29 th -October 28 th 2015 Refer to slide 85 for full regional map 5

, friends, or alone Participate in outdoor activities to build expertise in sport/activity AND/OR Enjoy outdoor activities for")
6 Outdoor Enthusiasts Family Outdoors Respondent Criteria Aged 18 and up Have children under 18 in household (if no children, eliminate from consideration for family outdoors) Participate in outdoor activities more than once a year; activities must include fishing or hunting/shooting Participate in outdoor activities with children under 18 Participate in outdoor activities to build relationships with my family Aged 18 and up Participate in outdoor activities at least once a month; activities must include fishing or hunting/shooting Participate in outdoor activities with spouse/significant other, family members (such as parents, siblings, but not own children), friends, or alone Participate in outdoor activities to build expertise in sport/activity AND/OR Enjoy outdoor activities for the experience/excitement AND/OR enjoy outdoor activities to get away or escape 6

7 Anglers Hunters/Shooters Respondent Criteria, cont. Beginning/Intermediate Anglers Either Family Outdoors or Outdoor Enthusiasts Fish 1-10x/yr. Avid Anglers Outdoor Enthusiast Fish 11+x/year Own fishing equipment and regularly use it when I fish. Boaters A subset of Beginning/Intermediate Anglers or Avid Anglers, non-exclusive definition in terms of sample) Partic ipates in boating Currently owns a boat and fishes from a boat (canoe, kayak, rowboat, electric motor, etc.) Hispanics A subset of family Outdoors, non-exclusive definition in terms of sample Hunters Beginning/ Interm ed iate Hunters Either Family Outdoors or Outdoor Enthus ias ts Hunt 1-4x/yr. Avid Hunters Outdoor Enthusiast Hunt 5+x/year Shooters Beginning/Intermediate Shooters Either Family Outdoors or Outdoor Enthusiast Shoot 1-9x/yr. Avid Shooters Outdoor Enthusiast Shoot 10+x/year 7
8 Executive Summary: Overall License Conservation Overall, approximately three-quarters of respondents are aware of the connection between licensing and conservation on an aided basis (directionally higher among shooters/hunters vs. anglers). While nearly all (over 9 out of 10) like the idea that they are funding conservation with their licensing fees, it is not the main driver for why they participate in outdoor activities. They are participating because they appreciate the outdoors and the time they spend in nature. Nearly everyone is aware they need a license, and most people hold one. Eight in ten respondents claim they purchased a license because it is a required rule and the right thing to do. Conservation is not a main driver of licensing purchase. Through a Max Diff prioritization of messaging (see slide 13 for more details), both anglers and hunters/shooters prefer the detailed conservation messaging of: 100% of your license fees are invested back into conservation, ensuring healthy fish/wildlife populations and public access to fishing/hunting/shooting opportunities. 100% of your license fees are invested back to state wildlife agencies to ensure healthy fish/wildlife populations and public access to fishing/hunting/shooting opportunities in your state 8
9 Executive Summary: RBFF License Conservation While the majority of anglers correctly understand that their license fees go towards conservation, the following are significantly more aware of the connection: Outdoor Enthusiasts, Avid Anglers and Boaters. While nearly all like the idea that they are funding conservation with their licensing fees, it is not the main driver for why they fish or participate in outdoor activities. They are participating because they appreciate the outdoors and the time they spend with their family. Almost all anglers, however, care about healthy fish populations and protecting and preserving the waterways. See slides for more details Most anglers know you need a license to fish and have purchased one in the past. However, Outdoor Enthusiasts, Avid Anglers and Boaters are significantly more likely to have purchased a license, especially Annual licenses. In terms of why they purchase licenses, most claim they purchased a license because it is a required law. However, Outdoor Enthusiasts, Avid Anglers and Boaters are all significantly more likely to say because they want to support a sport they are passionate about, as well as because the fees go towards conservation. When asked the reasons why they fish, respondents categorized as Family Outdoors and Beginner/Intermediate Anglers are significantly more likely to fish for family reasons (spending time with family, family traditions) Outdoor Enthusiasts and Avid Anglers are significantly more likely to fish for reasons other than family (enjoy solitude, catch own food). Boaters have the largest range of reasons (including both family and non-family rationale). And Hispanics while also stating family reasons, also are significantly more likely to say starting a new hobby. 9
10 Executive Summary: CAHSS License Conservation While the majority of shooters/hunters correctly understand that their license fees go towards conservation, the following are significantly more aware of the connection: Outdoor Enthusiasts, Avid Shooters and Avid Hunters. While nearly all like the idea that they are funding conservation with their licensing fees, it is not the main driver for why they participate in shooting/hunting and outdoor activities. They are participating because they appreciate the outdoors and the adventure and excitement shooting and hunting offers. Most hunters/shooters know you need a license and have purchased one in the past. However Hunters are significantly more likely than Shooters to have a license. While conservation is not a main driver of licensing purchase overall, almost half hunters/shooters claim this is one reason to purchase a license. Outdoor Enthusiasts, as well as Avid Hunters, are significantly more likely to purchase a license because they know the fees are invested back into conservation. When asked why they shoot or hunt, respondents categorized as Outdoor Enthusiasts, Avid Shooters and Avid hunters are significantly more likely to say a variety of reasons, including it is a good way to promote conservation and keep the tradition alive that was passed down by family. Avid Shooters and Avid Hunters both participate in more outdoor activities than Beginner/Intermediates and tend to be older, males, who are looking to shoot or hunt for excitement and solitude. See slides for more details 10
11 Executive Summary: Regional License As seen with earlier findings, most responde nts are aware that their licensing fees go towards conservation. There are no major differences regionally on this topic. Conservation Nearly all respondents like the idea that they are funding conservation with their licensing fees. This is particularly true of the Midwest region, and also in the East North Central region. While nearly everyone is aware they need a license to fish or hunt, respondents in the Midwest are significantly more likely than any other region to be aware. The Midwest is also significantly more likely to have purchased annual licenses in the past and know they needed a license by general knowledge. Roughly, e ight in ten respondents claim they purchased a license because it is a required rule and the right thing to do., with more respondents in the Midwest and South saying this. Conservation is not a main driver of licensing purchase, but the Midwest is the region garnering the highest score, with the West North Central, as well as the East South Central, scoring higher than other regions. See slides for more details 11
12 Executive Summary: Implications License Conservation As expertise and commitment to the sport increase, so does knowledge of conservation. If the organizations desire to increase awareness of this connection, it may be necessary to create targeted marketing efforts for those who are new to fishing/hunting/shooting activities. A theme across studies and analyses is that while conservation is deemed important, it is not the reason why people participate in fishing or hunting. Their love for the sport, as well as their enjoyment for the outdoors is the driving factor to their participation. In order to increase the relevance of conservation, a stronger connection between conservation and the activities themselves needs to be communicated so that the target audiences can understand the tangible benefits of these efforts. Another consistent finding in both studies is how the majority of respondents know they need a license to fish or hunt, but that conservation is not a main driver of purchase. Again, it will be necessary for the target audiences to fully understand the end benefit of conservation in order to elevate that as a main driver of license behavior. Additionally, specialized executions around about licensing would be beneficial for the different segments as we learned that there are different drivers to participation among the Outdoor Enthusiasts vs. Family Outdoors and Beginners vs. Avids. There are also different demographics for these groups that could also be highlighted in creative executions. Across all groups in the study, conservation messaging that outlined how much and where the licensing fees were being used were the most relevant messaging tested. These messages could serve as the foundation for strengthening the connection between licensing and conservation as they begin to show the end benefit for these efforts. 12
13 Understanding Max Diff MaxDiff is an approach for obtaining preference/importance scores for multiple items (brand preferences, brand images, product features, advertising claims, or in this case membership benefits) using marketing or social survey research. With MaxDiff, respondents are shown a set (subset) of the possible benefits in the study, and are asked to indicate the benefit they value the most and the benefit they value the least. MaxDiff scoring uses a sophisticated estimation technique to compute scores for each respondent on each benefit. Hierarchical Bayes (HB) is the statistical technique used. This test utilized n=788 for RBFF and n=752 for CAHSS for overall respondents and tested 8-9 different messages. Respondents viewed three messages at a time over a total of ten screens. Instead of using a 0 to 100 scale, the MaxDiff data has been transformed into scores on a scale that may be stated as: Index Score = (0 to 100) X N N = the number of items tested With this method, scores above 100 are always above average and scores below 100 are always below average. Indexed scores greater than or equal to 100 represent a benefit that tested at average to exceptional levels. Scores performing under 100 represent benefits that were lower performing. An index of 100 is an average performing benefit A score above 100 is accepted as better than average performance A score of 99 or lower is below average 13

14 01 RBFF Detailed Findings + Licensing + Conservation + Message Prioritization

15 Nearly everyone is aware they need a license, and most people hold one. 91% are aware that they need a license to fish or hunt 94% hold a license 73% Annual 23% Short term 7% Lifetime Where learned about it? General knowledge: 61% State fish and wildlife agency website: 31% Sporting/retail store: 19% A friend: 18% Other website: 5% Where purchased? Sporting/retail store: 79% Online: 22% Toll free number: 4% Q2. Do you know if you need a license to fish, or hunt? Base=Total Respondents (n=788) Q3. What kind of fishing license have you purchased in the past? Base=Total Respondents (n=788) Q4a. How did you find out you needed a fishing license? Base=License Holder (n=737) Q4. Where did you purchase your fishing license? Base=License Holder (n=737) 15
16 Over 80% claim they purchased a license because it is a required rule. Reasons Purchased Fishing License The rules and regulations require it, and I want to stay within the bounds of law 83% It is the right thing to do 60% I enjoy funding a sport that I am passionate about 38% All of my fishing license fees are invested back into conservation 38% Other 1% Total equals more than 100%. Multiple responses allowed. Q7. Which of the following are reasons why you have purchased/would purchase a fishing license? Base=Total Respondents: (n=788) 16
 License Fees Used For Conservation/Preservation 45% Maintenance Miscellaneous (DNR, Fees, Education) Activities 11% 11% 11% Funding 8% Administration 7% Don't Know")
17 License fees are most commonly thought to go towards conservation. What do the licensing fees go towards? (Open End Responses) License Fees Used For Conservation/Preservation 45% Maintenance Miscellaneous (DNR, Fees, Education) Activities 11% 11% 11% Funding 8% Administration 7% Don't Know 24% Q5. What do the licensing fees go towards? Base=Total Respondents (n=788) 17
18 When asked directly, a majority are aware that license funds go towards conservation efforts. Anglers: Agreement Statements T2B I am aware that funds generated from license sales go towards conservation efforts 4% 5% 16% 31% 44% 75% I am aware that all of my license fees go towards state fish and wildlife agencies 4% 5% 18% 34% 39% 73% I am aware that manufacturers pay excise taxes on the sale of fishing and boating gear and equipment that go towards conservation efforts 8% 10% 30% 26% 26% 52% Completely Disagree Somewhat Disagree Neither Agree nor Disagree Somewhat Agree Completely Agree Q6. Before you go fishing and hunting, you do need a license. Please indicate how much you agree or disagree with each statement. Base=Total Respondents (n=788) 18
 Conservation means Maintenance Protection Preservation Saving Sustainability Miscellaneous (Wildlife, Communication, Promotion) Conserving the environment/natural resources")
19 People define conservation as maintenance, protection, and preservation. What does the word conservation mean to you? (Open End Responses) Conservation means Maintenance Protection Preservation Saving Sustainability Miscellaneous (Wildlife, Communication, Promotion) Conserving the environment/natural resources Rebuild/Grow Don't Know 27% 22% 21% 17% 10% 8% 7% 5% 2% Q8. What does the word conservation mean to you? Base=Total Respondents (n=788) 19
20 While there is awareness for conservation, it is not a main driver for why people fish. They are fishing to appreciate the outdoors. Reasons to Fish I enjoy spending time outdoors It allows me to spend time with my family I participated as a child 57% 65% 81% It is a low cost activity It gives me an opportunity to unplug I enjoy the solitude I wanted to take my children It offers adventure and excitement 47% 46% 45% 54% 52% It s easily accessible To continue the tradition passed down by family members I like to catch my own food My children asked me to take them A friend or relative invited me to join them It is a good way to promote conservation I went as a part of a vacation or group outing I wanted to try a new hobby I recently moved to the state and wanted to try fishing here Other 2% 5% 41% 36% 31% 31% 23% 15% 13% 11% Total equals more than 100%. Multiple responses allowed. Q1. Which of the following are reasons why you fish? Base=Total Respondents (n=788) 20

21 Nearly all care about healthy fish populations and appreciate that their fees goes towards conservation efforts. License Agreement Statements I care about healthy fish populations and public access to fishing opportunities 27% 69% 96% I want to help protect and preserve our waterways 27% 68% 96% 93% like that all their licensing fees goes towards conservation I am passionate about conservation There is not enough education on conservation 39% 40% 42% 38% 80% 77% Somewhat Agree Completely Agree Q9. When you purchase a fishing license, all the fees go towards conservation. Knowing this, how do you feel about these efforts? Q10. Please indicate how much you agree or disagree with each of the following statements regarding fishing licenses. Base=Total Respondents: (n=788) 21
22 The highest priority conservation messages detail out that 100% of licensing fees are invested back into ensuring healthy fish populations. RBFF Max Diff Index Scores 100% of your fishing license fees are invested back to state wildlife agencies to ensure healthy fish populations and public access to fishing opportunities in your state. 100% of your fishing license fees are invested back into conservation, ensuring healthy fish populations and public access to fishing opportunities The revenue generated from your fishing license goes toward conserving your local waterways today and for generations to come. 140 When you purchase a fishing license, equipment, and gear, or register your boat, you directly contribute to conservation efforts. 101 Anglers are a critical part of the natural ecosystem. Participation ensures that waterways remain clean, healthy and accessible. 84 Your license funds go towards conservation efforts. 65 Fishing and boating help preserve waterways for the next generation. 58 Fishing and boating help promote conservation of the outdoors. 44 Your license funds go to fisheries management. 28 Which one of the following conservation messages is the most meaningful to you and which conservation message is the least meaningful to you? Base=Total Respondents (n=788) 22

23 01 RBFF Detailed Findings + Demographics

24 Almost nine out of ten respondents participate in outdoor activities once a month. Frequency of Participation in Outdoor Activities At least weekly 44% Every other week Once a month 20% 24% 87% participate at least once a month Every other month 3% 4-5 times a year 5% 2-3 times a year 5% QS11. How often do you participate in outdoor activities? Base=Total Respondents (n=788) 24
25 Most participate in outdoor activities with either a spouse or a significant other, or their young children. Who Outdoor Activities Are Participated With Spouse/Significant Other 74% Young children (under 18) 62% Friends 54% Other family members (parents, siblings, etc.) 38% Adult children (18+) 21% Business associates 5% A mentor 2% Other I typically do these activities alone 2% 2% Total equals more than 100%. Multiple responses allowed. QS12. Who do you participate in these outdoor activities with? Base=Total Respondents (n=788) 25
26 Respondents enjoy building relationships with their family, to gain experience and stay active. Agreement Statements T2B Scores: (Somewhat/Completely Agree) I enjoy outdoor activities for the experience/excitement 40% 55% 95% Outdoor activities ensure I get my exercise/stay active 40% 53% 93% I participate in outdoor activities to build relationships with my family 43% 50% 93% Outdoor activities help me forget about my normal routine 42% 46% 88% I participate in outdoor activities to build expertise in my sport/activity 39% 24% 63% I enjoy the solitude I receive from participating in activities alone 36% 27% 62% Somewhat Agree Completely Agree QS13. How much do you agree or disagree with each of the following statements? Base=Total Respondents: (n=788) 26
27 Besides fishing, respondents enjoy walking, camping, hiking and bicycling. Outdoor Activities Participate In Fishing Walking Camping Hiking Bicycling Boating Running Hunting Recreational shooting Backpacking Skiing Climbing Snowboarding Rafting Water skiing/wake boarding 12% 11% 11% 10% 10% 61% 51% 46% 40% 32% 27% 22% 19% Total equals more than 100%. Multiple responses allowed. 86% 100% QS14. Which of the following outdoor activities do you participate in? Base=Total Respondents (n=788) 27
28 Most typically fish four to ten times per year, using their own equipment. Fishing Frequency Fishing Equipment Used 1 to 3 times 16% I own all my fishing equipment and regularly use it when I fish 91% 4 to 10 times 52% I borrow family/friend s equipment when I fish 7% 11 to 30 times 24% 31 or more times 8% I rent equipment when I fish 2% Beginning/Intermediate Anglers: 68% Avid Anglers: 32% QS15. How many times do you fish in a typical year? QS16. Which of the following best describes the equipment you use when fishing? Base=Total Respondents (n=788) 28
29 Almost two-thirds own a boat; of those, most use their boat to fish. Ways Respondents Fish Type of Boat Owned From a boat 18% Motorized boat Kayak 24% 85% From the shore/pier 34% Canoe Row boat 21% 18% From both a boat and shore/pier 48% Sailboat Other 11% 3% Current Boat Ownership Is Boat Used To Fish? 19% 3% 19% 62% 97% Yes, I own a boat No, used to own a boat but not currently No, never owned a boat Boater: 24% Non-Boater: 76% Yes No QS17. Which way do you typically fish? Base=Total Respondents (n=788) /QS18. Do you currently own a boat? (Base=Participate in Boating (n=316) QS19. What type of boat do you own? Base=Currently Own a Boat (n=195) /QS20. Do you use the boat you own to fish? Base=Currently Own a Boat (n=195) 29
30 Demographics GENDER AGE REGION HH INCOME EMPLOYMENT 58% 42% HISPANIC 18-34: 31% 35-44: 23% 45-54: 20% 55-64: 17% 65+: 9% RACE Mountain: 7% Pacific: 12% South Atlantic: 22% East North Central: 17% West North Central: 9% East South Central: 7% West South Central: 10% New England: 4% Middle Atlantic: 12% KIDS UNDER 18 <$30K: 2% $30K-$49,999: 4% $50K-$74,999: 41% $75K-$99,999: 26% $100K-$124,999: 14% $125K+: 12% Prefer not to answer: 1% MARITAL STATUS Full-Time: 57% Part-Time: 9% Temporarily Unemployed: 1% Student: 2% Homemaker: 16% Retired: 13% Not employed: 2% EDUCATION Yes: 8% No: 92% Caucasian: 87% African/Black: 6% Asian: 4% American Indian/ Alaskan Native: 1% Other: 2% Yes: 65% No: 35% Single: 9% Married: 79% Living w/sign. other: 7% Divorced/Separated: 4% Widowed: 1% Some college or less: 43% College graduate: 37% Completed graduate school: 6% Post-graduate work: 14% 30

31 02 CAHSS Detailed Findings + Licensing + Conservation + Message Prioritization

32 Nearly everyone is aware they need a license, and a large amount of Shooters hold one. Recreational Shooters: Licensing Awareness & Behaviors 93% are aware that they need a license to fish or hunt 83% hold a license 59% Annual 25% Short term 10% Lifetime Where learned about it? General knowledge: 61% State fish and wildlife agency website: 34% Sporting/retail store: 17% A friend: 22% Other website: 11% Where purchased? Sporting/retail store: 78% Online: 29% Toll free number: 6% Q2. Do you know if you need a license to fish, or hunt? Base=Total Shooters (n=376) Q3. What kind of fishing license have you purchased in the past? Base=Total Shooters (n=376) Q4a. How did you find out you needed a fishing license? Base= Shooter License Holder (n=311) Q4. Where did you purchase your fishing license? Base=Shooter License Holder (n=311) 32

33 Much like Shooters, almost all Hunters are aware they need a license, but more Hunters hold a license than Shooters. Hunters: Licensing Awareness & Behaviors 93% are aware that they need a license to fish or hunt 97% hold a license 72% Annual 29% Short term 6% Lifetime Where learned about it? General knowledge: 65% State fish and wildlife agency website: 33% Sporting/retail store: 18% A friend: 22% Other website: 8% Where purchased? Sporting/retail store: 81% Online: 24% Toll free number: 6% Q2. Do you know if you need a license to fish, or hunt? Base=Total Hunters (n=376) Q3. What kind of fishing license have you purchased in the past? Base=Total Hunters (n=376) Q4a. How did you find out you needed a hunting license? Base= Shooter License Holder (n=365) Q4. Where did you purchase your hunting license? Base=Shooter License Holder (n=365) 33
34 Shooters and Hunters feel similarly on why they purchase a license: because the rules and regulations require it. Reasons Purchased Hunting License The rules and regulations require it, and I want to stay within the bounds of law 79% 82% It is the right thing to do 64% 64% I enjoy funding a sport that I am passionate about 47% 51% All of my hunting license fees are invested back into conservation 44% 46% Other 1% 5% Recreational Shooters Hunters Totals equals more than 100%. Multiple responses allowed. Q7. Which of the following are reasons why you have purchased/would purchase a hunting license? Base=Total Respondents (Recreational Shooters: n=376; Hunters: n=376) 34
 License Fees Used For Conservation/Preservation Miscellaneous (DNR, Fees, Government) 2% 1% 49% 48% Administration Activities Funding Maintenance Don't Know Shooters 13% 13% 10%")
35 License fees are most commonly thought, by both Shooter and Hunters, to go towards conservation. What do the licensing fees go towards? (Open End Responses) License Fees Used For Conservation/Preservation Miscellaneous (DNR, Fees, Government) 2% 1% 49% 48% Administration Activities Funding Maintenance Don't Know Shooters 13% 13% 10% 10% 7% 5% 4% 3% 18% 20% Hunters Q5. What do the licensing fees go towards? Base=Total Respondents (Recreational Shooters: n=376; Hunters: n=376) 35
36 When asked directly, a large majority of Shooters are aware that license funds go towards conservation efforts. Recreational Shooters: Agreement Statements T2B I am aware that funds generated from license sales go towards conservation efforts 3% 1% 14% 26% 57% 83% I am aware that all of my license fees go towards state fish and wildlife agencies 3% 3% 14% 28% 52% 80% I am aware that manufacturers pay excise taxes on the sale of firearms, ammunition, and archery equipment that go towards conservation efforts 5% 3% 23% 29% 41% 69% Completely Disagree Somewhat Disagree Neither Agree nor Disagree Somewhat Agree Completely Agree Q6. Before you go fishing and hunting, you do need a license. Please indicate how much you agree or disagree with each statement. Base=Total Shooters (n=376) 36
37 Similar to Shooters, most Hunters are also aware that license funds go towards conservation efforts. Hunters: Agreement Statements I am aware that all of my license fees go towards state fish and wildlife agencies 1% 4% 13% 38% 45% T2B 82% I am aware that funds generated from license sales go towards conservation efforts 1% 4% 14% 33% 48% 81% I am aware that manufacturers pay excise taxes on the sale of firearms, ammunition, and archery equipment that go towards conservation efforts 3% 8% 23% 36% 30% 66% Completely Disagree Somewhat Disagree Neither Agree nor Disagree Somewhat Agree Completely Agree Q6. Before you go fishing and hunting, you do need a license. Please indicate how much you agree or disagree with each statement. Base=Total Hunters (n=376) 37
 Conservation means Maintenance Protection Preservation Saving Sustainability Miscellaneous (Wildlife, Communication, Promotion) Conserving the wildlife/environment/natural")
38 Conservation is described the same for both Shooters and Hunters: as maintenance, protection and preservation. What does the word conservation mean to you? (Open End Responses) Conservation means Maintenance Protection Preservation Saving Sustainability Miscellaneous (Wildlife, Communication, Promotion) Conserving the wildlife/environment/natural Rebuild/Grow Don't Know 29% 28% 17% 19% 20% 19% 13% 13% 10% 9% 9% 12% 12% 9% 8% 8% 1% 4% Shooters Hunters Q8. What does the word conservation mean to you? Base=Total Respondents (Recreational Shooters: n=376; Hunters: n=376) 38
39 Conservation is not a main reason why respondents shoot or hunt; Instead, they enjoy spending times outdoors and seek the adventure and excitement associated with the sport. Reasons to Hunt/Shoot I enjoy spending time outdoors 75% 74% It offers adventure and excitement It allows me to spend time with my family It gives me an opportunity to unplug 38% 46% 48% * 54% * 60% 58% I participated as a child 39% 36% To continue the tradition passed down by family members 36% 43% I enjoy the solitude I like to harvest my own food A friend or relative invited me to join them It is a good way to promote conservation I wanted to take my children 28% 26% 25% 25% 33% 33% 29% 36% 38% 47% * Hunters also are driven by family traditions and the ability to harvest their own food My children asked me to take them 19% 17% I wanted to try a new sport I went as a part of a vacation or group outing I recently moved to the state and wanted to try shooting/hunting Other 1% 6% 6% 5% * 17% 14% 12% 13% Totals equals more than 100%. Multiple responses allowed. Shooters Hunters Q1. Which of the following are reasons why you hunt/participate in shooting sports? Base=Total Respondents (Recreational Shooters: n=376; Hunters: n=376) NOTE: Capital letters in [ ] denote statistical significance at the 95% confidence level. 39

40 Nearly all care about healthy wildlife populations and appreciate that their fees goes towards conservation efforts. Shooters are significantly more likely than Hunters to say they are passionate about conservation. License Agreement Statements (T2B: Somewhat/Completely Agree) I care about healthy wildlife populations and public access to hunting opportunities 92% 95% 93% of Shooters and 92% of Hunters like that all their licensing fees goes towards conservation I want to help protect and preserve our wildlife I am passionate about conservation There is not enough education on conservation 80% 77% 76% 85% * 95% 95% Shooters Hunters Q9. When you purchase a hunting license, all the fees go towards conservation. Knowing this, how do you feel about these efforts? Q10. Please indicate how much you agree or disagree with each of the following statements regarding hunting licenses. Base=Total Respondents (Recreational Shooters: n=376; Hunters: n=376) NOTE: * denotes statistical significance at the 95% confidence level. 40
41 The two highest conservation messages detail out that 100% of hunting licensing fees are invested back into ensuring healthy wildlife populations. CAHSS Max Diff Index Scores 100% of your hunting license fees are invested back into conservation, ensuring healthy wildlife populations and public access to hunting and shooting opportunities. 100% of your hunting license fees are invested back to state wildlife agencies to ensure healthy wildlife populations and public access to hunting opportunities in your state The revenue generated from your hunting license goes toward conserving your local wildlife today and for generations to come. 149 Hunting and Shooting sports help preserve wildlife for the next generation. 81 When you purchase a hunting license, equipment, and gear, you directly contribute to conservation efforts. 80 Hunting and Shooting sports help promote conservation of the outdoors. 50 Your license funds go towards conservation efforts. 48 Your license funds go to wildlife management. 40 Which one of the following conservation messages is the most meaningful to you and which conservation message is the least meaningful to you? Base=Total Respondents (n=752) 41


42 02 CAHSS Detailed Findings + Demographics
43 The majority of Shooters and Hunters participate in outdoor activities at least once a month. Frequency of Participation in Outdoor Activities At least weekly Every other week Once a month 21% 22% 15% 17% 50% 53% 89% of recreational shooters and 88% of hunters participate at least once a month Every other month 3% 3% 4-5 times a year 5% 6% 2-3 times a year 2% 3% Shooters Hunters QS11. How often do you participate in outdoor activities? Base=Total Respondents (Recreational Shooters: n=376; Hunters: n=376) 43
44 Most participate in outdoor activities with either a spouse or a significant other, their young children or their friends. Who Outdoor Activities Are Participated With Spouse/Significant Other 75% 76% Young children (under 18) 60% 63% Friends 59% 59% Other family members 44% 44% Adult children (18+) 22% 20% Business associates 9% 8% A mentor 3% 2% Other 0% 1% I typically do these activities alone 3% 3% Shooters Hunters Totals equals more than 100%. Multiple responses allowed. QS12. Who do you participate in these outdoor activities with? Base=Total Respondents (Recreational Shooters: n=376; Hunters: n=376) 44
45 Both Shooters and Hunters value similar things for why they participate in outdoor activities. Agreement Statements T2B Scores: (Somewhat/Completely Agree) Shooters Hunters I enjoy outdoor activities for the experience/excitement Outdoor activities ensure I get my exercise/stay active I participate in outdoor activities to build relationships with my family Outdoor activities help me forget about my normal routine I participate in outdoor activities to build expertise in my sport/activity I enjoy the solitude I receive from participating in activities alone 64% 64% 71% 77% 97% 95% 95% 92% 94% 94% 89% 90% QS13. How much do you agree or disagree with each of the following statements? Base=Total Respondents (Recreational Shooters: n=376; Hunters: n=376) 45
46 Besides Shooting and Hunting, respondents enjoy walking, camping, hiking and bicycling. Hunters are significantly more likely to say they participate in fishing. Outdoor Activities Participate In Fishing Walking Camping Hiking Bicyclying Boating Running Hunting Recreational shooting Backpacking Skiing Climbing Snowboarding Rafting Water skiing/wake boarding 29% 31% 24% 19% 17% 19% * 14% 15% 16% 17% 14% 17% 17% * 73% 85% 82% 79% 68% 71% 60% 54% 48% 46% 40% 40% 39% 39% 45% Shooters Hunters Totals equals more than 100%. Multiple responses allowed. * 100% 100% QS14. Which of the following outdoor activities do you participate in? Base=Total Respondents (Recreational Shooters: n=376; Hunters: n=376) NOTE: * denotes statistical significance at the 95% confidence level. 46
47 Shooters actively participate more often than Hunters, who typically hunt between 1-4 times per year. Frequency of Recreational Shooting Frequency of Hunting 1 to 4 times 28% 1 to 4 times 47% 5 to 9 times 23% 5 to 9 times 27% 10 or more times 49% 10 or more times 27% Beginning/Intermediate Shooters: 26% Avid Shooters: 24% Beginning/Intermediate Hunters: 23% Avid Hunters: 27% QS15. How many times do you participate in shooting sports/hunt in a typical year? Base=Total Respondents (Recreational Shooters: n=376; Hunters: n=376) 47


48 Demographics GENDER AGE REGION HH INCOME EMPLOYMENT 47% 53% HISPANIC 18-34: 41% 35-44: 25% 45-54: 15% 55-64: 12% 65+: 7% RACE Mountain: 9% Pacific: 15% South Atlantic: 20% East North Central: 15% West North Central: 8% East South Central: 7% West South Central: 11% New England: 2% Middle Atlantic: 13% KIDS UNDER 18 <$30K: 4% $30K-$49,999: 6% $50K-$74,999: 36% $75K-$99,999: 30% $100K-$124,999: 13% $125K+: 10% Prefer not to answer: 1% MARITAL STATUS Full-Time: 65% Part-Time: 8% Temporarily Unemployed: 1% Student: 2% Homemaker: 12% Retired: 10% Not employed: 1% EDUCATION Yes: 7% No: 93% Caucasian: 90% African/Black: 4% Asian: 2% American Indian/ Alaskan Native: 1% Other: 2% Prefer not to answer: 1% Yes: 69% No: 31% Single: 9% Married: 77% Living w/sign. other: 7% Divorced/Separated: 6% Widowed: 1% Some college or less: 41% College graduate: 37% Completed graduate school: 8% Post-graduate work: 13% 48

49 03 Combined Detailed Findings + Regional analyses
50 Mostly everyone knows they need a license to fish, or hunt, regardless of region; however, the Midwest is significantly more likely than any other region to know this. Is a License to Fish or Hunt Required- % Saying Yes West [A] 92% Midwest [B] 97% [A,C,D] South [C] 90% Northeast [D] 90% Q2. Do you know if you need a license to fish, or hunt? Base=West (n=329), Midwest (n=376), South (n=593), Northeast (n=242) NOTE: Capital letters in [ ] denote statistical significance at the 95% confidence level. 50
51 Most knew they needed a license mostly by general knowledge and through their state fish and wildlife agency website. General knowledge is significantly more likely to be how they learned in the Midwest than any other region. How They Learned A Fishing/Hunting License Is Needed General knowledge 60% 59% 56% 71% [A,C,D] State fish and wildlife agency website Sporting goods store/retail store that sells fishing/hunting equipment A friend 11% 15% 20% 18% 21% 25% 23% [B] [B] [B] 21% 23% [B] [B] [B] 35% 34% 35% [B] [B] [B] [A] [B] [C] [D] West Midwest South Northeast External website 7% 4% 8% [B] 12% [A,B] Other 1% 2% 2% 2% Totals equals more than 100%. Multiple responses allowed. Q4a. How did you find out you needed a fishing/hunting license? Base=West (n=329), Midwest (n=376), South (n=593), Northeast (n=242) NOTE: Capital letters in [ ] denote statistical significance at the 95% confidence level. 51
52 While most have purchased a license in the past, annual licenses are significantly more likely to be purchased in the Midwest than any other region. Past Fishing/Hunting License Purchase Annual license 66% 67% 68% 76% [A,C,D] Short term license Lifetime hunting and fishing license holder 6% 5% 9% 7% [B] 31% 23% 26% 21% [B,D] [A] [B] [C] [D] West Midwest South Northeast Never purchased a license before 10% 6% 8% 11% [B] Totals equals more than 100%. Multiple responses allowed. Q3. What kind of fishing/hunting license have you purchased in the past? Base=West (n=329), Midwest (n=376), South (n=593), Northeast (n=242) NOTE: Capital letters in [ ] denote statistical significance at the 95% confidence level. 52
53 Most think to purchase their license at a sporting goods store or retail store; the Northeast was significantly lower for sporting goods store/retail store, compared to the other regions. Location of Fishing/Hunting License Purchase Sporting goods store/retail store that sells fishing/hunting equipment 71% 82% 83% 78% [D] [D] [D] Online Toll free number to purchase 5% 3% 5% 9% [B] 25% 19% 24% 31% [B] [A] [B] [C] [D] West Midwest South Northeast Other 2% 3% 4% 6% Totals equals more than 100%. Multiple responses allowed. Q4. Where did you purchase your fishing/hunting license? Base=West (n=329), Midwest (n=376), South (n=593), Northeast (n=242) NOTE: Capital letters in [ ] denote statistical significance at the 95% confidence level. 53
54 No differences are seen by region: most are aware that license funds go towards conservation efforts. Agreement Statements T2B Scores: (Somewhat/Completely Agree) West Midwest South Northeast I am aware that funds generated from license sales go towards conservation efforts 79% 81% 77% 79% I am aware that all of my license fees go towards state fish and wildlife agencies 77% 79% 75% 77% I am aware that manufacturers pay excise taxes on the sale of fishing and boating gear, firearms, ammunition, and archery equipmnet 57% 58% 64% 64% Q6. Before you go fishing and hunting, you do need a license. Please indicate how much you agree or disagree with each statement. Base=West (n=329), Midwest (n=376), South (n=593), Northeast (n=242) 54
55 Regardless of region, most feel similarly on why they purchase a license, with the Midwest and the South being significantly more likely to purchase a license because it is the law. Reasons Purchased Fishing/Hunting License The rules and regulations require it, and I want to stay within the bounds of law It is the right thing to do I enjoy funding a sport that I am passionate about All of my fishing/hunting license fees are invested back into conservation 46% 43% 39% 38% 45% 42% 41% [C] 52% [B,C] 63% 62% 62% 60% 79% 84% 84% 76% [D] [D] Other 2% 2% 1% 2% West Midwest South Northeast [A] [B] [C] [D] Totals equals more than 100%. Multiple responses allowed. Q7. Which of the following are reasons why you have purchased/would purchase a fishing/hunting license? Base=West (n=329), Midwest (n=376), South (n=593), Northeast (n=242) NOTE: Capital letters in [ ] denote statistical significance at the 95% confidence level. 55
56 The majority of all respondents like knowing their license fees go towards conservation. No real differences seen regionally. License Fees Go Towards Conservation % Saying I Like It West [A] 91% Midwest [B] 95% [A] South [C] 92% Northeast [D] 95% Q9. When you purchase a fishing/hunting license, all the fees go towards conservation. Knowing this, how do you feel about these efforts? Base=West (n=329), Midwest (n=376), South (n=593), Northeast (n=242) NOTE: Capital letters in [ ] denote statistical significance at the 95% confidence level. 56
57 The majority of respondents know they need a license to fish, or hunt. The East North Central and West North Central regions have slightly more awareness than the other regions. Is a License to Fish or Hunt Required- % Saying Yes 95% 91% 88% 97% 97% [C] [B, C, H] [B, C, H] 94% [C] 93% 90% Mountain Pacific South Atlantic ENC WNC ESC WSC NE/Mid Atlantic [A] [B] [C] [D] [E] [F] [G] [H] Q2. Do you know if you need a license to fish, or hunt? Base=Mountain (n=121), Pacific (n=208), South Atlantic (n=326), ENC (n=246), WNC (n=130), ESC (n=109), WSC (n=158), NE/Mid Atlantic (n=242) NOTE: Capital letters in [ ] denote statistical significance at the 95% confidence level. 57
58 While most knew by general knowledge that they need a license to either fish or hunt, the regions of Mountain, East North Central, West North Central and West South Central were significantly higher than other regions for saying general knowledge. How They Learned A Fishing/Hunting License Was Needed Region General Knowledge State fish and wildlife agency website Sporting good store/retail store that sells fishing/hunting equipment Mountain [A] Pacific [B] S Atlantic [C] ENC [D] WNC [E] ESC [F] WSC [G] NE/Mid Atlantic [H] 71% 54% 53% 70% 75% 65% 69% 56% [B, C, H] [B, C, H] [B, C, H] [C] [B, C, H] 31% 37% 37% 26% 25% 32% 30% 35% 17% 26% 21% 14% 5% 19% 21% 18% [E] [D,E] [D,E] [D,E] [E] [D,E] [E] [E] [E] [E] A friend 18% 23% 25% 15% 15% 16% 19% 23% [D,E] External website 5% 8% 8% 4% 4% 6% 10% 12% NOTE: Capital letters in [ ] denote statistical significance at the 95% confidence level. Totals equals more than 100%. Multiple responses allowed. [D] [D,E] [D,E] [A,D,E, F] Q4a. How did you find out you needed a fishing/hunting license? Base= License Holders: Mountain (n=110), Pacific (n=187), South Atlantic (n=293), ENC (n=230), WNC (n=123), ESC (n=106), WSC (n=149), NE/Mid Atlantic (n=215) 58
59 Mostly all respondents have purchased a license in the past; those in the East South Central region were particularly higher than most other regions for past license purchase. Past Licenses Purchased Region Mountain [A] Pacific [B] S Atlantic [C] ENC [D] WNC [E] ESC [F] WSC [G] NE/Mid Atlantic [H] License Holder (Net) 91% 90% 90% 93% 95% 97% 94% 89% Annual license 68% 65% 63% 75% 77% 72% 71% 68% Short term license 29% 32% 26% 24% 20% 26% 25% 21% Lifetime hunting and fishing license holder Never purchased a license before [E, H] NOTE: Capital letters in [ ] denote statistical significance at the 95% confidence level. Totals equals more than 100%. Multiple responses allowed. 7% 6% 10% 4% 7% 11% 6% 7% [B, D] [B,C] 9% 10% 10% 7% 5% 3% 6% 11% [H] [A, B, C, H] [F] [F] [F] [E,F,G] [B,C] [D] [H] Q3. What kind of license have you purchased in the past? Base=Mountain (n=121), Pacific (n=208), South Atlantic (n=326), ENC (n=246), WNC (n=130), ESC (n=109), WSC (n=158), NE/Mid Atlantic (n=242) 59
60 Licenses are most commonly purchased at a sporting goods store/retail store; those located in the Mountain, Pacific, East North Central and West South Central and significantly more likely to purchase there than other regions. Location of License Purchase Region Sporting goods store/retail store that sells fishing/hunting equipment Mountain [A] Pacific [B] S Atlantic [C] ENC [D] WNC [E] ESC [F] WSC [G] NE/Mid Atlantic [H] 84% 81% 74% 84% 80% 80% 85% 71% [C,H] [C,H] [C,H] [H] [C,H] Online 27% 24% 27% 18% 22% 24% 18% 31% Toll free number to purchase 5% 5% 6% 3% 2% 3% 5% 9% Other 3% 2% 4% 2% 3% 7% 1% 6% NOTE: Capital letters in [ ] denote statistical significance at the 95% confidence level. Totals equals more than 100%. Multiple responses allowed. [D,G] [E] [G] [D,G] D,E,F] [G] Q4. Where did you purchase your fishing/hunting license? Base= License Holders: Mountain (n=110), Pacific (n=187), South Atlantic (n=293), ENC (n=230), WNC (n=123), ESC (n=106), WSC (n=149), NE/Mid Atlantic (n=215) 60
61 Awareness levels of what license fees go towards are strong; the West North Central region had the highest scores for awareness. Region I am aware that all of my license fees go towards state fish and wildlife agencies I am aware that funds generated from license sales go towards conservation efforts I am aware that manufacturers pay excise taxes on the sale of fishing and boating gear, firearms, ammunition and archery equipment that go towards conservation efforts Mountain [A] Pacific [B] S Atlantic [C] NOTE: Capital letters in [ ] denote statistical significance at the 95% confidence level. Agreement Statements (T2B: Somewhat/Completely Agree %) ENC [D] WNC [E] ESC [F] WSC [G] NE/Mid Atlantic [H] 82% 75% 71% 77% 82% 77% 82% 77% [C] [C] [C] 83% 77% 75% 78% 85% 77% 81% 79% 68% 61% 58% 54% 62% 53% 61% 64% [C,D,F] [B,C] [D] Q6. Before you go fishing and hunting, you do need a license. Please indicate how much you agree or disagree with each statement. Base=Mountain (n=121), Pacific (n=208), South Atlantic (n=326), ENC (n=246), WNC (n=130), ESC (n=109), WSC (n=158), NE/Mid Atlantic (n=242) 61
62 The West North Central, East South Central and West South Central regions had stronger scores for conservation being the reason they purchase a license. Reasons Purchased a License Region The rules and regulations require it, and I want to stay within the bounds of law Mountain [A] Pacific [B] S Atlantic [C] ENC [D] WNC [E] ESC [F] WSC [G] NE/Mid Atlantic [H] 82% 78% 83% 83% 86% 88% 85% 76% [H] [B,H] [B,H] [H] It is the right thing to do 64% 62% 60% 61% 62% 61% 66% 60% I enjoy funding a sport that I am passionate about All of my fishing/hunting license fees are invested back into conservation 45% 47% 36% 40% 48% 47% 40% 52% [C] [C] [C,D,G] 43% 35% 38% 41% 51% 51% 45% 41% [B,C] [B,C] [B] Other 3% 2% 1% 2% 2% 2% 2% 2% NOTE: Capital letters in [ ] denote statistical significance at the 95% confidence level. Totals equals more than 100%. Multiple responses allowed. Q7. Which of the following are reasons why you have purchased/would purchase a fishing/hunting license? Base=Mountain (n=121), Pacific (n=208), South Atlantic (n=326), ENC (n=246), WNC (n=130), ESC (n=109), WSC (n=158), NE/Mid Atlantic (n=242) 62
63 The majority of respondents like knowing their license fees go towards conservation; those located in the East North Central region are more likely than most other regions to like this. License Fees Go Towards Conservation % Saying I Like It 88% 92% 92% 98% [A,B,C,E,G] 89% 93% 92% 95% Mountain Pacific South Atlantic ENC WNC ESC WSC NE/Mid Atlantic [A] [B] [C] [D] [E] [F] [G] [H] Q9. When you purchase a fishing/hunting license, all the fees go towards conservation. Knowing this, how do you feel about these efforts? Base=Mountain (n=121), Pacific (n=208), South Atlantic (n=326), ENC (n=246), WNC (n=130), ESC (n=109), WSC (n=158), NE/Mid Atlantic (n=242) NOTE: Capital letters in [ ] denote statistical significance at the 95% confidence level. 63
64 04 Appendices RBFF + Segments + Beginner vs. Avid + Boaters + Hispanic
65 RBFF: Family Outdoors vs. Outdoor Enthusiasts When asked the reasons why they fish, respondents categorized as Family Outdoors were significantly more likely to fish for family reasons than those categorized as Outdoor Enthusiasts. (i.e. to spend time with their family (80% vs. 54%), because their children asked them to (47% vs. 17%), to continue the tradition passed down by family members (43% vs. 31%); the same was true of Outdoor Enthusiasts: they were significantly more likely to fish for reasons other than family (i.e. easily accessible (44% vs. 36%), like to catch own food (35% vs. 27%), enjoy the solitude (53% vs. 39%).) While most Family Outdoors and Outdoor Enthusiasts know you need a license to fish and have purchased one in the past, Outdoor Enthusiasts are significantly more likely to have purchased a license (95% vs. 91%), especially annual licenses (76% vs. 68%) and Lifetime licenses (9% vs. 4%). The majority of both Family Outdoors and Outdoor Enthusiasts both correctly understand that their license fees go towards conservation, but Outdoor Enthusiasts were significantly more likely to be aware of this than Family Outdoors: awareness that funds generated from license sales go towards conservation (79% vs. 71%) awareness that all license fees go towards state fish and wildlife agencies (76% vs. 69%) awareness of manufacturers paying excise taxes on the sale of fishing/boating gear and equipment that go towards conservation efforts (56% vs. 48%). While most purchase licenses because it is the law (and of those, Family Outdoors are significantly more likely to say this (87% vs. 79%), Outdoor Enthusiasts are significantly more likely to purchase a license to support a sport they are passionate about (47% vs. 28%) and because the fees go towards conservation (42% vs. 35%). Both groups equally like knowing that their license funds go towards conservation as both care about healthy fish populations and want to protect and preserve their waterways. Sample Size: Family Outdoors (n=359); Outdoor Enthusiasts (n=429) 65
66 RBFF: Family Outdoors vs. Outdoor Enthusiasts 06 Demographic Differences There was significantly more female Family Outdoors and significantly more male Outdoor Enthusiasts (74% female/26% male Family Outdoors; 46% female/54% male Outdoor Enthusiasts). Family Outdoors also had significantly more younger respondents, while the Outdoor Enthusiasts had significantly more older respondents: 70% of Family Outdoors were younger than 45 years of age (compared to 40% of Outdoor Enthusiasts); 60% of Outdoor Enthusiasts were 45 or older (compared to only 30% of Family Outdoors). There was significantly more Family Outdoors in the South (45% vs. 34%) and significantly more Outdoor Enthusiasts in the Northeast (21% vs. 10%). Family Outdoors were significantly more likely to be married (86% vs. 72%), while Outdoor Enthusiasts were significantly more likely to be single (14% vs. 4%) Outdoor Enthusiasts are significantly more likely to participate in Boating (48% vs. 31%), Recreational Shooting (26% vs. 18%) and Hunting (34% vs. 18%). They are also more likely to own a boat (69% vs. 48%). Most respondents are employed; however, Outdoor Enthusiasts were significantly more likely to have retirees (22% vs. 3%) and less likely to have homemakers (6% vs. 28%). There were no differences between Family Outdoors and Outdoor Enthusiasts among race/ethnicity, income and education. Sample Size: Family Outdoors (n=359); Outdoor Enthusiasts (n=429) 66
67 RBFF: Beginner/Intermediate Anglers vs. Avid Anglers Beginner/Intermediate Anglers are significantly more likely to say they fish because of family reasons: my children asked me to take them (33% vs. 25%) and I wanted to take my children (48% vs. 41%). Avid Anglers are significantly more likely to fish for other reasons besides family: for the excitement and adventure (57% vs. 40%), because it is easily accessible (52% vs. 35%), like to catch own food (39% vs. 28%), enjoyment of the solitude (58% vs. 42%), a good way to promote conservation (22% vs. 12%), having participated as a child (63% vs. 54%), gives them an opportunity to unplug (58% vs. 50%), and spending time outdoors (87% vs. 78%). While most know you need a license to fish, Avid Anglers are significantly more likely to say they know over Beginner/Intermediate Anglers (94% vs. 91%); Avid Anglers are also significantly more likely to have purchased a license (99% vs. 91%), especially annual licenses (85% vs. 67%) and Lifetime licenses (12% vs. 4%). Beginner/Intermediate Anglers are significantly more likely to have purchased a short term license (27% vs. 15%). When asked where their license fees go, the most commonly given top of mind answer was conservation; however, Avid Anglers are significantly more likely to say this (51% vs. 42%). Beginner/Intermediates were significantly more likely to say they didn t know where the fees go (27% vs. 17%). Avid Anglers were also significantly more likely to agree that their fees go towards conservation when directly asked: awareness that funds generated from license sales go towards conservation (85% vs. 71%) awareness that all license fees go towards state fish and wildlife agencies (79% vs. 70%) awareness of manufacturers paying excise taxes on the sale of fishing/boating gear and equipment that go towards conservation efforts (61% vs. 48%). While most purchase licenses because it is the law, Avid Anglers are significantly more likely to purchase a license to support a sport they are passionate about (53% vs. 31%) and because the fees go towards conservation (47% vs. 35%). Sample Size: Beginner/Intermediate Anglers (n=537); Avid Anglers (n=251) 67
68 RBFF: Beginner/Intermediate Anglers vs. Avid Anglers Both groups equally like knowing that their license funds go towards conservation as both care about healthy fish populations and want to protect and preserve their waterways. Avid Anglers were significantly more likely to say they care about healthy fish populations and public access to fishing opportunities (98% vs 95%). Demographic Differences There was significantly more female Beginner/Intermediate Anglers and significantly more male Avid Anglers (66% female/34% male Beginner/Intermediate; 43% female/57% male Avid). The Beginner/Intermediates were also significantly more younger respondents, while the Avids had significantly more older respondents: <45 years: Beginner/Intermediate (59%); Avid (43%); 45+: Beginner (41%); Avid (57%). There was significantly more Beginner/Intermediates in the West (23% vs. 12%) and significantly more Avids in the Northeast (25% vs. 12%). Beginner/Intermediate Anglers were significantly more likely to have children under 18 years of age (72% vs. 52%) and are significantly more likely to participate in outdoor activities with these young children (69% vs. 46%). Avid Anglers participate in outdoor activities more often than Beginner/Intermediate Anglers, and also participate in more activities than Beginner/Intermediates. They are also significantly more likely own a boat (76% vs. 50%). Avid Anglers were also significantly more likely to have higher household incomes (57% vs. 50% were $75K or more); they were also significantly more likely to have retirees (21% vs. 10%) and less likely to have homemakers or part-time workers. Sample Size: Beginner/Intermediate Anglers (n=537); Avid Anglers (n=251) 68
69 RBFF: Boaters vs. Non Boaters When asked the reasons why they fish, respondents categorized as Boaters were significantly more likely to fish for a variety of reasons than respondents categorized as Non Boaters: Because it offers adventure and excitement: 56% vs 42% Because it allows them to spend time with family: 72% vs. 63% Because they like to catch their own food: 48% vs. 26% Because they enjoy the solitude: 54% vs. 45% Because it is a good way to promote conservation: 27% vs. 12% Boaters were significantly more likely to have purchased a license (98% vs. 92%), especially an annual license (85% vs. 69%). Non Boaters were significantly more likely to have purchased short term licenses (26% vs. 14%). Boaters were significantly more likely to be aware that license fees go towards conservation: Funds generated from license sales go towards conservation (84% vs. 73%) All license fees go towards state fish and wildlife agencies (81% vs. 70%) While most purchase licenses because it is the law, Boaters were significantly more likely to purchase a license to support a sport they are passionate about (48% vs. 35%) and because the fees go towards conservation (48% vs. 35%). Both groups equally like knowing that their license funds go towards conservation as both care about healthy fish populations and want to protect and preserve their waterways; however, Boaters were significantly more likely to say they are passionate about conservation (87% vs. 78%). Sample Size: Boaters (n=189); Non Boaters (n=599) 69
70 RBFF: Boaters vs. Non Boaters 06 Demographic Differences There were no gender differences between Boaters and Non Boaters, but Boaters were significantly more likely to be older respondents (45+: Boaters (53%); Non Boaters (44%). The Beginner/Intermediates were also significantly more younger respondents, while the Avid s had significantly more older respondents: <45 years: Beginner/Intermediate (59%); Avid (43%); 45+: Beginner (41%); Avid (57%). There was significantly more Boaters in the Midwest (33% vs. 23%); no other regional differences were found. Boaters were significantly more likely to be Caucasian than Non Boaters (91% vs. 86%). Boaters participate in outdoor activities more often than Non Boaters, participate more often with their spouse/significant other, and also participate in more activities than Non Boaters. They were also significantly more likely to be classified as Outdoor Enthusiasts (74% vs. 48%) and Avid Anglers (56% vs. 24%). Boaters were significantly more likely to have higher household incomes (60% vs. 50% were $75K or more); they were also significantly more likely to have retirees (19% vs. 12%) and less likely to be homemakers. Sample Size: Boaters (n=189); Non Boaters (n=599) 70
71 RBFF: Profile of Hispanics When asked the reasons why they fish, respondents felt similarly regardless of ethnicity; the only difference was with the reason I wanted to try a new hobby : 22% of Hispanics cited this, while only 10% of Non-Hispanics chose this. Overall, respondents know you need a license to fish and have purchased one in the past, regardless of ethnicity. Hispanics are however, significantly more likely to have purchased their license from a toll free number (13% vs. 4%), and a sporting goods store/retail store (90% vs. 78%). They were also significantly more likely to find out they needed a license through this sporting goods store/retail store (35% vs. 17%). Both Hispanics and Non-Hispanics equally like knowing that their license funds go towards conservation as both care about healthy fish populations and want to protect and preserve their waterways; however, Hispanics were significantly more likely to say they are passionate about conservation (89% vs. 80%). Demographic Differences There were a significantly more males that made up Hispanics (55% vs. 40%); They were also significantly more younger respondents (88% vs. 51% were <45 years of age). There was significantly more Hispanics in the West (44% vs. 17%) and significantly less in the South (20% vs. 40%); no other regional differences were found. Hispanics were significantly more likely to have children under the age of 18 (80% vs. 64%). Hispanics participate in outdoor activities more often than Non-Hispanics, and also participate in more activities. Hispanics are significantly more likely to be employed than Non-Hispanics (83% vs. 65%). Note: Few statistical differences are found due to such a small sample size of Hispanics (n=64); Non Hispanics (n=724) 71
72 RBFF: Male Anglers vs. Female Anglers Female Anglers are significantly more likely to say they fish because of family or social reasons: It allows me to spend time with my family (75% vs. 52% of males), my children asked me to take them (36% vs. 23%), a friend or relative invited me to join them (25% vs. 20%), to continue the tradition passed down by family members (40% vs. 31%), and I wanted to take my children (53% vs. 36%). Females were also more likely to fish because they wanted to try a new hobby and because it is a low cost activity. Male Anglers are significantly more likely to fish for other reasons besides family: for the excitement and adventure (50% vs. 42%), like to catch own food (36% vs. 28%), and enjoyment of the solitude (54% vs. 42%). While most know you need a license to fish, Male Anglers are significantly more likely to have purchased a license (97% vs. 91%), especially annual licenses (77% vs. 69%) and Lifetime licenses (9% vs. 5%). Female Anglers are significantly more likely to have purchased a short term license (27% vs. 19%). When asked where their license fees go, the most commonly given top of mind answer was conservation; however, Males are significantly more likely to say this; Females were significantly more likely to say they didn t know where the fees go (29% vs. 17%). Male Anglers were also significantly more likely to agree that their fees go towards conservation when directly asked: awareness that funds generated from license sales go towards conservation (80% vs. 72%) awareness that all license fees go towards state fish and wildlife agencies (77% vs. 69%) awareness of manufacturers paying excise taxes on the sale of fishing/boating gear and equipment that go towards conservation efforts (61% vs. 46%). While most purchase licenses because it is the law, Female Anglers are significantly more likely to say this (85% vs. 80% of males). Sample Size: Beginner/Intermediate Anglers (n=537); Avid Anglers (n=251) 72
73 RBFF: Male Anglers vs. Female Anglers Both groups equally like knowing that their license funds go towards conservation as both care about healthy fish populations and want to protect and preserve their waterways. Female Anglers were significantly more likely to say conservation meant protection (25% vs 18%), and saving (19% vs. 13%), while Male Anglers were significantly more likely to say sustainability (13% vs. 8%). Demographic Differences Females had significantly more younger respondents, while the Males had significantly more older respondents: <45 years: Females (63%) and Males (41%); 45+: Females (37%) and Males (59%). Males were significantly more likely to be Hispanic/Latino (11% vs. 6%). Female Anglers were significantly more likely to have children under 18 years of age (75% vs. 52%) and are significantly more likely to participate in outdoor activities with these young children (73% vs. 47%). They are also significantly more likely over Males to say they participate with their spouses, and other family members, while Males are significantly more likely to say they participate in outdoor activities with friends (62% vs 47%) or alone (4% vs. 1%). Male Anglers participate in outdoor activities more often than Female Anglers, and are more likely to participate in Shooting and Hunting over Females (27% vs. 20% for shooting and 38% vs. 18% for hunting). They are also significantly more likely own a boat (71% vs. 55%). Females were significantly more likely to be categorized as Family Outdoors (57% vs. 29%) and Beginner/Intermediate Anglers (77% vs. 56%), while Males were categorized significantly more as Outdoor Enthusiasts (71% vs. 43%) and Avid Anglers (44% vs. 23%). Male Anglers were also significantly more likely to have higher household incomes (60% vs. 47% were $75K or more) while Females had lower household incomes; they were also significantly more likely to be employed 73% versus 61% of females) and have at least a college degree (63% vs. 52% of females). Sample Size: Beginner/Intermediate Anglers (n=537); Avid Anglers (n=251) 73

74 04 Appendices CAHSS + Segments + Beginner vs. Avid
75 CAHSS: Family Outdoors vs. Outdoor Enthusiasts When asked the reasons why they hunt, respondents categorized as Outdoor Enthusiasts were significantly more likely to hunt for a variety of reasons more than Family Outdoor, including a good way to promote conservation (34% vs. 17%), enjoy spending time outdoors (80% vs. 67%), and it offers adventure and excitement (64% vs. 52%). While most Family Outdoors and Outdoor Enthusiasts know you need a license to hunt and have purchased one in the past, Outdoor Enthusiasts are significantly more likely to have purchased a license (92% vs. 87%), especially annual licenses (69% vs. 58%). Short term licenses were significantly more likely to have been purchased by Family Outdoors (33% vs. 23%). Outdoor Enthusiasts were also more likely to know they needed a license through general knowledge than Family Outdoors (67% vs. 57%). The majority of both Family Outdoors and Outdoor Enthusiasts both correctly understand that their license fees go towards conservation, but Outdoor Enthusiasts were significantly more likely to be aware of this than Family Outdoors: more likely to mention top of mind that license fees go towards conservation (53% vs. 42%). awareness that funds generated from license sales go towards conservation (86% vs. 77%) awareness that all license fees go towards state fish and wildlife agencies (84% vs. 77%) awareness of manufacturers paying excise taxes on the sale of firearms, ammunition, and archery equipment that go towards conservation efforts (71% vs. 63%). While most purchase licenses because it is the law, Outdoor Enthusiasts are significantly more likely to purchase a license because the fees go towards conservation (48% vs. 41%). Both groups equally like knowing that their license funds go towards conservation as both care about healthy wildlife populations and want to protect and preserve it. Sample Size: Family Outdoors (n=376); Outdoor Enthusiasts (n=376) 75
76 CAHSS: Family Outdoors vs. Outdoor Enthusiasts 06 Demographic Differences There was significantly more female Family Outdoors and significantly more male Outdoor Enthusiasts (56% female/44% male Family Outdoors; 41% female/59% male Outdoor Enthusiasts). Family Outdoors also had significantly more younger respondents, while the Outdoor Enthusiasts had significantly more older respondents: the average age of a Family Outdoor respondents was 36 years of age and the average age of a Outdoor Enthusiast respondents was 44 years of age. Family Outdoors were significantly more likely to be married (84% vs. 73%), while Outdoor Enthusiasts were significantly more likely to be single (12% vs. 4%) Most respondents are employed; however, Outdoor Enthusiasts were significantly more likely to have retirees (16% vs. 2%) and less likely to have homemakers (8% vs. 18%). There were no differences between Family Outdoors and Outdoor Enthusiasts among region, race/ethnicity, income and education. Sample Size: Family Outdoors (n=376); Outdoor Enthusiasts (n=376) 76
77 CAHSS: Beginner/Intermediate Shooters vs. Avid Shooters Avid Shooters are significantly more likely to say they hunt for several reasons more than Beginner/Intermediate Shooters: they like the adventure and excitement it offers (71% vs. 50%), they like to harvest their own food (45% vs. 22%), they enjoy the solitude (44% vs. 29%), they think it is a good way to promote conservation (39% vs 18%), they participated as a child (44% vs. 34%), they want to keep the tradition alive that was passed down by family (42% vs. 30%), they like that it lets them unplug (55% vs. 41%), they like spending time outdoors (85% vs. 66%). While most know you need a license to hunt, Avid Shooters are significantly more likely to have purchased a license in the past (89% vs. 77%), especially annual licenses (69% vs. 48%). Beginner/Intermediate Shooters are significantly less likely to have purchased a license (23% vs. 11%). Respondents knew they needed a license mostly by either general knowledge or state fish/wildlife agency websites; however, Beginner/Intermediate Shooters were significantly more likely to say they found out through a friend than Avid Shooters (30% vs. 14%). When asked where their license fees go, the most commonly given answer was conservation; however, Avid Shooters are significantly more likely to say this (60% vs. 39%). Beginner/Intermediates were significantly more likely to say they didn t know where the fees go (22% vs. 13%). Avid Shooters were also significantly more likely to agree that their fees go towards conservation when directly asked: awareness that funds generated from license sales go towards conservation (90% vs. 77%) awareness that all license fees go towards state fish and wildlife agencies (84% vs. 76%) awareness of manufacturers paying excise taxes on the sale of gear and equipment that go towards conservation efforts (74% vs. 65%). Sample Size: Beginner/Intermediate Shooters (n=192); Avid Shooters (n=183) 77
78 CAHSS: Beginner/Intermediate Shooters vs. Avid Shooters While most purchase licenses because it is the law, Avid Shooters are significantly more likely to purchase a license to support a sport they are passionate about (55% vs. 41%). Both groups equally like knowing that their license funds go towards conservation as both care about healthy wildlife populations and want to protect and preserve it. Demographic Differences There was significantly more female Beginner/Intermediate Shooters and significantly more male Avid Shooters (55% female/45% male Beginner/Intermediate; 40% female/60% male Avid). The Beginner/Intermediates also had more younger respondents, while the Avid s had significantly more older respondents: the average age of a Beginner/Intermediate was 39 years of age and Avid was 44 years of age. Beginner/Intermediate Shooters were significantly more likely to be married (83% vs. 69%) with kids (88% vs. 43%), and are significantly more likely to participate in outdoor activities with these young children (85% vs. 34%) or their spouses (83% vs. 67%). 99% of Beginner/Intermediate Shooters also say they participate in outdoor activities to spend time with their families, significantly higher than Avid Shooters (99% vs. 89%). Avid Shooters were significantly more likely to be single (13% vs. 4%) Avid Shooters participate in outdoor activities more often than Beginner/Intermediate Shooters, and also participate in hunting more than Beginner/Intermediates (59% vs. 32%). Avid Shooters were significantly more likely to have retirees (17% vs. 8%) and less likely to have homemakers (4% vs. 17%). There were no differences between Beginner/Intermediate and Avid Shooters among region, race/ethnicity, income and education. Sample Size: Beginner/Intermediate Shooters (n=192); Avid Shooters (n=183) 78
79 CAHSS: Male Shooters vs. Female Shooters While most shoot because they enjoy spending time outdoors and the excitement and adventure it offers, Female Shooters are significantly more likely to say they shoot because of family or social reasons: It allows me to spend time with my family (68% vs. 42% of males), my children asked me to take them (23% vs. 15%), and a friend or relative invited me to join them (41% vs. 25%). Females were also more likely to shoot because they wanted to try a new sport (22% vs. 12% of males). Male Shooters are significantly more likely to shoot for other reasons besides family: because they participated as a child (46% vs. 31%) and enjoyment of the solitude (42% vs. 30%). While most know you need a license to shoot, Male Shooters are significantly more likely to have purchased a license (88% vs. 77%), especially annual licenses (65% vs. 51%). When asked where their license fees go, the most commonly given top of mind answer was conservation; however, Males are significantly more likely to say this; Females were significantly more likely to say they didn t know where the fees go (26% vs. 11%). Male Shooters were also significantly more likely to agree that their fees go towards conservation when directly asked: awareness that funds generated from license sales go towards conservation (90% vs. 75%) awareness of manufacturers paying excise taxes on the sale of gear and equipment that go towards conservation efforts (75% vs. 63%). While most purchase licenses because it is the law, Male Shooters are significantly more likely to say they purchase a license because they enjoy funding sport they are passionate about (53% vs. 41% of females). Both groups equally like knowing that their license funds go towards conservation as both care about healthy wildlife populations and want to protect and preserve the wildlife. Female Shooters were significantly more likely to think that there is no enough education on conservation (86% vs. 68% of males). Sample Size: Beginner/Intermediate Anglers (n=537); Avid Anglers (n=251) 79
80 CAHSS: Male Shooters vs. Female Shooters 06 Demographic Differences Females had significantly more younger respondents, while the Males had significantly more older respondents: the average age of a Female Shooter was 37 years of age and the average age of a Male Shooter was 45 years of age. The only significant difference by region was Males were higher in the Northeast (23% vs. 9% of females). Roughly three-quarters of male and female shooters are married; however, Female Shooters were significantly more likely to say they were not married but living with significant other (9% vs. 3% of males). Females were significantly more likely to have children under 18 (77% vs. 55% of males), and are significantly more likely to participate in outdoor activities with these young children (70% vs. 51%). They are also significantly more likely over Males to say they participate with their spouses, and other family members, while Males are significantly more likely to say they participate in outdoor activities with friends (66% vs 51%) or alone (5% vs. 1%). Male Shooters participate in outdoor activities more often than Female Shooters (94% vs. 84%), and are more likely to participate in Hunting over Female Shooters (50% vs. 40%). Females were significantly more likely to be categorized as Family Outdoors (50% vs. 35% of males) and Beginner/Intermediate Shooters (59% vs. 44%), while Males were categorized significantly more as Outdoor Enthusiasts (65% vs. 50% of females) and Avid Shooters (56% vs. 41%). Male Shooters were also significantly more likely to have higher household incomes, while Female Shooters had lower household incomes; they were also significantly more likely to be employed (80% versus 66% of females); Females were significantly less likely to have a college degree (50% had less than a college degree vs. 30% of males). Sample Size: Beginner/Intermediate Anglers (n=537); Avid Anglers (n=251) 80
81 CAHSS: Beginner/Intermediate Hunters vs. Avid Hunters Avid Hunters are significantly more likely to say they hunt for several reasons more than Beginner/Intermediate Hunters: they like the adventure and excitement it offers (64% vs. 51%), they enjoy the solitude (44% vs. 30%), they think it is a good way to promote conservation (31% vs 20%), they participated as a child (42% vs. 30%), they want to keep the tradition alive that was passed down by family (49% vs. 35%), they like that it lets them unplug (45% vs. 30%), they like spending time outdoors (80% vs. 69%). While most Hunters know you need a license to hunt, both Beginners/Intermediates and Avids have equally purchased a license in the past; however, Beginner/Intermediate Hunters are significantly more likely to have purchased a short term license (35% vs. 24%), while Avid Hunters are significantly more likely to have purchased a Lifetime license (9% vs. 2%). Respondents knew they needed a license mostly by either general knowledge or state fish/wildlife agency websites; however, Avid Hunters were significantly more likely to say they found out through a sporting goods store/retail store (23% vs. 12%). The majority of both Beginner/Intermediate and Avid Hunters correctly understand that their license fees go towards conservation, but Avid Hunters were significantly more likely to be aware of this than Beginner/Intermediates: awareness that funds generated from license sales go towards conservation (86% vs. 77%) awareness of manufacturers paying excise taxes on the sale of gear and equipment that go towards conservation efforts (73% vs. 58%). While most purchase licenses because it is the law, Avid Hunters are significantly more likely to purchase a license because they know that the fees are invested back into conservation (52% vs. 40%). Sample Size: Beginner/Intermediate Hunters (n=176); Avid Hunters (n=201) 81
82 CAHSS: Beginner/Intermediate Hunters vs. Avid Hunters Both groups equally like knowing that their license funds go towards conservation as both care about healthy wildlife populations and want to protect and preserve it. Demographic Differences There was significantly more female Beginner/Intermediate Hunters and significantly more male Avid Hunters (53% female/47% male Beginner/Intermediate; 41% female/59% male Avid). The Beginner/Intermediates also had more younger respondents, while the Avid s had significantly more older respondents: the average age of a Beginner/Intermediate was 38 years of age and Avid was 42 years of age. Beginner/Intermediate Hunters were significantly more likely to be married (82% vs. 75%) with kids (89% vs. 56%), and are significantly more likely to participate in outdoor activities with these young children (85% vs. 44%). 99% of Beginner/Intermediate Hunters also say they participate in outdoor activities to spend time with their families, significantly higher than Avid Hunters (99% vs. 89%). Avid Hunters were significantly more likely to be single (12% vs. 6%) and participate in outdoor activities to build expertise (80% vs. 61%), for the experience and excitement (99% vs. 92%) and for the solitude (69% vs. 59%). Avid Hunters participate in outdoor activities more often than Beginner/Intermediate Hunters, and also participate in outdoors sports, including Recreational Shooting, more than Beginner/Intermediates (34% vs. 23%). The majority of Hunters are employed; however, Avid Hunters were significantly more likely to have retirees than Beginner/Intermediate Hunters (13% vs. 3%). There were no differences between Beginner/Intermediate and Avid Hunters among region, race/ethnicity, income and education. Sample Size: Beginner/Intermediate Hunters (n=176); Avid Hunters (n=201) 82
83 CAHSS: Male Hunters vs. Female Hunters While most hunt because they enjoy spending time outdoors and the excitement and adventure it offers, Female Hunters are significantly more likely to say they hunt because it allows me to spend time with my family (57% vs. 36% of males), while Male Hunters are significantly more likely to hunt because they enjoy the solitude (45% vs. 29%), it is a good way to promote conservation (31% vs. 22%), and they went as a part of a vacation or group outing (16% vs. 9%). While most know you need a license to shoot, Female Hunters are significantly more likely to say they know this (98% vs. 89%); However, Male Hunters are significantly more likely to have purchased a license (100% vs. 94% of females), especially annual licenses (76% vs. 66%). When asked where their license fees go, the most commonly given top of mind answer was conservation; Male Hunters were significantly more likely to agree that their fees go towards conservation when directly asked: awareness that funds generated from license fees go towards state fish and wildlife agencies (88% vs. 76%) awareness of manufacturers paying excise taxes on the sale of gear and equipment that go towards conservation efforts (71% vs. 60%). While most purchase licenses because it is the law, and the right thing to do, Male Hunters are significantly more likely to say they purchase a license because all their fees are invested back into conservation (52% vs. 40% of females). When asked what conservation meant to them, Male Hunters were significantly more likely to say maintenance (33% vs. 23%), while Female Hunters were more likely to say protection (27% vs. 13%). Both groups equally like knowing that their license funds go towards conservation as both care about healthy wildlife populations and want to protect and preserve the wildlife. Sample Size: Beginner/Intermediate Anglers (n=537); Avid Anglers (n=251) 83
84 CAHSS: Male Hunters vs. Female Hunters 06 Demographic Differences Females had significantly more younger respondents, while the Males had significantly more older respondents: the average age of a Female Hunter was 36 years of age and the average age of a Male Hunter was 44 years of age. Over three-quarters of male and female hunters are married; however, Female Hunters were significantly more likely to say they were not married but living with significant other (11% vs. 4% of males). Female Hunters were significantly more likely to participate in outdoor activities with these either their spouse/significant other (86% vs. 67%) or other family members (52% vs. 37%). Males are significantly more likely to say they participate in outdoor activities to build expertise in their sport (76% vs. 66% of females) and enjoy the solitude of being alone (69% vs. 58% of females). Females were significantly more likely to be categorized as Family Outdoors (44% vs. 31% of males) and Beginner/Intermediate Hunters (53% vs. 42%), while Males were categorized significantly more as Outdoor Enthusiasts (70% vs. 56% of females) and Avid Hunters (59% vs. 47%). Male Hunters were also significantly more likely to have higher household incomes, while Female Hunters had lower household incomes; they were also significantly more likely to be employed (85% versus 61% of females) and have higher educations (54% of males had at least a college education or greater, while only 34% of females claimed this). No differences were found by region or race/ethnicity, Sample Size: Beginner/Intermediate Anglers (n=537); Avid Anglers (n=251) 84
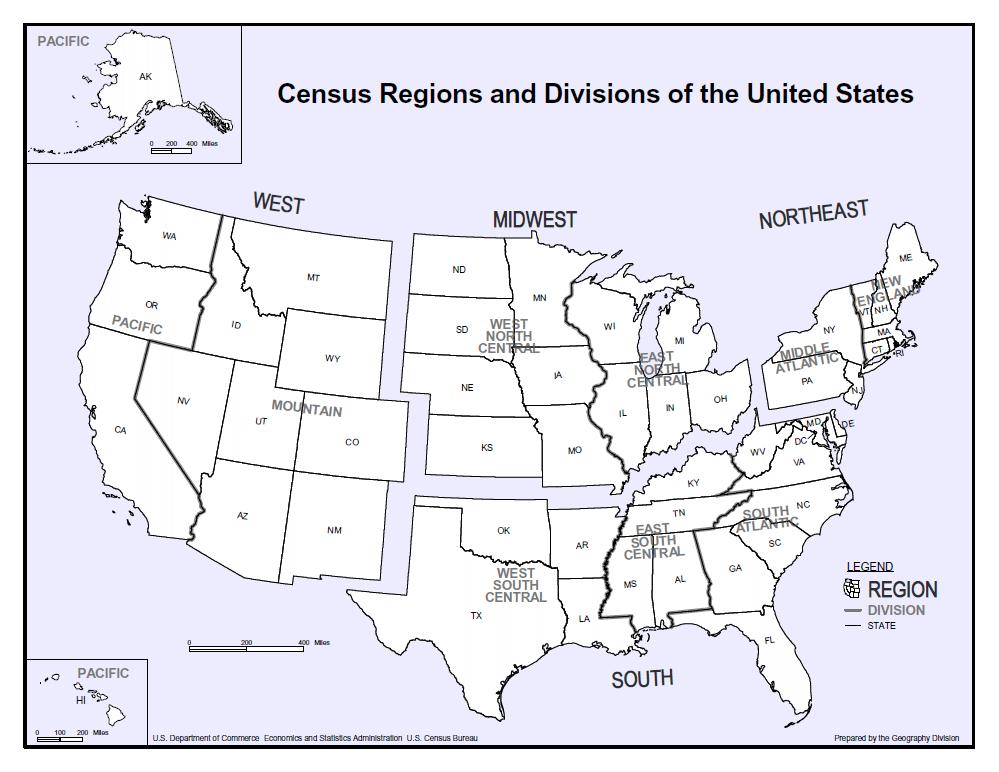
85 85
SAMPLE REPORT SUPPLEMENTAL REPORT
 SAMPLE REPORT SUPPLEMENTAL REPORT Handgun Consumers: An In-Depth Exploration Supplement to the Consumer Segmentation Analysis on the Commercial Firearms & Accessories Market 2017 Southwick Associates,
MARKET SEGMENTATION PROFILE EXECUTIVE SUMMARY
 MARKET SEGMENTATION PROFILE EXECUTIVE SUMMARY February 18, 2011 Research Objectives 2 Achieving significant gains in fishing and boating participation is going to require reaching new audiences with new
Hispanic Segment Analysis
 Hispanic Segment Analysis June 2011 Table of Contents Background & Methodology... 2 Hispanic Consumers... 3 Hispanic Anglers & Boaters... 6 Anglers... 6 Boaters... 10 Licensing... 14 Impact of Acculturation...
SPORTING HERITAGE. Fueling the American Economy 2018 EDITION
 AMERICA S SPORTING HERITAGE Fueling the American Economy 2018 EDITION INTRODUCTION One of the greatest benefits all Americans share is their access to the great outdoors. Whether fishing in a suburban
Paddlesports Kayaking Canoeing. A Partnership Project of:
 A Special Report on Paddlesports 2009 Kayaking Canoeing Rafting A Partnership Project of: PADDLESPORTS Paddlesports Paddlesports offer some of the most diverse outdoor experiences of any nature-based activity
SAMPLE REPORT. Supplement to the Consumer Segmentation Analysis on the Commercial Firearms & Accessories Market
 SAMPLE REPORT SUPPLEMENTAL REPORT Modern Sporting Rifle Owners: An In-Depth Exploration Supplement to the Consumer Segmentation Analysis on the Commercial Firearms & Accessories Market 2017 Southwick Associates,
Recreation. Participation. Topline Report
 Outdoor Recreation Participation Topline Report 2011 Ages 6 + 2010 Outdoor Participation 10.1 Billion Outdoor Outings 73 Average Outings Per Participant Participation in outdoor recreation in 2010 remained
Insights into First-Time Fishing License Buyers:
 Insights into First-Time Fishing License Buyers: A Survey Analysis For: Recreational Boating & Fishing Foundation (RBFF) By: Southwick Associates May 2014 PO Box 6435 Fernandina Beach, FL32035 Tel (904)
Wildlife Ad Awareness & Attitudes Survey 2015
 Wildlife Ad Awareness & Attitudes Survey 2015 Contents Executive Summary 3 Key Findings: 2015 Survey 8 Comparison between 2014 and 2015 Findings 27 Methodology Appendix 41 2 Executive Summary and Key Observations
PATHS TO PARTICIPATION. How to help hunters and target shooters try new shooting sports activities.
 PATHS TO PARTICIPATION How to help hunters and target shooters try new shooting sports activities. Overview The purpose of this project is to help improve hunting and shooting sports marketing efforts
A SURVEY OF 1997 COLORADO ANGLERS AND THEIR WILLINGNESS TO PAY INCREASED LICENSE FEES
 Executive Summary of research titled A SURVEY OF 1997 COLORADO ANGLERS AND THEIR WILLINGNESS TO PAY INCREASED LICENSE FEES Conducted by USDA Forest Service Rocky Mountain Research Station Fort Collins,
Participation Topline Report 2012
 outdoor recreation Participation Topline Report 2012 Ages 6 + 2011 Outdoor Participation 11.6 Billion Outdoor Outings 81.9 Average Outings Per Participant In 2011, outdoor recreation among Americans reached
OUTDOOR RECREATION PARTICIPATION REPORT TOPLINE 2013
 OUTDOOR RECREATION PARTICIPATION REPORT TOPLINE 2013 Ages 6+ OUTDOOR PARTICIPATION 12.4 Outdoor Outings 87.4 Average Outings Per Participant More Americans participated in outdoor recreation in than in
Fishing in Indiana Motivations of Indiana Anglers
 Fishing in Indiana Motivations of Indiana Anglers 2005 Survey Shorna Broussard, Alicia Haley, Matt Burlingame, and Stu Shipman FNR-IDNR-101-W Introduction Indiana anglers have many different motivations
Paddlesports. Kayaking Canoeing Rafting Stand up paddling. A Partnership Project of:
 2014 Special Report on Paddlesports Kayaking Canoeing Rafting Stand up paddling A Partnership Project of: PADDLESPORTS Paddlesports A record number of Americans enjoyed paddlesports in 2013. Whether kayaking
Northwest Parkland-Prairie Deer Goal Setting Block G7 Landowner and Hunter Survey Results
 Northwest Parkland-Prairie Deer Goal Setting Block G7 Landowner and Hunter Survey Results Table of Contents Public Surveys for Deer Goal Setting... 1 Methods... 1 Hunter Survey... 2 Demographics... 2 Population
The 2001 Economic Benefits of Hunting, Fishing and Wildlife Watching in MISSOURI. Prepared by:
 The 2001 Economic Benefits of Hunting, Fishing and Wildlife Watching in MISSOURI Prepared by: Southwick Associates, Inc. PO Box 6435 Fernandina Beach, FL 32035 Ph (904) 277-9765 Fax (904) 261-1145 Email:
RECRUITMENT HUNTERS A case-study approach to learning more about hunting among Hispanics and improving recruitment and retention of other hunters
 RECRUITMENT OF HISPANIC HUNTERS A case-study approach to learning more about hunting among Hispanics and improving recruitment and retention of other hunters A joint project of the McGraw Center for Conservation
Appendix A (Survey Results) Scroll Down
 Scroll Down") Appendix A (Survey Results) Scroll Down RECREATIONAL USER TENDENCIES What is your gender? 1 8 6 4 46.1% Female 53.9% Male Slightly over half of the on-site interviews at Coopers Rock were conducted with
Appendix A (Survey Results) Scroll Down RECREATIONAL USER TENDENCIES What is your gender? 1 8 6 4 46.1% Female 53.9% Male Slightly over half of the on-site interviews at Coopers Rock were conducted with
PATHS TO PARTICIPATION. How to help hunters and target shooters try new shooting sports activities.
 PATHS TO PARTICIPATION How to help hunters and target shooters try new shooting sports activities. Overview The purpose of this project is to help improve hunting and shooting sports marketing efforts
Summer Flounder. Wednesday, April 26, Powered by
 Summer Flounder Wednesday, April 26, 2017 On February 2, 2017, the Summer Flounder, Scup and Black Sea Bass Management Board, part of the Atlantic States Marine Fisheries Commission (ASMFC), approved changes
Central Hills Prairie Deer Goal Setting Block G9 Landowner and Hunter Survey Results
 Central Hills Prairie Deer Goal Setting Block G9 Landowner and Hunter Survey Results Table of Contents Public Surveys for Deer Goal Setting... 1 Methods... 1 Hunter Survey... 2 Demographics... 2 Population
PATHS TO PARTICIPATION. How to help hunters and target shooters try new shooting sports activities.
 PATHS TO PARTICIPATION How to help hunters and target shooters try new shooting sports activities. Overview The purpose of this project is to help improve hunting and shooting sports marketing efforts
Female Cyclist Survey 3
 Female Cyclist Survey 3 Executive Summary In order to fully characterize the current and potential female membership of USA Cycling, this study was commissioned to design and analyze a 2013 survey of that
Oakmont: Who are we?
 Oakmont: Who are we? A Snapshot of our community from the April 2010 US Census Contents Age and Gender... 1 Marital Status... 2 Home Ownership and Tenure... 3 Past Demographic Characteristics... 5 Income
SPECIAL REPORT ON FISHING AND BOATING. A partnership. project of:
 A partnership project of: SPECIAL REPORT ON FISHING AND BOATING 2013 CONTENTS Executive Summary.... 1 Fishing.... 3 Freshwater Fishing.... 17 Saltwater Fishing.... 21 Fly Fishing.... 25 Youth, A Focused
BCLC Employee Survey Final Report. August 31, 2016
 BCLC Employee Survey Final Report August 31, 2016 BACKGROUND AND METHODOLOGY Survey Background Canadian research indicates that gaming workers exhibit rates of problem gambling that are over three times
RIVER ACCESS STRATEGY RIVER USAGE AND ATTITUDES BASELINE ONLINE SURVEY SUMMARY REPORT
 RIVER ACCESS STRATEGY RIVER USAGE AND ATTITUDES BASELINE ONLINE SURVEY JUNE 2014 RIVER ACCESS STRATEGY RIVER USAGE AND ATTITUDES SURVEY BACKGROUND The North Saskatchewan River Valley is one of North America
TRCP National Sportsmen s Survey Online/phone survey of 1,000 hunters and anglers throughout the United States
 #17144 TRCP National Sportsmen s Survey Online/phone survey of 1,000 hunters and anglers throughout the United States Methodology Public Opinion Strategies conducted a national survey of N =1,000 voters
Evaluating the Effectiveness of Hunting, Shooting, and Fishing Recruitment and Retention Programs
 Evaluating the Effectiveness of Hunting, Shooting, and Fishing Recruitment and Retention Programs Presented to the Council to Advance Hunting and the Shooting Sports Annual Meeting of the Board of Directors
PATHS TO PARTICIPATION. How to help hunters and target shooters try new shooting sports activities.
 PATHS TO PARTICIPATION How to help hunters and target shooters try new shooting sports activities. Overview The purpose of this project is to help improve hunting and shooting sports marketing efforts
SPORTS PARTICIPATION IN THE UNITED STATES 2016 EDITION
 A STATISTICAL STUDY OF SPORTS PARTICIPATION FOR 55 SPORTS / RECREATIONAL ACTIVITIES SPORTS PARTICIPATION IN THE UNITED STATES 2016 EDITION ISSN: 0882-8210 Prepared for the NATIONAL SPORTING GOODS ASSOCIATION
The 2006 Economic Benefits of Hunting, Fishing and Wildlife Watching in TEXAS. Prepared by:
 The 2006 Economic Benefits of Hunting, Fishing and Wildlife Watching in TEXAS Prepared by: Southwick Associates, Inc. P.O. Box 6435 Fernandina Beach, FL 32035 Ph (904) 277-9765 Fax (904) 261-1145 Email:
2020 K Street NW, Suite 410 Washington, DC (202)
") 2020 K Street NW, Suite 410 Washington, DC 20006 (202) 463-7300 Interview dates: October 24 25, 2013 Interviews: 1,008 adults CONDUCTED BY IPSOS PUBLIC AFFAIRS These are findings of an Ipsos online poll
2020 K Street NW, Suite 410 Washington, DC 20006 (202) 463-7300 Interview dates: October 24 25, 2013 Interviews: 1,008 adults CONDUCTED BY IPSOS PUBLIC AFFAIRS These are findings of an Ipsos online poll
PATHS TO PARTICIPATION. How to help hunters and target shooters try new shooting sports activities.
 PATHS TO PARTICIPATION How to help hunters and target shooters try new shooting sports activities. Overview The purpose of this project is to help improve hunting and shooting sports marketing efforts
The National Citizen Survey. Bowling Green, KY. Technical Appendices
 The National Citizen Survey Bowling Green, KY Technical Appendices 2014 National Research Center, Inc. Boulder, CO International City/County Management Association Washington, DC Contents Appendix A: Complete
FULL PROFILE Census, 2018 Estimates with 2023 Projections Calculated using Weighted Block Centroid from Block Groups Realm Realty Lat/Lon: 3
 FULL PROFILE 2000-2010 Census, 2018 Estimates with 2023 Projections Calculated using Weighted Block Centroid from Block Groups Realm Realty Lat/Lon: 30.0027/-90.1613 RF1 Lakeside Shopping Center Metairie,
PATHS TO PARTICIPATION. How to help hunters and target shooters try new shooting sports activities.
 PATHS TO PARTICIPATION How to help hunters and target shooters try new shooting sports activities. Overview The purpose of this project is to help improve hunting and shooting sports marketing efforts
Bowling Green, KY Technical Appendices
 Bowling Green, KY Technical Appendices 2018 2955 Valmont Road Suite 300 777 North Capitol Street NE Suite 500 Boulder, Colorado 80301 Washington, DC 20002 n-r-c.com 303-444-7863 icma.org 800-745-8780 Contents
Outdoor Participation Report 2013
 Outdoor Participation Report 2013 2013 Outdoor Recreation Participation Introduction... 4 Outdoor Participation... 7 Active Lifestyles... 25 Youth... 33 Diversity... 45 A Detailed Look... 55 Acknowledgements...
2016 Volunteer Program Annual Report
 The mission of the Oregon Department of Fish & Wildlife Volunteer Program is to actively involve citizens as volunteers in the protection and enhancement of Oregon s fish and wildlife resources for the
IWLA s Role in Implementing a National Strategy April 25, 2017
 R3 for Hunters and Recreational Shooters IWLA s Role in Implementing a National Strategy April 25, 2017 Overview What is R3? What s the problem? Why a national plan? What s the plan? What s IWLA s role?
The Power of Outdoor Recreation Spending in Pennsylvania:
 The Power of Outdoor Recreation Spending in Pennsylvania: How hunting, fishing, and outdoor activities help support a healthy state economy November, 2018 Prepared for the Theodore Roosevelt Conservation
Outdoor Recreation. Participation Report 2012
 Outdoor Recreation Participation Report 2012 2012 Outdoor Recreation Participation Report Introduction... 1 Outdoor Participation... 3 Active Lifestyles... 21 Youth... 31 Diversity...41 A Detailed Look...
The 2006 Economic Benefits of Hunting, Fishing and Wildlife Watching in NORTH CAROLINA. Prepared by:
 The 2006 Economic Benefits of Hunting, Fishing and Wildlife Watching in NORTH CAROLINA Prepared by: Southwick Associates, Inc. P.O. Box 6435 Fernandina Beach, FL 32035 Ph (904) 277-9765 Fax (904) 261-1145
National Association of REALTORS National Smart Growth Frequencies
 September 520, 2017 3,000 Weighted Online Respondents National Association of REALTORS National Smart Growth Frequencies Q.2 The first question is about the quality of life in your community. How satisfied
2017 SPECIAL REPORT ON FISHING
 2017 SPECIAL REPORT ON FISHING A partnership project of: CONTENTS Executive Summary.... 1 Fishing.... 3 Freshwater Fishing.... 17 Saltwater Fishing.... 22 Fly Fishing.... 27 Youth.... 32 Hispanics....
WSCGA. Understanding the member profile and their purchase behavior.
 WSCGA Understanding the member profile and their purchase behavior. 2015 Agenda Background and Key Summary What does a WSCGA Member look like? What do members think about the WSCGA? What is their recent
ROLLER DERBY DEMOGRAPHICS:
 ROLLER DERBY DEMOGRAPHICS: Results from the Third Annual Comprehensive Data Collection on Skaters and Fans Women s Flat Track Derby Association Published March 2012 Methodology Data for this survey were
WATERFOWL HUNTING IN MINNESOTA. A study of people who hunted for waterfowl in Minnesota from 2000 through Final Report
 WATERFOWL HUNTING IN MINNESOTA A study of people who hunted for waterfowl in Minnesota from 2000 through 2004 Final Report A cooperative study conducted by: Minnesota Cooperative Fish and Wildlife Research
THE KNOWLEDGE NETWORKS-ASSOCIATED PRESS POLL SPORTS POLL (BASEBALL) CONDUCTED BY KNOWLEDGE NETWORKS July 6, 2009
 CONDUCTED BY KNOWLEDGE NETWORKS July 6, 2009") 1350 Willow Rd, Suite 102 Menlo Park, CA 94025 www.knowledgenetworks.com Interview dates: June 26 July 5, 2009 Interviews: 655 adults interested or very interested in MLB Sampling margin of error for a
1350 Willow Rd, Suite 102 Menlo Park, CA 94025 www.knowledgenetworks.com Interview dates: June 26 July 5, 2009 Interviews: 655 adults interested or very interested in MLB Sampling margin of error for a
Golfers in Colorado: The Role of Golf in Recreational and Tourism Lifestyles and Expenditures
 Golfers in Colorado: The Role of Golf in Recreational and Tourism Lifestyles and Expenditures by Josh Wilson, Phil Watson, Dawn Thilmany and Steve Davies Graduate Research Assistants, Associate Professor
The Greater Sage-Grouse:
 The Greater Sage-Grouse: Hunter opinions regarding potential conservation strategies in eleven western states For: National Wildlife Federation October 30, 2014 PO Box 6435 Fernandina Beach, FL 32035 Tel
DKS & WASHINGTON COUNTY Washington County Transportation Survey
 PREPARED FOR: DKS & WASHINGTON COUNTY Washington County Transportation Survey April 2013 PREPARED BY: DHM RESEARCH (503) 220-0575 239 NW 13 th Ave., #205, Portland, OR 97209 www.dhmresearch.com 1 INTRODUCTION
Women in Shooting Sports Survey Results
 Conducted by SLG2, Inc. Women in Shooting Sports Survey Results January 5, 2018 SLG2, Inc. DBA: Shoot Like A Girl P.O. Box 1211 Athens, AL 35612 p. 256.520.3759 Karen.Butler@shootlikeagirl.com www.shootlikeagirl.com
First-Time and Repeat Angler Analysis: Key Findings & Next Steps December 11, 2013
 First-Time and Repeat Angler Analysis: Key Findings & Next Steps December 11, 2013 Stephanie Hussey, RBFF Rob Southwick, Southwick Associates RESEARCH OVERVIEW Purpose To identify and characterize first-time
2009 New Brunswick Gambling Prevalence Study
 2009 New Brunswick Gambling Prevalence Study Prepared for: Government of New Brunswick Centennial Building P.O. Box 6000 Fredericton, NB E3B 5H1 Prepared by: TABLE OF CONTENTS EXECUTIVE SUMMARY... 1 STUDY
Proportion (%) of Total UK Adult Population (16+)s. Participating in any Watersports Activity
 of Total UK Adult Population (16+)s. Participating in any Watersports Activity") Proportion (%) of Total UK Adult Population (16+)s Participating in any Watersports Activity Headlines Participation in any activities up 2.1% point 14.3m UK adults participating Highest volume recorded
Proportion (%) of Total UK Adult Population (16+)s Participating in any Watersports Activity Headlines Participation in any activities up 2.1% point 14.3m UK adults participating Highest volume recorded
Community & Transportation Preferences Survey
 Community & Transportation Preferences Survey Webinar: August 5, 2015 Hugh Morris, AICP, LEED Realtor.org Jennifer Dill, Ph.D. trec.pdx.edu 1 Introduction National Association of Realtors Over 1,000,000
U.S. Bicycling Participation Study
 U.S. Bicycling Participation Study Report of findings from the 2016 survey Conducted by Corona Insights Commissioned by PeopleForBikes Released July 2017 Table of Contents Background and Objectives 3 Research
Sport Fishing Expenditures and Economic Impacts on Public Lands in Washington
 Sport Fishing Expenditures and Economic Impacts on Public Lands in Washington For: Northwest Sportfishing Industry Association By: Southwick Associates Released June 2015 PO Box 6435 Fernandina Beach,
Hunter and Angler Expenditures, Characteristics, and Economic Effects, North Dakota,
 Agribusiness and Applied Economics Report No. 507-S January 2003 Hunter and Angler Expenditures, Characteristics, and Economic Effects, North Dakota, 2001-2002 Dean A. Bangsund and F. Larry Leistritz*
APPENDIX 1 INTRODUCTORY LETTER, SURVEY COVER LETTERS, REMINDER POSTCARD, AND QUESTION & ANSWER SHEET
 APPENDIX 1 INTRODUCTORY LETTER, SURVEY COVER LETTERS, REMINDER POSTCARD, AND QUESTION & ANSWER SHEET 67 Cooperative Human Dimensions Initiative Human Dimensions Section Colorado Division of Wildlife 6060
Fishing License Renewals and Angler Lifestyles 2015 Angler Participation Research Summary Report
 Fishing License Renewals and Angler Lifestyles 2015 Angler Participation Research Summary Report Released March 2016 Final Report Background Produced for the American Sportfishing Association by Southwick
Transportation Issues Poll for New York City
 2016-17 Transportation Issues Poll for New York City 82% support Vision Zero and reducing traffic deaths 72% on average, support more street space for children to play, protected bike lanes and other safety
SPECIAL REPORT ON FISHING AND BOATING 2012
 SPECIAL REPORT ON FISHING AND BOATING 2012 A Partnership Project of: TABLE OF CONTENTS Executive Summary... 1 Fishing... 3 Freshwater Fishing... 17 Saltwater Fishing... 21 Fly Fishing... 25 Youth, A Focused
make people aware of the department s actions for improving the deer population monitoring system,
 Investing in Wisconsin s Whitetails 1 Over the last 60 years, the department has developed a deer herd monitoring and management system that seeks to use the best science and data possible. The deer monitoring
The Economic Importance of Recreational River Use to the City of Calgary
 The Economic Importance of Recreational River Use to the City of Calgary Prepared by: Calgary River Users Alliance May 20, 2016 The Economic Importance of Recreational River Use to the City of Calgary
Angler Spending on Fishing-related Durable Goods: Results from the 2014 Marine Recreational Fishing Expenditure Survey
 Angler Spending on Fishing-related Durable Goods: Results from the 2014 Marine Recreational Fishing Expenditure Survey Sabrina Lovell1, James Hilger2, and Scott Steinback3 NAAFE 2015 Ketchikan, AK 1US
Notes on Presentation by Jim Spring of Leisure Trends Group to the National Ski Council Federation September 10, 2004
 Notes on Presentation by Jim Spring of Leisure Trends Group to the National Ski Council Federation September 10, 2004 Jim s first comment was that he has been involved with SIA (Snowsports Industry of
MANAGEMENT ESTABLISHING JURISDICTION LEGAL BASIS DEFINING LOGICAL APPROACHES
 MANAGEMENT ESTABLISHING JURISDICTION LEGAL BASIS DEFINING LOGICAL APPROACHES Single Entity or Co Management What are the differences? What are the legal jurisdictions? Determined through the courts and
RESEARCH Massachusetts Recreational Boater Survey. Project Summary
 Coastal and Marine Spatial Planning RESEARCH Project Summary 2010 Massachusetts Recreational Boater Survey The 2010 Massachusetts Recreational Boater Survey gathered spatial and economic data relating
FOR LEASE HARMS ROAD INDUSTRIAL PARK Harms Road, Houston Texas 77041
 FOR LEASE HARMS ROAD INDUSTRIAL PARK 7206-7214 Harms Road, Houston Texas 77041 Property Statistics: Single-tenant Industrial Park Tilt wall construction with stone facade Crane ready Heavy power, grade
Strategic Initiative Update Expanding Participation in Conservation, FYCCN and R3
 Strategic Initiative Update Expanding Participation in Conservation, FYCCN and R3 Florida Fish and Wildlife Conservation Commission Staff Report September 2018 Good morning Mr. Chairman, Commissioners
TESTIMONY OF THOMAS O KEEFE, PhD PACIFIC NORTHWEST STEWARDSHIP DIRECTOR ON BEHALF OF AMERICAN WHITEWATER
 TESTIMONY OF THOMAS O KEEFE, PhD PACIFIC NORTHWEST STEWARDSHIP DIRECTOR ON BEHALF OF AMERICAN WHITEWATER OREGON STATE HOUSE House Committee on Transportation Policy Representative Caddy McKeown, Chair
Developing A State Agency Brand. Maine Department of Inland Fisheries and Wildlife
 Developing A State Agency Brand Maine Department of Inland Fisheries and Wildlife First Steps In 2016, MDIFW contracted Responsive Management to conduct research on the Agency s standing with the general
2005 Arkansas Nongame Wildlife Conservation Survey
 2005 Arkansas Nongame Wildlife Conservation Survey by Survey Research Center Institute of Government University of Arkansas at Little Rock 2801 South University Avenue Little Rock Arkansas 72204 501.569.8561
Maine Office of Tourism Visitor Tracking Research 2012 Calendar Year Annual Report Regional Insights: Kennebec & Moose River Valley
 Maine Office of Tourism Visitor Tracking Research 2012 Calendar Year Annual Report Regional Insights: Prepared by April 2013 1 1 Introduction and Methodology 2 The Maine Office of Tourism has commissioned
National Survey for Wales Key Facts for Policy and Practice
 National Survey for Wales 2016-17 Key Facts for Policy and Practice Outdoor Recreation This bulletin describes the main findings of the Outdoor Recreation section of the 2016-2017 National Survey for Wales.
PARTNERSHIP OPPORTUNITIES
 PARTNERSHIP OPPORTUNITIES 2017 Since 1967, the Illinois Junior Golf Association (IJGA) has achieved success in developing Better People Through Junior Golf by providing a foundation of sportsmanship, integrity,
HUNTING IN AMERICA. An Economic Force for Conservation 2018 EDITION
 HUNTING IN AMERICA An Economic Force for Conservation 2018 EDITION HUNTING IN AMERICA Hunting is a grand tradition in America, loved and practiced by millions of people each year. Despite stereotypical
Table of Contents
 February 2018 Table of Contents Executive Summary Executive Summary Personas Activists Barriers Motivations Needs In The Wind Barriers Motivations Needs Hunting Buddies Barriers Motivations Needs Strategic
Oregon 2011 Regional Visitor Report Mt. Hood Columbia River Gorge
 Oregon 2011 Regional Visitor Report Mt. Hood Columbia River Gorge Introduction Longwoods International began tracking American travelers in 1985, and has conducted large-scale syndicated visitor research
Department of Agricultural and Resource Economics, Fort Collins, CO
 July 2011 EMPR 11-01 Department of Agricultural and Resource Economics, Fort Collins, CO 80523-1172 http://dare.colostate.edu/pubs WHAT IS THE VALUE OF A FISHING TRIP? A COMPARISON OF PUBLIC AND PRIVATE
First Time Firearms Buyers Segmentation Produced by Southwick Associates, Inc.
 First Time Firearms Buyers Segmentation Produced by Southwick Associates, Inc. One size does not fit all. First time buyers are not all the same. Increasing the number of firearm consumers depends on knowing
WEAR IT CALIFORNIA! LIFE JACKET CAMPAIGN ASSESSMENT 2007
 WEAR IT CALIFORNIA! LIFE JACKET CAMPAIGN ASSESSMENT 2007 Background This study was conducted for the California Department of Boating and Waterways, the National Safe Boating Council, the BoatU.S. Foundation
CRACIUN RESEARCH. June 20, 2011 A M A R K E T R E S E A R C H S T CHA
 CRACIUN RESEARCH A M A R K E T R E S E A R C H S T U D Y CHA June 20, 2011 Craciun Research Anchorage. Seattle. Washington, DC 907.279.3982 www.craciunresearch.com 2011 Craciun Research. All rights reserved.
TRENDS IN PARTICIPATION RATES FOR WILDLIFE-ASSOCIATED RECREATION BY RACE/ETHNICITY AND GENDER:
 TRENDS IN PARTICIPATION RATES FOR WILDLIFE-ASSOCIATED RECREATION BY RACE/ETHNICITY AND GENDER: 1980-2001 Allan Marsinko Professor Department of Forestry and Natural Resources Clemson University Clemson,
USA Triathlon Membership Survey Report Colorado Springs, Colorado
 USA Triathlon Membership Survey Report Colorado Springs, Colorado Report prepared by: Lauren Rios Team USA and Research Coordinator USA Triathlon This is a product of USA Triathlon. Any reproduction or
Connections to the Wild Salmon Resource in cook inlet
 Connections to the Wild Salmon Resource in cook inlet Highlights of Opinion Research Sponsored by The Salmon Project As part of a feasibility study in early 2013, the Salmon Project sponsored extensive
Full Circle Performance Weightlifting Club Inc
 Full Circle Performance Weightlifting Club Inc SUMMARY Mission Providing at-risk youth with a pathway to the Olympics via the sport of Weightlifting Contact Information Primary Address 821 12th St. W.
Q1A. Did you personally attend any Major League Baseball games LAST year, or not?
 1350 Willow Rd, Suite 102 Menlo Park, CA 94025 www.knowledgenetworks.com Interview dates: September 14 September 21, 2009 Interviews: 559 adults interested or very interested in MLB Sampling margin of
WILDLIFE WATCHING U.S. FISH & WILDLIFE SERVICE 2006 NATIONAL SURVEY HIGHLIGHTS*
 WILDLIFE WATCHING U.S. FISH & WILDLIFE SERVICE 2006 NATIONAL SURVEY HIGHLIGHTS* During 2006, 71 million U.S. residents, 31 percent of the U.S. population sixteen years old and older, participated in wildlife-watching
WOMEN IN THE NWT - SUMMARY
 In 16, 44,469 people lived in the Northwest Territories (NWT) with females accounting for just under half (49%) of the population. The NWT population consists of almost equal numbers of Indigenous (First
Measuring and growing active modes of transport in Auckland
 AUCKLAND CLIENT TRANSPORT SECTION HEADLINE1 AUCKLAND TRANSPORT JUNE 2017 Measuring and growing active modes of transport in Auckland WAVE 3 1 AUCKLAND TRANSPORT 2 The overall business objective is to:
Economic Impact of Mountain Biking in the Nantahala and Pisgah National Forests
 Economic Impact of Mountain Biking in the Nantahala and Pisgah National Forests JAMES N. MAPLES, Ph D MICHAEL J. BRADLEY, Ph D Report submitted to Outdoor Alliance on August 5, 2017 Study funded by Outdoor
The Economic Contributions of Hunting- Related Tourism in Eastern and Southern Africa
 The Economic Contributions of Hunting- Related Tourism in Eastern and Southern Africa For: Safari Club International Foundation November, 2015 PO Box 6435 Fernandina Beach, FL32035 Tel (904) 277-9765 www.southwickassociates.com
AN ASSESSMENT OF NEW JERSEY DEER HUNTER OPINION ON EXPANDING ANTLER POINT RESTRICTION (APR) REGULATIONS IN DEER MANAGEMENT ZONES 28, 30, 31, 34 AND 47
 REGULATIONS IN DEER MANAGEMENT ZONES 28, 30, 31, 34 AND 47") AN ASSESSMENT OF NEW JERSEY DEER HUNTER OPINION ON EXPANDING ANTLER POINT RESTRICTION (APR) REGULATIONS IN DEER MANAGEMENT ZONES 28, 30, 31, 34 AND 47 Survey mailed: April 2010 Data analyzed: June 2010
AN ASSESSMENT OF NEW JERSEY DEER HUNTER OPINION ON EXPANDING ANTLER POINT RESTRICTION (APR) REGULATIONS IN DEER MANAGEMENT ZONES 28, 30, 31, 34 AND 47 Survey mailed: April 2010 Data analyzed: June 2010
Internet Use Among Illinois Hunters: A Ten Year Comparison
 HumanDimensions R e s e a r c h P r o g r a m Internet Use Among Illinois Hunters: A Ten Year Comparison Illinois Natural History Survey Prairie Research Institute University of Illinois at Urbana-Champaign
Up and Comers: Building a Successful Internship Program. Kamille Ramos USGA, Manager of Inclusion & Talent Acquisition
 Up and Comers: Building a Successful Internship Program Presented by Kamille Ramos USGA, Manager of Inclusion & Talent Acquisition Objectives Tell Our Story Our Internship Programs The 2018 Intern Journey