Current Hawaii Economic Conditions. Eugene Tian
|
|
|
- Claire Paul
- 6 years ago
- Views:
Transcription
1 Current Hawaii Economic Conditions Eugene Tian Department of Business, Economic Development & Tourism At the PATA/TTRA 2016 Annual Outlook & Economic Forecast Forum February 3, 2016
2 Positive Signs in the Economy Overall, Hawaii s economy is on a normal growth path Labor market will continue to improve in 2016 Construction industry will continue to expand in 2016 Hawaii s economy will grow at the similar rate as the nation in 2016 between 2.0% and 2.5% Hawaii s unemployment rate will still be better than the nation in 2016
3 Challenges in the Economy Economic slowing down in most of the countries worldwide Many Hawaii industries are still recovering Hawaii and Kauai Counties are still recovering Unemployment due to economic reasons is still high Air seat growth significantly slowing down and will lead visitor industry growth slowing down Construction industry momentum is weakening Reduction in military presence
4 Presentation Layout A Review on Economic Growth Labor Market Construction and Real Estate Tourism Military
5 A Historical Review of Hawaii s Economic Growth Annual average growth, % Indicator 30 years, years, Real GDP Real personal income Honolulu inflation rate Non-Ag wage and salary jobs Unemployment rate 1/ Visitor arrivals by air Real visitor expenditures 2/ / Average of 30 years, / Deflated by Honolulu CPI.
6 Many of the Economies of Hawaii Visitor Origin Countries Will Experience Slowing Down USA Canada Japan S. Korea Hong Kong Taiwan China United Kingdom Germany France Eurozone Australia Brazil Source: Blue Chip Economic Indicators, January 10, 2016
7 Hawaii s economy has been following the U.S. in the most recent two business cycles Real GDP growth, % change from previous year 8.0% 6.0% 8.3 years 10.7 years 7.6 years United States 4.0% 2.0% 0.0% -2.0% Hawaii -4.0% -6.0% Source: US BEA, DBEDT, NBER, and Blue Chip Economic Indicators
8 Personal Income Growth: U.S. and Hawaii 16.0% 14.0% 12.0% Hawaii 10.0% 8.0% United States 6.0% 4.0% 2.0% 0.0% -2.0% -4.0% -6.0% Source: U.S. Bureau of Economic Analysis
9 Total Job Growth: U.S. and Hawaii Total jobs including payroll jobs and proprietors, both full-time and part-time 6.0% 5.0% Hawaii 4.0% 3.0% United States 2.0% 1.0% 0.0% -1.0% -2.0% -3.0% -4.0% Source: U.S. Bureau of Economic Analysis
10 U.S. and Japanese Visitor Arrivals to Hawaii: ,000,000 US Japanese 5,000,000 4,000,000 3,000,000 2,000,000 1,000, Source: HVB, DBEDT, and HTA


11 Labor Market
12 Statewide Labor Force, Employment, and payroll Job Count Reached Record High Levels in , ,000 Labor Force Employment Jobs 600, , , , , ,
13 For Job Count, Honolulu and Maui Counties Have Fully Recovered From Great Recession But Hawaii and Kauai Counties Are Still Recovering (% recovery from December 2007) Honolulu Maui Hawaii Kauai Dec-07 Feb-08 Apr-08 Jun-08 Aug-08 Oct-08 Dec-08 Feb-09 Apr-09 Jun-09 Aug-09 Oct-09 Dec-09 Feb-10 Apr-10 Jun-10 Aug-10 Oct-10 Dec-10 Feb-11 Apr-11 Jun-11 Aug-11 Oct-11 Dec-11 Feb-12 Apr-12 Jun-12 Aug-12 Oct-12 Dec-12 Feb-13 Apr-13 Jun-13 Aug-13 Oct-13 Dec-13 Feb-14 Apr-14 Jun-14 Aug-14 Oct-14 Dec-14 Feb-15 Apr-15 Jun-15 Aug-15 Oct-15 Dec-15 Source: DILR and calculations by DBEDT
14 Unemployment Rate % Honolulu State of Hawai'i United States December / United States 4.8% Hawai i 2.9% Honolulu 2.7% Jan-04 Mar-04 May-04 Jul-04 Sep-04 Nov-04 Jan-05 Mar-05 May-05 Jul-05 Sep-05 Nov-05 Jan-06 Mar-06 May-06 Jul-06 Sep-06 Nov-06 Jan-07 Mar-07 May-07 Jul-07 Sep-07 Nov-07 Jan-08 Mar-08 May-08 Jul-08 Sep-08 Nov-08 Jan-09 Mar-09 May-09 Jul-09 Sep-09 Nov-09 Jan-10 Mar-10 May-10 Jul-10 Sep-10 Nov-10 Jan-11 Mar-11 May-11 Jul-11 Sep-11 Nov-11 Jan-12 Mar-12 May-12 Jul-12 Sep-12 Nov-12 Jan-13 Mar-13 May-13 Jul-13 Sep-13 Nov-13 Jan-14 Mar-14 May-14 Jul-14 Sep-14 Nov-14 Jan-15 Mar-15 May-15 Jul-15 Sep-15 Nov-15 Source: Bureau of Labor Statistics * Not seasonally adjusted. 8
15 In 2015, unemployment claims dropped 18.4% Comparison of Initial Unemployment Claims 3,000 2,500 Number of Claims 2,000 1,500 1, Source: Hawaii DLIR
16 Statewide Job Count Changes: 2014 Hawaii Gained 6,750 Payroll Jobs in 2014 Professional & Business Services 2,400 State & local gov. 1,833 Food Services & Drinking Places 1,150 Health Care & Social Assistance Accommodation Nat. Resources, Mining, Constr. Transp., Warehousing, Util Financial Activities Manufacturing Arts, Entertainment & Recreation Retail Trade Wholesale Trade 0 33 Other Services Information Educational Services Federal gov (1,000) (500) ,000 1,500 2,000 2,500 3,000 Source: Hawaii State Department of Labor and Industrial Relations
17 Hawaii Gained 9,500 Payroll Jobs in 2015 Health Care & Social Assistance Nat. Resources, Mining, Constr. 1,800 1,900 Food Services & Drinking Places Retail Trade 1,700 Statewide Job Count Changes: First 4 months of 2015 Professional & Business Services 1,300 1,600 Transp., Warehousing, Util. Other Services Arts, Entertainment & Recreation Financial Activities Wholesale Trade Information Educational Services Manufacturing Accommodation State & local Government Federal Government , ,000 1,500 2,000 2,500 Source: Hawaii State Department of Labor and Industrial Relations
18 Hawaii Industrial Winners Percent of Jobs Compared with December Health Care Professional Services Food Services Art & Entertainment Other Services 120 % of the December 2007 level Dec-07 Feb-08 Apr-08 Jun-08 Aug-08 Oct-08 Dec-08 Feb-09 Apr-09 Jun-09 Aug-09 Oct-09 Dec-09 Feb-10 Apr-10 Jun-10 Aug-10 Oct-10 Dec-10 Feb-11 Apr-11 Jun-11 Aug-11 Oct-11 Dec-11 Feb-12 Apr-12 Jun-12 Aug-12 Oct-12 Dec-12 Feb-13 Apr-13 Jun-13 Aug-13 Oct-13 Dec-13 Feb-14 Apr-14 Jun-14 Aug-14 Oct-14 Dec-14 Feb-15 Apr-15 Jun-15 Aug-15 Oct-15 Dec-15 Source: DLIR
19 Hawaii Industrial Losers Percent of Jobs Compared with December % change in job count Dec-07 Mar-08 Jun-08 Sep-08 Dec-08 Mar-09 Jun-09 Sep-09 Dec-09 Mar-10 Jun-10 Sep-10 Dec-10 Mar-11 Jun-11 Sep-11 Dec-11 Mar-12 Jun-12 Sep-12 Dec-12 Mar-13 Jun-13 Sep-13 Dec-13 Mar-14 Jun-14 Sep-14 Dec-14 Mar-15 Jun-15 Sep-15 Dec-15 Construction Manufacturing Wholesale trade Transporation & Warehousing Information Finance Education Services Source: DLIR
20 % Unemployment Rate Due to Economic Reasons Difference between U6 and U Source: U.S. Bureau of Labor Statistics
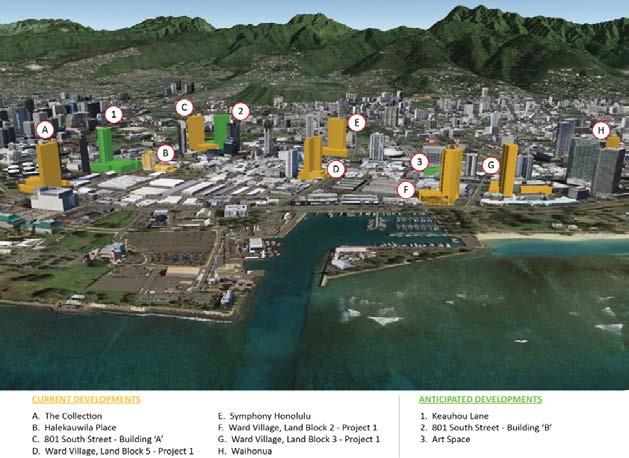
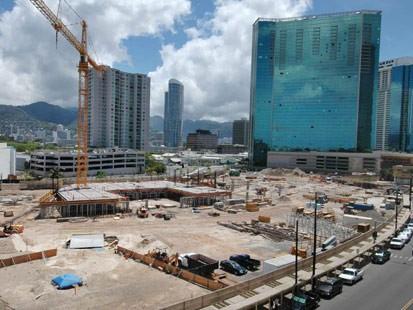
21 Construction and Real Estate
22 Private Construction Continues Recovering 12-Month Moving Average of Building Authorization Components* 500, ,000 Additions & Alterations Commercial & Industrial Residential 400, ,000 $ Thousands 300, , , , ,000 50,000 0 *Additions and Alterations and Commercial & Industrial data do not include Kauai. All data through December 2015 Source: County building departments and U.S. Census Bureau
23 Real Estate Sales (% change 2014 to 2015) Single Family Homes Condo Homes Island Closed sales Median price Closed sales Median price Honolulu 5.2% 3.7% 4.5% 2.9% Maui 15.0% 2.0% 0.0% -1.0% Hawaii 6.5% 4.3% 0.8% -1.8% Kauai 4.5% 15.1% 10.1% 7.1% Source: Hawaii Information Service, the Honolulu Board of Realtors, and Realtors Association of Maui.
24 2015 Home Median Prices Island Single Family Homes Condo Homes Honolulu $700,000 $360,000 Maui $580,000 $410,000 Hawaii $328,500 $275,000 Kauai $613,500 $370,000 Source: Hawaii Information Service, the Honolulu Board of Realtors, and Realtors Association of Maui.


25 Tourism Industry
26 Diversification of Visitor Market Region 2006 Arrivals % of Total 2015 Arrivals % of Total US Mainland 5,173, ,307, Japan 1,362, ,499, Canada 280, , Australia 117, , China 54, , Korea 37, , Europe 106, , Latin America 19, , Others 375, , Total 7,528, ,533, Source: DBEDT and HTA
27 Visitor Arrivals and Expenditures Millions Visitor Arrivals (1) Calendar Year Millions Visitor Expenditures (1) $20,000 $15,000 $11,066 $12,158 $14,365 $14,521 $14,943 $15,417 $15,964 $10,000 $5,000 $ Calendar Year Source: HTA and DBEDT (1) 2015 and 2016 figures are projections 18
28 Given the outlook of air seats at the beginning of 2016, visitor arrivals by air might be a 0.3% increase in Total air seats 9,299,913 9,392,291 10,328,316 10,896,815 11,264,105 11,912,851 11,956,990 Total passengers 8,333,417 8,504,757 9,198,738 9,332,485 9,693,318 10,076,950 10,115,614 Load factor 89.6% 90.6% 89.1% 85.6% 86.1% 84.6% 84.6% Visitors by air 6,916,894 7,174,397 7,867,143 8,003,474 8,183,671 8,533,978 8,557,809 Returning residents 1,416,523 1,330,360 1,331,595 1,329,011 1,233,208 1,542,972 1,557,804 % of visitors 83.0% 84.4% 85.5% 85.8% 84.4% 84.7% 84.7 Source: HTA
29 Military in Hawaii


30 Military Presence in Hawaii is the Highest Since WWII Active Duty Personnel in Hawai i 55,000 50,000 49,110 49,023 51,045 46,764 45,000 43,141 41,887 42,371 40,000 38,397 38,755 35,000 35,412 33,930 30,000 25,000 20, Source: U.S. Department of Defense.
2018 Annual Economic Forecast Dragas Center for Economic Analysis and Policy
 2018 Annual Economic Forecast Dragas Center for Economic Analysis and Policy PRESENTING SPONSOR EVENT PARTNERS 2 The forecasts and commentary do not constitute an official viewpoint of Old Dominion University,
Economy On The Rebound
 Economy On The Rebound Robert Johnson Associate Director of Economic Analysis November 17, 2009 robert.johnson@morningstar.com (312) 696-6103 2009, Morningstar, Inc. All rights reserved. Executive
National and Regional Economic Outlook. Central Southern CAA Conference
 National and Regional Economic Outlook Central Southern CAA Conference Dr. Mira Farka & Dr. Adrian R. Fleissig California State University, Fullerton April 13, 2011 The Painfully Slow Recovery The Painfully
Southern California Economic Forecast & Industry Outlook
 2016-17 Southern California Economic Forecast & Industry Outlook Robert A. Kleinhenz, Ph.D. Sr. VP/Chief Economist, LAEDC February 17, 2016 Outline U.S. Economy California Economy Southern California Economy
President and Chief Executive Officer Federal Reserve Bank of New York Washington and Lee University H. Parker Willis Lecture in Political Economics
 The U.S. Economic Outlook Chartspresented by WilliamC Dudley Charts presented by William C. Dudley President and Chief Executive Officer Federal Reserve Bank of New York Washington and Lee University H.
2018 Annual Economic Forecast Dragas Center for Economic Analysis and Policy
 2018 Annual Economic Forecast Dragas Center for Economic Analysis and Policy PRESENTING SPONSOR EVENT PARTNERS 2 The forecasts and commentary do not constitute an official viewpoint of Old Dominion University,
The Changing Global Economy Impacts on Seaports and Trade Dr. Walter Kemmsies
 The Changing Global Economy Impacts on Seaports and Trade Dr. Walter Kemmsies Chief Economist, PAGI Group, JLL (Port, Airport & Global Infrastructure) Agenda Where are we in the cycle? What are the barriers
U.S. and Colorado Economic Outlook National Association of Industrial and Office Parks. Business Research Division Leeds School of Business
 U.S. and Colorado Economic Outlook National Association of Industrial and Office Parks Presented by the Business Research Division Leeds School of Business University of Colorado at Boulder U.S. Economic
WORKFORCE LOCAL AREA EMPLOYMENT STATISTICS (LAUS)
") AUGUST 2018 WORKFORCE LOCAL AREA EMPLOYMENT STATISTICS (LAUS) 1,200,000 1,100,000 1,000,000 900,000 Labor Force Employment 1,152,626 1,116,938 800,000 700,000 600,000 500,000 2016 to 2017: 35957 (3.1%)
AUGUST 2018 WORKFORCE LOCAL AREA EMPLOYMENT STATISTICS (LAUS) 1,200,000 1,100,000 1,000,000 900,000 Labor Force Employment 1,152,626 1,116,938 800,000 700,000 600,000 500,000 2016 to 2017: 35957 (3.1%)
Babson Capital/UNC Charlotte Economic Forecast. May 13, 2014
 Babson Capital/UNC Charlotte Economic Forecast May 13, 2014 Outline for Today Myths and Realities of this Recovery Positive Economic Signs Negative Economic Signs Outlook for 2014 The Employment Picture
WORKFORCE LOCAL AREA EMPLOYMENT STATISTICS (LAUS)
") AUGUST 2016 WORKFORCE LOCAL AREA EMPLOYMENT STATISTICS (LAUS) 1,150,000 1,100,000 1,050,000 1,000,000 950,000 900,000 850,000 800,000 750,000 700,000 Labor Force Employment June 2015 to June 2016: 36,504
AUGUST 2016 WORKFORCE LOCAL AREA EMPLOYMENT STATISTICS (LAUS) 1,150,000 1,100,000 1,050,000 1,000,000 950,000 900,000 850,000 800,000 750,000 700,000 Labor Force Employment June 2015 to June 2016: 36,504
2018 Economic Outlook Forum Daraius Irani, Ph.D. Chief Economist, Regional Economic Studies Institute VP, Division of Strategic Partnerships and
 2018 Economic Outlook Forum Daraius Irani, Ph.D. Chief Economist, Regional Economic Studies Institute VP, Division of Strategic Partnerships and Applied Research Towson University November 29, 2018 $19,000
A comment on recent events, and...
 A comment on recent events, and... where we are in the current economic cycle November 15, 2016 Mark Schniepp Director Likely Trump Policies $4 to $5 Trillion in tax cuts over 10 years to corporations,
Economic Update and Outlook
 Economic Update and Outlook NAIOP Vancouver Chapter November 15, 2012 Helmut Pastrick Chief Economist Central 1 Credit Union Outline: Global, U.S., and Canadian economic conditions Canada economic and
MAINTAINING MOMENTUM:
 MAINTAINING MOMENTUM: 2018 National Economic Update September 12, 2018 noun mo men tum \ mō-ˈmen-təm, mə- \ 1 b : the strength or force that allows something to continue or to grow stronger or faster as
The Economic Outlook. Economic Policy Division
 The Economic Outlook Economic Policy Division Glass Half Full Six years of steady growth Real GDP Outlook Percent Change, Annual Rate 10 5 0-5 -10 1980 1985 1990 1995 2000 2005 2010 2015 Glass Half Full
Old Dominion University 2017 Regional Economic Forecast. Strome College of Business
 Old Dominion University 2017 Regional Economic Forecast January 25, 2017 Professor Vinod Agarwal Director, Economic Forecasting Project Strome College of Business www.odu.edu/forecasting The views expressed
MUSTAFA MOHATAREM Chief Economist, General Motors
 MUSTAFA MOHATAREM Chief Economist, General Motors INTRODUCTION The U.S. economy continues to grow at a gradual but also erratic pace The current recovery is one of the slowest in the post-wwii U.S. history.
Economic Overview. Melissa K. Peralta Senior Economist April 27, 2017
 Economic Overview Melissa K. Peralta Senior Economist April 27, 2017 TTX Overview TTX functions as the industry s railcar cooperative, operating under pooling authority granted by the Surface Transportation
Nevada County Population Projections 2013 to 2032 Based On The Last Estimate Year of 2012
 Nevada County Population Projections 2013 to 2032 Based On The Last Estimate Year of 2012 Prepared By: The Nevada State Demographer s Office Jeff Hardcastle, AICP NV State Demographer University of NV
Big Changes, Unknown Impacts
 Big Changes, Unknown Impacts Boulder Economic Forecast Place cover image here Richard Wobbekind Senior Economist and Associate Dean for Business and Government Relations January 17, 2018 Real GDP Growth
Zions Bank Economic Overview
 Zions Bank Economic Overview Kenworth National Dealers Conference November 8, 2018 1 National Economic Conditions 2 Volatility Returns to the Stock Market 27,000 Dow Jones Industrial Average October 10,
The Herzliya Conference The Economic Dimension Prof. Rafi Melnick Provost, Interdisciplinary Center (IDC) Herzliya
 Herzliya") The Herzliya Conference The Economic Dimension 2009 Provost, Interdisciplinary Center (IDC) Herzliya The Big Issues The broken crystal ball A crisis that happens once in 100 years From a country oriented
The Herzliya Conference The Economic Dimension 2009 Provost, Interdisciplinary Center (IDC) Herzliya The Big Issues The broken crystal ball A crisis that happens once in 100 years From a country oriented
COMPARISON OF FIXED & VARIABLE RATES (25 YEARS) CHARTERED BANK ADMINISTERED INTEREST RATES - PRIME BUSINESS*
 CHARTERED BANK ADMINISTERED INTEREST RATES - PRIME BUSINESS*") COMPARISON OF FIXED & VARIABLE RATES (25 YEARS) Fixed Rates Variable Rates FIXED RATES OF THE PAST 25 YEARS AVERAGE RESIDENTIAL MORTGAGE LENDING RATE - 5 YEAR* (Per cent) Year Jan Feb Mar Apr May Jun Jul
COMPARISON OF FIXED & VARIABLE RATES (25 YEARS) Fixed Rates Variable Rates FIXED RATES OF THE PAST 25 YEARS AVERAGE RESIDENTIAL MORTGAGE LENDING RATE - 5 YEAR* (Per cent) Year Jan Feb Mar Apr May Jun Jul
The Cairns Economy Recent Trends and Prospects
 MINING, AGRICULTURE, TOURISM, TRANSPORT, CONSTRUCTION, MANUFACTURING, DEFENCE, EDUCATION, ADMINISTRATION, SERVICES The Cairns Economy Recent Trends and Prospects WS (Bill) Cummings PRESENTATION TO Ref:
Riverside Rising Economic Outlook for the Region April 2015
 Analysis. Answers Riverside Rising Economic Outlook for the Region April 2015 Beacon Economics, LLC California fact versus fiction Looking back a few years (2009 / 2010) everyone was saying that CA would
State of American Trucking
 State of American Trucking October 11, 2018 Rod Suarez Economic Analyst American Trucking Associations rsuarez@trucking.org Business Cycles U.S. Expansions Duration October 1949 - July 1953 May 1954 -
The Global Economy: Sustaining Momentum
 The Global Economy: Sustaining Momentum David J. Stockton Senior Fellow Peterson Institute for International Economics Chief Economist Monetary Policy Analytics October 5, 2017 What s Driving the Global
Japanese Market Potential
 Growth Strategy (announced on 14 June 2013) : Japan is BACK. Overall Target: 2% Real GDP Growth in the next 10 years JPY1.5 million Increase of GNI/capita after 10 years Unleash the Potential of Private
Reading the Tea Leaves: Investing for 2010 and Beyond
 Reading the Tea Leaves: Investing for 2010 and Beyond Wednesday, April 28, 2010; 8:00 AM - 9:15 AM Moderator: Maria Bartiromo, Anchor, CNBC's Closing Bell With Maria Bartiromo Speakers: Nick Calamos, President
2015 Economic Forecast & Industry Outlook. Robert A. Kleinhenz, Ph.D. Chief Economist, Kyser Center for Economic Research, LAEDC October 8, 2014
 2015 Economic Forecast & Industry Outlook Robert A. Kleinhenz, Ph.D. Chief Economist,, LAEDC October 8, 2014 Outline U.S. Economy California Economy Southern California Economy & Industries Five-Year Outlook
Market Insights. June 30, 2018
 June 30, 2018 Economic Overview 2 Global & Regional Growth Forecasts IMF GDP Forecasts (% change YoY) 2010 2011 2012 2013 2014 2015 2016 2017 2018 Advanced Economies 1.7% 1.2% 1.3% 2.1% 2.3% 1.7% 2.3%
Market Insights. March 29, 2019
 March 29, 2019 Economic Overview 2 Global & Regional Growth Forecasts IMF GDP Forecasts (% change YoY) 2010 2011 2012 2013 2014 2015 2016 2017 2018 Advanced Economies 1.2% 1.4% 2.1% 2.3% 1.7% 2.4% 2.3%
Economic Update and Prospects for 2019 Professor Robert M. McNab Dragas Center for Economic Analysis and Policy Strome College of Business
 Economic Update and Prospects for 2019 Professor Robert M. McNab Dragas Center for Economic Analysis and Policy Strome College of Business January 3, 2019 The forecasts and commentary do not constitute
The Economic Outlook. Economic Policy Division
 The Economic Outlook Economic Policy Division Glass Half Full Six plus years of moderate growth Real GDP Outlook Percent Change, Annual Rate 10 5 0-5 -10 1980 1985 1990 1995 2000 2005 2010 2015 Glass Half
The 2019 Economic Outlook Forum The Outlook for MS
 The 2019 Economic Outlook Forum The Outlook for MS February 2019 Mississippi University Research Center Mississippi Institutions of Higher Learning Darrin Webb, State Economist dwebb@mississippi.edu (601)432-6556
2018 Annual Economic Forecast Dragas Center for Economic Analysis and Policy
 2018 Annual Economic Forecast Dragas Center for Economic Analysis and Policy PRESENTING SPONSOR EVENT PARTNERS 2 The forecasts and commentary do not constitute an official viewpoint of Old Dominion University,
UNIVERSITY OF CALIFORNIA Economics 134 DEPARTMENT OF ECONOMICS Spring 2018 Professor David Romer
 UNIVERSITY OF CALIFORNIA Economics 134 DEPARTMENT OF ECONOMICS Spring 2018 Professor David Romer LECTURE 2 OVERVIEW OF THE GREAT DEPRESSION January 22, 2018 I. THE 1920S A. GDP growth and inflation B.
Economic & Financial Market Outlook
 Economic & Financial Market Outlook BC Pension Forum March 1, 2013 Chris Lawless, Chief Economist Overview Global forces Recent economic performance ~ US, Europe, Japan, China ~ Other emerging markets
Outline. Overview of globalization. Global outlook for real economic activity & inflation. Risks to the outlook
 2017 International Economic Outlook Everett Grant Research Economist Globalization & Monetary Policy Institute Federal Reserve Bank of Dallas October 2017 The views expressed are those of the author and
Foreign overnights in the Nordic countries 2015
 Foreign overnights in the Nordic countries 2015 Sources: Statistics Statistics Statistics Statistics July 2016 VISIT FINLAND STATISTICS Contents Foreign overnights in the Nordic countries.4 Overnights
Briefing on the State of the State. presented to the. SCAA Schuyler Center for Analysis and Advocacy
 Briefing on the State of the State presented to the SCAA Schuyler Center for Analysis and Advocacy Rae D. Rosen Assistant Vice President Federal Reserve Bank of New York November 16, 2006 Key Points: Economic
Your Texas Economy. Current through: Tuesday, Nov 20, 2018
 Your Texas Economy Current through: Tuesday, Nov 20, 2018 Overview of Texas Economy The Texas economy is growing robustly in 2018 2018 job growth through October is 2.9 percent annualized compared to 2.1
Transitions: 2019 Economic Forecast for Metro Denver February 6, 2019
 Transitions: 2019 Economic Forecast for Metro Denver February 6, 2019 Prepared by: Can Stock Photo / jkirsh In Partnership with: Consumer Changes and Influences Slowing population growth Aging of the population
Global Economic Outlook
 Global Economic Outlook Mark A. Wynne Vice President & Associate Director of Research Director, Globalization & Monetary Policy Institute Federal Reserve Bank of Dallas Presentation to Vistas Conference
THE ICELANDIC ECONOMY AN IMPRESSIVE RECOVERY BUT WHAT CHALLENGES LIE AHEAD?
 THE ICELANDIC ECONOMY AN IMPRESSIVE RECOVERY BUT WHAT CHALLENGES LIE AHEAD? FROM BUST TO BOOM. AN EPIC BUST After 16 years of growth with a short pause for breath in 2002, the Icelandic economy entered
The Erie Economy: Performance, Opportunities, and Challenges
 The Erie Economy: Performance, Opportunities, and Challenges Eggs n Issues Manufacturer and Business Association December 2015 Dr. Kenneth Louie The Economic Research Institute of Erie Sam and Irene Black
ORLANDO MSA MARKET OVERVIEW LAST UPDATED: MAY 2018
 ORLANDO MSA MARKET OVERVIEW LAST UPDATED: MAY 2018 Orlando MSA Market Overview Labor Market Payroll Employment Commercial Real Estate Residential Real Estate Consumer Spending Visitor Industry Labor Market
2018 HR & PAYROLL Deadlines
 th (by payment date) EPAF 3rd PARTY FEEDS WTE Approval 2018 HR & PAYROLL s Normal Payroll day s 2017 B1-26 3 * 13-Dec-17 15-Dec-17 n/a n/a n/a 28-Dec-17 29-Dec-17 11:00 AM 16-Dec-2017 29-Dec-2017 JAN 2018
Southwest Ohio Regional Economy in Context. Richard Stock, PhD. Business Research Group
 Southwest Ohio Regional Economy in Context Richard Stock, PhD. Business Research Group State of the Metro Area (in January Each Year) Total Employment has slowly increased in the last three years after
From Recession to Recovery
 From Recession to Recovery Monday, April 26, 2010 8:00 AM - 9:15 AM Moderator Michael Klowden, President and CEO, Milken Institute Speakers Mohamed El-Erian, CEO and Co-Chief Investment Officer, Pacific
Economic Update and Outlook
 The Building Industry Association Of Okaloosa-Walton Counties Economic Update and Outlook Rick Harper, PhD February 1, 2018 The Economic Outlook 3rd longest postwar expansion for U.S., marked 103 months
Impacts of the Global Economy on Asia Pacific Travel. 29 June 2007 John Walker
 Impacts of the Global Economy on Asia Pacific Travel 29 June 2007 John Walker jwalker@oxfordeconomics.com Oxford Economics Founded in 1981 Over 300 clients including blue chip companies and government
U.S. Economic Activity. Federal Reserve Bank of Dallas
 U.S. Economic Activity Federal Reserve Bank of Dallas 2019 Contents 1 Economic Activity 2 Wages and Prices 3 Financial Activity Economic Activity Economic Activity Index 160 Consumer Confidence and Sentiment
U.S. Economic Activity. Federal Reserve Bank of Dallas
 U.S. Economic Activity Federal Reserve Bank of Dallas 2019 Contents 1 Economic Activity 2 Wages and Prices 3 Financial Activity Economic Activity Economic Activity New Orders for Durable Goods Billions
U.S. Economic Activity. Federal Reserve Bank of Dallas
 U.S. Economic Activity Federal Reserve Bank of Dallas 2019 Contents 1 Economic Activity 2 Wages and Prices 3 Financial Activity Economic Activity Economic Activity Index 160 Consumer Confidence and Sentiment
2019 ECONOMIC FORECAST AND FINANCIAL MARKET UPDATE
 2019 ECONOMIC FORECAST AND FINANCIAL MARKET UPDATE January 14, 2019 Scott Colbert, CFA Executive Vice President Director of Fixed Income & Chief Economist scott.colbert@commercebank.com GLOBAL GROWTH EXPECTATIONS
Global growth prospects
 Global growth prospects Percent 6 Advanced Economies Emerging Markets and Developing Economies 5 4.9 5.0 4.7 4.7 4.5 4 4.3 4.3 3.7 3.7 3 2 2.3 2.3 2.2 2.0 2.0 1.7 1.7 1 1.1 1.3 0 2012 2013 2014 2015 2016
MBA Economic and Mortgage Finance Outlook
 MBA Economic and Mortgage Finance Outlook MBA of Alabama Annual Conference June 7, 2017 Presented by Lynn Fisher Mortgage Bankers Association 1 Summary of the MBA Outlook 2016 2017 2018 2019 GDP Growth
The Houston Economy Jesse Thompson Regional Business Economist The Federal Reserve Bank of Dallas, Houston Branch February 2017
 The Houston Economy Jesse Thompson Regional Business Economist The Federal Reserve Bank of Dallas, Houston Branch February 2017 Image from http://peoplesguidetohouston.wordpress.com/category/uncategorized/
Bob Costello Chief Economist & Vice President American Trucking Associations. Economic & Motor Carrier Industry Trends. September 10, 2013
 Bob Costello Chief Economist & Vice President American Trucking Associations Economic & Motor Carrier Industry Trends September 10, 2013 The Freight Economy Washington continues to be a headwind on economic
Zions Bank Municipal Conference Economic Overview August 13, 2015
 Zions Bank Municipal Conference Economic Overview August 13, 2015 Overview National Economic Conditions Utah Economic Conditions Utah is One of the Fastest Growing CA 0.9% States in the Country Percent
Your Texas Economy. Last updated: January 30, 2018
 Your Texas Economy Last updated: January 30, 2018 Texas economy strong in 2017 2017 job growth was 2.4% Overview 2015/2016 job growth was much weaker due to the oil bust (1.3% and 1.2%, respectively) 2014
Economic Outlook March Economic Policy Division
 Economic Outlook March 212 Economic Policy Division Real GDP Outlook Percent Change, Annual Rate 2 1 1 - -1 197 197 198 198 199 199 2 2 21 U.S. GDP Actual and Potential Quarterly, Q1 197 to Q4 211 Real
Utility Debt Securitization Authority 2013 T/TE Billed Revenues Tracking Report
 Utility Debt Securitization Authority 2013 T/TE Billed Revenues Tracking Report Billing Budgeted Billed Dollar Percent Month Revenues Revenues Variance Variance Jan 2018 11,943,180.68 12,697,662.47 754,481.79
The Israeli Economy 2009 The Caesarea Center Conference
 The Israeli Economy 2009 The Caesarea Center Conference Provost, Interdisciplinary Center (IDC) Herzliya The Big Issues The broken crystal ball A crisis that happens once in 100 years From a country oriented
Nevada County Population Projections 2015 to 2034
 Nevada County Population Projections 2015 to 2034 Prepared By: Jeff Hardcastle, AICP Nevada State Demographer Nevada Department of Taxation Reno Office: 4600 Kietzke Lane, Building L Suite 235 Reno, NV
The Houston Economy Jesse Thompson Regional Business Economist The Federal Reserve Bank of Dallas, Houston Branch June 2016
 The Houston Economy Jesse Thompson Regional Business Economist The Federal Reserve Bank of Dallas, Houston Branch June 2016 Image from http://peoplesguidetohouston.wordpress.com/category/uncategorized/
Zions Bank Economic Overview
 Zions Bank Economic Overview Logan Rotary Club June 28, 2018 Dow Tops 26,000 Up 48% Since 2016 Election Jan 26, 2018 26,616 Oct 30, 2016 17,888 Source: Wall Street Journal Dow Around Correction Territory
Northwest Economic Research Center College of Urban and Public Affairs Forecast Breakfast Economic Outlook
 Northwest Economic Research Center College of Urban and Public Affairs 2019 Forecast Breakfast Economic Outlook 1/10/2019 2 U.S. ECONOMY 1/10/2019 3 1980 1982 1984 1986 1988 1990 1992 1994 1996 1998 2000
Muhlenkamp & Company. Webinar December 1, Ron Muhlenkamp, Portfolio Manager Jeff Muhlenkamp, Portfolio Manager Tony Muhlenkamp, President
 Muhlenkamp & Company Webinar December 1, 2016 Ron Muhlenkamp, Portfolio Manager Jeff Muhlenkamp, Portfolio Manager Tony Muhlenkamp, President Muhlenkamp & Company, Inc. Intelligent Investment Management
The Houston Economy Jesse Thompson Regional Business Economist The Federal Reserve Bank of Dallas, Houston Branch January 2017
 The Houston Economy Jesse Thompson Regional Business Economist The Federal Reserve Bank of Dallas, Houston Branch January 2017 Image from http://peoplesguidetohouston.wordpress.com/category/uncategorized/
Percent
 Outline Outline Growth is picking up Percent 6 Advanced economies Emerging and developing economies 5 4 4.9 5.0 4.3 4.4 4.6 4.7 4.7 3.7 3.7 3 2 2.0 2.3 1.6 2.2 2.3 1.9 1.7 1 1.1 1.3 0 2012 2013 2014 2015
Future Global Trade Trends - Risks & Opportunities. Pulse of the Ports: Peak Season Forecast March 21, 2013
 1 Future Global Trade Trends - Risks & Opportunities Pulse of the Ports: Peak Season Forecast March 21, 2013 June 2012 Dr. Walter Kemmsies Chief Economist Summary Higher economic growth in 2013, possible
US Economic Activity
 US Economic Activity GDP has been in positive territory for seven consecutive quarters, and the advance estimate shows the US economy grew at a 1.0% rate in the fourth quarter 2015. US Economic Activity
Zions Bank Economic Overview
 Zions Bank Economic Overview Intermountain Credit Education League May 10, 2018 Dow Tops 26,000 Up 48% Since 2016 Election Jan 26, 2018 26,616 Oct 30, 2016 17,888 Source: Wall Street Journal Dow Around
Zions Bank Economic Overview
 Zions Bank Economic Overview Veteran Owned Business Conference May 11, 2018 Dow Tops 26,000 Up 48% Since 2016 Election Jan 26, 2018 26,616 Oct 30, 2016 17,888 Source: Wall Street Journal Dow Around Correction
Kevin Thorpe Financial Economist & Principal Cassidy Turley
 Kevin Thorpe Financial Economist & Principal Cassidy Turley Economic & Commercial Real Estate Outlook Kevin Thorpe, Chief Economist 2012 Another Year Of Modest Improvement 2006Q1 2006Q3 2007Q1 2007Q3 2008Q1
Zions Bank Economic Overview. March 14, 2017
 Zions Bank Economic Overview March 14, 2017 National Economic Conditions Dow 20,000 The Trump Bump Dow Reaches New Heights Following U.S. Presidential Election Source: Wall Street Journal 120.0 110.0 100.0
National and Virginia Economic Outlook Professor Robert M. McNab Dragas Center for Economic Analysis and Policy Strome College of Business
 National and Virginia Economic Outlook Professor Robert M. McNab Dragas Center for Economic Analysis and Policy Strome College of Business October 24, 2018 The forecasts and commentary do not constitute
SWISS reports stable load factors
 SWISS Corporate Communications Phone: +41 (0)848 773 773 Fax: +41 (0)44 564 2127 communications@swiss.com SWISS.COM Media release Zurich Airport, October 10, 2008 SWISS reports stable load factors SWISS
Construction Market Opportunities and Risks
 Construction Market Opportunities and Risks Construction Teleconference 11:00 a.m. to 12:00 noon June 3, 2004 Copyright 2003 Global Insight, Inc. Speakers Global Construction Outlook Chris Holling, Executive
Southern Lodging Summit Memphis, TN. Presented by Randy Smith Founder Smith Travel Research
 Southern Lodging Summit Memphis, TN Presented by Randy Smith Founder Smith Travel Research Total US - Key Statistics 12-Months Ending July 2012 % Change Hotels 52.3 k Room Supply 1.8 bn 0.4% Room Demand
Texas Economic Outlook: Recovery in 2010 Keith Phillips Federal Reserve Bank of Dallas San Antonio Office
 Texas Economic Outlook: Recovery in 2010 Keith Phillips Federal Reserve Bank of Dallas San Antonio Office The views expressed in this presentation are strictly those of the author and do not necessarily
Inland Empire International Trade Economic Forecast
 Inland Empire International Trade Economic Forecast Mira Farka Adrian Fleissig Institute for Economic and Environmental Studies Orange County / Inland Empire Regional SBDC Network California State University,
Dr. James P. Gaines Research Economist recenter.tamu.edu
 Texas Uncertain Economy in a World of Uncertain Oil Prices Dr. James P. Gaines Research Economist recenter.tamu.edu National Economic Recovery still Going 2 U.S. Outlook Expected GDP growth still modest:
ROYAL MONETARY AUTHORITY OF BHUTAN MONTHLY STATISTICAL BULLETIN
 ROYAL MONETARY AUTHORITY OF BHUTAN MONTHLY STATISTICAL BULLETIN Macroeconomic Research and Statistics Department Vol. XVIl, No.3 March 2018 CONTENTS Preface....01 Bhutan s Key Economic Indicators..02 Table
Opportunities in a Challenging Global Business Environment: Can the World Avoid a Double-Dip?
 Opportunities in a Challenging Global Business Environment: Can the World Avoid a Double-Dip? Ross DeVol Chief Research Officer (310) 570 4615 rdevol@milkeninstitute.org www.milkeninstitute.org Presentation
How Global Trade Is Driving Demand For Ports
 How Global Trade Is Driving Demand For Ports 17 April, 2018 Dr. Walter Kemmsies Chief Strategist JLL Ports Airports and Global Infrastructure JLL Ports Airports and Global Infrastructure Capital Markets
Zions Bank Economic Overview
 Zions Bank Economic Overview WIB Education Summit September 19, 2017 National Economic Conditions Dow Breaks 22,000 The Trump Bump Dow Reaches New Heights Following U.S. Presidential Election Source: Federal
ROYAL MONETARY AUTHORITY OF BHUTAN MONTHLY STATISTICAL BULLETIN
 ROYAL MONETARY AUTHORITY OF BHUTAN MONTHLY STATISTICAL BULLETIN Department of Macroeconomic Research and Statistics Vol. XVIl, No.9 September 2018 CONTENTS Preface....01 Bhutan s Key Economic Indicators..02
U.S. Overview. Gathering Steam? Tuesday, October 1, 2013
 U.S. Overview Gathering Steam? Tuesday, October 1, 2013 Uneven global economic recovery Annual real GDP growth projections (%) Projections 2013 2014 World 3.1 3.1 3.8 United States 2.2 1.7 2.7 Euro Area
ROYAL MONETARY AUTHORITY OF BHUTAN MONTHLY STATISTICAL BULLETIN
 ROYAL MONETARY AUTHORITY OF BHUTAN MONTHLY STATISTICAL BULLETIN Department of Macroeconomic Research and Statistics Vol. XVIl, No.11 November 2018 CONTENTS Preface....01 Bhutan s Key Economic Indicators..02
Wenlin Liu, Senior Economist. Stateof Wyoming. Economic Analysis Division State of Wyoming 1
 WYOMING DEMOGRAPHIC AND ECONOMIC TREND LCCC LIFE Program April 7, 2012 Cheyenne, Wyoming Wenlin Liu, Senior Economist Economic Analysis Division Stateof Wyoming Economic Analysis Division State of Wyoming
Deficit Reduction and Economic Growth: Are They Mutually Exclusive Goals? Tuesday, May 1, 2012; 2:30 PM - 3:45 PM
 Deficit Reduction and Economic Growth: Are They Mutually Exclusive Goals? Tuesday, May 1, 2012; 2:30 PM - 3:45 PM Moderator: Gillian Tett, U.S. Managing Editor, Financial Times Speakers: Jared Bernstein,
Global Containerboard Outlook
 Global Containerboard Outlook European Conference March 2018 Gleb Sinavskis Economist, European Paper Packaging Copyright 2018 RISI, Inc. Proprietary Information Gleb Sinavskis Economist, European Paper
The U.S. Economic Outlook
 The U.S. Economic Outlook Nigel Gault Chief U.S. Economist, IHS Global Insight FTA Revenue Estimation & Tax Research Conference Charleston, West Virginia October 17, 2011 What Has Happened to the Recovery?
Colombia: Economic Adjustment and Outlook. Andres-Mauricio Velasco Technical Deputy Minister of Finance, Republic of Colombia February 2018
 Colombia: Economic Adjustment and Outlook Andres-Mauricio Velasco Technical Deputy Minister of Finance, Republic of Colombia February 2018 What is Colombian Ministry of Finance s outlook and funding strategies
SA economic review Kevin Lings. August 2018
 SA economic review Kevin Lings August 2018 South Africa real GDP growth year-on-year %y/y 8 7 6 5 Ave 4.3% 4 Ave 2.5% 3 2 Ave 0.9% 1 0-1 -2-3 00 01 02 03 04 05 06 07 08 09 10 11 12 13 14 15 16 17 18 2
The ABA Advantage: Economic Issues Update & ABA Resources
 The ABA Advantage: Economic Issues Update & ABA Resources aba.com 1-800-BANKERS Meet the team Jim Chessen Chief Economist Curtis Dubay Senior Economist Brittany Kleinpaste Vice President of Economic Policy