Changing Demographics in the U.S. and the Impact on Congress
|
|
|
- Marilyn McGee
- 5 years ago
- Views:
Transcription

1 Changing Demographics in the U.S. and the Impact on Congress Richard Fry, PhD Prepared for presentation to the HACU 16 th Annual National Capitol Forum on Hispanic Higher Education, Washington, DC April 4, 2011


2 1615 L Street, NW, Suite 700 Washington, DC Fax
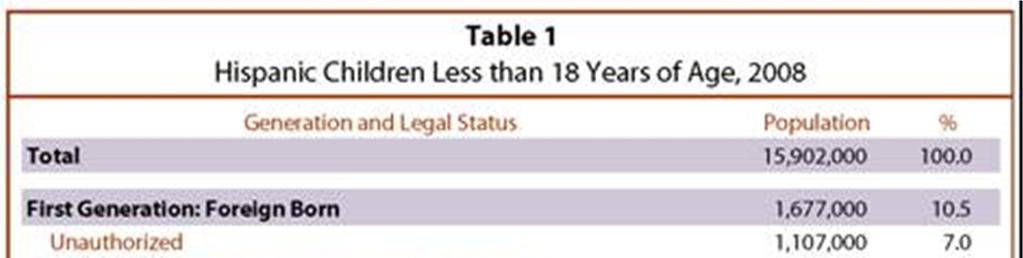
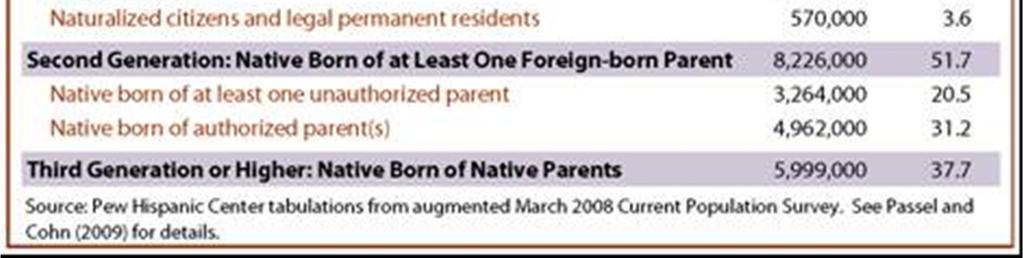
3 HISPANIC CHILDREN & CENSUS 2010
4 Children 2010 and 2000 ALL HISPANIC % Population (thousands) ,165 17, ,175 12, Population Growth Growth (thousands) 1,989 4,790 Growth (%) Source: Pew Hispanic Center tabulations of U.S. Census Bureau Redistricting_Files-PL_ for states
5 Six States Have At Least 500,000 Hispanic Children HISPANIC CHILDREN (thousands) Rank (thousands) Rank United States 17,132 12,342 California 4, ,051 1 Texas 3, ,387 2 Florida 1, New York Illinois Arizona New Jersey Colorado Georgia North Carolina Source: Pew Hispanic Center tabulations of U.S. Census Bureau Redistricting_Files-PL_ for states
6 In Twelve States More than 1-in- 5 Children are Hispanic HISPANIC SHARE OF ALL CHILDREN (%) 2010 Rank 2000 United States New Mexico California Texas Arizona Nevada Colorado Florida Illinois New York New Jersey Oregon Rhode Island Source: Pew Hispanic Center tabulations of U.S. Census Bureau Redistricting_Files-PL_ for states
7 THE FUTURE GROWTH OF HISPANIC CHILDREN
8 Hispanic Children Are Projected to be the Major Growing Group of Children 73 School-age Population (in millions) 54 total school-age pop Hispanic school-age pop Source: U.S. Census Bureau, Population Division, National Population Projections Released 2008
9 Hispanics Projected to be the Largest School-age Population by % % of School-age Population 20% 38% 39% NH white Hispanic NH black NH asian 15% Source: U.S. Census Bureau, Population Division, National Population Projections Released % 4% 6%
10 GROWING HISPANIC DEMAND FOR HIGHER EDUCATION
11 50% 18-to-24 Year-olds Enrolled in College All Race/ethnicities 40% 30% 20% 10% 0% Source: U.S. Census Bureau Historical Time Series on College Enrollment,
12 18-to-24 Year-olds Enrolled in College, by Major Race/ethnic Group 50% 40% 30% NH White Hispanic 20% Black 10% 0% Source: U.S. Census Bureau Historical Time Series on College Enrollment,
13 Hispanic 18-to-24 Year-old High School Completion Hispanic 18-to-24 Year-olds Finishing High School 80% 70% 60% 50% 40% 30% 20% 10% 0% Source: U.S. Census Bureau Historical Time Series on College Enrollment,
14 18-to-24 Year-old High School Completers Enrolled in College 60% 50% 40% 30% 20% 10% 0% Source: U.S. Census Bureau Historical Time Series on College Enrollment, NH White Hispanic Black
15 Hispanics are a Growing Proportion of 18-to-24 Year-old College Students Hispanic Share of 18-to-24 Year-old College Students 14% 12% 10% 8% 6% 4% 2% 0% Source: U.S. Census Bureau Historical Time Series on College Enrollment,

16 Hispanics are Soon to be the Largest Minority Among 18-to-24 Year-old College Students Share of 18-to-24 Year-old College Students 14% 12% 10% 8% 6% Hispanic Black 4% 2% 0% Source: U.S. Census Bureau Historical Time Series on College Enrollment,
17 Hispanic Undergraduates are More Likely to Enroll at 2-year and Less-than-2-year Institutions 4 year 2-year less than 2-year 53% 58% 52% 56% 42% 40% 44% 43% 4% 1% 4% 1% Hispanic White Black Asian Source: National Center for Education Statistics, Fall 2009 IPEDS enrollment data
18 1615 L Street, NW, Suite 700 Washington, DC Tel: Fax: The Pew Research Center is a nonpartisan fact tank that provides information on the issues, attitudes and trends shaping America and the world.
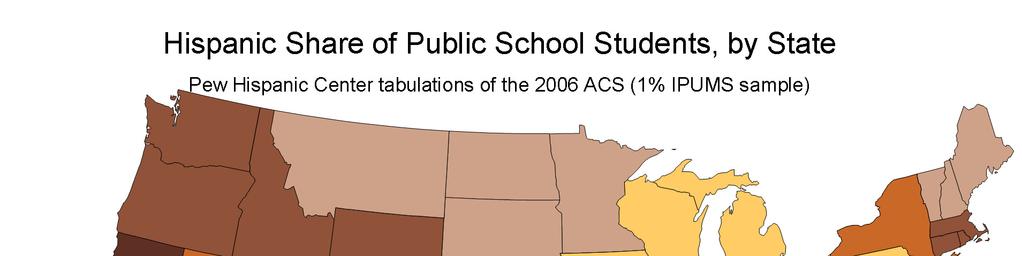
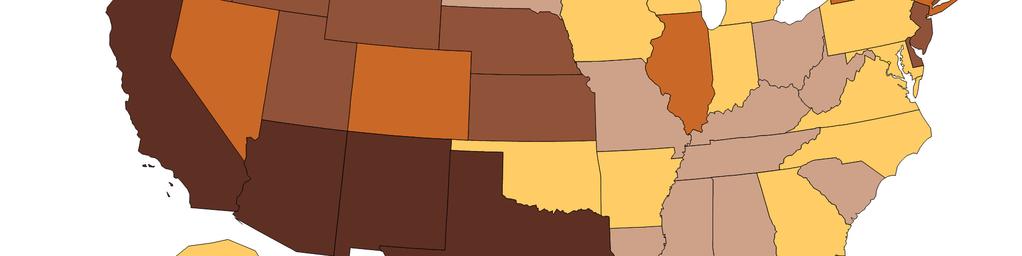
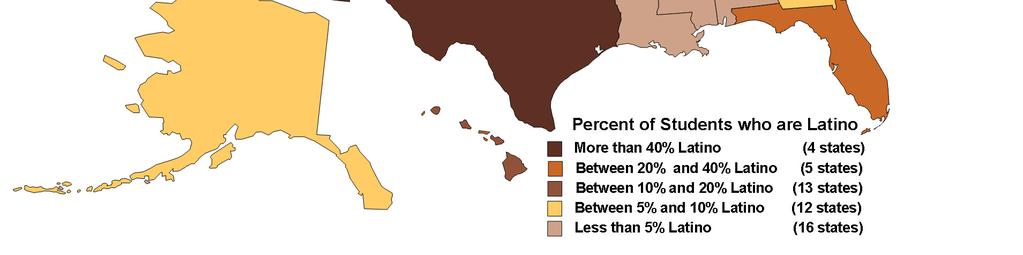
19 THE HISPANIC PUBLIC SCHOOL POPULATION
20


21 Most Hispanic Students are not Limited English Speakers
22 Parental Education of Hispanic Public School Students % of Hispanic Students whose Parent(s) Did Not Complete High School 50.2% 42.3% % of Hispanic Students Whose Parent(s) Have Some College or More 52.8% 29.7% 23.9% 16.2% Foreign-Born Second Generation Third Generation+ Foreign-Born Second Generation Third Generation+ Source: Richard Fry and Felisa Gonzales, One-in-Five and Growing Fast: A Profile of Hispanic Public School Students, Pew Hispanic Center
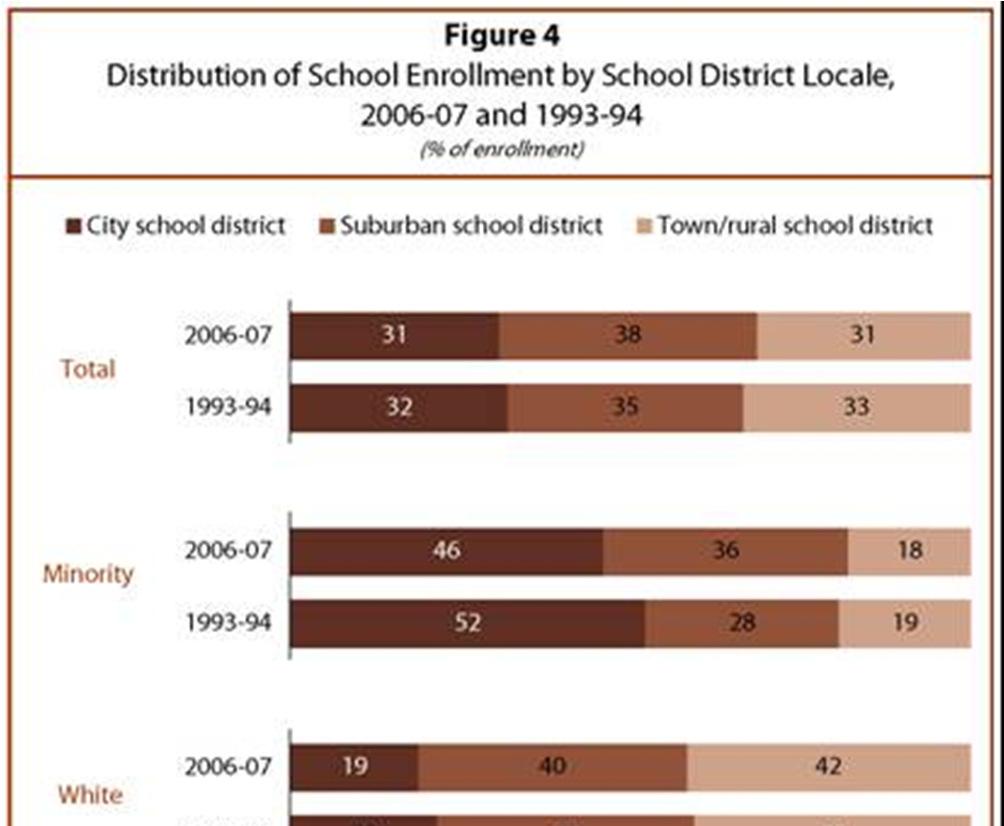
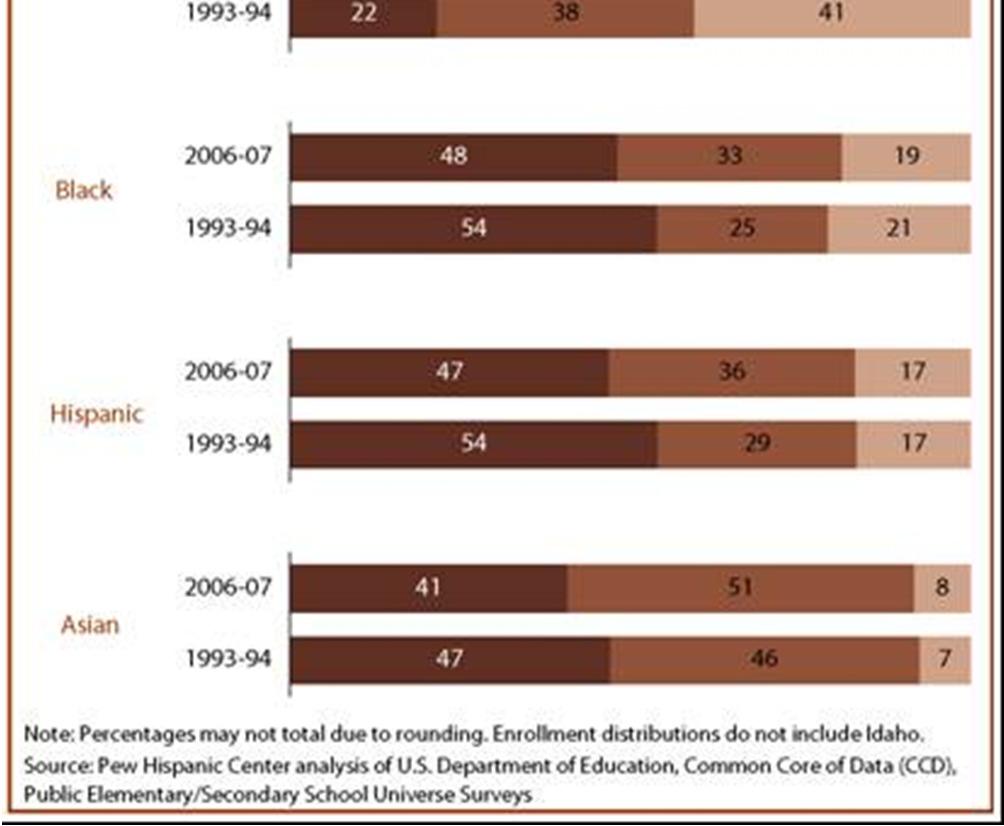
23 DISPERSION AND SUBURBANIZATION


24 Counties with Largest Hispanic Populations, 1980


25 Counties with Largest Hispanic Populations, 2007

26 Where Were Concentrations in 1980? Almost All 15%+ Counties Along Border 14.6 Million Hispanics 6.4% of Total

27 Where Were Concentrations in 1990? Almost All 15%+ Counties Along Border, Still 22.4 Million Hispanics 9.0% of Total Counties With 15%+ Hispanic


28 Where Were Concentrations in 2000? Fast Growth Away from Border 35.3 Million Hispanics 12.5% of Total Counties With 15%+ Hispanic
29 Where Were Concentrations in 2007? Many Concentrations Emerge in Distant Areas 45.5 Million Hispanics 15.1% of Total Counties With 15%+ Hispanic
30 Distribution of Hispanics by 1980 Hispanic County Population Size percent of 2007 Hispanics 58% 20% 16% 7% percent of 2000 Hispanics 62% 19% 14% 5% percent of 1990 Hispanics 68% 18% 12% 3% percent of 1980 Hispanics 68% 17% 12% 4% counties with 50,000 or more Hispanics 1980 (47) 10,000 to 49,999 Hispanics ,000 to 9,999 Hispanics 1980 less than 1,000 Hispanics 1980
31
32
33 HISPANIC YOUTH S GROWING SCHOOLING PARTICIPATION
34 More Latino Youth are Enrolling in School (% enrolled in school or college) Hispanic White Black
35 Increased School Enrollment has Occurred Among Young Hispanic Women (% enrolled in school or college) Men Hispanic White Black Hispanic Born Abroad Hispanic U.S.-Born Women Hispanic White Black Hispanic Born Abroad Hispanic U.S.-Born Note: Whites include only non-hispanic whites. Blacks include only non-hispanic blacks. Figures refer to 16-to-25 year-olds. Source: Pew Hispanic Center
36 Hispanic High School Dropout Rates Have Declined (status high school dropout rate, %) Men Hispanic White 6 15 Black Hispanic Born Abroad Hispanic U.S.- Born Women Hispanic White 5 15 Black 8 28 Hispanic Born Abroad Hispanic U.S.- Born 9 31 Note: Whites include only non-hispanic whites. Blacks include only non- Hispanic blacks. Figures refer to 16-to-25 year-olds. Source: Pew Hispanic Center
37 Young Hispanic College Enrollment Rates Have Increased (% of high school completers enrolled in college) Men Hispanic White Black Hispanic Born Abroad Hispanic U.S.-Born Women Hispanic White Black Hispanic Born Abroad Hispanic U.S.-Born Note: Whites include only non-hispanic whites. Blacks include only non-hispanic blacks. Figures refer to 16-to-25 year-olds. Source: Pew Hispanic Center


38 Hispanic Children Will Increasingly be Third Generation and Higher
2011 National Survey of Fishing, Hunting, and Wildlife-Associated Recreation
 U.S. Fish & Wildlife Service 2011 National Survey of Fishing, Hunting, and Wildlife-Associated Recreation State Overview Issued September 2012 Preliminary Estimates 2 2011 National Survey of Fishing, Hunting,
Demographic Change in North Carolina
 Demographic Change in North Carolina 5 Trends to Watch North Carolina Aggregates Association June 29, 2017 Rebecca Tippett, PhD Director, Carolina Demography July 1 Population (Millions) North Carolina
TABLE C: STATE MANDATES AND FUNDING LEVELS
 TABLE C: STATE MANDATES AND FUNDING LEVELS Information was collected from the 2012-2013 State of the States in Gifted Education report. Empty cells indicate no response to the question Hatched cells indicate
Education Committee Economic Background and Issue Review
 Education Committee Economic Background and Issue Review Montpelier, Vermont January 22, 2014 Thomas E. Kavet State Economist and Principal Economic Advisor to the Vermont State Legislature Since 1996
Demographic Characteristics and Trends of Bexar County and San Antonio, TX
 Demographic Characteristics and Trends of Bexar County and San Antonio, TX Leadership San Antonio Understand Infrastructure. Prepare for Growth. May 2, 2012 San Antonio, TX Select Growing States, 2000-2010
WHERE ARE ARIZONA DEMOGRAPHICS TAKING US? HOW GROWING SLOWER, OLDER AND MORE DIVERSE AFFECTS REAL ESTATE
 WHERE ARE ARIZONA DEMOGRAPHICS TAKING US? HOW GROWING SLOWER, OLDER AND MORE DIVERSE AFFECTS REAL ESTATE March 2017 Tom Rex Office of the University Economist and Center for Competitiveness and Prosperity
LATINO VOTE A Fight For Change!
 LATINO VOTE A Fight For Change! The Power of the Vote! Political Power, Policy and Health Equity The University of North Carolina School of Social Work Chapel Hill, North Carolina June 7, 2016 LATINO VOTE
Traffic Safety Facts 2007 Data
 Traffic Safety Facts 2007 Data Bicyclists and Other Cyclists DOT HS 810 986 Bicyclists and other cyclists include riders of two-wheel nonmotorized vehicles, tricycles, and unicycles powered solely by pedals.
Target Shooting by Hunters and Their Use of Shooting Ranges: 1975, 1991, and 2011
 U.S. Fish & Wildlife Service Target Shooting by Hunters and Their Use of Shooting Ranges: 1975, 1991, and 2011 Addendum to the 2011 National Survey of Fishing, Hunting, and Wildlife-Associated Recreation
Traffic Safety Facts. State Traffic Data Data. Overview
 Traffic Safety Facts 2015 Data June 2017 DOT HS 812 412 State Traffic Data Key Findings Traffic fatalities increased by 7 percent from 2014 to 2015 (32,744 to 35,092) for the United States. The fatality
MEDICAID EXPENDITURES FOR LONG-TERM SERVICES AND SUPPORTS: 2011 UPDATE
 RESEARCH PAPER MEDICAID EXPENDITURES FOR LONG-TERM SERVICES AND SUPPORTS: 2011 UPDATE STEVE EIKEN, KATE SREDL, BRIAN BURWELL, AND LISA GOLD THOMSON REUTERS 150 CAMBRIDGEPARK DRIVE CAMBRIDGE, MA 02140 OCTOBER
Investing in Real Estate. The smart choice for today s investor
 Investing in Real Estate The smart choice for today s investor Real Estate is preferred over stocks Real estate out performs stocks http://blog.863katy.com/category/national-housing-news/page/2/ Real Estate
Agricultural Weather Assessments World Agricultural Outlook Board
 Texas (8) Missouri (7) South Dakota (6) Kansas () Nebraska () North Dakota () Oklahoma () Kentucky (4) Montana (4) California (3) Minnesota (3) New York (3) Pennsylvania (3) Tennessee (3) Wisconsin (3)
Agricultural Weather Assessments World Agricultural Outlook Board
 Texas (8) Missouri (7) South Dakota (6) Kansas (5) Nebraska (5) North Dakota (5) Oklahoma (5) Kentucky (4) Montana (4) California (3) Minnesota (3) New York (3) Pennsylvania (3) Tennessee (3) Wisconsin
7. Ranking the States with the Greatest Energy Intensity and Residual Effect Reductions
 37 7. Ranking the States with the Greatest Energy Intensity and Residual Effect Reductions In this chapter, we report on the states that had the greatest reductions in energy intensity and residuals over
DOT HS November 2009 Geospatial Analysis of Rural Motor Vehicle Traffic Fatalities
 DOT HS 811 196 November 2009 Geospatial Analysis of Rural Motor Vehicle Traffic Fatalities This document is available to the public from the National Technical Information Service, Springfield, Virginia
LATINO VOTE. The Power of the Vote!
 LATINO VOTE The Power of the Vote! LATINO VOTE Challenges, Opportunities and Solutions to Get America to Vote! www.svrep.org Redistricting: Every 10 years after the US Census Count, America draws its lines
SIA SNOW SPORTS PARTICIPANT STUDY
 2012-2013 SIA SNOW SPORTS PARTICIPANT STUDY TABLE OF CONTENTS Section Page Number Participation Demographics 5 Gender and Age Demographics 27 Income and Education Demographics 38 Ethnic Demographics 54
HANDICAP ACTIVE AND INACTIVE SEASON SCHEDULE
 HANDICAP ACTIVE AND INACTIVE SEASON SCHEDULE The authorized golf association having jurisdiction in an area is responsible for declaring the duration of any inactive season. Any non-member club of an authorized
ECONOMIC IMP ACT REPORT 2018
 FIREARMS AND AMMUNITION INDUSTRY ECONOMIC IMP ACT REPORT 218 THE FIREARMS INDUSTRY TRADE ASSOCIATION NSSF.ORG Who is the National Shooting Sports Foundation? The National Shooting Sports Foundation (NSSF)
America s Diversity Explosion: What it means for Presidential Politics. WILLIAM H. FREY Brookings Institution and University of Michigan
 America s Diversity Explosion: What it means for Presidential Politics r WILLIAM H. FREY Brookings Institution and University of Michigan Millions 225 U.S. White and Minority Populations, 1970-2050 200
Black Homicide Victimization in the Great Lakes States
 APRIL 2018 Victimization in the Great Lakes States An Analysis of 2015 Homicide Data WWW.VPC.ORG BLACK HOMICIDE VICTIMIZATION IN THE GREAT LAKES STATES VIOLENCE POLICY CENTER 1 COPYRIGHT AND ACKNOWLEDGMENTS
THE FUTURE OF SALES TAX REVENUE
 THE FUTURE OF SALES TAX REVENUE Presented by Adam Fulton, Senior Economic Associate The Outlook for Sales Taxes State governments rely on state sales taxes for more than a fifth of their revenue Economic
Utah s Demographic Transformation
 Utah s Demographic Transformation A View into the Future Pamela S. Perlich, Ph.D. University Of Utah December 3, 2009 Based on a paper with the same title, available on-line: www.bebr.utah.edu Utah: Trend
For the First Time, a Smaller Jackpot
 F I S C A L S T U D I E S WWW.ROCKINST.ORG SEPTEMBER 21, 2009 For the First Time, a Smaller Jackpot Trends in State Revenues from Gambling Lucy Dadayan and Robert B. Ward HIGHLIGHTS State-local gambling
A Comparison of Highway Construction Costs in the Midwest and Nationally
 A Comparison of Highway Construction Costs in the Midwest and Nationally March 20, 2018 Mary Craighead, AICP 1 INTRODUCTION State Departments of Transportation play a significant role in the construction
CIRCLE The Center for Information & Research on Civic Learning & Engagement. Electoral Engagement Among Minority Youth
 FACT SHEET CIRCLE The Center for Information & Research on Civic Learning & Engagement Electoral Engagement Among Minority Youth By Mark Hugo Lopez, Research Director and Emily Kirby, Research Associate
Dartmouth College Fact Book
 Undergraduate Entering Classes All First-year Entering Year 2004 2005 2006 2007 2008 2009 2010 2011 2012 2013 Graduating Class of 2008 2009 2010 2011 2012 2013 2014 2015 2016 2017 Applied 11,734 12,756
Wenlin Liu, Senior Economist. Stateof Wyoming. Economic Analysis Division State of Wyoming 1
 WYOMING DEMOGRAPHIC AND ECONOMIC TREND LCCC LIFE Program April 7, 2012 Cheyenne, Wyoming Wenlin Liu, Senior Economist Economic Analysis Division Stateof Wyoming Economic Analysis Division State of Wyoming
There are three major federal data sources that we evaluate in our Bicycle Friendly States ranking:
 Since the landmark Intermodal Surface Transportation Efficiency Act (ISTEA) created the Transportation Enhancements program in 1991 bicycle and pedestrian projects have been eligible for programmatic federal
Occupant Protection Laws
 Occupant rotection Laws tate Must Be in Child Restraint* Additional eat Belt Coverage* Who is Covered & Where rimary or econdary Alabama Under 6 yrs.** 6 until 15 yrs. 15+ yrs. in Alaska Under 4 yrs.**
Occupant Protection Laws
 Occupant Protection s Alabama Alaska Arizona Under 1 yr. or
 Alabama Alaska Arizona Under 1 yr. or
 Together, we are creating a world that works better.
 Together, we are creating a world that works better. www.td.org/powermember www.td.org/membership TIPS, TOOLS & INTELLIGENCE FOR DEVELOPING TALENT HUMAN CAPITAL ISSUE 1801 Alan Landers JANUARY 2018 $19.50
50 by 30 Live, Learn, Earn
 50 by 30 Live, Learn, Earn SCALE Meeting Workforce Readiness October 13, 2017 Workforce Readiness Update Key Data Points Next Steps Employer Panel Workforce Readiness Vision Elevate each person s contribution
Back in the Black. States Gambling Revenues Rose in Introduction Gambling revenues to states rose modestly in fiscal 2010, HIGHLIGHTS
 F I S C A L S T U D I E S WWW.ROCKINST.ORG JUNE 23, 2011 Back in the Black States Gambling Revenues Rose in 2010 Lucy Dadayan and Robert B. Ward HIGHLIGHTS State-local gambling revenues from lotteries,
Occupant Protection Laws
 Alabama Alaska Arizona ; under 5 yrs. and 20 lbs. forward-facing ; 4-8 yrs.,
Babson Capital/UNC Charlotte Economic Forecast. May 13, 2014
 Babson Capital/UNC Charlotte Economic Forecast May 13, 2014 Outline for Today Myths and Realities of this Recovery Positive Economic Signs Negative Economic Signs Outlook for 2014 The Employment Picture
The GRPS Cultural Landscape GRPS Office of Equity and Inclusion
 The GRPS Cultural Landscape GRPS Office of Equity and Inclusion We Welcome You! Our Cultural Landscape Background Nationally, the U.S. population is becoming more racially/ethnically diverse. Source: Pew
AWEA State RPS Market Assessment Executive Summary
 AWEA State RPS Market Assessment 2013 Executive Summary Lead Author: John Hensley, Policy Analyst Contributions from: Emily Williams, Senior Policy Analyst Carl Levesque, clean energy communications consultant
CHAPTER 6. APPENDICES
 CHAPTER 6. APPENDICES Appendix 6.1. Summary of State Regulations Pertaining to Asian Carps. Some states prohibit or restrict the possession of certain species of Asian carps. State regulations pertaining
The 2019 Economic Outlook Forum The Outlook for MS
 The 2019 Economic Outlook Forum The Outlook for MS February 2019 Mississippi University Research Center Mississippi Institutions of Higher Learning Darrin Webb, State Economist dwebb@mississippi.edu (601)432-6556
The American Electorate of the 21st Century. Morley Winograd and Michael D. Hais NDN Fellows and Co-authors of Millennial Makeover
 The American Electorate of the 21st Century Morley Winograd and Michael D. Hais NDN Fellows and Co-authors of Millennial Makeover New American Demographics The New America: America Is a Dynamic and Changing
2017 Nebraska Profile
 2017 Nebraska Profile State, 9 NEW Regions, 93 Counties, plus 31 Cities Three Volumes Demographic Change in the State Economic Influences at Work Housing Statistics and Trends Summary of Findings Discuss
NC Demographic Trends Through 2035
 NC Demographic Trends Through 2035 House Select Committee on Strategic Transportation Planning and Long Term Funding Solutions February 22, 2016 Rebecca Tippett, University of North Carolina July 1 Population
USA TRIATHLON MEMBERSHIP REPORT TABLE OF CONTENTS
 USA TRIATHLON MEMBERSHIP REPORT This report has been prepared by the Membership Services staff based on active memberships on December 31, 2015. Media requests can be addressed to communications@usatriathlon.org.
More of the Same; Or now for Something Completely Different?
 More of the Same; Or now for Something Completely Different? C2ER Place cover image here Richard Wobbekind Chief Economist and Associate Dean for Business and Government Relations June 14, 2017 Real GDP
Trends in Gambling Revenue to the States
 Trends in Gambling Revenue to the States Presentation to the Stop Predatory Gambling Lucy Dadayan November 9, 2009 Overview Gambling availability across the nation National trends in gambling revenue Growth
NC Demographic Trends Through 2035
 NC Demographic Trends Through 2035 Joint Appropriation Committee on Transportation February 21, 2017 Rebecca Tippett, PhD Director, Carolina Demography July 1 Population (Millions) North Carolina s Total
Purpose of the Efficiency Program Industry By State and Region Appendices and Limitations of Data
 Purpose of the Efficiency Program Industry By State and Region Appendices and Limitations of Data CEE collaborates with the American Gas Association (AGA) to survey and collect data in the United States
Managed Lanes: The Fitch Approach. Saavan Gatfield, Senior Director
 Managed Lanes: The Fitch Approach Saavan Gatfield, Senior Director HOT Lanes Getting Hotter Priced Managed Lanes Across the United States As of 4/27/14 Sources: HNTB Corporation; GAO analysis of USDOT,
recenter.tamu.edu Dr. James P. Gaines Research Economist Real Estate Center at Texas A&M University
 recenter.tamu.edu Dr. James P. Gaines Research Economist Real Estate Center at Texas A&M University Area Market Reports RECENTER.TAMU.EDU Tierra Grande Economic Review Videos, Audios & Presentations Data,
Nebraska s Population and Economic Trends
 Nebraska s Population and Economic Trends Jerry Deichert, David Drozd UNO Center for Public Affairs Research Twenty-first Annual Nebraska State Data Center Summer Conference August 17, 2010 CPACS Collaborating
Irving Marathon Sponsorship Proposal
 2018 Irving Marathon Sponsorship Proposal Table of Contents What is the Irving Marathon?... 3 Event Demographics... 4 Vision for 2018... 4 Partnering with the Irving Marathon... 5 Title Sponsorship...
The Powerball Regressivity: An Evidence from the World s Largest Lottery Prize
 The Powerball Regressivity: An Evidence from the World s Largest Lottery Prize Ki C. Han School of Management Suffolk University 8 Ashburton Place Boston, MA 02108 (617) 573-8561 khan@suffolk.edu Sukhun
Exploring Recent Increases in Hunting and Fishing Participation
 Exploring Recent Increases in Hunting and Fishing Participation Photo credit: Washington Department of Fish and Wildlife Produced by the American Sportfishing Association, Responsive Management, the Oregon
ENROLLMENT MANAGEMENT REPORT COLLEGE PROFILE PHARMACY FALL 2017
 ENROLLMENT MANAGEMENT REPORT COLLEGE PROFILE PHARMACY FALL 217 INTRODUCTION COLLEGE PROFILE The following college profile has been developed to tailor our annual enrollment report to your specific college
America s Brightest ORANGE
 America s Brightest ORANGE Oklahoma State University 2013 Survey of Alumni of Graduate Programs Jeremy Penn, Ph.D. Director Mark Nicholas, Ph.D. Assistant Director John Hathcoat, Ph.D. Statistical Analyst
Changes in Travel Behavior Affecting Transit
 Changes in Travel Behavior Affecting Transit TRB Executive Committee Wednesday, January 10, 2018 Steven E. Polzin, PhD. Outline What is going on with travel What factors are influencing transit use Critical
TABLE 3. Level of Activity in State Financial Assurance Funds 2017
 of of where of where Annual Approximate Amount Paid Annual and and total Alabama 752 28 78 47,792 47,462 2,810 2,810 59 $40.60 $568.00 $1.30 $10.30 $41.90 $578.30 $175,309 $163,492 2,519 1 Alaska* N/A
STUN GUN LAWS/ REQUIREMENTS DATED
 STUN GUN LAWS/ REQUIREMENTS DATED 11-09-15 State Laws / Permit Requirements Penalties-At-A-Glance Alabama Under Alabama law, a stun gun is not considered a firearm. Rather, Alabama defines a firearm as
Wildlife Watching in the U.S.: The Economic Impacts on National and State Economies in 2011
 U.S. Fish & Wildlife Service Wildlife Watching in the U.S.: The Economic Impacts on National and State Economies in 2011 Addendum to the 2011 National Survey of Fishing, Hunting, and Wildlife-Associated
Regional Summit on GROWING STATE ECONOMIES Nashville, TN November 14, Global Entrepreneurship Monitor Research: Highlights. Abdul Ali, Ph.D.
 Regional Summit on GROWING STATE ECONOMIES Nashville, TN November 14, 2011 Global Entrepreneurship Monitor Research: Highlights Abdul Ali, Ph.D. 1 Babson College # 1 Entrepreneurship Undergraduate: 1995-2011
Golf Participation in the U.S Edition
 Golf Participation in the U.S. 2016 Edition Golf Participation in the U.S. 2016 Edition Published by National Golf Foundation 501 N Highway A1A Jupiter, Florida 33477 (561) 744-6006 www.ngf.org April 2016
SECTION SEVEN. Characteristics of People with IDD and Staff in Large Public Residential Facilities
 SECTION SEVEN Characteristics of People with IDD and Staff in Large Public Residential Facilities FY Section 7: Characteristics of People with IDD and Staff in Large State-Operated IDD Facilities This
Growth, Innovation, and the Future of the Arizona Economy. Michael Crow Arizona State University December 21, 2016
 Growth, Innovation, and the Future of the Arizona Economy Michael Crow Arizona State University December 21, 2016 Billions Arizona Gross Domestic Product, 2005-2016 $280 $275 $270 $265 $260 $255 $250 $245
17t h Ann u a l Re p o r t on th e ( ) POLICY STUDY
 POLICY STUDY") July 2008 17t h Ann u a l Re p o r t on th e Per f o r m a n c e of Stat e Hi g h w a y Sy s t e m s (1984 2006) By David T. Hartgen, Ph.D., P.E., and Ravi K. Karanam Project Director: Adrian T. Moore,
July 2008 17t h Ann u a l Re p o r t on th e Per f o r m a n c e of Stat e Hi g h w a y Sy s t e m s (1984 2006) By David T. Hartgen, Ph.D., P.E., and Ravi K. Karanam Project Director: Adrian T. Moore,
Population Change during Trying Times: Illinois New Demographic Reality
 Change during Trying Times: Illinois New Demographic Reality Dr. Matthew Hall IGPA Faculty Member Assistant Professor of Sociology, University of Illinois at Chicago Highlights 1. Illinois grew by 411,399
DFW MULTIFAMILY TRENDS & OBSERVATIONS Q2 2017
 DFW MULTIFAMILY TRENDS & OBSERVATIONS Q2 2017 DALLAS / FORT WORTH The Top US Demand Driven Apartment Market DFW MULTIFAMILY STARTS A HISTORY LESSON!!! The challenge boom or bust perception vs recent history
Are Highways Crumbling? State Performance Summaries,
 Policy Summary 407 February 2013 Are Highways Crumbling? State Performance Summaries, 1989 2008 by David T. Hartgen, Ph.D., P.E., M. Gregory Fields and Elizabeth San José Project Director: Adrian T. Moore,
Wildlife Watching in the U.S.: The Economic Impacts on National and State Economies in 2006
 U.S. Fish & Wildlife Service Wildlife Watching in the U.S.: The Economic Impacts on National and State Economies in 2006 Addendum to the 2006 National Survey of Fishing, Hunting, and Wildlife-Associated
Legislative Economic Briefing
 Legislative Economic Briefing February 16, 2017 Mississippi University Research Center Mississippi Institutions of Higher Learning Darrin Webb, State Economist dwebb@mississippi.edu (601)432-6556 To subscribe
Zions Bank Municipal Conference Economic Overview August 13, 2015
 Zions Bank Municipal Conference Economic Overview August 13, 2015 Overview National Economic Conditions Utah Economic Conditions Utah is One of the Fastest Growing CA 0.9% States in the Country Percent
Beer Industry Update January 2019
 Beer Industry Update January 2019 Lester Jones, Chief Economist National Beer Wholesalers Association ljones@nbwa.org Twitter @joneslester https://www.youtube.com/watch?v=xizcodu3_1e # of Months 130 120
HEALTH INSURANCE COVERAGE STATUS American Community Survey 1-Year Estimates
 S2701 HEALTH INSURANCE COVERAGE STATUS 2014 American Community Survey 1-Year Estimates Supporting documentation on code lists, subject definitions, data accuracy, and statistical testing can be found on
Five Ways the 2016 Census Affects Marketers
 Five Ways the 2016 Census Affects Marketers February 15, 2018 Dr. Doug Norris Senior Vice President and Chief Demographer Rupen Seoni Senior Vice President and Practice Leader Today s presenters Dr. Doug
Pedestrian Fatalities on Interstate Highways, United States, Saving lives through research and education.
 Saving lives through research and education Pedestrian Fatalities on Interstate Highways, United States, 1993-2012 September 2014 607 14th Street, NW, Suite 201 Washington, DC 20005 AAAFoundation.org 202-638-5944
TABLE 3. Level of Activity in State Financial Assurance Funds 2016
 TABLE 3. Level of Activity in Financial Assurance Funds 2016 have where have Annual Approximate Amount Paid Annual and and total closed average Annual Claims Alabama 3,186 60 71 45,335 44,928 2,745 2,745
Sun Metro Fixed Route Rider Survey
 University of Texas at El Paso DigitalCommons@UTEP IPED Technical Reports Institute for Policy and Economic Development 8-1-2006 Dennis L. Soden University of Texas at El Paso, desoden@utep.edu Mathew
DATA COMPOSITE. Facts and Figures for Year Ending 2017
 DATA COMPOSITE Facts and Figures for Year Ending 2017 Data Composite The Data Composite is maintained by Office of Strategic Planning and Implementation. Strategic Planning & Implementation Archdiocese
Economic Update Edward Seiler NH&RA
 Economic Update Edward Seiler NH&RA 2 Annual Real GDP Growth (%) 5.0 4.0 Actual (BEA) Forecast (CBO in red, OMB red + orange) 3.0 2.0 1.0 0.0-1.0 1990 1991 1992 1993 1994 1995 1996 1997 1998 1999 2000
Legal Heat: 50 State Guide to Firearm Laws and Regulations
 Legal Heat: 50 State Guide to Firearm Laws and Regulations First Edition A Traveler s resource for all 50 states and the District of Columbia. Plus User-friendly overviews of essential information like:
MARKET AND CAPACITY UPDATE. Matthew Marsh September 2016
 MARKET AND CAPACITY UPDATE Matthew Marsh September 2016 1980 1981 1982 1983 1984 1985 1986 1987 1988 1989 1990 1991 1992 1993 1994 1995 1996 1997 1998 1999 2000 2001 2002 2003 2004 2005 2006 2007 2008
Car Production. Brazil Mexico. Production in thousands. Source: AMIA Asociacion Mexicana de la industria automotriz.
 Car Production Production in thousands 4000 3000 2000 1000 Brazil Mexico 0 2013 2014 2015 Source: AMIA Asociacion Mexicana de la industria automotriz. Mexico s Expanding Middle Class Percent of population
Americans in Transit A Profile of Public Transit Passengers
 Americans in Transit A Profile of Public Transit Passengers published by American Public Transit Association December 1992 Louis J. Gambacclnl, Chairman Rod Diridon, Vice Chairman Fred M. Gilliam, Secretary-Treasurer
Missing Opportunities: Racial and Ethnic Disparities in the Twin Cities Metro in 2016
 New MetroStats Missing Opportunities: Racial and Ethnic Disparities in the Twin Cities Metro in 2016 10/2/2017 Community Development Committee What s New American Community Survey data released (9/14)
CLIFF PENNINGTON. Oakland A s 2012 Math Educational Program. 3 rd -5 th Grade Workbook
 CLIFF PENNINGTON Oakland A s 2012 Math Educational Program 3 rd -5 th Grade Workbook EARN 2 VOUCHERS TO A 2012 A s GAME! ELIGIBILITY Students from 1st through 8th grade are eligible to participate in the
2020 K Street NW, Suite 410 Washington, DC (202)
") 2020 K Street NW, Suite 410 Washington, DC 20006 (202) 463-7300 Interview dates: October 24 25, 2013 Interviews: 1,008 adults CONDUCTED BY IPSOS PUBLIC AFFAIRS These are findings of an Ipsos online poll
2020 K Street NW, Suite 410 Washington, DC 20006 (202) 463-7300 Interview dates: October 24 25, 2013 Interviews: 1,008 adults CONDUCTED BY IPSOS PUBLIC AFFAIRS These are findings of an Ipsos online poll
Nevada County Population Projections 2015 to 2034
 Nevada County Population Projections 2015 to 2034 Prepared By: Jeff Hardcastle, AICP Nevada State Demographer Nevada Department of Taxation Reno Office: 4600 Kietzke Lane, Building L Suite 235 Reno, NV
SCHOOL REPORT CARD District: FOX C-6 (050012) School: RICHARD SIMPSON ELEM. (5010)
 School: RICHARD SIMPSON ELEM. (5010)") Grade Span: K - 06 Title I School: Missouri School Improvement Program - Annual Performance Report (1) Preschool Enrollment FOX C-6 - RICHARD SIMPSON ELEM. 0 0 0 0 (2) K-12 Enrollment FOX C-6 - RICHARD
Grade Span: K - 06 Title I School: Missouri School Improvement Program - Annual Performance Report (1) Preschool Enrollment FOX C-6 - RICHARD SIMPSON ELEM. 0 0 0 0 (2) K-12 Enrollment FOX C-6 - RICHARD
Arizona X X X 2013
 Alabama X X X 2012 http://children.alabama.gov/uploadedfiles/file/dev elopmental_standards_handbook.pdf Alaska X X 2007 https://education.alaska.gov/publications/earlylearn ingguidelines.pdf http://www.azed.gov/earlychildhood/files/2011/10/arizona-early-learningstandards-3rd-edition.pdf
PerformanceTrak News December 2013 and Year End Results January 30, 2014
 PerformanceTrak News December 2013 and Year End Results January 30, 2014 Executive Summary Rounds played concluded down 4.8% for 2013 while the number of days open finished down 6.9% as compared to 2012.
United States Flags. Gauge: 28 sts = 4", though gauge is not critical. Use any yarn and a needle size that gives you a fabric you like.
 United States Flags by Deborah V. Gardner Materials: 1 skein each Cascade 220 Sport, 100% Peruvian wool, #9568 Twilight Blue, #8895 Christmas Red, #8505 White (8 flags can be knitted with 1skein of each
The Economic Status of Women in the U.S. What Has Changed in the Last Years
 The Economic Status of Women in the U.S. What Has Changed in the Last 20 40 Years March 28, 2018 Heidi Hartmann, Ph.D. President, IWPR Scholar in Residence, American University Editor, Journal of Women,
2017 NASCAR PLAYOFFS PREVIEW
 2017 NASCAR PLAYOFFS PREVIEW NASCAR No. 1 sport to deliver brand loyalty NASCAR Delivers Marketing Horsepower Is the No. 1 sport in brand loyalty. Fans are three times as likely as non fans to try and
American River College Student Equity Disproportionate Impact Analyses Fall 2015
 Disproportionate Impact Analyses Fall 2015 This document introduces the set of data ARC s Research Office compiled in Fall 2015. The data reported here were sourced from the California Community College
Agaricus and Specialty Mushroom Number of Growers, Sales, Price, and Value United States: , , and , , ,619
 Mushrooms ISSN: 1949-1530 Released August 20, 2015, by the National Agricultural Statistics Service (NASS), Agricultural Statistics Board, United States Department Agriculture (USDA). All Mushroom Value
The Mind of the Triathlete
 The Mind of the Triathlete Market Research Report The event that is most popular is the sprint triathlon, the shortest-distance triathlon. Such events have attracted the participation of more than three-quarters
TRENDS IN PARTICIPATION RATES FOR WILDLIFE-ASSOCIATED RECREATION BY RACE/ETHNICITY AND GENDER:
 TRENDS IN PARTICIPATION RATES FOR WILDLIFE-ASSOCIATED RECREATION BY RACE/ETHNICITY AND GENDER: 1980-2001 Allan Marsinko Professor Department of Forestry and Natural Resources Clemson University Clemson,
Catena Media analysis of how we expect sports betting to roll out across the United States of America.
 Catena Media analysis of how we expect sports betting to roll out across the United States of America. The impacts of this ruling on sports betting in the United States The state of New Jersey can now