FALKLAND ISLANDS GOVERNMENT FISHERIES DEPARTMENT FISHERY STATISTICS
|
|
|
- Charleen Robertson
- 5 years ago
- Views:
Transcription
1 FALKLAND ISLANDS GOVERNMENT FISHERIES DEPARTMENT FISHERY STATISTICS Volume 14 ( )
2 Crown Copyright 2010 No part of this publication may be reproduced without prior permission.. For citation purposes this publication should be referenced as follows: Falkland Islands Government, (2010). Fisheries Department Fisheries Statistics, Volume 14, 2009: 72 pp Stanley, FIG Fisheries Department Stanley, Falkland Islands
3 Contents. Page Foreword i Section A Introduction Figure A.1 Chart of the Falkland Islands Interim Conservation and Management Zone (FICZ) and Falkland Islands Outer Conservation Zone (FOCZ) 1 Table A.1 Abbreviations for vessel types used in the tables 2 Table A.2 Abbreviations for species names used in the tables 2 Table A.3 Abbreviations for fishing fleets used in the tables 2 Table A.4 Licence types, target species and periods of application Table A.5 Register of ITQ holding at 28 April Section B Licences Table B.1 Licence allocations by licence type and year 5 Table B.2 Licence allocations by fishing fleet and year 6 Table B.3 Licence 'A' (Unrestricted finfish - first season) allocations by fishing fleet and year 7 Table B.4 Licence 'B' (Illex squid) allocations by fishing fleet and year 8 Table B.5 Licence 'C' (Patagonian squid) allocations by fishing fleet and year 8 Table B.6 Licence 'E' (Experimental) allocations by fishing fleet and year 8 Table B.7 Licence 'F' (Skates and rays - first season) allocations by fishing fleet and year 9 Table B.8 Licence 'G' (Illex squid and restricted finfish) allocations by fishing fleet and year 9 Table B.9 Licence 'L' (Toothfish Longliners) allocations by fishing fleet and year 9 Table B.10 Licence 'R' (Skates and rays - second season) allocations by fishing fleet and year 9 Table B.11 Licence 'S' (Blue Whiting and Hoki - surimi vessels) allocations by fishing fleet and year 10 Table B.12 Licence 'W' (Restricted finfish - first season) allocations by fishing fleet and year 10 Table B.13 Licence 'X' (Patagonian squid - second season) allocations by fishing fleet and year 10 Table B.14 Licence 'Y' (Unrestricted finfish - second season) allocations by fishing fleet and year 11 Table B.15 Licence 'Z' ( Restricted finfish - second season) allocations by fishing fleet and year 11 Table B.16 Annual revenue (Pounds sterling) by licence type 12 Section C Catch summary tables Table C.1 Total catch (tonnes) by vessel type and year 13 Table C.2 Total catch (tonnes) of all species by year 14 Table C.3 Total catch (tonnes) by month and year 15 Table C.4 Total catch (tonnes) by gross registered tonnage (GRT) and year 16 Table C.5 Total catch (tonnes) by length overall (m) (LOA) and year 16 Table C.6 Total catch (tonnes) by brake horsepower (BHP) and year 16 Table C.7 Total catch (tonnes) by fishing fleet and year Section D Illex argentinus (ILL) - Illex squid Table D.1 Total catch (tonnes) by vessel type and year 19 Table D.2 Total catch (tonnes) by month and year 19 Table D.3 Total catch (tonnes) by fishing fleet and year 19 Table D.4 Total catch (tonnes) by gross registered tonnage (GRT) and year 20 Table D.5 Total catch (tonnes) by length overall (m) (LOA) and year 20 Table D.6 Total catch (tonnes) by brake horsepower (BHP) and year 20 Table D.7 Total catch (tonnes) of jiggers by gross registered tonnage (GRT) and year 21 Table D.8 Total catch (tonnes) of jiggers by length overall (m) (LOA) and year 21 Table D.9 Total catch (tonnes) of jiggers by brake horsepower (BHP) and year 21 Table D.10 Total catch (tonnes) of trawlers by gross registered tonnage (GRT) and year 21
4 Table D.11 Total catch (tonnes) of trawlers by length overall (m) (LOA) and year 22 Table D.12 Total catch (tonnes) of trawlers by brake horsepower (BHP) and year 22 Figures D Chart of catches (tonnes) by grid square and season; Length-frequency distribution and length-weight relationship in trawler fleets in Length-frequency distribution and length-weight relationship in trawler fleets in 2009 on high seas 25 Section E Loligo gahi (LOL) - Patagonian squid Table E.1 Total catch (tonnes) by vessel type and year 26 Table E.2 Total catch (tonnes) by month and year 26 Table E.3 Total catch (tonnes) by fishing fleet and year 26 Table E.4 Total catch (tonnes) by gross registered tonnage (GRT) and year 27 Table E.5 Total catch (tonnes) by length overall (m) (LOA) and year 27 Table E.6 Total catch (tonnes) by brake horsepower (BHP) and year 27 Figures E Chart of catches (tonnes) by grid square and season; Length-frequency distribution and length-weight relationship during first season Length-frequency distribution and length-weight relationship during second season Section F Martialia hyadesi (MAR) - Martialia squid Table F.1 Total catch (tonnes) by vessel type and year 31 Table F.2 Total catch (tonnes) by month and year 31 Table F.3 Total catch (tonnes) by fishing fleet and year 31 Table F.4 Total catch (tonnes) by gross registered tonnage (GRT) and year 32 Table F.5 Total catch (tonnes) by length overall (m) (LOA) and year 32 Table F.6 Total catch (tonnes) by brake horsepower (BHP) and year 32 Section G Micromesistius australis (BLU) - Southern blue whiting Table G.1 Total catch (tonnes) by vessel type and year 33 Table G.2 Total catch (tonnes) by month and year 33 Table G.3 Total catch (tonnes) by fishing fleet and year 33 Table G.4 Total catch (tonnes) by gross registered tonnage (GRT) and year 34 Table G.5 Total catch (tonnes) by length overall (m) (LOA) and year 34 Table G.6 Total catch (tonnes) by brake horsepower (BHP) and year 34 Figures G Chart of catches (tonnes) by grid square and season; Length-frequency distribution and length-weight relationship in surimi fleets in Length-frequency distribution and length-weight relationship in trawler fleets in Section H Macruronus magellanicus (WHI) - Hoki Table H.1 Total catch (tonnes) by vessel type and year 38 Table H.2 Total catch (tonnes) by month and year 38 Table H.3 Total catch (tonnes) by fishing fleet and year 38 Table H.4 Total catch (tonnes) by gross registered tonnage (GRT) and year 39 Table H.5 Total catch (tonnes) by length overall (m) (LOA) and year 39 Table H.6 Total catch (tonnes) by brake horsepower (BHP) and year 39
5 Figures H Chart of catches (tonnes) by grid square and season; Length-frequency distribution and length-weight relationship in Section I Salilota australis (BAC) - Red cod Table I.1 Total catch (tonnes) by vessel type and year 42 Table I.2 Total catch (tonnes) by month and year 42 Table I.3 Total catch (tonnes) by fishing fleet and year 42 Table I.4 Total catch (tonnes) by gross registered tonnage (GRT) and year 43 Table I.5 Total catch (tonnes) by length overall (m) (LOA) and year 43 Table I.6 Total catch (tonnes) by brake horsepower (BHP) and year 43 Figures I Chart of catches (tonnes) by grid square and season; Length-frequency distribution and length-weight relationship in Section J Merluccius spp. (PAT) - Hakes Table J.1 Total catch (tonnes) by vessel type and year 46 Table J.2 Total catch (tonnes) by month and year 46 Table J.3 Total catch (tonnes) by fishing fleet and year 46 Table J.4 Total catch (tonnes) by gross registered tonnage (GRT) and year 47 Table J.5 Total catch (tonnes) by length overall (m) (LOA) and year 47 Table J.6 Total catch (tonnes) by brake horsepower (BHP) and year 47 Figures J Chart of catches (tonnes) by grid square and season; Length-frequency distribution and length-weight relationship in Section K Genypterus blacodes (KIN) - Kingclip Table K.1 Total catch (tonnes) by vessel type and year 50 Table K.2 Total catch (tonnes) by month and year 50 Table K.3 Total catch (tonnes) by fishing fleet and year 50 Table K.4 Total catch (tonnes) by gross registered tonnage (GRT) and year 51 Table K.5 Total catch (tonnes) by length overall (m) (LOA) and year 51 Table K.6 Total catch (tonnes) by brake horsepower (BHP) and year 51 Figures K Chart of catches (tonnes) by grid square and season; Length-frequency distribution and length-weight relationship in Section L Dissostichus eleginoides (TOO) - Patagonian toothfish Table L.1 Total catch (tonnes) by vessel type and year 54 Table L.2 Total catch (tonnes) by month and year 54 Table L.3 Total catch (tonnes) by fishing fleet and year 54 Table L.4 Total catch (tonnes) by gross registered tonnage (GRT) and year 55 Table L.5 Total catch (tonnes) by length overall (m) (LOA) and year 55 Table L.6 Total catch (tonnes) by brake horsepower (BHP) and year 55 Table L.7 Total catch (tonnes) of combination vessels by gross registered tonnage (GRT) and year 56 Table L.8 Total catch (tonnes) of combination vessels by length overall (m) (LOA) and year 56 Table L.9 Total catch (tonnes) of combination vessels by brake horsepower (BHP) and year 56 Table L.10 Total catch (tonnes) of longliners by gross registered tonnage (GRT) and year 56
6 Table L.11 Total catch (tonnes) of longliners by length overall (m) (LOA) and year 56 Table L.12 Total catch (tonnes) of longliners by brake horsepower (BHP) and year 57 Table L.13 Total catch (tonnes) of trawlers by gross registered tonnage (GRT) and year 57 Table L.14 Total catch (tonnes) of trawlers by length overall (m) (LOA) and year 57 Table L.15 Total catch (tonnes) of trawlers by brake horsepower (BHP) and year 57 Figures L Chart of catches (tonnes) by grid square and season; Length-frequency distribution and length-weight relationship in longliner fleets in Length-frequency distribution and length-weight relationship in trawler fleets in Section M Rajidae (RAY) - Skates and rays Table M.1 Total catch (tonnes) by vessel type and year 61 Table M.2 Total catch (tonnes) by month and year 61 Table M.3 Total catch (tonnes) by fishing fleet and year 61 Table M.4 Total catch (tonnes) by gross registered tonnage (GRT) and year 62 Table M.5 Total catch (tonnes) by length overall (m) (LOA) and year 62 Table M.6 Total catch (tonnes) by brake horsepower (BHP) and year 62 Figures M Chart of catches (tonnes) by grid square and season; Length-frequency distribution and length-weight relationship in Section N Scallops (ZYP) Table N.1 Total catch (tonnes) by vessel type and year 65 Table N.2 Total catch (tonnes) by month and year 65 Table N.3 Total catch (tonnes) by fishing fleet and year 65 Table N.4 Total catch (tonnes) by gross registered tonnage (GRT) and year 66 Table N.5 Total catch (tonnes) by length overall (m) (LOA) and year 66 Table N.6 Total catch (tonnes) by brake horsepower (BHP) and year 66 Section O Others (OTH) Table O.1 Total catch (tonnes) by vessel type and year 67 Table O.2 Total catch (tonnes) by month and year 67 Table O.3 Total catch (tonnes) by fishing fleet and year 67 Table O.4 Total catch (tonnes) by gross registered tonnage (GRT) and year 68 Table O.5 Total catch (tonnes) by length overall (m) (LOA) and year 68 Table O.6 Total catch (tonnes) by brake horsepower (BHP) and year 68 Table O.7 Total catch (tonnes) of others by species in Figures O Chart of catches (tonnes) by grid square and season; Chart of catches (tonnes) by grid square and season (rock cod); Length-frequency distribution and length-weight relationship in

7 FOREWORD 1. The Falkland Islands Fishery This year once again demonstrated how volatile fisheries based mainly on short-lived resources such as squid can be. After the two bumper years of 2007 and 2008, Illex did not migrate to Falkland Zones at all in 2009, causing problems for squid fishing companies. The abundance of Loligo was also at low level with a total annual catch of 31,475 t. In contrast to this, the most abundant catch (58,149 t) in FICZ/FOCZ was that of rock cod, which has became the most abundant finfish resource in the Falkland fishery over the last three years Illex argentinus Illex squid Illex stocks are prone to high variability in abundance, bringing instability to its fishery and marketing. The years of 2004 and 2005 were characterized by rather poor abundances of Illex and were followed by three consecutive years ( ) of high abundances. During the 2008 fishery, the Fisheries Department expressed concerns about the status of Illex stocks in 2009 due to much slower growth rates and consequently reduced fecundity because of the colder than usual water temperatures during feeding season in February-May. Together with the possibility of spawning being delayed until August 2008, the decrease in fecundity might lead to quite a significant drop in recruitment abundance for Nevertheless, fishing companies showed their interest in the Illex fishery, and applied for 46 licenses to fish in Falkland waters. In the beginning of 2009, there was no indication of the dramatic change in Illex abundance. The temperature regime on the high seas was quite stable throughout January, with sea surface temperatures (SST) being 14-15ºC on the shelf at 45ºS. Two types of temperature anomalies were observed. To the north of 47 ºS SST had positive anomalies of 1.5-2ºC. The southern part of the Patagonian Shelf including FICZ was characterized by a weak negative anomaly of -1.0ºC. The warm temperatures on the shelf at 45-47ºC favoured migrations of Illex outside the Argentinean EEZ. Two trawlers started reporting their catches on the high seas from the second week of January, taking t per day. In the middle of the month catches decreased to t per day, and then increased again (up to 20 t per day) to the end of the month. The majority of squid belonged to the South Patagonian stock. Squid were mainly cm mantle length (ML), with immature females and maturing males. No Illex catches were reported from the FICZ/FOCZ. For the first time in the last three years, there was a positive anomaly in SST over the Falkland Shelf in February (+1-1.5ºC). The Falkland Current was shifted to the east, which induced the spread of a large ini
8 flow of warm waters (11-12ºC) from the Argentinean Shelf to the northern part of FICZ. The gradients in SST were observed only on the high seas favouring Illex concentrations there. Three to eight Falkland-registered trawlers fished for Illex on the high seas before the start of the first Loligo season in February. Their catches were quite variable (11 to 60 t per day, average 18 t). This was about a half of that observed during the same period of 2008 when the abundance of Illex was extremely high (average catches were ~30 mt per day). All licensed jiggers preferred to fish on the high seas, without a single day spent in the Falkland waters. As a result, only 1 t of Illex was caught in FICZ as bycatch by the finfish fleet. Overall, according to the results of the trawl fishery in January-February on the high seas, the abundance of the South Patagonian Stock of Illex in 2008 was moderate. The Falkland Current was shifted eastwards and did not create strong gradients of temperature and salinity in the northern part of FICZ/FOCZ in March. Moderate positive anomalies in SST were observed over the entire Falkland shelf, being very similar to those in the Illex rich year of So, in this respect there was nothing obvious to prevent squid entering into FOCZ/ FICZ. However, for some reason which was difficult to understand without oceanographic data, squid did not appear in FICZ/FOCZ in March at all. All licensed jiggers carried on fishing on the high seas. Seven jiggers appeared in the northern part of FICZ on 6 March, but did not catch anything and left. Two other jiggers checked the situation on 25 March. After yielding 3 t per night, they also steamed back to the high seas. Catches of Illex by finfish trawlers were miniscule with a total of 30 t caught during the whole month. Two possible scenarios for the rest of the fishing season were suggested. If waters underneath the surface were cold (as in 2002) squid would not appear in the Falkland Zones at all. If the waters were relatively warm (as in ), squid from the Argentinean EEZ would migrate through the northern part of FICZ, but CPUEs would be much lower than in as the whole abundance of Illex seemed to be 2-3 times lower than in the last two years. Unfortunately, fishing in the following two months proved the first scenario to be true. In contrast to March with its moderate positive anomalies in SST in the northern part of FICZ, April was characterized by the development of negative SST anomalies. The inflow of shelf waters from the Argentinean EEZ cooled down to 7ºC and was constantly present throughout the month in the north-western part of FICZ. However, unlike there was no Illex squid present. The whole B-licensed jigging fleet worked on the high seas, with one to two vessels periodically (11 fishing days) checking the commercial situation in FICZ. The zero Illex catches were obviously not an attractive prospect for the remainder of the fleet. Catches of G-licensed trawlers were in a range of several hundred kilos of Illex per day. In Argentina, the Illex fishery south of 46 S was closed on 8 April because of low stock abundance. The SST in May had a negative anomaly, being quite similar to that in April. However, the warm inflow of shelf waters was still present in the northwest of FICZ. In normal years, the presence of this inflow favoured Illex migrations through the Falkland waters. No squid were present in All jigging vessels worked on the high seas and never appeared in FICZ/FOCZ in May. As a result, only 1 t of squid was reported as a by-catch by trawlers. The Falkland fishery was closed early on 15th May. The Illex season of 2009 was virtually non-existent, being the worst in the history of the Falkland fishery with a meager total catch of 45 t. All companies issued with B-licenses were reimbursed, resulting in a significant reduction in Falkland fishing revenues. ii
9 1.2. Loligo gahi Patagonian squid The second most important squid resource, the Patagonian longfin squid Loligo gahi is fished in the eastern and southern parts of the Falkland Shelf in the region called the Loligo box. Two main cohorts of L. gahi are usually exploited; the autumn-spawning cohort in February-April and spring-spawning cohort in July- September. To estimate the level of the Loligo biomass before the first season, a research survey was conducted in the Loligo box on board F/V Castelo between the 9th and 23rd of February The whole catch of Loligo was 193 tonnes, most of squid (94%) being caught in the southern area. The highest densities were found to the east and north-east of Beauchêne Island. Squid distribution was different from those observed in the previous two years when Loligo were more concentrated in the northern part of the southern area, and had not yet arrived to the Beauchêne Island area. This suggested that most of the first group of Loligo had migrated to the Loligo box due to positive anomalies in water temperatures. A preliminary estimation of the Loligo biomass was at 16,104 t; twice as large as the biomass estimated during the biomass survey in February The first season started as usual on 24 th February with 16 C-licensed trawlers. All vessels fished to the east and north-east of Beauchêne Island at m depths. The catches were reasonable averaging t per day (maximum 52 t per day). The squid were mainly immature, about 0.5 cm smaller than in 2008 (mean ML of females 10.6 cm, males 11.6 cm). The total Loligo catch for the month (1,995 t) was only a half of that observed during the same period of the last year. In the first week of March, the whole Loligo fleet fished between m mainly to the east of Beauchêne Island, yielding average catches of t per day. A decreasing trend in catches forced some vessels to move to the northern part of the Loligo box. Dense aggregations of squid were found at much shallower depths ( m). During the first days of the northern fishery (between 15 and 19 March) catches were high (>30 t per day), but these aggregations were quickly depleted (less than 10 t per day by 22 March), and the vessels moved again to the south where the catches remained at low level of t per day until the end of the month. In April, the fleet continued to fish for Loligo in the southern and central areas. Two peaks of abundance occurred in April (7 and 11 April), but the quantities of squid were rather small (average CPUEs of 16 and 20 t per day). The overall abundance of Loligo this year was at low level, with the total catch for the first season equaling at 12,971 t. This catch is the third lowest catch of the autumn-spawning group of Loligo since The average mantle size of squid in catches was 12.1 cm, similar to the sizes in 2008 and 2007, but greater than in In-season stock assessment of the escapement biomass was estimated to be 10,500 t, close to the 10,000 t escapement limit. To estimate the biomass of Loligo before the second season, another research survey was conducted in the Loligo box onboard the F/V Baffin Bay between the 30 th June and 14 th July. Fifty one trawls were conducted with a total Loligo catch of 113 t. Loligo was concentrated in the northern area, with a low abundance in the southern area. The standardized biomass was estimated at 22,830 t being almost the same as before the second seasons of 2006 and The second season fishery started as usual on 15 th July, with the whole fleet fishing in the northern area. The catches were good (mean 27 t per day). Some vessels checked the southern area, but without success iii
10 (7-9 t per day). The first peak in catches occurred on th July in both regions (40-50 t per day). Loligo also appeared in the western part of the southern area, migrating from the outside of the Loligo box. The second peak in CPUEs took place only in the southern area (mean 42 t per day) on 29 th July. The average size of squid in catches was cm of mantle length in the north, and cm in the south. In August, CPUEs gradually decreased from t per day during the first week of the month to t per day by the end of the month. The decreasing trend in catches carried on to the first week of September, with average CPUEs being only around 10 t per day. The average sizes were 11.9 cm ML for females and 12.9 cm ML for males. The total catch of Loligo during the second fishing season was 17,873 t with about 60% being caught in the central and northern parts of the Loligo box. The small contribution of the southern area to the whole catch was consistent with quite low biomass found in this area during the pre-season Loligo survey. The fishing season closed early on 11 th September to preserve the escapement spawning biomass, ensuring it remained above the 10,000 t threshold limit. After updating the stock assessment model with the last 5 days data, the escapement biomass was estimated at 10,000-12,000 t. To investigate possible arrivals of new squid groups after the early closure of the fishery, a scientific survey was conducted between 12 and 30 th September. Thirty two trawls were made in two successive sample periods to cover the Loligo box and 14 adaptive trawls were also made to intensify sampling in areas of high Loligo density. It was found that squid were more abundant in the northern part of the box. The biomass was estimated to be 6,045 t during the first sample period (11-19 September) and 12,120 t during the second sample period (20-30 September), suggesting that late immigration of a new group of Loligo may have been occurred. The total annual catch of Loligo in 2009 attained 31,475 t which was the third lowest annual catch in the last decade Martialia hyadesi Martialia squid No catch of Martialia squid was reported within the FICZ/FOCZ Micromesistius a. australis Southern blue whiting Traditionally the southern blue whiting fishery has been one of the most important resources in the Falkland Island finfish fishery with annual catches of approximately 25,000 tonnes taken by specialized pelagic vessels as well as by the bottom-trawl finfish fishery. The downward trend in catches observed since 2007 continued in 2009 with the total annual catch just reaching 10,543 t. More than a half of that (6,580 t) was taken by the pelagic fleet targeting post spawning aggregations of southern blue whiting between October and December. Two pelagic vessels (including one surimi trawler) were fishing for southern blue whiting without much success, having historically low catches. One trawler tried to fish in March and April but did not have any success either. The finfish fleet targeted aggregations of southern blue whiting in September October in the southern part of FICZ. Catches were low with the total catch of the fleet amounting to 3,555 t. Catches in Argentina were at a similar low level with the annual catch reaching 15,900 tonnes. A stock assessment of southern blue whiting was undertaken in 2009 using an age-structured-production model. It included the data from previous stock assessments up to 2004 and also recent catch data collected both in Falkland and Argentinean waters until The stock assessment showed a continuous downward trend of the iv
11 stock since 1993 and a critical condition with the total biomass consisting of 23% of B 0. It was recommended to close the spawning grounds for the commercial fishery during spawning time (September October) and reduce the TAC considerably to allow the stock to recover. These conservation measures will only be effective if similar actions are taken in Argentina Macruronus magellanicus - Hoki Hoki is one of the most abundant pelagic species around South America, migrating in austral winter from their feeding grounds around the Falkland Islands north towards spawning grounds in Argentina and southwest to Chile. After spawning, fish return from their spawning grounds to their feeding grounds. On the other hand a proportion of adult fish and younger fish remain on the feeding grounds throughout the year. The distribution of stock biomass is thus highly variable and difficult to estimate. After the poor fishing year of 2008, catches in 2009 were very good (23,170 t). The annual catch was the second highest hoki catch on record after ,351 t of this catch were recorded as bycatch (i.e. hoki accounting for less than 40% of the total catch) in various fisheries. The largest catches were taken in the first half of the year, with high catches (quite unusually) even throughout the austral winter. CPUEs were high in the first half of the year, indicating high abundance of hoki in Falkland waters. The average CPUEs were 1.58 t per hour in targeted hauls with densest aggregations encountered between February and April (average CPUEs of 2.38 t per hour). The highest CPUE (19.1t per hour) was recorded for a surimi vessel in December. Catches of hoki in the austral summer consisted of an unusually high proportion of young fishes in the north of FICZ, which might indicate that a good recruitment event has taken place between 2006 and However, overall catches decreased rather than increased in the austral summer, indicating that fish had not migrated back in time from their spawning grounds. This was most likely due to extremely cold weather conditions observed in FICZ in the second half of the year Merluccius hubbsi, Merluccius australis Hakes Common and Patagonian hakes are highly valuable migratory finfish species on the Patagonian Shelf. Over the years catches of hakes have fluctuated strongly due to variability in the proportion of hake stocks migrating into Falkland waters from the high seas and Argentinean EEZ. Since 2006, the amount of hakes migrating into the FICZ has been considerably larger than in previous years, with 2009 setting a new record with the total annual catch amounting to 13,055 t. Catches were the highest in austral autumn and throughout the austral winter; high catches and densities lasted longer into the year, with vessels still attaining high CPUEs in August in contrast to 2007 when the majority of catches occurred before June. Dense aggregations of hakes were encountered between February and August with average CPUEs of 775 kg/hr in targeted hauls (i.e. any hauls with more than 30% hake), while surprisingly the highest CPUEs were encountered in October, up to 1,992 kg/hr. From the observer reports, general knowledge about fish behaviour, migratory routes and seasons of both common and austral hake, it is possible to deduce that the majority of fish were common hakes (Merluccius hubbsi) while catches of austral hake remained at low level. As the proportion of the common hake stock migrating to the Falkland waters remains low in comparison its total stock size, the observed increase in catches in recent years does not necessarily imply an increase v
12 in stock biomass but rather a shift in migratory behaviour, likely due to environmental factors. This is a matter of concern because the total hake catches in the Southwest Atlantic have been declining rather than increasing Genypterus blacodes Kingclip Kingclip is one the of the most valuable by-catch species in the Falkland Islands fishery. It appears to have a seasonal spawning migration in and out of Falkland Islands waters especially in the western parts of the FICZ. They leave in winter and return in early summer with many individuals in post spawning condition. Recently, however, mature females have been found in the northwestern part of FICZ in February which may suggests that kingclip may be batch spawners with extended spawning periods. The cumulative catch of kingclip reached 3,393 t which makes 2009 the second highest kingclip catch on record after the most productive As in previous years, the fishing effort in the finfish fishery has remained relatively stable indicating an increase in abundance of kingclip from 2003 onwards. The reasons for this increase in abundance still remain unclear but, similar to common hakes, could be a result of regional changes in oceanography. Monthly catches increased steadily from January through to May ( t), then decreased in June (179 t) due to a decrease in fishing effort. The same increasing trend in monthly catches was observed from July to October ( t) after which it declined again due to a drop in fishing effort. Most of the large catches were encountered in the western and northern parts of the FICZ Salilota australis Red cod The total annual catch of red cod reached 5,079 t making it the 9 th highest catch on record in the Falkland Zones. As usual the highest catches were taken between August and November when some vessels were targeting pre-spawning, spawning and post spawning aggregations to the west and south west of the Falkland Islands. The other productive months were March and May with 530 t and 603 t respectively. In assessing stocks for 2009, an Age Structured Production Model (ASPM) was used with the CASAL software. For the ASPM, the SSB 0 and SSB 1987 were calculated to be 67,850 t and 67,915 t respectively. The final SSB 2008 was 18,311 t and therefore 26.98% of SSB 0. Both the CEDA and ASPM models produced similar results for SSB 2002 at 17,000 and 18,094 t respectively. The ASPM illustrated a relatively steep decline in both SSB and total biomass from 1987 until After this SSB seems to remain stable at approximately 17,000 18,000 t whereas total biomass has increased slightly from ~ 33,000 to 39,000 t. Clearly there is a worrying decline in red cod biomass. To identify the red cod spawning grounds, the data on spawning behaviour and distribution were collected over three research cruises in 2005, 2006 and The results of these cruises enabled us to develop mitigation measures to protect spawning aggregations of red cod for the future, with twelve grid squares in the southwestern part of FICZ being closed to all fishing activities between 1 and 31 October Dissostichus eleginoides Patagonian toothfish In 2007, the toothfish longline fishery became the first fishery in the Falkland Islands to be managed with TAC, rather than total allowable effort (TAE). The original TAC for 2008 was set at 1,200 t, however prior to the end of 2008 the CFL (ITQ holder) requested the bringing forward of 15% from the next 2009 TAC. vi
13 That was allowed and resulted in a new TAC of 1,380 t for CFL managed to catch 1,368 t and were thus 12 t short of the new TAC. The latter was carried forward to 2009 with a resultant TAC of 1032 t. Catches were reasonably good throughout the year up until the only longliner CFL Gambler left the fishery on the 10 th October for dry dock and maintenance. Daily CPUEs ranged between 0 and t per day (mean = 4.3 t). Prior to the CFL Gambler return to the fishery, the CFL requested bringing forward 10% from the 2010 TAC, and this was approved. This resulted in a new 2009 TAC of 1,152 t. The vessel started to fish again on the 2 nd December and for the remainder of the period catches were at a slightly lower level ranging from 0.55 to 6.77 t per day (mean = 3.63 t). By the end of year, the longliner had caught 1,134 t and therefore were 18 t short of their new TAC, which will be carried over to The cumulative catch for toothfish in 2009 caught in the trawl fishery reached 285 t making it the 6 th highest in the last 10 years. Trawlers continued to catch 2+ and 3+ year fish on the shelf indicating that 2006 and 2007 were good years for recruitment, the benefits of which, for the longline fishery, may be seen in 6 7 years time. During April 2009 the FIFD conducted another experiment on board the CFL Gambler in order to compare the CPUEs of both the umbrella and Spanish longline systems in order to arrive at a factor to enable the use of both data sets in the CPUE time series for stock assessments. The March 2008 longline/umbrella experiment suggested a nonlinear relationship with their CPUEs as the umbrella system was saturated before the longline system when the local toothfish abundance was high. This illustrated that the longline system could outperform the umbrella system when local abundance was high. The experiment in April 2009 used a pair wise allocation of treatments so there would be direct comparison of the two systems. Data from both experiments (2008 and 2009) allowed FIFD to produce a Gamma Distribution model fitted to the ratio of CPUE Umbrella/CPUE Longliner which enabled the use of the umbrella data in stock assessments. The stock assessment for 2009 was carried out using an ASPM. The MSY estimations varied between 1,130 t and 1,312 t, which were close to the current TAC of 1,200 t. It was recommended that the TAC remain the same (1,200 t) for Rajidae Skates and rays The year 2009 recorded 5,865 t of skate caught in the Falklands Conservation Zones, the highest total catch since the start of a specific fishery in Nearly half of the total catch was taken as targeted catch, under F or R licenses. As previously, targeted fishing for skate peaked in the third quarter of the year with 1,340 t taken by six Korean trawlers and 436 tonnes by two Spanish trawlers. Overall, 76% of the targeted skate catch was harvested by Korean vessels and 24% by Spanish vessels. The Spanish vessels had a mean yearly CPUE of 599 kg/hr and the Korean vessels had a mean yearly CPUE of 650 kg/hr. Mean monthly CPUE peaked between June and September for all vessels. In 2009, 2,941 tonnes of skate were reported as bycatch in various fisheries. Most skate bycatch in 2009 was taken during the first half of the year under W -licence (1,181 t) and A -licence (1,097 t). Fifteen observer deployments reported a total of tonnes of skate catch identified to species. The five most prevalent species comprised 85% of the total by weight: broadnose skate Bathyraja brachyurops (33.3%), yellownose skate Dipturus chilensis (19.1%), grey-tailed skate Bathyraja griseocauda (17.7%), white spotted skate Bathyraja albomaculata (9.6%), and cuphead skate Bathyraja scaphiops (5.3%). vii
14 1.11. Patagonotothen ramsayi Rock cod The annual catch of rock cod reached 58,149 t and was similar to that in the previous year. A total of 44,701 t of medium-sized and large fish (76.9%) was processed. Rockcod was targeted mainly by trawlers with finfish licenses (52,594 t) and was also taken as bycatch in other fisheries, particularly during the Loligo trawl fishery (4,418 t). Most of rock cod was caught on the northwestern shelf between 150 and 220 m. Mean daily CPUEs of finfish trawlers peaked up to t in January, they gradually decreased to 5-10 t in late July early September, and then increased again to t by the end of December. In 2009, mean daily catch was 13.6 t in contrast to 15.1 t in 2008 and 8.2 t in Fish size in catches was generally smaller, than in the years 2007 and 2008 that was probably a consequence of heavy exploitation of the stock over the last few years. The possible recruitment of a strong year class can be disregarded as no significant CPUE increase was observed in 2009 compared to Macrourus spp., Coelorhynchus spp. Grenadiers Grenadiers, Macrourus spp. and C. fasciatus were taken as a bycatch by longliners and trawlers throughout the year. Total longline bycatch was 77.6 t, trawlers took another 145 t. These data did not include the catch taken during an exploratory deep-sea fishery onboard a Spanish trawler in February - March, which accounted for 733 t of the total annual catch of 958 t. The exploratory survey covered the area between S and S with depths ranging from 512 to 931 m. The spatial distribution of grenadiers in summer was found to be relatively even all over the study area. The entire population had just started to move northwards to the autumn spawning grounds with females becoming relatively more abundant to the north of 52 S, and males extending the zone of their maximum abundance to almost 51 S. Before, in winter and spring, grenadiers were aggregated mostly on the southern Falkland slope. Modal sizes of males in catches varied between 20 and 22 cm, those of females between 23 and 27 cm of pre-anal length (PL). Female maturity and GSI increased with their northward migration from southern feeding grounds Zygochlamys patagonica - Patagonian scallop There was no specialized scallop fishery in Falkland waters in A small by-catch of 13 t was taken by Loligo and finfish fleets Eleginops maclovinus - Falkland mullet The mullet fishery continued at a low level. Fishing occurred from January to the beginning of March and then stopped over the austral winter. Fishing recommenced in September and continued until the end of November. A total of 2.8 tonnes were caught in 6 creeks which was 3.3 tonnes lower than in 2008, however the effort in 2009 was also half that of the previous year. The two most frequently visited creeks were Body Creek and Teal Creek Others Butterfish (Stromateus brasiliensis), redfish (Sebastes oculatus), lobster krill (Munida spp.) and other various squid and fish are included into this category. The total annual catch of each species is shown in table O.7. viii
15 2. Fisheries Department research cruises in 2009 After reviewing all tender proposals, the commercial fishing trawler Castelo has been chosen as a new research vessel for the Fisheries Department. A few major renovations have been done to the vessel including the installation of a dry lab to accommodate several scientists and installing an oceanographic winch to deploy CTDs. The south-western part of FICZ was chosen as the study region of the first research cruise on Castelo with main aims: a) to examine distribution and biology of hoki and Patagonian hakes during their post-spawning migrations to Falkland waters, b) to examine distribution and biology of grenadier community in deeper part of the Falkland slope and c) to carry out an oceanographic survey of the area. The vessel departed Stanley in the afternoon of 17 October, and in the evening made its first trawl and oceanographic station to the east of Lively Island. The following thirteen days of the research cruise were dedicated to the demersal trawl survey of the south-western part of FICZ. The vessel started the survey from the eastern grid squares XVAK and XVAL, then proceeded to fishing northern grid squares and finished the survey in the southern grid squares XUAE and XUAF. Every day, two grid squares of the survey were fished. In each grid square, two trawls were made at random locations, usually one in shallower and one in deeper waters. During the last two days of the survey, four plankton tows were performed just after the dusk, at depths of the main backscattering layer ( m) and above it (25-30 m). After finishing the biomass survey on 29 October, the vessel moved to a deepwater area of the Falkland Trough to the south of Beauchêne Island. Three deepwater trawls were made at depths of 550, 650 and 900 m on 30 th October, studying distribution and abundance of deepwater fauna with grenadiers Macrourus carinatus being the dominant species. To compare the demographic structure of juvenile toothfish inhabiting deepwater and shelf regions, three additional trawls were made at m depths to the southeast of Beauchêne Island on 31 st October. A good collection of genetic and otolith samples from toothfish were collected from both regions. On 1 st November, two shallow water trawls (65-70 m depth) were made in one of the potential Loligo spawning grounds between East Falkland and Sea Lion Islands. Mature and spawning squid of the springspawning cohort together with juvenile squid of the autumn-spawning cohort were sampled. The Castelo arrived in Stanley in the morning of 2 nd November. Despite strong winds and rough seas encountered during nine out of sixteen days of the cruise, only a half day was lost due to bad weather. Mean density (kg/km 2 ) and total biomass was estimated for each abundant species in the area studied, with maximum biomasses represented by rock cod (~34,000 t) and post-spawning aggregations of red cod (~18,000 t). 3. Fisheries Department research contracts in 2009 The Falkland Islands Government s financial year runs from 1 July to 30 June and most external research contracts in the Fisheries Department have these same start and end dates. Contracts completed by the end of June 2009 are presented below. A contract for the years has been signed with the Renewable Resources Assessment Group (RRAG, Imperial College, London, principal investigator Dr. David Agnew) to provide fisheries management advice and analysis of license fees. ix
16 3.1. Providing satellite sea surface water temperature (SST) data for the area of the Falkland- Patagonian shelf between January and May This research has been carried out by principal investigator Dr. A.M. Sirota of the research company MARSATEC, Kaliningrad, Russia. The maps of SST were sent to the Fisheries Department three times a week (Monday, Wednesday, Friday) by . The SST maps were made and transferred using the SURFER-7 Software in colors. They were used for monitoring the Illex distribution during the fishing season Is genetic isolation of the Loligo gahi populations on the east and west coasts of S. America related to the Peruvian upwelling system or isolation-by-distance? This work was carried out by Dr. Paul W. Shaw from the Environmental & Evolutionary Biology Research Group, School of Biological Sciences, Royal Holloway and Bedford New College, University of London, United Kingdom. Microsatellite DNA markers for population genetic assessment of Loligo gahi were developed to test whether populations of this species around the Falkland Islands represent a single breeding unit or whether they should be considered separately for the purposes of fishery management. In the course of this study, comparison with a sample from Peruvian waters uncovered extensive genetic differences between the Atlantic and Pacific populations of this species, raising the question as to what features could cause the breakdown in effective migration. Local oceanographic and physical features associated with the cold upwelling system on the west coast of South America were suggested as representing a barrier to dispersal/migration in this species. The aim of the present study was to test whether populations to either side of the upwelling region are genetically isolated, or whether the perceived Peru-Falkland divergence results from isolation-by-distance effects between the geographically most remote parts of the species distribution. Samples from Peru and Chile were screened for genetic variation and differentiation at 6 microsatellite DNA markers and one mtdna gene region (COI), and compared to previously screened samples from Peru and the FICZ. The main objectives of the study were successfully completed. Genetic variation at the same six microsatellite loci, and a new mtdna marker, was assessed in 403 individuals from 13 Chilean, Peruvian and Falkland Islands samples. It was shown that levels of genetic variability in L. gahi (number of alleles per locus and observed heterozygosity) were comparable to previous samples from the FICZ, Peru and Chile. Estimates of the betweensample component of genetic variation (FST) across all loci were low, and not significantly different to zero, between the majority of samples within the Peru region and within the Chile-FICZ region (FST = and respectively). It was concluded that there was no substantial evidence for genetic differentiation between subpopulations within the two regions, and that there were effectively single genetic populations of L. gahi within Peruvian and Chile-Falkland Islands waters. The hypothesis of an isolation-by-distance effect generating genetic differentiation was rejected within the two regional populations. Estimates of the between-sample component of genetic variation (FST) across all loci were low but significantly different form zero for all between-region sample comparisons, indicating a significant genetic break between Peruvian and Chile-Falkland L.gahi populations. The barrier to genetic exchange between these two regional populations was identified as lying between 12 o S and 33 o S on the Pacific coast of S. America, corresponding to the position of the cold upwelling system here. x
17 A newly developed mitochondrial DNA marker, the COI gene region, revealed haplotypic diversity, characteristic of recently expanded populations of L. gahi, with the northern population probably resulting from a founder/colonization process from the southern population. Patterns in mtdna haplotype diversity support the genetic differentiation indicated by microsatellite markers, with a distinct divergence between Peruvian and Chilean-Falkland populations Genetic structuring of hoki populations around the Falkland Islands and southern Chile. This work was carried out by Dr. Paul W. Shaw from the Environmental & Evolutionary Biology Research Group, School of Biological Sciences, Royal Holloway and Bedford New College, University of London, United Kingdom. The main objectives of the study were successfully completed. Genetic variation at six microsatellite loci, developed previously for hoki (D Amato et al. 1999), was assessed in 249 individuals from 2 sites in SW Chile and 1 site in the Falkland Islands, plus a temporal replicate sample from the Falklands site. A novel mtdna marker (Control Region) was successfully developed for hoki, and subset of 101 individuals were tested for sequence variation. Results are summarised as follows: Microsatellite locus variation complied with previous studies using the same loci (D Amato et al. 1999), generating a dataset with sufficient statistical power to test for population genetic differentiation. Haplotype variation at the CR mtdna locus was extremely high and consistent across samples, and displayed very low nucleotide diversity. Excess haplotype diversity resulted in low statistical power of the mtdna marker to test for population differentiation, but good power for tests of demographic processes. Estimates of the between-sample component of genetic variation (FST) across all loci were low (0.002), and not significantly different to zero, between samples within Chile. It is concluded that there is no evidence for genetic differentiation within Chile, although this conclusion is qualified by the apparent temporal instability of gene frequencies within the Falkland Islands site. Further sampling and testing for temporal stability within the Chile population, would be required to confirm the absence of multiple genetic stocks within this region. Estimates of the between-sample component of genetic variation (FST) across all loci were higher ( ), and significantly different to zero, between samples from Chile and the Falklands. It is concluded that there is evidence for genetic differentiation around southern S America between southern Chile and the Falkland Islands. Further sampling and testing for temporal stability within and between the Chile / Falklands populations would be required to confirm where barriers to genetic exchange exist. Estimates of the between-sample component of genetic variation (FST) across all loci were high, for marine fish (0.011), and significantly different to zero, between the temporal samples taken at the Falklands site. It is concluded that there is a lack of temporal stability in gene frequencies at this site, suggesting the presence of genetically distinct sub-populations in this area (either migrating through at different times of year or being sampled in different proportions from a mixed stock). Further sampling and testing for temporal stability within the Falkland Islands population would be required to confirm the presence of mixed or temporally changing stocks A newly developed mitochondrial DNA marker, the Control Region, revealed haplotypic diversity, characteristic of recently expanded populations of hoki. Patterns in mtdna haplotype diversity, although limxi
18 ited in statistical power, support the genetic differentiation of the autumn Falkland Islands sample from the Chilean and spring Falklands samples Are early and late autumn recruitment cohorts of Illex argentinus distinct populations? A genetic test using microsatellite DNA markers. This work was carried out by Dr. Paul W. Shaw from the Environmental & Evolutionary Biology Research Group, School of Biological Sciences, Royal Holloway and Bedford New College, University of London, United Kingdom. The main aim of the project was to test for significant genetic differentiation in gene frequencies between geographical and/or temporal samples of I. argentinus, and so test for genetic differences between early and late autumn recruitment cohorts in waters to the north and west of the Falkland Islands. Genetic variation at five microsatellite loci, developed previously for I. argentinus (Adcock et al. 1999a), was assessed in 298 individuals from 15 samples. Substantial problems were encountered with extraction of high quality DNA from all samples, leading to high failure rates of PCR amplification. Re-extraction of all 658 individuals using a phenol clean-up modification achieved significant improvement in PCR amplification success, but only 298 individuals could be screened successfully for a core of 5 microsatellite loci. Extensive degradation of sample DNA, probably resulting from long-term storage (since 2001), was identified as the source of amplification failure. In the samples that were screened successfully, microsatellite locus variation complied with previous studies using the same loci (Adcock et al. 1999b) and levels of variation were similar amongst all samples: expected heterozygosity (HE) ranged from (Ia422) to (Ia112); number of alleles ranged from 9 (Ia201) to 21 (Ia112). The global estimate of the between-sample component of genetic variation (FST) across the whole dataset and across all loci was low (0.012) and not significantly different to zero. Pairwise estimates of FST between individual samples ranged from to 0.043, and no values were significantly different from zero. It is concluded that there is no evidence for statistically significant genetic differentiation among samples within the present dataset. An alternative approach to uncovering genetic sub-structuring within a dataset, Bayesian clusteringbased analysis, was used to test for the presence of mixtures of genetically differentiated subpopulations within samples. STRUCTURE analysis indicated that the most likely number of populations represented within the dataset was 1, i.e. no sub-structuring or presence of cryptic subpopulations. There was no evidence of significant clusters of individual genotypes. Assignment tests generated low levels of self-classification (<10% for all samples) of individuals to their sample of origin and simulations did not permit any sample to be excluded as a likely source of any individual. Both sample-based differentiation tests and multiple clustering-based analyses failed to detect any signal of genetic sub-structuring of the sample set, therefore failing to reject the null hypothesis of a single genetically homogeneous population with no evidence of differentiated seasonal spawning populations. 4. Reductions in seabird mortality in the Falkland Islands In 2004 the Falkland Islands Government adopted the National Plan of Action Seabirds for longliners (NPOA S). This is currently under review and will pave the way for targets to The aims of the NPOA S were to reduce by catch rates to below 0.01 birds/1000 hooks by 2004/2005 and to further reduce this level to below birds/1000 hooks by 2006/2007. Due to considerable effort and the use of a new xii
19 longlining method (umbrella method) the mortality was reduced to zero for 2007/2008 and again for 2008/2009. These excellent results were in part due to good house keeping on longliners working in the Falklands zones and included correct line weighting regimes, correctly designed and effective tori lines, the use of the Brickle Curtain and the removal of hooks from by-catch and discards. The NPOA Trawlers is also currently under review and will also set targets until A new tori line designed in 2008 is now being used by trawlers operating in the Falkland Islands. The new lines are essentially shorter, use a different float to stop it travelling and to improve the line tension, and streamer lines are made of different material as well. 5. Fishing Effort and Catch Limits for 2009 The limits on Total Allowable Effort (TAE) and Total Allowable Catch (TAC) were set for the 2010 calendar year was the second year when this process was conducted by the Fisheries Department rather than RRAG. TAE were calculated as the number of fishing vessel units required to achieve the management objectives by fisheries. TAC was estimated for toothfish. 6. Participation in Scientific Workshops, Conferences and Symposia in ICES International Symposium Issues confronting deep-sea oceans: the economic, scientific and governance challenges and opportunities of working in deep sea The symposium was held in Horta (Faial), Azores, Portugal on April 2009 and was broadcasted live on (watched daily by persons worldwide). It was attended by about 170 participants from 26 countries and consisted of opening and closing lectures, everyday s 1-2 plenary lectures, followed by presentations organised in 7 sessions. Participant from FIFD: V. Laptikhovsky. Two oral presentations were given: Deep-sea fishery resources and fisheries around the Falkland Islands by V.Laptikhovsky, A.Arkhipkin and P.Brickle, and Grenadier fishery and its management in the Southwest Atlantic by V.Laptikhovsky and A.Arkhipkin th International Otolith Symposium The Fourth International Otolith Symposium was held in Monterey, California, USA between 23 rd and 28 th August Participants from FIFD: A. Arkhipkin and Z. Shcherbich. Two oral reports were presented at the Symposium: Growth in evolutionary exile: morid fishes (Gadiformes) in the Southwest Atlantic by Shcherbich Zh. N., Brickle P., Arkhipkin A. I.; and Thirty years after: state-of-the-art in cephalopod age and growth studies by A. Arkhipkin Cephalopod International Advisory Council (CIAC) Symposium The triannual CIAC Symposium was held in Vigo, Spain between 3 rd and 11 th September The Symposium was attended by ~160 delegates from around the globe. Participants from FIFD: A. Arkhipkin and V. Laptikhovsky. Two oral presentations were reported during the Symposium: Invasion from the deep: utilisation of shelf resources by deep-sea squid and fish by A. Arkhipkin and V. Laptikhovsky, and Squid as fish xiii
20 prey in the Patagonian ecosystem of the Southwest Atlantic by V. Laptikhovsky and A. Arkhipkin. Additionally, A. Arkhipkin was a chairman of the workshop Recent advances in age, growth and production estimations in cephalopods XIII European Congress of Ichthyology The meeting was held in Klaipeda, Lithuania between 6 th and 12 th September The conference venue was the Hotel Klaipeda, which was situated in the centre of the city. The conference was attended by P. Brickle, who presented a report entitled Life history strategies in the most species rich notothenid genus, Patagonotothen by P. Brickle, A. Arkhipkin, S. Ramsvatn, N. Anders, V. Laptikhovsky and Z. Shcherbich ICES Annual Scientific Meeting The ICES Annual Science Conference was held in Berlin, Germany between the 21 st and 25 th September Participants from FIFD: I. Payá and J. Brown. Three papers were accepted as oral presentations for the conference. Augmentation of length sampling using production by commercial size categories in the Loligo gahi fishery off the Falkland Islands: A simple hierarchical Bayesian model by Ignacio Paya; Progress and future of using CTD loggers in collaborative swept area surveys of Loligo gahi in the Falkland Island: Spatial distribution and biomass estimations by I. Paya, and Initial results of satellite linked archival tagging in the Patagonian toothfish (Dissostichus eleginoides Smitt, 1898) around the Falkland Islands by J. Brown, P. Brickle and A. Arkhipkin. 7. Publications from scientific work carried out in FIG Fisheries Department in Peer-reviewed publications (appeared in 2009) Arkhipkin, A.I., Schuchert, P.C., Danyushevsky, L Otolith chemistry reveals fine population structure and close affinity to the Pacific and Atlantic oceanic spawning grounds in migratory marine fish southern blue whiting (Micromesistius australis australis). Fisheries Research, 96, Brickle, P., Arkhipkin, A., Laptikhovsky, V.V., Stocks, A.F., Taylor, A Resource partitioning by two large planktivorous fishes Micromesistius australis and Macruronus magellanicus in the Southwest Atlantic. Estuarine, Coastal and Shelf Science, 84, Collins, M.A., Laptikhovsky, V., Strugnell J.M Expanded description of Opisthoteuthis hardyi based on new specimens from the Patagonian slope. Journal of the Marine Biological Association of the United Kingdom (on line July 2009: doi: /S ) Laptikhovsky, V Oceanographic factors influencing the distribution of South American fur seal, Arctocephalus australis around the Falkland Islands before the breeding season. Journal of the Marine Biological Association of the United Kingdom, 89, Laptikhovsky, V., Arkhipkin, A., Bolstad, K.S A second species of the squid genus Kondakovia (Cephalopoda: Onychoteuthidae) from the sub-antarctic, with new insight into the evolutionary history of the family. Polar Biology, 32, xiv
21 Laptikhovsky, V., Brickle, P Aspects of embryonic development in two Southwest Atlantic gadiform fish: Tadpole codling, Salilota australis (Moridae), and southern blue whiting, Micromesistius australis (Gadidae). ACTA Ichthyologica et Piscatoria, 39, Laptikhovsky, V., Pereira, J., Salman, A., Arkhipov, A., Costa, A A habitat-dependence in reproductive strategies of cephalopods and pelagophile fish in the Mediterranean Sea. Bolletin Malacologico, 45, (suppl. 2009). Laptikhovsky V., Reyes P.R Distribution and reproductive biology of a subantarctic deep-sea lobster, the Patagonian lobsterette Thymops birsteini (Zarenkov and Semenov, 1972) (Decapoda, Astacidea, Nephropidae). Journal of Natural History, 43 (1&2), Technical reports: Payá, I Loligo gahi stock assessment survey, first season Falkland Islands Government Fisheries Department, Stanley. 44 pp. Payá, I Loligo gahi, first season Fishery Statistics, Biological Trends, Stock Assessment and Risk Analysis. Falkland Islands Government Fisheries Department, Stanley. 41 pp. Payá, I Loligo gahi stock assessment survey, second season Falkland Islands Government Fisheries Department, Stanley. 44 pp. Payá, I Loligo gahi, second season Fishery Statistics, Biological Trends, Stock Assessment and Risk Analysis. Falkland Islands Government Fisheries Department, Stanley. 41 pp. Payá, I Vessel Units and Allowable Effort Loligo - C licences for Second Season Falkland Islands Government Fisheries Department, Stanley. 10 pp. Payá, I Vessel Units and Allowable Effort Loligo - C licences for first Season Falkland Islands Government Fisheries Department, Stanley. 14 pp. Payá, I. and A. Winter Loligo gahi Stock Assessment Survey, post-second Season pp. Payá, I., P. Schuchert & P. Brickle Vessel Units, Allowable Effort and Allowable Catch, Falkland Islands Government Fisheries Department, Stanley. 43 pp. Dr Alexander I. Arkhipkin (Editor), sections ; 1.15; 2; 3; 6; 7 Dr Paul Brickle, sections ; ; 4 Ignacio Paya, sections 1.2; 1.9; 1.12 (stock assessment parts); 5 Dr Pia Schuchert, sections Dr Vladimir Laptikhovsky, sections Dr Andreas Winter, section 1.10 xv
22 Introduction Figure A.1 Chart of the Falkland Islands Interim Conservation and Management Zone (FICZ) and Falkland Islands Outer Conservation Zone (FOCZ) This chart is illustrative NOT definitive - 1 -
23 Introduction Table A.1 Abbreviations for vessel types used in the tables FIFD Code Vessel type CO Combination (trawler - jigger) JI Jigger LO Longliner PO Potter TR Trawler Table A.2 Abbreviations for species names used in the tables FIFD Code FAO Code Scientific name Common name BAC SAO Salilota australis Red cod BLU POS Micromesistius australis Southern blue whiting COX** PAT Patagonotothen spp Rock cod GRX** RTX Macrouridae Grenadiers HAK*** HKP Merluccius hubbsi Common hake KIN CUS Genypterus blacodes Kingclip ILL SQA Illex argentinus Illex squid LOL SQP Loligo gahi Patagonian squid MAR SQS Martialia hyadesi Martialia squid OTH MZZ/SKX Osteichthyes/Chondrichthyes Others PAT HKX / HKN Merluccius spp /australis* Austral Hake RAY SRX Rajidae Skates and rays TOO TOP Dissostichus eleginoides Patagonian toothfish WHI GRM Macruronus magellanicus Hoki ZYP ZYP Zygochlamys patagonica Scallop * - Merluccius spp. until 2005; M.australis since 2006 ** - since 2006, before - in OTH; *** - since 2006, before - in PAT Table A.3 Abbreviations for fishing fleets used in the tables ISO Alfa-2 code ISO Alfa-3 code Fishing Fleet AU AUS Australia BZ BLZ Belize CB* KHM Cambodia CL CHL Chile CN CHN China EE EST Estonia ES ESP Spain FK FLK Falkland Islands FR FRA France GH GHC Ghana GR GRC Greece HN HDN Honduras IS ISL Iceland IT ITA Italy JP JPN Japan KR KOR Korea NA NAM Namibia NO NOR Norway PA PAN Panama PL POL Poland PT PRT Portugal RU RUS Russia SC SYC Seychelles SL SLE Sierra Leone TW * TWN Taiwan UK GBR United Kingdom UR UKR Ukraine US USA United States of America UY URY Uruguay VC VCT Saint Vincent VU VUT Vanuatu * - Cambodia is coded as CB for these statistics and Taiwan as TW
24 Introduction Table A.4 Licence types, target species and periods of application First Season Second Season Licence Target species Period of application A Unrestricted finfish B Illex squid Illex and Martialia squid C Patagonian squid (Loligo) F Skates and rays G Illex squid and restricted finfish* W Restricted finfish** R Skate and rays X All species Patagonian squid (Loligo) Y Unrestricted finfish Z Restricted finfish** All year A Unrestricted finfish F Skates and rays E Experimental fishery*** L Toothfish (Longliners) mid S Blue Whiting and Hoki W Restricted finfish** * The 'G' licence was introduced in It represents a combination of the 'B' Illex squid licence and 'W' restricted finfish licences. It is limited to trawlers using nets with a minimum mesh size of 90 mm. ** Restricted finfish - Main target species: Micromesistius australis - Southern blue whiting - BLU Macruronus magellanicus - Hoki - WHI. *** Experimental fishing licences 'E' are issued on an occasional basis to denote exploratory or experimental fishing activities. The 'E' licence included longliners fishing for toothfish up to mid 1999, when the 'L' licence was instituted for this activity. In 2006 the 'E' licence was used to cover access to the Loligo fishery during the monitoring activities undertaken by single vessels. The Scallop fishery, exploratory trawl fishery for grenadiers and longline fishery for kingclip have also been operating on an E licence
25 Table A5 Register of ITQ holding on 28 April 2009 FISHERY Quota Squid - Squid - Squid and Restricted Restricted Toothfish Squid - Owner Finfish Scallops Jig or Trawl Loligo gahi Skate Restricted Finfish Finfish Finfish Longline Loligo gahi Illex argentinus (Summer) Pelagic (Winter) Argos 8.15% 18.75% 11.22% 2.00% 18.75% Beauchene 3.10% 12.97% 1.88% 12.97% Bold Ventures 15.30% 22.21% Byron Holdings 2.28% % 19.97% CFL 100% FIG 70% Fortuna 24.96% 27.53% 0.04% 30% 0.27% 27.53% International Fish 2.28% 2.06% J.K. (Marine) 36.80% 0.86% Pioneer Seafoods 7.86% 2.52% RBC 38.33% 10.45% 2.99% 1.95% 10.45% Seafish 4.40% 29.20% 14.14% 19.95% 4.40% Seaview 14.34% 14.34% SFS % Southern Cross 4.18% 11.56% 7.71% 10.42% 11.56% Sulivan Shipping 11.14% 34.00% 23.09% 18.43% Total % 0.00% 0.00% % % % % % % % Note: Scallops and Squid Jig/Trawl have yet to enter quota system. Figures in italics represent provisional quota which is not transferable. The catch entitlement generated by the ITQ held by the Crown (FIG) in the Restricted Finfish Pelagic fishery is leased to Fortuna Ltd
26 Licences Table B.1 Licence allocations by licence type and year LICENCE A B C E F G L R S W X Y Z Grand Total LICENCE A B C E F G L R S W X Y Z LICENCE A* B C E F** G L R S W*** X Y Z * - A + Y since 2008 ** - F + R since 2008 ** *- W + Z since
27 Licences Table B.2 Licence allocations by fishing fleet and year Fishing fleet BG BZ CL ES FK FR GR HN IS IT JP KR NA NL NO PA PL PT RU SC SL TW UK UR US Grand Total
28 Table B.2 Licences Licence allocations by fishing fleet and year, continued Fishing fleet AU BZ CB CL CN EE ES FK FR GH IS JP KR NA NZ PA PT RU TW UK VC UY VU Grand Total Table B.3 Licence 'A' (Unrestricted finfish - first season, ; both seasons in 2008) allocations by fishing fleet and year Fishing fleet ES FK UK
29 Licences Table B.4 Licence 'B' (Illex squid) allocations by fishing fleet and year Fishing fleet BZ CB CN ES FK GH JP KR PA RU TW VU Table B.5 Licence 'C' (Patagonian squid) allocations by fishing fleet and year Fishing fleet ES FK FR NA PA UK VC Table B.6 Licence 'E' (Experimental) allocations by fishing fleet and year Fishing fleet AU ES FK IS KR UK UY
30 Licences Table B.7 Licence 'F' (Skates and rays - first season in , both seasons in ) allocations by fishing fleet and year Fishing fleet BZ KR ES Table B.8 Licence 'G' (Illex squid and restricted finfish) allocations by fishing fleet and year Fishing fleet EE ES FK JP NA UK Table B.9 Licence 'L' (Toothfish Longliners) allocations by fishing fleet and year Fishing fleet CL FK KR NZ Table B.10 Licence 'R' (Skates and rays - second season) allocations by fishing fleet and year Fishing fleet BZ ES KR PA
31 Licences Table B.11 Licence 'S' (Blue Whiting and Hoki - surimi vessels) allocations by fishing fleet and year Fishing fleet CL FK JP Table B.12 Licence 'W' (Restricted finfish - first season, ; both seasons in 2008) allocations by fishing fleet and year Fishing fleet BZ EE ES FK KR JP UK Table B.13 Licence 'X' (Patagonian squid - second season) allocations by fishing fleet and year Fishing fleet ES FK FR JP NA UK
32 Licences Table B.14 Licence 'Y' (Unrestricted finfish - second season) allocations by fishing fleet and year Fishing fleet ES FK RU UK Table B.15 Licence 'Z' ( Restricted finfish - second season) allocations by fishing fleet and year Fishing fleet AU BZ CL ES FK JP KR NA PA PT UK
33 Licences Table B.16 Annual revenue (Pounds sterling) by licence type LICENCE A 537, , , , , , ,949 B 22,723,027 20,698,011 20,961,399 20,865,023 14,301,237 17,440,342 10,867,548 C 4,028,578 5,077,665 3,286,308 2,904,346 3,558,704 3,305,953 3,473,536 E 3,000 1, ,308 12, , ,725 F ,214 G L R , ,363 S W.. 113, , , , ,679 X 377, , , ,803 1,466,992 2,046,655 2,173,149 Y 939, , , , , , ,690 Z 391, , ,843 1,222,974 1,207,635 1,335,812 1,920,068 29,001,223 27,942,586 26,360,901 26,513,702 21,073,205 25,690,547 20,348,929 LICENCE A 300, , , , , , ,589 B 12,176,224 12,189,748 9,578,864 9,349,734 14,609,416 16,408,604 15,504,408 C 3,915,269 3,489,634 3,694,139 3,840,651 4,063,638 4,515,400 4,495,703 E 107, , , , , F 117, ,714 41, ,114 G. 654, ,493 1,321, ,274 1,001,852 1,176,222 L , , ,856 R 446, ,579 73, , , , ,071 S , , , ,191 W 842, , , , , , ,804 X 2,297,557 1,745,260 2,157,595 1,802,191 1,596,130 2,014,142 1,759,362 Y 174, , , , , , ,723 Z 1,536,543 1,474,175 1,329,126 1,262,615 1,051, , ,040 21,977,242 21,296,309 19,577,548 20,182,480 24,780,401 27,685,053 26,552,083 LICENCE A* 312, , , , ,227 1,129,012 1,129,011 B 12,122,222 2,926,562 2,441,087 4,509,716 6,151,234 4,430,958 0 C 1,446,088 1,509,446 1,534,994 1,763,009 1,734,547 1,939,301 1,939,301 E 34,500 56,925 84,150 95, F** 85, ,778 49, , , ,121 G 1,085, , , , , , ,004 L 493, , , , , , ,700 R 240, , , , ,912. S 895,352 1,237, , , , , ,770 W*** 515, , , , ,479 1,219,240 1,219,240 X 1,804,098 2,090,748 2,510,109 3,263,140 3,263,140 4,242,081 4,242,082 Y 434, , , , ,542.. Z 995, , ,434 1,026, , ,466,419 11,912,319 10,552,357 14,401,541 15,393,593 15,308,645 10,850,229 * - A + Y since 2008; ** - F+R since 2008; *** - W + Z since 2008;
34 Catch summary tables Table C.1 Total catch (tonnes) by vessel type and year VESSEL TYPE CO JI LO TR VESSEL TYPE CO JI LO TR VESSEL TYPE JI PO LO TR
35 Table C.2 Catch summary tables Total catch (tonnes) of all species by year SPECIES BAC BLU ILL KIN LOL MAR PAT RAY TOO WHI OTH SPECIES BAC BLU ILL KIN LOL MAR PAT RAY TOO WHI OTH ZYP SPECIES BAC BLU ILL KIN LOL MAR HAK. 8414** 11,908** 8805** 13051** PAT 2735* 23*** 0*** 0*** 0*** RAY TOO WHI GRX COX ZYP OTH * - Merluccius spp, ** - M.hubbsi, *** - M.australis
36 Catch summary tables Table C.3 Total catch (tonnes) by month and year MONTH January February March April May June July August September October November December January February March April May June July August September October November December January February March April May June July August September October November December
37 Table C.4 Catch summary tables Total catch (tonnes) by gross registered tonnage (GRT) and year GRT < > Table C.5 Total catch (tonnes) by length overall (m) (LOA) and year LOA < > Table C.6 Total catch (tonnes) by brake horsepower (BHP) and year BHP < >
38 Table C.7 Catch summary tables Total catch (tonnes) by fishing fleet and year Fishing fleet BG BZ CL ES FK FR GR HN IS IT JP KR NA NL NO PA PL PT RU SL TW UK UR
39 Table C.7 Catch summary tables Total catch (tonnes) by fishing fleet and year, continued Fishing fleet AU BZ CB CL CN EE ES FK FR IS JP KR NA NO NZ PA PT RU SC TW UK UR UY VC VU Fishing fleet BZ CL CN EE ES FK GH JP KR PA TW UK UY
40 Illex argentinus Illex squid Table D.1 Total catch (tonnes) by vessel type and year VESSEL TYPE JI TR Table D.2 Total catch (tonnes) by month and year MONTH January February March April May June July August September October November December Table D.3 Total catch (tonnes) by fishing fleet and year Fishing fleet AU BZ CB CL CN EE ES FK FR GH IS JP KR NA PA RU TW UK VC VU
41 Illex argentinus Illex squid Table D.4 Total catch (tonnes) by gross registered tonnage (GRT) and year GRT < > Table D.5 Total catch (tonnes) by length overall (m) (LOA) and year LOA < > Table D.6 Total catch (tonnes) by brake horsepower (BHP) and year BHP < >
42 Illex argentinus Illex squid Table D.7 Total catch (tonnes) of jiggers by gross registered tonnage (GRT) and year GRT < Table D.8 Total catch (tonnes) of jiggers by length overall (m) (LOA) and year LOA < > Table D.9 Total catch (tonnes) of jiggers by brake horsepower (BHP) and year BHP < Table D.10 Total catch (tonnes) of trawlers by gross registered tonnage (GRT) and year GRT < <
43 Illex argentinus Illex squid Table D.11 Total catch (tonnes) of trawlers by length overall (m) (LOA) and year LOA < > Table D.12 Total catch (tonnes) of trawlers by brake horsepower (BHP) and year BHP >

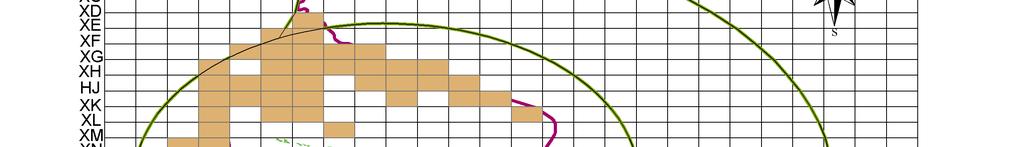


44 - 23 -
45 Illex argentinus Illex squid Length frequency distribution and length-weight relationship in trawler fleets in 2009 in the Falkland waters Male (N=38) Female (N=75) Percentage Mantle length, cm Weight, g y = x R 2 = Mantle length, cm
 13 14 15 16 17 18 19 20 21 22 23 24 25 26 27 Mantle length, cm Weight, g 350 300 250 200 150 100 y = 0.0584x 2.6345 R 2 = 0.")
46 Illex argentinus Illex squid Length frequency distribution and length-weight relationship in trawler fleets in 2009 on high seas Percentage Male (N=737) Female (N=816) Mantle length, cm Weight, g y = x R 2 = Mantle length, cm
47 Loligo gahi - Patagonian squid Table E.1 Total catch (tonnes) by vessel type and year VESSEL TYPE TR Table E.2 Total catch (tonnes) by month and year MONTH January February March April May June July August September October November December Table E.3 Total catch (tonnes) by fishing fleet and year Fishing fleet AU BZ CL ES FK FR HN JP KR NA PA PL PT SC UK UY VC
48 Table E.4 Total catch (tonnes) by gross registered tonnage (GRT) and year GRT < > Table E.5 Total catch (tonnes) by length overall (m) (LOA) and year LOA < > Table E.6 Total catch (tonnes) by brake horsepower (BHP) and year BHP < >


49 - 28 -
50 Loligo gahi Patagonian squid Length frequency distribution and length-weight relationship during first season Male (N=6,933) Female (N=4,641) 60 Percentage Mantle length, cm 300 y = x R 2 = Weight, g Mantle length, cm

51 Loligo gahi Patagonian squid Length frequency distribution and length-weight relationship during second season Juvenile (N=2) Female (N=10,181) Male (N=14,188) 6 Percentage Mantle length, cm y = x R 2 = Weight, g Mantle length, cm
52 Martialia hyadesi - Martialia squid Table F.1 Total catch (tonnes) by vessel type and year VESSEL TYPE JI TR Table F.2 Total catch (tonnes) by month and year MONTH January February March April May June July August September October November December Table F.3 Total catch (tonnes) by fishing fleet and year Fishing fleet CB ES FK JP KR TW
53 Martialia hyadesi - Martialia squid Table F.4 Total catch (tonnes) by gross registered tonnage (GRT) and year GRT < > Table F.5 Total catch (tonnes) by length overall (m) (LOA) and year LOA < > Table F.6 Total catch (tonnes) by brake horsepower (BHP) and year BHP < >
54 Micromesistius australis - Southern Blue Whiting Table G.1 Total catch (tonnes) by vessel type and year VESSEL TYPE TR Table G.2 Total catch (tonnes) by month and year MONTH January February March April May June July August September October November December Table G.3 Total catch (tonnes) by fishing fleet and year Fishing fleet AU BZ CL EE ES FK JP KR NA PT UK
55 Micromesistius australis - Southern Blue Whiting Table G.4 Total catch (tonnes) by gross registered tonnage (GRT) and year GRT < > Table G.5 Total catch (tonnes) by length overall (m) (LOA) and year LOA < > Table G.6 Total catch (tonnes) by brake horsepower (BHP) and year BHP < >


56 - 35 -
57 Micromesistius australis Southern Blue Whiting Length frequency distribution and length-weght relationship in surimi fleet in Male (N=902) Female (N=1,137) 6 Percentage Total length, cm y = x R 2 = Weight, g Total length, cm
58 Micromesistius australis Southern Blue Whiting Length frequency distribution and length-weight relationship in trawler fleets in Male (N=2,857) Juvenile (N=430) Female (N=1,895) 4 Percentage Total length, cm y = 0.004x R 2 = Weight, g Total length, cm
59 Macruronus magellanicus Hoki Table H.1 Total catch (tonnes) by vessel type and year VESSEL TYPE CO LO TR Table H.2 Total catch (tonnes) by month and year MONTH January February March April May June July August September October November December Table H.3 Total catch (tonnes) by fishing fleet and year Fishing fleet AU BZ CL EE ES FK FR HN IS JP KR NA PA PL PT RU SC UK VC
60 Macruronus magellanicus Hoki Table H.4 Total catch (tonnes) by gross registered tonnage (GRT) and year GRT < > Table H.5 Total catch (tonnes) by length overall (m) (LOA) and year LOA < > Table H.6 Total catch (tonnes) by brake horsepower (BHP) and year BHP < >
61 - 40 -
62 Macruronus magellanicus Hoki Length frequency distribution and length-weight relationship in trawler fleets in Male (N=6,155) Juvenile (N=87) Female (N=7,736) Percentage Preanal length, cm y = x R 2 = Weight, g Total length, cm
63 Salilota australis - Red cod Table I.1 Total catch (tonnes) by vessel type and year VESSEL TYPE LO TR Table I.2 Total catch (tonnes) by month and year MONTH January February March April May June July August September October November December Grand Total Table I.3 Total catch (tonnes) by fishing fleet and year Fishing fleet AU BZ CL EE ES FK FR HN IS JP KR NA PA PL PT RU SC UK UY VC
64 Salilota australis - Red cod Table I.4 Total catch (tonnes) by gross registered tonnage (GRT) and year GRT < > Table I.5 Total catch (tonnes) by length overall (m) (LOA) and year LOA < > Table I.6 Total catch (tonnes) by brake horsepower (BHP) and year BHP < >


65 - 44 -
66 Salilota australis - Red cod Length frequency distribution and length-weight relationship in trawler fleets in Male (N=3,125) Female (N=3,963) Juvenile (N=10) Percentage Total length, cm y = x R 2 = Weight, g Total length, cm
67 Merluccius spp - Hakes Table J.1 Total catch (tonnes) by vessel type and year VESSEL TYPE LO TR Table J.2 Total catch (tonnes) by month and year MONTH January February March April May June July August September October November December Table J.3 Total catch (tonnes) by fishing fleet and year Fishing fleet AU BZ CL EE ES FK FR HN IS JP KR NA PA PL PT RU SC UK UY VC
68 Merluccius spp - Hakes Table J.4 Total catch (tonnes) by gross registered tonnage (GRT) and year GRT < > Table J.5 Total catch (tonnes) by length overall (m) (LOA) and year LOA < > Table J.6 Total catch (tonnes) by brake horsepower (BHP) and year BHP < >

69 - 48 -
70 Merluccius spp - Hakes Length frequency distribution and length-weight relationship in M.hubbsi in trawler fleets in Percentage Male (N=1,144) Female (N=7,385) Total length, cm y = x R 2 = Weight, g Total length, cm
71 Genypterus blacodes - Kingclip Table K.1 Total catch (tonnes) by vessel type and year VESSEL TYPE LO TR Table K.2 Total catch (tonnes) by month and year MONTH January February March April May June July August September October November December Table K.3 Total catch (tonnes) by fishing fleet and year Fishing fleet AU BZ CL EE ES FK FR IS JP KR NA PA PT RU SC UK
72 Genypterus blacodes - Kingclip Table K.4 Total catch (tonnes) by gross registered tonnage (GRT) and year GRT < > Table K.5 Total catch (tonnes) by length overall (m) (LOA) and year LOA < > Table K.6 Total catch (tonnes) by brake horsepower (BHP) and year BHP < >

73 - 52 -
74 Genypterus blacodes - Kingclip Length frequency distribution and length-weight relationship in trawler fleets in Male (N=1,015) Female (N=1,553) 2.5 Percentage Total length, cm y = x R 2 = Weight, g Total length, cm
75 Dissostichus eleginoides - Toothfish Table L.1 Total catch (tonnes) by vessel type and year VESSEL TYPE LO PO TR Table L.2 Total catch (tonnes) by month and year MONTH January February March April May June July August September October November December Table L.3 Total catch (tonnes) by fishing fleet and year Fishing fleet AU BZ CL EE ES FK FR HN IS JP KR NA NO NZ PA PT SC RU UK VC
76 Dissostichus eleginoides - Toothfish Table L.4 Total catch (tonnes) by gross registered tonnage (GRT) and year GRT < > Table L.5 Total catch (tonnes) by length overall (m) (LOA) and year LOA < > Table L.6 Total catch (tonnes) by brake horsepower (BHP) and year BHP < >
77 Dissostichus eleginoides - Toothfish Table L.7 Total catch (tonnes) of combination vessels by gross registered tonnage (GRT) and year GRT < * 59* *- potters Table L.8 Total catch (tonnes) of combination vessels by length overall (m) (LOA) and year LOA * 59* * *- potters Table L.9 and year Total catch (tonnes) of combination vessels by brake horsepower (BHP) BHP * 59* * *- potters Table L.10 Total catch (tonnes) of longliners by gross registered tonnage (GRT) and year GRT < Table L.11 Total catch (tonnes) of longliners by length overall (m) (LOA) and year LOA <
78 Dissostichus eleginoides - Toothfish Table L.12 Total catch (tonnes) of longliners by brake horsepower (BHP) and year BHP < Table L.13 Total catch (tonnes) of trawlers by gross registered tonnage (GRT) and year GRT < > Table L.14 Total catch (tonnes) of trawlers by length overall (m) (LOA) and year LOA < > Table L.15 Total catch (tonnes) of trawlers by brake horsepower (BHP) and year BHP < >

79 - 58-
80 Dissostichus eleginoides - Toothfish Length frequency distribution and length-weight relationship in longliner fleet in Unsexed (N=38) Male (N=1,705) Female (N=1,170) 2.5 Percentage Total length, cm y = x R 2 = Weight, g Total length, cm
81 Dissostichus eleginoides - Toothfish Length frequency distribution and length-weight relationship in trawler fleets in Male (N=2,110) Female (N=2,624) Percentage Total length, cm Weight, g Total length, cm
82 Rajidae - Skates and Rays Table M.1 Total catch (tonnes) by vessel type and year VESSEL TYPE LO PO TR Table M.2 Total catch (tonnes) by month and year MONTH January February March April May June July August September October November December Table M.3 Total catch (tonnes) by fishing fleet and year Fishing fleet AU BZ CL EE ES FK FR HN IS IT JP KR NA NZ PA PT RU UK UY VC
83 Rajidae - Skates and Rays Table M.4 Total catch (tonnes) by gross registered tonnage (GRT) and year GRT < > Table M.5 Total catch (tonnes) by length overall (m) (LOA) and year LOA < > Table M.6 Total catch (tonnes) by brake horsepower (BHP) and year BHP < >

84 - 63 -
85 Rajidae - Skates and Rays Length frequency distribution and length-weight relationship in 2009 for Bathyraja brachiurops Male (N=355) Female (N=513) 3 Percentage Disk width, cm Weight, g 5000 y = x R 2 = Disk width, cm
86 Zygochlamys patagonica - Scallop Table N.1 Total catch (tonnes) by vessel type and year VESSEL TYPE TR * 6* 13* * 6* 13* * - No specialised fishery, just a discarded bycatch. Included into others in Tables O1-O7 Table N.2 Total catch (tonnes) by month and year MONTH January February March April May June July August September October November December Table N.3 Total catch (tonnes) by fishing fleet and year Fishing fleet FK PA UK UY
87 Zygochlamys patagonica - Scallop Table N.4 Total catch (tonnes) by gross registered tonnage (GRT) and year GRT < > Table N.5 Total catch (tonnes) by length overall (m) (LOA) and year LOA < > Table N.6 Total catch (tonnes) by brake horsepower (BHP) and year BHP < >
88 Table O.1 Total catch (tonnes) by vessel type and year VESSEL TYPE CO *... LO TR *-potters Table O.2 Total catch (tonnes) by month and year Others MONTH January February March April May June July August September October November December Table O.3 Total catch (tonnes) by fishing fleet and year Fishing fleet AU BZ CL EE ES FK FR HN IS IT JP KR NA NO NZ PA PL PT RU SC UY UK
89 Others Table O.4 Total catch (tonnes) by gross registered tonnage (GRT) and year GRT < > Table O.5 Total catch (tonnes) by length overall (m) (LOA) and year LOA < > Table O.6 Total catch (tonnes) by brake horsepower (BHP) and year BHP < >
 of others by species in 2009 Common name Latin name Catch Blue Antimora Antimora rostrata 11 Butterfish Stromateus brasiliensis 75 Chinese Baby Face Psychrolutes marmoratus")

90 Table O.7 Total catch (tonnes) of others by species in 2009 Common name Latin name Catch Blue Antimora Antimora rostrata 11 Butterfish Stromateus brasiliensis 75 Chinese Baby Face Psychrolutes marmoratus 0 Crab Lithodidae 10 Dogfish Squalus acanthias 0 Eelpout Iluocetes fimbriatus 0 Falkland Herring Sprattus fuegensis 0 Flat fish Mancopsetta spp. 0 Frogmouth Cottoperca gobio 16 Greater Hooked Squid Moroteuthis ingens 87 Grenadier Macrouridae 958 Icefish Chamsocephalus esox 0 Lobster Krill Munida spp 0 Moonfish Lampris immaculatus 1 Mullet Eleginops maclovinus 0 Porbeagle Lamna nasus 3 Red Fish Sebastes oculatus 31 Rock cod Patagonotothen spp Scallop Zygochlamys patagonica 13 Sculpin Cottunculus granulosus 0 Smooth Oreo Pseudocyttus maculatus 0 Others 10 Total

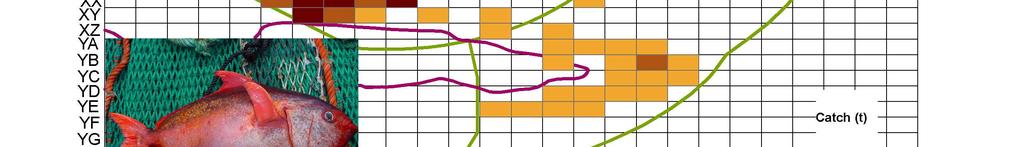
91 - 70 -


92 - 71 -
93 Patagonotothen ramsayi Rock Cod Length frequency distribution and length-weight relationship in Unsexed (N=1,008) Juvenile (N=507) Male (N=10,487) Female (N=11,723) Percentage Total length, cm y = x R 2 = Weight, g Total length, cm

94
FALKLAND ISLANDS GOVERNMENT FISHERIES DEPARTMENT FISHERY STATISTICS
 FALKLAND ISLANDS GOVERNMENT FISHERIES DEPARTMENT FISHERY STATISTICS Volume 18 (2004 2013) Crown Copyright 2014 No part of this publication may be reproduced without prior permission.. For citation purposes
FALKLAND ISLANDS GOVERNMENT FISHERIES DEPARTMENT
 FALKLAND ISLANDS GOVERNMENT FISHERIES DEPARTMENT FISHERY STATISTICS Volume 10 (1996 2005) Crown Copyright 2006 No part of this publication may be reproduced without prior permission.. For citation purposes
Advice June 2012
 2.4.1 Advice June 212 ECOREGION STOCK Iceland and East Greenland Beaked redfish (Sebastes mentella) in Subareas V, XII, and XIV and NAFO Subareas 1+2 (Deep pelagic stock > 5 m) Advice for 213 The advice
SC China s Annual report Part II: The Squid Jigging Fishery Gang Li, Xinjun Chen and Bilin Liu
 3 rd Meeting of the Scientific Committee Port Vila, Vanuatu 28 September - 3 October 215 SC-3-9 China s Annual report Part II: The Squid Jigging Fishery Gang Li, Xinjun Chen and Bilin Liu National Report
HADDOCK ON THE SOUTHERN SCOTIAN SHELF AND IN THE BAY OF FUNDY (DIV. 4X/5Y)
") Canadian Science Advisory Secretariat Science Advisory Report 26/47 HADDOCK ON THE SOUTHERN SCOTIAN SHELF AND IN THE BAY OF FUNDY (DIV. 4X/5Y) Context Haddock (Melanogrammus aeglefinus) are found on both
Canadian Science Advisory Secretariat Science Advisory Report 26/47 HADDOCK ON THE SOUTHERN SCOTIAN SHELF AND IN THE BAY OF FUNDY (DIV. 4X/5Y) Context Haddock (Melanogrammus aeglefinus) are found on both
South American Hake & Hoki. Mario Inostroza President of EMDEPES, Chile
 South American Hake & Hoki Mario Inostroza President of EMDEPES, Chile EMDEPES is the Chilean subsidiary of the Japanese fishing & aquaculture company NISSUI NISSUI s Main Business Units I. Marine Business
Advice June 2014
 5.3.23 Advice June 2014 ECOREGION STOCK Celtic Sea and West of Scotland Plaice in Division VIIa (Irish Sea) Advice for 2015 Based on ICES approach to data-limited stocks, ICES advises that catches should
STOCK STATUS OF SOUTHERN BLUEFIN TUNA
 7 th Expert Consultation on Indian Ocean Tunas, Victoria, Seychelles, 9-14 November, 1998 STOCK STATUS OF SOUTHERN BLUEFIN TUNA Tsuji, S. 1 Introduction The Commission for the Conservation of Southern
The fishery for jack mackerel in the Eastern Central Pacific by European trawlers in 2008 and 2009
 Eighth International Meeting: SWG: Jack Mackerel Sub-Group SP-08-SWG-JM-01 The fishery for jack mackerel in the Eastern Central Pacific by European trawlers in 2008 and 2009 Ad Corten Corten Marine Research
Pelagic fishery for Sebastes mentella in the Irminger Sea
 3.2.6.d Pelagic fishery for Sebastes mentella in the Irminger Sea The stock structure of deep-sea redfish S. mentella in Sub-area XII, Division Va and Sub-area XIV and NAFO Div. 1F remains generally uncertain.
2.3.1 Advice May Capelin in Subareas V and XIV and Division IIa west of 5 W (Iceland East Greenland Jan Mayen area).
.") 2.3.1 Advice May 2014 ECOREGION Iceland and East Greenland STOCK Capelin in Subareas V and XIV and Division IIa west of 5 W (Iceland East Greenland Jan Mayen area) Advice for 2014/2015 ICES advises on
2.3.1 Advice May 2014 ECOREGION Iceland and East Greenland STOCK Capelin in Subareas V and XIV and Division IIa west of 5 W (Iceland East Greenland Jan Mayen area) Advice for 2014/2015 ICES advises on
3.4.3 Advice June Barents Sea and Norwegian Sea Cod in Subareas I and II (Norwegian coastal waters cod)
") 3.4.3 Advice June 2013 ECOREGION STOCK Barents Sea and Norwegian Sea Cod in Subareas I and II (Norwegian coastal waters cod) Advice for 2014 ICES advises on the basis of the Norwegian rebuilding plan,
3.4.3 Advice June 2013 ECOREGION STOCK Barents Sea and Norwegian Sea Cod in Subareas I and II (Norwegian coastal waters cod) Advice for 2014 ICES advises on the basis of the Norwegian rebuilding plan,
6 th Meeting of the Scientific Committee Puerto Varas, Chile, 9-14 September SC6-Doc15 The Russian Federation s Annual Report
 6 th Meeting of the Scientific Committee Puerto Varas, Chile, 9-14 September 2018 SC6-Doc15 The Russian Federation s Annual Report National report of the Russian Federation to the SPRFMO Science Working
Advice October 2013
 5.4.21.3 Advice October 213 ECOREGION Celtic Sea and West of Scotland STOCK Nephrops on Porcupine Bank (FU 16) Advice for 214 ICES advises on the basis of the MSY approach that catches from FU 16 in 214
Fishery Report 2017: Dissostichus spp. (Subarea 48.2)
") Fishery Report 2017: Dissostichus spp. (Subarea 48.2) FISHERY REPORT The map above shows the management areas within the CAMLR Convention Area, the specific region related to this report is shaded. Throughout
Fishery Report 2017: Dissostichus spp. (Subarea 48.2) FISHERY REPORT The map above shows the management areas within the CAMLR Convention Area, the specific region related to this report is shaded. Throughout
ISSN (online) ISBN (online) July New Zealand Fisheries Assessment Report 2017/41. P.L. Horn C.P.
 ISBN (online) July New Zealand Fisheries Assessment Report 2017/41. P.L. Horn C.P.") Catch-at-age for hake (Merluccius australis) and ling (Genypterus blacodes) in the 1 16 fishing year and from two research trawl surveys in 16, with a summary of all available data sets from the New Zealand
Catch-at-age for hake (Merluccius australis) and ling (Genypterus blacodes) in the 1 16 fishing year and from two research trawl surveys in 16, with a summary of all available data sets from the New Zealand
Falkland Islands. Figure FI-1. The Falklands Interim Conservation and Management Zone (FICZ) and the Falklands Outer Conservation Zone (FOCZ).
 and the Falklands Outer Conservation Zone (FOCZ).") Falkland Islands The Falkland Islands are a UKOT in the South Atlantic, approximately 350 nautical miles off the coast of South America between 51 and 53 south. The islands have a population of around
Falkland Islands The Falkland Islands are a UKOT in the South Atlantic, approximately 350 nautical miles off the coast of South America between 51 and 53 south. The islands have a population of around
Gulf of St. Lawrence (4RST) Greenland Halibut
 Greenland Halibut") Fisheries and Oceans Science Pêches et Océans Sciences DFO Science Stock Status Report A4-3 () 52 5 48 46 Québec Nouveau-Brunswick Québec 4T 4S 4R 3Pn 4Vn Terre-Neuve 3Ps 3K 3L Gulf of St. Lawrence (4RST)
Fisheries and Oceans Science Pêches et Océans Sciences DFO Science Stock Status Report A4-3 () 52 5 48 46 Québec Nouveau-Brunswick Québec 4T 4S 4R 3Pn 4Vn Terre-Neuve 3Ps 3K 3L Gulf of St. Lawrence (4RST)
TAC Reported Landings * - By-catch only
 DFO Atlantic Fisheries Stock Status Report 96/68E 4Vn 3Ps 4W 4Vs EASTERN SCOTIAN SHELF HADDOCK Background Haddock on the eastern Scotian Shelf and southern Gulf of St. Lawrence are considered as a single
ASSESSMENT OF THE WEST COAST OF NEWFOUNDLAND (DIVISION 4R) HERRING STOCKS IN 2011
 HERRING STOCKS IN 2011") Canadian Science Advisory Secretariat Science Advisory Report 212/24 ASSESSMENT OF THE WEST COAST OF NEWFOUNDLAND (DIVISION 4R) HERRING STOCKS IN 211 Context Figure 1. Map of unit areas of NAFO Division
Canadian Science Advisory Secretariat Science Advisory Report 212/24 ASSESSMENT OF THE WEST COAST OF NEWFOUNDLAND (DIVISION 4R) HERRING STOCKS IN 211 Context Figure 1. Map of unit areas of NAFO Division
REDFISH in Sub-areas I and II. Nominal catch (t) by countries in Sub-area I, Divisions IIa and IIb combined as officially reported to ICES.
 by countries in Sub-area I, Divisions IIa and IIb combined as officially reported to ICES.") .1. Redfish in Sub-areas I and II Table.1..1 REDFISH in Sub-areas I and II. Nominal catch (t) by countries in Sub-area I, Divisions IIa and IIb combined as officially reported to ICES. Year Can Den Faroe
.1. Redfish in Sub-areas I and II Table.1..1 REDFISH in Sub-areas I and II. Nominal catch (t) by countries in Sub-area I, Divisions IIa and IIb combined as officially reported to ICES. Year Can Den Faroe
6 th Meeting of the Scientific Committee Puerto Varas, Chile, 9-14 September SC6-Doc21 Chinese Taipei s Annual Report
 6 th Meeting of the Scientific Committee Puerto Varas, Chile, 9-14 September 2018 SC6-Doc21 Chinese Taipei s Annual Report 2018 National Report of Chinese Taipei to SPRFMO Scientific Committee on the Squid
9.4.5 Advice September Widely distributed and migratory stocks Herring in the Northeast Atlantic (Norwegian spring-spawning herring)
") 9.4.5 Advice September 212 ECOREGION STOCK Widely distributed and migratory stocks Herring in the Northeast Atlantic (Norwegian spring-spawning herring) Advice for 213 ICES advises on the basis of the
9.4.5 Advice September 212 ECOREGION STOCK Widely distributed and migratory stocks Herring in the Northeast Atlantic (Norwegian spring-spawning herring) Advice for 213 ICES advises on the basis of the
SCIENTIFIC COUNCIL MEETING JUNE Assessment of Demersal Redfish in NAFO Subarea 1
 NOT TO BE CITED WITHOUT PRIOR REFERENCE TO THE AUTHOR(S) Northwest Atlantic Fisheries Organization Serial No. N5126 NAFO SCR Doc. 5/4 SCIENTIFIC COUNCIL MEETING JUNE 25 Assessment of Demersal Redfish in
Advice June 2013 Version 2,
 5..37 Advice June 3 Version, 5--3 ECOREGION STOCK Celtic Sea and West of Scotland Sole in Divisions VIIf,g (Celtic Sea) Advice for ICES advises on the basis of the MSY approach that catches in should be
SCIENTIFIC COUNCIL MEETING - JUNE Polish Research Report, by A. J. Paciorkowski Sea Fisheries Institute Gdynia Poland.
 NOT TO BE CITED WITHOUT PRIOR REFERENCE TO THE,SECRETARIAT Northwest Atlantic Fisheries Organization Serial No. N17 NAFO SCS Doc. 80/VI/ SCIENTIFIC COUNCIL MEETING JUNE 1980 Polish Research Report, 1979
Advice October 2014
 5.3.21.3 Advice October 2014 ECOREGION Celtic Sea and West of Scotland STOCK Nephrops on Porcupine Bank (FU 16) Advice for 2015 ICES advises on the basis of the MSY approach that catches from FU 16 in
FALKLAND ISLANDS GOVERNMENT FISHERIES DEPARTMENT FISHERY STATISTICS
 FALKLAND ISLANDS GOVERNMENT FISHERIES DEPARTMENT FISHERY STATISTICS Volume 9 (1995-2004) FALKLAND ISLANDS GOVERNMENT FISHERIES DEPARTMENT FISHERY STATISTICS Volume 9 (1995-2004) Crown Copyright 2005 No
The South African and Namibian horse mackerel fisheries Prepared by Dave Japp and Melanie Smith. The South African horse mackerel
 The South African and Namibian horse mackerel fisheries Prepared by Dave Japp and Melanie Smith The South African horse mackerel Status of the Fishery and Management Until recently the South African fishery
Fishing mortality in relation to highest yield. Fishing mortality in relation to agreed target
 3.4 Stock summaries 3.4. Northeast Arctic cod State of the stock Spawning biomass in relation to precautionary limits Full reproductive capacity Fishing mortality in relation to precautionary limits/management
Advice June Capelin in Subareas V and XIV and Division IIa west of 5 W (Iceland East Greenland Jan Mayen area).
.") 2.4.12 Advice June 2012 ECOREGION Iceland and East Greenland STOCK Capelin in Subareas V and XIV and Division IIa west of 5 W (Iceland East Greenland Jan Mayen area) Advice for 2013 ICES advises on the
2.4.12 Advice June 2012 ECOREGION Iceland and East Greenland STOCK Capelin in Subareas V and XIV and Division IIa west of 5 W (Iceland East Greenland Jan Mayen area) Advice for 2013 ICES advises on the
The Hague, Kingdom of the Netherlands October 2016 SC The European Union Annual report
 4 th Meeting of the Scientific Committee The Hague, Kingdom of the Netherlands 1-1 October 216 SC-4-1 The European Union Annual report Ad Corten Consultant Dutch Ministry of Economic Affairs 1 National
Spurdog (Squalus acanthias) in the Northeast Atlantic
 in the Northeast Atlantic") ICES Advice on fishing opportunities, catch, and effort Northeast Atlantic Published 11 October 2016 9.3.17 Spurdog (Squalus acanthias) in the Northeast Atlantic ICES stock advice ICES advises that when
ICES Advice on fishing opportunities, catch, and effort Northeast Atlantic Published 11 October 2016 9.3.17 Spurdog (Squalus acanthias) in the Northeast Atlantic ICES stock advice ICES advises that when
Fishery Report 2017: Dissostichus eleginoides Kerguelen Islands French EEZ (Division )
") FISHERY REPORT Fishery Report 2017: Dissostichus eleginoides Kerguelen Islands French EEZ (Division 58.5.1) The map above shows the management areas within the CAMLR Convention Area, the specific region
FISHERY REPORT Fishery Report 2017: Dissostichus eleginoides Kerguelen Islands French EEZ (Division 58.5.1) The map above shows the management areas within the CAMLR Convention Area, the specific region
Year Avg. TAC Can Others Totals
 SKATE IN DIVISIONS 3L, 3N, 3O AND SUBDIVISION 3Ps Background There are 8 to 1 species of skate in the waters around Newfoundland. Of these, thorny skate (Raja radiata) is by far the most common, comprising
Overview 10/8/2015. October Pelagic Advice Pelagic AC 7 October 2015
 October Pelagic Advice Pelagic AC 7 October 2015 John Simmonds ICES ACOM Vice Chair Overview WG 1 Blue whiting NSS herring North Sea horse makerel WG 2 Stocks Northeast Atlantic mackerel Western horse
Dauphin Lake Fishery. Status of Walleye Stocks and Conservation Measures
 Dauphin Lake Fishery Status of Walleye Stocks and Conservation Measures Date: December, 21 Dauphin Lake Fishery Status of Walleye Stocks and Conservation Measures Background: Walleye stocks in Dauphin
4.9.5 Norwegian spring-spawning herring
 4.9.5 Norwegian springspawning herring State of the stock Spawning biomass in relation to precautionary limits Acceptable Fishing mortality in relation to precautionary limits Acceptable Fishing mortality
Sandeel (Ammodytes spp.) in Divisions IIIa, IVa, and IVb, SA 3 (Skagerrak and Kattegat, North and Central North Sea)
 in Divisions IIIa, IVa, and IVb, SA 3 (Skagerrak and Kattegat, North and Central North Sea)") ICES Advice on fishing opportunities, catch and effort Greater North Sea Ecoregion Published 23 February 2015 6.3.39 Sandeel (Ammodytes spp.) in Divisions IIIa, IVa, and IVb, SA 3 (Skagerrak and Kattegat,
ICES Advice on fishing opportunities, catch and effort Greater North Sea Ecoregion Published 23 February 2015 6.3.39 Sandeel (Ammodytes spp.) in Divisions IIIa, IVa, and IVb, SA 3 (Skagerrak and Kattegat,
Shrimp of the Estuary and the Gulf of St. Lawrence
 DFO Science Stock Status Report C4-6 54 52 North Shore Latitude 5 48 12 New Brunswick 1 Gaspé Peninsula Anticosti P.E.I. 9 8 Newfoundland Shrimp of the Estuary and the Gulf of St. Lawrence 46 44 Nova Scotia
SA2 + Div. 3K Redfish
 Fisheries and Oceans Pêches et Océans Canada Canada DFO Science Stock Status Report A2-15(21) entered the fishery in 1975 and averaged about 16,5 t from 1978-1986. The steady reduction in catches from
Report of the Working Group on Widely Distributed
 ICES WGWIDE REPORT 2017 ICES ADVISORY COMMITTEE ICES CM 2017/ACOM:23 Report of the Working Group on Widely Distributed Stocks (WGWIDE) 30 August -5 September 2017 ICES Headquarters, Copenhagen, Denmark
SILVER WAREHOU (SWA) (Seriolella punctata)
 (Seriolella punctata)") 703 SILVER WAREHOU (SWA) (Seriolella punctata) 1. FISHERY SUMMARY (a) Commercial fisheries Silver warehou are common around the South Island and on the Chatham Rise in depths of 200 800 m. The majority
703 SILVER WAREHOU (SWA) (Seriolella punctata) 1. FISHERY SUMMARY (a) Commercial fisheries Silver warehou are common around the South Island and on the Chatham Rise in depths of 200 800 m. The majority
SCIENTIFIC COMMITTEE THIRD REGULAR SESSION August 2007 Honolulu, United States of America
 SCIENTIFIC COMMITTEE THIRD REGULAR SESSION 13-24 August 2007 Honolulu, United States of America ANNUAL REPORT PART 1 INFORMATION ON FISHERIES, RESEARCH, AND STATISTICS WCPFC-SC3-AR PART 1/WP-15 REPUBLIC
Recent stock recovery and potential future developments in. Sebastes mentella in the Barents- and Norwegian Seas.
 Recent stock recovery and potential future developments in the fishery, The rise management, of the assessment beaked and redfish population of Sebastes mentella in the Barents- and Norwegian Seas. Benjamin
ASMFC Stock Assessment Overview: Atlantic Menhaden
 Introduction This document presents a summary of the 217 Stock Assessment Update for Atlantic menhaden. The assessment is an update to the 215 Benchmark Stock Assessment that was peer reviewed by an independent
Assessment Summary Report Gulf of Mexico Red Snapper SEDAR 7
 Assessment Summary Report Gulf of Mexico Red Snapper SEDAR 7 Stock Distribution: Red snapper are found throughout the Gulf of Mexico, the Caribbean Sea, and from the U.S. Atlantic Coast to northern South
Golden redfish (Sebastes norvegicus) in subareas 5, 6, 12, and 14 (Iceland and Faroes grounds, West of Scotland, North of Azores, East of Greenland)
 in subareas 5, 6, 12, and 14 (Iceland and Faroes grounds, West of Scotland, North of Azores, East of Greenland)") ICES Advice on fishing opportunities, catch, and effort Arctic Ocean, Celtic Seas, Faroes, Greenland Sea, Icelandic Waters, Published 13 June 2017 Norwegian Sea, and Oceanic Northeast Atlantic Ecoregions
ICES Advice on fishing opportunities, catch, and effort Arctic Ocean, Celtic Seas, Faroes, Greenland Sea, Icelandic Waters, Published 13 June 2017 Norwegian Sea, and Oceanic Northeast Atlantic Ecoregions
Serial No. N4503 NAFO SCR Doc. 01/115. SCIENTIFIC COUNCIL MEETING SEPTEMBER 2001 (Deep-sea Fisheries Symposium Poster)
") NOT TO BE CITED WITHOUT PRIOR REFERENCE TO THE AUTHOR(S) Northwest Atlantic Fisheries Organization Serial No. N4503 NAFO SCR Doc. 01/115 SCIENTIFIC COUNCIL MEETING SEPTEMBER 2001 (Deep-sea Fisheries Symposium
NOT TO BE CITED WITHOUT PRIOR REFERENCE TO THE AUTHOR(S) Northwest Atlantic Fisheries Organization Serial No. N4503 NAFO SCR Doc. 01/115 SCIENTIFIC COUNCIL MEETING SEPTEMBER 2001 (Deep-sea Fisheries Symposium
By far the majority of New Zealand s fisheries are performing well
 The Status of New Zealand s Fisheries 212 November 212 Introduction This document summarises the status of New Zealand s fish stocks relative to the requirements of the Harvest Strategy Standard for New
3.4 Stock Summaries Advice June 2011
 3.4 Stock Summaries 3.4.1 Advice June 211 ECOREGION STOCK Barents Sea and Norwegian Sea Cod in Subareas I and II (Northeast Arctic cod) Advice for 212 ICES advises on the basis of the Joint Russian Norwegian
West Coast Rock Lobster. Description of sector. History of the fishery: Catch history
 West Coast Rock Lobster Description of sector History of the fishery: The commercial harvesting of West Coast rock lobster commenced in the late 1800s, and peaked in the early 1950s, yielding an annual
6 th Meeting of the Scientific Committee Puerto Varas, Chile, 9-14 September 2018
 6 th Meeting of the Scientific Committee Puerto Varas, Chile, 9-14 September 218 SC6-Doc23_rev1 China s Annual Report, part I (Jack mackerel) Gang Li, Xiaorong Zou & Luoliang Xu Annual Report of China
Beaked redfish (Sebastes mentella) in subareas 1 and 2 (Northeast Arctic)
 in subareas 1 and 2 (Northeast Arctic)") ICES Advice on fishing opportunities, catch, and effort Arctic Ocean, Barents Sea, Faroes, Greenland Sea, Published 28 September 2018 Icelandic Waters, and Norwegian Sea Ecoregions DOI: 10.17895/ices.pub.4538
ICES Advice on fishing opportunities, catch, and effort Arctic Ocean, Barents Sea, Faroes, Greenland Sea, Published 28 September 2018 Icelandic Waters, and Norwegian Sea Ecoregions DOI: 10.17895/ices.pub.4538
ATLANTIC SALMON NEWFOUNDLAND AND LABRADOR, SALMON FISHING AREAS 1-14B. The Fisheries. Newfoundland Region Stock Status Report D2-01
 Fisheries Pêches and Oceans et Océans DFO Science Newfoundland Region Stock Status Report D2-01 ATLANTIC SALMON NEWFOUNDLAND AND LABRADOR, SALMON FISHING AREAS 1-14B Background There are 15 Atlantic salmon
SWG JACK MACKEREL FISHERY IN CHILE
 SWG-10-07 JACK MACKEREL FISHERY IN CHILE ANNUAL NATIONAL REPORT SCIENCE WORKING GROUP 2011 1. DESCRIPTION OF THE FISHERY. 1.1 Composition of the Fleet. The structure and size of the industrial purse seine
Stock Annex: Greater silver smelt (Argentina silus) in divisions 5.b and 6.a (Faroes grounds and west of Scotland)
 in divisions 5.b and 6.a (Faroes grounds and west of Scotland)") ICES Stock Annex 1 Stock Annex: Greater silver smelt (Argentina silus) in divisions 5.b and 6.a (Faroes grounds and west of Scotland) Stock specific documentation of standard assessment procedures used
ICES Stock Annex 1 Stock Annex: Greater silver smelt (Argentina silus) in divisions 5.b and 6.a (Faroes grounds and west of Scotland) Stock specific documentation of standard assessment procedures used
Trends in Scottish Fish Stocks 2017
 Port Arthur, Scalloway, Shetland, ZE1 0UN, Scotland, UK Tel: +44 (0)1595 772000 Fax: +44 (0)1595 772001 Email: info@nafc.uhi.ac.uk Web: www.nafc.ac.uk Trends in Scottish Fish Stocks 2017 Ian R. Napier
SEAFISH ECONOMIC ANALYSIS
 SEAFISH ECONOMIC ANALYSIS UK 15m & over Scallop Fleet Area VII Economic analysis of the UK 15m and over scallop fishing fleet in ICES Area VII March 2016 AUTHORS: Arina Motova (Seafish) Hazel Curtis (Seafish)
Advice October 2012
 9.4.20 Advice October 2012 ECOREGION STOCK Widely distributed and migratory stocks Portuguese dogfish (Centroscymnus coelolepis) in the Northeast Atlantic Advice for 2013 and 2014 ICES advises on the basis
SUMMARY OF ICES 2009 ADVICE FOR PELAGIC SPECIES incl Blue whiting, capelin, herring, Norway pout, sandeel and sprat
 SUMMARY OF ICES ADVICE FOR PELAGIC SPECIES incl Blue whiting, capelin, herring, Norway pout, BLUE WHITING Blue whiting combined stock Sub-areas I-IX, XII and XIV Status of stock in October 543,043 Due
THORNY SKATE IN DIVISIONS 3L, 3N, 3O AND SUBDIVISION 3Ps
 Newfoundland and Labrador Region Stock Status Report 2003/023 stomachs of skate captured in the vicinity of commercial fisheries. THORNY SKATE IN DIVISIONS 3L, 3N, 3O AND SUBDIVISION 3Ps Background There
Species Profile: Red Drum Benchmark Assessment Finds Resource Relatively Stable with Overfishing Not Occurring
 Red Drum Sciaenops ocellatus Management Unit: New Jersey - Florida Interesting Facts: * The name is derived from their color and the fact that during spawning time males produce a drum-like noise by vibrating
Stock Annex: Thornback ray (Raja clavata) in Division 7.e (western English Channel)
 in Division 7.e (western English Channel)") ICES Stock Annex 1 Stock Annex: Thornback ray (Raja clavata) in Division 7.e (western English Channel) Stock specific documentation of standard assessment procedures used by ICES. Stock: Working Group:
ICES Stock Annex 1 Stock Annex: Thornback ray (Raja clavata) in Division 7.e (western English Channel) Stock specific documentation of standard assessment procedures used by ICES. Stock: Working Group:
Trends in Scottish Fish Stocks 2018
 Port Arthur, Scalloway, Shetland, ZE1 UN, Scotland, UK Tel: +44 ()1595 772 Fax: +44 ()1595 7721 Email: info@nafc.uhi.ac.uk Web: www.nafc.ac.uk Trends in Scottish Fish Stocks 218 Ian R. Napier 14 th September
DARK GHOST SHARK (GSH)
") DARK GHOST SHARK (GSH) (Hydrolagus novaezealandiae) 1. FISHERY SUMMARY 1.1 Commercial fisheries Two species (dark and pale ghost sharks) make up effectively all the commercial ghost shark landings. Dark
DARK GHOST SHARK (GSH) (Hydrolagus novaezealandiae) 1. FISHERY SUMMARY 1.1 Commercial fisheries Two species (dark and pale ghost sharks) make up effectively all the commercial ghost shark landings. Dark
Roundnose grenadier (Coryphaenoides rupestris) in Division 3.a (Skagerrak and Kattegat)
 in Division 3.a (Skagerrak and Kattegat)") Greater North Sea ecoregion Published 3 June 2016 9.3.28 Roundnose grenadier (Coryphaenoides rupestris) in Division 3.a (Skagerrak and Kattegat) ICES stock advice ICES advises that when the precautionary
Greater North Sea ecoregion Published 3 June 2016 9.3.28 Roundnose grenadier (Coryphaenoides rupestris) in Division 3.a (Skagerrak and Kattegat) ICES stock advice ICES advises that when the precautionary
2016 ANNUAL FISH TRAWL SURVEY REPORT
 216 ANNUAL FISH TRAWL SURVEY REPORT The University of Rhode Island Graduate School of Oceanography The Graduate School of Oceanography (GSO) Fish trawl survey began weekly sampling two stations in Narragansett
Bycatch accounting and management in the Ross Sea toothfish fishery
 Bycatch accounting and management in the Ross Sea toothfish fishery Steve Parker Sophie Mormede Stuart Hanchet New Zealand Ross Sea Region 4.5 million km 2 of ocean High seas fishery Managed by CCAMLR
Map Showing NAFO Management Units
 Map Showing NAFO Management Units Biology Are 6 species of seals in Atlantic Canadian waters, all of which occur in Newfoundland Two Arctic Species (Ringed, Bearded) Two temperate (Grey, Harbour) Two migratory
Sprat (Sprattus sprattus) in subdivisions (Baltic Sea)
 in subdivisions (Baltic Sea)") ICES Advice on fishing opportunities, catch, and effort Baltic Sea Ecoregion Published 31 May 2016 8.3.18 Sprat (Sprattus sprattus) in subdivisions 22 32 (Baltic Sea) ICES stock advice ICES advises that
ICES Advice on fishing opportunities, catch, and effort Baltic Sea Ecoregion Published 31 May 2016 8.3.18 Sprat (Sprattus sprattus) in subdivisions 22 32 (Baltic Sea) ICES stock advice ICES advises that
SC-02-JM-12. Report of the 5 th workshop on diagnosis of the status of the South Pacific Jack mackerel fishery in Peru SNP Scientific Committee
 2 nd Meeting of the Scientific Committee Honolulu, Hawaii, USA 1-7 October 2014 SC-02-JM-12 Report of the 5 th workshop on diagnosis of the status of the South Pacific Jack mackerel fishery in Peru SNP
Norway lobster (Nephrops norvegicus) in Division 4.a, Functional Unit 7 (northern North Sea, Fladen Ground)
 in Division 4.a, Functional Unit 7 (northern North Sea, Fladen Ground)") ICES Advice on fishing opportunities, catch, and effort Greater North Sea Ecoregion Published 11 November 2016 6.3.27 (update) Norway lobster (Nephrops norvegicus) in Division 4.a, Functional Unit 7 (northern
ICES Advice on fishing opportunities, catch, and effort Greater North Sea Ecoregion Published 11 November 2016 6.3.27 (update) Norway lobster (Nephrops norvegicus) in Division 4.a, Functional Unit 7 (northern
6 th Meeting of the Scientific Committee Puerto Varas, Chile, 9-14 September SC6-Doc19 Peru s Annual Report, part I (SPRFMO Area) IMARPE PRODUCE
 IMARPE PRODUCE") 6 th Meeting of the Scientific Committee Puerto Varas, Chile, 9-14 September 2018 SC6-Doc19 Peru s Annual Report, part I (SPRFMO Area) IMARPE PRODUCE INSTITUTO DEL MAR DEL PERU IMARPE MINISTERIO DE LA
6 th Meeting of the Scientific Committee Puerto Varas, Chile, 9-14 September 2018 SC6-Doc19 Peru s Annual Report, part I (SPRFMO Area) IMARPE PRODUCE INSTITUTO DEL MAR DEL PERU IMARPE MINISTERIO DE LA
Stock Annex: template
 Stock Annex: template Stock Annex Stock specific documentation of standard assessment procedures used by ICES. Stock Working Group: Thornback ray (Raja Clavata) in the Bay of Biscay VIIIa-c WGEF Date:
Advice May Herring in Subdivisions and 32 (excluding Gulf of Riga herring)
") 8.3.10 Advice May 2014 ECOREGION STOCK Baltic Sea Herring in Subdivisions 25 29 and 32 (excluding Gulf of Riga herring) Advice for 2015 ICES advises on the basis of the MSY approach that catches in 2015
8.3.10 Advice May 2014 ECOREGION STOCK Baltic Sea Herring in Subdivisions 25 29 and 32 (excluding Gulf of Riga herring) Advice for 2015 ICES advises on the basis of the MSY approach that catches in 2015
6 th Meeting of the Scientific Committee Puerto Varas, Chile, 9-14 September SC6-Doc17 The European Union s Annual Report Wójcik I.
 6 th Meeting of the Scientific Committee Puerto Varas, Chile, 9-14 September 2018 SC6-Doc17 The European Union s Annual Report Wójcik I., Janusz J, National report of the European Union to the 2018 SPRFMO
SC WG ON THE ECOSYSTEM APPROACH TO FISHERIES MANAGEMENT MAY 2008
 NOT TO BE CITED WITHOUT PRIOR REFERENCE TO THE AUTHOR(S) Northwest Atlantic Fisheries Organization Serial No. N5612 NAFO SCR Doc. 08/79 SC WG ON THE ECOSYSTEM APPROACH TO FISHERIES MANAGEMENT MAY 2008
Stock characteristics, fisheries and management of Greenland halibut (Reinhardtius hippoglossoides (Walbaum)) in the Northeast Arctic
) in the Northeast Arctic") The 10 th Norwegian Russian Symposium Stock characteristics, fisheries and management of Greenland halibut (Reinhardtius hippoglossoides (Walbaum)) in the Northeast Arctic by Kjell H. Nedreaas (IMR) &
The 10 th Norwegian Russian Symposium Stock characteristics, fisheries and management of Greenland halibut (Reinhardtius hippoglossoides (Walbaum)) in the Northeast Arctic by Kjell H. Nedreaas (IMR) &
Advice June Sole in Division IIIa and Subdivisions (Skagerrak, Kattegat, and the Belts)
") 6.3.26 Advice June 2014 ECOREGION STOCK North Sea Sole in Division IIIa and Subdivisions 22 24 (Skagerrak, Kattegat, and the Belts) Advice for 2015 ICES advises on the basis of the MSY approach that catches
6.3.26 Advice June 2014 ECOREGION STOCK North Sea Sole in Division IIIa and Subdivisions 22 24 (Skagerrak, Kattegat, and the Belts) Advice for 2015 ICES advises on the basis of the MSY approach that catches
New Zealand Fisheries Assessment Research Document 98/21. Not to be cited without permission of the authork) Malcolm Clark
 Malcolm Clark") Not to be cited without permission of the authork) New Zealand Fisheries Assessment Research Document 98/21 A summary of commercial catch and effort information for orange roughy (Hoplostethus atlanticus)
Not to be cited without permission of the authork) New Zealand Fisheries Assessment Research Document 98/21 A summary of commercial catch and effort information for orange roughy (Hoplostethus atlanticus)
SOUTH PACIFIC COMMISSION. TWENTY-SECOND REGIONAL TECHNICAL MEETING ON FISHERIES (Noumea, New Caledonia, 6-10 August 1990)
") Page 1 ORIGINAL : ENGLISH SOUTH PACIFIC COMMISSION TWENTY-SECOND REGIONAL TECHNICAL MEETING ON FISHERIES (Noumea, New Caledonia, 6-10 August 1990) STOCK STATUS OF SKIPJACK TUNA IN THE WESTERN TROPICAL
Page 1 ORIGINAL : ENGLISH SOUTH PACIFIC COMMISSION TWENTY-SECOND REGIONAL TECHNICAL MEETING ON FISHERIES (Noumea, New Caledonia, 6-10 August 1990) STOCK STATUS OF SKIPJACK TUNA IN THE WESTERN TROPICAL
EU request to ICES on in-year advice on haddock (Melanogrammus aeglefinus) in Division 7.a (Irish Sea)
 in Division 7.a (Irish Sea)") ICES Special Request Advice Celtic Seas Ecoregion Published 1 March 2017 EU request to ICES on in-year advice on haddock (Melanogrammus aeglefinus) in Division 7.a (Irish Sea) Advice summary Please note:
ICES Special Request Advice Celtic Seas Ecoregion Published 1 March 2017 EU request to ICES on in-year advice on haddock (Melanogrammus aeglefinus) in Division 7.a (Irish Sea) Advice summary Please note:
NAFO/ICES PANDALUS ASSESSMENT GROUP MEETING OCTOBER An overview of Norwegian investigations of the shrimp stock off East Greenland in
 NOT TO BE CITED WITHOUT PRIOR REFERENCE TO THE AUTHOR(S) Northwest Atlantic Fisheries Organization Serial No. N5595 NAFO SCR Doc. 08/063 NAFO/ICES PANDALUS ASSESSMENT GROUP MEETING OCTOBER 2008 An overview
Preliminary results of SEPODYM application to albacore. in the Pacific Ocean. Patrick Lehodey
 SCTB15 Working Paper ALB-6 Preliminary results of SEPODYM application to albacore in the Pacific Ocean Patrick Lehodey Oceanic Fisheries Programme Secretariat of the Pacific Community Noumea, New Caledonia
SC5-Doc13. The European Annual Report. Irek Wojcik, Ad Corten
 5 th Meeting of the Scientific Committee Shanghai, China 23-28 September 2017 SC5-Doc13 The European Annual Report Irek Wojcik, Ad Corten National report of the European Union to the 2017 SPRFMO Scientific
REPORT OF ICES ADVISORY COMMITTEE NORTH ATLANTIC SALMON STOCKS. NORTH ATLANTIC SALMON CONSERVATION ORGANIZATION NEAC Area
 REPORT OF ICES ADVISORY COMMITTEE ON NORTH ATLANTIC SALMON STOCKS TO NORTH ATLANTIC SALMON CONSERVATION ORGANIZATION NEAC Area CNL(14)8 Advice generated by ICES in response to terms of reference from NASCO
Red Sea bream in Subareas VI, VII and VIII
 Stock Annex; Red Sea bream in Subareas VI, VII and VIII Stock specific documentation of standard assessment procedures used by ICES. Stock sbr-678_sa Working Group Red Sea bream (Pagellus bogaraveo) in
1. SPECIES DETAILS. Common Name or Names by Which the Species is Known [EPBC Regulation (b)]:
![1. SPECIES DETAILS. Common Name or Names by Which the Species is Known [EPBC Regulation (b)]:](/thumbs/90/103290341.jpg "1. SPECIES DETAILS. Common Name or Names by Which the Species is Known [EPBC Regulation (b)]:") Nomination to list the Rexea solandri, Gemfish (Eastern population) as Endangered under the Environment Protection and Biodiversity Conservation Act, 1999. 1. SPECIES DETAILS Scientific Name of the species
Nomination to list the Rexea solandri, Gemfish (Eastern population) as Endangered under the Environment Protection and Biodiversity Conservation Act, 1999. 1. SPECIES DETAILS Scientific Name of the species
By far the majority of New Zealand s fisheries are performing well
 The Status of New Zealand s Fisheries 214 February 215 Introduction This report summarises the status of New Zealand s fish stocks relative to the requirements of the Harvest Strategy Standard for New
Haddock, Iceland, ICES Va, Danish Seine
 Haddock, Iceland, ICES Va, Danish Seine Haddock, Iceland, ICES Va, Danish Seine Content last updated 2nd Aug 2017 Stock: Haddock in the Iceland grounds (ICES Division Va) Management: Iceland Overview Haddock
ICES Advice on fishing opportunities, catch, and effort Celtic Seas and Greater North Sea Ecoregions Published 24 October 2017
 ICES Advice on fishing opportunities, catch, and effort Celtic Seas and Greater North Sea Ecoregions Published 24 October 2017 DOI: 10.17895/ices.pub.3334 Seabass (Dicentrarchus labrax) in divisions 4.b
5. purse seines 3 000
 Sea Bass Q and A Latest News What have the 28 Member States decided on 2 July? The EU has today taken another step to protect sea bass. The 28 EU member states agreed to the Commission's proposal to increase
ICES Advice on fishing opportunities, catch, and effort Celtic Seas and Greater North Sea ecoregions Published 30 June 2016
 ICES Advice on fishing opportunities, catch, and effort Celtic Seas and Greater North Sea ecoregions Published 30 June 2016 5.3.57 Sea bass (Dicentrarchus labrax) in divisions 4.b c, 7.a, and 7.d h (central
Small pelagic fishery and research in Albania
 Small pelagic fishery and research in Albania Eqerem Kapedani Abstract Information on past and present small pelagic fishery and research in Albania is reported. Data on small pelagic fishery mostly targeting
Beaked redfish (Sebastes mentella) in subareas 1 and 2 (Northeast Arctic)
 in subareas 1 and 2 (Northeast Arctic)") ICES Advice on fishing opportunities, catch, and effort Arctic Ocean, Barents Sea, Faroes, Greenland Sea, Published 13 June 2017 Icelandic Waters, and Norwegian Sea Ecoregions DOI: 10.17895/ices.pub.3212
ICES Advice on fishing opportunities, catch, and effort Arctic Ocean, Barents Sea, Faroes, Greenland Sea, Published 13 June 2017 Icelandic Waters, and Norwegian Sea Ecoregions DOI: 10.17895/ices.pub.3212
University of Miami Rosenstiel School of Marine and Atmospheric Science. Billfish Research Program
 University of Miami Rosenstiel School of Marine and Atmospheric Science Billfish Research Program 2011-2013 UNIVERSITY OF MIAMI Billfish Science Laboratory: RESEARCH FOCUS Uses advanced remote sensing
SCIENTIFIC COMMITTEE THIRTEENTH REGULAR SESSION. Rarotonga, Cook Islands 9-17 August 2017
 SCIENTIFIC COMMITTEE THIRTEENTH REGULAR SESSION Rarotonga, Cook Islands 9-17 August 2017 Updating indicators of effort creep in the WCPO purse seine fishery WCPFC-SC13-2017/MI-IP-04 Graham Pilling 1, the
Report on Biology, Stock Status and Management of Southern Bluefin Tuna: 2017
 Attachment 11 Report on Biology, Stock Status and Management of Southern Bluefin Tuna: 2017 The CCSBT Extended Scientific Committee (ESC) updated the stock assessment and conducted a review of fisheries
NORTHERN SHRIMP ON THE EASTERN SCOTIAN SHELF (SFA 13-15)
") Canadian Science Advisory Secretariat Science Advisory Report 25/6 NORTHERN SHRIMP ON THE EASTERN SCOTIAN SHELF (SFA 13-15) Context The northern or pink shrimp, Pandalus borealis, is the only shrimp species
Canadian Science Advisory Secretariat Science Advisory Report 25/6 NORTHERN SHRIMP ON THE EASTERN SCOTIAN SHELF (SFA 13-15) Context The northern or pink shrimp, Pandalus borealis, is the only shrimp species