THE RELATIONSHIP BETWEEN GAIT BIOMECHANICS AND BODY MASS INDEX by Ann Marie Herring Tullock November, 2014
|
|
|
- Paulina Weaver
- 5 years ago
- Views:
Transcription
1 THE RELATIONSHIP BETWEEN GAIT BIOMECHANICS AND BODY MASS INDEX by Ann Marie Herring Tullock November, 2014 Director of Thesis: Paul DeVita, Ph.D. Major Department: Kinesiology Walking gait is one of the basic components of human movements. With the rising obesity epidemic and implied health complications, it is pertinent to examine the relationship between body mass index and the joint torques and powers at the hip, knee, and ankle joints required to produce gate. The purpose of this study was to identify the relationships between ground reaction forces, joint torques, and joint powers at the hip, knee, and ankle and BMI in a group of people with BMIs ranging from kg/m 2, while walking at a self-selected normal speed and at a safe self-selected maximum speed. We proposed a direct relationship between BMI and ankle torques and powers. Additionally, we proposed that hip and knee joint torques and powers would have a direct relationship to BMI up until approximately 35 kg/m 2 at which point individuals would begin to modulate their hip and knee joint torques and powers to mimic those used by healthy individuals. Gait biomechanics were collected for twenty-one healthy adults with BMI between 18 kg/m 2 and 44 kg/m 2 using an eight-camera Qualysis motion capture system and evaluated using Visual 3D. Each subject was tested while walking at a normal speed and a safe-maximum speed. The data showed a statistically significant relationship between maximum hip extensor torque at both a normal speed and a safe-maximum speed. No significant relationships were found between knee torques or powers and BMI. Maximum ankle plantarflexor torques and maximum positive ankle powers were found to
2 be significantly correlated with BMI for both speeds. Additionally, first and second maximum ground reaction forces and maximum braking and propulsive forces were found to be significantly correlated with BMI at both speeds. We were unable to fully evaluate the specific hypothesis due to an inadequate sample size however, our results suggest that further investigation may support the hypothesis. Additionally, our subject sample was largely skewed towards females. We intend to continue subject recruitment in order to wholly test our original hypothesis as well as evaluate possible differences between the gait biomechanics of Class III obese males and females.
3
4 The Relationship Between Gait Biomechanics and Body Mass Index A Thesis Presented to The Faculty of the Department of Kinesiology East Carolina University In Partial Fulfillment of the Requirements for The Masters of Science in Exercise and Sport Science Biomechanics Concentration By: Ann Marie Herring Tullock November, 2014
5 Ann Marie Herring Tullock, 2014
6 The Relationship of Gait Biomechanics and Body Mass Index by Ann Marie Herring Tullock APPROVED BY: DIRECTOR OF THESIS: Paul DeVita, PhD COMMITTEE MEMBER: Zachary Domire, PhD COMMITTEE MEMBER: John Willson, PhD, DPT COMMITTEE MEMBER: Patrick Rider, MA CHAIR OF THE DEPARTMENT OF KINESIOLOGY: Stacy Altman, JD DEAN OF THE GRADUATE SCHOOL: Paul J. Gemperline, PhD
7 Table of Contents List of Tables..v List of Figures vi Chapter 1: Introduction...1 Hypothesis 7 Purpose.7 Delimitations...8 Limitations...8 Chapter 2: Review of Literature.. 9 Influences of Obesity on Health Parameters 9 Gait Characteristics of Normal, Lean Adults and Obese Adults...15 Measurement Techniques in Gait Analysis...25 Summary Chapter 3: Methodology.. 32 Subject Characteristics...32 Equipment and Instruments...33 Procedures..34 Dual X-Ray Absorptiometry.36 Data Reduction Data Analysis.40
8 Chapter 4: Results 41 20m Walk Test and SF Isokinetic Strength Testing 42 Gait Biomechanics.44 Hip Joint.44 Knee Joint..46 Ankle Joint.48 Ground Reaction Forces 50 Summary 54 Chapter 5: Discussion..55 Development of Hypothesis Meter Walk Test and SF Isokinetic Strength.57 Correlation of Joint Torques and Powers with BMI..58 Summary...61 Bibliography. 64 Appendix A- East Carolina University, University and Medical Center Institutional Review Board Letter of Approval Appendix B- Health Survey (SF36).. 73
9 Appendix C- Information about SF-36 Health Status Scales and the Interpretation of Low and High Scores.77
10 List of Tables 1. Stride Characteristics Subject Characteristics Correlation of Body Segment Parameters with BMI and Total Body Mass Correlation of 20m Walk Time and SF-36 with BMI and Total Body Mass Mass Normalized Correlation of Ankle Torques and Powers with BMI Correlations with Covariates of Speed and Age Correlation of BMI and Hip Extensor Torque and Ankle Plantarflexor Torque...60
11 List of Figures 1. Moments of force at the ankle, knee, and hip Joint moment patterns for a young female walking at natural cadence Support moment for 12 normals walking at comfortable cadence Ground Reaction Forces for obese and normal weight subjects Net Muscle Moments Sagittal Plane Joint Torques Sagittal Plane Joint Powers Marker Configuration Hip Joint Moments Knee Joint Moments Ankle Joint Moments Correlation of Maximum Knee Extensor Torque at 60 /s and BMI Correlation of Maximum Knee Extensor Torque at 150 /s and BMI Correlation of Maximum Knee Flexor Torque at 60 /s and BMI Correlation of Maximum Knee Flexor Torque at 150 /s and BMI Correlation of Maximum Hip Extensor Torque and BMI at Self-Selected Normal Speed Correlation of Maximum Positive Hip Power and BMI at Self-Selected Normal Speed Correlation of Maximum Hip Extensor Torque and BMI at Safe-Maximum Speed
12 19. Correlation of Maximum Positive Hip Power and BMI at Safe-Maximum Speed Correlation of Maximum Knee Extensor Torque and BMI at Self-Selected Normal Speed Correlation of Maximum Negative Knee Power and BMI at Self-Selected Normal Speed Correlation of Maximum Knee Extensor Torque and BMI at Safe-Maximum Speed Correlation of Maximum Negative Knee Power and BMI at Safe-Maximum Speed Correlation of Maximum Ankle Plantarflexor Torque and BMI at Self-Selected Normal Speed Correlation of Maximum Positive Ankle Power and BMI at Self-Selected Normal Speed Correlation of Maximum Ankle Plantarflexor Torque and BMI at Safe-Maximum Speed Correlation of Maximum Positive Ankle Power and BMI at Safe-Maximum Speed Correlation of First Maximum Ground Reaction Force and BMI at Self-Selected Normal Speed Correlation of Second Maximum Ground Reaction Force and BMI at Self-Selected Normal Speed Correlation of Maximum Braking Force and BMI at Self-Selected Normal Speed...51
13 31. Correlation of Maximum Propulsive Force and BMI at Self-Selected Normal Speed Correlation of First Maximum Ground Reaction Force and BMI at Safe-Maximum Speed Correlation of Second Maximum Ground Reaction Force and BMI at Safe- Maximum Speed Correlation of Maximum Braking Force and BMI at Safe-Maximum Speed Correlation of Maximum Propulsive Force and BMI at Safe-Maximum Speed.52
14 Chapter 1: Introduction Walking gait is a basic component of human movement. Through locomotion, humans are able to move their body mass through space at a given velocity. Walking is characterized by the cycle of moving one lower limb through space while supporting oneself on the contralateral limb followed by a transfer of weight in order to swing the second limb (Murray, 1967). A stride cycle is characterized by the time between two successive heel strikes of the right or left foot (Murray, 1967). One stride cycle is comprised of a stance phase, when the foot is in contact with the floor, and a swing phase when the foot is moving through the air (Murray, 1967). Stride length can be defined as the distance between successive points of heel strike for a single foot (Murray, 1967). Step length is measured as the distance between the points of contact of the heel with the ground of the right foot followed by the point of contact of the left foot (Murray, 1967). Changes in gait patterns induced by obesity may be a factor for the development of many musculoskeletal disorders. For example, gait differences are exacerbated in obese individuals with low back pain compared to lean individuals with back pain. These subjects are seen to have reduced stability, prolonged stance, lower velocity, and shorter step length compared to both obese individuals with no back pain and lean individuals with back pain (Cimolin et al., 2011). Load carriage has a vast impact on the health of the human foot as well. Heel pad thickness and heel pad compressibility index are significantly greater in obese individuals with heel pain than normal weight individuals (Prichasuk et al., 1994). Increased body mass index is strongly correlated with an increased incident rate of knee osteoarthritis (Reijman et al., 2007). Individuals with knee osteoarthritis have
15 lower mean sagittal knee angular velocity as well as lower maximum sagittal plane knee extension velocity than healthy individuals. Affected individuals also have lower mean sagittal knee extension values for each leg with a greater decrease in the affected leg, less sagittal knee range of motion in the affected leg, and lower mean sagittal hip angular velocity than healthy individuals (Messier et al., 1992). The occurrence rate of knee osteoarthritis is proportional to the degree to which an individual is overweight (Tukker et al., 2008). A particularly strong association exists between obesity and osteoarthritis of the knee (Tukker et al., 2008). For each unit increase in BMI, individuals are 8% more likely to suffer from osteoarthritis or chronic knee pain (Tukker et al., 2008). Women exhibit a higher association between being overweight and suffering from knee osteoarthritis while overweight men have a higher affinity for hip osteoarthritis than women (Tukker et al., 2008). Being overweight not only increases the risk of developing osteoarthritis, but also increases the risk of decreased mobility in the general population as well as within the portion of the population suffering from osteoarthritis (Tukker et al., 2008). Joint torques are frequently used to describe human gait. Torques can be considered as the effect of forces exerted by a muscle crossing a joint (Vaughan, 1996). Magnitude and direction of joint torque can be estimated by examining the magnitude and direction of ground reaction forces (GRF) (Vaughan, 1996). This is done by multiplying the GRF and the perpendicular distance from its line of action to the joint center (Vaughan, 1996). Human gait is often divided into the phases of heel strike, foot flat, midstance, heel off, and toe off (Vaughan, 1996). In gait patterns of healthy, lean individuals, GRF passes anterior to the hip joint and posterior to the knee and ankle joints 2
16 just after heel strike leading to extensor torques at the hip and knee joints and dorsiflexor ankle torque (Vaughan, 1996). When the foot is flat on the ground, GRF is anterior to the hip, through the knee joint center, and anterior to the ankle joint center resulting in a large hip extensor torque, zero torque at the knee, and plantarflexor torque at the ankle (Vaughan, 1996). At midstance, GRF is reduced in magnitude and passes through the hip and anterior to the knee and ankle (Vaughan, 1996). During midstance, the hip torque is zero, knee torque is flexor, and a large lever arm at the ankle results in a large plantarflexor torque (Vaughan, 1996). When the heel leaves the ground, GRF are increased to a magnitude greater than body weight and passes posterior to the hip, posterior to the knee, and anterior to the ankle. At heel off the hip has a flexor torque, the knee has an extensor torque, and the ankle has a large plantarflexor torque (Vaughan, 1996). GRF magnitude is again decreased just before toe off and located posterior to the hip and knee and anterior to the ankle (Vaughan, 1996). Joint torques at toe off are in the same direction as heel off but smaller in magnitude (Vaughan, 1996). Obesity produces numerous variations in joint biomechanics during gait. General categorizations define moderate obesity as having a BMI between 30 kg/m 2 and 40 kg/m 2 and Class III obesity as having a BMI above 40 kg/m 2. Class III obese individuals walk with a larger support base accompanied by an increased forefoot abduction angle, shortened phases of swing and single support, increased double support, and a reduction in stride length (de Souza et al., 2005). Stance duration appears to be directly proportional to BMI with an extended duration as compared to lean individuals (Blaszczky et al., 2011). Ground reaction forces and torques are also closely related to 3
17 BMI. Obese individuals experience larger ground reaction forces and joint torques at the hip, knee, and ankle joints than normal weight individuals (Browning et al., 2007). Moderately obese individuals, characterized by Browning, et al. as having a mean BMI of 37 kg/m 2 for females and 34.1 kg/m 2 for males, walked with similar stride kinematics but altered kinetics as lean individuals (Browning et al., 2007). Stride length and stride frequency did not differ between moderately obese individuals and normal weight individuals (Browning et al., 2007). In these persons, ground reaction forces were larger in every direction. Moderately obese individuals had approximately 60% greater ground reaction forces than normal weight individuals (Browning et al., 2007). Joint torques of moderately obese individuals were proportionately larger at the hip, knee, and ankle joints compared to normal weight individuals (Browning et al., 2007). There is a mechanical relationship in which an increase in body mass leads to a concurrent increase in forces and torques (Browning et al., 2007; Sheehan et al., 2013). Moderately obese individuals show little adaptation to increased mass. Whereas there exists a linear relationship between gait biomechanics and level of obesity in lean to moderately obese individuals, there appears to be a nonlinear change in the gait biomechanics of Class III obese individuals, characterized as having a mean BMI of 42.3 kg/m 2 (DeVita et al., 2003). Class III obese individuals walked more slowly with shorter step lengths and exhibited significantly larger ground reaction forces than lean individuals. When walking at similar velocities, Class III obese individuals had a 5% shorter relative swing time and 3% longer relative stance time than lean individuals (DeVita et al., 2003). These obese individuals walked more erect with ~5º more hip extension throughout stance, ~8º less knee flexion in early stance, and ~4º less knee 4
18 flexion throughout stance compared to lean individuals (DeVita et al., 2003). In addition, Class III obese individuals were ~6º more plantarflexed throughout the stance phase and ~7º more plantarflexed at toe off than lean individuals (DeVita et al., 2003). Most importantly, joint torque and power patterns of Class III obese individuals were similar to those of normal weight individuals at the hip and knee and only varied in magnitude at the ankle joint (DeVita et al., 2003). This shift in hip and knee joint torques and power potentially creates an inverse relationship between joint torque and power and BMI in Class III obese individuals. Class III obese individuals used 89% more plantarflexor angular impulse which produced 61% more work at the ankle joint compared to the normal weight individuals (DeVita et al., 2003). Class III obese individuals adapted to their excessive mass by using more torque at the ankle to propel them upward and forward. The use of increased ankle torques and reduced hip and knee torques suggests the existence of a unique neuromuscular adaptation to obesity in Class III obese adults (DeVita et al., 2003). In summary, overweight to moderately obese individuals walk with similar kinematics as lean individuals, larger ground reaction forces, and joint torques proportional to their mass. There is a linear relationship between vertical ground reaction forces and sagittal plane joint torques with BMI; as BMI increases, ground reaction forces and joint torques increase. Obesity elicits mechanical adaptations in moderately obese individuals. The different adaptations seen in the Class III individuals suggest that these individuals make behavioral adaptations that enable them to alter the relationship between mass and hip and knee biomechanics in addition to mass driven adaptations at the ankle. Based on the reported gait biomechanics, it appears that these behavioral 5
19 adaptations may appear at BMI value between ~35 and ~45 kg/m 2. At this point, hip and knee biomechanics may become inversely proportional to BMI. In short, Class III obesity prompts behavioral changes in gait that are qualitatively different than obesity-induced changes. Alterations to gait patterns in obese individuals may contribute to an increased occurrence of disability. 6
20 Hypothesis It was hypothesized that there is a critical magnitude of obesity, as measured with Body Mass Index, above which humans walk with an inverse relationship between BMI and hip and knee joint torque and power. The expected results are: that BMI will be: 1) directly related to GRFs and ankle joint torque and power and 2) directly related to hip and knee joint torques and powers from BMI 20 to ~35 kg/m2 and indirectly related at higher BMI values. Purpose The purpose of this study is to identify the relationships between ground reaction forces, joint torques, and joint powers at the hip, knee, and ankle and BMI in a group of people with BMIs ranging from kg/m 2, while walking at a self-selected normal speed and at a safe self-selected maximum speed. 7
21 Delimitations 1. With the exception of obesity, all subjects will be apparently healthy, mobile adults with no history of neuromuscular, musculoskeletal, physiological, or neurological disability. 2. Individuals with previous surgery on the lower limbs will be excluded. 3. BMI will range from kg/m Age will range from years. 5. Analysis will be performed on the right lower extremity of all subjects. Limitations 1. Accuracy of health surveys 2. Accuracy of marker placement and 3D Motion Capture System 3. Accuracy of AMTI Force Plate 4. Subjects may adjust their normal gait patterns after marker placement and in an unfamiliar environment. 8
22 Chapter 2: Review of Literature The primary intent of this thesis is to determine the relationship between ground reaction forces, joint torques, and joint powers at the hip, knee, and ankle and BMI in individuals with BMI s ranging from kg/m 2. More specifically, it will attempt to determine at what level of obesity individuals begin to adjust their gait patterns as an adaptive technique to enable the transport of greater mass loads. This chapter will review literature with a focus on 1) the influence of obesity on health parameters, 2) gait characteristics of normal, lean adults and obese adults 3) techniques used to measure gait characteristics. Influences of Obesity on Health Parameters Obesity is a rising epidemic in developed countries as defined by having excess body fat. Body mass is commonly measured by mass in kilograms divided by height in square meters, otherwise known as body mass index (BMI) (Grundy et al., 2004). The Center for Disease Control classifies BMI under 18.5 kg/m 2 as underweight, kg/m 2 as normal weight, kg/m 2 as overweight, and 30.0 kg/m 2 and above as obese (CDC, 2011). Obesity has been further categorized based on incurred health risk. Body mass index ranging from kg/m 2 is considered class I obesity, kg/m 2 is class II, and over 40 kg/m 2 is class III (Flegal et al., 1998; Katzmarzyk et al., 2006). As an individual moves into higher obesity classification levels, their health risks are also increasing. Obesity contributes to a multitude of serious diseases, functional impairments, and a higher risk of mortality (Allison et al., 2008). Comorbidities of obesity include, but
23 are not limited to, diabetes, metabolic syndrome, cardiovascular disease, cancer, foot pain and osteoarthritis. Many developed countries are experiencing steady inclines in the proportion of obese adults. From 1991 to 2000 the prevalence of individuals who were overweight rose from 45% to 56.4% in the United States (Mokdad et al., 2001). Approximately thirtyeight million United States adults surveyed in 2000 were obese (Mokdad et al., 2001). The increase in obesity rates has been accompanied by an increase in the number of individuals with a BMI greater than 40 kg/m 2, growing from.9% in 1991 to 2.1% in 2000 (Mokdad et al., 2001). In 1991, only 4 states reported obesity rates greater than 15% with no states reporting a rate greater than 20% (Mokdad et al., 2001). However, by 2000, 22 states reported obesity rates of at least 20% (Mokdad et al., 2001). As obesity rates continue to rise in the United States and developed countries, disease prevalence and the cost of treatment can be expected to rise as well. Major health concerns are surfacing for developed countries as the prevalence of obesity continues to rise. Obesity is linked to a wide array of mortality factors that are contributing to these health concerns. Hypertension is the most common syndrome related to weight and obesity in men and women (Must et al., 1999). An increase in the prevalence of Type 2 Diabetes Mellitus, gallbladder disease, and osteoarthritis for both genders has also been reported. An elevated prevalence of coronary heart disease exists in men for class I obesity and in women for all three classes of obesity (Must et al., 1999). For nonsmokers with no disease history, mortality rates are the highest among the heaviest men and women. This includes a 40-80% higher risk of dying from cancer (Calle et al., 1999). 10
24 Hypertension is the condition most commonly associated with heart disease. The Women s Health Study demonstrated that as blood pressure levels increased, women displayed a higher rate of incidence of Type II diabetes (Conen et al., 2007).Obesity, however, can be considered as an independent risk factor for CVD. Cardiovascular disease includes coronary heart disease, myocardial infarction, angina pectoris, congestive heart failure, stroke, hypertension, and atrial fibrillation (Must, 1999; Klein, 2004). Sudden causes of death related to CVD in Class III obese patients include dilated cardiomyopathy, severe coronary atherosclerosis, cardiomegaly, hypoplastic coronary arteries, and pulmonary emboli (Duflou et al., 1995). Body weight can be used as a reliable predictor of the development of diabetes. Obesity is associated with an increase in inflammatory markers which is associated with insulin resistance (Klein et al., 2004). Increasing BMI levels had a significant effect on an increased risk of developing Type II diabetes (Conen et al., 2007). Type II diabetes is the condition in which the body does not produce adequate insulin or the insulin is not recognized by the cells (American Diabetes Association, 2009). Diabetes can lead to many life altering consequences such as deteriorating vision, nerve damage, and skin and foot sores that may ultimately lead to amputation. Type 2 diabetes and hypertension are closely linked diseases and are both aspects of metabolic syndrome (Mokdad et al., 1998). Increased waist circumference, and dyslipidemia are also characteristics of metabolic syndrome. Individuals who are afflicted with metabolic syndrome are at a times higher risk for suffering from coronary heart disease and stroke (Klein et al., 2004). 11
25 Furthermore, obesity is associated with pulmonary diseases such as asthma, chronic obstructive pulmonary disease, sleep disorders, hypoventilation syndrome, pulmonary thromboembolism, aspiration pneumonia and possible respiratory failure (McClean et al., 2008). Resta, et al. found that 51.5% of the obese population in their study had moderate to severe obstructive sleep apnea (Resta et al., 2001). The presence of this disorder often leads to loud snoring, restless sleep, daytime sleepiness, and headaches. These symptoms can lead to occupational and social harms (McClean et al., 2008). In addition to sleep disorders, obesity increases the severity of asthma (Shore, 2007). Moderate to severe asthma can greatly inhibit an individual s ability to perform physical activity and activities of daily living, potentially leading to an increase in obesity level and consequently reducing the quality of life. In addition to diabetes, hypertension, cardiovascular disease, and pulmonary disease, BMI is strongly related to the development of cancer. Reeves, et al. found that among women, there is a positive relationship between increasing BMI and risk for the following cancers: all cancers, adenocarcinoma of the esophagus, squamous cell carcinoma of the esophagus, pancreatic cancer, lung cancer postmenopausal breast cancer, endometrial cancer, kidney cancer, and leukemia (Reeves et al., 2007). Individuals with a BMI over 40 kg/m 2 have a 52 and 62 percent higher death rate from all cancers for men and women, respectively, when compared to normal weight adults. It is estimated that 14 percent of deaths caused by cancer in men and 20 percent of deaths in women caused by cancer are related to being overweight and obesity (Calle et al., 2003). Obesity can contribute to the development of mental disorders as well and is frequently related to major depressive disorder. Strine, et al. found that depression 12
26 severity is highly related to smoking, obesity, and physical inactivity. In addition, adults with a previous history of depression were more likely to smoke, to be obese, to be physically inactive, to binge drink and to drink heavily (Strine et al., 2008). While there has been no causal relationship discovered between obesity and depression, research shows that currently depressed individuals or those with lifetime diagnosis are 60% more likely to be obese and those with a lifetime diagnosis of anxiety are 30% more likely to be obese (Strine et al., 2008). Exercising and being physically active helps relieve symptoms of depression as well as serving to maintain current weight status or reduce obesity. While it seems that physical activity is often considered to cause obesity, it is possible that physical inactivity is a result of obesity and its limitations. Several musculoskeletal disorders which may inhibit physical activity and activities of daily living while concurrently reducing the quality of life are associated with obesity. Increased load carriage that results from elevated adiposity generates increased ground reaction forces as well as increased sagittal plane torque at the hip, knee, and ankle. This increase in ground reaction forces and sagittal plane torques may play a role in the higher prevalence of musculoskeletal disorders among the obese population. While there is much conflicting research, links between obesity and foot pain in the plantar fascia and the plantar fat pad may exist (Prichasuk et al., 1994). Excessive load carriage may be the mechanism responsible for causing plantar fascia pain by producing more stress on the medial longitudinal arch (Prichasuk et al. 1994). In normal individuals, the fat pad is highly elastic and compressible, lending to its function of shock absorption and cushion during gait (Prichasuk et al., 1994). Overweight individuals with foot pain showed a higher level of heel-pad thickness and less heel-pad elasticity which 13
27 may, inherently, lead to a decreased level of shock absorption and cushion (Prichasuk et al., 1994). A more definitive link has been identified between obesity and knee osteoarthritis. Knee osteoarthritis is exacerbated by the additional load carriage that results from obesity. Body mass index greater than 25 kg/m 2 is linked to having a more constant frontal plane knee adduction moment during the stance phase of gait (Harding et al., 2012). Obese individuals, classified as having a BMI greater than 30 kg/m 2, have lower sagittal plane knee extension moment magnitudes and smaller transverse plane knee rotation moments than their normal weight peers (Harding et al., 2012). Osteoarthritis results in a lower mean sagittal plane knee extension value for both the affected and unaffected legs. The affected leg, however, generally has a lower sagittal plane range of motion than the unaffected leg (Messier et al., 1992). Osteoarthritis also leads to a reduction in sagittal plane knee flexion in affected individuals compared to healthy individuals (Messier et al., 1992). Osteoarthritis patients have lower mean sagittal plane knee velocity than individuals free from osteoarthritis (Messier et al., 1992). Greater loading rates of the knee are found in individuals afflicted with osteoarthritis as well (Messier et al., 1992). Obesity appears to induce changes in gait mechanics which may ultimately result in the development of knee osteoarthritis. 14
28 Gait Characteristics of Normal, Lean Adults and Obese Adults While gait appears to be a simple task for the healthy individual, it is an aspect of human movement defined by a myriad of characteristics. Defining components include stride length, stride frequency, stance phase, swing phase, and double support phase. Common measurements also include joint biomechanics such as joint angles, ground reaction forces, and torque and power created at the joints of the hip, knee, and ankle. The movement of the lower limbs during the swing phase requires various muscle moments across the hip, knee, and ankle joints. During the first half of swing phase, inertial load is positive and the shank of the leg is in extension (Winter et al., 1978). Approximately 80% of the moment required to propel the shank is the result of forward deceleration of the knee joint and gravitational forces (Winter et al., 1978). The forward deceleration of the knee joint is a result of extensor deceleration at the hip (Winter et al, 1978). Inertial loads are reversed during the second half of swing phase as the shank decelerates (Winter et al., 1978). Eighty percent of this deceleration is caused by the muscle moments (Winter et al., 1978). Plantarflexors are the predominate muscle group activated during push-off (Winter et al., 1978). Hip flexors are the primary energy producers during the early portion of the swing phase (Winter et al., 1978). Deceleration of the leg is caused by absorption of energy by the hip extensors and knee flexors (Winter et al., 1978). A passive flow of energy from the foot and shank to the thigh and trunk is responsible for the final deceleration of the leg (Winter et al., 1978). During weight acceptance, stored energy from the trunk is transferred across the hip and knee and then absorbed by knee extensors and ankle dorsiflexors (Winter et al., 1978). 15
29 The function of the lower limb during stance phase is to resist collapse and to extend sufficiently to achieve the required push-off (Winter, 1980). Flexion at all three joints of the lower limb would result in collapse during the stance phase; therefore support of the body requires net extensor activity at these joints (Winter, 1980). Figure one demonstrates the muscle moments of the lower limb joints. Fig. 1. Moments of force at the ankle, knee, and hip during stance, with extensor moments shown. Convention has counter-clockwise moment acting at proximal end of any segment as being positive. Ms is the total extensor moment acting on the lower limb segments. (Winter, 1980) When one joint opposes or does not contribute to lower limb support one or both of the remaining joints will compensate for the non-contributing joints (Winter, 1980.) This theme is demonstrated by the variability between a young female walking at a natural 16
30 cadence (Figure 2) and an average of net supporting moment, Ms, of 12 normal subjects (Figure 3). Fig. 2. Joint moment patterns for a young female walking at natural cadence (Winter, 1980) 17
31 Fig. 3. Support moment, Ms, for 12 normals walking at comfortable cadence. Basic pattern shows a peak of support during weight acceptance followed by a second peak during late push-off (Winter, 1980) Support during stance is achieved by a net extensor pattern. Therefore, kinetic assessments of gait should examine the total limb (Winter, 1980). Massive weight loss, such as that produced by weight loss surgery, results in gait adjustments of obese individuals. Patients who lost 33% of their body mass have shown increases in swing time, longer strides, and faster walking speeds. These patients also showed an increase in hip range of motion in the swing phase as well as maximal knee flexion in early stance and a 40.5% shift of ankle joint function toward plantarflexion at a self-selected speed (Hortobagyi et al., 2011). Reductions in the first peak of vertical ground reaction force decreased 30.0% after massive weight loss (Hortobagyi et al., 2011). Massive weight loss appears to produce simple mass-related adaptations in gait mechanics as well as mechanical plasticity in the form of a reorganization of lower extremity joint torques (Hortobagyi et al., 2011). Obese individuals have approximately 60% greater ground reaction forces than their normal weight counterparts at all speeds (Browning et al., 2007). Vertical and anteroposterior GRF both increase in proportion to body mass. Mediolateral GRF 18
32 displays a much larger increase than would be predicted based on body mass (Browning et al., 2007). This disproportion is potentially attributable to the larger step width seen in the obese individuals. The second medial peak formed when body mass is shifted to the contralateral stance leg does not decrease at a slower speed (Browning et al., 2007). Diminutions in speed may be an adequate method to prevent musculoskeletal injury in obese individuals while walking. Reduced speeds result in smaller magnitudes of the first peak of vertical GRF despite having a smaller effect on the second peak vertical GRF. For example, vertical GRF peaks were reduced 15 and 6% when walking at 1.0 ms -1 versus 1.5 ms -1 (Browning et al., 2007). For both obese and normal weight individuals, peak anteroposterior GRF is approximately 40% smaller at 1.0 ms -1 than 1.5 ms -1. The first peak of mediolateral GRF in obese individuals decreased by 23% when velocity was reduced from 1.5 ms -1 to 1.0 ms -1 (Browning et al., 2007). Figure 4 depicts the variations in GRF between obese and normal weight individuals at 1.5 ms -1 and obese individuals at six different speeds. 19
33 Fig.4. Mean vertical (A), anteroposterior (B), and mediolateral (C) ground-reaction forces (GRF) while walking at 1.5 ms -1 for the obese vs. normal-weight subjects, and vertical (D), anteroposterior (E), and mediolateral (F) GRF for the obese subjects walking at each speed. The cartoon in panel C shows the orientation of the mediolateral GRF relative to the foot. Compared with normal-weight subjects, the obese subjects had greater GRF, but in both groups GRF were smaller at the slower walking speeds (Browning et al., 2007). Absolute net muscle moments (Figure 5) are also greater in obese individuals than normal weight individuals and are reduced with slower walking velocities (Browning, 2007). Peak hip extensor moment was significantly greater in obese individuals than normal weight individuals at all speeds except 0.75 ms -1 and peak extensor knee moments were significantly greater at 1.75 ms -1 (Browning et al., 2007). Peak knee extension moment was reduced by 43% when obese individuals walked at 1.0 ms -1 rather than 1.5 ms -1 (Browning et al., 2007). 20
34 Fig. 5. Mean hip (A), knee (B), and ankle (C) net muscle moments during stance while walking at 1.5 ms -1 for the obese vs. normal-weight subjects, and hip (D), knee (E), and ankle (F) net muscle moments during stance for the obese subjects walking at each speed. Positive moments are extensor. Stance begins at right heel strike. Compared with normal-weight subjects, the obese subjects had greater net muscle moments, but in both groups net muscle moments were smaller at the slower walking speeds (Browning et al., 2007). At a standard speed of 1.5 ms -1, normal weight individuals walk with a stride length of approximately 1.49 m and an approximate frequency of 1.01 Hz. For the same individuals, 61.5% of the gait cycle was spent in the stance phase, 38.5% of the cycle was spent in swing phase, and 21.8% of the cycle was spent in double support phase. Stride width was found to be about 30% greater in obese subjects than lean subjects (Browning et al., 2007). Additional research shows similar findings of stride frequency, stance phase, and swing phase (DeVita et al., 2003). Table 1 demonstrates these findings. 21
35 Stride Length (m) Stride Frequency (Hz) Stance (% Cycle) Swing (% Cycle) O NW O NW O NW O NW Browning, et al DeVita, et al Table 1. Stride Characteristics of Obese and Normal Weight Individuals at a Standard Speed of 1.5 ms -1 While Browning and Kram found no difference between lean and obese individuals for stride length and stride frequency, their results did demonstrate that obese individuals spent longer times in stance phase and double support phase and less time in swing phase. Stride length and frequency for both groups increased as speed increased. Stance phase time and double support phase time are inversely related to speed while swing phase time and gait speed are positively related (Browning et al., 2007). Separate research has shown that obese individuals walk with a 7% shorter step length and 11% lower step rate while walking at a 16% slower self-selected velocity than normal weight individuals (DeVita et al., 2003). At this velocity, obese individuals had a 3% shorter relative swing phase and a 2% longer relative stance phase (DeVita et al., 2003). Precise, biomechanical differences of gait between normal weight individuals and moderately obese individuals have not been definitively defined. However, adaptations have been noted as individuals move from a level of moderate obesity into Class III obesity. Normal weight adults and moderately obese adults ambulate with no significant differences in joint angles of the hip, knee, and ankle (Browning et al., 2007). At slower speeds, both normal weight and moderately obese adults extend more at the hip and knee are generally more extended, whereas the ankle is more plantarflexed during stance and more dorsiflexed during swing (Browning et al., 2007). On the contrary, there is a 22
36 difference in angular joint position between the normal weight and Class III obese individuals. Class III obese individuals increase knee flexion in early stance by 12% and ankle plantarflexion at toe off by 11% to increase velocity (DeVita et al., 2003). Obese individuals were found to be more erect, demonstrating approximately 5º more hip extension throughout stance phase, approximately 8º less knee flexion in early stance, and approximately 4º less knee flexion throughout the entire stance phase (DeVita et al., 2003). These individuals were approximately 6º more plantarflexed throughout stance phase and approximately 7º more plantarflexed at toe off than normal weight individuals (DeVita et al., 2003). Obese individuals increased their extensor angular impulse at the knee by 17% and plantarflexor angular impulse at the ankle by 12% (DeVita et al., 2003). At a standard speed of 1.5 ms -1, these larger impulses produced 68% more negative work at the knee in early stance and 11% more positive work at the ankle throughout stance while hip torque and power were not different than that of normal weight individuals (DeVita et al., 2003). Subjects used 89% more plantarflexor angular impulse that produced 61% more work at the ankle joint (DeVita et al., 2003). 23
37 Fig. 6. Sagittal plane joint torques during the stance phase for obese (self-selected speed: solid line; standard speed: dashed line) and lean (dotted line) participants. Positive values are extensor or plantarflexor and negative values are flexor or dorsiflexor torques. Obese and lean had equivalent knee extensor angular impulses in early stance (area under curve from B10% to B40% of stance) at the standard speed and obese had less angular impulse at the slower, self-selected speed. Obese had larger ankle plantarflexor torque compared to lean at the same speed and larger torque in the faster, standard speed compared to the self-selected speed. Hip torques were equivalent in all conditions. Support toque was larger in obese compared to lean and larger in early stance at the faster compared to slower speeds in obese (DeVita et al., 2003). Fig. 7.Sagittal plane joint power during the stance phase for obese (self-selected speed: solid line; standard speed: dashed line) and lean (dotted line) participants. Positive values indicate energy generation through concentric contractions and negative values indicate energy absorption through eccentric contractions. Obese and lean had equivalent power at the hip and knee joints at the same walking speed but less knee power at the slower speed. Obese had larger ankle power at the faster compared to slower speeds and compared to lean at the same speed. Total power was larger in obese compared to lean, due mostly to differences in ankle power (DeVita et al., 2003). Obese individuals walked with greater torques than normal weight individuals. This increase in torque was a byproduct of greater GRF while walking with similar joint kinematics (Browning et al., 2007). While obese individuals walked with similar stride characteristics to normal weight individuals, they displayed a linear increase in ground reaction forces, joint torques, and BMI (Browning et al., 2007). There is a qualitative, 24
38 behavioral change in gait, potentially mass related, that occurs in Class III obese individuals at an unidentified cut-off point as defined by BMI (DeVita et al., 2003). This change results in a gait pattern which elicits a more erect gait with torque and power at the hip and knee being nearly identical to that of normal weight individuals yet larger plantarflexor torque and power at the ankle (DeVita et al., 2003). Measurement Techniques in Gait Analysis Gait is measured using motion capture systems and force plates. While there are many ways to collect three-dimensional kinematics, modern three-dimensional motion capture utilizes infrared markers and a camera tracking system to record the movement of an individual s joints and segments in space. Three-dimensional systems allow wide array of research including the computation of joint angles and the location of joint centers. Force plates are used to measure many different types of forces. This thesis will examine the use of a force plate to measure vertical ground reaction forces during gait. While three-dimensional analysis can give us 3D coordinates of body segments in space, the simultaneous use of force plates allows the acquisition of force vectors and ground reaction forces during movement as well. In the 1930 s, Herbert Elftman was able to utilize a force plate to examine the muscle function in a human leg while walking (Elftman, 1948). Elftman was able to show that the application of ground reaction forces is initially placed on the foot in an upward and backward pattern followed by an upward and forward pattern (Elftman, 1948). The use of ground reaction forces and the point of its application combined with video images of the displacement of the body over time allow the study of kinetics of the leg without the necessity of considering the entire body. 25
39 Elftman also stated that his methods of determining the instantaneous value of the forces and torques acting on each part of the leg allows the calculation of the sum of the torques exerted by the muscles on the foot, shank, and thigh (Elftman, 1948). Joint torques are frequently estimated using the process of inverse dynamics. Forces inside our joints and torques produced by muscles are calculated using ground reaction forces and body positions coupled with anthropometric characteristics. In the 1930 s, Elftman also used inverse dynamics to calculate the torque of one-joint muscles and, although they are not actually present in the lower limb, create a model of three-joint muscles (Elftman, 1939). Free body diagrams are created to represent body segments under investigation. These models allow the association of positional and inertial properties (Cappozzo et al., 1984). Positional properties convey the information needed to locate a segment at any point in time in reference to an arbitrarily chosen observer. An observer is defined by a local coordinate system rigid with the segment and a global coordinate system rigid with the observer (Cappozzo et al., 1984). Stereometric techniques allow the determination of the instantaneous position of points fixed in a moving segment and, therefore, allow simple vector calculations of the segment transformation matrix and position vector (Cappozzo et al., 1984). These techniques require target points that can be represented by skin markers. The majority of modern marker placement sets are based from the Helen Hayes model (Kadaba et al., 1990). This system was designed using minimal markers to simplify the identification of marker trajectories. The selected marker positions were chosen to satisfy rigid body assumptions (Kadaba et al., 1990). In the Helen Hayes marker system, two markers were placed on the right and left anterior superior iliac 26
40 spines, one marker was placed on a stick 10 cm long extending from the top of the sacrum in the spinal plane, and one marker is also placed on the greater trochanter, lateral malleolus, and the space between the second and third metatarsal heads (Kadaba et al., 1990). An additional cuff was positioned on the midthigh and another on the midshank with 7 cm long wands with markers attached at the tip (Kadaba et al., 1990). Fig. 8. Marker configuration and embedded coordinate systems (Kadaba et al., 1990). Lower limb joints work across all three planes during gait. The majority of motion occurs in the sagittal plane; however there is a significant amount of movement within the frontal plane as well. The hip experiences close to the same amount of torque in the frontal plane as in the sagittal plane but much less in the transverse plane. Subjects showed more frontal plane torque at the knee joint than the sagittal and transverse. The ankle joint demonstrated a much larger torque in the sagittal plane than either the frontal or the transverse (Eng et al., 1995). Figures 9-11 demonstrate these findings. These 27
41 results confirmed the necessity of testing gait in a three-dimensional model rather than a planar model (Eng et al., 1995). Fig. 9. Hip joint moments normalized to body mass in the frontal, transverse, and sagittal planes. The dashed line represents one standard deviation above and below the mean. (Eng et al., 1995) 28
42 Fig. 10. Knee joint moments normalized to body mass in the frontal, transverse, and sagittal planes. The dashed line represents one standard deviation above and below the mean. (Eng et al., 1995) 29
43 Fig. 11. Ankle joint moments normalized to body mass in the frontal, transverse, and sagittal planes. The dashed line represents one standard deviation above and below the mean. (Eng et al., 1995) 30
44 Summary Obesity has become an epidemic in well-developed countries. It is accompanied by health altering diseases including, but not limited to, cancer, cardiovascular disease, diabetes, and osteoarthritis (Allison et al., 2008). Osteoarthritis alone may create alterations in gait patterns. Obesity, as well as being a potential risk factor for osteoarthritis, yields its own characteristics that result in gait alterations. Gait is a complex movement pattern defined by such measurements as kinematics, joint biomechanics, and ground reaction forces. Obese individuals have been found to experience greater ground reaction forces and torques than normal weight individuals. Moderately obese individuals with a BMI of approximately 35 kg/m 2 walk with similar design as lean individuals while exerting higher ground reaction forces and joint torques (Browning et al., 2007). However, Class III obese individuals with a BMI closer to 45 kg/m 2, display similar joint angles at the hip and knee but more plantarflexion at the ankle than normal weight individuals. There appears to be a yet un-defined cut-off point, as defined by BMI, where obese individuals shift from a linear adaptation to body mass to a qualitative behavioral adaptation. Additional research is needed to determine what level of obesity triggers individuals to make a change in muscle activation to compensate for carrying a larger load. 31
45 Chapter 3: Methodology Subject Characteristics Twenty-one subjects were recruited for this study using newspaper ads and flyers located on the East Carolina University campus as well as in local businesses. The East Carolina University listserve was utilized to send announcements to faculty and staff. These s initially aimed at recruiting individuals of all BMI levels. During our study these s were resent periodically, targeting more specific BMI categories by specifying weight requirements such as weighing more than two hundred pounds. Flyers were also distributed to bariatric patients at Physicians East in Greenville, NC. Phone interviews were conducted to determine eligibility for the study. Inclusion criteria specified that subjects must be between the ages of 18 and 60 years old with a 20 kg/m 2 BMI 50 kg/m 2. Our goal was to recruit one subject per BMI unit for our target range. Despite our purposeful recruitment, we were unable to procure and subjects with a BMI above 44kg/m 2 and only a limited sample of subjects above a BMI of 37 kg/m 2. A BMI range of 18 kg/m 2 to 44 kg/m 2 characterized our final subject sample. In order to participate in this study, subjects were required to be apparently healthy with the exception of high BMI. Individuals were excluded if they had any neurological, musculoskeletal, neuromuscular, or physiological disabilities. Previous surgeries to the lower limbs were also considered as exclusion criteria. Qualifying subjects were required to sign a written informed consent form (see Appendix) before participating. We tested subjects evenly distributed within the range of body mass indexes between 18 kg/m 2 and 44 kg/m 2. Table 2 represents subject characteristics.
. A copy of this form can be located in the Appendix.")
46 Table 2: Subject Characteristics Equipment and Instruments A phone interview was used to determine eligibility. Subjects also completed the SF-36. This 8-scale, 36 question short-form health survey was used to assess physical and mental health (Ware et al., 1992). A copy of this form can be located in the Appendix. A timed 20m walking trial was conducted in a hallway to evaluate functional capabilities. Quadriceps strength was evaluated with isokinetic strength testing using a HUMAC Norm, isokinetic dynamometer (Computer Sports Medicine, Inc, Ma) at 60º sec -1 and 150º sec -1. Strength testing was performed to investigate whether the 33
47 hypothesized non-linear relationship between BMI and gait mechanics was mirrored by such a relationship between BMI and strength. Biomechanical gait analyses were performed using a 15 m level walkway instrumented with an AMTI force plate used to collect ground reaction forces (AMTI Model LG-6, Newton, MA). Ground reaction forces were measured at 960 Hz and a gain of Gait kinematic and kinetic data were recorded with the use of eight Qualisys ProReflex MCU 240 cameras (Qualisys Medical AB, Gothenburg, Sweden) at 120 Hz. An infrared timing system was used to control for the walking speed of each subject (Brower timing system, model IRD-T175, Salt Lake City, Utah). Data were collected using Qualisys Track Manager Software (Innovision Systems Inc., Columbiaville, MI) and analyzed using Visual 3D (C-Motion Inc., Rockwille, MD). Height and mass for all subjects were measured using a Seca 703 scale (Seca gmbn & Co.kg, Hamburg, Germany). Procedures Participants were tested on two occasions for approximately 45 minutes on day 1 and approximately an hour and 20 minutes on day 2. Testing was conducted in the Biomechanics Laboratory, room 332 of Ward Sports Medicine Building, East Carolina University, Greenville, NC. Before participation, subjects were required to read and sign an informed consent form. All data were collected while subjects were wearing tight fitting athletic style shorts and tennis shoes. On day 1, subjects completed a functional test. This was comprised of a timed 20m walk in a hallway. Upon successful completion, subjects were isokinetically tested 34
48 for quadriceps strength using the HUMAC isokinetic dynamometer. Velcro straps were used to stabilize the torso and thigh. Subjects were given a warm-up period to habituate themselves with the equipment and protocol. The input axis of the dynamometer was aligned with the knee joint. The right leg was tested for each subject with five trials at an angular velocity of 60ºsec -1 and five trials at an angular velocity of 150ºsec -1. The maximum peak torques for extension and flexion at each angular velocity were used for analysis. Subjects returned to the lab approximately three days after strength testing. DXA scans were performed in the East Carolina University F.I.T.T. Laboratory. Upon return to the Biomechanics Laboratory, reflective markers were placed on the subject using a Helen Hayes set-up. Fifteen individual markers and three marker plates were situated on the participants in the following manner: individual markers were placed on the right foot on the first and fifth metatarsal heads, heel, and medial and lateral malleoli, a three marker plate was used on the superior aspect of the right foot, a four marker plate was attached to the shank, individual markers were placed on the medial and lateral femoral condyles, a four marker plate was attached to the thigh, individual markers were used to identify the right and left greater trochanters, right and left ASIS, right and left PSIS, and right and left iliac crests for a 5 second static calibration. During this calibration trial, subjects stood stationary in the center of the collection field with feet shoulder width apart and arms crossed over the chest. After the static calibration, the markers of the metatarsals, malleoli, knee, greater trochanters, and iliac crests were removed. This modified marker-setup was used for a static calibration trial as well as all movement trials. 35
49 Subjects were allowed to practice walking along the walkway to obtain the correct speed. These practice trials also served as a tool for subjects to become comfortable in the environment and to reduce anxiety. Subjects were never instructed to walk at a specific speed. Instructions for the self-selected, normal pace included being instructed to walk at a pace the subject would use when walking to work or an appointment. This created an intentional self-selected speed during which the subjects walked as if they were heading some place. When walking at a safe-maximum speed, subjects were instructed to walk as fast as possible without feeling as though they were going to run or fall. Five trials were collected at a self-selected speed and five trials were collected at a safemaximum walking speed. Subjects were never instructed to strike the force plate while walking. Trials in which the participant s right foot did not fully contact the force plate or the left foot contacted the plate were discarded. Any trials in which participants made noticeable changes to their gait were also discarded. Participants were given the opportunity to rest between trials if needed. Dual X-Ray Absorptiometry Dual x-ray absorptiometry (DXA) was used to obtain subject specific body segment inertial parameters (BSIPs). We conjectured that as obesity increases, variations in body segment mass, as a percentage of total body mass, would produce meaningful differences in BSIPs and, in turn, alter lower extremity joint torques. The largest torque variations were expected at the hip joint and knee joint. We failed to identify a significant correlation however between BMI and percent body mass of the pelvis, right thigh, or right shank. A significant correlation was identified between BMI and the right foot. Additionally, we were unable to find a significant correlation between total body mass 36

50 and percent body mass of the right thigh or right shank. A significant correlation was found between total body mass and percent body mass of the pelvis and the right foot. The DXA procedure altered the thigh relative weighting by +4.09% but had relatively small differences for the pelvis, shank, and foot. The relationships between segment mass and BMI were low and nonsignificnat overall. However in more obese individuals, a difference was found between the segment masses found using the DXA and the standard segment measure typically utilized. Therefore, we applied this DXA method to all subjects. These data are presented in Table 4. Table 3. Body Segment Parameters Correlation with BMI and Total Body Mass, * p < 0.05 Data Reduction Data from each subject were processed using Qualisys Track Manager Software which provided data in the global coordinate system (GCS) for all subjects and trials. Position data were obtained for each subject with respect to the coordinate system of the Biomechanics Laboratory. QTM identified markers by anatomical location and correct trajectories after gaps for missing data have been filled. Files were exported to Visual 3D after filling gaps for marker fallout. A linked rigid-segment system was used to build a 37
51 model of the lower extremity. A static standing trial, known as a calibration trial, was performed for each subject. This trial was used to create an individualized model per subject enabling the location of joint centers, location of the segment center of mass, definition of the local coordinate system of each segment (LCS), and location of the reflective markers in the coordinate system. Joint centers were located at fifty percent of the distance between the medial and lateral calibration markers for knee and ankle joints. The hip joint was located twenty five percent of the distance between the right and left greater trochanters. A pipeline was used for signal processing. A low pass digital filter was used with cutoff frequencies of marker positions (6 Hz), analogs (45 Hz), ground reaction forces (45Hz), center of pressure (45 Hz), and free moments (45 Hz). The analysis then produced for each trial: stride length, walking velocity and joint angular positions and velocities of the hip, knee and ankle. Joint positions, gait velocity, stride length, and stride velocity of the segments or joints are referred to as the kinematics of gait. Angular positions and velocities of the hip, knee, and ankle joints were calculated using a series of commands in Visual 3D. Joint torques were processed with a second low pass filter at 10 Hz. This second filter removed noise that is seen at initial heel strike. Joint angular displacements were calculated to find joint position data. Calculation of the angle between two adjacent segments allowed for the calculation of angular displacement. Joint angular displacement (θ) was calculated using the difference of the initial (θ i ) and final (θ f ) joint angular positions. (θ) = θ f θ i (1) Velocities were calculated using joint angular displacement per unit of time. 38
52 Ω i = (θ i+1 + θ i-1 )/(2*Δt) (2) Joint torques and powers were then calculated at the ankle, knee, and hip using the following procedures. Joint torque was calculated by first obtaining joint reaction forces (JRF) at the ankle using the following equation where segment mass is m, acceleration of the segment center of mass is a cm, gravity force vector is mg, and ground reaction force is f grf : JRF ankle = ma cm mg f grf (3) Joint torques (JM) were then found using the following equation: JM Ankle = Iα (d1 * JRF Ankle ) (d2 * F GRF ) t (4) Where I is the moment of intertia, α is angular acceleration, d1 * JRF Ankle describes the moment as a result of JRF, d2 * F GRF is described from the GRF, and t is the ground reaction torque. This equation was then reversed with JRF replacing GRF, shifting ground reaction forces, torques, center of pressure, force on the segment due to gravity (mg), segment center of mass accelerations (ma cm ), proximal (JM Prox ) and distal (JM Distal ) moment arms, and proximal (JRF Prox ) and distal (JRF Distal ) joint center locations into the local coordinate system in order to solve for the knee and hip. These equations are represented as the following: JRF Prox = ma cm mg JRF Distal (5) JM Prox = Iα (d1 * F JRF_Prox ) (d2 * F JRF_Distal ) JM Distal (6) 39
53 Data Analysis Scores on the SF-36 and 20 m functional walking test were correlated with BMI. A correlation was measured between mass and peak isokinetic knee torque using the data from the HUMAC. Relationships between peak vertical ground reaction forces, peak hip, knee, and ankle joint torques, and peak hip, knee and ankle joint powers with respect to BMI were analyzed using Pearson Product Moment Correlation and regression analyses. Linear regressions were fitted to vertical ground reaction force, peak hip, knee, and ankle joint torques, and peak hip, knee, and ankle joint powers. Significance was tested at the p <.05 level. Variables found to have a significant correlation with BMI were further evaluated by normalizing to mass. This additional analysis allowed the assessment of the relationship as being mass, or BMI, driven as opposed to being driven by an unknown variable. For our subject sample, the correlation of BMI and mass was 0.885, this strong correlation supports the idea of normalizing for mass. The allowed variance of age and speed among participants could influence an identified relationships between joint torques and powers and ground reaction forces with BMI. Therefore, the relationships between BMI and our evaluated variables were explored after removing variation due to either walking speed or age. 40
54 Chapter 4: Results The primary hypothesis of this study was that there is a critical magnitude of obesity, as measured with Body Mass Index, above which humans make behavioral adaptations to their walking biomechanics. It was speculated that these behavioral adaptations enable Class III obese individuals to modulate hip and knee torques and powers to values exhibited by lean individuals while simultaneously increasing torque and power at the ankle despite having excessive body mass and ground reaction forces. This chapter presents the gait biomechanics of healthy adults with BMI values between 20 kg/m 2 and 44kg/m 2 tested at a self-selected normal speed and a self-selected safe maximum speed. We originally proposed to test people with BMIs up to 50 kg/m 2, but we were unable to recruit individuals above 44 kg/m 2. The final sample size was 21 participants. The purpose of this study was to identify the relationships between ground reaction forces, joint torques, and joint powers at the hip, knee, and ankle and BMI in a group of people with BMIs ranging from kg/m 2, while walking at a self-selected normal speed and at a safe self-selected maximum speed. Dual x-ray absorptiometry was used to calculate the percent of body mass for the pelvis, right thigh, right shank, and right foot. Isokinetic concentric knee flexion and extension were tested using a HUMAC isokinetic dynamometer. 20 Meter Walk Test and SF-36 A timed 20 meter (m) walk test and the SF-36 were used to assess the physical competency of subjects. The mean and standard deviation for the timed 20m walk were 13.7s ± 1.8s. Significant correlations were found between walk time and BMI as well as

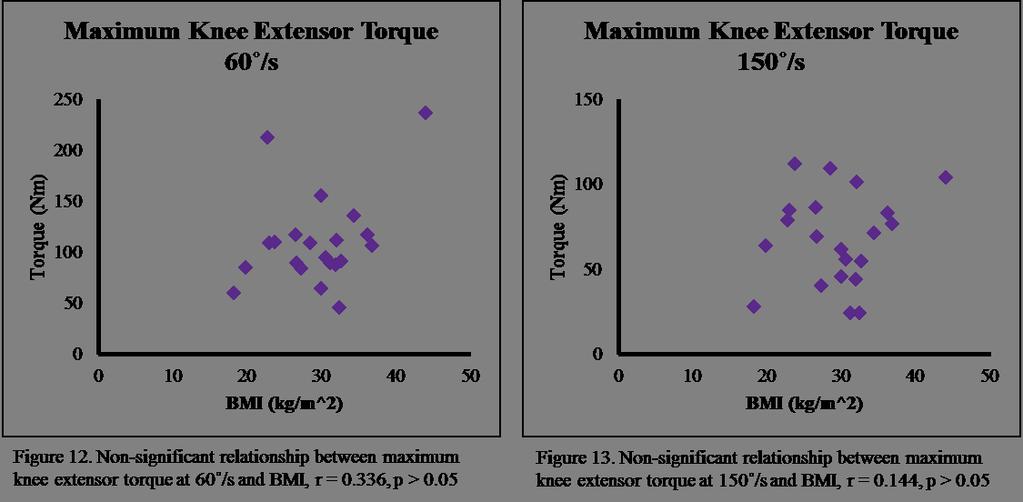
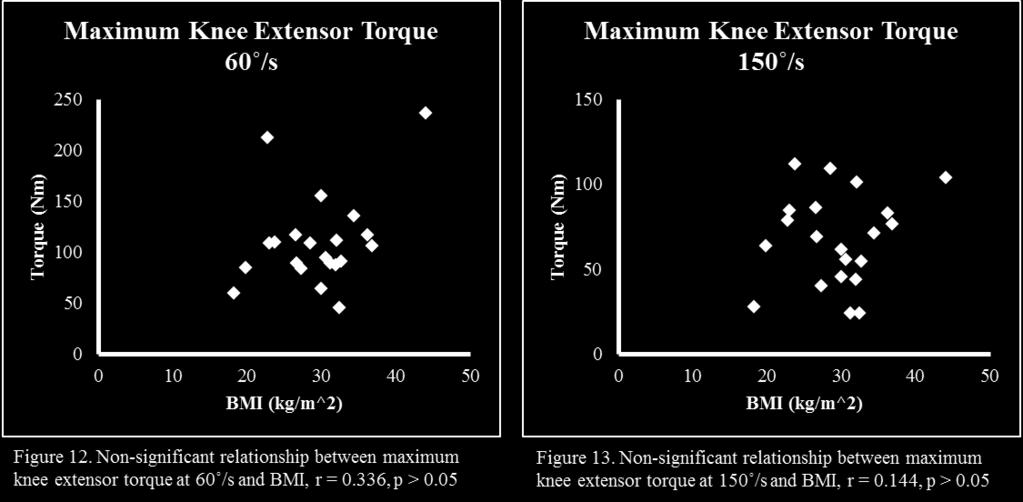
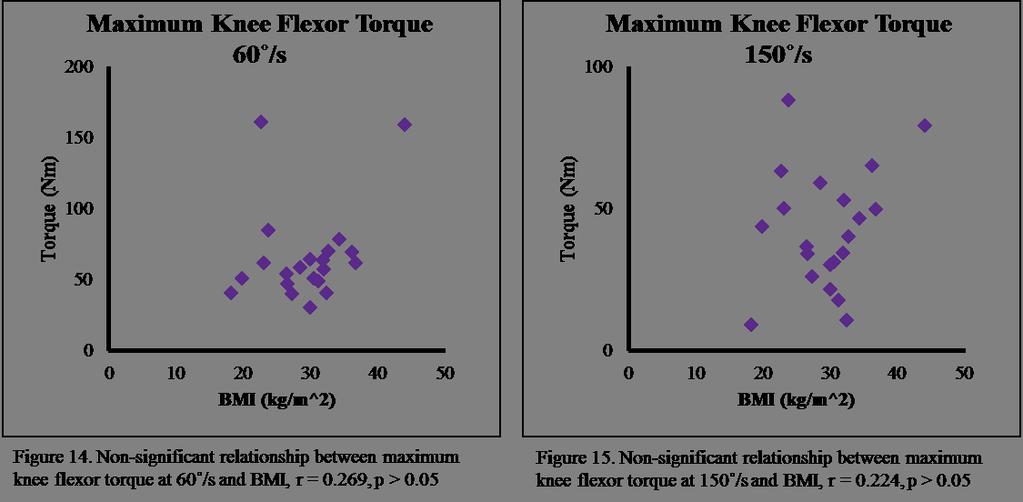
55 walk time and total body mass. The average physical competence score (PCS) and mental competence scores (MCS) were 53.6 and 53.8, respectively, with standard deviations of 53.1 and 6.8. No significant correlations were found between PCS or MCS and BMI. These data are presented in Table 3. Table 4. 20m Walk Test and SF-36 Results and Correlation with BMI and Total Body Mass, *p < 0.05 Isokinetic Strength Testing Right leg knee flexor and extensor strength were tested isokinetically at 60 /s and 150 /s using a HUMAC isokinetic dynamometer. These data were used to assess any changes in strength associated with BMI and total body mass. We failed to identify a significant correlation for any condition at the p < 0.05 level. These data are presented in Figures 12 through
56 43
57 Gait Biomechanics The purpose of this study was to identify the relationships between ground reaction forces, joint torques, and joint powers at the hip, knee, and ankle and BMI while walking at a self-selected normal speed and at a safe self-selected maximum speed for healthy adults with BMI s ranging from kg/m 2. Due to recruitment difficulties, only one subject with a BMI above 40 kg/m 2 was included in this data set. Hip Joint We expected to find a curvilinear relationship between hip joint torques and powers and BMI. More specifically, we expected to see an increase in torques and powers as BMI increased to some BMI at ~35 kg/m 2 after which point, torques and powers would decrease and begin to mimic those seen in normal weight individuals. At the self-selected speed, maximum hip extensor torque was found to be significantly correlated with BMI. We failed to identify a significant correlation between maximum positive power at the hip joint and BMI while subjects ambulated at their selfselected normal speed. These data are depicted in Figures 16 and 17. The significant relationship between maximum hip extensor torque and BMI at the self-selected speed was further evaluated by normalizing to mass. This produced a non-significant correlation with r = The lack of a significant relationship after normalizing for mass verifies the relationship is, indeed, mass driven opposed to being driven by unidentified variables. 44
58 Similar results were found at the hip joint with subjects walking at a safemaximum speed. A significant correlation was found between maximum hip extensor torque and BMI at a safe-maximum speed. We failed to find a significant relationship between maximum positive hip power and BMI at a safe-maximum speed. These data are shown in Figures 18 and 19. Additional analysis with mass normalization found a nonsignificant relationship between maximum hip extensor torque and BMI at the safemaximum speed, indicating the relationship between hip extensor torque and BMI is mass driven. 45

59 Knee Joint We expected to find a similar result at the knee joint as expected at the hip joint. It was hypothesized that knee joint torques and powers would increase to a BMI of approximately 35 kg/m 2 and then begin to decrease and mimic the torques and powers of normal weight individuals as BMI continued to increase. Our subject sample failed to present a significant relationship between knee joint extensor torque and maximum negative knee joint power at the self-selected speed. These data are presented in Figures 20 and


60 Additionally, we failed to find a significant relationship between maximum knee extensor torque and maximum negative knee power at the safe-maximum speed, seen in figures 22 and
61 Ankle Joint We hypothesized that the ankle joint torques and powers would be directly correlated to BMI in a linear fashion throughout the entire range of BMI. Significant correlations were found at the ankle joint between maximum plantarflexor torque and BMI as well as between maximum positive ankle power and BMI at the self-selected normal speed. These data are presented in Figures 24 and 25. Additional significant correlations were found between maximum peak ankle plantarflexor torque and BMI as well as maximum positive ankle power and BMI at the safe-maximum speed, seen in Figures 26 and

62 Correlations of maximum ankle plantarflexor torque and BMI as well as the correaltions of maximum ankle positive power and BMI at both speeds were further evaluated using mass normalization. All correlations were found to be non-significant. These values are presented in Table 4. The lack of a significant relationship after normalizing for mass suggests that the relationships between ankle torque and BMI and ankle power and BMI are mass driven. Correlation with BMI at Self-Selected Speed Correlation with BMI at Safe-Maximum Speed Maximum Ankle Plantarflexor Torque Maximum Ankle Positive Power Table 5. Mass Normalized Correlation of Ankle Torques and Powers with BMI, *p<
63 Ground Reaction Force Similar to ankle joint biomechanics, we expected to find a direct, linear relationship between BMI and ground reaction forces for the entire range of BMI. At the self-selected speed, first maximum and second maximum ground reaction forces were found to be significantly correlated with BMI. Both braking and propulsive forces were also found to be significantly correlated with BMI at the self-selected speed. These data are represented in Figures 28 through 31. At the self-selected speed, additional analysis of mass normalized correlations showed non-significant relationships between first maximum vertical ground reaction force, maximum braking force, and maximum propulsive force and BMI. These non-significant correlations indicate the relationships between ground reaction forces and BMI are mass driven. A significant correlation was found between second maximum vertical ground reaction force in the opposite direction with r= This change in direction of correlation at a significant level confirms the correlation between second maximum vertical ground reaction force and BMI at the selfselected speed is mass driven. 50


64 First maximum and second maximum vertical ground reaction forces were both significantly correlated with BMI at the safe-maximum speed. Additionally, both maximum braking and maximum propulsive forces were significantly correlated with BMI at the safe-maximum speed. These data are depicted in Figures 32 through 35. Evaluation of these correlations was further explored by normalizing for mass. The results closely mimicked those at the self-selected speed. All correlations were non- 51


65 significant when normalized for mass with the exception of second maximum ground reaction force. This correlation was significant in the opposite direction with r= These results indicate the correlations of ground reaction forces and BMI at the safemaximum speed are mass driven relationships. 52
Effects of Wider Step Width on Knee Biomechanics in Obese and Healthy-Weight Participants During Stair Ascent
 University of Tennessee, Knoxville Trace: Tennessee Research and Creative Exchange Masters Theses Graduate School 12-2016 Effects of Wider Step Width on Knee Biomechanics in Obese and Healthy-Weight Participants
Normal and Abnormal Gait
 Normal and Abnormal Gait Adrielle Fry, MD EvergreenHealth, Division of Sport and Spine University of Washington Board Review Course March 6, 2017 What are we going to cover? Definitions and key concepts
HOW DO WE ACCELERATE WHILE RUNNING? Daniel J. Schuster. April 2015
 HOW DO WE ACCELERATE WHILE RUNNING? by Daniel J. Schuster April 2015 Director of Thesis: Dr. Paul DeVita Major Department: Kinesiology Running biomechanics are well established in terms of lower extremity
Normal Gait and Dynamic Function purpose of the foot in ambulation. Normal Gait and Dynamic Function purpose of the foot in ambulation
 Normal Gait and Dynamic Function purpose of the foot in ambulation Edward P. Mulligan, PT, DPT, OCS, SCS, ATC Assistant Professor; Residency Chair UT Southwestern School of Health Professions Department
Do Thigh Circumference and Mass Changes Associated With Obesity Alter Walking Biomechanics?
 University of Tennessee, Knoxville Trace: Tennessee Research and Creative Exchange Masters Theses Graduate School 5-2011 Do Thigh Circumference and Mass Changes Associated With Obesity Alter Walking Biomechanics?
The Influence of Load Carrying Modes on Gait variables of Healthy Indian Women
 The Influence of Load Carrying Modes on Gait variables of Healthy Indian Women *Guha Thakurta A, Iqbal R and De A National Institute of Industrial Engineering, Powai, Vihar Lake, Mumbai-400087, India,
ASSESMENT Introduction REPORTS Running Reports Walking Reports Written Report
 ASSESMENT REPORTS Introduction Left panel Avatar Playback Right Panel Patient Gait Parameters Report Tab Click on parameter to view avatar at that point in time 2 Introduction Software will compare gait
Gait. Kinesiology RHS 341 Lecture 12 Dr. Einas Al-Eisa
 Gait Kinesiology RHS 341 Lecture 12 Dr. Einas Al-Eisa Definitions Locomotion = the act of moving from one place to the other Gait = the manner of walking Definitions Walking = a smooth, highly coordinated,
Gait Analyser. Description of Walking Performance
 Gait Analyser Description of Walking Performance This brochure will help you to understand clearly the parameters described in the report of the Gait Analyser, provide you with tips to implement the walking
Purpose. Outline. Angle definition. Objectives:
 Disclosure Information AACPDM 69 th Annual Meeting October 21-24, 2015 Speaker Names: Sylvia Õunpuu, MSc and Kristan Pierz, MD Gait Analysis Data Interpretation: Understanding Kinematic Relationships Within
The Starting Point. Prosthetic Alignment in the Transtibial Amputee. Outline. COM Motion in the Coronal Plane
 Prosthetic Alignment in the Transtibial Amputee The Starting Point David C. Morgenroth, MD, Department of Rehabilitation Medicine University of Washington VAPSHCS Outline COM Motion in the Coronal Plane
Current issues regarding induced acceleration analysis of walking using the integration method to decompose the GRF
 Current issues regarding induced acceleration analysis of walking using the integration method to decompose the GRF George Chen May 17, 2002 Stanford Neuromuscular Biomechanics Lab Group Muscle contribution
Assessments SIMPLY GAIT. Posture and Gait. Observing Posture and Gait. Postural Assessment. Postural Assessment 6/28/2016
 Assessments 2 SIMPLY GAIT Understanding movement Evaluations of factors that help therapist form professional judgments Include health, palpatory, range of motion, postural, and gait assessments Assessments
An investigation of kinematic and kinetic variables for the description of prosthetic gait using the ENOCH system
 An investigation of kinematic and kinetic variables for the description of prosthetic gait using the ENOCH system K. OBERG and H. LANSHAMMAR* Amputee Training and Research Unit, University Hospital, Fack,
-Elastic strain energy (duty factor decreases at higher speeds). Higher forces act on feet. More tendon stretch. More energy stored in tendon.
. Higher forces act on feet. More tendon stretch. More energy stored in tendon.") As velocity increases ( ) (i.e. increasing Froude number v 2 / gl) the component of the energy cost of transport associated with: -Internal kinetic energy (limbs accelerated to higher angular velocity).
As velocity increases ( ) (i.e. increasing Froude number v 2 / gl) the component of the energy cost of transport associated with: -Internal kinetic energy (limbs accelerated to higher angular velocity).
INTERACTION OF STEP LENGTH AND STEP RATE DURING SPRINT RUNNING
 INTERACTION OF STEP LENGTH AND STEP RATE DURING SPRINT RUNNING Joseph P. Hunter 1, Robert N. Marshall 1,, and Peter J. McNair 3 1 Department of Sport and Exercise Science, The University of Auckland, Auckland,
A Biomechanical Approach to Javelin. Blake Vajgrt. Concordia University. December 5 th, 2012
 A Biomechanical Approach to Javelin Blake Vajgrt Concordia University December 5 th, 2012 The Biomechanical Approach to Javelin 2 The Biomechanical Approach to Javelin Javelin is one of the four throwing
Ankle biomechanics demonstrates excessive and prolonged time to peak rearfoot eversion (see Foot Complex graph). We would not necessarily expect
. We would not necessarily expect") Case Study #1 The first case study is a runner presenting with bilateral shin splints with pain and tenderness along the medial aspect of the tibia. The symptoms have increased significantly over the last
Case Study #1 The first case study is a runner presenting with bilateral shin splints with pain and tenderness along the medial aspect of the tibia. The symptoms have increased significantly over the last
CHAPTER IV FINITE ELEMENT ANALYSIS OF THE KNEE JOINT WITHOUT A MEDICAL IMPLANT
 39 CHAPTER IV FINITE ELEMENT ANALYSIS OF THE KNEE JOINT WITHOUT A MEDICAL IMPLANT 4.1 Modeling in Biomechanics The human body, apart of all its other functions is a mechanical mechanism and a structure,
GROUND REACTION FORCE DOMINANT VERSUS NON-DOMINANT SINGLE LEG STEP OFF
 GROUND REACTION FORCE DOMINANT VERSUS NON-DOMINANT SINGLE LEG STEP OFF Sara Gharabaghli, Rebecca Krogstad, Sara Lynch, Sofia Saavedra, and Tamara Wright California State University, San Marcos, San Marcos,
Joint Torque Evaluation of Lower Limbs in Bicycle Pedaling
 11th conference of the International Sports Engineering Association, ISEA 216 Delft University of Technology; July 12 th Joint Torque Evaluation of Lower Limbs in Bicycle Pedaling Hiroki Yamazaki Akihiro
video Outline Pre-requisites of Typical Gait Case Studies Case 1 L5 Myelomeningocele Case 1 L5 Myelomeningocele
 Outline Evaluation of Orthosis Function in Children with Neuromuscular Disorders Using Motion Analysis Outcomes Terminology Methods Typically developing Case examples variety of pathologies Sylvia Õunpuu,
Gait Analysis at Your Fingertips:
 Gait Analysis at Your Fingertips: Enhancing Observational Gait Analysis Using Mobile Device Technology and the Edinburgh Visual Gait Scale Jon R. Davids, MD; Shriners Hospitals for Children Northern California;
Steffen Willwacher, Katina Fischer, Gert Peter Brüggemann Institute of Biomechanics and Orthopaedics, German Sport University, Cologne, Germany
 P01-3 ID126 SURFACE STIFFNESS AFFECTS JOINT LOADING IN RUNNING Steffen Willwacher, Katina Fischer, Gert Peter Brüggemann Institute of Biomechanics and Orthopaedics, German Sport University, Cologne, Germany
Serve the only stroke in which the player has full control over its outcome. Bahamonde (2000) The higher the velocity, the smaller the margin of
 The higher the velocity, the smaller the margin of") Lower Extremity Performance of Tennis Serve Reporter: Chin-Fu Hsu Adviser: Lin-Hwa Wang OUTLINE Introduction Kinetic Chain Serve Types Lower Extremity Movement Summary Future Work INTRODUCTION Serve the
Lower Extremity Performance of Tennis Serve Reporter: Chin-Fu Hsu Adviser: Lin-Hwa Wang OUTLINE Introduction Kinetic Chain Serve Types Lower Extremity Movement Summary Future Work INTRODUCTION Serve the
EXSC 408L Fall '03 Problem Set #2 Linear Motion. Linear Motion
 Problems: 1. Once you have recorded the calibration frame for a data collection, why is it important to make sure the camera does not shut off? hat happens if the camera automatically shuts off after being
Posture influences ground reaction force: implications for crouch gait
 University of Tennessee, Knoxville From the SelectedWorks of Jeffrey A. Reinbolt July 14, 2010 Posture influences ground reaction force: implications for crouch gait H. X. Hoang Jeffrey A. Reinbolt, University
video Purpose Pathological Gait Objectives: Primary, Secondary and Compensatory Gait Deviations in CP AACPDM IC #3 1
 s in CP Disclosure Information AACPDM 71st Annual Meeting September 13-16, 2017 Speaker Names: Sylvia Ounpuu, MSc and Kristan Pierz, MD Differentiating Between, Secondary and Compensatory Mechanisms in
Diabetes and Orthoses. Rob Bradbury Talar Made
 Diabetes and Orthoses Rob Bradbury Talar Made Diabetes High prevalence disease 4-6% in UK (over 2.5 mill diagnosed and a further 0.5 ) 6+% in USA 40% in some parts of Middle East (may be higher in Indian
Does Changing Step Width Alter Lower Extremity Biomechanics During Running?
 University of Tennessee, Knoxville Trace: Tennessee Research and Creative Exchange Masters Theses Graduate School 5-2012 Does Changing Step Width Alter Lower Extremity Biomechanics During Running? Richard
Running Injuries in Adolescents Jeffrey Shilt, M.D. Part 1 Page 1
 Running Injuries in Adolescents Jeffrey Shilt, M.D. Chief Surgical Officer, The Woodlands, Texas Children's Hospital Associate Professor, Orthopedic and Scoliosis Surgery, Baylor College of Medicine Part
SECTION 4 - POSITIVE CASTING
 4-1 SECTION 4 - POSITIVE CASTING THE SHAPE OF THE SHELL IS DERIVED FROM THE SHAPE OF THE CAST Thermo-forming plastic for orthopedic intervention was originally developed at the University of California
The importance of physical activity throughout an individual's life is indisputable. As healthcare
 What to Expect When They re Expecting: A Look at Biomechanical Changes in Walking/Running During Pregnancy Jennifer Bruer-Vandeweert, Megan Hotchkiss, Jamie Kronenberg, Kristin Olson Dr. Rumit Singh Kakar,
REPORT. A comparative study of the mechanical and biomechanical behaviour of natural turf and hybrid turf for the practise of sports
 REPORT A comparative study of the mechanical and biomechanical behaviour of natural turf and hybrid turf for the practise of sports Addressed to: PSF - PALAU TURF Date: May 2015 Table of Contents SHEET
INTRODUCTION TO GAIT ANALYSIS DATA
 INTRODUCTION TO GAIT ANALYSIS DATA 1. Phases of gait a. Stance (% gc) i. Loading response (10%) ii. Mid- and terminal stance (%) iii. Pre-swing (10%) b. Swing (% gc) i. Initial swing ii. Mid-swing iii.
Spasticity in gait. Wessex ACPIN Spasticity Presentation Alison Clarke
 Spasticity in gait Clinicians recognise spasticity but the elements of spasticity contributing to gait patterns are often difficult to identify: Variability of muscle tone Observation/recording General
Coaching the Hurdles
 Coaching the Hurdles Monica Gary, Sprints & Hurdles Coach Purdue University Important components to consider in hurdle training: a. Rhythm for the hurdler is the primary concern for the coach -short rhythm
Supplementary Figure S1
 Supplementary Figure S1: Anterior and posterior views of the marker set used in the running gait trials. Forty-six markers were attached to the subject (15 markers on each leg, 4 markers on each arm, and
The Discus. By Al Fereshetian. Nature of the Event
 11 The Discus By Al Fereshetian Nature of the Event Because of the numerous diverse qualities necessary for success, the discus throw is one of the most complex events in all of track and field. Discus
Neurorehabil Neural Repair Oct 23. [Epub ahead of print]
![Neurorehabil Neural Repair Oct 23. [Epub ahead of print]](/thumbs/86/94477916.jpg "Neurorehabil Neural Repair Oct 23. [Epub ahead of print]") APPENDICE Neurorehabil Neural Repair. 2009 Oct 23. [Epub ahead of print] Segmental Muscle Vibration Improves Walking in Chronic Stroke Patients With Foot Drop: A Randomized Controlled Trial. Paoloni M,
APPENDICE Neurorehabil Neural Repair. 2009 Oct 23. [Epub ahead of print] Segmental Muscle Vibration Improves Walking in Chronic Stroke Patients With Foot Drop: A Randomized Controlled Trial. Paoloni M,
Biomechanics Sample Problems
 Biomechanics Sample Problems Forces 1) A 90 kg ice hockey player collides head on with an 80 kg ice hockey player. If the first person exerts a force of 450 N on the second player, how much force does
Gait analysis through sound
 Invited article Niigata Journal of Health and Welfare Vol. 15, No. 1 Gait analysis through sound Kaoru Abe Graduate School of Health and Welfare, Niigata University of Health and Welfare, Niigata, Japan
Biomechanics and Models of Locomotion
 Physics-Based Models for People Tracking: Biomechanics and Models of Locomotion Marcus Brubaker 1 Leonid Sigal 1,2 David J Fleet 1 1 University of Toronto 2 Disney Research, Pittsburgh Biomechanics Biomechanics
Coaching the Triple Jump Boo Schexnayder
 I. Understanding the Event A. The Run and Its Purpose B. Hip Undulation and the Phases C. Making the Connection II. III. IV. The Approach Run A. Phases B. Technical Features 1. Posture 2. Progressive Body
RUNNING SHOE STIFFNESS: THE EFFECT ON WALKING GAIT
 RUNNING SHOE STIFFNESS: THE EFFECT ON WALKING GAIT Stephen N Stanley, Peter J M c Nair, Angela G Walker, & Robert N Marshall Auckland Institute of Technology, Auckland, New Zealand University of Auckland,
As a physiotherapist I see many runners in my practice,
 When rubber meets road Mark Richardson reveals the story that our running shoes can tell us, and how it can help you avoid running injury at a glance This article: Shows you how to analyse the sole of
Myths and Science in Cycling
 Myths and Science in Cycling John McDaniel, PhD Kent State University Jim Martin, PhD - U of Utah Steve Elmer, PhD- Michigan Tech Who am I PhD in Exercise Physiology under Dr. Jim Martin at the University
Foot mechanics & implications on training, posture and movement
 Foot mechanics & implications on training, posture and movement Three Arches Three Arches These arches are not reciprocal. When the foot pronates ALL arches should fall. If the medial arch falls and the
The DAFO Guide to Brace Selection
 The DAFO Guide to Brace Selection Cascade Dafo believes... better mobility gives children a wider range of experiences, more success in the activities they choose, and ultimately more control over their
Chapter 1 - Injury overview Chapter 2 - Fit for Running Assessment Chapter 3 - Soft Tissue Mobilization... 21
 Table of Contents Introduction Chapter 1 - Injury overview... 6 Chapter 2 - Fit for Running Assessment... 13 Chapter 3 - Soft Tissue Mobilization... 21 Chapter 4 - Dynamic Warm-up... 28 Chapter 5 - Strengthening...
Running injuries - what are the most important factors
 Created as a free resource by Clinical Edge Based on Physio Edge podcast 59 with Greg Lehman, Tom Goom and Dr Christian Barton Get your free trial of online Physio education at Why do runners get injured?
+ t1 t2 moment-time curves
 Part 6 - Angular Kinematics / Angular Impulse 1. While jumping over a hurdle, an athlete s hip angle was measured to be 2.41 radians. Within 0.15 seconds, the hurdler s hip angle changed to be 3.29 radians.
Rugby Strength Coach. Speed development guide
 Rugby Strength Coach Speed development guide Outline Why do Newton's laws of motion matter? What is speed? The technique and physical demands of speed Speed training parameters Rugby specific speed training
A bit of background. Session Schedule 3:00-3:10: Introduction & session overview. Overarching research theme: CPTA
 A Cognitive-Biomechanical Perspective for the Management of Common Chronic Musculoskeletal Conditions Skulpan Asavasopon, PT, PhD Loma Linda University Christopher M. Powers, PT, PhD, FAPTA University
Running Gait Mechanics. Walking vs Running. Ankle Joint Complex Sagittal Plane. As speed increases, when has walking ended and running begun?
 Running Gait Mechanics Walking vs Running As speed increases, when has walking ended and running begun? Ankle Joint Complex Sagittal Plane 1 Ankle Joint Complex Sagittal Plane Pos. @FS 5 o DF Absorption
Palacký Univerzity in Olomouc Faculty of Physical Culture
 Project: Sophisticated biomechanic diagnostics of human movement Registration number: CZ.1.07/2.3.00/09.0209 Palacký Univerzity in Olomouc Faculty of Physical Culture Tento projekt je spolufinancován Evropským
Case Study: Chronic Plantar Heel Pain/Plantar Fasciopathy. CASE STUDY PRESENTATION by Resonance Podiatry and Gait Labs
 Case Study: Chronic Plantar Heel Pain/Plantar Fasciopathy CASE STUDY PRESENTATION by Resonance Podiatry and Gait Labs THE PATIENT 43yo female, professional netball umpire 6 month history right plantar
SIMULTANEOUS RECORDINGS OF VELOCITY AND VIDEO DURING SWIMMING
 Portuguese Journal of Sport Sciences. 6:supl. 2, 32-35, 2006 SIMULTANEOUS RECORDINGS OF VELOCITY AND VIDEO DURING SWIMMING Albert B. Craig 1, Budd Termin2, and David R. Pendergast 2 1University of Rochester,
Mobility Lab provides sensitive, valid and reliable outcome measures.
 Mobility Lab provides sensitive, valid and reliable outcome measures. ith hundreds of universities and hospitals using this system worldwide, Mobility Lab is the most trusted wearable gait and balance
Rules of Hurdling. Distance Between Hurdles
 The Hurdle Events Introduction Brief discussion of rules, safety practices, and talent demands for the hurdles. Examine technical and training considerations for the hurdle events. 100 Meter Hurdles for
Comparison of Kinematics and Kinetics During Drop and Drop Jump Performance
 schouweiler, hess UW-L Journal of Undergraduate Research XIII (21) Comparison of Kinematics and Kinetics During Drop and Drop Jump Performance Ryan Schouweiler, Karina Hess Faculty Sponsor: Thomas Kernozek,
USA Track & Field Heptathlon Summit- November
 USA Track & Field Heptathlon Summit- November 1994 1 I. Technical considerations in the sprint hurdles Practical Biomechanics For the 100m Hurdles By Gary Winckler University of Illinois A. General flow
Customized rocker sole constructions
 Customized rocker sole constructions German guidelines to improve results in daily practice Stief, Thomas Registered Association for the Encouragement of Research and Education Management in Orthopedic
SPRINTING CHARACTERISTICS OF WOMEN S 100 METER FINALS AT THE IAAF WORLD CHAMPIONSHOPS DAEGU 2011
 9:30-9:45 am Sang-Kyoon Park. Sprinting characteristics of women's 100 meter finals at the IAAF world championships Daegu 2011. (228) SPRINTING CHARACTERISTICS OF WOMEN S 100 METER FINALS AT THE IAAF WORLD
THREE DIMENSIONAL KINEMATICS OF THE DIRECT FREE KICK IN SOCCER WHEN OPPOSED BY A DEFENSIVE WALL
 THREE DMENSONAL KNEMATCS OF THE DRECT FREE KCK N SOCCER WHEN OPPOSED BY A DEFENSVE WALL E. W. Brown l, D. J. Wilson l, B. R. Mason l, J. Baker lyouth Sports nstitute Michigan State University East Lansing,
A comparison of gait biomechanics of flip-flops, sandals, barefoot and shoes
 Zhang et al. Journal of Foot and Ankle Research 2013, 6:45 JOURNAL OF FOOT AND ANKLE RESEARCH RESEARCH Open Access A comparison of gait biomechanics of flip-flops, sandals, barefoot and shoes Xiuli Zhang
EFFECTS OF SPEED AND INCLINE ON LOWER EXTREMITY KINEMATICS DURING TREADMILL JOGGING IN HEALTHY SUBJECTS
 BIOMEDICAL ENGINEERING- EFFECTS OF SPEED AND INCLINE ON LOWER EXTREMITY KINEMATICS DURING TREADMILL JOGGING IN HEALTHY SUBJECTS 73 LAN-YUEN GUO 1, FONG-CHIN SU 2, CHICH-HAUNG YANG 3, SHU-HUI WANG 3, JYH-JONG
AEROBIC GYMNASTICS Code of Points APPENDIX II Guide to Judging Execution and Difficulty
 FÉDÉRATION INTERNATIONALE DE GYMNASTIQUE FONDÉE EN 1881 AEROBIC GYMNASTICS Code of Points 2009 2012 DRAFT OCTOBER 2008 APPENDIX II Guide to Judging Execution and Difficulty Page 1 of 80 INTRODUCTION This
EXPERIMENTAL STUDY OF EXOSKELETON FOR ANKLE AND KNEE JOINT
 EXPERIMENTAL STUDY OF EXOSKELETON FOR ANKLE AND KNEE JOINT PROJECT REFERENCE NO. : 37S0925 COLLEGE : NEW HORIZON COLLEGE OF ENGINEERING, BANGALORE BRANCH : MECHANICAL ENGINEERING GUIDES : DR GANESHA PRASAD
Positive running posture sums up the right technique for top speed
 Positive running, a model for high speed running Frans Bosch positive running posture sums up the right technique for top speed building blocks in running: Pelvic rotation for- and backward and hamstring
Brian Snyder MD/PhD Children s Hospital Harvard Medical School
 Brian Snyder MD/PhD Children s Hospital Harvard Medical School Observe patient s gait pattern as walk into room Systematic musculoskeletal exam (range of motion, joint alignment while standing) Neurologic
Ball impact dynamics of knuckling shot in soccer
 Available online at www.sciencedirect.com Procedia Engineering 34 (2012 ) 200 205 9 th Conference of the International Sports Engineering Association (ISEA) Ball impact dynamics of knuckling shot in soccer
10/22/15. Walking vs Running. Normal Running Mechanics. Treadmill vs. Overground Are they the same? Importance of Gait Analysis.
 2 angle (deg) 1/22/1 Normal Running Mechanics Walking vs Running Irene Davis, PhD, PT, FACSM, FAPTA, FASB Director, Spaulding National Running Center Walking Periods of DOUBLE SUPPORT Running Periods of
The Effect of Military Load Carriage on Ground Reaction Forces. Technical Note. Stewart A Birrell 1 Robin H Hooper 1 Roger A Haslam 1
 The Effect of Military Load Carriage on Ground Reaction Forces Technical Note Stewart A Birrell 1 Robin H Hooper 1 Roger A Haslam 1 1 Department of Human Sciences, Loughborough University, Leicestershire,
Proposed Paralympic Classification System for Va a Information for National federations and National Paralympic Committees
 Proposed Paralympic Classification System for Va a Information for National federations and National Paralympic Committees Prepared by the research team Johanna Rosén, MSc, PhD student, member Paracanoe
Supplementary Figure 1 An insect model based on Drosophila melanogaster. (a)
") Supplementary Figure 1 An insect model based on Drosophila melanogaster. (a) Side and ventral images of adult female flies used to calculate the sizes of body and leg segments. Scale bar is 0.3 mm. Green,
Supplementary Figure 1 An insect model based on Drosophila melanogaster. (a) Side and ventral images of adult female flies used to calculate the sizes of body and leg segments. Scale bar is 0.3 mm. Green,
Sprinting: A Biomechanical Approach By Tom Tellez
 Sprinting: A Biomechanical Approach By Tom Tellez World class male sprinters stride approximately forty-three times for a 100 meter race. If a mechanical error costs one-one thousandth of a second per
Biomechanical Analysis of Race Walking Compared to Normal Walking and Running Gait
 University of Kentucky UKnowledge Theses and Dissertations--Kinesiology and Health Promotion Kinesiology and Health Promotion 2015 Biomechanical Analysis of Race Walking Compared to Normal Walking and
THE ANKLE-HIP TRANSVERSE PLANE COUPLING DURING THE STANCE PHASE OF NORMAL WALKING
 THE ANKLE-HIP TRANSVERSE PLANE COUPLING DURING THE STANCE PHASE OF NORMAL WALKING Thales R. Souza, Rafael Z. Pinto, Renato G. Trede, Nadja C. Pereira, Renata N. Kirkwood and Sérgio T. Fonseca. Movement
Biomechanical analysis of the medalists in the 10,000 metres at the 2007 World Championships in Athletics
 STUDY Biomechanical analysis of the medalists in the 10,000 metres at the 2007 World Championships in Athletics by IAAF 23:3; 61-66, 2008 By Yasushi Enomoto, Hirosuke Kadono, Yuta Suzuki, Tetsu Chiba,
PURPOSE. METHODS Design
 7 Murrary, M.P.; Sepic, S.B.; Gardner, G.M.; and Mollinger, L.A., "Gait patterns of above-knee amputees using constant-friction knee components," Bull Prosthet Res, 17(2):35-45, 1980. 8 Godfrey, C.M.;
ScienceDirect. Improvement of three-dimensional motion analyzer system for the development of Indonesian gait database
 Available online at www.sciencedirect.com ScienceDirect Procedia Manufacturing 2 (2015 ) 268 274 2nd International Materials, Industrial, and Manufacturing Engineering Conference, MIMEC2015, 4-6 February
Analysis of Gait Characteristics Changes in Normal Walking and Fast Walking Of the Elderly People
 IOSR Journal of Engineering (IOSRJEN) ISSN (e): 2250-3021, ISSN (p): 2278-8719 Vol. 08, Issue 7 (July. 2018), V (V) 34-41 www.iosrjen.org Analysis of Gait Characteristics Changes in and Of the Elderly
Joint Impact of Lower Extremities in Obese and Overweight Children. Jenny Patel and Benjamin Sweely Tickle College of Engineering November 16th, 2017
 Joint Impact of Lower Extremities in Obese and Overweight Children Jenny Patel and Benjamin Sweely Tickle College of Engineering November 16th, 2017 Impact 340 Million Children Aged 5-19 in 2016 World
Breaking Down the Approach
 Breaking Down the Approach Written by Andre Christopher Gonzalez Sunday, July 31, 2005 One of the biggest weaknesses of the two-legged approach is the inability of the athlete to transfer horizontal momentum
11/11/2012. Associations of Foot Forces and Pressures to Regional Foot Pain: The Framingham Foot Study. Acknowledgements & Disclosures
 11/11/2012 Associations of Foot Forces and Pressures to Regional Foot Pain: The Jody L. Riskowski, PhD, CSCS Institute for Aging Research (IFAR), Hebrew SeniorLife Harvard Medical School Boston, MA, USA
Athlete Profiling. Injury Prevention
 Athlete Profiling Injury Prevention Fraser McKinney Physiotherapist Special interest in: Basketball Athletics Race Walking Research Performance markers (screening / HR assessments / biomechanics) Athlete
Design and Evaluation of a Variable Resistance Orthotic Knee Joint
 Design and Evaluation of a Variable Resistance Orthotic Knee Joint Andrew Herbert-Copley Thesis submitted to the faculty of graduate and postdoctoral studies in partial fulfillment of the requirements
COMPARISON STUDY BETWEEN THE EFFICIENY OF THE START TECHNIQUES IN THE ROMANIAN COMPETITIVE SWIMMING
 Bulletin of the Transilvania University of Braşov Series IX: Sciences of Human Kinetics Vol. 6 (55) No. 1 2013 COMPARISON STUDY BETWEEN THE EFFICIENY OF THE START TECHNIQUES IN THE ROMANIAN COMPETITIVE
Colin Jackson's Hurdle Clearance Technique
 Colin Jackson's Hurdle Clearance Technique By Milan Čoh, Biomechanical Laboratory, Faculty of Sport, University of Ljubljana, Slovenia INTRODUCTION Colin Jackson is, uncontestedly, one of the greatest
Aeris Performance 2. Product Manual
 Aeris Performance 2 Product Manual Instructions The Aeris Performance 2 is designed to be maintenance free. The foot is water resistant; however, if the foot is submerged in water, the foot and foot shell
Biomechanics of Parkour: The Vertical Wall-Run Technique
 University of Colorado, Boulder CU Scholar Undergraduate Honors Theses Honors Program Spring 2015 Biomechanics of Parkour: The Vertical Wall-Run Technique Integrative Physiology, Peter.Lawson@Colorado.EDU
Gait analysis for the development of the biped robot foot structure
 Preprints of the 9th World Congress The International Federation of Automatic Control Cape Town, South Africa. August 4-9, 4 Gait analysis for the development of the biped robot foot structure Yusuke OGAWA
Kinematic and Spatiotemporal Analysis Between Sprint Drills and Maximal Sprinting
 Sacred Heart University DigitalCommons@SHU PTHMS Undergraduate Publications Physical Therapy & Human Movement Science Spring 2013 Kinematic and Spatiotemporal Analysis Between Sprint Drills and Maximal
KNEE JOINT FORCES IN RELATION TO GROUND SURFACE STIFFNESS DURING RUNNING. By Victoria Price May 2017
 KNEE JOINT FORCES IN RELATION TO GROUND SURFACE STIFFNESS DURING RUNNING Director of Thesis: Paul DeVita Major Department: Kinesiology By Victoria Price May 2017 Abstract: Running shoes and surfaces have
A Bio-inspired Behavior Based Bipedal Locomotion Control B4LC Method for Bipedal Upslope Walking
 1 A Bio-inspired Behavior Based Bipedal Locomotion Control B4LC Method for Bipedal Upslope Walking JIE ZHAO, QI LIU, STEFFEN SCHUETZ, and KARSTEN BERNS Robotics Research Lab, University of Kaiserslautern,
Ideal Heel Promotes proper alignment and reduces lever arms
 IDEAL Technologies Ideal Heel Promotes proper alignment and reduces lever arms The Ideal Heel is an innovation that shifts the ground contact point forward. The runner lands with more ground clearance
Sample Solution for Problem 1.a
 Sample Solution for Problem 1.a 1 Inverted Pendulum Model (IPM) 1.1 Equations of Motion and Ground Reaction Forces Figure 1: Scheme of the Inverted Pendulum Model (IPM). The equations of motion of this
30m Crouch Start. 100m Crouch Start. # of Steps
 Approach Run PRECEPTS RALPH LINDEMAN Head Men s and Women s Track & Field Coach US Air Force Academy Coaching Staff, USA Men s Team, 2004 Olympic Games, Athens, Greece Coaching Staff, USA Men s Team, 2007
to decrease this force without compromising alignment. Four methods of heel modification are frequently used to decrease destabilizing forces at heel
 The Influence of Heel Design on a Rigid Ankle-Foot Orthosis DAVID R. WIEST, M.S., R.P.T. 1 ROBERT L. WATERS, M.D. 2 ERNEST L. BONTRAGER, M.S.3 MICHAEL J. QUIGLEY, C.P.O. 4 In the past decade measurements