A 10-15year Modulation Cycle of ENSO Intensity
|
|
|
- Basil Fields
- 6 years ago
- Views:
Transcription
1 A 10-15year Modulation Cycle of ENSO Intensity Fengpeng Sun and Jin-Yi Yu Department of Earth System Science University of California, Irvine Irvine, California, USA Revised on July, 23 th, 2008 Submitted to Journal of Climate Corresponding author address: Dr. Jin-Yi Yu, Department of Earth System Science, University of California, Irvine, CA , USA.
2 ABSTRACT This study examines the slow modulation of El Niño-Southern Oscillation (ENSO) intensity and its underlying mechanism. A 10-15year ENSO intensity modulation cycle is identified from historical and paleoclimate data by calculating the envelope function of boreal winter Niño3.4 and Niño3 sea surface temperature (SST) indices. Composite analyses reveal interesting spatial asymmetries between El Niño and La Niña events within the modulation cycle. In the enhanced-intensity periods of the cycle, El Niño is located in the eastern tropical Pacific and La Niña in the central tropical Pacific. The asymmetry is reversed in the weakened-intensity periods: El Niño centers in the central Pacific and La Niña in the eastern Pacific. El Niño and La Niña centered in the eastern Pacific are accompanied with basin-scale surface wind and thermocline anomalies, while those centered in the central Pacific are accompanied with local wind and thermocline anomalies. The El Niño-La Niña asymmetries provide a possible mechanism for ENSO to exert a non-zero residual effect that could lead to slow changes in the Pacific mean state. The mean state changes are characterized by a SST dipole pattern between the eastern and central tropical Pacific, which appears as one leading EOF mode of tropical Pacific decadal variability. The Pacific Walker circulation migrates zonally in association with this decadal mode and also changes the mean surface wind and thermocline patterns along the equator. Although the causality has not been established, it is speculated that the mean state changes in turn favor the alternative spatial patterns of El Niño and La 2
3 Niña that manifest as the reversed ENSO asymmetries. Based on these findings, an ENSO-Pacific climate interaction mechanism is hypothesized to explain the decadal ENSO intensity modulation cycle. 3
4 1. Introduction El Niño-Southern Oscillation (ENSO) is known to undergo decadal (and interdecadal) variations in its frequency, intensity, and propagation pattern (e.g., Wang and Wang 1996; An and Wang 2000; Fedorov and Philander 2000; Timmermann 2003; An and Jin 2004; Yeh and Kirtman 2004). The decadal ENSO variability and its potential influences on global climate and weather have prompted extensive research (e.g., Torrence and Webster 1999; Power et al. 1999). Various hypotheses have been put forward to explain the origin of decadal ENSO variability. Initially, the decadal ENSO variability was suggested to be forced by extratropical processes (e.g., Barnett et al. 1999; Pierce et al. 2000) or arise from tropical-extratropical interactions (e.g., Gu and Philander 1997; Wang and Weisberg 1998; Zhang et al. 1998). More recent studies have suggested the decadal ENSO variability could originate internally within the tropics and does not require the involvement of extratropical processes (e.g., Knutson et al. 1997; Kirtman and Schopf 1998; Timmermann and Jin 2002; Timmermann 2003). The decadal ENSO variability was described as either an internal mode of the coupled atmosphere-ocean system in the tropics (e.g., Knutson et al. 1997; Kirtman and Schopf 1998; Timmermann and Jin 2002) or excited by stochastic forcing (e.g., Penland and Sardeshmukh 1995; Eckert and Latif 1997; Newman et al. 2003). Demonstrated with a simple model, Newman et al. (2003) and Newman (2007) further suggested that the decadal variability in the extratropics, such as the Pacific Decadal Oscillation (PDO, Mantua et al. 1997) could be forced by the decadal ENSO 4
5 variability via "atmospheric bridge" (Alexander et al. 2002). The observational study of Deser et al. (2004) also suggested that tropical Pacific plays a key role in North Pacific interdecadal climate variability. For the tropical-origin hypothesis, slow changes in the tropical Pacific mean state have been considered to account for the decadal ENSO variability. Modeling studies showed that ENSO amplitude is sensitive to mean thermocline depth (Zebiak and Cane 1987; Latif et al. 1993), mean zonal SST gradient (Knutson et al. 1997) and mean vertical structure of the upper ocean (Meehl et al. 2001). The recurrence frequency and growth rate of ENSO were shown to depend on these mean state properties in the equatorial Pacific (Fedorov and Philander 2000). Modeling studies (e.g., Kirtman and Schopf 1998) also showed ENSO dynamics could alternate between the delayed-oscillator (Suarez and Schopf 1988; Battisti and Hirst 1989) type and the stochastically forced type as the Pacific state changes and it leads to decadal variability in ENSO properties. More recently, the nonlinear ENSO dynamics and the interactions between ENSO and the Pacific mean state have been increasingly emphasized to explain the decadal ENSO variability. Timmermann and Jin (2002) used a low-order tropical atmosphere-ocean model to show changing the strength of zonal SST advection can alternate ENSO periods between biennial and 4-5 years and result in a slow amplitude modulation. By analyzing long-term coupled general circulation model (CGCM) simulations, Timmermann (2003) further suggested decadal ENSO modulation could also result from the nonlinear interactions between 5
6 ENSO and the Pacific background state. Rodgers et al. (2004) and An and Jin (2004) pointed out that ENSO has strong nonlinearity that can cause asymmetries between its warm (El Niño) and cold (La Niña) phases. Rodgers et al. (2004) analyzed long-term integration of ECHOG-G model and found the decadal ENSO variability contributes to the structure of the tropical Pacific decadal variability in the model, resulting from the asymmetry between the model s El Niño and La Niña. Sun and Zhang (2006) conducted numerical experiments with and without ENSO using a coupled model to show ENSO works as a basin-scale mixer to regulate the time-mean thermal stratification in the upper equatorial Pacific. These latest studies pointed out that further studies of ENSO-Pacific climate interaction are important and needed to better understand ENSO variability on decadal timescales. Extreme ENSO events were noticed to occur approximately every years (e.g., Gu and Philander 1995; Torrence and Webster 1999), recalling that the last three strongest ENSO events occurred in 1972/73, 1982/83 and 1997/98. Between those strong events, rather weaker ENSO events happened. Does this nearly 10-20year timescale happen by chance or is there a decadal modulation cycle of ENSO intensity? What is the possible underlying mechanism? To address these questions, we analyze various atmospheric and oceanic data sets to examine the existence of slow modulations of ENSO intensity and to describe the changes of ENSO and tropical Pacific mean state during the modulation. The data sets and the analysis methods are outlined in Section 2, followed by the identification of an ENSO modulation cycle in 6
7 Section 3. In Section 4, the asymmetric spatial structures of ENSO within the modulation cycle are described. In Section 5, a linkage is established between the ENSO asymmetries and one leading mode of the decadal mean state changes in the tropical Pacific. Major findings are summarized in Section 6. An ENSO asymmetrymean state interaction mechanism is also hypothesized to explain the observed decadal ENSO modulation cycle. 2. Data sets and Methods Two historical SST data sets are used in this study: the global monthly Extended Reconstructed Sea Surface Temperature data set version 2 (ERSST.v2) (Smith and Reynolds 2004) with a spatial resolution of 2 x 2, and the Hadley Centre Sea Ice and Sea Surface Temperature data set version 1 (HadISST1) (Rayner et al. 2003) with a spatial resolution of 1 x 1. The large-scale variations in HadISST1 are broadly consistent with those in ERSST.v2, but there are differences between these two data sets due to different historical bias corrections as well as different data and analysis procedures (Smith and Reynolds 2003). Most of the analyses presented in this paper are based on ERSST.v2, and HadISST1 is used for verification. ERSST.v2 is an improved extended reconstruction of the previous version, ERSST (Smith and Reynolds 2003), which is constructed utilizing the most recently available International Comprehensive Ocean-Atmosphere Data Set (ICOADS) SST data and the improved statistical methods that allow stable reconstruction using sparse data. 7
8 The analyzed signal in the historical data sets is heavily damped before 1880, so data from 1880 to 2006 is analyzed in this study. A 331-year long ( ) ENSO index time series reconstructed by Mann et al. (2000) from multi-proxy paleoclimate data is also used to further verify the decadal signals identified from the historical data sets. The reconstructed index represents the extended boreal winter (October-March) SST anomalies averaged in the Niño3 region (150 W-90 W, 5 S-5 N) with the longterm climatology removed. Also used in this study are the monthly surface wind and 200hPa velocity potential data from the National Centers for Environmental Prediction (NCEP)/ National Center for Atmospheric Research (NCAR) reanalysis data (Kalnay et al. 1996) and the monthly upper ocean temperature data from SODA (Simple Ocean Data Assimilation, Carton et al. 2000). The surface wind data is on 2.5 x 2.5 grids and the velocity potential data is on the Gaussian grids (1.875 x ~2 ) and both data sets are from 1948 to SODA assimilates the ocean observations, e.g., World Ocean Atlas, XBT profiles, in-situ station data and satellite altimeter-derived sea level data. The upper ocean temperature data from SODA has a resolution of 1 x 0.5 ~1 (enhanced resolution in tropics) in horizontal, 15meter in vertical from the surface to about 160-meter deep (with lower resolution below) and is from 1950 to The temperatures are linearly interpolated in the vertical to locate the depth of 20 C isotherms, which is used as a proxy for thermocline depth. The yearly ocean heat content (defined as the averaged temperature between surface and 300-meter deep) 8
9 data set from Levitus et al. (2005) for the period of is also used. Monthly anomalies for all the variables are constructed as the deviations from their monthly mean climatologies calculated from the entire data period. Due to ENSO s phase locking to the seasonal cycle, the mature phases of El Niño and La Niña tend to occur toward the end of the calendar year (Rasmusson and Carpenter 1982). In this study, we choose the extended boreal winter (October-March) SST anomalies in the Niño3.4 region (170 W-120 W, 5 S-5 N) to describe the variations of ENSO activity. Both the Niño3.4 and Niño3 (used in the proxy paleoclimate data set) regions are located within the areas where large ENSO SST variability occurs and their time evolutions are highly correlated. 3. The 10-15year Modulation Cycle of ENSO Intensity Figure 1a shows the extended winter Niño3.4 index (thin-solid line) calculated from the ERSST.v2. The time series has been highpass filtered with an 8-year cutoff to highlight the SST fluctuations on interannual ENSO timescales, considering ENSO is known to have a periodicity of 2-8 years. The filter we used is the 4 th order Butterworth filter (Parks and Burrus 1987), which is a recursive filter commonly used in climate analysis. Besides the dominant interannual ENSO events, also seen in the time series is a modulation of ENSO intensity: periods of strong and weak ENSO intensity alternate on slow timescales. We used an envelope function adopted from 9
10 Nakamura and Wallace (1990) to quantify the modulation of ENSO intensity. To construct the envelope function, the Niño3.4 index was first squared and then filtered with a 10-year cutoff lowpass Butterworth filter to highlight the decadal signals. The resulting quantity was multiplied by 2 in recognition of the fact that the power of a pure harmonic oscillation of arbitrary frequency averaged over one certain period is just half the squared intensity of the oscillation (Nakamura and Wallace 1990). The resulting series is defined as the envelope function (hereafter ENVF) of the Niño3.4 index. The square root of this time series represents the true amplitude of the slow (>10 years) modulation. It is shown in Figure 1a that the square-rooted ENVF (thicksolid line, with thick-dashed line the mirror image) portrays reasonably well the slow intensity variations of the Niño3.4 index. The ENVF is not sensitive to the low-pass cut-off frequency used. We also tried low-pass filters with 8-year and 12-year cutoffs and obtained similar ENVF time series. The power spectrum of the standardized ENVF is shown in Figure 2a, together with the best-fit first-order autoregression (AR1) red noise spectrum and associated 95% confidence limit using F-test. The serial dependence in the time series induced by the lowpass filtering procedure and its effects on the effective sample size and the degree of freedom have been taken into account (Wilks 1995). It shows that the ENVF has a statistically significant spectral peak around the 10-15year bands. To verify this spectral peak, we also calculated the ENVFs for the Niño3.4 index of HadISST1 and the 331-year reconstructed Niño3 index of Mann et al. (2000). Both 10
11 indices were calculated in the extended boreal winter. Figure 2b and 2c show the power spectra of the standardized ENVFs from these two data sets. Similar to Figure 2a, spectral peaks near the 10-15year bands are also evident and statistically significant at the 95% confidence level. All the three data sets consistently indicate that ENSO intensity undergoes decadal modulations, with a significantly distinct 10-15year cycle. To further verify the 10-15year modulation cycle exists in ENSO intensity, the same analysis procedure was applied to the Southern Oscillation Index (SOI), the atmospheric component of ENSO. The Troup SOI data set (Troup 1965), which is the standardized anomaly of the mean sea level pressure difference between Tahiti (149.6 W, 17.6 S) and Darwin (130.9 E, 12.4 S) from 1870 to 2006 is used. A significant spectral peak near the 10-15year period was also found (not shown). It is noted from Figure 1a that the Niño3.4 intensity increases toward both ends of the time series compared with the middle period This indicates a secular change of ENSO variance (Gu and Philander 1995) that is far longer than the 10-15year decadal modulation cycle we are interested in. For this reason, a bandpass Butterworth filter with cutoffs at 10 and 20 years is applied to the ENVF to retain only the decadal (10-20year) ENSO modulation. The standardized bandpass filtered ENVF calculated from ERSST.v2 is shown in Figure 1b. This bandpass filtered ENVF is used as the reference time series for composite analyses in the rest of the study. We also calculated the corresponding bandpass filtered ENVF from HadISST1 Niño3.4 index (not shown) and found it largely coincides with that shown in Figure 11
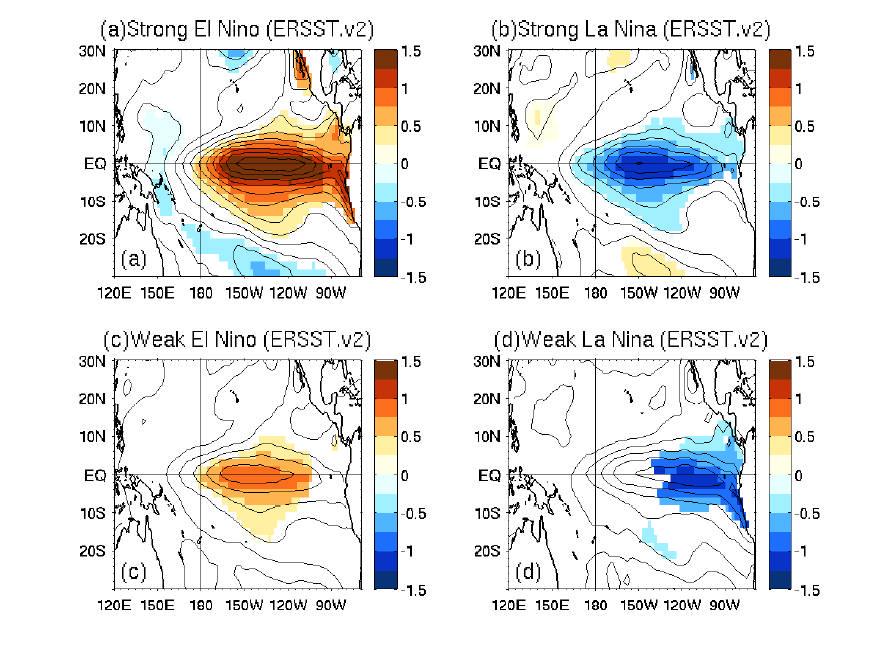
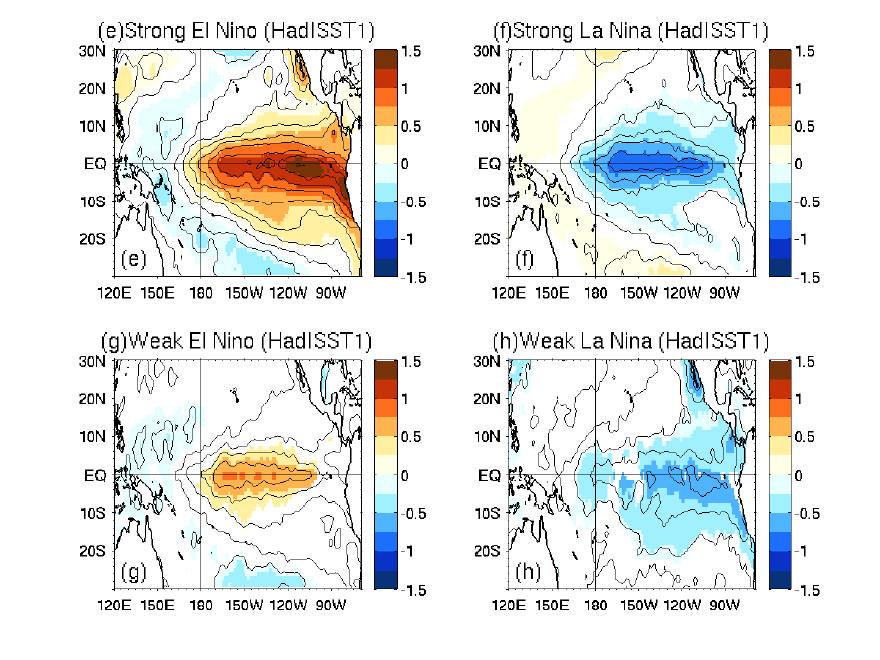
12 1b, except for the periods around and The differences in these two periods may be due to the paucity of the observational data during the two world wars and different historical bias correction methods used in those two data sets. It is worth noting that the bandpass filtered ENVF of the SOI (not shown) is generally well consistent with the one shown in Figure 1b. 4. Variations of ENSO Structures in the Modulation Cycle We examine in this section the variations of El Niño and La Niña spatial structures within the 10-15year ENSO intensity modulation cycle. The anomalous surface and subsurface structures of El Niño and La Niña were composed for the enhanced and weakened intensity periods of the modulation cycle. Here, we define the enhanced and weakened intensity periods as the times when the bandpass filtered ENVF (Figure 1b) is greater and less than 0.3 standard deviations, respectively. These criteria were subjectively selected to have enough events for the composite. El Niño and La Niña events are defined as the events whose extended boreal winter Niño3.4 index is greater than 0.5 C and less than -0.5 C, respectively. It should be noted that our results are not very sensitive to the thresholds used to define the El Niño/La Niña events or the enhanced/weakened intensity periods. The composite ENSO SST anomaly structures calculated from unfiltered ERSST.v2 are shown in Figure 3 a-d, with the shaded indicating 95% significant level 12
13 using a t-test. There are two major features in the composites. The first is the evident spatial asymmetries between El Niño and La Niña events in both the enhanced and weakened intensity periods of the modulation cycle. The second major feature is that spatial asymmetries in the enhanced and weakened intensity periods are reversed. During the enhanced-intensity periods, El Niño events (Figure 3a) have their largest positive SST anomalies in the eastern tropical Pacific (centered at 130 W) while La Niña events (Figure 3b) have their largest negative SST anomalies in the central tropical Pacific (centered at 150 W). SST anomalies of El Niño events are attached to the South America coast while those of La Niña events are detached from the coast. During the weakened-intensity periods, the spatial asymmetry between El Niño and La Niña still exists but is reversed from that in the enhanced-intensity periods: El Niño events (Figure 3c) are now more detached from the South America coast with significant positive SST anomalies centered in the central Pacific (near 160 W) while La Niña events (Figure 3d) have significant negative SST anomalies centered in the far eastern Pacific (near 110 W) and more attached to the coast. Kao and Yu (2008) referred the ENSO events with their SST anomaly center in the eastern Pacific as the eastern-pacific type of ENSO and those with their SST anomaly center in the central Pacific as the central-pacific type of ENSO. The same composite analyses were repeated with HadISST1 and similar results are found in Figures 3e-h. Especially, the El Niño composite calculated from HadISST1 during the enhanced-intensity periods (Figure 3e) has its largest positive 13
14 SST anomalies (centered at 100 W) more attached to the coast than those calculated from ERSST.v2 (Figure 3a). Both data sets show that the El Niño-La Niña spatial asymmetries are characterized by alternations of ENSO SST anomaly centers between the central and eastern tropical Pacific. To address the concern of general paucity of data prior to 1950s for both ERSST.v2 and HadISST1, we repeated the composite analyses with only the data before and after 1950 and qualitatively similar results were found for both data sets (not shown). The composites in Figure 3 suggest the 10-15year ENSO intensity modulation cycle is accompanied by the alternation of SST anomaly centers between the eastern and central tropical Pacific for both El Niño and La Niña events. We are not aware that such reversed asymmetries have even been shown for decadal ENSO variability in observations. Timmermann (2003) remarked similar reversed asymmetries and zonal displacement of ENSO in the decadal modulation of the ENSO events produced from the ECHAM4/OPYC3 CGCM. However, he did not show how the reversed asymmetries look like in the model, so it cannot be determined how similar or different the reversed asymmetries in CGCM are to the observed asymmetries reported here. We further show in Figure 4 the composites of anomalous surface wind for the El Niño and La Niña events during the enhanced and weakened intensity periods. The 57-year ( ) long NCEP/NCAR reanalysis wind data were used. Also 14
15 shown in the figure are the zonal wind anomalies (shaded) that are statistically significant at the 95% significant level using a t-test. For the ENSO events with SST anomaly centers located in the eastern Pacific (i.e., the strong El Niño in Figure 4a and the weak La Niña in Figure 4d), they tend be associated with significant anomalous surface wind vectors across the Pacific basin with the largest zonal wind anomalies located mostly to the east of the date line. For the ENSO events with SST anomaly centers located in the central Pacific (i.e., the weak El Niño in Figure 4c and the strong La Niña in Figure 4b), their associated anomalous surface wind vectors are confined more locally in the central Pacific and their largest zonal wind anomalies are located more to the west of the date line. The anomalous wind patterns are consistent with the anomalous SST patterns. Figure 4 suggests that the eastern-pacific type of ENSO appears involving air-sea interactions over a large portion of the tropical Pacific basin, and the central-pacific type of ENSO appears involving air-sea interactions more confined in the central tropical Pacific. The composite ocean heat content (OHC) anomalies for these strong and weak El Niño and La Niña events are show in Figure 5. Anomalies at the 95% significance level are shaded. Here the OHC is defined as the ocean temperature averaged over the upper 300 meters, and the yearly OHC values from the Levitus data set (Levitus et al. 2005) are used. Both strong El Niño (Figure 5a) and weak La Niña (Figure 5d) composites are associated with large OHC anomalies in both sides of the tropical Pacific basin. For the strong El Niño (Figure 5a), the 15
16 positive OHC anomalies extending from 170 W to the South America coast indicate a deepening thermocline along the equator. For weak La Niña (Figure 5d), negative OHC anomalies show up in far eastern Pacific from 120 W to 90 W indicating a shoaling thermocline. The out-of-phase relationship between the anomalies in the eastern and western Pacific indicates a basin-wide thermocline variation. It is consistent with the larger zonal extents of surface wind anomaly patterns shown in Figure 4a and Figure 4d for these eastern-pacific types of ENSO. For the strong La Niña (Figure 5b) and weak El Niño (Figure 5c) composites, their associated OHC anomalies are confined mostly in the central Pacific, spanning from 180 to 130 W for strong La Niña and from 170 W to 140 W for weak El Niño. These local OHC anomaly patterns are also consistent with the more confined wind anomaly patterns shown in Figures 4b and 4c for these central-pacific types of ENSO. The spatial asymmetry between strong El Niño and La Niña events has been noticed for some time (e.g., Hoerling et al. 1997; Monahan 2001) and it was explained as a result of nonlinearity, such as horizontal and vertical advection in ENSO dynamics (e.g., An and Jin 2004; Dong 2005; Schopf and Burgman 2006). Our results show the spatial asymmetry also exists between weak El Niño and weak La Niña, suggesting that explanations other than the ENSO nonlinearity may be needed. One possibility is that the ENSO asymmetries may reflect different types of ENSO dynamics. For example, the two patterns of ENSO events (i.e. the one centered in the eastern Pacific and the other centered in the central Pacific) might be the exhibitions 16
17 of two ENSO types, such as the delayed oscillator mode (Suarez and Schopf 1988; Battisti and Hirst 1989) and the slow SST mode (Neelin 1991; Neelin and Jin 1993; Jin and Neelin 1993a, 1993b) or others. Further examinations of this possibility are important to the understanding of the decadal modulation of ENSO. 5. ENSO Residual Effect on the Mean State Changes In this section, we quantify the SST asymmetry between El Niño and La Niña by the sum of their SST anomaly composites. Figure 6 shows the sums of the composite for the enhanced and weakened periods of the modulation cycle separately. During the enhanced periods, the sum exhibits large positive anomalies in the far eastern tropical Pacific (around 100 W) centered slightly to the south of equator. Comparison of Figure 6a with the two composites in Figure 3a and 3b indicates the positive anomalies in eastern tropical Pacific is largely due to that El Niño warming impact on SST is larger than La Niña cooling. As a result, the average over an ENSO cycle is not zero. Negative SST anomalies are found along the equator between 130 E and the date line. This SST asymmetry pattern during the enhanced periods looks similar to the spatial distribution of skewness in Burgers and Stephenson (1999) in their Figure 3a. Strong warming occurs in the far eastern upwelling regions where the thermocline is already close to the surface, therefore it is difficult to attain much cooler than warmer SST. Strong cooling occurs in the central Pacific because of cloud feedback and surface fluxes, which limit warming SST (Rodgers et al. 2004). During 17
18 the weakened periods, the sum exhibits negative anomalies in the far eastern Pacific and slightly positive anomalies in the central Pacific. This pattern is nearly out of phase with the composite sum in the enhanced periods. Since the sum of El Niño and La Niña composites represents the residual effect that ENSO asymmetry may have on the mean state, the nearly reversed patterns shown in Figure 6 suggest the residual effect is reversed between the enhanced and weakened intensity periods of the 10-15year modulation cycle. During the enhanced-intensity periods, the ENSO residual effect tends to warm up the eastern tropical Pacific but cool down the central tropical Pacific, which might lead to a decrease of the east-west SST gradient along the equator. During the weakened-intensity periods, the ENSO residual effect tends to cool down the eastern tropical Pacific but warm up the central Pacific, and increase the east-west SST gradient. Figure 7 displays the sums of the composite surface wind vector and convergence/divergence anomalies for El Niño and La Niña in the enhanced and weakened intensity periods. The sums represent the ENSO residual effects on the mean surface wind. In the enhanced-intensity periods (Figure 7a), ENSO residual tends to produce northwesterly anomalies in the eastern equatorial Pacific, which is opposite to the climatological southeasterly, representing a relaxation of the trade winds in that region. In the weakened periods (Figure 7b), ENSO residual tends to produce southeasterly anomalies in the eastern Pacific and strengthen the climatological trade winds. Figure 7 also shows that the ENSO residuals result in 18
19 anomalous surface wind convergence in the far eastern Pacific from 15 S to the equator in the enhanced-intensity periods but anomalous divergence in the weakenedintensity periods. The corresponding ENSO residual effects on the mean thermocline depth are shown in Figure 8. In the enhanced-intensity periods (Figure 8a), ENSO residual tends to increase the thermocline depth in the eastern tropical Pacific but decrease the depth in the central Pacific. In the weakened-intensity periods (Figure 8b), the residual decreases the thermocline depth along the coast but increases it in the central Pacific. Significant thermocline variations in the tropical Pacific cover a region extending from around 10 S to 10 N and coincide more-or-less with the areas of large asymmetric patterns for the SST and surface wind shown in Figures 6 and 7. Figures 6-8 indicate that the SST, surface wind, and thermocline depth anomalies resulted from the ENSO residual effects are dynamically consistent with each other. For example, in the enhanced-intensity periods, the asymmetry between El Niño and La Niña SST anomalies tends to increase the mean SST in the eastern Pacific that in turn relaxes the mean surface trade wind in the region. The relaxed surface trade wind, together with the anomalous convergence, tends to deepen the mean thermocline and therefore further warms up the eastern Pacific. To further quantify the tropical Pacific mean state changes related to the modulation cycle, we regress the bandpass filtered ENVF against different climate variables (SST, surface wind and thermocline depth) in Figure 9. We have tried the analysis with both the 10year lowpass filtered and the non-filtered anomalies for the 19
20 climate variables and found little difference in the regression results. The results shown are those calculated with the non-filtered anomalies. The regression for SST anomalies (Figure 9a) is characterized by a nearly zonal dipole structure along the equator between the far eastern Pacific near (90 W, 10 S) and the central Pacific near (175 E). It is also noticeable that the regression center in the central Pacific is symmetric with respect to the equator, while the regression center in the far eastern Pacific is meridionally asymmetric and centered to the south of equator. Figure 9a indicates that in the enhanced ENSO periods, the far eastern Pacific is warmer than normal while central equatorial Pacific is cooler than normal and vice versa for the weakened periods, which is similar to the ENSO residual SST effects shown in Figure 6. Quantitatively, when the decadal ENSO intensity increases one standard deviation, the ENSO asymmetry warms up the eastern tropical Pacific and cools downs the central tropical Pacific by about C. The regression pattern for surface wind shown in Figure 9b is also similar to the ENSO residual wind effects displayed in Figure 7, which indicates the climatological trade winds are relaxed in the eastern tropical Pacific and strengthened in the central Pacific during the enhanced periods and vice versa for the weakened periods. The Figure 9c shows the corresponding regression pattern for 20 C isotherm depth. Opposite thermocline variations appear between the far eastern tropical Pacific (centered at 90 W, 10 S) and the central equatorial Pacific (centered at 130 W). In the enhanced periods, the mean thermocline deepens in the far eastern tropical Pacific 20
21 while shoals in the central Pacific. This regression pattern is in general consistent with the corresponding ENSO asymmetry pattern for the thermocline depth shown in Figure 8. The similarities between the ENSO asymmetry residual patterns shown in Figures 6-8 and the ENVF-regressed variation patterns shown in Figure 9 suggest the slow variations in the Pacific mean state associated with the ENSO modulation cycle are closely related to the ENSO residual effects. So how important are the decadal modulation of ENSO and its residual effects to the decadal mean state changes in the tropical Pacific? To answer this question, we examined the leading modes of decadal SST variability in the tropical Pacific using the Empirical Orthogonal Function (EOF) analysis. The EOF analysis is applied to the 10-20year bandpass filtered winter SST anomalies in the tropical Pacific (120 E-70 W, 30 S-30 N). The first two leading EOF modes are shown in Figure 10, which explain respectively 51% and 16% of the filtered SST variance. The first EOF (Figure 10a) has a spatial structure similar to PDO or the so-called ENSO-like decadal variability (Zhang et al. 1997). This structure is characterized by a horseshoe pattern in the eastern-to-central Pacific, flanked by opposite structures in the mid-latitudes of western and central Pacific in both hemispheres. The correlation coefficient between the principal coefficient of this first EOF mode and the bandpass filtered ENVF is small (correlation coefficient: ) and does not pass the 95% significance test. This indicates that the 10-15year ENSO modulation cycle is not directly related to this first EOF mode. And this result 21
22 is consistent with the observational study of Yeh and Kirtman (2005), which found no direct relationship between their horseshoe EOF mode and the decadal modulation of ENSO amplitude. The second EOF mode (Figure 10b) exhibits a zonally out-of-phase structure between the central and eastern tropical Pacific. Also noted in this pattern is the extension of the SST anomalies from the central Pacific to the Northeast Pacific and Baja California. This EOF pattern is spatially similar to the ENVF-regressed SST pattern shown in Figure 9a. The simultaneous correlation coefficient between the principal component of the second EOF mode and the bandpass filtered ENVF is as large as 0.70 and is statistically significant at the 95% level. This indicates the second EOF mode reflects the mean state changes associated with the reversed ENSO residual effects within the modulation cycle. The mean state change associated with decadal ENSO modulation is an important part of the tropical Pacific decadal variability. Yeh and Kirtman (2005) even suggested the observed low-frequency ENSO modulation leads the slow changes in the whole Pacific mean state three to four years to stress the forcing by changes in the ENSO statistics. Several CGCM studies (Timmermann 2003; Yeh and Kirtman 2004; Rodgers et al. 2004) also found the decadal modulations of their model ENSO are associated with a dipole-like tropical Pacific decadal variability similar to the second leading EOF mode we show here. However, there are some differences in details between the observed SST dipole pattern in our study and those model SST dipole patterns. First, the observed dipole 22
23 pattern shows an out-of-phase SST anomaly pattern between the far eastern and the central tropical Pacific around the date line while the one shown in Yeh and Kirtman (2004) is an out-of-phase pattern between the eastern and western tropical Pacific. Second, the dipole pattern shown in Timmermann (2003) is more confined in the equatorial Pacific while the observed one has significant loadings in the off-equatorial regions, especially in the far eastern tropical Pacific. Furthermore, the observed dipole pattern is meridionally asymmetric in the far eastern Pacific but the ones reported in Timmermann (2003) and Yeh and Kirtman (2004) are exact symmetric to the equator there. The causes of these differences are unknown, but could be possibly related to different analysis processes used or the fact that these CGCMs are dominated by 2- year ENSO. To allow the slow changes in the Pacific mean SSTs to modulate ENSO intensity, the mean SST changes have to be strong enough to affect the Pacific Walker circulation, whose location, intensity, and zonal extent exert strong influence on the strength of atmosphere-ocean coupling in the tropical Pacific (Deser and Wallace 1990). Following Tanaka et al. (2004), we measure the strength of the Walker circulation by the extended winter velocity potential at 200 hpa with its zonal mean removed. The climatology of the Pacific Walker circulation is shown in Figure 11a, with negative values indicating rising motion with upper-troposphere divergence and positive values sinking motion with upper-troposphere convergence. The climatology is characterized by a rising branch centered over the Philippine Sea and Maritime 23
24 continent near 150 E and a sinking branch centered over the far eastern tropical Pacific and Central American continents around (100 W, 10 S). The variations of the Walker circulation associated with the decadal modulation of ENSO intensity is examined in Figure 11b by regressing the bandpass filtered ENVF against the unfiltered 200-hPa velocity potential anomalies. It shows the locations of both rising and sinking branches of the Walker circulation associated with the slowly varying ENSO intensity cycle. The regression pattern exhibits a seasaw anomalous structure to the west and east of the climatological rising center of the Walker circulation. The rising branch in the western Pacific moves westward to 120 E during the enhanced ENSO intensity periods and eastward to the date line during the weakened periods. The sinking branch in the eastern Pacific also migrates during the ENSO modulation cycle. Compared with the climatology, the sinking branch shifts northwestward during the enhanced periods. It appears that the Pacific Walker circulation shifts westward during the enhanced periods and eastward during the weakened periods. It is noticed that this pattern is dynamically consistent with the surface wind pattern in Figure 9b, in which easterlies in western equatorial Pacific, e.g., over Indonesia is strengthened (relaxed) corresponding to the westward-shifted (eastward-shifted) Walker circulation during the enhanced (weakened) ENSO intensity periods. 6. Conclusions and Discussions 24
25 As one of the most pronounced interannual climate signal in tropical Pacific, ENSO also shows decadal variations, which have captured more and more attentions in the climate research community. By analyzing historical and paleo-proxy climate data sets, we investigated the decadal modulation of ENSO intensity and the ENSO residual effects on the Pacific mean state. We find the ENSO intensity exhibits a prominent 10-15year modulation cycle and this verifies the previous studies (e.g., Gu and Philander 1995; Knutson et al. 1997; Kirtman and Schopf 1998; Torrence and Webster 1999). The modulation cycle is characterized by evident spatial asymmetry between El Niño and La Niña events, which allows the ENSO cycle to leave a nonzero residual impact onto the mean state changes in the tropical Pacific. And the spatial asymmetry is reversed between the enhanced- to weakened-intensity periods of the modulation cycle, which implies opposite residual effects were produced by ENSO on the Pacific mean state during different periods of the modulation cycle. The mean state changes associated with the modulation cycle appears as the second leading EOF mode of the decadal SST variations in the tropical Pacific. It suggests the decadal ENSO variability is an important source of tropical Pacific decadal variability. This substantiates the previous studies (e.g., Rodgers et al 2004; Yeh and Kirtman 2004; Yeh and Kirtman 2005; and Schopf and Burgman 2006) on the forces of ENSO statistics on the Pacific mean state. Figure 12 is sketched to summarize the major features in the changes of 25
26 Pacific mean state within the modulation cycle. In the enhanced-intensity periods of the cycle (Figure 12a), the El Niño-La Niña asymmetry results in a westward shift of Walker circulation compared to its climatology, which strengthens the trade winds and favors cooling in the central tropical Pacific but relaxes the trade winds and favors warming in the eastern tropical Pacific. Accompanied with the circulation shift is the flattened thermocline along the equator, with a deepening thermocline in the far eastern and a shoaling thermocline in the central Pacific. The resulted mean state changes should weaken the atmosphere-ocean coupling in the Pacific and shift the Pacific coupled system into the weakened ENSO intensity periods. In this Pacific mean state, the already deeper-than-normal thermocline in the eastern tropical Pacific may make local SSTs more sensitive to upwelling than to downwelling. As a result, it favors La Niña but prohibits El Niño from occurring in the eastern tropical Pacific. This may be one possible reason why the El Niño-La Niña asymmetry reverses during the weakened-intensity periods. Figure 12b shows that in these weakened ENSO intensity periods, the mean state changes associated with the ENSO residual effect are characterized by a gradual cooling in the far eastern Pacific and a warming in the central-western Pacific. Associated with the SST variations are strengthened and relaxed trade winds in these two regions respectively via the eastward migration of the Walker circulation from its climatology locations. The changes lead to the rebuilding of the zonal SST gradient along the equator and concurrent deepening and shoaling of the thermocline in the central and eastern tropical Pacific, respectively. As a result, the ocean-atmosphere coupling is enhanced in the Pacific by the ENSO 26
27 residual effect and the Pacific mean state is gradually pushed back to the enhanced ENSO intensity periods. In the enhanced periods, the shallower-than-normal thermocline in the eastern tropical Pacific may be more sensitive to downwelling than upwelling. Therefore, it favors El Niño to happen in the eastern Pacific but prohibits La Niña there. Our studies indicate that a two-way interaction mechanism between the ENSO asymmetry and tropical Pacific mean state may operate in the tropical Pacific to support a 10-15year modulation cycle of ENSO intensity. And our results substantiate the importance of ENSO s regulatory effects and they are in agreement with the recent numerical modeling studies (e.g., Sun and Zhang 2006 and Sun 2007) that suggested ENSO can have regulatory effects on the tropical Pacific mean climate. Our results further suggest that better understanding of the ENSO asymmetry and its residual influences on the Pacific mean state is important to the study of the decadal ENSO variations. The mechanism we hypothesized here relies on the reversible ENSO residual effects on the Pacific mean state to provide the needed restoring force to sustain the modulation cycle. A few issues have yet to be addressed to examine this ENSO-Pacific mean state interaction mechanism. The ENSO asymmetry residual effect may have different interpretations in other studies. For example, as elaborated by Schopf and Burgman (2006), they presented a kinematic effect of oscillating a nonlinear temperature profile similar to that seen in the equatorial Pacific to account for the long-term mean state changes as ENSO intensity changes. Though the residual 27
28 effects of ENSO cycle on the mean state are likely, they should not have an impact on the stability of the underlying system or the future evolution of the system. Therefore, it is yet to be demonstrated that the ENSO residual effect does constitute as a forcing to the Pacific mean state, which in turn affects the ENSO properties. Also, the interaction mechanism we postulated here invokes a linearity assumption in which the Pacific state is assumed to fluctuate around a stationary basic state to determine the properties of ENSO. It is yet to be determined how useful this linear view can be used to explain nonlinear ENSO behaviors. Another issue that is yet to understand is how the 10-15year modulation timescale is determined. Further examinations and verifications of the ENSO-Pacific mean state interaction hypothesis proposed here are needed. Acknowledgments. The authors thank the anonymous reviewers and Dr. Paul Schopf and Dr. De-Zheng Sun for their helpful and constructive comments that have helped the improvement of this paper. The support from NSF (ATM ) and JPL (subcontract No ) is acknowledged. The data analysis was performed at Earth System Modeling Facility at University of California, Irvine (supported by NSF ATM ). 28
29 Reference Alexander, M. A., I. Blade, M. Newman, J. R. Lanzante, N. C. Lau, and J. D. Scott, 2002: The atmospheric bridge: The influence of ENSO teleconnections on air-sea interaction over the global oceans. J. Climate, 15, An, S. I. and B. Wang, 2000: Interdecadal change of the structure of the ENSO mode and its impact on the ENSO frequency. J. Climate, 13, , and F.-F. Jin, 2004: Nonlinearity and asymmetry of ENSO. J. Climate, 17, Barnett, T. P., D. W. Pierce, M. Latif, D. Dommenget, and R. Saravanan, 1999: Interdecadal interactions between the tropics and midlatitudes in the Pacific basin. Geophys. Res. Lett., 26, Battisti D. S., and A. C. Hirst, 1989: Interannual variability in the tropical atmosphere-ocean system: Influences of the basic state, ocean geometry, and nonlinearity. J. Atmos. Sci., 46, Burgers, G., and D. B. Stephenson, 1999: The normality of El Niño, Geophys. Res. Lett., 26,
30 Carton, J. A., G. Chepurin, X. H. Cao, and B. Giese, 2000: A Simple Ocean Data Assimilation analysis of the global upper ocean Part I: Methodology. J. Phys. Oceanogr., 30, Deser, C. and J. M. Wallace, 1990: Large-scale atmospheric circulation features of warm and cold episodes in the tropical Pacific. J. Climate, 3, , C., A. S. Phillips, and J. W. Hurrell, 2004: Pacific interdecadal climate variability: linkages between the tropics and North Pacific during boreal winter since J. Climate, 17, Dong, B.-W., 2005: Asymmetry between El Niño and La Niña in a Global Coupled GCM with an Eddy-Permitting Ocean Resolution. J. Climate.,18, Eckert, C. and M. Latif, 1997: Predictability of a stochastically forced hybrid coupled model of El Niño. J. Climate, 10, Fedorov, A. V. and S. G. Philander, 2000: Is El Niño changing? Science, 288, Gu D., and S. G. H. Philander, 1995: Secular changes of annual and interannual 30
31 variability in the Tropics during the past century. J. Climate, 8, , and S. G. H. Philander, 1997: Interdecadal climate fluctuations that depend on exchanges between the tropics and extratropics. Science, 275, Hoerling, M. P., A. Kumar, and M. Zhong, 1997: El Niño, La Niña, and the nonlinearity of their teleconnections. J. Climate, 10, Jin F.-F., and J. D. Neelin, 1993a: Modes of interannual tropical ocean atmosphere interaction A unified view. Part I: Numerical results. J. Atmos. Sci., 50, , and, 1993b: Modes of interannual tropical ocean atmosphere interaction A unified view. Part III: Analytical results in fully coupled cases. J. Atmos. Sci., 50, Kalnay, E., M. Kanamitsu, R. Kistler, W. Collins, D. Deaven, L. Gandin, M. Iredell, S. Saha, G. White, J. Woollen, Y. Zhu, M. Chelliah, W. Ebisuzaki, W. Higgins, J. Janowiak, K. C. Mo, C. Ropelewski, J. Wang, A. Leetmaa, R. Reynolds, R. Jenne, and D. Joseph, 1996: The NCEP/NCAR 40-year reanalysis project. Bull. Amer. Meteorol. Soc., 77, Kao H.-Y. and J.-Y. Yu, 2008: Contrasting Eastern-Pacific and Central-Pacific types 31
32 of ENSO, J. Climate, in press. Kirtman, B. P. and P. S. Schopf, 1998: Decadal variability in ENSO predictability and prediction. J. Climate, 11, Knutson T. R., S. Manabe, and D. Gu, 1997: Simulated ENSO in a global coupled ocean atmosphere model: Multidecadal amplitude modulation and CO2 sensitivity. J. Climate, 10, Latif M., A. Sterl, E. Majer-Reimer, and W. M. Junge, 1993: Climate variability in a coupled GCM. Part I: The tropical Pacific. J. Climate, 6, Levitus, S., J. Antonov, and T. Boyer, 2005: Warming of the world ocean, Geophys. Res. Lett., 32. Mann, M.E., E. Gille, R.S. Bradley, M.K. Hughes, J. Overpeck, F.T. Keimig, and W. Gross, 2000: Global Temperature Patterns in Past Centuries: An Interactive Presentation. Earth Interact., 4, 1. Mantua, N. J., S. R. Hare, Y. Zhang, J. M. Wallace, and R. C. Francis, 1997: A Pacific interdecadal climate oscillation with impacts on salmon production. Bull. Amer. Meteorol. Soc., 78,
33 Meehl G. A., P. Gent, J. M. Arblaster, B. Otto-Bliesner, E. Brady, and A. Craig, 2001: Factors that affect amplitude of El Niño in global coupled climate models. Climate Dyn., 17, Monahan, A.H., 2001: Nonlinear principal component analysis: Tropical Indo Pacific sea surface temperature and sea level pressure. J. Climate, 14, Nakamura, H. and J. M. Wallace, 1990: Observed Changes In Baroclinic Wave Activity During The Life-Cycles of Low-Frequency Circulation Anomalies. J. Atmos. Sci., 47, Neelin, J. D., 1991: The slow sea surface temperature mode and the fast-wave limit: Analytic theory for tropical interannual oscillations and experiments in a hybrid coupled model. J. Atmos. Sci., 48, , and F.-F. Jin, 1993: Modes of interannual tropical ocean atmosphere interaction A unified view. Part II: Analytical results in the weak-coupling limit. J. Atmos. Sci., 50, Newman, M., 2007: Interannual to decadal predictability of tropical and North Pacific sea surface temperatures. J. Climate, 20,
34 , M., G. P. Compo, and M. A. Alexander, 2003: ENSO-forced variability of the Pacific decadal oscillation. J. Climate, 16, Parks, T.W., and C.S. Burrus, 1987: Digital Filter Design, John Wiley & Sons, New York, p.83. Penland, C., and P. D. Sardeshmukh, 1995: The Optimal Growth of Tropical Sea Surface Temperature Anomalies. J. Climate, 8, Pierce, D. W., T. P. Barnett, and M. Latif, 2000: Connections between the Pacific Ocean tropics and midlatitudes on decadal timescales. J. Climate, 13, Power, S., T. Casey, C. Folland, A. Colman, and V. Mehta, 1999: Inter-decadal modulation of the impact of ENSO on Australia. Clim. Dyn., 15, Rasmusson, E. M., and T. H. Carpenter, 1982: Variations in Tropical Sea Surface Temperature and Surface Wind Fields Associated with the Southern Oscillation/El Niño. Mon. Wea. Rev., 110, Rayner, N. A., D. E. Parker, E. B. Horton, C. K. Folland, L. V. Alexander, D. P. Rowell, E. C. Kent, and A. Kaplan, 2003: Global analyses of sea surface temperature, 34
35 sea ice, and night marine air temperature since the late nineteenth century. J. Geophys. Res.-Atmos., 108. Rodgers, K. B., P. Friederichs, and M. Latif, 2004: Tropical pacific decadal variability and its relation to decadal modulations of ENSO. J. Climate, 17, Schopf, P. S. and R. J. Burgman, 2006: A simple mechanism for ENSO residuals and asymmetry. J. Climate, 19, Smith, T. M. and R. W. Reynolds, 2003: Extended reconstruction of global sea surface temperatures based on COADS data ( ). J. Climate, 16, , 2004: Improved extended reconstruction of SST ( ). J. Climate, 17, Suarez M. J., and P. S. Schopf, 1988: A delayed action oscillator for ENSO. J. Atmos. Sci., 45, Sun, D.-Z., 2007: The role of ENSO in regulating its background state. In: Nonlinear Dynamics in Geosciences, Springer, New York, 604. Sun, D.-Z., and T. Zhang, 2006: A regulatory effect of ENSO on the time-mean 35
36 thermal stratification of the equatorial upper ocean, Geophys. Res. Lett., 33, L07710, doi: /2005gl Tanaka, H. L., N. Ishizaki, and A. Kitoh, 2004: Trend and interannual variability of Walker, monsoon and Hadley circulations defined by velocity potential in the upper troposphere. Tellus, 56A, Timmermann, A., 2003: Decadal ENSO amplitude modulations: a nonlinear paradigm. Glob. Planet. Change, 37, , and F. F. Jin, 2002: A nonlinear mechanism for decadal El Niño amplitude changes. Geophys. Res. Lett., 29. Torrence, C. and P. J. Webster, 1999: Interdecadal changes in the ENSO-monsoon system. J. Climate, 12, Troup, A. J., 1965: The southern oscillation. Quart. J. Roy. Meteor. Soc., 91, Wang, B. and Y. Wang, 1996: Temporal structure of the Southern Oscillation as revealed by waveform and wavelet analysis. J. Climate, 9,
37 Wang, C. Z. and R. H. Weisberg, 1998: Climate variability of the coupled tropicalextratropical ocean-atmosphere system. Geophys. Res. Lett., 25, Wilks, D.S., 1995: Statistical Methods in the Atmospheric Sciences. International Geophysics Series, Vol. 59, Academic Press, 464 pp. Yeh, S. W. and B. P. Kirtman, 2004: Tropical Pacific decadal variability and ENSO amplitude modulation in a CGCM. J. Geophys. Res.-Oceans, 109., and, 2005: Pacific decadal variability and decadal ENSO amplitude modulation, Geophys. Res. Lett., 32, L05703, doi: /2004gl Zebiak S. E., and M. A. Cane, 1987: A model for El Niño Southern Oscillation. Mon. Wea. Rev., 115, Zhang, X. B., J. Sheng, and A. Shabbar, 1998: Modes of Interannual and interdecadal variability of Pacific SST. J. Climate, 11, Zhang, Y., J. M. Wallace, and D. S. Battisti, 1997: ENSO-like interdecadal variability: J. Climate, 10,
38 Figure Captions: Figure 1. Upper panel (Figure 1a): time series of extended boreal winter (October- March) Niño3.4 SST anomaly index (thin line), decadal amplitude (square root of envelope function, thick solid line) and its mirror (thick dashed line); Lower panel (Figure 1b): standardized 10-20year bandpass filtered envelope function (ENVF). Figure 2. Power spectrum of standardized ENVF of extended winter Niño3.4 index for (a) ERSST.v2, (b) HadISST1 and (c) extended winter Niño3 index reconstructed from the paleoclimate proxy data of Mann et al. (2000). The lowpass filtering procedure induced serial dependence and effect on the effective sample size and the degrees of freedom are considered. Dotted line is the best-fit AR1 red noise power spectrum and dashed line is the 95% significance level using F-test. Figure 3. Composite extended winter SST anomalies (ERSST.v2) for (a) El Niño and (b) La Niña events for the enhanced ENSO intensity periods. (c) and (d) are the same as (a) and (b), but for the weakened ENSO intensity periods. Contour interval is 0.2 C and the shaded indicates 95% significance level using a t-test. (e)-(h) are the same separately as (a)-(d) but for the HadISST1. Figure 4. Composite extended winter surface zonal wind (shaded, unit: m/s) and wind vector anomalies for (a) El Niño and (b) La Niña events for the enhanced ENSO 38
39 intensity periods. (c) and (d) are the same as (a) and (b), but for the weakened ENSO intensity periods. Shaded is the 95% significance level using a t-test. Figure 5. Composite extended winter ocean heat content anomalies (unit: joules) for (a) El Niño and (b) La Niña events for the enhanced ENSO intensity periods. (c) and (d) are the same as (a) and (b), but for the weakened ENSO intensity periods. Contour interval is 5x10 18 and the shaded is the 95% significance level using a t-test. Zero contour line is highlighted. Figure 6. The asymmetric (El Niño+La Niña) structures of extended winter SST anomalies for the enhanced ENSO intensity periods (a) and the weakened ENSO intensity periods (b). Contour interval is 0.1 C and the shaded is the 90% significance level using a two-tailed t-test. Figure 7. Same as Figure 6, but for the surface wind vector (unit: m/s) and divergence (red) and convergence (blue) anomalies (unit: m/s 2 ). Shaded is the 90% significance level using a two-tailed t-test. Figure 8. Same as Figure 6 but for the 20 C isotherm depth anomalies (unit: meter). Shaded is the 90% significance level using a two-tailed t-test. Contour interval is 3 meters. Figure 9. Upper panel (Figure 9a): linear regression between 10-20year bandpass 39
40 filtered ENVF (Figure 1b) and unfiltered extended winter SST anomalies (unit: C per standard deviation of ENVF, contour interval is 0.03); Middle panel (Figure 9b): same as upper panel but for the surface wind (unit: m/s per standard deviation of ENVF); Lower panel (Figure 9c): same as upper panel but for the 20 C isotherm depth (unit: meter per standard deviation of ENVF, contour interval is 2). Shaded is the 90% significance level using F-test. Figure 10. The first (a) and second (b) leading EOF mode of 10-20yr bandpass filtered extended winter SST anomalies in the tropical Pacific (120 E-70 W, 30 S- 30 N). Contour interval is 0.01 C. Figure 11: Upper panel (Figure 11a): long term mean climatology of 200 hpa velocity potential (unit: 10 6 m 2 s -1 ) with zonal mean removed. Positive indicates sinking motion and negative rising motion. Lower panel (Figure 11b): linear regression between 10-20year bandpass filtered ENVF and unfiltered extended winter 200 hpa velocity potential (unit: 10 6 m 2 s -1 per standard deviation of ENVF). Shaded is the 90% significance level using F-test. Figure 12. Schematic diagram showing the oceanic and atmospheric variations in the tropical Pacific caused by El Niño-La Niña asymmetry forcing during the enhanced (a) and weakened (b) ENSO intensity periods. Dashed lines show the climatology. 40
41 Figure 1. Upper panel (Figure 1a): time series of extended boreal winter (October- March) Niño3.4 SST anomaly index (thin line), decadal amplitude (square root of envelope function, thick solid line) and its mirror (thick dashed line); Lower panel (Figure 1b): standardized 10-20year bandpass filtered envelope function (ENVF). 41
42 Figure 2. Power spectrum of standardized ENVF of extended winter Niño3.4 index for (a) ERSST.v2, (b) HadISST1 and (c) extended winter Niño3 index reconstructed from the paleoclimate proxy data of Mann et al. (2000). The lowpass filtering procedure induced serial dependence and effect on the effective sample size and the degrees of freedom are considered. Dotted line is the best-fit AR1 red noise power spectrum and dashed line is the 95% significance level using F-test. 42
43 43
44 Figure 3. Composite extended winter SST anomalies (ERSST.v2) for (a) El Niño and (b) La Niña events for the enhanced ENSO intensity periods. (c) and (d) are the same as (a) and (b), but for the weakened ENSO intensity periods. Contour interval is 0.2 C and the shaded indicates 95% significance level using a t-test. (e)-(h) are the same separately as (a)-(d) but for the HadISST1. 44
 and wind vector anomalies for (a) El Niño and (b) La Niña events for the enhanced ENSO")
45 Figure 4. Composite extended winter surface zonal wind (shaded, unit: m/s) and wind vector anomalies for (a) El Niño and (b) La Niña events for the enhanced ENSO intensity periods. (c) and (d) are the same as (a) and (b), but for the weakened ENSO intensity periods. Shaded is the 95% significance level using a t-test. 45
 and (d) are the same as (a) and (b), but for the weakened ENSO intensity periods. Contour interval is 5x10 18 and the shaded is the 95% significance level using a t-test.")
46 Figure 5. Composite extended winter ocean heat content anomalies (unit: joules) for (a) El Niño and (b) La Niña events for the enhanced ENSO intensity periods. (c) and (d) are the same as (a) and (b), but for the weakened ENSO intensity periods. Contour interval is 5x10 18 and the shaded is the 95% significance level using a t-test. Zero contour line is highlighted. 46
 structures of extended winter SST anomalies for the enhanced ENSO intensity periods (a) and the weakened")
47 Figure 6. The asymmetric (El Niño+La Niña) structures of extended winter SST anomalies for the enhanced ENSO intensity periods (a) and the weakened ENSO intensity periods (b). Contour interval is 0.1 C and the shaded is the 90% significance level using a two-tailed t-test. 47
48 Figure 7. Same as Figure 6, but for the surface wind vector (unit: m/s) and divergence (red) and convergence (blue) anomalies (unit: m/s 2 ). Shaded is the 90% significance level using a two-tailed t-test. 48

49 Figure 8. Same as Figure 6 but for the 20 C isotherm depth anomalies (unit: meter). Shaded is the 90% significance level using a two-tailed t-test. Contour interval is 3 meters. 49
: linear regression between 10-20year bandpass filtered ENVF (Figure 1b) and unfiltered extended winter SST anomalies (unit: C per standard deviation of ENVF, contour interval")
50 Figure 9. Upper panel (Figure 9a): linear regression between 10-20year bandpass filtered ENVF (Figure 1b) and unfiltered extended winter SST anomalies (unit: C per standard deviation of ENVF, contour interval is 0.03); Middle panel (Figure 9b): same as upper panel but for the surface wind (unit: m/s per standard deviation of ENVF); Lower panel (Figure 9c): same as upper panel but for the 20 C isotherm depth (unit: meter per standard deviation of ENVF, contour interval is 2). Shaded is the 90% significance level using F-test. 50
51 Figure 10. The first (a) and second (b) leading EOF mode of 10-20yr bandpass filtered extended winter SST anomalies in the tropical Pacific (120 E-70 W, 30 S- 30 N). Contour interval is 0.01 C. 51
52 Figure 11: Upper panel (Figure 11a): long term mean climatology of 200 hpa velocity potential (unit: 10 6 m 2 s -1 ) with zonal mean removed. Positive indicates sinking motion and negative rising motion. Lower panel (Figure 11b): linear regression between 10-20year bandpass filtered ENVF and unfiltered extended winter 200 hpa velocity potential (unit: 10 6 m 2 s -1 per standard deviation of ENVF). Shaded is the 90% significance level using F-test. 52

 and weakened (b)")
53 Figure 12. Schematic diagram showing the oceanic and atmospheric variations in the tropical Pacific caused by El Niño-La Niña asymmetry forcing during the enhanced (a) and weakened (b) ENSO intensity periods. Dashed lines show the climatology. 53
Subsurface Ocean Temperature Indices for Central-Pacific and Eastern-Pacific Types of El Niño and La Niña Events
 Subsurface Ocean Temperature Indices for Central-Pacific and Eastern-Pacific Types of El Niño and La Niña Events Jin-Yi Yu 1*, Hsun-Ying Kao 2, Tong Lee 3, and Seon Tae Kim 1 1 Department of Earth System
Subsurface Ocean Indices for Central-Pacific and Eastern-Pacific Types of ENSO
 Subsurface Ocean Indices for Central-Pacific and Eastern-Pacific Types of ENSO Jin-Yi Yu 1*, Hsun-Ying Kao 1, and Tong Lee 2 1. Department of Earth System Science, University of California, Irvine, Irvine,
Decadal amplitude modulation of two types of ENSO and its relationship with the mean state
 Clim Dyn DOI 10.1007/s00382-011-1186-y Decadal amplitude modulation of two types of ENSO and its relationship with the mean state Jung Choi Soon-Il An Sang-Wook Yeh Received: 14 February 2011 / Accepted:
Effect of late 1970 s Climate Shift on Interannual Variability of Indian Summer Monsoon Associated with TBO
 Effect of late 97 s Climate Shift on Interannual Variability of Indian Summer Monsoon Associated with TBO 7. Introduction Biennial variability has been identified as one of the major modes of interannual
Traditional El Niño and El Niño Modoki Revisited: Is El Niño Modoki Linearly Independent of Traditional El Niño?
 ATMOSPHERIC AND OCEANIC SCIENCE LETTERS, 2010, VOL. 3, NO. 2, 70 74 Traditional El Niño and El Niño Modoki Revisited: Is El Niño Modoki Linearly Independent of Traditional El Niño? LI Gen, REN Bao-Hua,
J1.2 LINKAGES BETWEEN EL NIÑO AND RECENT TROPICAL WARMING
 J1.2 LINKAGES BETWEEN EL NIÑO AND RECENT TROPICAL WARMING Fei-Fei Jin 1, Soon-Il An 1, Axel Timmermann 2, Jingxia Zhao 1 1 School of Ocean and Earth Science and Technology, University of Hawaii at Manoa,
Changes in the in-phase relationship between the Indian and subsequent Australian summer monsoons during the past five decades
 Ann. Geophys., 25, 1929 1933, 2007 European Geosciences Union 2007 Annales Geophysicae Changes in the in-phase relationship between the Indian and subsequent Australian summer monsoons during the past
Periodic Forcing and ENSO Suppression in the Cane- Zebiak Model
 Journal of Oceanography, Vol. 61, pp. 109 to 113, 2005 Periodic Forcing and ENSO Suppression in the Cane- Zebiak Model AIJUN PAN 1 *, QINYU LIU 1 and ZHENGYU LIU 2,1 1 Physical Oceanography Laboratory,
Biennial Oscillation of Tropical Ocean-Atmosphere System Associated with Indian Summer Monsoon
 Biennial Oscillation of Tropical Ocean-Atmosphere System Associated with Indian Summer Monsoon 2.1 Introduction The Indian summer monsoon displays substantial interannual variability, which can have profound
Goal: Develop quantitative understanding of ENSO genesis, evolution, and impacts
 The Delayed Oscillator Zebiak and Cane (1987) Model Other Theories Theory of ENSO teleconnections Goal: Develop quantitative understanding of ENSO genesis, evolution, and impacts The delayed oscillator
Variability in the tropical oceans - Monitoring and prediction of El Niño and La Niña -
 Variability in the tropical oceans - Monitoring and prediction of El Niño and La Niña - Jun ichi HIROSAWA Climate Prediction Division Japan Meteorological Agency SST anomaly in Nov. 1997 1 ( ) Outline
El Niño and La Niña amplitude asymmetry caused by
 El Niño and La Niña amplitude asymmetry caused by atmospheric feedbacks Claudia Frauen 1 and Dietmar Dommenget 2 1 IFM-GEOMAR, Leibniz Institute of Marine Sciences (at Kiel University) 2 School of Mathematical
APPENDIX B NOAA DROUGHT ANALYSIS 29 OCTOBER 2007
 APPENDIX B NOAA DROUGHT ANALYSIS 29 OCTOBER 2007 ENSO Cycle: Recent Evolution, Current Status and Predictions Update prepared by Climate Prediction Center / NCEP October 29, 2007 Outline Overview Recent
Influence of El Nino Southern Oscillation and Indian Ocean Dipole in biennial oscillation of Indian summer monsoon
 Influence of El Nino Southern Oscillation and Indian Ocean Dipole in biennial oscillation of Indian summer monsoon 4.1 Introduction The main contributors to the interannual variability of Indian summer
The slab ocean El Niño
 GEOPHYSICAL RESEARCH LETTERS, VOL. 37,, doi:10.1029/2010gl044888, 2010 The slab ocean El Niño Dietmar Dommenget 1 Received 28 July 2010; revised 2 September 2010; accepted 3 September 2010; published 16
El Niño and La Niña sea surface temperature anomalies: Asymmetry characteristics associated with their wind stress anomalies
 JOURNAL OF GEOPHYSICAL RESEARCH, VOL. 107, NO. D19, 4372, doi:10.1029/2001jd000393, 2002 El Niño and La Niña sea surface temperature anomalies: Asymmetry characteristics associated with their wind stress
Investigation of Common Mode of Variability in Boreal Summer Intraseasonal Oscillation and Tropospheric Biennial Oscillation
 Investigation of Common Mode of Variability in Boreal Summer Intraseasonal Oscillation and Tropospheric Biennial Oscillation 5. Introduction The Asian summer monsoon is one of the most vigorous and energetic
Asymmetry in zonal phase propagation of ENSO sea surface temperature anomalies
 Click Here for Full Article GEOPHYSICAL RESEARCH LETTERS, VOL. 36, L13703, doi:10.1029/2009gl038774, 2009 Asymmetry in zonal phase propagation of ENSO sea surface temperature anomalies Michael J. McPhaden
INTERDECADAL PACIFIC OSCILLATION TIME SERIES (updated July 2016) Chris Folland, Met Office Hadley Centre for Climate Change and Sevices, Exeter, UK
 Chris Folland, Met Office Hadley Centre for Climate Change and Sevices, Exeter, UK") INTERDECADAL PACIFIC OSCILLATION TIME SERIES (updated July 2016) Chris Folland, Met Office Hadley Centre for Climate Change and Sevices, Exeter, UK The Interdecadal Pacific Oscillation (IPO) is almost
INTERDECADAL PACIFIC OSCILLATION TIME SERIES (updated July 2016) Chris Folland, Met Office Hadley Centre for Climate Change and Sevices, Exeter, UK The Interdecadal Pacific Oscillation (IPO) is almost
The Amplitude-Duration Relation of Observed El Niño Events
 ATMOSPHERIC AND OCEANIC SCIENCE LETTERS, 2012, VOL. 5, NO. 5, 367 372 The Amplitude-Duration Relation of Observed El Niño Events Wu Yu-Jie 1,2 and DUAN Wan-Suo 1 1 State Key Laboratory of Numerical Modeling
RECTIFICATION OF THE MADDEN-JULIAN OSCILLATION INTO THE ENSO CYCLE
 RECTIFICATION OF THE MADDEN-JULIAN OSCILLATION INTO THE ENSO CYCLE By William S. Kessler and Richard Kleeman Journal of Climate Vol.13, 1999 SWAP, May 2009, Split, Croatia Maristella Berta What does give
Western Pacific Interannual Variability Associated with the El Nino Southern Oscillation
 University of South Florida Scholar Commons Marine Science Faculty Publications College of Marine Science 3-15-1999 Western Pacific Interannual Variability Associated with the El Nino Southern Oscillation
ENSO Cycle: Recent Evolution, Current Status and Predictions. Update prepared by Climate Prediction Center / NCEP 8 March 2010
 ENSO Cycle: Recent Evolution, Current Status and Predictions Update prepared by Climate Prediction Center / NCEP 8 March 2010 Outline Overview Recent Evolution and Current Conditions Oceanic Niño Index
Increasing intensity of El Niño in the central equatorial Pacific
 Click Here for Full Article GEOPHYSICAL RESEARCH LETTERS, VOL. 37,, doi:10.1029/2010gl044007, 2010 Increasing intensity of El Niño in the central equatorial Pacific Tong Lee 1 and Michael J. McPhaden 2
Identifying the Types of Major El Niño Events since 1870
 1 2 3 4 5 Identifying the Types of Major El Niño Events since 1870 6 7 8 9 10 11 12 13 14 15 16 17 18 Jin-Yi Yu * and Seon Tae Kim Department of Earth System Science University of California, Irvine, California,
Trade winds How do they affect the tropical oceans? 10/9/13. Take away concepts and ideas. El Niño - Southern Oscillation (ENSO)
") El Niño - Southern Oscillation (ENSO) Ocean-atmosphere interactions Take away concepts and ideas What is El Niño, La Niña? Trade wind and Walker circulation. What is the Southern Oscillation? Tropical
El Niño - Southern Oscillation (ENSO) Ocean-atmosphere interactions Take away concepts and ideas What is El Niño, La Niña? Trade wind and Walker circulation. What is the Southern Oscillation? Tropical
Local vs. Remote SST Forcing in Shaping the Asian-Australian Monsoon Variability
 Local vs. Remote SST Forcing in Shaping the Asian-Australian Monsoon Variability Tim Li IPRC and Dept. of Meteorology, Univ. of Hawaii Acknowledgement. B. Wang, C.-P. Chang, P. Liu, X. Fu, Y. Zhang, Kug
NOTES AND CORRESPONDENCE. Contributions of Indian Ocean and Monsoon Biases to the Excessive Biennial ENSO in CCSM3
 1850 J O U R N A L O F C L I M A T E VOLUME 22 NOTES AND CORRESPONDENCE Contributions of Indian Ocean and Monsoon Biases to the Excessive Biennial ENSO in CCSM3 JIN-YI YU, FENGPENG SUN,* AND HSUN-YING
Influence of enhanced convection over Southeast Asia on blocking ridge and associated surface high over Siberia in winter
 5th Session of the East Asia winter Climate Outlook Forum (EASCOF-5), 8-10 November 2017, Tokyo, Japan Influence of enhanced convection over Southeast Asia on blocking ridge and associated surface high
Analysis of 2012 Indian Ocean Dipole Behavior
 Analysis of 2012 Indian Ocean Dipole Behavior Mo Lan National University of Singapore Supervisor: Tomoki TOZUKA Department of Earth and Planetary Science, University of Tokyo Abstract The Indian Ocean
ENSO Cycle: Recent Evolution, Current Status and Predictions. Update prepared by Climate Prediction Center / NCEP 4 September 2012
 ENSO Cycle: Recent Evolution, Current Status and Predictions Update prepared by Climate Prediction Center / NCEP 4 September 2012 Outline Overview Recent Evolution and Current Conditions Oceanic Niño Index
Lecture 33. Indian Ocean Dipole: part 2
 Lecture 33 Indian Ocean Dipole: part 2 Understanding the processes I continue the discussion of the present understanding of the processes involved in the evolution of the mean monthly SST, and convection
Decadal changes in the relationship between Indian and Australian summer monsoons
 Decadal changes in the relationship between Indian and Australian summer monsoons By C. Nagaraju 1, K. Ashok 2, A. Sen Gupta 3 and D.S. Pai 4 1 CES, C-DAC Pune, India 2 CCCR, IITM, Pune, India 3 Universities
Ocean dynamic processes responsible for the interannual. variability of the tropical Indian Ocean SST. associated with ENSO
 Ocean dynamic processes responsible for the interannual variability of the tropical Indian Ocean SST associated with ENSO Jong Seong Kug 1 and Soon Il An 2, Korea Ocean Research and Development Institute
Kelvin and Rossby Wave Contributions to the SST Oscillation of ENSO
 2461 Kelvin and Rossby Wave Contributions to the SST Oscillation of ENSO IN-SIK KANG AND SOON-IL AN Department of Atmospheric Sciences, Seoul National University, Seoul, Korea 30 May 1997 and 20 October
Remote influence of Interdecadal Pacific Oscillation on the South Atlantic Meridional Overturning Circulation variability
 Remote influence of Interdecadal Pacific Oscillation on the South Atlantic Meridional Overturning Circulation variability 2017 US AMOC Science Team Meeting May 24 th, 2017 Presenter: Hosmay Lopez 1,2 Collaborators:
Impacts of intraseasonal oscillation on the onset and interannual variation of the Indian summer monsoon
 Chinese Science Bulletin 2009 SCIENCE IN CHINA PRESS Springer Impacts of intraseasonal oscillation on the onset and interannual variation of the Indian summer monsoon QI YanJun 1,2,3, ZHANG RenHe 2, LI
Understanding El Nino-Monsoon teleconnections
 Understanding El Nino-Monsoon teleconnections Dr Neena Joseph Mani Earth & Climate Science INSA Anniversary General meeting, Session: Science in IISER Pune 27 th December 2017 Mean State of the equatorial
A Near-Annual Pacific Ocean Basin Mode
 2478 JOURNAL OF CLIMATE A Near-Annual Pacific Ocean Basin Mode IN-SIK KANG AND JONG-SEONG KUG School of Earth and Environmental Sciences, Seoul National University, Seoul, South Korea SOON-IL AN International
Analysis of the non-linearity in the pattern and time evolution of El Niño southern oscillation
 Clim Dyn (23) 4:282 2847 DOI.7/s382-2-47- Analysis of the non-linearity in the pattern and time evolution of El Niño southern oscillation Dietmar Dommenget Tobias Bayr Claudia Frauen Received: March 22
5. El Niño Southern Oscillation
 5. El Niño Southern Oscillation Copyright 2006 Emily Shuckburgh, University of Cambridge. Not to be quoted or reproduced without permission. EFS 5/1 Ocean-Atmosphere Coupling Tropical atmosphere/ocean,
Interaction between equatorially symmetric and asymmetric tropical eastern Pacific SSTs
 Theor Appl Climatol DOI 10.1007/s00704-010-0258-y ORIGINAL PAPER Interaction between equatorially symmetric and asymmetric tropical eastern Pacific SSTs Soon-Il An & Jung Choi Received: 23 September 2009
Changes of The Hadley Circulation Since 1950
 Changes of The Hadley Circulation Since 1950 Xiao-Wei Quan, Henry F. Diaz, Martin P. Hoerling (NOAA-CIRES CDC, 325 Broadway, Boulder, CO 80305) Abstract The Hadley circulation is changing in response to
Lecture 24. El Nino Southern Oscillation (ENSO) Part 1
 Part 1") Lecture 24 El Nino Southern Oscillation (ENSO) Part 1 The most dominant phenomenon in the interannual variation of the tropical oceanatmosphere system is the El Nino Southern Oscillation (ENSO) over the
Lecture 24 El Nino Southern Oscillation (ENSO) Part 1 The most dominant phenomenon in the interannual variation of the tropical oceanatmosphere system is the El Nino Southern Oscillation (ENSO) over the
Propagation of planetary-scale zonal mean wind anomalies and polar oscillations
 Article Atmospheric Science July 2012 Vol.57 No.20: 2606 261 doi: 10.1007/s113-012-5168-1 SPECIAL TOPICS: Propagation of planetary-scale zonal mean wind anomalies and polar oscillations QIAN WeiHong *
The General Circulation and El Niño. Dr. Christopher M. Godfrey University of North Carolina at Asheville
 The General Circulation and El Niño Dr. Christopher M. Godfrey University of North Carolina at Asheville Global Circulation Model Air flow broken up into 3 cells Easterlies in the tropics (trade winds)
ENSO Wrap-Up. Current state of the Pacific and Indian Ocean
 18-11-2014 ENSO Wrap-Up Current state of the Pacific and Indian Ocean Tropical Pacific Ocean moves closer to El Niño The Pacific Ocean has shown some renewed signs of El Niño development in recent weeks.
The Child. Mean Annual SST Cycle 11/19/12
 Introduction to Climatology GEOGRAPHY 300 El Niño-Southern Oscillation Tom Giambelluca University of Hawai i at Mānoa and Pacific Decadal Oscillation ENSO: El Niño-Southern Oscillation PDO: Pacific Decadal
& La Niña Southern Oscillation Index
 El Niño & La Niña Southern Oscillation Index Today: first of the natural changes Lectures 1) El Nino/La Nina: year- decadal changes in climate system 2) Next: Short term natural changes (centuries to millenia)
A Proposed Mechanism for the Asymmetric Duration of El Niño and La Niña
 3822 J O U R N A L O F C L I M A T E VOLUME 24 A Proposed Mechanism for the Asymmetric Duration of El Niño and La Niña YUKO M. OKUMURA Climate and Global Dynamics Division, National Center for Atmospheric
Hui Wang, Mike Young, and Liming Zhou School of Earth and Atmospheric Sciences Georgia Institute of Technology Atlanta, Georgia
 Water Cycle between Ocean and Land and Its Influence on Climate Variability over the South American-Atlantic Regions as Determined by SeaWinds Scatterometers Rong Fu Hui Wang, Mike Young, and Liming Zhou
3. Climatic Variability. El Niño and the Southern Oscillation Madden-Julian Oscillation Equatorial waves
 Georges (1998) 3. Climatic Variability El Niño and the Southern Oscillation Madden-Julian Oscillation Equatorial waves ENVIRONMENTAL CONDITIONS FOR TROPICAL CYCLONES TO FORM AND GROW Ocean surface waters
Enhancement of near-annual variability in the equatorial Pacific in
 EGU Journal Logos (RGB) doi:10.5194/adgeo-33-13-2013 Author(s) 2013. CC Attribution 3.0 License. Advances in Geosciences G Enhancement of near-annual variability in the equatorial Pacific in 2000 2008
Lecture 18: El Niño. Atmosphere, Ocean, Climate Dynamics EESS 146B/246B
 Lecture 18: El Niño Atmosphere, Ocean, Climate Dynamics EESS 146B/246B El Niño Transient equatorial motions: Kelvin and Rossby waves. Positive feedback mechanism associated with air-sea coupling. Atmospheric
Mechanistic links between the tropical Atlantic and the Indian monsoon in the absence of El Nino Southern Oscillation events
 Mechanistic links between the tropical Atlantic and the Indian monsoon in the absence of El Nino Southern Oscillation events Vijay Pottapinjara 1*, Roxy Mathew Koll2, Raghu Murtugudde3, Girish Kumar M
Reconciling disparate 20th Century Indo-Pacific ocean temperature trends in the instrumental record and in CMIP5
 Reconciling disparate 20th Century Indo-Pacific ocean temperature trends in the instrumental record and in CMIP5 Matt Newman and Amy Solomon CIRES/CDC, University of Colorado and NOAA/ESRL/PSD Solomon,
Indian Ocean Dipole - ENSO - monsoon connections and Overcoming coupled model systematic errors
 Indian Ocean Dipole - ENSO - monsoon connections and Overcoming coupled model systematic errors Hilary Spencer, Rowan Sutton and Julia Slingo CGAM, Reading University h.spencer@reading.ac.uk Monsoon -
El Niño / Southern Oscillation (ENSO) and inter-annual climate variability
 and inter-annual climate variability") El Niño / Southern Oscillation (ENSO) and inter-annual climate variability seasonal cycle what is normal? monthly average conditions through a calendar year sea level pressure and surface winds surface
El Niño / Southern Oscillation (ENSO) and inter-annual climate variability seasonal cycle what is normal? monthly average conditions through a calendar year sea level pressure and surface winds surface
ANALYSIS OF UPWELLING CHANGES IN THE EASTERN EQUATORIAL PACIFIC DURING EL NIÑO SOUTHERN OSCILLATION. A Thesis CARLOS FERNANDO PERUGACHI SALAMEA
 ANALYSIS OF UPWELLING CHANGES IN THE EASTERN EQUATORIAL PACIFIC DURING EL NIÑO SOUTHERN OSCILLATION A Thesis by CARLOS FERNANDO PERUGACHI SALAMEA Submitted to the Office of Graduate Studies of Texas A&M
OCN 201 Lab Fall 2009 OCN 201. Lab 9 - El Niño
 OCN 201 Lab Fall 2009 OCN 201 Lab 9 - El Niño El Niño is probably one of the most widely publicized oceanic phenomena. If there s one single reason for that it s probably the fact that El Niño s presence
Appendix E Mangaone Stream at Ratanui Hydrological Gauging Station Influence of IPO on Stream Flow
 NZ Transport Agency Peka Peka to North Ōtaki Expressway Hydraulic Investigations for Expressway Crossing of Mangaone Stream and Floodplain Appendix E Mangaone Stream at Ratanui Hydrological Gauging Station
General Introduction to Climate Drivers and BoM Climate Services Products
 General Introduction to Climate Drivers and BoM Climate Services Products Climate Information Services Australian Bureau of Meteorology Yuriy Kuleshov El Niño Southern Oscillation (ENSO) El Niño Southern
ATMS 310 Tropical Dynamics
 ATMS 310 Tropical Dynamics Introduction Throughout the semester we have focused on mid-latitude dynamics. This is not to say that the dynamics of other parts of the world, such as the tropics, are any
JOURNAL OF GEOPHYSICAL RESEARCH, VOL. 115, D17109, doi: /2009jd013596, 2010
 JOURNAL OF GEOPHYSICAL RESEARCH, VOL. 115,, doi:10.1029/2009jd013596, 2010 Impact of the Atlantic Ocean on the multidecadal fluctuation of El Niño Southern Oscillation South Asian monsoon relationship
Second peak in the far eastern Pacific sea surface temperature anomaly following strong El Niño events
 GEOPHYSICAL RESEARCH LETTERS, VOL. 40, 4751 4755, doi:10.1002/grl.50697, 2013 Second peak in the far eastern Pacific sea surface temperature anomaly following strong El Niño events WonMoo Kim 1 and Wenju
C.-P. Chang and Tim Li 1 Department of Meteorology, Naval Postgraduate School, Monterey, CA Abstract
 TROPCAL TROPOSPHERC BENNAL OSCLLATON AND ENSO C.-P. Chang and Tim Li 1 Department of Meteorology, Naval Postgraduate School, Monterey, CA 93943 Abstract The tropospheric biennial oscillation (TBO) and
Lecture 13 El Niño/La Niña Ocean-Atmosphere Interaction. Idealized 3-Cell Model of Wind Patterns on a Rotating Earth. Previous Lecture!
 Lecture 13 El Niño/La Niña Ocean-Atmosphere Interaction Previous Lecture! Global Winds General Circulation of winds at the surface and aloft Polar Jet Stream Subtropical Jet Stream Monsoons 1 2 Radiation
NOTES AND CORRESPONDENCE. Timing of El Niño Related Warming and Indian Summer Monsoon Rainfall
 1 JUNE 2008 N O T E S A N D C O R R E S P O N D E N C E 2711 NOTES AND CORRESPONDENCE Timing of El Niño Related Warming and Indian Summer Monsoon Rainfall CHIE IHARA, YOCHANAN KUSHNIR, MARK A. CANE, AND
The Role of the Wind-Evaporation-Sea Surface Temperature (WES) Feedback in Tropical Climate Variability
 Feedback in Tropical Climate Variability") The Role of the Wind-Evaporation-Sea Surface Temperature (WES) Feedback in Tropical Climate Variability R. Saravanan Depart ment of At mospheric Sciences, Texas A&M University, College Station Collaborators:
The Role of the Wind-Evaporation-Sea Surface Temperature (WES) Feedback in Tropical Climate Variability R. Saravanan Depart ment of At mospheric Sciences, Texas A&M University, College Station Collaborators:
- terminology. Further Reading: Chapter 07 of the text book. Outline. - characteristics of ENSO. -impacts
 (1 of 14) Further Reading: Chapter 07 of the text book Outline - terminology - characteristics of ENSO -impacts (2 of 14) Today: Introduction We want to look at another source of variability in the atmosphere
Changes in ENSO and associated overturning. circulations from enhanced greenhouse gases by the. end of the 20th century
 Changes in ENSO and associated overturning circulations from enhanced greenhouse gases by the end of the 20th century Zhengqing Ye and William W. Hsieh Dept. of Earth and Ocean Sciences, University of
How fast will be the phase-transition of 15/16 El Nino?
 How fast will be the phase-transition of 15/16 El Nino? YOO-GEUN HAM D E P A R T M E N T O F O C E A N O G R A P H Y, C H O N N A M N A T I O N A L U N I V E R S I T Y 2015/16 El Nino outlook One of strongest
Indian Ocean warming its extent, and impact on the monsoon and marine productivity
 Indian Ocean warming its extent, and impact on the monsoon and marine productivity RIO WIO Indian Ocean warming: o Western Indian Ocean experienced strong, monotonous warming during the last century o
Historical changes in El Niño and La Niña characteristics in an ocean reanalysis
 JOURNAL OF GEOPHYSICAL RESEARCH, VOL. 117,, doi:10.1029/2012jc008031, 2012 Historical changes in El Niño and La Niña characteristics in an ocean reanalysis Sulagna Ray 1,2 and Benjamin S. Giese 1 Received
UNIFIED MECHANISM OF ENSO CONTROL ON INDIAN MONSOON RAINFALL SUNEET DWIVEDI
 UNIFIED MECHANISM OF ENSO CONTROL ON INDIAN MONSOON RAINFALL SUNEET DWIVEDI K Banerjee Centre of Atmospheric and Ocean Studies, M N Saha Centre of Space Studies University of Allahabad, Allahabad, INDIA
Mesoscale air-sea interaction and feedback in the western Arabian Sea
 Mesoscale air-sea interaction and feedback in the western Arabian Sea Hyodae Seo (Univ. of Hawaii) Raghu Murtugudde (UMD) Markus Jochum (NCAR) Art Miller (SIO) AMS Air-Sea Interaction Workshop Phoenix,
 1 2 http://ds.data.jma.go.jp/tcc/tcc/index.html http://ds.data.jma.go.jp/tcc/tcc/index.html Climate in Japan World Climate Extratropics Tropics Oceanograhpic conditions World Climate Page 2 Extratropics
Long-term warming trend over the Indian Ocean
 Long-term warming trend over the Indian Ocean RIO WIO 1. Western Indian Ocean experienced strong, monotonous warming during the last century 2. Links to asymmetry and skewness in ENSO forcing 3. Strong
Review for the second quarter. Mechanisms for cloud formation
 Review for the second quarter Mechanisms for cloud formation 1 Rising air expands and cools; Sinking air compresses and warms. (18) (24) Dry adiabatic lapse rate (10 o C/km): the rate of temperature decrease
Data Analysis of the Seasonal Variation of the Java Upwelling System and Its Representation in CMIP5 Models
 Data Analysis of the Seasonal Variation of the Java Upwelling System and Its Representation in CMIP5 Models Iulia-Mădălina Ștreangă University of Edinburgh University of Tokyo Research Internship Program
Global Circulations. GEOG/ENST 2331 Lecture 15 Ahrens: Chapter 10
 Global Circulations GEOG/ENST 2331 Lecture 15 Ahrens: Chapter 10 Last lecture Microscale (turbulence) Mesoscale (land/sea breeze) Synoptic scale (monsoon) Global scale (3 cell circulation) Three Cell Model
Surface chlorophyll bloom in the Southeastern Tropical Indian Ocean during boreal summer-fall as reveal in the MODIS dataset
 Surface chlorophyll bloom in the Southeastern Tropical Indian Ocean during boreal summer-fall as reveal in the MODIS dataset Iskhaq Iskandar 1 and Bruce Monger 2 1 Jurusan Fisika, Fakultas MIPA, Universitas
The Setting - Climatology of the Hawaiian Archipelago. Link to Video of Maui Waves
 The Setting - Climatology of the Hawaiian Archipelago Link to Video of Maui Waves What caused this week s weather? What caused this weekend s weather? Today s Objective: Provide overview and description
Multifarious anchovy and sardine regimes in the Humboldt Current System during the last 150 years
 Multifarious anchovy and sardine regimes in the Humboldt Current System during the last 5 years Renato Salvatteci, David Field, Dimitri Gutierrez, Tim Baumgartner, Vicente Ferreira, Luc Ortlieb, Abdel
Analysis of the Non-linearity in the Pattern and Time Evolution of El Niño Southern Oscillation!
 2 3 Analysis of the Non-linearity in the Pattern and Time Evolution of El Niño Southern Oscillation! 4 DietmarDommenget *,TobiasBayr 2 andclaudiafrauen SchoolofMathematicalSciences,MonashUniversity,Clayton,Victoria,
(20 points) 1. ENSO is a coupled climate phenomenon in the tropical Pacific that has both regional and global impacts.
 1. ENSO is a coupled climate phenomenon in the tropical Pacific that has both regional and global impacts.") SIO 210 Problem Set 4 Answer key December 1, 2014 Due Dec. 12, 2014 (20 points) 1. ENSO is a coupled climate phenomenon in the tropical Pacific that has both regional and global impacts. (2 points) a)
SIO 210 Problem Set 4 Answer key December 1, 2014 Due Dec. 12, 2014 (20 points) 1. ENSO is a coupled climate phenomenon in the tropical Pacific that has both regional and global impacts. (2 points) a)
El Niño variability in simple ocean data assimilation (SODA),
,") JOURNAL OF GEOPHYSICAL RESEARCH, VOL. 116,, doi:10.1029/2010jc006695, 2011 El Niño variability in simple ocean data assimilation (SODA), 1871 2008 Benjamin S. Giese 1 and Sulagna Ray 1 Received 30 September
JOURNAL OF GEOPHYSICAL RESEARCH, VOL. 116,, doi:10.1029/2010jc006695, 2011 El Niño variability in simple ocean data assimilation (SODA), 1871 2008 Benjamin S. Giese 1 and Sulagna Ray 1 Received 30 September
Are Hurricanes Becoming More Furious Under Global Warming?
 Are Hurricanes Becoming More Furious Under Global Warming? Z H A N L I U N I V E R S I T Y O F U T A H A T M O S P H E R I C S C I E N C E S D E P A R T M E N T T U E S D A Y, M A R C H 1 6, 2 0 1 0 OUTLINE
Lecture 13. Global Wind Patterns and the Oceans EOM
 Lecture 13. Global Wind Patterns and the Oceans EOM Global Wind Patterns and the Oceans Drag from wind exerts a force called wind stress on the ocean surface in the direction of the wind. The currents
Lecture 29. The El-Niño Southern Oscillation (ENSO) La Niña = the girl; corresponds to the opposite climate situation
 La Niña = the girl; corresponds to the opposite climate situation") Lecture 29 The El-Niño Southern Oscillation (ENSO) El Niño is Spanish for Christ child, the name given by fishermen to a warm ocean current off the coast of Peru/Ecuador that in some years occurs near
Lecture 29 The El-Niño Southern Oscillation (ENSO) El Niño is Spanish for Christ child, the name given by fishermen to a warm ocean current off the coast of Peru/Ecuador that in some years occurs near
The Air-Sea Interaction. Masanori Konda Kyoto University
 2 The Air-Sea Interaction Masanori Konda Kyoto University 2.1 Feedback between Ocean and Atmosphere Heat and momentum exchange between the ocean and atmosphere Atmospheric circulation Condensation heat
GEOS 201 Lab 13 Climate of Change InTeGrate Module Case studies 2.2 & 3.1
 Discerning Patterns: Does the North Atlantic oscillate? Climate variability, or short term climate change, can wreak havoc around the world. Dramatic year to year shifts in weather can have unanticipated
Monitoring and prediction of El Niño and La Niña
 Monitoring and prediction of El Niño and La Niña Akio NARUI El Niño Monitoring and Prediction Group Climate Prediction Division Japan Meteorological Agency Outline 1. Introduction of El Niño and La Niña
Tropical Pacific Ocean remains on track for El Niño in 2014
 1 of 10 3/06/2014 3:33 PM ENSO Wrap-Up Current state of the Pacific and Indian Ocean Tropical Pacific Ocean remains on track for El Niño in 2014 Issued on Tuesday 3 June 2014 Product Code IDCKGEWWOO The
LINKAGE BETWEEN INDIAN OCEAN DIPOLE AND TWO TYPES OF El NI 譙 O AND ITS POSSIBLE MECHANISMS
 Vol.22 No.2 JOURNAL OF TROPICAL METEOROLOGY June 2016 Article ID: 1006-8775(2016) 02-0172-10 LINKAGE BETWEEN INDIAN OCEAN DIPOLE AND TWO TYPES OF El NI 譙 O AND ITS POSSIBLE MECHANISMS DONG Di ( ) 1, 2,
NOTES AND CORRESPONDENCE. On Wind, Convection, and SST Variations in the Northeastern Tropical Pacific Associated with the Madden Julian Oscillation*
 4080 JOURNAL OF CLIMATE NOTES AND CORRESPONDENCE On Wind, Convection, and SST Variations in the Northeastern Tropical Pacific Associated with the Madden Julian Oscillation* SOLINE BIELLI AND DENNIS L.
Abrupt seasonal variation of the ITCZ and the Hadley circulation
 GEOPHYSICAL RESEARCH LETTERS, VOL. 34, L18814, doi:10.1029/2007gl030950, 2007 Abrupt seasonal variation of the ITCZ and the Hadley circulation Yongyun Hu, 1 Dawei Li, 1 and Jiping Liu 2 Received 16 June
The Asian Monsoon, the Tropospheric Biennial Oscillation and the Indian Ocean Zonal Mode in the NCAR CSM
 The Asian Monsoon, the Tropospheric Biennial Oscillation and the Indian Ocean Zonal Mode in the NCAR CSM Johannes Loschnigg International Pacific Research Center y School of Ocean and Earth Science and
Currents. History. Pressure Cells 3/13/17. El Nino Southern Oscillation ENSO. Teleconnections and Oscillations. Neutral Conditions
 Teleconnections and Oscillations Teleconnection climate anomalies being related to each other over a large scale Oscillations: Macroscale movement of atmospheric systems that can influence weather, climate,
The Great Paradox of Indian Monsoon Failure (Unraveling The Mystery of Indian Monsoon Failure During El Niño)
") The Great Paradox of Indian Monsoon Failure (Unraveling The Mystery of Indian Monsoon Failure During El Niño) K. Krishna Kumar, B. Rajagopalan, M. Hoerling, G. Bates and M. Cane Point-by-point response
The Great Paradox of Indian Monsoon Failure (Unraveling The Mystery of Indian Monsoon Failure During El Niño) K. Krishna Kumar, B. Rajagopalan, M. Hoerling, G. Bates and M. Cane Point-by-point response