WIND-INDUCED PRESSURES ON CANOPIES ATTACHED TO THE WALLS OF LOW-RISE BUILDINGS
|
|
|
- Justin Pearson
- 6 years ago
- Views:
Transcription
1 WIND-INDUCED PRESSURES ON CANOPIES ATTACHED TO THE WALLS OF LOW-RISE BUILDINGS José Daniel Candelario Suárez A Thesis In The Department Of Building, Civil and Environmental Engineering Presented in Partial Fulfillment of the Requirements For the Degree of Master of Applied Science (Building Engineering) at Concordia University Montreal, Quebec, Canada November 2012 José Daniel Candelario Suárez, 2012 i
2 This is to certify that the thesis prepared CONCORDIA UNIVERSITY School of Graduate Studies By: Entitled: José Daniel Candelario Suárez Wind-induced pressures on canopies attached to the walls of low-rise buildings and submitted in partial fulfillment of the requirements for the degree of Master of Applied Science (Building Engineering) complies with the regulations of the University and meets the accepted standards with respect to originality and quality. Signed by the final examining committee: Chair Dr. O. Pekau Examiner Dr. S. Rakheja External (to program) Examiner Dr. K. Galal Supervisor Dr. T. Stathopoulos Approved by Dr. Maria Elektorowicz, GPD Department of Building, Civil and Environmental Engineering Dr. R. Drew, Dean Faculty of Engineering and Computer Science Date ii
3 ABSTRACT WIND-INDUCED PRESSURES ON CANOPIES ATTACHED TO THE WALLS OF LOW-RISE BUILDINGS JOSE DANIEL CANDELARIO SUAREZ Current knowledge regarding wind-induced pressures on attached canopies is restricted to a limited number of studies. As a result, most wind standards and codes of practice do not provide guidelines for the design of such components. This thesis consists of a parametric study that expands current knowledge by providing a better understanding on the behavior of pressure coefficients acting on canopies attached to low rise buildings. All experimental results presented on this study have been carried out in the Building Aerodynamics Laboratory of Concordia University. Two canopy models have been fabricated for the purpose of this study in the form of rectangular thin plates with pressure taps equally distributed along both upper and lower faces. These canopy models were attached at different locations on an acrylic glass building model with a gable roof of 4:12 slope. A total of 63 geometrically unique configurations were selected for this parametric study. The experiments were performed in the boundary layer wind tunnel for a simulated open terrain exposure. The 63 configurations, as well as the location of pressure taps on both faces of the canopy allow a detailed investigation of the different wind loading patterns exhibited as a function of the changes in the building geometry. A total number of 28 different wind directions have iii
4 been tested for every configuration. Local and area-averaged peak values of the induced pressures have been analyzed as a function of the different geometrical relationships, which are unique to each configuration. The experimental results indicate that a slight difference in the geometry of the attached canopy and the parent building can result in an 80% difference of the peak net pressure coefficient. It has also been noted that the most critical uplift forces occur in canopies located above the intermediate regions of the parent wall. In contrast, downward forces exhibit less sensitivity to changes in geometry. Following the analysis and observations of the experimental data, recommended design guidelines have been provided for implementation in wind standards and building codes of practice. Comparisons with previous experimental results and provisions of other international standards and codes of practice are provided. iv
5 ACKNOWLEDGMENTS I would like to express my sincere gratitude to Dr. Theodore Stathopoulos for his guidance and supervision during the course of this study and for his undying willingness to pass his knowledge on to others. Special thanks are due to my friend and colleague Dr. Ioannis Zisis for his involvement in the study and for the revision of this thesis. I would also like to express my gratitude to my friends and colleagues at Concordia University for their company and support both inside and outside the office. I wish to dedicate this work to my grandfather Gumersindo Suárez González and to my mother María Teresa Suárez Toro. v
6 TABLE OF CONTENTS LIST OF FIGURES...x LIST OF TABLES... xvii CHAPTER 1 INTRODUCTION OVERVIEW SCOPE AND OBJECTIVES THESIS ORGANIZATION...4 CHAPTER 2 LITERATURE REVIEW DESCRIPTION OF EXISTING WORK JUSTIFICATION OF THE PRESENT STUDY...12 CHAPTER 3 EXPERIMENTAL METHODOLOGY GENERAL CONCEPT OF A BOUNDARY LAYER WIND TUNNEL CHARACTERISTICS OF THE BLWT CONCORDIA UNIVERSITY BUILDING AERODYNAMICS LABORATORY Physical characteristics Instrumentation Characteristics of the simulated flow PRESSURE COEFFICIENTS...31 vi
7 3.4.1 Definition of pressure coefficients Pressure coefficients applied to this study Pressure coefficients and velocity averaging periods BUILDING MODELS AND CONFIGURATIONS TESTED Selection of scale Description of attached canopy and parent building model Definition of Parameters and Configurations Tested...42 CHAPTER 4 PRESSURE COEFFICIENTS ON UPPER AND LOWER SURFACES SEPARATELY GENERAL EFFECT OF WIND DIRECTION ON SURFACE PRESSURES PRESSURES ON UPPER AND LOWER SURFACE PRESSURES...49 Effect of hc/h, hc/wc and ed/lc on the upper surface of the canopy...49 Effect of hc/h, hc/wc and ed/lc on the lower surface of the canopy LOCAL PRESSURE COEFFICIENTS ON REGIONS OF UPPER AND LOWER SURFACES ENVELOPES OF PPRESSURE COEFFICIENTS ON UPPER AND LOWER SURFACES...58 CHAPTER 5 NET PRESSURE COEFFICIENTS ON ATTACHED CANOPIES GENERAL...63 vii
8 5.2 EFFECT OF WIND DIRECTION ON CRITICAL NET PRESSURE COEFFICIENTS VISUALIZATION OF FLOW AROUND THE CANOPY NET PRESSURES AND CORRELATION COEFFICIENTS EFFECT OF PARAMETERS ON NET PRESSURE COEFFICIENTS Effect of Effect of Effect of canopy length (lc) and location (ed) NET LOCAL PRESSURE COEFFICIENTS DIVIDED BY REGIONS COMPARISONS WITH EXPERIMENTAL RESULTS OF PREVIOUS STUDIES ENVELOPES OF NET PRESSURES...89 CHAPTER 6 TOWARDS CODIFICATION GENERAL RECOMMENDED DESIGN GUIDELINES FOR ATTACHED CANOPIES Design guidelines for suctions on upper and lower surfaces Design Guidelines for Net loads COMPARISONS WITH CURRENT DESIGN PROVISIONS AZ/NZS : DIN EN /NA: viii
9 6.3.3 ASCE 7-10 overhangs and partially enclosed structure CHAPTER 7 CONCLUSIONS AND RECOMMENDATIONS FOR FUTURE STUDIES SUMMARY CONCLUSIONS LIMITATIONS AND RECOMMENDATIONS FOR FUTURE STUDIES REFERENCES BIBLIOGRAPHY APPENDIX A APPENDIX B APPENDIX C ix
10 LIST OF FIGURES Figure 1.1 Canopy attached to a low-rise residential building...2 Figure 1.2 Canopy destroyed by hurricane winds...2 Figure 2.1 Canopy model mounted on the force balance system, after Jancauskas and Holmes (1985)...7 Figure 2.2 Internal manifolding and pressure tap location of attached canopy surface used for pressure measurements, after Jancauskas and Holmes (1985)...8 Figure 2.3 Segment obtained from the provisions of the AS/NZS : Figure 2.4 Segment obtained from the provisions of the DIN EN Figure 2.5 Illustration relating the attached canopy to the roof of a Partially Enclosed Building...13 Figure 2.6 Expected differences in flow patterns between a roof overhang and a canopy attached at a high and at an intermediate portion of the parent wall...13 Figure 2.7 Comparison of recommended local net pressure coefficients according to the five currently available design provisions...14 Figure 3.1 Construction plans of the Boundary Layer Wind Tunnel at Concordia University s Building Aerodynamics Laboratory, after Stathopoulos (1984)...19 x
11 Figure 3.2 Open terrain exposure at the BLWT in the Building Aerodynamics Laboratory at Concordia University...20 Figure 3.3 Schematic of the experimental setup at the boundary layer wind tunnel..22 Figure 3.4 Boundary layer flow and notation used for elevations and velocities...23 Figure 3.5 Wind velocity and turbulence intensity profiles for open-terrain exposure...24 Figure 3.6 Variation of C and m with roughness length, after Counihan (1975)...27 Figure 3.7 Spectra of longitudinal turbulence component at =, after Stathopoulos (1984)...30 Figure 3.8 Illustration of the generation of net pressure coefficients, Cp,net...34 Figure 3.9 Gust duration curve, after Durst (1960)...36 Figure 3.10 Building configuration tested...39 Figure 3.11 Building model with different canopies in place...40 Figure 3.12 Top view of building and canopy model showing pressure tap locations...40 Figure 3.13 Ranges of the modifiable dimensions of the canopy and parent building model...42 Figure 4.1 Canopies with sheathing attached to the lower surface of the beam and joist system...46 xi
12 Figure 4.2 Attached canopy (not to scale) with sheathing at both upper and lower surfaces highlighting components affected by upper and lower surface pressure coefficients...46 Figure 4.3 Wind directions tested for each of the 63 configurations, after Zisis (2010)...47 Figure 4.4 Effect of wind direction on peak minimum, and peak maximum on the upper surface of a canopy extending over the full length of the parent wall...48 Figure 4.5 Effect of wind direction on peak minimum, and peak maximum on the lower surface of a canopy extending over the full length of the parent wall...48 Figure 4.6 Effect of hc/h on Peak Local, and Area-Averaged...50 Figure 4.7 Effect of hc/wc on peak local, and area-averaged...51 Figure 4.8 Effect of length and edge distances on local and area-averaged...52 Figure 4.9 Effect of hc/h on peak local, and area-averaged...54 Figure 4.10 Effect of hc/h on peak local, and area-averaged...54 Figure 4.11 Effect of length and edge distances on local and area-averaged...55 xii
13 Figure 4.12 Division of regions on the attached canopy (adapted from ASCE 7-10 for flat low-pitch roofs)...57 Figure 4.13 Peak local at different regions of the canopy as a function of hc/h...57 Figure 4.14 Peak local at different regions of the canopy as a function of hc/h...58 Figure 4.15 Area-averaging effect and corresponding envelopes for the upper surface of the canopy on all configurations tested...60 Figure 4.16 Area-averaging effect and corresponding envelopes for the lower surface of the canopy on all configurations tested...61 Figure 4.17 Envelopes for pressure coefficients as a function of effective areas at upper and lower surfaces of all 63 configurations combined...62 Figure 5.1 Drawing of a conventional canopy attached to a low rise building (not to scale) indicating the components affected by net loads...64 Figure 5.2 Effect of wind direction on peak minimum, peak maximum and mean for a canopy extending over the full length of the parent wall...66 Figure 5.3 Effect of wind direction on peak minimum, peak maximum and mean for an eccentrically placed canopy extending over half of the length of the parent wall...66 Figure 5.4 Wind directions at the occurrence of minimum and maximum peak Cp, net...67 xiii
14 Figure 5.5 Flow visualization for a canopy attached at the mid height of the parent wall and a zero degree azimuth...68 Figure 5.6 Flow visualization for a canopy attached close to the eave height of the parent wall and a zero degree azimuth...69 Figure 5.7 Pressure and correlation coefficient contour plots for a canopy attached at the mid height of the parent wall and a zero degree azimuth...71 Figure 5.8 Pressure and correlation coefficient contour plots for a canopy attached close to the eave height of the parent wall and a zero degree azimuth...72 Figure 5.9 Pressure and correlation coefficient contour plots for a canopy attached at the mid height of the parent wall and the critical wind direction...75 Figure 5.10 Pressure and correlation coefficient contour plots for a canopy attached close to the eave height of the parent wall and the critical wind direction...76 Figure 5.11 Effect of hc/h on local, and area-averaged for wc = 3.65m...78 Figure 5.12 Effect of on local and area-averaged for = Figure 5.13 Effect of ratio on local and area-averaged for = Figure 5.14 Effect of length and edge distances on local and area-averaged...82 Figure 5.15 Two and three dimensional contour plots displaying the distribution of the net pressure coefficients on attached canopy...83 xiv
15 Figure 5.16 Peak local as a function of at the different regions of the canopy...84 Figure 5.17 Comparison between results of the present study and Jancauskas and Holmes, Figure 5.18 Comparison between results of the present study and Hölscher et al Figure 5.19 Area averaging effect and envelopes for the corresponding ranges of Cases I, II and III separately...91 Figure 5.20 Area-alleviation effect and corresponding envelopes for all 63 configurations combined...92 Figure 6.1 Proposed design values for min and on attached canopies...94 Figure 6.2 Proposed design values for GCp, net on attached canopies...97 Figure 6.3 Comparisons between the recommended envelopes of the present study and AS/NZS provisions Figure 6.4 Comparison between the recommended local net pressure coefficients of the present study and the DIN provisions for three different hc/h ratios Figure 6.5 Comparisons between the recommended design values for a full length canopy and ASCE 7-10 for overhangs xv
16 Figure 6.6 Comparisons between the recommended design values for three different hc/h ratios and ASCE 7-10 provisions for the roof of a partially enclosed building xvi
17 LIST OF TABLES Table 3.1 Configurations tested and definition of nomenclature used..44 Table 6.1 Geometrical reduction factors for min and.95 Table 6.2 Geometrical reduction factor for the local...98 xvii
18 CHAPTER 1 INTRODUCTION 1.1 OVERVIEW An attached canopy is a roof adjacent to a building not enclosed by walls and used for recreational purposes rather than as a storage space or carport (see Fig. 1.1). This kind of addition is of common use in low-rise housing because it provides an adequate space for many social and leisure activities with partial protection from the elements. Because their main function is to provide shelter from the rain and direct sunlight, attached canopies are generally lightweight and as a result wind loading is often the governing design consideration. Under-designing an attached canopy can lead to its partial or complete destruction (see Fig. 1.2). In an extreme scenario the shattered canopy can generate projectiles that may cause further damage to neighboring buildings. With this in mind, members of industry and practitioners have been compelled to design attached canopies using highly conservative loads because of the lack of specific design provisions. Currently there is only limited knowledge as of what the proper design loads should be for these types of structures. Neither the National Building Code of Canada 2010 (NBCC), nor the American Society of Civil Engineers Standard (ASCE 7-10) has established any provisions for the proper design of attached canopies. In North America, 1


19 Figure 1.1 Canopy attached to a low-rise residential building Figure 1.2 Canopy destroyed by hurricane winds 2
20 only the International Building Code (IBC 2012) and the International Residential Code (IRC 2012) contain some provisions to address this issue. However, these provisions do not seem to result from a detailed study. Several codes and standards from other parts of the world do provide wind loading design guidelines for attached canopies (sometimes referred to as awnings), however these have been found to present some limitations and inconsistencies within each other. By expanding the knowledge regarding wind loading patterns on attached canopies, the selection of materials and the economical aspects related to its design and construction can be assessed more efficiently whilst ensuring the integrity of the canopy s structure and components and cladding elements. 1.2 SCOPE AND OBJECTIVES This thesis consists of a parametric study which aims to expand current knowledge on the wind loading design of canopies attached to low-rise buildings. This is done by examining the sensitivity of the wind loads acting on the attached canopy to changes in the relative dimensions of the canopy and the parent building, i.e. the building to which the canopy is attached. Pressures have been obtained from wind tunnel simulation at both upper and lower surfaces of the canopy for an array of geometrical configurations and wind directions. Separate upper and lower pressures are to be used in the design of components 3
21 and cladding elements, while simultaneous (net) pressures are to be used in the design of the principal structure of the attached canopy. The principal objective of this study is to generate wind loading design guidelines for attached canopies. These guidelines could be considered for implementation on future wind standards and building codes of practice. Comparisons between the findings of the present study and the available international studies and design guidelines are presented to assess the possible discrepancies and limitations of each. 1.3 THESIS ORGANIZATION Chapter 2 consists of the literature review. A discussion of the pertinent studies currently available is provided as well as a justification for the present study. Chapter 3 presents the experimental methodology performed for the fulfilment of this thesis. The concept of a Boundary Layer Wind Tunnel (BLWT) and proper simulation of the boundary layer is explained. The features of the BLWT at Concordia University s Building Aerodynamics Laboratory and the flow properties used for experimentation are presented. Finally, the fabrication details of the building and attached canopy model as well as the parameters and configurations tested are described. Chapter 4 presents the analyses of the experimental results for both peak local and area averaged suctions on both upper and lower surfaces of the attached canopy 4
22 individually. The relationships between the peak pressures and the variation of critical parameters are presented. The area-averaging effect for the peak suctions obtained for every configuration are summarized into one figure for the upper surface and one for the lower surface of the canopy. Chapter 5 presents the analyses of the experimental results for both peak local and area averaged net pressure coefficients. The patterns observed are expanded upon by the use of contour plots, correlations coefficients between upper and lower surfaces, and flow visualization still frame photographs. The relationships between the peak pressures and the variation of each isolated parameter are observed and commented upon. Comparisons between the experimental data of the present study to previous studies are presented. Consequently, the peak net pressure coefficients obtained for every configuration are summarized into one figure. In Chapter 6 the experimental findings are summarized into design recommendations to be considered for implementation in building codes and standards. Subsequently, comparisons between the recommended design guidelines of the present study and the other available provisions are made. Finally, conclusions, limitations, and recommendations for future research on the subject are presented in Chapter 7. 5
23 CHAPTER 2 LITERATURE REVIEW 2.1 DESCRIPTION OF EXISTING WORK The number of studies related to the effect of wind-induced pressures on attached canopies is presently limited. In addition, available studies have been found to present some limitations and inconsistencies with each other. All of the experimental studies comprised in this literature review are based on the results obtained from boundary layer wind tunnel experimentation. The first available study is the work of Jancauskas and Holmes (1985). These experiments were performed in two different boundary layer wind tunnels an urban terrain exposure. The integrated peak loads exerted on the attached canopies were measured by different methods at each of the wind tunnels. One of the studies used a force-balance method whose experimental setup is shown in Figure 2.1. The other method considered pressure-based measurements. Figure 2.2 illustrates the array of the pressure taps used in the attached canopy model for this portion of the study. A total of 14 configurations were tested in this study by varying the height of the parent building, the height of the attached canopy, the length of the canopy, and its width. It must be noted that the configurations tested in this study do not consider the effect that the location of the canopy along the length of the adjacent building will generate on the 6
24 wind-induced pressures. Furthermore, it must be noted that only integrated peak loads are presented. This study is the basis of the provisions available on the Australian/New Zealand Standard as shown in Figure 2.3. Paluch et al. (2003) carried out extensive work regarding wind loads on canopies attached to arched roofs. A total of 30 configurations of arched-roof buildings with attached canopies of different geometries were tested using a pressure based measuring system in a boundary layer wind tunnel. The focus of this study however, is more oriented towards the static wind loads on the arched roofs as a result of the presence of an attached canopy. In addition, pressures on the attached canopies have not been measured in upper and lower surfaces simultaneously. Figure 2.1 Canopy model mounted on the force balance system, after Jancauskas and Holmes (1985) 7
25 Figure 2.2 Internal manifolding and pressure tap location of attached canopy surface used for pressure measurements, after Jancauskas and Holmes (1985) 8
26 9
27 For each configuration 24 wind directions were tested. Both local and area integrated peak loads have been analyzed. The results and analysis resulting from this study form the basis of the design guidelines provided in Eurocode 1 for Wind Actions (DIN EN : ) shown in Figure 2.4. Goyal et al. (2007) carried out a critical review in which the latest research being done in the subject is discussed. Comparisons between the provisions on the AZ/NZS :2002 and the IS: 875 (Part-3)-1987 are also provided. It is concluded that currently available codes of practice provide insufficient information regarding the wind pressure coefficients on buildings with attached canopies, and thus states the need for further investigation on the subject. Zisis and Stathopoulos (2010) carried out a detailed study on wind-induced pressures on attached canopies. The experiments were performed on a boundary layer wind tunnel for a roughness simulating an open terrain exposure. The loads were determined using a system of pressure sensitive scanners. For each configuration a total of 28 wind directions were tested. This study presents both local and area averaged peak loads, as well as pressure and correlation coefficient contour plots so as to give a better understanding of the loading patterns on attached canopies. Some comparisons are also made with the corresponding design guidelines provided by the AZ/NZS :2002. It must be noted, however that this study was limited to 3 different configurations. 10
28 Figure 2.4 Segment obtained from the provisions of the DIN EN
29 In addition to the AZ/NZS :2002 and the DIN EN /NA: , provisions for the wind load design of attached canopies are also available on the Austrian Standard (ÖNORM B ), the Swiss Standard (Schweizerische Norm, SIA 261), and the Indian Standard code of practice for design loads (IS: 875 (Part-3)-1987). However, it is unclear if these provisions are the result of other wind tunnel studies or if they are just adaptations of other design provisions. 2.2 JUSTIFICATION OF THE PRESENT STUDY The National Building Code of Canada (NBCC) and the American Society of Civil Engineering Minimum Design Loads of Buildings and Other Structures (ASCE 7-10) both lack provisions for the design of attached canopies. As a result, many practitioners in North America have resolved to design such elements by adapting currently available provisions so as to obtain an idea of an adequate pressure coefficient. One of these approaches is to consider the attached canopy as if it were the roof of a Partially Enclosed Building (ASCE 7-10) or a Building with Large Openings (NBCC) as shown in in Figure 2.5. Another approach is to consider the canopy as an extension of the roof overhang, thus designing it with the corresponding provisions. As it can be seen in Figure 2.6, this results in significant geometrical differences which are in turn expected to have a substantial impact on the flow patterns about the attached canopy. 12
30 Figure 2.5 Illustration relating the attached canopy to the roof of a Partially Enclosed Building Figure 2.6 Expected differences in flow patterns between a roof overhang and a canopy attached at a high and at an intermediate portion of the parent wall 13
31 In addition to this, the several Wind Standards and Codes of practice that do provide design guidelines for wind-induced pressures on attached canopies, exhibit several limitations and inconsistencies as expressed by Zisis and Stathopoulos (2010), and Goyal et al. (2007). It has been seen for many cases that these guidelines do not seem to yield consistent results with each another. This is illustrated in Figure 2.7 where the design values suggested by each of the aforementioned standards are plotted for three identical configurations Net Pressure Coefficient SIA DIN ÖNORM AS/NZS IS hc/h Figure 2.7 Comparison of recommended local net pressure coefficients according to the five currently available design provisions (all pressure coefficient values are referenced to the dynamic velocity pressure based on a 3-sec averaging wind speed measured at the mean roof height) 14
32 The objective of this thesis is to attend to these demands and inconsistencies by providing a more extensive parametric study so as to produce more reliable design guidelines for the design of attached canopies. As it has been previously stated by Goyal et al. (2007): Codes of practice of different countries dealing with design of structures for wind load, including Indian Standard on Wind Loads, do not give enough information regarding wind pressure coefficients on the buildings with projections ( ) very little experimental research work has been done so far on buildings with projections, particularly attached canopies ( ) it is, therefore, required to carryout further studies to investigate the effects of attached canopies on wind loads on buildings. 15
33 CHAPTER 3 EXPERIMENTAL METHODOLOGY 3.1 GENERAL A parametric study has been carried out to assess the impact that changing the dimensions of an attached canopy and its geometry relative to the parent building will have on the wind-induced loading. A modifiable model of a low rise structure with an attached canopy has been constructed and examined in a Boundary Layer Wind Tunnel while monitored by pressure sensitive scanners placed along both surfaces of the canopy model. In this chapter the pertinent aspects regarding the aforementioned process are explained in greater detail. 3.2 CONCEPT OF A BOUNDARY LAYER WIND TUNNEL The boundary layer phenomenon results from the interaction of a free flow and a submerged body. Friction forces occurring at the interaction between the particles of air and the surface of the submerged body result in interruptions of the free flow. These interruptions can be seen as marked deviations between velocities measured over small periods of time (e.g. 3-sec gusts) and the average wind velocity. The magnitude of the variation in the wind velocity with respect to the arithmetic mean is generally used to 16
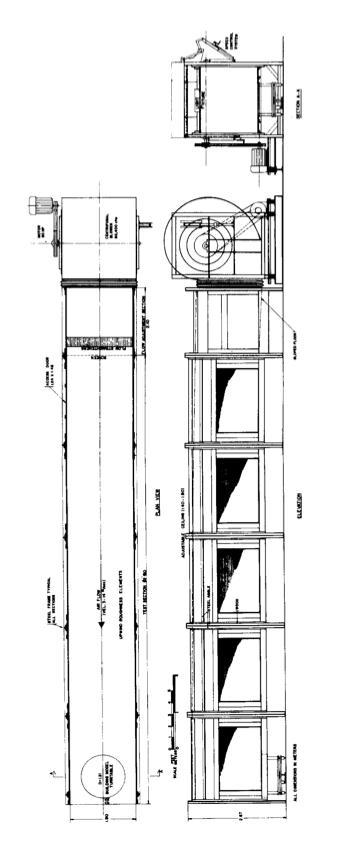
34 define the turbulence of a flow. The higher the surface roughness the higher the turbulence is expected to be and thus the properties of the boundary layer flow are altered. The atmospheric boundary layer is the result of the interaction of the wind and the surface of the earth. A boundary layer wind tunnel (BLWT), as opposed to a conventional wind tunnel, recreates the interaction between the wind and the terrain so as to simulate the natural characteristics of the wind at a defined scale. Most BLWTs today are based on the contributions of Danish engineer Martin Jensen (Jensen 1958). He observed that by building very long wind tunnels and by modelling the surface roughness, proper simulation of the wind could be achieved. Jensen (1958) formulated scaling laws for proper wind tunnel simulations by comparing pressures on a full scale low rise structure to a model in a boundary layer wind tunnel. Presently, in order to assess proper simulation, the mean velocity and turbulence intensity profiles, the longitudinal scale of turbulence, and the power spectra of the longitudinal velocity are considered fundamental. 3.3 CHARACTERISTICS OF THE BLWT AT THE CONCORDIA UNIVERSITY BUILDING AERODYNAMICS LABORATORY Physical characteristics The BLWT in the Building Aerodynamics Laboratory (BAL) at Concordia University is of the open circuit return type and consists of a 1.8m x 1.8m (6ft x 6ft) cross section and a working section of about 12m (39.4ft) long. Top, side, and front views retrieved from the original construction plans are provided in Figure 3.1. The flow is 17
35 generated by a MARK HOT double inlet centrifugal blower with a capability of providing 40 (86400 cfm). As a result, a maximum testing wind speed of 14.0 m/sec can be attained. The wind speed can be reduced to 3 m/sec by manually adjusting the outlet control. The floor is covered with a polypropylene carpet and the ceiling consists of wooden panels of adjustable height. Different terrain exposures may be simulated by the addition of floor panels with specific roughness elements and by adjusting the ceiling to achieve a zero longitudinal pressure gradient. In this way, the proper simulation of the atmospheric flow for any exposure category can be ensured. It must be noted, however, that every experiment comprised in this study has been conducted for an open terrain exposure (low roughness) as shown in Figure 3.2. At the test section a turntable of a 1.20m diameter has been placed to allow for the testing of models for any desired wind direction. Additionally, an acrylic glass window has been placed at the wind tunnel wall to facilitate flow visualization experimentation without having the equipment interfere with the flow. 18
36 19

37 Figure 3.2 Open terrain exposure at the BLWT in the Building Aerodynamics Laboratory at Concordia University 20
38 3.3.2 Instrumentation Instrumentation used for the measurement of flow phenomena in the BLWT at the Building Aerodynamics Laboratory consisted of two major independent systems for velocity and for pressure measurements. Velocity related measurements, such as wind speed and turbulence intensity profiles, were performed using a 4-hole Cobra Probe (Turbulent Flow Instrumentation) in combination with an automated traverse system (Rotalec). Measurements were conducted at a sampling rate of 1000Hz for a duration of approximately 30 seconds. The gradient mean wind velocity was set at approximately 13.4 m/s. Pressure measurements were conducted using a Digital Service Module DSM 3400 as the Data Acquisition System (DAS) in combination with a ZOC33/64Px pressure scanner and Thermal Control Unit (TCU) system all from Scanivalve Corp. The pressure taps in the building models are connected to the ZOC33/64Px scanners using urethane flexible tubing. Compressed air is connected to the system for purging and calibration purposes. The DAS was operated by a second computer connected to the DSM 3400 through an Ethernet network connection. A schematic of the experimental setup is shown in Figure 3.3. The scanning period was set at 50 microseconds for 64 channels resulting in a sampling frequency of Hz. A total of 8200 frames are thus scanned in approximately 26.2 seconds, corresponding to a full-scale storm of approximately 1 hour. In addition, a fog generator (Dantec) and a high speed camera were used for the flow visualisation portion of the study. 21
39 Figure 3.3 Schematic of the experimental setup at the boundary layer wind tunnel Characteristics of the simulated flow In order for the pressure measurements obtained in the wind tunnel to have a physical meaning one must first be assured that the flow generated at the testing section adequately simulates the properties of the atmospheric wind. Comparisons between theoretical and experimental velocity profiles, turbulence intensity, integral scale of turbulence, and spectra of the velocity fluctuations are defined and evaluated in this section to assess the validity of the experimentation. The variation of the mean velocity as a function of elevation ( z) and the location of the gradient height ) after which the mean wind velocity is constant ( are 22
40 23
41 24
42 where α is a the power law exponent which depends on the type of exposure. It has been observed that a power law exponent of α = 0.14 provides the best agreement with the measured values, which conforms to full scale measurements of an open terrain exposure (Liu, 1991). The experimental turbulence intensity is compared to the theoretical values as given by: (3.2) where c and d are terrain-dependant coefficients (Zhou and Kareem, 2002) taken as 0.15 and 0.11, respectively, for an open terrain exposure. In general, it can be seen that the experimental values obtained for the velocity and turbulence intensity profiles show a good agreement with the theoretical properties of an atmospheric flow at an open terrain exposure. Velocity fluctuations at a certain height inside the atmospheric boundary layer can be defined as a sequence of eddies being transported by the mean wind velocity in a periodic fluctuation with a circular frequency, where is the frequency. The integral scales of turbulence measure the average size of these eddies. The length of an eddy can be measured in three dimensions for three different components of the fluctuating wind (longitudinal, transverse, and vertical). As a result, nine integral length scales of turbulence have been defined (Simiu and Scanlan, 1996). For wind tunnel experimentation, it has been found that the most important to simulate amongst the nine integral scales of turbulence is the longitudinal size of the eddy in the longitudinal direction of the velocity fluctuations. 25
43 is defined as: Mathematically the integral length scale of turbulence in the longitudinal direction (3.9) where is the autocovariance function of the fluctuation which relates the similarity of the wind signal to itself at a certain time lag. An experimental value of 112m has been estimated at one sixth of the boundary layer depth for an open terrain exposure (Stathopoulos, 1984). In addition, the following empirical expression has been proposed (Counihan, 1975) for estimation of length scale of turbulence in the longitudinal direction: (3.10) where z is the height in meters, and C and m can be determined from Figure 3.6 as a function of the roughness length. Evaluating the expression at an elevation of one sixth the gradient height and using the experimental roughness length = 0.01cm an approximated value of 122m is obtained. It can be noted that both values obtained for the approximation of the integral length scale of turbulence in the longitudinal direction fall within the ranges of the experimental values measured for an open terrain exposure (Shiotani, 1971). 26
44 27
45 (3.11) where is the variance of the longitudinal wind speed, n is the frequency and is the power spectral density of the longitudinal turbulence component at a given height z. Two principal analytical and empirical spectral representations have been regarded to closely approximate the behavior of the atmospheric flow. The first is the analytical expression known as Von Karman s equation: ( ) (3.12) where, (3.13) and, (3.14) in which, = mean wind speed at height Z; = length scale of turbulence in the longitudinal direction; d = displacement length 28
46 = roughness length The second is known as Davenport s empirical expression defined as: ( ) (3.15) where, (3.16) and where is the mean wind speed at a 10m (32.8 ft) height. It must thus be noted that this expression does not take into consideration the variation of the spectrum with respect to height. The spectra of longitudinal velocity fluctuations have been measured at the BLWT at the Building Aerodynamics Laboratory in Concordia University at a height of one sixth of the boundary layer height has been obtained for an open terrain exposure (Stathopoulos, 1984). Figure 3.7 shows the comparison of the experimental spectrum compared to the curves obtained from Von Karman s and Davenport s equations. It can be seen that for lower wave numbers (n / ) Von Karman s equation seems to coincide better with the experimental data. For the intermediate wave numbers, where the highest energy in the turbulence occurs, Davenport s equation provides a better fit. In general it can be seen that there is a good agreement in between the experimental and theoretical 29
47 30
48 3.4 PRESSURE COEFFICIENTS The magnitude of the forces exerted on a structure exposed to wind activity depends on factors related to either the characteristics of the building or the properties of the wind. The effect that the geometry of the building has on the pressures to which it will be submitted is the principal goal of most boundary layer wind tunnel experimentation for codification purposes. The properties of the wind that have an impact on the pressures, most importantly the wind speed, can vary significantly for different geographic location, different terrain exposures and different wind directions. Pressure coefficients thus result as a convenient way to express relative pressures only as a function of the structure s geometry. In this section, the fundamental definition of a pressure coefficient is provided and the specific pressure coefficients used in this study are defined Definition of pressure coefficients Pressure coefficients are dimensionless numbers that refer all pressures measured at the surface of the structure to the mean dynamic pressure of the upstream wind. Pressure coefficients are derived from Bernoulli s principal, which is defined as: (3.17) 31
49 where is the density of the air, and are the velocity and the static pressure upstream from the body and and are the velocity and the local pressure exerted at the interface with the submerged body. Equation (3.17) can be rewritten as: = constant (3.18) from which the pressure coefficients are derived as: = constant (3.19) = constant (3.20) Cp (3.21) If the pressure coefficient at a specific location along the body of a structure is known, then the corresponding force can be easily obtained by multiplying the pressure coefficient by the design dynamic pressure q and the corresponding tributary area A as shown: (3.22) 32
50 3.4.2 Pressure coefficients applied to this study All data acquired by the pressure scanner is presented in dimensionless form by use of pressure coefficients in accordance to the following equation: Cp = (3.23) where, = surface pressure at tap; = static pressure; = dynamic pressure at mean roof height converted from by use of the power law as follows: (3.24) Since the attached canopy is generally a thin element exposed to wind pressures on both upper and lower surfaces it is essential to consider the pressures acting simultaneously on each plane. This is done by the use of net pressure coefficients as defined in the following equation: (3.25) where, and are measured at top and bottom components, respectively, of a pressure tap pair as illustrated in Figure 3.8. It must be noted that the negative sign represents a pressure directed away from the surface (suction) and a positive sign represents a pressure directed towards a surface. If this convention is maintained when 33
51 computing net loads in accordance with Eq. (3.25) a negative value for a will result in a net uplifting load, where as a positive value will result in a net downwards loading. Figure 3.8 Illustration of the generation of net pressure coefficients, Cp,net Throughout this study peak pressure coefficients may be identified as either local or area-averaged. A local peak refers to the critical value experienced at a single pressure tap (or pressure tap pair in the case of local ). An area-averaged refers to the peak value that the entire surface experiences determined by the average of every pressure tap (or pressure tap pair) simultaneously. Additionally, local and area-averaged pressure coefficients may be referred to as either minimum, maximum or mean. These are defined respectively as: (3.26) (3.27) 34
52 (3.28) where,, and are the extreme upward, extreme downward, and mean pressure at a pressure tap or pressure tap pair during the entire duration of the simulated storm Pressure coefficients and velocity averaging periods The magnitude of the design velocities depends greatly upon the time period for which it is averaged, e.g. a maximum velocity averaged over a three second duration, is expected to be considerably higher than a velocity averaged over 1 hour. The duration of the averaging period will affect the average dynamic pressure to which the pressure coefficients are normalized. Since the dynamic pressure is in the denominator (see Eq. (3.23)), longer averaging periods will result in higher magnitude pressure coefficients. It can thus be seen that pressure coefficients carry a physical meaning only when used with a design wind speed which has been averaged over the same period of the simulated storm. All results presented in this study have resulted from simulated storms of 1 hour duration. However, major building codes and standards provide pressure coefficients that conform to different averaging periods, most commonly: 3-seconds gust, 10-minutes, and 1 hour. In Chapter 6 to properly undertake code comparisons and to generate code recommendations all pressure coefficients have been converted to comply with 3-second average velocities. If the ratio of a 3 second gust to a 1 hour wind speed ( ) is known then the conversion of a pressure coefficient measured at a 1 hour averaging period ( ) can 35
53 be converted into a pressure coefficient corresponding to a 3 second gust ( ) as follows: (3.29) The relationship between the velocities and the averaging period has led to numerous studies and debates, however, the Durst gust duration curve (Durst, 1960) presented in Figure 3.9 is widely regarded as a useful tool to estimate the relationship between velocities corresponding to different averaging periods (. t(seconds) Figure 3.9 Gust duration curve, after Durst (1960) 36
54 3.5 BUILDING MODELS AND CONFIGURATIONS TESTED The design and construction of an adequate building model is essential for any type of wind tunnel study. The selection of a scale that is physically feasible whilst conforming to the flow properties simulated at the BLWT is often a subject of much scrutiny. Additionally, in the case of a parametric study, the selection of the ranges in the relative geometries to be examined is also subjected to much judgement so as to serve geometrical configurations commonly encountered in practice. In this section, these aspects are attended to and all of the configurations to be tested are defined Selection of scale Following the analyses of the flow properties in the BLWT at the Building Aerodynamics Laboratory of Concordia University, it has been established that a geometric scale of 1:400 is optimal for simulation experiments (Stathopoulos, 1984). However, limitations are frequently encountered and the modelling of the optimal scale is not always feasible. Experiments have been performed to assess the errors that result from varying the scale (Stathopoulos, 1983) and it has been seen that increasing the scale within an acceptable range may result in only minimal deviations of the peak and mean pressure coefficients. It has also been seen that adequately simulating the turbulence is of uppermost importance to the extreme fluctuating pressures in low rise structures (Tieleman et al. 1998). 37
55 For this study, the optimal scale of 1:400 was not a feasible option. The limitation was imposed by the thin canopy model and the importance for it to have pressure taps at both upper and lower surfaces at the same locations in the horizontal plane. This was done by sandwiching metallic tubing elements in between two thin metallic plates and welding them together. The smallest thickness that could be achieved was of 10mm (. In a 1:400 scale this would correspond to a thickness of 40cm (15.74 in) which is unusual for most canopies encountered in practice. In a 1:100 scale, however, a 10mm ( thickness would correspond to a 10cm (3.8 in) full-scale thickness, which conforms better to dimensions encountered in practice. The turbulence intensity at the mean roof height for the three different parent building heights tested where found to be 17.9% (mrh = 4.5 cm), 15.5% (mrh = 8 cm), and 14.4% (mrh = 11.3 cm) thus complying with the importance of proper simulation of the turbulence intensity when dealing with low-rise buildings (Tieleman et al. 1998). Taking into consideration the technical limitations, the geometric scale of 1:100 was considered as the most suitable for the present experimentation Description of attached canopy and parent building model The parent building was constructed out of acrylic glass with a gabled-roof of slope 4:12, base dimensions of 15 cm by 10 cm (length-width) and a ridge height of cm to represent the 1:100 geometric scale. Figure 3.10 shows the parent building used for experimentation with its complete dimensions. The parent wall of the building model consists of five wall segments of unique widths which may be arranged in 38
56 different ways so as to provide a slot at different positions to which the canopy model can be attached. The parent building and canopy model can be seen in Fig Two separate canopy models have been made out of thin sandwiched metallic plates. One of the canopy models stretches over the half length of the parent wall whereas the other stretches over the entire length (Fig 3.11 a and b respectively). Both models have the same width of 3.65 cm. Pressure taps have been placed at both upper and lower surfaces of the canopy at the same locations in the horizontal plane to form pressure tap pairs which enable the determination of net pressure coefficients. Pressure tap locations for both canopy models are shown in Figure The half-length canopy model has a 16,40 Figure 3.10 Building models tested (dimensions in cm) 39

57 (a) (b) Figure 3.11 Building model with different canopies in place Pressure tap location Pressure tap location *even numbered channels are located underneath the channels shown Figure 3.12 Top view of building and canopy model showing pressure tap locations 40
58 total of 18 pressure taps (9 pressure tap pairs) and the full-length canopy model has a total of 30 pressure taps (15 pressure tap pairs). The transformable model allows for many different geometrical relationships between the canopy and the parent building. Every unique parent building-to-canopy geometric relationship will be referred to as a configuration during the course of this study. The modifiable dimensions and their respective ranges are illustrated in Figure By shifting the slot at which the canopy is attached along the Y axis, the height of the canopy (hc) can be varied. The eave height of the building (h) can also be varied by fixing the model to an adjustable base. The length of the canopy along the X axis (lc) can be modified by employing either the full-length or the half-length canopy model as defined before. The half-length canopy may also be shifted along the X axis to account for different edge distances (ed). In addition, the width of the canopy may be varied along the Z direction by either pushing or pulling the canopy model inside the slot of the parent building. 41

59 Figure 3.13 Ranges of the canopy and parent building model dimensions Definition of Parameters and Configurations Tested The adjustable model allows for a great number of configurations to be tested. In the case of a parametric study, the testing of numerous configurations is important in order to have a higher confidence in the trends observed. However, the amount of time dedicated to the experimentation and analysis of data results as a limiting factor regarding the number of configurations that can be tested. A total of 63 configurations has been esteemed to be an efficient compromise between time and dependability for this parametric study. Table 3.2 provides all of the dimensions corresponding to each individual configuration. It may be seen that each configuration is unique in at least one of the following four geometrical ratios: 42
60 -ratio of the canopy height to the eave height -ratio of the canopy height to the canopy width -ratio of the length of the canopy to the length of the parent wall -ratio of the edge distance to the canopy length These ratios serve as the principal parameters for the observations of this study. Their effect on the wind loading patterns exerted on the attached canopy are presented in detail on Chapters 4 and 5. 43


61 Table 3.1 Configurations tested and definition of nomenclature used Configuration h hc wc hc/h hc/wc Case 1 lc = 15 ed = 0 Case 2 lc = 7.5 ed = 3.75 Case 3 lc = 7.5 ed =
62 CHAPTER 4 PRESSURE COEFFICIENTS ON UPPER AND LOWER SURFACES SEPARATELY 4.1 GENERAL Canopies are often constructed as a beam and joist system to which the sheathing elements are fastened. Sheathing elements are commonly attached to the upper side of the joists (refer to Appendix A for construction plans). However, it is not uncommon to add an additional layer of sheathing underneath the joists as can be seen in Figure 4.1. When both sides of a sheathing element are unexposed to wind loads the pressures acting independently on upper and lower surfaces are essential for the design of the fastening system with the joists. Furthermore, cladding elements such as roof tiles and shingles commonly fixed to the sheathing are always exposed to wind loads in only one surface. Figure 4.2 shows a sketch illustrating the principal components of an attached canopy with sheathing elements on both upper and lower surfaces. The analyses and observations made on this section serve as the basis for their recommended design provisions. Although the failure of these components will rarely result in the complete failure of the canopy, lose sheathing and component and cladding elements may act as projectiles resulting in more significant damage to neighbouring buildings or to the parent building itself. 45

 with")

63 Figure 4.1 Canopies with sheathing attached to the lower surface of the beam and joist system Figure 4.2 Attached canopy (not to scale) with sheathing at both upper and lower surfaces highlighting components affected by upper and lower surface pressure coefficients 46
64 4.2 EFFECT OF WIND DIRECTION ON SURFACE PRESSURES Pressure coefficients on attached canopies may vary significantly with wind direction. A total of 28 azimuths have been examined for each of the 63 configurations. These are illustrated in Figure 4.3 where it can be noted that a wind direction refers to the direction perpendicular to the containing wall and a ( ) wind direction refers to the direction parallel to the containing wall. Figures 4.4 and 4.5 display the maximum and minimum values as a function of wind direction on upper and lower surfaces of the canopy. It may be observed that the peak pressure coefficients vary significantly for different wind directions. It may also be seen that the peaks do not necessarily occur at the same wind direction for upper and lower surfaces. For this reason, every peak value presented in this chapter refers to its corresponding critical wind direction unless otherwise stated. Figure 4.3 Wind directions tested for each of the 63 configurations, after Zisis (2010) 47
65 Figure 4.4 Effect of wind direction on peak minimum, and peak maximum on the upper surface of a canopy extending over the full length of the parent wall Figure 4.5 Effect of wind direction on peak minimum, and peak maximum on the lower surface of a canopy extending over the full length of the parent wall 48
66 4.3 PRESSURES ON UPPER AND LOWER SURFACES In this section the impact that each geometrical ratio has on the pressures exerted upon the canopy is examined. This is done by varying an isolated parameter while maintaining the others constant. Four dependant variables are investigated for each case: the local minimum and maximum (Loc. Min. ; Loc. Max.) which refer to the critical values experienced at a single pressure tap, and the area-averaged minimum and maximum (Area-avg. Min. ; Area-avg. Max.), which refer to the peak value that the entire surface experiences determined by the critical simultaneous averages at every pressure tap Effect of hc/h, hc/wc and ed/lc on the upper surface of the canopy Peak local and area-averaged values as a function of the ratio (see Table 3.2 for definition of parameters) are presented in Figure 4.6. It can be seen that an increase in the ratio results in an increase of the local min. For higher ratios the magnitude of the local min lower ratios. It has also been noted that the can be up to 1.8 times larger than that of ratio has very little effect on the areaaveraged min which generally has a value near In the case of the local and area-averaged max very little change is found for lower ratios. For > 0.68 an inversely proportional relationship has been found to occur between the max 49
67 and the ratio. Additionally, it can be seen that the magnitude of the local max for higher ratios can be nearly 2 times smaller than that of a lower ratio. Peak local and area-averaged values as a function of the ratio are presented in Figure 4.7. It can be seen that very little change in the local and areaaveraged min results when the ratio is varied. The same can be said about the local and area-averaged max. In general, Figure 4.7 suggests that the magnitudes of local and area-averaged pressures on the upper surface of the attached canopy are nearly independent of the ratio. Peak Cp, upper wc = 3.65m; Lc = 15m Loc. Min. Area-avg. Min. Area-avg. Max. Loc. Max hc/h Figure 4.6 Effect of hc/h on peak local, and area-averaged 50
68 hc/h = 0.34; lc = 15m Peak Cp, upper Loc. Min. Area-avg. Min. Loc. Max. Area-avg. Min hc/wc Figure 4.7 Effect of hc/wc on peak local, and area-averaged Figure 4.8 shows the effect that the ratio and the largest edge distance (ed) have on the local and area-averaged upper surface pressure coefficient. For the case of net pressure coefficients, the ratio has a marked impact on the local min. It can be seen that for a canopy extending over the full length of the parent wall ( ) the magnitude of the highest local suction may be 1.5 times higher than that for canopies extending over half the length ( ). On the contrary, very little difference is observed between a canopy placed at the corner of the parent wall and one placed at the center. It may also be noted that area averaged min as well as local and area averaged max display little or no sensitivity to the and the ratios. 51
69 -4.0 hc/h = 0.94 ; wc = 3.65 m -3.0 Peak Cp, upper lc/l = 1 ed/lc = 0 lc/l = 0.5 ed/lc = 0.5 Loc. Min. Area-avg. Min. Area-avg. Max. Loc. Max. lc/l = 0.5 ed/lc = ed/lc Figure 4.8 Effect of length and edge distance on peak local and area-averaged Effect of hc/h, hc/wc and ed/lc on the lower surface of the canopy Peak local and area-averaged values as a function of the ratio are presented in Figure 4.9. It can be seen that both local and area-averaged min display very little sensitivity to the ratio. The highest local min amongst the configurations shown has a value of whereas the lowest value was The Areaaveraged min generally has a value of around -1.0 regardless of the ratio. This is consistent with what was seen for the area-averaged suctions on the upper surface of the canopy. Similarly, it can be seen that the area-averaged max displays little sensitivity to changes in the ratio. Additionally, these variations are small and do not 52
70 occur in a well-defined trend. The local max also displays little sensitivity to the ratio, however, the magnitudes increase slightly as the ratio is increased. It can be concluded from Figure 4.9 that the magnitudes of local and area-averaged pressures on the lower surface of the attached canopy are nearly unaffected by the variation of the ratio. Peak local and area-averaged as a function of the ratio are shown in Figure It can be seen that both local and area-averaged min display a slight direct proportionality with the ratio. However, little sensitivity is seen since the largest local min has a value that is only 1.10 times larger than the smallest. In the case of the local and area-averaged max the same slight direct proportionality with the ratio can be observed. The largest local max is only 1.15 times larger than the smallest shown. It can be concluded that the local and areaaveraged pressures on the lower surface of the attached canopy are nearly independent of the ratio. Figure 4.11 shows local and area-averaged lower surface pressure coefficients as a function of the ratio. It can be seen that both local and area averaged minimum and maximum appear to be unaffected by the ratio and the largest edge distance (ed). 53

71 wc = 3.65m; lc = 15m Peak Cp, lower Loc. Min. Area-avg. Min. Area-avg. Max. Loc. Max hc/h Figure 4.9 Effect of hc/h on peak local, and area-averaged hc/h = 0.94m; lc = 7.5m Peak Cp, lower Loc. Min Area-avg. Min. Area-avg. Max. 2.0 Loc. Max hc/wc Figure 4.10 Effect of hc/wc on peak local, and area-averaged 54
72 -4.0 hc/h = 0.94 ; wc = 3.65 m -3.0 Peak Cp, lower lc/l = 1 ed/lc = 0 lc/l = 0.5 ed/lc = 0.5 Loc. Min. Area-avg. Min. Area-avg. Max. Loc. Max. lc/l = 0.5 ed/lc = ed/lc Figure 4.11 Effect of length and edge distance on peak local and area-averaged 4.4 LOCAL PRESSURE COEFFICIENTS ON REGIONS OF UPPER AND LOWER SURFACES Local values have been found to differ considerably at different locations within the attached canopy. It has been seen that higher uplifting forces occur at the leading edge and corner regions, where separation of flow occurs, as opposed to the interior regions, where lower suctions and higher pressures are to be expected due to the proximity to the stagnation points in the parent wall. This is an important aspect to be considered for the design of component and cladding elements, such as fasteners and roofing shingles or tiles. 55
73 The surface of the attached canopy has been divided into three regions: corner, edge and interior. The schematic in Figure 4.12 defines the limits of each region. A local peak associated to a region refers to the highest magnitude found in any single pressure tap inside that region. Peak local pressure coefficients acting at the different regions of the upper surface of the canopy are given on Figure 4.13 as a function of the ratio. It can be seen that for 0.68 there is very little difference between the highest min occurring at the different regions. In contrast, for ratios larger than 0.68 the difference is significant. The highest suction at the corner region is 1.2 times larger than the highest suction at the edge region and nearly 2 times larger than that of the interior region. In the case of the max there is very little difference between the peaks occurring in the interior and edge regions regardless of the ratio. In the corner regions, however, a marked reduction is observed. Peak local pressure coefficients acting at the different regions of the lower surface of the canopy are given on Figure 4.14 as a function of the ratio. The peak min appear to occur with similar magnitudes in any of the three regions and no clear trend can be identified. In the case of the max there is very little difference between the magnitudes of the peaks occurring at the edge and interior region, and once again these are generally higher than the peaks occurring at the corners. Tabulated results for peak pressure coefficients at the different regions of the canopy are provided in Appendix B1 for every configuration tested in this study. 56
74 Notation: a: 10% of wc or 0.4hc, whichever is smaller, but not less than either 4% of wc or 3ft (0.9m) Figure 4.12 Division of regions on the attached canopy (adapted from ASCE 7-10 for flat low-pitch roofs) wc = 3.65m; Lc = 15m Corner Min. Peak Cp, upper Edge Min. Corner Max. Interior Max. Interior Min hc/h Edge Max. Figure 4.13 Peak local at different regions of the canopy as a function of hc/h 57
75 wc = 3.65m; Lc = 15m Peak Cp, lower Corner Min. Edge Min. Interior Min. Corner Max. 2.0 Interior Max. Edge Max hc/h Figure 4.14 Peak local at different regions of the canopy as a function of hc/h 4.5 ENVELOPES OF PPRESSURE COEFFICIENTS ON UPPER AND LOWER SURFACES The area-averaging effect has been assessed for the pressures acting on both upper and lower surfaces of the canopy separately by averaging the peak pressures experienced at increasing numbers of adjacent pressure tabs and assigning them to their corresponding tributary area. Figure 4.15 shows the peak suctions acting on the upper surface (min ) as a function of their corresponding tributary area for each of the 63 configurations tested. Each graph contains the 21 area-averaging curves obtained for the corresponding Case (see Table 3.2). Envelope lines for each of the three cases have been 58
76 superimposed into the corresponding graphs. It can be noted that the envelope line for the curves of Case 1 is significantly higher than for the other two cases. The same approach was followed for the suctions acting on the lower surface of the canopy. Figure 4.16 shows the peak min as a function of their corresponding tributary area for every configuration tested. It can be noted once again that the envelope line for the curves of Case 1 is significantly higher than that of Cases 2 and 3. The monotonically decreasing relationship between the tributary area and the magnitudes of the peak pressure coefficients is observed for every configuration tested. In addition, the significant difference in the magnitudes of the envelope for Case 1 with the envelopes of Cases 2 and 3, suggests that the peak min and are sensitive to the the ratio which is consistent with what was seen in Figure
77 -4.0 Case I Cp. upper Case II Cp, upper Case III Cp, upper (0.1) (0.9) (9.3) (92.9) Effective Wind Area, ft² (m²) Figure 4.15 Area-averaging effect and corresponding envelopes for the upper surface of the canopy on all configurations tested 60
78 -4.0 Case I Cp, lower Case II Cp, lower Case III Cp, lower (0.1) (0.9) (9.3) (92.9) Effective Wind Area, ft² (m²) Figure 4.16 Area-averaging effect and corresponding envelopes for the lower surface of the canopy on all configurations tested 61
79 The most critical envelopes for the min and min as a function of the tributary area are presented together in Figure These envelopes have both been obtained for Case 1, which represents a canopy extending over the entire length of the parent wall ( ). Local suction forces at the lower surface of the canopy are considerably lower than those at the upper surface, whereas a smaller difference can be seen as the effective area is increased Upper surface Cp, upper/lower Lower surface (0.1) (0.9) (9.3) (92.9) Effective Wind Area, ft² (m²) Figure 4.17 Envelopes for pressure coefficients as a function of effective areas at upper and lower surfaces of all 63 configurations combined 62
80 CHAPTER 5 NET PRESSURE COEFFICIENTS ON ATTACHED CANOPIES 5.1 GENERAL Attached canopies are exposed to wind loads on both upper and lower surfaces simultaneously. Pressures applied to the sheathing elements are transferred to the main structural components of the canopy, namely the joists, header beam and the columns. This section focuses on the peak local and area-averaged net loads experienced by the canopy for different geometrical configurations. Figure 5.1 shows a sketch illustrating the principal components of a conventional canopy attached to a low-rise structure. The analyses and observations made on this section serve as the basis for the design of the labeled components. Detailed construction plans of conventional wooden canopies attached to low rise structures are provided in Appendix A. 63

81 Figure 5.1 Drawing of a conventional canopy attached to a low rise building (not to scale) indicating the components affected by net loads 5.2 EFFECT OF WIND DIRECTION ON CRITICAL NET PRESSURE COEFFICIENTS It has been seen that pressure coefficients on attached canopies may vary significantly with wind direction. A total of 28 azimuths have been examined for each of the 63 configurations (see Figure 4.3). It can be noted that a wind direction refers to the direction perpendicular to the containing wall and a ( ) wind direction refers to the direction parallel to the containing wall. Figures 5.2 and 5.3 display the maximum, minimum and mean values as a function of wind direction for two different configurations (refer to Appendix B2 for 64
82 other configurations). For a canopy extending over the entire length of the parent wall as shown in Figure 5.2 it can be seen that the highest magnitudes for peak minimum values occur at the 330º (30º) wind direction. The highest peak maximum occurs at the 225º (135º) wind direction. In addition, the lowest magnitudes for both maximum and minimum values were found to occur when the canopy is placed at the leeward wall (180º). It must be noted that peak values display a great sensitivity to wind direction. In the configuration examined, the peak minimum obtained at 330º (30º) degrees is more than five times that encountered at 180º. In the case presented in Figure 5.3 for a canopy extending half the length of the parent wall and placed eccentrically along the length of the parent wall, a very different behavior is observed. The highest magnitude peak minimum values are found to occur for wind directions running parallel to the building ridge 90º (270º) and the highest peak maximum values occur at wind directions nearly perpendicular to the ridge 15º (345º). As in the previous case, the lowest magnitudes for both maximum and minimum values were found to occur when the canopy is placed at the leeward wall. It can thus be concluded that wind direction has a significant impact on the peak. Figure 5.4 shows the critical wind directions for all of the 63 configurations separately for Cases I, II, and III. It can be seen that different wind directions result as critical for different configurations. For this reason, every peak value presented in this chapter refers to its corresponding critical wind direction unless otherwise stated. 65


83 Figure 5.2 Effect of wind direction on peak minimum, peak maximum and mean for a canopy extending over the full length of the parent wall Figure 5.3 Effect of wind direction on peak minimum, peak maximum and mean for an eccentrically placed canopy extending over half of the length of the parent wall 66
84 mid height, and near the eave height of the parent wall. Still shots for zero degree wind direction are provided in Figures 5.5 and 5.6 for these configurations. For a canopy attached at the mid height, stagnation of flow occurs at the parent wall both above and below the canopy. Stagnation of flow above the canopy will result in a downward flow running along the surface of the parent wall which will ultimately inflict a downward force on the upper surface of the canopy. Stagnation of flow in the parent wall underneath the canopy will in turn generate flow directed towards the lower surface of the canopy resulting in an upward force. These two counteracting forces at upper and lower surfaces are expected to result in a decreased net uplifting pressure coefficient (min ). 67
 resulting in a dominating upwards flow which generates a force directed towards the lower surface of the canopy.")
85 In the case of a canopy attached closer to the eave height, flow stagnates more significantly at the parent wall underneath the canopy (see Figure 5.6) resulting in a dominating upwards flow which generates a force directed towards the lower surface of the canopy. In contrast, high levels of flow separation occur at the upper surface of the canopy resulting in dominating suctions. The combination of high suctions acting on the upper surface and high pressures on the lower surface is expected to result in an increased uplifting force, i.e. a higher net uplifting pressure coefficient. It can thus be expected that the higher the location of the canopy along the parent wall, i.e. the higher the ratio, the higher the net uplifting pressures will be. Conversely, it may also be expected that higher net downward forces occur for lower ratios. hc/h = 0.5 wc = 3.65m lc = 15m Figure 5.5 Flow visualization for a canopy attached at the mid height of the parent wall and a zero degree azimuth 68

86 hc/h = 0.94 wc =3.65m lc = 15m Figure 5.6 Flow visualization for a canopy attached close to the eave height of the parent wall and a zero degree azimuth 5.4 NET PRESSURES AND CORRELATION COEFFICIENTS Instrumentation of the canopy model with pressure taps at both upper and lower surfaces allows for the monitoring of pressure coefficients at either surface separately ( ; ) or their simultaneous effect at the same position of the canopy ( ). This provides the possibility of a clearer understanding of the wind loading patterns that the attached canopy is exposed to. Pressure and correlation coefficient contour plots for a canopy attached to both the mid height, and eave height of the parent wall are given in Figures 5.7 and 5.8, respectively, again for a zero degree wind direction. Figure 5.7 shows that for a wind direction perpendicular to the parent wall the upper surface of the canopy experiences downward loading of higher magnitudes than the suctions. In the bottom surface pressures are significantly higher than suctions as well. It must be noted however that despite having a peak max of more than 1.20, the 69
87 peak min was found to be This phenomenon of counteracting forces can be further observed by the correlation coefficient contour plot (see Figure 5.7) exhibiting a high positive value between upper and lower surfaces of the canopy. It can be seen that the combined effect of pressures acting on upper and lower surfaces of canopies placed far from the eave (lower ratios) will result in significant reductions to the loads experienced in either side, thus resulting in a reduced min. In contrast, it can be seen from Figure 5.8 that for a canopy placed closer to the eave height dominant suctions occur on the upper surface in combination with dominant pressures on the lower surface. The high suctions in the upper surface, particularly along the corners and leading edges, are attributed to the phenomenon of flow separation (refer 70
88 Figure 5.7 Pressure and correlation coefficient contour plots for a canopy attached at the mid height of the parent wall and a zero degree azimuth 71
89 Figure 5.8 Pressure and correlation coefficient contour plots for a canopy attached close to the eave height of the parent wall and a zero degree azimuth 72
90 to Figure 5.6 for flow visualization photograph). The dominant high pressures on the lower surface of the canopy result from the upward flow generated by the stagnation of flow underneath the surface of the canopy. In this case a peak min of -2.30, in combination with a peak max of 0.60, results in a peak min of The correlation coefficients for this configuration range from weak to zero implying that the high suctions occurring at the upper surface of the canopy do not occur in a well-defined pattern with the positive pressures in the lower surface of the canopy. This can be reflected by the fact that the min value is increased, but only by a small amount over the individual contribution of the min and max to the net uplifting forces on the canopy. Despite their weak correlation, the combined effect of the high suction and high pressure contributions at upper and lower surfaces respectively, result in an increase min for higher ratios. It has been seen, however, that peak values do not necessarily occur at wind directions perpendicular to the length of the canopy. Pressure and correlation coefficient contour plots for a canopy attached at the mid height of the parent wall are given in Figure 5.9 for the critical wind direction. When compared to the contours for a zero degree wind direction for the same configuration (refer to Fig. 5.7) it can be seen that the peak min is significantly increased at the leftmost corner and the peak max is decreased. Furthermore, the correlation coefficient at the same corner has been decreased. As a result, the peak min has been increased by more than 4 times the magnitude of that found for the zero degree wind direction. Pressure and correlation coefficient contour plots for a canopy attached near the eave height of the parent wall are given in Figure 5.10 for the critical wind direction. 73
91 When compared to the contours for a zero degree wind direction for the same configuration (refer to Fig. 5.8) it can be seen that the min and max are significantly increased at the rightmost corner. It may be also seen that the correlation coefficient is slightly increased. As a result the min is increased by nearly 1.5 times the magnitude of that found for the zero degree wind direction. It is to be noted that the peak min = recorded was the largest observed for any configuration examined. Additional contour plots for Cases II and III are provided in Appendix B3. 74

92 Figure 5.9 Pressure and correlation coefficient contour plots for a canopy attached at the mid height of the parent wall and the critical wind direction (75) 75
93 Figure 5.10 Pressure and correlation coefficient contour plots for a canopy attached close to the eave height of the parent wall and the critical wind direction 76
94 5.5 EFFECT OF PARAMETERS ON NET PRESSURE COEFFICIENTS In this section the impact that each parameter has on the loads exerted upon the canopy is examined. This is done by varying an isolated parameter while maintaining the others constant. Four dependant variables are investigated for each case: the local minimum and maximum (Loc. Min. ; Loc. Max.) which refer to the critical values experienced at a single pressure tap pair, and the area-averaged minimum and maximum (Area-avg. Min. ; Area-avg. Max.) which refer to the peak value that the entire surface experiences determined by the critical simultaneous averages at every pressure tap pair Effect of Local and area-averaged values as a function of the ratio are presented in Figure It can be seen that a higher location of the canopy along the parent wall will generally result in higher net uplifting pressures (min ) on the canopy. It may also be noted that for ratios smaller than 0.5, peak min values display little sensitivity to a slight increase in the canopy height. For intermediate heights ( a higher sensitivity is seen as the slope for the local peak min is increased. Finally, for values greater than or equal to 0.9 a more notable increase occurs. The change from a low to a high ratio can result in an increase of more than 3 times the magnitude of the peak local min. It can thus be concluded that net uplifting 77
95 pressures are highly sensitive to the ratio. This is consistent with what was expected based on the analyses of the flow visualization photographs and what was found in the pressure coefficient contour plots. The net downward pressure coefficients (max ), on the other hand, portray a smaller sensibility to the ratio. Figure 5.11 shows that the area-averaged max decreases slightly as the ratio is increased. In the case of the maximum local values, no trend appears to be well defined. However, the highest maximum local encountered is only 1.3 times larger than the smallest. It can thus be seen that net downwards pressures are considerably less sensitive to the ratio than the net uplifting pressures wc = 3.65m Loc. Min. Peak Cp, net Area Avg. Min Area Avg. Max. Loc. Max hc/h Figure 5.11 Effect of hc/h on local, and area-averaged for wc = 3.65m 78
96 5.5.2 Effect of Local and area-averaged values as a function of the ratio are presented in Figure 5.12 for an ratio of 0.94, since this showed to be more critical in Figure When the width of the canopy (wc) is decreased while maintaining its ratio constant, the net uplifting forces will initially increase, which can be explained by the reduction of surface area for the reattachment of flow to take place. However, when the width is further reduced the vortices generated in the gap between the canopy and the roof overhang have a greater influence on the net uplifting forces. This results in a marked reduction of both local and area-averaged min values. In addition, it must be noted that the highest local min encountered is only 1.3 times larger than the lowest. Net downward pressure coefficients, on the other hand, portray an inversely proportional relationship to the ratio, probably due to the effect of stagnation occurring at the portion of the parent wall located underneath the canopy. The portion of the total canopy area exposed to the strongest upwards flow becomes more significant when wc is decreased. As a result, the net downward loading is decreased. The highest local max encountered is 2.5 times larger than the lowest. Given that the proximity to the roof overhang, as well as the dominance of upward flow are considered to be determinant factors in the effect of ratio on a building with a high ratio, the interest to examine the effect of on a lower 79
97 -4.0 hc/h = 0.94 ; lc = 7.5m Peak Cp, net Loc. Min. Area-avg. Min. Area-avg. Max Loc. Max hc/wc Figure 5.12 Effect of on local and area-averaged for = 0.94 ratio arises. Figure 5.13 shows the local and area-averaged values as a function of for an ratio of Clearly at this lower ratio the effect of on the net uplifting forces appears to be negligible for both local and area-averaged peak values. In the case of the net downward pressures, increasing results in a marked increase of the max ratio, but for lower values. This trend is contrary to that found for the case of high ratios, the downward flow along the parent wall is dominant over the upward flow. As a result, the portion of the total canopy area exposed to the strongest downward flow becomes more significant when wc decreases. It can be concluded that the effect of is different for low or high ratios. 80
98 -4.0 hc/h = 0.34 ; lc = 7.5m -3.0 Peak Cp, net Loc. Min. Area-avg. Min Area-avg. Max. Loc. Max hc/wc Figure 5.13 Effect of ratio on local and area-averaged for = Effect of canopy length (lc) and location (ed) The last geometric parameters examine the effect of the length of the canopy (lc) and the largest edge-to-edge distance (ed) on net pressure coefficients. Local and areaaveraged values as function of the ratio are presented in Figure 5.14 for a constant and a constant wc equal to 3.65m. An increase in the ratio generally corresponds to a decrease in the magnitude of the local min, whereas the areaaveraged min portrays little sensitivity. It is also to be noted that the case of the full-length canopy ( ) has a significantly higher local min in comparison to the other two mid-length canopy ( ) cases. It can be concluded that the ratio is 81
99 significant for the net uplifting pressures, whereas the edge distance seems to be of secondary importance. In the case of the net downward pressure coefficients there appears to be no significant difference between the full-length canopy model and the mid-length models. The same can be said about the distance from the edge, which shows only a slight increase when going from a canopy placed at the center ( = 0.75) to a canopy placed at the corner ( = 1) of the parent wall. Therefore, it can be said that local uplifting forces are sensitive to changes in the ratio, and less sensitive to the largest edge-to-edge distance (ed). Local downwards loading forces, on the other hand, are more sensitive to the ratio and display little sensitivity to the ratio hc/h = 0.94 ; wc = 3.65 m -3.0 Loc. Min Area-avg. Min. Peak Cp, net lc/l = 1 ed/lc = 0 lc/l = 0.5 ed/lc = 0.5 Area-avg. Max. Loc. Max. lc/l = 0.5 ed/lc = ed/lc Figure 5.14 Effect of length and edge distances on local and area-averaged 82
. Figure 5.15 shows 3-d and 2-d contour plots of the local values measured at the attached canopy for a wind direction perpendicular to the ridge (0º).")
100 5.6 NET LOCAL PRESSURE COEFFICIENTS DIVIDED BY REGIONS Local values have also been found to differ considerably at different regions within the attached canopy (see Figure 4.12 for the delimitation of regions). Figure 5.15 shows 3-d and 2-d contour plots of the local values measured at the attached canopy for a wind direction perpendicular to the ridge (0º). The differences in the magnitudes of local at different regions of the attached canopy can be observed. It can be seen that for the configuration shown the highest local suction (at the corner) is around 3 times the magnitude of the lowest suction (at the interior). Figure 5.15 Two and three dimensional representations of the distribution of the net pressure coefficients on attached canopy 83
101 Figure 5.16 shows the local peak values at the different regions of the upper surface as a function of the ratio. It can be seen that the uplifting forces for ratios lower than 0.50 occur at higher magnitudes around the edge regions. For higher ratios on the other hand, a marked difference can be seen in between the corner peak uplift and that found at the interior region. The peak local uplift at the corner region for an of 0.94 was found to have about 1.5 times the magnitude of that found in the interior. For the case of positive downward loading, a slight difference can be seen between the corner and the interior region. The greatest difference between the corner and interior peak can be seen at an of 0.84 where the local maximum peak at the wc = 3.65m; lc = 15m Corner Min Peak Cp,net Edge Min Interior Max Interior Min Corner Max Edge Max hc/h Figure 5.16 Peak local as a function of at the different regions of the canopy 84
102 interior was more than 3 times the magnitude of that found in the corner. It may also be noted that little difference is seen between the edge and corner region. It can be thus concluded that the location for which the peak pressure coefficient is estimated in the canopy is considerably affected by the ratio. Higher uplifting forces will occur around the corner regions for high ratios and around the edges for lower ratios. Downward forces on the other hand, generally occur with higher magnitudes at the interior regions for high ratios. 5.7 COMPARISONS WITH EXPERIMENTAL RESULTS OF PREVIOUS STUDIES As previously stated, several wind standards and codes of practice, containing provisions for the design of attached canopies, show significant inconsistencies. Publications regarding the wind tunnel experimentation and analysis that led to the development of the AS/NZS and the DIN design guidelines have been made available. These comprehensive studies (Jancauskas and Holmes 1985; Hölscher et al. 2007) facilitate the comparisons between the findings of the present study and their experimental values. Comparisons between the experimental results that led to the AS/NZS provisions published by Jancauskas and Holmes and those of the present study are presented in the three plots of Figure The geometrical ratios tested by Jancauskas and Holmes are 85
103 not necessarily the same as those tested as part of this study. For ease of comparison, they have been grouped into the three different graphs for the defined ranges of ratios and analyzed as a function of the ratio. It can be seen that the results of the present study generally portray a good agreement with the previous results. However, it must also be noted that the range of the present study extends over higher values of ratios for which previous data was not available. 86
104 Figure 5.17 Comparison between results of the present study and Jancauskas and Holmes,
105 The experimental results and analysis that led to the design guidelines provided in the DIN have been made available (Hölscher et al. 2007) and are compared with those of the present study in Figure The latter are considerably higher, however, this can be partially attributed to the fact that the previous experiments were performed for suburban terrain exposure whereas the present study was performed for an open country exposure. -4.0, Peak Cp, net hc/h Figure 5.18 Comparison between results of the present study and Hölscher et al
106 5.8 ENVELOPES OF NET PRESSURE COEFFICIENTS In order for this parametric study to be suitable for the different dimensions that may be encountered in practice it is of great significance to examine the peak pressures experienced by different effective areas. The area-averaging effect on min and max peaks has been derived by considering single or multiple sets of pressure taps and assigning them to their corresponding effective surface area. The three plots shown in Figure 5.19 contain all of the experimental curves obtained in terms of peak net pressure coefficients as a function of the increasing effective area (refer to Appendix B1 for tabulated net pressure coefficients of all configurations). Each plot contains 21 curves corresponding to the respective case as defined in Table 3.2. The expected monotonically decreasing relationship between the effective area and the magnitudes of the peak pressure coefficients is observed. Based on the previous observations regarding the effect of the ratio on peak, all of the curves shown in Figure 5.19 have been grouped into one of the following three categories:
107 Consequently, the envelope lines for each of the corresponding categories have been superimposed onto each plot. It can be noted that the envelope with the highest net uplifting peak is found for Case I ( = 0), whereas the highest net downwards loading peak occurs for Case III ( = 1). In the case of net downward loading it can be seen that the experimental curves for different ranges appear to be intertwined. This reaffirms the observation that net downward loads are less sensitive to the ratio. For this reason a single maximum envelope is provided for all ratios. The critical maximum and minimum envelope lines amongst the three Cases for each range of ratio have been plotted together into Figure This figure condenses all experimental data as a function of the effective area considering only the ratio since it has been found to have the greatest influence on peak pressure coefficients. 90
108 Case I Cp, net ll Case II Cp, net All 1 Case III Cp, net (0.1) (0.9) (9.3) (92.9) Effective Wind Area, ft ² (m²) 9 ll Configurations with 0.9 hc/h 1 Configurations with 0.5< hc/h < 0.9 Configurations with hc/h 0.5 Figure 5.19 Area averaging effect and envelopes for the corresponding ranges of Cases I, II and III separately 91
109 Cp, net (0.1) (0.9) (9.3) (92.9) Effective Wind Area, ft² (m²) 0.9 ll Figure 5.20 Area averaging effect and corresponding envelopes for all 63 configurations combined 92
110 CHAPTER 6 TOWARDS CODIFICATION 6.1 GENERAL This section provides the recommendations for the wind loading design of attached canopies. The proposed pressure coefficients here presented are the result of the analyses and observations made in Chapters 4 and 5. Comparisons between the present recommendations and the AS/NZS and the DIN design guidelines for net pressure coefficients are provided. These guidelines are the result of the previously discussed studies of Jancauskas and Holmes (1985) and Hölscher et al. (2007). Additional comparisons with the ASCE 7 provisions for roof overhangs and roofs of partially enclosed buildings are provided to assess the differences that practitioners may encounter when designing the wind loads accordingly. It is to be noted that all pressure coefficients presented from here on have been converted to conform to a 3-sec gust averaging period for codification purposes. The conversions where approximated by use of the Durst curve for gust duration (Durst 1960). 93
111 6.2 RECOMMENDED DESIGN GUIDELINES FOR ATTACHED CANOPIES Design guidelines for suctions on upper and lower surfaces Recommended provisions for the design of suctions on upper and lower surfaces of attached canopies are provided in Figure 6.1. These design guidelines lines have been generated from the envelopes of all experimental data obtained for upper and lower surfaces separately (see Figures 4.15, 4.16, and 4.17). A directionality factor of 0.8 has been applied to all envelopes to account for the unlikelihood that the critical wind speed occurs at the critical wind direction for a specific building configuration. These recommended min and design values are given as a function of the effective area of the canopy considered Pressure Coefficient, GCp Upper surface Lower surface (0.1) (0.9) (9.3) (92.9) Effective Wind Area, ft² (m²) Figure 6.1 Proposed design values for min and on attached canopies 94
112 In addition, recommended min and design values may be multiplied by the reduction factors and (see Table 6.1). These reduction factors have been generated from the observations made on Chapter 4 to account for the effect of the ratio which was seen to have a considerable impact on the suctions on upper and lower surfaces. The recommended min and can thus be obtained by the following equations: (6.1) (6.2) in which the is obtained from the corresponding curve (upper or lower) on Figure 6.1 as a function of the effective area. Table 6.1 Geometrical reduction factors for min and = l l *For intermediate lc/l ratios use linear interpolation 95
113 6.2.2 Design guidelines for net loads Recommended provisions for the design of attached canopies are provided in Figure 6.2. These design guidelines lines have been generated from the envelopes of all experimental data obtained from the current study (see Figures 5.19, and 5.20). A directionality factor of 0.8 has been applied to all envelopes to account for the unlikelihood that the critical wind speed occurs at the critical wind direction for a specific building configuration. These recommended design values are given as a function of the ratio and the effective area of the canopy considered. These curves can be used on their own as a simple yet conservative design guideline for the net pressure coefficients ) on attached canopies. It must be noted however that these simplified provisions only take into consideration the ratio whereas it has been seen that the other parameters examined may also have a significant effect on the local net pressure coefficients. It is for this reason that reduction factors dependant on the geometrical and ratios are introduced in Table 6.2. The values presented in this table are the result of intricate examination of every single configuration tested. The recommended local can thus be obtained by the following equation: = (6.3) = (6.4) 96
114 where is obtained as a function of from Figure 6.2, and the uplifting and downward loading reduction factors ( and ) are given as a function of, and on Table 6.2. The addition of the reduction factor increases the complexity of the design procedure, however, a more economical design covering a much wider range of geometric configurations is provided. An assessment of the recommended design guidelines considering the reduction factor in comparison to the experimental results is provided in Appendix C1. Net Pressure Coefficient, GCp net (0.1) (0.9) (9.3) (92.9) Effective Wind Area ft² (m²) 0.9 ll Figure 6.2 Proposed design values for GCp, net on attached canopies 97
115 98
116 6.3 COMPARISONS WITH CURRENT DESIGN PROVISIONS Several wind standards and building codes of practice provide design guidelines for wind loading on attached canopies as was discussed in Chapter 2. In this section the provisions of the AZ/NZS and the DIN are compared to the recommendations of the present study, since the studies that led to their proposed values have been made available. Furthermore, the recommendations of the present study are compared to the ASCE provisions overhangs, and roofs of partially enclosed structures AZ/NZS :2002 Comparisons between the values proposed by the AS/NZS and the recommended envelopes of the present study for the as a function of the effective area are presented in Figure 6.3. In general a good agreement has been observed. It must be noted that for the AS/NZS recommends higher values than those recommended in the present study for the range of. For in the AS/NZS a good agreement is seen with the range of from the present recommendations. For the min recommended by the AS/NZS are considerably lower than the present recommendations. In the case of the max it can be seen that the three different values corresponding to the AS/NZS recommendations for ratios of 1, 0.75, and 0.5, respectively, are all within the values of the present recommendations. Comparisons between the AZ/NZS provisions and the experimental findings of the present study have been included in Appendix C2. 99
117 100
118 6.3.2 DIN EN /NA: Comparisons between the design provisions on the DIN and those of the present study are provided in Figure 6.4 as a function of seen that the recommended values for local min for three configurations. It can be generally display a good agreement in which the recommendations of the present study are slightly higher than the recommendations of the DIN. In the case of the local max it can be seen that both the DIN and the present study recommend the same values regardless of the ratio for this range. It may also be noted that the recommendations of the present study for the highest downwards loading is considerably higher than that recommended by the DIN. Comparisons between the DIN provisions and the experimental findings of the present study have been included in Appendix C Net Pressure Coefficient, GCp Present min DIN min DIN max Present max hc/h Figure 6.4 Comparison between the recommended local net pressure coefficients of the present study and the DIN provisions for three different hc/h ratios 101
119 6.3.3 ASCE 7-10 overhangs and partially enclosed structure Due to the lack of provisions in the major North American codes and standards, practitioners often consider the attached canopies as either extensions of the roof overhangs or as the roofs of partially enclosed structures. Upon making such assumptions, canopies are often designed in accordance to the corresponding provisions in the ASCE However, it is to be expected that this will result in significant differences with the experimental values obtained for attached canopies as was seen in Chapter 2. Comparisons between the values provided by the ASCE 7 provisions for roof overhangs and the recommendations of the present study are shown in Figure 6.5. It can be seen that treating a canopy as if it were an extended roof overhang may result in a design that is conservative by a maximum of 9 times, or non-conservative by a value of over 1.5 times the experimental values obtained at the corner regions. These marked differences are attributed to high levels of suction on the upper surface of the corner regions of the overhang in combination with high pressures on the lower surface resulting from stagnation on the windward wall. Additionally, the effect of the roof slope has also been seen to have an effect on the pressures around the corner regions. Comparisons between the values provided by the ASCE 7 provisions for flat roofs of partially enclosed buildings and the recommendations of the present study are shown in Figure 6.6. It can be seen that for = 0.5 values proposed for net uplifting loads on flat roofs of partially enclosed buildings are 3 times higher than those proposed 102
120 103
121 Net Pressure Coefficient, GCp Figure 6.6 ASCE 7-10 Partially enclosed buildings Current Provisions hc/h Comparisons between the recommended design values for three different hc/h ratios and ASCE 7-10 provisions for the roof of a partially enclosed building (Figure ) 104
122 CHAPTER 7 CONCLUSIONS AND RECOMMENDATIONS FOR FUTURE STUDIES 7.1 SUMMARY Wind tunnel experimentation has been performed on a total of 63 different configurations to serve as the basis for a parametric study of the wind loading effect on attached canopies. The effect of wind direction on net pressure coefficients has been examined and it has been shown that the critical peaks may occur for different wind directions depending on the configuration. Local and area-averaged net pressure coefficients ( ) as well as pressure coefficients acting on upper and lower surfaces separately ( and ) have been analyzed as a function of four basic geometrical ratios to examine the trends and relationships that they exhibit with each other. Pressure and correlation coefficient contour plots have also been presented so as to provide a better understanding of the flow patterns occurring around the canopy. Recommended design guidelines for, and on attached canopies have been provided resulting from extensive data analyses and interpretation. 105
123 Comparisons between the recommendations and experimental findings of the present study and those associated with the AZ/NZS :2002 and the DIN EN /NA: have been provided. 7.2 CONCLUSIONS The conclusions generated from this study can be summarized as follows: -Critical wind directions were found to vary significantly from configuration to configuration, however, the highest uplifting local loads generally occur between the range of 30 and 90. -The ratio of the height of the canopy to the eave height of the building (hc/h) was found to be the most influential parameter on the peak net pressure coefficients. -The ratio of the length of the canopy to the length of the parent wall (lc/l) and the ratio of the height to the width of the canopy (hc/wc) were found to be of secondary importance and the location of the canopy with respect to the edge of the parent wall was found to have a marginal importance. -Local net uplifting pressure coefficients are higher around the corner regions for high hc/h ratios, whereas little difference between regions is seen for low hc/h ratios. -Local net downwards pressure coefficients are generally higher around the interior region. -The lc/l ratio is the most influential in the design of suctions at upper and lower surfaces. 106
124 -Suctions are generally higher on the upper surface of the canopy than on the lower surface. -Suctions on the upper and lower surfaces of the canopy are generally higher on the edge and corner regions for high hc/h ratios, whereas little difference between the regions is seen for low hc/h. -Both differences and similarities have been found between the available design guidelines of other codes and standards and those generated from the present study. These differences could be expected since a greater range of configurations has been tested in the present study. -Designing attached canopies by adapting provisions available in major North American building codes for geometrically similar building components will lead in most cases to highly inadequate design wind loads. 7.3 LIMITATIONS AND RECOMMENDATIONS FOR FUTURE STUDIES Amongst the parameters tested, the hc/h, lc/l, and hc/wc ratios were seen to have the most significant impact on pressure coefficients on attached canopies. A wide range of hc/h and hc/wc ratios have been tested, however, the same can not be said about the lc/l ratio. Perhaps this parameter requires additional experimentation. Additionally, a significant difference has been found to occur between the recommendations of the present study and the provisions of the ASCE for overhangs on roofs with small slopes. This difference has been attributed amongst other geometrical differences to the slope of the overhang in comparison to the present experimental setup 107
125 for attached canopies with a 0 slope. Wind tunnel testing on attached canopies with different roof slopes could potentially widen the range of this study. The present study is limited to canopies attached to low-rise structures. The lowest ratio of canopy height to parent wall height tested was of 0.2. However, it is not uncommon to find canopies attached to high-rise structures where considerably different results are to be expected due to the large area of parent wall above the canopy height. Further experimentation with smaller hc/h ratios could be of great interest for codification purposes. In addition, wind loads on podia attached to high-rise buildings also represent an area for future expansion. 108
126 REFERENCES ASCE. (2010). Minimum design loads for building and other structures. ASCE/SEI 7-10, Reston, Va. British Standard Institute. (1997). Loading for buildings Part 2: Code of practice for wind loads. BS , London. CEN. (2004). Eurocode 1: Actions on structures General actions Part 1.4: Wind actions. Pr EN , Brussels. Counihan, J. (1975) Adiabatic Atmospheric Boundary Layers: A Review and Analysis of Data from the Period Atmos. Environ., Davenport, A.G., Stathopoulos, T., Surry, D. (1985) Reliability of wind loading specifications for low Buildings. Procedures, International Conference on Structural Safety and Reliability, ICOSSAR 85, Kobe, Japan. Davenport, A. G. (2002). Past, present and future of wind engineering. Journal of Wind Engineering and Industrial Aerodynamics, 90(12-15), DIN. (2010). Einwirkungen auf Tragwerke - teil 4: Windlasten. DIN EN : , Berlin. 109
127 Durst, C.S. (1960). Wind speeds over short periods of time. Meteorological Magazine, 89, Goyal, R., Ahuja, A.K., and Prasad. J. (2007) Wind loads on buildings with attached canopies, Asian Journal of Civil Engineering, Vol. 8 No. 3, Holmes, J. D. (2001). Wind loading of structures. Spon Press, New York. International Code Council. (2012a). International building code (IBC), Fall Church, Va. International Code Council. (2012b). International residential code (IRC), Fall Church, Va. IS. (1987). Indian Standard code of practice for design loads-(part 3-wind loads) for buildings and structures, IS: 875 (Part-3)-1987, New Delhi. Jancauskas, L., and Holmes, J. (1985). Wind loads on attached canopies. Procedures, National Conference on Wind Engineering, Texas Tech Univ., Lubbock, Tex. Jensen, M. (1958). The model-law for phenomena in natural wind. Ingenioren - International Edition, 2(4),
128 Jensen, M., & Franck, N. (1965). Model-scale tests in turbulent wind. Part II. Danish Technical Press. National Research Council of Canada. (2010). National Building Code of Canada (NBCC), Ottawa, ON. ÖNORM. (1993). Belastungsannahmen im Bauwesen Statische Windeinwirkungen ÖNORM B : , Vienna. Paluch, M.J., Loredo-souza, A.M. and Blessmann, J. (2003). Wind loads on attached canopies and their effects on the pressure distribution over arch roof industrial building, Journal of Wind Engineering and Industrial Aerodynamics, 91, Shiotani, M. (1971), Structure of Gusts in High Winds, parts 1-4, The Pysical Sciences laboratory, Nikon University, Furabachi, Chiba, Japan Scanivalve Corporation, ZOC 33/64Px Electronic Pressure Scanning Module, Instruction and Service Manual Scanivalve Corporation, DSMLINK V2.90, Installation and Operation Manual Scanivalve Corporation, DSM 3000 Digital Service Module, Instruction and Service Manual 111
129 SIA (2003), Einwirkungen auf Tragwerke, Schweizerischer ingenieur- und Architektenverein. SIA 261:2003, Zurich Simiu, E., and Scanlan, R. (1996). Wind Effects on Structures: Fundamentals and Applications to design, 3 rd Ed.,Wiley & Sons, New York. Standards Australia International Ltd. Standards New Zealand. (2002). Australian/New Zealand standards, structural design actions Part 2, wind actions. AS/NZS Stathopoulos, T. & Surry, D. (1983). Scale effects in wind tunnel testing of low buildings. Journal of Wind Engineering and Industrial Aerodynamics, 13(1-3), Stathopoulos, T. (1984). Design and fabrication of a wind tunnel for building aerodynamics. Journal of Wind Engineering and Industrial Aerodynamics, 16(2-3), Stathopoulos T., (1985) Wind Loads on Low-Rise Buildings: A Review of the State of the Art. Engineering Structures, Volume 6, No. 2, pp Tieleman, H. W., Hajj, M. R., & Reinhold, T. A. (1998). Wind tunnel simulation requirements to assess wind loads on low-rise buildings. Journal of Wind Engineering and Industrial Aerodynamics, 74-76,
130 Tieleman, H. W., Reinhold, T. A., & Marshall, R. D. (1978). On the wind-tunnel simulation of the atmospheric surface layer for the study of wind loads on low-rise buildings. Journal of Wind Engineering and Industrial Aerodynamics, 3(1), Uematsu, Y., Iizumi, E., and Stathopoulos, T. (2007). Wind force coefficients for designing free-standing canopy roofs. Journal of Wind Engineering and Industrial Aerodynamics, 95_9 11_, Uematsu, Y., Stathopoulos, T., and Iizumi, E. (2008a). Wind loads on free-standing canopy roofs: Part 1. Local wind pressures. Journal of Wind Engineering and Industrial Aerodynamics, 96_6 7_, Uematsu, Y., Stathopoulos, T., and Iizumi, E. (2008b). Wind loads on free-standing canopy roofs: Part 2. Overall wind forces. Journal of Wind Engineering and Industrial Aerodynamics, 96_6 7_, Zisis, I. and Stathopoulos, T. (2010). Wind-induced pressures on patio covers. ASCE Journal of Structural Engineering, Volume 136, No. 9, pp Zisis, I., Stathopoulos, T, and Candelario, J. D,. (2011). Codification of wind loads on a patio cover based on a parametric wind tunnel study. 13th International Conference in Wind Engineering, Amsterdam, Netherlands. 113
131 APPENDIX A 114

132 Appendix A1 Isometric and construction details for a typical wooden attached canopy. Source
133 Appendix A2 Isometric view for a typical wooden attached canopy. Source
134 Appendix A3 Construction details for a wooden canopy attached to a low rise building. Source 117
135 APPENDIX B 118
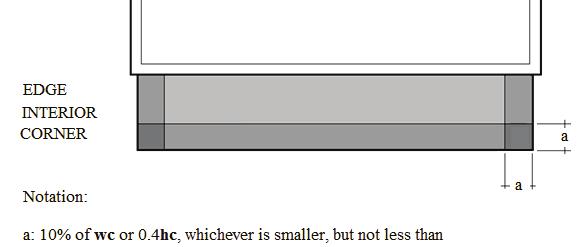
136 119
137 CASE I - Lower surface pressure coefficients by region Peak local pressure coefficient at different regions Area-Averaged CORNER EDGE INTERIOR ENTIRE SURFACE Config. Min. Max. Min. Max. Min. Max. Min. Max
138 CASE I-Net Pressure coefficients Peak Net Pressure coefficient Local Area-avg. Configuration Min. Max. Min. Max
139 CASE II-Upper surface pressure coefficients by region Peak local pressure coefficient at different regions Area-Averaged CORNER EDGE INTERIOR ENTIRE SURFACE Config. Min. Max. Min. Max. Min. Max. Min. Max
140 CASE II-Lower surface pressure coefficients by region Peak local pressure coefficient at different regions Area-Averaged CORNER EDGE INTERIOR ENTIRE SURFACE Config. Min. Max. Min. Max. Min. Max. Min. Max
141 CASE II-Net Pressure coefficients Peak Net Pressure coefficient Local Area-avg. Configuration Min. Max. Min. Max
142 CASE III-Upper surface pressure coefficients by region Peak local pressure coefficient at different regions Area-Averaged CORNER EDGE INTERIOR ENTIRE SURFACE Config. Min. Max. Min. Max. Min. Max. Min. Max
143 CASE III-Lower surface pressure coefficients by region Peak local pressure coefficient at different regions Area-Averaged CORNER EDGE INTERIOR ENTIRE SURFACE Config. Min. Max. Min. Max. Min. Max. Min. Max
144 CASE III-Net Pressure coefficients Peak Net Pressure coefficient Local Area-avg. Configuration Min. Max. Min. Max
145 Appendix B2 Local, mean, and area averaged net pressure coefficients as a function of the wind direction for configurations of each of the three cases (see Table 3.2). Pressure coefficients are referenced to the hourly mean speed at the mean roof height. Configuration 1 CASE I -4 Mean Peak Max Peak Min Cp, net Wind Direction ( º ) Configuration 4 CASE I -4 Mean Peak Max Peak Min Cp, net Wind Direction ( º ) 128
146 Configuration 7 CASE I -4 Mean Peak Max Peak Min Cp, net Wind Direction ( º ) Configuration 13 CASE I -4 Mean Peak Max Peak Min Cp, net Wind Direction ( º ) 129
147 Configuration 16 CASE I -4 Mean Peak Max Peak Min Cp, net Wind Direction ( º ) Configuration 19 CASE I -4 Mean Peak Max Peak Min Cp, net Wind Direction ( º ) 130
148 Configuration 1 CASE II -4 Mean Peak Max Peak Min Cp, net Wind Direction ( º ) Configuration 4 CASE II -4 Mean Peak Max Peak Min Cp, net Wind Direction ( º ) 131
149 Configuration 7 CASE II -4 Mean Peak Max Peak Min Cp, net Wind Direction ( º ) Configuration 10 CASE II -4 Mean Peak Max Peak Min Cp, net Wind Direction ( º ) 132
150 Configuration 13 CASE II -4 Mean Peak Max Peak Min Cp, net Wind Direction ( º ) Configuration 16 CASE II -4 Mean Peak Max Peak Min Cp, net Wind Direction ( º ) 133
151 Configuration 19 CASE II -4 Mean Peak Max Peak Min Cp, net Wind Direction ( º ) 134
152 Configuration 1 - CASE III -4 Mean Peak Max Peak Min Cp, net Wind Direction ( º ) Configuration 4 CASE III -4 Mean Peak Max Peak Min Cp, net Wind Direction ( º ) 135
153 Configuration 10 CASE III -4 Mean Peak Max Peak Min Cp, net Wind Direction ( º ) Configuration 13 CASE III -4 Mean Peak Max Peak Min Cp, net Wind Direction ( º ) 136
154 Configuration 16 CASE III -4 Mean Peak Max Peak Min Cp, net Wind Direction ( º ) Configuration 19 CASE III -4 Mean Peak Max Peak Min Cp, net Wind Direction ( º ) 137
155 Appendix B3 Upper, lower and net pressure coefficients contour plots for low and intermediate hc/h ratios of Cases II and III (see Table 3.2). Pressure coefficients are referenced to the hourly mean speed at the mean roof height. Configuration 7 Case 2 Zero degree ( ) wind direction Upper Surface Min. Peaks - Cp,upper (min) Lower Surface Max. Peaks - Cp,lower (max) Net Min. Peaks - Cp,net (min) 138
 Lower Surface Min.")
156 Upper Surface Max. Peaks - Cp,upper (max) Lower Surface Min. Peaks - Cp,lower (min) Net Max. Peaks - Cp,net (max) 139
External Pressure Coefficients on Saw-tooth and Mono-sloped Roofs
 External Pressure Coefficients on Saw-tooth and Mono-sloped Roofs Authors: Bo Cui, Ph.D. Candidate, Clemson University, 109 Lowry Hall, Clemson, SC 9634-0911, boc@clemson.edu David O. Prevatt, Assistant
Wind Flow Validation Summary
 IBHS Research Center Validation of Wind Capabilities The Insurance Institute for Business & Home Safety (IBHS) Research Center full-scale test facility provides opportunities to simulate natural wind conditions
Wind Directional Effect on a Single Storey House Using Educational Wind Tunnel
 Wind Directional Effect on a Single Storey House Using Educational Wind Tunnel S S Zaini 1, N Rossli 1, T A Majid 1, S N C Deraman 1 and N A Razak 2 1 Disaster Research Nexus, School of Civil Engineering,
EFFECTS OF SIDEWALL OPENINGS ON THE WIND LOADS ON PIPE-FRAMED GREENHOUSES
 The Seventh Asia-Pacific Conference on Wind Engineering, November 8-12, 29, Taipei, Taiwan EFFECTS OF SIDEWALL OPENINGS ON THE WIND LOADS ON PIPE-FRAMED GREENHOUSES Yasushi Uematsu 1, Koichi Nakahara 2,
Available online at ScienceDirect. Procedia Engineering 161 (2016 )
") Available online at www.sciencedirect.com ScienceDirect Procedia Engineering 161 (216 ) 1845 1851 World Multidisciplinary Civil Engineering-Architecture-Urban Planning Symposium 216, WMCAUS 216 Experimental
Available online at www.sciencedirect.com ScienceDirect Procedia Engineering 161 (216 ) 1845 1851 World Multidisciplinary Civil Engineering-Architecture-Urban Planning Symposium 216, WMCAUS 216 Experimental
EXPERIMENTAL STUDY OF WIND PRESSURES ON IRREGULAR- PLAN SHAPE BUILDINGS
 BBAA VI International Colloquium on: Bluff Bodies Aerodynamics & Applications Milano, Italy, July, 2-24 8 EXPERIMENTAL STUDY OF WIND PRESSURES ON IRREGULAR- PLAN SHAPE BUILDINGS J. A. Amin and A. K. Ahuja
2013 Wall of Wind (WoW) Contest Informational Workshop
 Contest Informational Workshop") 2013 Wall of Wind (WoW) Contest Informational Workshop Presented By: Ioannis Zisis February 22, 2013 With Contributions By: Dr. Girma Bitsuamlak, Roy Liu, Walter Conklin, Dr. Arindam Chowdhury, Jimmy Erwin,
2013 Wall of Wind (WoW) Contest Informational Workshop Presented By: Ioannis Zisis February 22, 2013 With Contributions By: Dr. Girma Bitsuamlak, Roy Liu, Walter Conklin, Dr. Arindam Chowdhury, Jimmy Erwin,
Effects of wind incidence angle on wind pressure distribution on square plan tall buildings
 J. Acad. Indus. Res. Vol. 1(12) May 2013 747 RESEARCH ARTICLE ISSN: 2278-5213 Effects of wind incidence angle on wind pressure distribution on square plan tall buildings S.K. Verma 1, A.K. Ahuja 2* and
INTERACTION BETWEEN WIND-DRIVEN AND BUOYANCY-DRIVEN NATURAL VENTILATION Bo Wang, Foster and Partners, London, UK
 INTERACTION BETWEEN WIND-DRIVEN AND BUOYANCY-DRIVEN NATURAL VENTILATION Bo Wang, Foster and Partners, London, UK ABSTRACT Ventilation stacks are becoming increasingly common in the design of naturally
Wind tunnel tests of a non-typical stadium roof
 Wind tunnel tests of a non-typical stadium roof G. Bosak 1, A. Flaga 1, R. Kłaput 1 and Ł. Flaga 1 1 Wind Engineering Laboratory, Cracow University of Technology, 31-864 Cracow, Poland. liwpk@windlab.pl
Quantification of the Effects of Turbulence in Wind on the Flutter Stability of Suspension Bridges
 Quantification of the Effects of Turbulence in Wind on the Flutter Stability of Suspension Bridges T. Abbas 1 and G. Morgenthal 2 1 PhD candidate, Graduate College 1462, Department of Civil Engineering,
Critical Gust Pressures on Tall Building Frames-Review of Codal Provisions
 Dr. B.Dean Kumar Dept. of Civil Engineering JNTUH College of Engineering Hyderabad, INDIA bdeankumar@gmail.com Dr. B.L.P Swami Dept. of Civil Engineering Vasavi College of Engineering Hyderabad, INDIA
Pressure coefficient on flat roofs of rectangular buildings
 Pressure coefficient on flat roofs of rectangular buildings T. Lipecki 1 1 Faculty of Civil Engineering and Architecture, Lublin University of Technology, Poland. t.lipecki@pollub.pl Abstract The paper
WIND EFFECTS ON MONOSLOPED AND SAWTOOTH ROOFS
 Clemson University TigerPrints All Dissertations Dissertations 8007 WIND EFFECTS ON MONOSLOPED AND SAWTOOTH ROOFS Bo Cui Clemson University, boc@clemson.edu Follow this and additional works at: https://tigerprints.clemson.edu/all_dissertations
Aerodynamic Analysis of a Symmetric Aerofoil
 214 IJEDR Volume 2, Issue 4 ISSN: 2321-9939 Aerodynamic Analysis of a Symmetric Aerofoil Narayan U Rathod Department of Mechanical Engineering, BMS college of Engineering, Bangalore, India Abstract - The
Effects of directionality on wind load and response predictions
 Effects of directionality on wind load and response predictions Seifu A. Bekele 1), John D. Holmes 2) 1) Global Wind Technology Services, 205B, 434 St Kilda Road, Melbourne, Victoria 3004, Australia, seifu@gwts.com.au
Wind Pressure Distribution on Rectangular Plan Buildings with Multiple Domes
 Wind Pressure Distribution on Rectangular Plan Buildings with Multiple Domes Astha Verma, Ashok K. Ahuja Abstract Present paper describes detailed information of the experimental study carried out on the
MEASUREMENTS ON THE SURFACE WIND PRESSURE CHARACTERISTICS OF TWO SQUARE BUILDINGS UNDER DIFFERENT WIND ATTACK ANGLES AND BUILDING GAPS
 BBAA VI International Colloquium on: Bluff Bodies Aerodynamics & Applications Milano, Italy, July, 2-24 28 MEASUREMENTS ON THE SURFACE WIND PRESSURE CHARACTERISTICS OF TWO SQUARE BUILDINGS UNDER DIFFERENT
WIND-INDUCED LOADS OVER DOUBLE CANTILEVER BRIDGES UNDER CONSTRUCTION
 WIND-INDUCED LOADS OVER DOUBLE CANTILEVER BRIDGES UNDER CONSTRUCTION S. Pindado, J. Meseguer, J. M. Perales, A. Sanz-Andres and A. Martinez Key words: Wind loads, bridge construction, yawing moment. Abstract.
Advanced Hydraulics Prof. Dr. Suresh A. Kartha Department of Civil Engineering Indian Institute of Technology, Guwahati
 Advanced Hydraulics Prof. Dr. Suresh A. Kartha Department of Civil Engineering Indian Institute of Technology, Guwahati Module - 4 Hydraulics Jumps Lecture - 4 Features of Hydraulic Jumps (Refer Slide
RESILIENT INFRASTRUCTURE June 1 4, 2016
 RESILIENT INFRASTRUCTURE June 1 4, 2016 CASE STUDIES ON THE IMPACT OF SURROUNDING BUILDINGS ON WIND-INDUCED RESPONSE John Kilpatrick Rowan Williams Davies and Irwin, Guelph, Ontario, Canada ABSTRACT In
Basis of Structural Design
 Basis of Structural Design Course 10 Actions on structures: Wind loads Other loads Course notes are available for download at http://www.ct.upt.ro/users/aurelstratan/ Wind loading: normative references
A Wind-Tunnel Study of a Cubic Rooftop AC Unit on a Low Building
 A Wind-Tunnel Study of a Cubic Rooftop AC Unit on a Low Building Noriaki Hosoya, 1 Jack E. Cermak, 2 and Chris Steele 3 Abstract A wind-tunnel test was conducted to determine gust wind loads on simple
UNIVERSITY OF HONG KONG LIBRARY. Hong Kong Collection
 UNIVERSITY OF HONG KONG LIBRARY Hong Kong Collection CODE OF PRACTICE ON WIND EFFECTS HONG KONG-1983 BUILDING DEVELOPMENT DEPARTMENT HONG KONG PRINTED AND PUBLISHED BY THE GOVERNMENT PRINTER, HONG KONG
6. EXPERIMENTAL METHOD. A primary result of the current research effort is the design of an experimental
 6. EXPERIMENTAL METHOD 6.1 Introduction A primary result of the current research effort is the design of an experimental setup that can simulate the interaction of a windmill with a vortex wake and record
COMPUTATIONAL FLOW MODEL OF WESTFALL'S LEADING TAB FLOW CONDITIONER AGM-09-R-08 Rev. B. By Kimbal A. Hall, PE
 COMPUTATIONAL FLOW MODEL OF WESTFALL'S LEADING TAB FLOW CONDITIONER AGM-09-R-08 Rev. B By Kimbal A. Hall, PE Submitted to: WESTFALL MANUFACTURING COMPANY September 2009 ALDEN RESEARCH LABORATORY, INC.
Determination of the wind pressure distribution on the facade of the triangularly shaped high-rise building structure
 Determination of the wind pressure distribution on the facade of the triangularly shaped high-rise building structure Norbert Jendzelovsky 1,*, Roland Antal 1 and Lenka Konecna 1 1 STU in Bratislava, Faculty
Influence of rounding corners on unsteady flow and heat transfer around a square cylinder
 Influence of rounding corners on unsteady flow and heat transfer around a square cylinder S. K. Singh Deptt. of Mech. Engg., M. B. M. Engg. College / J. N. V. University, Jodhpur, Rajasthan, India Abstract
INTERFERENCE EFFECTS OF TWO BUILDINGS ON PEAK WIND PRESSURES
 The Seventh Asia-Pacific Conference on Wind Engineering, November 8-, 9, Taipei, Taiwan INTERFERENCE EFFECTS OF TWO BUILDINGS ON PEAK WIND PRESSURES Wonsul Kim, Yukio Tamura and Akihito Yoshida 3 Ph.D.
ASCE D Wind Loading
 ASCE 7-10 3D Wind Loading 1 All information in this document is subject to modification without prior notice. No part or this manual may be reproduced, stored in a database or retrieval system or published,
AIRFLOW GENERATION IN A TUNNEL USING A SACCARDO VENTILATION SYSTEM AGAINST THE BUOYANCY EFFECT PRODUCED BY A FIRE
 - 247 - AIRFLOW GENERATION IN A TUNNEL USING A SACCARDO VENTILATION SYSTEM AGAINST THE BUOYANCY EFFECT PRODUCED BY A FIRE J D Castro a, C W Pope a and R D Matthews b a Mott MacDonald Ltd, St Anne House,
SPECTRAL CHARACTERISTICS OF FLUCTUATING WIND LOADS ON A SEPARATE TWIN-BOX DECK WITH CENTRAL SLOT
 The Seventh Asia-Pacific Conference on Wind Engineering, November 8-, 009, Taipei, Taiwan SPECTRAL CHARACTERISTICS OF FLUCTUATING WIND LOADS ON A SEPARATE TWIN-BOX DEC WITH CENTRAL SLOT Le-Dong Zhu, Shui-Bing
DESIGN AND CHARACTERISTICS OF A LARGE BOUNDARY- LAYER WIND TUNNEL WITH TWO TEST SECTIONS
 The Seventh Asia-Pacific Conference on Wind Engineering, November 8-12, 2009, Taipei, Taiwan DESIGN AND CHARACTERISTICS OF A LARGE BOUNDARY- LAYER WIND TUNNEL WITH TWO TEST SECTIONS Kai Chen 1, Xin-Yang
Wind action on small sky observatory ScopeDome
 Wind action on small sky observatory ScopeDome A.Flaga a, G. Bosak a, Ł. Flaga b, G. Kimbar a, M. Florek a a Wind Engineering Laboratory, Cracow University of Technology, Cracow, Poland, LIWPK@windlab.pl
Influence of the external dynamic wind pressure on the ventilation of double facades
 Influence of the external dynamic wind pressure on the ventilation of double facades Claudia Ziller & Bernd Döring Institute of steel construction, Aachen, Germany ABSTRACT: The ventilation rate in the
Surrounding buildings and wind pressure distribution on a high rise building
 Surrounding buildings and wind pressure distribution on a high rise building Conference or Workshop Item Accepted Version Luo, Z. (2008) Surrounding buildings and wind pressure distribution on a high rise
Full scale measurements and simulations of the wind speed in the close proximity of the building skin
 Full scale measurements and simulations of the wind speed in the close proximity of the building skin Radoslav Ponechal 1,* and Peter Juras 1 1 University of Zilina, Faculty of Civil Engineering, Department
Analysis of Shear Lag in Steel Angle Connectors
 University of New Hampshire University of New Hampshire Scholars' Repository Honors Theses and Capstones Student Scholarship Spring 2013 Analysis of Shear Lag in Steel Angle Connectors Benjamin Sawyer
PRESSURE DISTRIBUTION OF SMALL WIND TURBINE BLADE WITH WINGLETS ON ROTATING CONDITION USING WIND TUNNEL
 International Journal of Mechanical and Production Engineering Research and Development (IJMPERD ) ISSN 2249-6890 Vol.2, Issue 2 June 2012 1-10 TJPRC Pvt. Ltd., PRESSURE DISTRIBUTION OF SMALL WIND TURBINE
E. Agu, M. Kasperski Ruhr-University Bochum Department of Civil and Environmental Engineering Sciences
 EACWE 5 Florence, Italy 19 th 23 rd July 29 Flying Sphere image Museo Ideale L. Da Vinci Chasing gust fronts - wind measurements at the airport Munich, Germany E. Agu, M. Kasperski Ruhr-University Bochum
Wind Loads on Low-Rise Building Models with Different Roof Configurations
 Wind Loads on Low-Rise Building Models with Different Roof Configurations Deepak Prasad, Tuputa Uliate, and M. Rafiuddin Ahmed School of Engineering and Physics, Faculty of Science and Technology, The
STRUCTURAL DESIGN FIGURE INTERNATIONAL BUILDING CODE 288aR
 FIGURE 1609.1 288aR 288bR 1609.1.4.1 Building with openings. Where glazing is assumed to be an opening in accordance with Section 1609.1.4, the building shall be evaluated to determine if the openings
Anemometry. Anemometry. Wind Conventions and Characteristics. Anemometry. Wind Variability. Anemometry. Function of an anemometer:
 Anemometry Anemometry Function of an anemometer: Measure some or all of the components of the wind vector In homogeneous terrain, vertical component is small express wind as -D horizontal vector For some
ISOLATION OF NON-HYDROSTATIC REGIONS WITHIN A BASIN
 ISOLATION OF NON-HYDROSTATIC REGIONS WITHIN A BASIN Bridget M. Wadzuk 1 (Member, ASCE) and Ben R. Hodges 2 (Member, ASCE) ABSTRACT Modeling of dynamic pressure appears necessary to achieve a more robust
Numerical Analysis of Wind loads on Tapered Shape Tall Buildings
 IJSTE - International Journal of Science Technology & Engineering Volume 1 Issue 11 May 2015 ISSN (online): 2349-784X Numerical Analysis of Wind loads on Tapered Shape Tall Buildings Ashwin G Hansora Assistant
Ermenek Dam and HEPP: Spillway Test & 3D Numeric-Hydraulic Analysis of Jet Collision
 Ermenek Dam and HEPP: Spillway Test & 3D Numeric-Hydraulic Analysis of Jet Collision J.Linortner & R.Faber Pöyry Energy GmbH, Turkey-Austria E.Üzücek & T.Dinçergök General Directorate of State Hydraulic
Greenup Lock Filling and Emptying System Study
 Fourth LACCEI International Latin American and Caribbean Conference for Engineering and Technology (LACCET 2006) Breaking Frontiers and Barriers in Engineering: Education, Research and Practice 21-23 June
CORESTA RECOMMENDED METHOD N 6
 CORESTA RECOMMENDED METHOD N 6 DETERMINATION OF VENTILATION DEFINITIONS AND MEASUREMENT PRINCIPLES (2015 Revision September 2016) 1. SCOPE This CORESTA Recommended Method specifies a method for the determination
FABRICATION OF VERTICAL AXIS WIND TURBINE WITH WIND REDUCER AND EXPERIMENTAL INVESTIGATIONS
 87 CHAPTER-4 FABRICATION OF VERTICAL AXIS WIND TURBINE WITH WIND REDUCER AND EXPERIMENTAL INVESTIGATIONS 88 CHAPTER-4 FABRICATION OF VERTICAL AXIS WIND TURBINE WITH WIND REDUCER AND EXPERIMENTAL INVESTIGATIONS
EMPIRICAL EVALUATION OF THREE WIND ANALYSIS TOOLS FOR CONCEPT DESIGN OF AN URBAN WIND SHELTER
 Y. Ikeda, C. M. Herr, D. Holzer, S. Kaijima, M. J. Kim. M, A, Schnabel (eds.), Emerging Experience in Past, Present and Future of Digital Architecture, Proceedings of the 20th International Conference
Experimental Investigation Of Flow Past A Rough Surfaced Cylinder
 (AET- 29th March 214) RESEARCH ARTICLE OPEN ACCESS Experimental Investigation Of Flow Past A Rough Surfaced Cylinder Monalisa Mallick 1, A. Kumar 2 1 (Department of Civil Engineering, National Institute
Planning and Design of Proposed ByPass Road connecting Kalawad Road to Gondal Road, Rajkot - Using Autodesk Civil 3D Software.
 Planning and Design of Proposed ByPass Road connecting Kalawad Road to Gondal Road, Rajkot - Using Autodesk Civil 3D Software. 1 Harshil S. Shah, 2 P.A.Shinkar 1 M.E. Student(Transportation Engineering),
EXPERIMENTAL STUDY ON THE HYDRODYNAMIC BEHAVIORS OF TWO CONCENTRIC CYLINDERS
 EXPERIMENTAL STUDY ON THE HYDRODYNAMIC BEHAVIORS OF TWO CONCENTRIC CYLINDERS *Jeong-Rok Kim 1), Hyeok-Jun Koh ), Won-Sun Ruy 3) and Il-Hyoung Cho ) 1), 3), ) Department of Ocean System Engineering, Jeju
STALLING BEHAVIOUR OF A CONTRA-ROTATING AXIAL COMPRESSOR STAGE
 STALLING BEHAVIOUR OF A CONTRA-ROTATING AXIAL COMPRESSOR STAGE by YASHPAL JAIN Thesis submitted in fulfilment of the requirements for the degree of DOCTOR OF PHILOSOPHY Department of Mechanical Engineering
FLOW CONSIDERATIONS IN INDUSTRIAL SILENCER DESIGN
 FLOW CONSIDERATIONS IN INDUSTRIAL SILENCER DESIGN George Feng, Kinetics Noise Control, Inc., 3570 Nashua Drive, Mississauga, Ontario Vadim Akishin, Kinetics Noise Control, Inc., 3570 Nashua Drive, Mississauga,
ValidatingWindProfileEquationsduringTropicalStormDebbyin2012
 Global Journal of Researches in Engineering: e Civil And Structural Engineering Volume 4 Issue Version. Year 24 Type: Double Blind Peer Reviewed International Research Journal Publisher: Global Journals
Analysis and Design of Elevated Intze Watertank and its Comparative Study in Different Wind Zones - using SAP2000
 IJSTE - International Journal of Science Technology & Engineering Volume 2 Issue 2 August 2015 ISSN (online): 2349-784X Analysis and Design of Elevated Intze Watertank and its Comparative Study in Different
Fig 2.17: Topographic model: snow-free area (Snow boundary = red) Contour interval of 1 m.
 Contour interval of 1 m.") Fig 2.17: Topographic model: snow-free area (Snow boundary = red) Contour interval of 1 m. Fig 2.18: Utsteinen ridge characteristics: (1) Utsteinen ridge granite bedrock; (2) Compacted snow (west-side);
Fig 2.17: Topographic model: snow-free area (Snow boundary = red) Contour interval of 1 m. Fig 2.18: Utsteinen ridge characteristics: (1) Utsteinen ridge granite bedrock; (2) Compacted snow (west-side);
AF100. Subsonic Wind Tunnel AERODYNAMICS. Open-circuit subsonic wind tunnel for a wide range of investigations into aerodynamics
 Open-circuit subsonic wind tunnel for a wide range of investigations into aerodynamics Page 1 of 4 Works with Computer, chair and work table shown for photographic purposes only (not included) Screenshot
130 William Street New York, NY, USA
 12119293 ES29249846 DEPT OF BLDGS Job Number Scan Code COMMERCIAL - IN - CONFIDENCE 13 William Street New York, NY, USA Wind Tunnel Testing Overall Wind Loading Study December 21 st 216 For The Lightstone
THEORETICAL EVALUATION OF FLOW THROUGH CENTRIFUGAL COMPRESSOR STAGE
 THEORETICAL EVALUATION OF FLOW THROUGH CENTRIFUGAL COMPRESSOR STAGE S.Ramamurthy 1, R.Rajendran 1, R. S. Dileep Kumar 2 1 Scientist, Propulsion Division, National Aerospace Laboratories, Bangalore-560017,ramamurthy_srm@yahoo.com
ZIN Technologies PHi Engineering Support. PHi-RPT CFD Analysis of Large Bubble Mixing. June 26, 2006
 ZIN Technologies PHi Engineering Support PHi-RPT-0002 CFD Analysis of Large Bubble Mixing Proprietary ZIN Technologies, Inc. For nearly five decades, ZIN Technologies has provided integrated products and
Investigation on Divergent Exit Curvature Effect on Nozzle Pressure Ratio of Supersonic Convergent Divergent Nozzle
 RESEARCH ARTICLE OPEN ACCESS Investigation on Divergent Exit Curvature Effect on Nozzle Pressure Ratio of Supersonic Convergent Divergent Nozzle Shyamshankar.M.B*, Sankar.V** *(Department of Aeronautical
SUBMERGED VENTURI FLUME. Tom Gill 1 Robert Einhellig 2 ABSTRACT
 SUBMERGED VENTURI FLUME Tom Gill 1 Robert Einhellig 2 ABSTRACT Improvement in canal operating efficiency begins with establishing the ability to measure flow at key points in the delivery system. The lack
Generation of an Annual Typical Daily Wind Speed for Heights Equal and Less than 10 meters for Urban Armidale NSW, Australia
 IOSR Journal of Engineering (IOSRJEN) ISSN (e): 2250-3021, ISSN (p): 2278-8719 Vol. 04, Issue 08 (August. 2014), VX PP 31-42 www.iosrjen.org Generation of an Annual Typical Daily Wind Speed for Heights
23 RD INTERNATIONAL SYMPOSIUM ON BALLISTICS TARRAGONA, SPAIN APRIL 2007
 23 RD INTERNATIONAL SYMPOSIUM ON BALLISTICS TARRAGONA, SPAIN 16-20 APRIL 2007 AN INVESTIGATION INTO THE INTERRELATION BETWEEN THE INTERNAL AND EXTERNAL BALLISTICS OF FIRING A TP-T TANK AMMUNITION M. H.
Measurement and simulation of the flow field around a triangular lattice meteorological mast
 Measurement and simulation of the flow field around a triangular lattice meteorological mast Matthew Stickland 1, Thomas Scanlon 1, Sylvie Fabre 1, Andrew Oldroyd 2 and Detlef Kindler 3 1. Department of
ACCURATE PRESSURE MEASUREMENT FOR STEAM TURBINE PERFORMANCE TESTING
 ACCURATE PRESSURE MEASUREMENT FOR STEAM TURBINE PERFORMANCE TESTING Blair Chalpin Charles A. Matthews Mechanical Design Engineer Product Support Manager Scanivalve Corp Scanivalve Corp Liberty Lake, WA
A Study on the Distribution of the Peak Wind Pressure Coefficient for the Wind Resistant Design of Rooftop Hoardings in High-rise Buildings
 International Journal of Engineering Research and Technology. ISSN 0974-3154 Volume 11, Number 10 (2018), pp. 1583-1594 International Research Publication House http://www.irphouse.com A Study on the Distribution
lated by the arrangement of spires and roughness blocks to fit the urban terrain (terrain IV, power law index = 0.7) specified in AIJ recommendation (
 specified in AIJ recommendation (") The Seventh International olloquium on Bluff Body Aerodynamics and Applications (BBAA7) Shanghai, hina; September -6, 01 ross spectra of wind pressures on domed roofs in boundary layer wind tunnel Yuan-Lung
The Seventh International olloquium on Bluff Body Aerodynamics and Applications (BBAA7) Shanghai, hina; September -6, 01 ross spectra of wind pressures on domed roofs in boundary layer wind tunnel Yuan-Lung
The Sea Fish Industry Authority Seafish Technology
 The Sea Fish Industry Authority Seafish Technology Trials to Compare the Thermal Performance of a New Design of Tri-pack Corrugated Plastic Nonreusable fish box with Expanded Polystyrene and Single Walled
CHAPTER 5: VACUUM TEST WITH VERTICAL DRAINS
 CHAPTER 5: VACUUM TEST WITH VERTICAL DRAINS 5.1 Introduction Using surcharging as the sole soil consolidation mean can take a long time to reach the desired soil settlement. Soil consolidation using prefabricated
INTERNATIONAL JOURNAL OF CIVIL AND STRUCTURAL ENGINEERING Volume 1, No 4, 2010
 Effect of geometric dimensions on the transmission coefficient of floating breakwaters Mohammad Hosein Tadayon, Khosro Bargi 2, Hesam Sharifian, S. Reza Hoseini - Ph.D student, Department of Civil Engineering,
Wind tunnel test and numerical simulation of wind pressure on a high-rise building
 Journal of Chongqing University (English Edition) [ISSN 1671-8224] Vol. 9 No. 1 March 2010 Article ID: 1671-8224(2010)01-0047-07 To cite this article: AL ZOUBI Feras, LI Zheng-liang, WEI Qi-ke, SUN Yi.
RELIABILITY ASSESSMENT, STATIC AND DYNAMIC RESPONSE OF TRANSMISSION LINE TOWER: A COMPARATIVE STUDY
 RELIABILITY ASSESSMENT, STATIC AND DYNAMIC RESPONSE OF TRANSMISSION LINE TOWER: A COMPARATIVE STUDY Yusuf Mansur Hashim M. Tech (Structural Engineering) Student, Sharda University, Greater Noida, (India)
International Journal of Advance Research in Engineering, Science & Technology
 Impact Factor (SJIF): 4.542 International Journal of Advance Research in Engineering, Science & Technology e-issn: 2393-9877, p-issn: 2394-2444 Volume 4, Issue 4, April-2017 Planning & Design Of New By-pass
Effect of airflow direction on human perception of draught
 Effect of airflow direction on human perception of draught J. Toftum, G. Zhou, A. Melikov Laboratory of Indoor Environment and Energy Department of Energy Engineering Technical University of Denmark Abstract
Experiment 8: Minor Losses
 Experiment 8: Minor Losses Purpose: To determine the loss factors for flow through a range of pipe fittings including bends, a contraction, an enlargement and a gate-valve. Introduction: Energy losses
FINE SCALE MOMENTUM ADJUSTMENT ACROSS A FOREST EDGE: A WIND TUNNEL EXPERIMENT
 FINE SCALE MOMENTUM ADJUSTMENT ACROSS A FOREST EDGE: A WIND TUNNEL EXPERIMENT by Stuart Nulty A thesis submitted in partial fulfilment of the requirements for the degree of Bachelor of Applied Science
Experiment (13): Flow channel
: Flow channel") Experiment (13): Flow channel Introduction: An open channel is a duct in which the liquid flows with a free surface exposed to atmospheric pressure. Along the length of the duct, the pressure at the surface
Experiment (13): Flow channel Introduction: An open channel is a duct in which the liquid flows with a free surface exposed to atmospheric pressure. Along the length of the duct, the pressure at the surface
Single Phase Pressure Drop and Flow Distribution in Brazed Plate Heat Exchangers
 Purdue University Purdue e-pubs International Refrigeration and Air Conditioning Conference School of Mechanical Engineering 2016 Single Phase Pressure Drop and Flow Distribution in Brazed Plate Heat Exchangers
Yasuyuki Hirose 1. Abstract
 Study on Tsunami force for PC box girder Yasuyuki Hirose 1 Abstract In this study, a waterway experiment was performed in order to understand the influence of tsunami forms on tsunami forces acting on
CFD Simulation and Experimental Validation of a Diaphragm Pressure Wave Generator
 CFD Simulation and Experimental Validation of a Diaphragm Pressure Wave Generator T. Huang 1, A. Caughley 2, R. Young 2 and V. Chamritski 1 1 HTS-110 Ltd Lower Hutt, New Zealand 2 Industrial Research Ltd
JAR-23 Normal, Utility, Aerobatic, and Commuter Category Aeroplanes \ Issued 11 March 1994 \ Section 1- Requirements \ Subpart C - Structure \ General
 JAR 23.301 Loads \ JAR 23.301 Loads (a) Strength requirements are specified in terms of limit loads (the maximum loads to be expected in service) and ultimate loads (limit loads multiplied by prescribed
AERODYNAMIC CHARACTERISTICS OF NACA 0012 AIRFOIL SECTION AT DIFFERENT ANGLES OF ATTACK
 AERODYNAMIC CHARACTERISTICS OF NACA 0012 AIRFOIL SECTION AT DIFFERENT ANGLES OF ATTACK SUPREETH NARASIMHAMURTHY GRADUATE STUDENT 1327291 Table of Contents 1) Introduction...1 2) Methodology.3 3) Results...5
Australian Journal of Basic and Applied Sciences. Pressure Distribution of Fluid Flow through Triangular and Square Cylinders
 AENSI Journals Australian Journal of Basic and Applied Sciences ISSN:1991-8178 Journal home page: www.ajbasweb.com Pressure Distribution of Fluid Flow through Triangular and Square Cylinders 1 Nasaruddin
Air-Sea Interaction Spar Buoy Systems
 DISTRIBUTION STATEMENT A: Distribution approved for public release; distribution is unlimited Air-Sea Interaction Spar Buoy Systems Hans C. Graber CSTARS - University of Miami 11811 SW 168 th Street, Miami,
Study by numerical simulations on the breathing effect in a semi-underground highway with beams and a roof above it
 Study by numerical simulations on the breathing effect in a semi-underground highway with beams and a roof above it M Hagiwara East Nippon Expressway Co., Ltd, Japan A Mizuno, T Tsutaki Kogakuin University,
The Estimation Of Compressor Performance Using A Theoretical Analysis Of The Gas Flow Through the Muffler Combined With Valve Motion
 Purdue University Purdue e-pubs International Compressor Engineering Conference School of Mechanical Engineering The Estimation Of Compressor Performance Using A Theoretical Analysis Of The Gas Flow Through
Geometry Modification For Minimizing The Aeroelastics Effect
 Geometry Modification For Minimizing The Aeroelastics Effect Fariduzzaman a, Subagyo a, Fadilah Hasim a and Matza Gusto Andika a a Aero-Gas dynamics and Vibration Laboratory (LAGG), BPPT, PUSPIPTEK, Serpong
SUBPART C - STRUCTURE
 SUBPART C - STRUCTURE GENERAL CS 23.301 Loads (a) Strength requirements are specified in terms of limit loads (the maximum loads to be expected in service) and ultimate loads (limit loads multiplied by
Lab # 03: Visualization of Shock Waves by using Schlieren Technique
 AerE545 Lab # 03: Visualization of Shock Waves by using Schlieren Technique Objectives: 1. To get hands-on experiences about Schlieren technique for flow visualization. 2. To learn how to do the optics
PLEA th Conference, Opportunities, Limits & Needs Towards an environmentally responsible architecture Lima, Perú 7-9 November 2012
 Natural Ventilation using Ventilation shafts Multiple Interconnected Openings in a Ventilation Shaft Reduce the Overall Height of the Shaft While Maintaining the Effectiveness of Natural Ventilation ABHAY
NUMERICAL INVESTIGATION OF THE FLOW BEHAVIOUR IN A MODERN TRAFFIC TUNNEL IN CASE OF FIRE INCIDENT
 - 277 - NUMERICAL INVESTIGATION OF THE FLOW BEHAVIOUR IN A MODERN TRAFFIC TUNNEL IN CASE OF FIRE INCIDENT Iseler J., Heiser W. EAS GmbH, Karlsruhe, Germany ABSTRACT A numerical study of the flow behaviour
Remote sensing standards: their current status and significance for offshore projects
 Remote sensing standards: their current status and significance for offshore projects Peter J M Clive Technical Development Consultant SgurrEnergy Ltd 225 Bath Street Glasgow G2 4GZ E: peter.clive@sgurrenergy.com
COMPARISONS OF COMPUTATIONAL FLUID DYNAMICS AND
 The Seventh Asia-Pacific Conference on Wind Engineering, November 8-12, 2009, Taipei, Taiwan COMPARISONS OF COMPUTATIONAL FLUID DYNAMICS AND WIND TUNNEL EXPERIMENTS FOR PEDESTRIAN WIND ENVIRONMENTS Chin-Hsien
CFD Analysis of Giromill Type Vertical Axis Wind Turbine
 242 CFD Analysis Giromill Type Vertical Axis Wind Turbine K. Sainath 1, T. Ravi 2, Suresh Akella 3, P. Madhu Sudhan 4 1 Associate Pressor, Department Mechanical Engineering, Sreyas Inst. Engg. & Tech.,
PRESSURE FLUCTUATIONS ACTING ON A TAPERED TALL BUILDING
 The Seventh Asia-Pacific Conference on Wind Engineering, November 8-12, 29, Taipei, Taiwan PRESSURE FLUCTUATIONS ACTING ON A TAPERED TALL BUILDING Young-Moon Kim 1, Ki-Pyo You 1, Jang-Youl You 2 and Chang-Hyun
DETRMINATION OF A PLUNGER TYPE WAVE MAKER CHARACTERISTICE IN A TOWING TANK
 The 9 th International Conference on Coasts, Ports and Marine Structures (ICOPMAS 2010) 29 Nov.-1 Dec. 2010 (Tehran) DETRMINATION OF A PLUNGER TYPE WAVE MAKER CHARACTERISTICE IN A TOWING TANK sayed mohammad
Wind tunnel acoustic testing of wind generated noise on building facade elements
 See discussions, stats, and author profiles for this publication at: https://www.researchgate.net/publication/307638896 Wind tunnel acoustic testing of wind generated noise on building facade elements