Drift Characteristics of Paroscientific pressure sensors
|
|
|
- Hector Barber
- 6 years ago
- Views:
Transcription
1 Drift Characteristics of Paroscientific pressure sensors by Randolph Watts, Maureen Kennelly, Karen Tracey, and Kathleen Donohue (University of Rhode Island) PIES + current meter & CPIES arrays Paroscientific Digiquartz sensors 4 arrays, 7 settings leveling / dedrifting method Characterizing the observed drifts
2 Drift Characteristics of Paroscientific pressure sensors Aim to show (exponential+linear) curve is well suited to represent the drift Geostrophic leveling & drift detection is reliable to ~0.01 dbar new drift curves differ from previous method that used just P data, although both use (exp + lin) fit Averaging records from two or more same-site sensors produces an average drift, but not zero drift Pre-stressing reduces drift
3 CPIES: current and pressure recording inverted echo sounder Measures bottom current. (50 m off bottom) Emits 12kHz sound pulses. Measures round trip travel times of acoustic pulses to sea surface and back. Measures bottom pressure (and temperature). (includes acoustic release + relocation radio+strobe light)
4 CPIES array yields A CPIES array yields daily maps of upper and deep circulation. Look-up tables interpret acoustic travel times as geopotential height (0 referenced to 5000 dbar). 2-D arrays of CPIES estimate horizontal gradients of geopotential to calculate geostrophic velocities. Velocity profiles are referenced by measured nearbottom currents. Bottom pressures are leveled using near-bottom currents to map the geostrophic streamfunction.

5 Digiquartz sensor - Paroscientific website Digiquartz frequency increases with pressure-applied load: Accuracy 100 ppm; drift ~ 10 ppm; stability & resolution ~ <1-2 ppm PIES measures frequency with 4MHz temperature-compensated crystal freq. spec: 10 ppb accuracy to serve as a stable reference
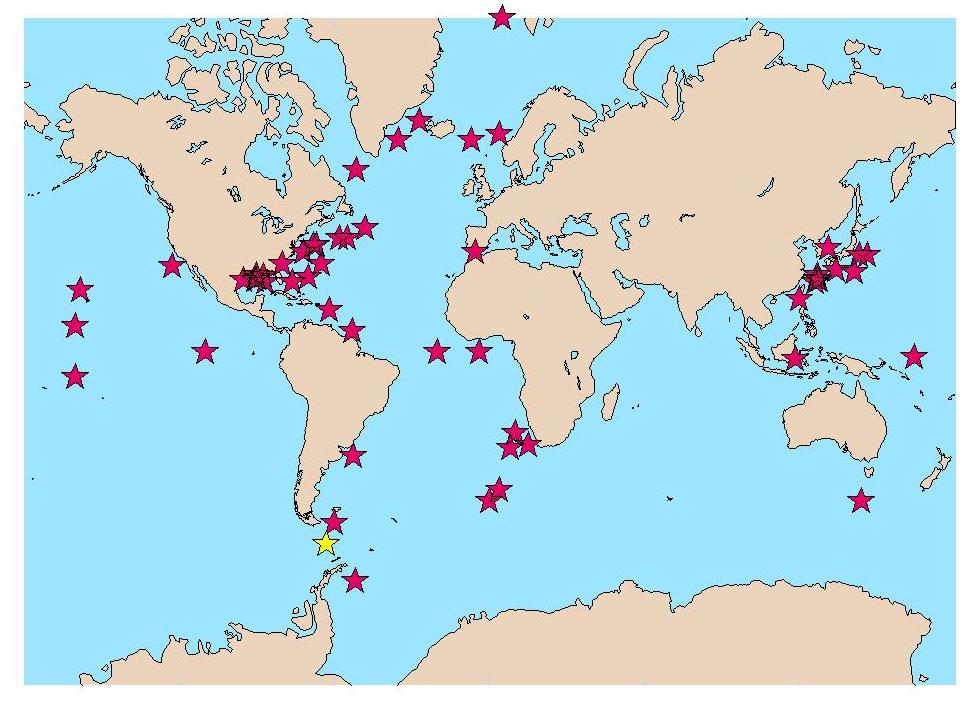
6 URI PIES & CPIES deployment sites 4 recent arrays with current meters; 7 settings

7 URI PIES & CPIES deployment sites Gulf of Mexico Drake Passage Kuroshio Extension Kuroshio, East China Sea 4 recent arrays with current meters; 7 settings


8 arrays of PIES & CMs combined to level the pressure sensors geostrophically Drake Passage Gulf of Mexico Kuroshio Extension
9 detide Detide Tidal response analysis (Munk and Cartwright, 1977) determines the tidal constituents for each instrument. Tides are then removed from the pressure records.
 records as")
10 Kuroshio Extension deep streamfunction maps LP filter (1-mo); July-Aug 2004 These are used to level and dedrift the P(t) records as follows.
11 Leveling (and drift) The streamfunction from CMs and the pressure from PIES measure the same geostrophic pressure field. The two fields should only differ by a sitedependent leveling constant.
12 drift-curve fit to P(t) - P cm (t) Examples from KESS sites 31-d lowpass filter p & p cm Difference (p-p cm ) is due to mapping-error and drift
13 drift-curve fit to P(t) - P cm (t) Examples from KESS sites 31-d lowpass filter p & p cm Difference (p-p cm ) is due to mapping-error and drift Fit exponential+linear to the difference Residual rms<0.01 dbar Resid slope<0.005dbar/yr
 to hourly data (dotted line), w/o geostrophic leveling could differ by 0.03-0.")
14 drift-curve fit to P(t) - P cm (t) Examples from KESS sites 31-d lowpass filter p & p cm Difference (p-p cm ) is due to mapping-error and drift Fit exponential+linear to the difference Residual rms<0.01 dbar Resid slope<0.005dbar/yr Old method fit (exp+lin) to hourly data (dotted line), w/o geostrophic leveling could differ by dbar
15 Digiquartz Pressure Drift (1) How well-suited is the (exponential + linear) curve-fit to the processes causing observed drifts? Test by comparing same-site differences of raw records against the sum of fitted drift curves Note same-site pairs could be 0.1 to 0.4 km apart
 agrees with difference between drift curves (red); rms <0.")
16 Consistency of method at same-site pairs in GoMex (rows 1, 2) sites with two PIES each, separately dedrifted (row 3) The difference between raw records (blue) agrees with difference between drift curves (red); rms < dbar (model 46K s)
 agrees with difference between drift curves (red); rms=0.004, 0.")
17 Consistency of (exp+lin) at same-site pairs in Kuroshio (rows 1, 2) Two sites with two PIES each, separately dedrifted (row 3) The difference between raw records (blue) agrees with difference between drift curves (red); rms=0.004, dbar (model 410K s)
18 The (exp + lin) curve suits the drift process well Next simply characterize the drift of each of many records by its (exp + lin) curve
19 144 drift curves from 92 sensors +0.1 dbar/yr ref slope
20 Digiquartz Pressure Drift (2) 6000 psi ~ 4000 dbar sensors, model 46K psi ~ 6800 dbar sensors, model 410K Do drifts scale with FS range? What sign and magnitude of drift?
21 Model 46K and 410K sensor drift 46K s - all pre-stressed 410K s - mixed pre-stressing

22 Model 46K (stretched) and 410K sensor drift 46K s, vertical scale X (10/6) -Slightly less drift, but the improvement may have arisen from pre-stressing 46K s - all pre-stressed 410K s - mixed pre-stressing
23 Typical drift ~ 0.4 dbar Upward and downward drifts would arise from two different processes Exponential and linear drifts would arise from different processes So there must be at least 3-4 substantial contributions to drift Yeow!
24 Digiquartz Pressure Drift (3) Since the largest part of the drift decays exponentially with time, can pre-stressing the sensors decrease subsequent drift? We usually pre-stress for many weeks or months 4000 psi for 6000 psi FS (~2800 dbar for ~4000 dbar FS) 6000 psi for psi FS (~4100 dbar for ~6800 dbar FS) How much might it help to pre-stress at nearly the same pressure as the subsequent deployment? Does sensor improve with age?
25 How effective is pre-stressing? (410K s) Without pre-stressing, all six drifts ~ -.4 dbar in a year With pre-stressing many drifts <0.1 dbar (+/-) in a year, but many others drifted up or down ~0.4 dbar in 1-2 yrs pre-stressing seems highly advisable, but does not guarantee small drift
26 How effective is pre-stressing? (410K s) Without pre-stressing, all six drifts ~ -.4 dbar in a year With pre-stressing many drifts <0.1 dbar (+/-) in a year, but many others drifted up or down ~0.4 dbar in 1-2 yrs pre-stressing seems highly advisable, but does not guarantee small drift Next represent drift as (end-start)
27 Does it help to pre-stress at ~ deployment P? Answer maybe excepting outliers
28 Does drift depend on prior deployment depth? difference (P new - P prior ) Answer is similarly murky Slightly less drift with `same new and old deployment depths.
29 Does age of sensor reduce drift rate? (1-year) total drift vs. age
30 Digiquartz Pressure Drift (4) Does a given sensor drift predictably from one deployment to the next?
31 Digiquartz Pressure Drift (4) Does a given sensor drift predictably from one deployment to the next? Answer the drift is not necessarily replicated in magnitude or direction! But we had many variables, and have not yet sorted out all effects. A few sensors DID replicate drift.
32
33 Digiquartz Pressure Drift (5) If you average two same-site pressure records, how well can this approximate a drift-free record? Test by comparing near-neighbor averages of raw records against the accurately dedrifted curves Near-neighbors could be 0.1 to 0.4km apart

34 These 46K sites average very well because they had small drifts that fortuitously opposed each other.

35 These 410K site-pairs did not average to small drift.
36 Drift Characteristics of Paroscientific pressure sensors Summary (exponential+linear) fitted curve is well suited to represent the drift, to which 3 or more processes contribute Geostrophic leveling & drift detection is reliable to ~0.01 dbar New drift curves differ from previous method of fitting data, although both use (exp + lin) fit Averaging records from two or more same-site sensors produces an average drift, but not zero drift Pre-stressing reduces drift (usually) < 0.10 dbar / yr Small net drift helps reduce uncertainty in fitted drift curve Aged sensors improve like good wine Drift of a given sensor is not predictable from one deployment to the next Choose a low range sensor (when possible) to achieve smaller drift
37 FINI
38 Might add histogram of decay time scale
39 144 drift curves from 92 sensors +0.1 dbar/yr ref slope
40 IES deployment sites

41 CPIES array yields A CPIES array yields daily maps of upper and deep circulation. Look-up tables interpret acoustic travel times as geopotential height (0 referenced to 5000 dbar). 2-D arrays of CPIES estimate horizontal gradients of geopotential to calculate geostrophic velocities. Velocity profiles are referenced by measured nearbottom currents. Bottom pressures are leveled using near-bottom currents to map the geostrophic streamfunction.
42 LEVELING PRESSURE GAUGE WITH DEEP CURRENT METERS Pre-stress pressure gauges Leveling flowchart Detide pressure Current at CMs Dedrift pressure Mean pressure Mean current Leveled pressure constants
43 Pre-stress gauges Pre-stress gauges Experience has shown that pressure drift is greatly reduced by preconditioning. Sensors are subjected to pressures of 3000 dbar for 1-2 months in the lab.
44 Mapping flowchart Leveled p Current at CM sites Mean p and current maps Mean p at PIES sites Mean current at CM sites p anomaly Current anomaly p and current anomaly maps Daily p and current maps
45 Leveling (and drift) The streamfunction from CMs and the pressure from PIES measure the same geostrophic pressure field. The two fields should only differ by a site-dependent leveling constant. Other differences arise from error in OI mapped streamfunction and drift in the pressure sensor. The sensor drift is detected by the difference from the temporal record of geostrophic pressures The drift is represented by a decaying exponential plus linear curve, least-squares fitted to this difference
46 Consistency of (exp+lin) at same-site pair in Kuroshio(2) (rows 1, 2) Another site with two PIES, separately dedrifted (row 3) The difference between raw records (blue) agrees with difference between drift curves (red); rms <0.005 dbar (model 410K)
47 Is drift smaller in 2nd/3rd deployment? 46K s 410K s 1st 2nd 3rd
48 Subsequent depth shallower/ same/ deeper shallower same depth +/- 500m -0.1 dbar/yr 410K s drifts are mixed Shallower 46K s drift to higher P or flat Deeper 46K s drift to lower P or nearly flat Same-depth 46K s - slightly better? deeper
49
50 Does drift depend on prior deployment depth? difference (P new - P prior ) Slightly less drift with `same new and old deployment depths.
51 Repeatable drifts? 46K Twelve representative repeats of 46K s having same Bliley and smallest depth differences between deployments. The repeatability of 46K s looks promising. However next look at 410K s - not as reproducible
52 Repeatable drifts? 410K These are 2nd deployments of 410K s. Not as reproducible as for the previous set. Other factors changed Deployment depth Time interval between
TRIAXYS Acoustic Doppler Current Profiler Comparison Study
 TRIAXYS Acoustic Doppler Current Profiler Comparison Study By Randolph Kashino, Axys Technologies Inc. Tony Ethier, Axys Technologies Inc. Reo Phillips, Axys Technologies Inc. February 2 Figure 1. Nortek
BOTTOM MAPPING WITH EM1002 /EM300 /TOPAS Calibration of the Simrad EM300 and EM1002 Multibeam Echo Sounders in the Langryggene calibration area.
 BOTTOM MAPPING WITH EM1002 /EM300 /TOPAS Calibration of the Simrad EM300 and EM1002 Multibeam Echo Sounders in the Langryggene calibration area. by Igor Kazantsev Haflidi Haflidason Asgeir Steinsland Introduction
Digiquartz Water-Balanced Pressure Sensors for AUV, ROV, and other Moving Underwater Applications
 Digiquartz Water-Balanced Pressure Sensors for AUV, ROV, and other Moving Underwater Applications Dr. Theo Schaad Principal Scientist Paroscientific, Inc. 2002 Paroscientific, Inc. Page 1 of 6 Digiquartz
Next Generation Quartz Pressure Gauges
 Next Generation Quartz Pressure Gauges Rick Puccio, Ph.D. Senior Scientist Quartzdyne Houston, TX March 2, 2016 Outline Quartz Pressure Gauge Introduction Gauge Size Reduction Long Term Pressure Drift
14/10/2013' Bathymetric Survey. egm502 seafloor mapping
 egm502 seafloor mapping lecture 10 single-beam echo-sounders Bathymetric Survey Bathymetry is the measurement of water depths - bathymetry is the underwater equivalent of terrestrial topography. A transect
Echo Sounder Evaluation of XBT Drop Rate off the coast of Florida
 Echo Sounder Evaluation of XBT Drop Rate off the coast of Florida Lockheed Martin Sippican Grant Johnson Engineering Project Manager Ocean Products 9/22/2010 1 Introduction New fall rate evaluation approach
EXPERIMENTAL RESULTS OF GUIDED WAVE TRAVEL TIME TOMOGRAPHY
 18 th World Conference on Non destructive Testing, 16-20 April 2012, Durban, South Africa EXPERIMENTAL RESULTS OF GUIDED WAVE TRAVEL TIME TOMOGRAPHY Arno VOLKER 1 and Hendrik VOS 1 TNO, Stieltjesweg 1,
ACCURACY, PERFORMANCE, AND HANDLING OF OIL-FILLED DIGIQUARTZ PRESSURE INSTRUMENTATION
 Application Note Doc. G8108-001 Rev. A - 23-Jul-02 ACCURACY, PERFORMANCE, AND HANDLING OF OIL-FILLED DIGIQUARTZ PRESSURE INSTRUMENTATION For more information regarding Digiquartz products contact: Paroscientific,
3.6 Magnetic surveys. Sampling Time variations Gradiometers Processing. Sampling
 3.6 Magnetic surveys Sampling Time variations Gradiometers Processing Sampling Magnetic surveys can be taken along profiles or, more often, on a grid. The data for a grid is usually taken with fairly frequent
SURFACE CURRENTS AND TIDES
 NAME SURFACE CURRENTS AND TIDES I. Origin of surface currents Surface currents arise due to the interaction of the prevailing wis a the ocean surface. Hence the surface wi pattern (Figure 1) plays a key
White Paper. Overview of MAP Headspace Gas Measurement: Sample Volume Considerations:
 Title: MAP Headspace Gas Testing good measurement practices TSN Number: 27 File:\\MII- SRV1\Metron\Bridge_Analyzers\Customer_Service_Documentation\White_Papers\MAP _CAT\27 Headspace Gas Sampling Issues.docx
Figure 1: A hockey puck travels to the right in three different cases.
 Question (12) Average velocity and position (update) for three hockey pucks You view the motion of a hockey puck in a video and mark its location every. The resulting image for three different hockey pucks
Wind Regimes 1. 1 Wind Regimes
 Wind Regimes 1 1 Wind Regimes The proper design of a wind turbine for a site requires an accurate characterization of the wind at the site where it will operate. This requires an understanding of the sources
Nortek Technical Note No.: TN-021. Chesapeake Bay AWAC Evaluation
 Nortek Technical Note No.: TN-021 Title: Chesapeake Bay AWAC Evaluation Last Edited: October 5, 2004 Authors: Eric Siegel-NortekUSA, Chris Malzone-NortekUSA, Torstein Pedersen- Number of Pages: 12 Chesapeake
STANDARD SCORES AND THE NORMAL DISTRIBUTION
 STANDARD SCORES AND THE NORMAL DISTRIBUTION REVIEW 1.MEASURES OF CENTRAL TENDENCY A.MEAN B.MEDIAN C.MODE 2.MEASURES OF DISPERSIONS OR VARIABILITY A.RANGE B.DEVIATION FROM THE MEAN C.VARIANCE D.STANDARD
PMI Pulse Decay Permeameter for Shale Rock Characterization Yang Yu, Scientist Porous Materials Inc., 20 Dutch Mill Road, Ithaca NY 14850
 PMI Pulse Decay Permeameter for Shale Rock Characterization Yang Yu, Scientist Porous Materials Inc., 20 Dutch Mill Road, Ithaca NY 14850 This document describes the application of Pulse Decay Permeameter
Measured broadband reverberation characteristics in Deep Ocean. [E.Mail: ]
![Measured broadband reverberation characteristics in Deep Ocean. [E.Mail: ]](/thumbs/90/101823179.jpg "Measured broadband reverberation characteristics in Deep Ocean. [E.Mail: ]") Measured broadband reverberation characteristics in Deep Ocean Baiju M Nair, M Padmanabham and M P Ajaikumar Naval Physical and Oceanographic Laboratory, Kochi-682 021, India [E.Mail: ] Received ; revised
Measured broadband reverberation characteristics in Deep Ocean Baiju M Nair, M Padmanabham and M P Ajaikumar Naval Physical and Oceanographic Laboratory, Kochi-682 021, India [E.Mail: ] Received ; revised
Long-Term Performance of an AWAC Wave Gage, Chesapeake Bay, VA
 Long-Term Performance of an AWAC Wave Gage, Chesapeake Bay, VA P. T. Puckette G. B. Gray Evans-Hamilton, Inc. 3319 Maybank Highway Johns Is, SC 29455 USA Abstract- Evans-Hamilton, Inc. deployed a Nortek
Impact of Dredging the Lower Narrow River on Circulation and Flushing
 Impact of Dredging the Lower Narrow River on Circulation and Flushing Craig Swanson Ph.D. Swanson Environmental Alex Shaw Ocean Engineering, URI Prof. Malcolm L. Spaulding Ocean Engineering, URI 29 January
Undertow - Zonation of Flow in Broken Wave Bores
 Nearshore Circulation Undertow and Rip Cells Undertow - Zonation of Flow in Broken Wave Bores In the wave breaking process, the landward transfer of water, associated with bore and surface roller decay
Increased streamer depth for dual-sensor acquisition Challenges and solutions Marina Lesnes*, Anthony Day, Martin Widmaier, PGS
 Increased streamer depth for dual-sensor acquisition Challenges and solutions Marina Lesnes*, Anthony Day, Martin Widmaier, PGS Summary The towing depth applicable to dual-sensor streamer acquisition has
WindProspector TM Lockheed Martin Corporation
 WindProspector TM www.lockheedmartin.com/windprospector 2013 Lockheed Martin Corporation WindProspector Unparalleled Wind Resource Assessment Industry Challenge Wind resource assessment meteorologists
Movement and Position
 Movement and Position Syllabus points: 1.2 plot and interpret distance-time graphs 1.3 know and use the relationship between average speed, distance moved and 1.4 describe experiments to investigate the
BERNOULLI EFFECTS ON PRESSURE.ACTIVATED W ATER LEVEL GAUGES
 International Hydrographic R eview, Monaco, LV (2), July 1978. BERNOULLI EFFECTS ON PRESSURE.ACTIVATED W ATER LEVEL GAUGES by Langley R. MUIR Ocean and Aquatic Sciences, Central Region, Burlington, Ontario,
Axial Base (PN3A) Medium-Power (MP) J-box
 Medium-Power (MP) J-box") Axial Base (PN3A) Medium-Power (MP) J-box Location: 46.1 N, 129.6 W Depth of Water Column: 2654 m This node supports geophysical instruments at the base of Axial Seamount. Instrument Name/Description Data
Axial Base (PN3A) Medium-Power (MP) J-box Location: 46.1 N, 129.6 W Depth of Water Column: 2654 m This node supports geophysical instruments at the base of Axial Seamount. Instrument Name/Description Data
High Ping Rate Profile Water Mode 12
 Application Note FSA-014 (October 2008) Revised October 2008 High Ping Rate Profile Water Mode 12 Introduction Water Mode 12 is the result of the continued evolution of the signal processing within our
The development of high resolution global ocean surface wave-tidecirculation
 PICES Annual Meeting in Qingdao The development of high resolution global ocean surface wave-tidecirculation coupled model Fangli Qiao, Qi Shu and Bin Xiao First Institute of Oceanography, SOA, China Oct
3. Approximately how far will an object near Earth's surface fall in 3.0 seconds? m m m m
 Page 1 of 5 Sub work 10-10-02 Name 12-OCT-03 1. A car travels a distance of 98 meters in 10. seconds. What is the average speed of the car during this 10.-second interval? 1. 4.9 m/s 3. 49 m/s/ 2. 9.8
Geostrophic and Tidal Currents in the South China Sea, Area III: West Philippines
 Southeast Asian Fisheries Development Center Geostrophic and Tidal Currents in the South China Sea, Area III: West Philippines Anond Snidvongs Department od Marine Science, Chulalongkorn University, Bangkok
Aspects of gravimeter calibration by time domain comparison of gravity records
 1 of 8 2/18/2011 3:51 PM Aspects of gravimeter calibration by time domain comparison of gravity records Bruno Meurers Institute for Meteorology and Geophysics University of Vienna bruno.meurers@univie.ac.at
The Wind Resource: Prospecting for Good Sites
 The Wind Resource: Prospecting for Good Sites Bruce Bailey, President AWS Truewind, LLC 255 Fuller Road Albany, NY 12203 bbailey@awstruewind.com Talk Topics Causes of Wind Resource Impacts on Project Viability
A multi-index GEM technique and its application to the southwestern Japan/East Sea
 A multi-index GEM technique and its application to the southwestern Japan/East Sea 1 Jae-Hun Park 1, D. Randolph Watts 1, Karen. L. Tracey 1 and Douglas A. Mitchell 2 1 Graduate School of Oceanography,
Analysis of Highland Lakes Inflows Using Process Behavior Charts Dr. William McNeese, Ph.D. Revised: Sept. 4,
 Analysis of Highland Lakes Inflows Using Process Behavior Charts Dr. William McNeese, Ph.D. Revised: Sept. 4, 2018 www.spcforexcel.com Author s Note: This document has been revised to include the latest
Wind Flow Validation Summary
 IBHS Research Center Validation of Wind Capabilities The Insurance Institute for Business & Home Safety (IBHS) Research Center full-scale test facility provides opportunities to simulate natural wind conditions
Sontek RiverSurveyor Test Plan Prepared by David S. Mueller, OSW February 20, 2004
 Sontek RiverSurveyor Test Plan Prepared by David S. Mueller, OSW February 20, 2004 INTRODUCTION Sontek/YSI has introduced new firmware and software for their RiverSurveyor product line. Firmware changes
Deep SOLO. Nathalie Zilberman, Dean Roemmich, and SIO float lab. 1. Deep SOLO float characteristics. 2. Deep SOLO float Deployment
 Deep SOLO Nathalie Zilberman, Dean Roemmich, and SIO float lab 1. Deep SOLO float characteristics 2. Deep SOLO float Deployment 3. Deep SOLO temperature and salinity Deep SOLO Float deployment, R/V Tangaroa
Wind Project Siting & Resource Assessment
 Wind Project Siting & Resource Assessment David DeLuca, Project Manager AWS Truewind, LLC 463 New Karner Road Albany, NY 12205 ddeluca@awstruewind.com www.awstruewind.com AWS Truewind - Overview Industry
A review of best practices for Selection, Installation, Operation and Maintenance of Gas meters for Flare Applications used for Managing facility
 A review of best practices for Selection, Installation, Operation and Maintenance of Gas meters for Flare Applications used for Managing facility mass balance and compliance 1. What, When and Why? 2. Flare
Applications of ELCIRC at LNEC
 stratification in the Guadiana estuary tidal propagation in the Óbidos lagoon Lígia Pinto Anabela Oliveira André B. Fortunato 2 O utline Stratification in the Guadiana estuary The Guadiana estuary Objectives
Evaluation of the Klein HydroChart 3500 Interferometric Bathymetry Sonar for NOAA Sea Floor Mapping
 Evaluation of the Klein HydroChart 3500 Interferometric Bathymetry Sonar for NOAA Sea Floor Mapping Yuhui Ai, Straud Armstrong and Dean Fleury L-3 Communications Klein Associates, Inc. 11 Klein Dr. Salem,
Temperature, salinity, density, and the oceanic pressure field
 Chapter 2 Temperature, salinity, density, and the oceanic pressure field The ratios of the many components which make up the salt in the ocean are remarkably constant, and salinity, the total salt content
Minimal influence of wind and tidal height on underwater noise in Haro Strait
 Minimal influence of wind and tidal height on underwater noise in Haro Strait Introduction Scott Veirs, Beam Reach Val Veirs, Colorado College December 2, 2007 Assessing the effect of wind and currents
Undertow - Zonation of Flow in Broken Wave Bores
 Lecture 22 Nearshore Circulation Undertow - Zonation of Flow in Broken Wave Bores In the wave breaking process, the landward transfer of water, associated with bore and surface roller decay within the
Draft of OKMC Cruise Plan (R/V Revelle June 1-14, 2012 RR1205)
") Draft of OKMC Cruise Plan (R/V Revelle June 1-14, 2012 RR1205) Ren-Chieh Lien and Thomas B Sanford 1. Objectives In the RR1205 cruise, we will deploy five subsurface moorings, one surface mooring (TBD),
Draft of OKMC Cruise Plan (R/V Revelle June 1-14, 2012 RR1205) Ren-Chieh Lien and Thomas B Sanford 1. Objectives In the RR1205 cruise, we will deploy five subsurface moorings, one surface mooring (TBD),
COMPARISON OF DIFFERENTIAL PRESSURE SENSING TECHNOLOGIES IN HOSPITAL ISOLATION ROOMS AND OTHER CRITICAL ENVIRONMENT APPLICATIONS
 COMPARISON OF DIFFERENTIAL PRESSURE SENSING TECHNOLOGIES IN HOSPITAL ISOLATION ROOMS AND OTHER CRITICAL ENVIRONMENT APPLICATIONS APPLICATION NOTE LC-136 Introduction Specialized spaces often times must
Mass coral mortality under local amplification of 2 C ocean warming
 Mass coral mortality under local amplification of C ocean warming Thomas M. DeCarlo, Anne L. Cohen, George T.F. Wong, Kristen A. Davis, Pat Lohmann, Keryea Soong correspondence to: tdecarlo@uwa.edu.au
Overview. 2 Module 13: Advanced Data Processing
 2 Module 13: Advanced Data Processing Overview This section of the course covers advanced data processing when profiling. We will discuss the removal of the fairly gross effects of ship heave and talk
On the Interpretation of Scatterometer Winds near Sea Surface Temperature Fronts
 On the Interpretation of Scatterometer Winds near Sea Surface Temperature Fronts Jim Edson University of Connecticut Amanda Plagge & Doug Vandemark University of New Hampshire IOVWST Meeting Utrecht, NL
Atmosphere, Ocean and Climate Dynamics Fall 2008
 MIT OpenCourseWare http://ocw.mit.edu 12.003 Atmosphere, Ocean and Climate Dynamics Fall 2008 For information about citing these materials or our Terms of Use, visit: http://ocw.mit.edu/terms. Problem
In ocean evaluation of low frequency active sonar systems
 Acoustics 8 Paris In ocean evaluation of low frequency active sonar systems K.T. Hjelmervik and G.H. Sandsmark FFI, Postboks 5, 39 Horten, Norway kth@ffi.no 2839 Acoustics 8 Paris Sonar performance measurements
Characterization of Boundary-Layer Meteorology During DISCOVER-AQ
 Characterization of Boundary-Layer Meteorology During DISCOVER-AQ Daniel M. Alrick and Clinton P. MacDonald Sonoma Technology, Inc. Gary A. Morris St. Edward s University for Texas Air Quality Research
INSTRUMENT INSTRUMENTAL ERROR (of full scale) INSTRUMENTAL RESOLUTION. Tutorial simulation. Tutorial simulation
 INSTRUMENTAL RESOLUTION. Tutorial simulation. Tutorial simulation") Lab 1 Standing Waves on a String Learning Goals: To distinguish between traveling and standing waves To recognize how the wavelength of a standing wave is measured To recognize the necessary conditions
Lab 1 Standing Waves on a String Learning Goals: To distinguish between traveling and standing waves To recognize how the wavelength of a standing wave is measured To recognize the necessary conditions
LONG WAVES OVER THE GREAT BARRIER REEF. Eric Wolanski ABSTRACT
 LONG WAVES OVER THE GREAT BARRIER REEF by Eric Wolanski k ABSTRACT Low-frequency forcing of water currents over the continental shelf f Australia is quite strong and should be taken into account when the
HOURLY OCEANOGRAPHIC AND ACOUSTIC VARIATIONS IN THE STRAIT OF GIBRALTAR, AND MULTIBEAM ECHOSOUNDER TECHNOLOGY
 International Hydrographic Review, Monaco, LXXIII(2), September 1996 HOURLY OCEANOGRAPHIC AND ACOUSTIC VARIATIONS IN THE STRAIT OF GIBRALTAR, AND MULTIBEAM ECHOSOUNDER TECHNOLOGY by RUIZ-CANAVATE,1 A.
MAPCO2 Buoy Metadata Report Project Title:
 MAPCO2 Buoy Metadata Report Project Title: Autonomous Multi-parameter Measurements from a Drifting Buoy During the SO GasEx Experiment Funding Agency: NOAA Global Carbon Cycle program PI(s): Christopher
Geospatial Positioning Accuracy Standards Part 5: Standards for Nautical Charting Hydrographic Surveys - Public Review Draft
 Appendix B FGDC Hydrographic Accuracy Standard Geospatial Positioning Accuracy Standards Part 5: Standards for Nautical Charting Hydrographic Surveys - Public Review Draft Subcommittee on Marine and Coastal
Atmospheric Forcing and the Structure and Evolution of the Upper Ocean in the Bay of Bengal
 DISTRIBUTION STATEMENT A. Approved for public release; distribution is unlimited. Atmospheric Forcing and the Structure and Evolution of the Upper Ocean in the Bay of Bengal J. Thomas Farrar and Robert
Observed Roughness Lengths for Momentum and Temperature on a Melting Glacier Surface
 5 Observed Roughness Lengths for Momentum and Temperature on a Melting Glacier Surface The roughness lengths for momentum and temperature are calculated on a melting glacier surface. Data from a five level
Characterizers for control loops
 Characterizers for control loops By: F. G. Shinskey (May 1999) Introduction Commercial controllers such as the PID series (proportional, integral, derivative, and their combinations) are linear devices
LOW PRESSURE EFFUSION OF GASES revised by Igor Bolotin 03/05/12
 LOW PRESSURE EFFUSION OF GASES revised by Igor Bolotin 03/05/ This experiment will introduce you to the kinetic properties of low-pressure gases. You will make observations on the rates with which selected
Harmonics and Sound Exam Review
 Name: Class: _ Date: _ Harmonics and Sound Exam Review Multiple Choice Identify the letter of the choice that best completes the statement or answers the question. 1. Which of the following is not an example
Figure 4, Photo mosaic taken on February 14 about an hour before sunset near low tide.
 The Impact on Great South Bay of the Breach at Old Inlet Charles N. Flagg and Roger Flood School of Marine and Atmospheric Sciences, Stony Brook University Since the last report was issued on January 31
Waves Wave Characteristics
 Name: Date: Waves 4.4 Wave Characteristics. A transverse travelling wave has amplitude A 0 and wavelength λ. The distance between a crest and its neighbouring trough, measured in the direction of energy
(20 points) 1. ENSO is a coupled climate phenomenon in the tropical Pacific that has both regional and global impacts.
 1. ENSO is a coupled climate phenomenon in the tropical Pacific that has both regional and global impacts.") SIO 210 Problem Set 4 Answer key December 1, 2014 Due Dec. 12, 2014 (20 points) 1. ENSO is a coupled climate phenomenon in the tropical Pacific that has both regional and global impacts. (2 points) a)
SIO 210 Problem Set 4 Answer key December 1, 2014 Due Dec. 12, 2014 (20 points) 1. ENSO is a coupled climate phenomenon in the tropical Pacific that has both regional and global impacts. (2 points) a)
WIND DATA REPORT. Paxton, MA
 WIND DATA REPORT Paxton, MA July 1, 2011 September 30, 2011 Prepared for Massachusetts Clean Energy Center 55 Summer Street, 9th Floor Boston, MA 02110 by Eric Morgan James F. Manwell Anthony F. Ellis
Argo Float Pressure Offset Adjustment Recommendations. 1: IORGC/JAMSTEC, 2-15, Natsushima-cho, Yokosuka, , Japan
 Argo Float Pressure Offset Adjustment Recommendations Taiyo Kobayashi 1, 2 and Gregory C. Johnson 3 1: IORGC/JAMSTEC, 2-15, Natsushima-cho, Yokosuka, 237-0061, Japan taiyok@jamstec.go.jp 2: Now visiting
High Frequency Acoustical Propagation and Scattering in Coastal Waters
 High Frequency Acoustical Propagation and Scattering in Coastal Waters David M. Farmer Graduate School of Oceanography (educational) University of Rhode Island Narragansett, RI 02882 phone: (401) 874-6222
Results and Discussion for Steady Measurements
 Chapter 5 Results and Discussion for Steady Measurements 5.1 Steady Skin-Friction Measurements 5.1.1 Data Acquisition and Reduction A Labview software program was developed for the acquisition of the steady
Examples of Carter Corrected DBDB-V Applied to Acoustic Propagation Modeling
 Naval Research Laboratory Stennis Space Center, MS 39529-5004 NRL/MR/7182--08-9100 Examples of Carter Corrected DBDB-V Applied to Acoustic Propagation Modeling J. Paquin Fabre Acoustic Simulation, Measurements,
Module 9. Advanced Data Processing
 Module 9 Advanced Data Processing 2 Module 9: Advanced Data processing Overview Advanced Data Processing or Why Doesn t My Data Look Like the Examples in Class? Sensor alignment, matching measurements
a wave is a rhythmic disturbance that carries/transfers energy through matter or space A repeating movement
 a wave is a rhythmic disturbance that carries/transfers energy through matter or space A repeating movement Mechanical Waves require a medium medium: the matter through which a wave travels examples: water,
Homework 2a Bathymetric Charts [based on the Chauffe & Jefferies (2007)]
![Homework 2a Bathymetric Charts [based on the Chauffe & Jefferies (2007)]](/thumbs/73/69074241.jpg "Homework 2a Bathymetric Charts [based on the Chauffe & Jefferies (2007)]") 14 August 2008 MAR 110 HW-2a: ex1bathymetric Charts 1 2-1. BATHYMETRIC CHARTS Homework 2a Bathymetric Charts [based on the Chauffe & Jefferies (2007)] Nautical charts are maps of a region of the ocean
14 August 2008 MAR 110 HW-2a: ex1bathymetric Charts 1 2-1. BATHYMETRIC CHARTS Homework 2a Bathymetric Charts [based on the Chauffe & Jefferies (2007)] Nautical charts are maps of a region of the ocean
Atmospheric Waves James Cayer, Wesley Rondinelli, Kayla Schuster. Abstract
 Atmospheric Waves James Cayer, Wesley Rondinelli, Kayla Schuster Abstract It is important for meteorologists to have an understanding of the synoptic scale waves that propagate thorough the atmosphere
ESCI 343 Atmospheric Dynamics II Lesson 10 - Topographic Waves
 ESCI 343 Atmospheric Dynamics II Lesson 10 - Topographic Waves Reference: An Introduction to Dynamic Meteorology (3 rd edition), J.R. Holton Reading: Holton, Section 7.4. STATIONARY WAVES Waves will appear
Motion Graphing Packet
 Name: Motion Graphing Packet This packet covers two types of motion graphs Distance vs. Time Graphs Velocity vs. Time Graphs Describing the motion of an object is occasionally hard to do with words. Sometimes
REAL LIFE GRAPHS M.K. HOME TUITION. Mathematics Revision Guides Level: GCSE Higher Tier
 Mathematics Revision Guides Real Life Graphs Page 1 of 19 M.K. HOME TUITION Mathematics Revision Guides Level: GCSE Higher Tier REAL LIFE GRAPHS Version: 2.1 Date: 20-10-2015 Mathematics Revision Guides
SBE61 CTD calibration: results from the June 2014 Tangaroa Voyage
 SBE61 CTD calibration: results from the June 2014 Tangaroa Voyage Phil Sutton, Matt Walkington NIWA Dave Murphy, Sea Bird Electronics Dean Roemmich, Nathalie Zilberman Scripps Institution of Oceanography
Chapter 7. SCIIB Pressure Sensor Performance Evaluations: Experiments, Results and Discussions
 : Experiments, Results and Discussions This chapter will summarize the experiments and results associated with the development of the single-mode fiber-based SCIIB pressure sensor system. We will start
BUYER S GUIDE AQUAlogger 520
 OCEAN & ENVIRONMENTAL BUYER S GUIDE AQUAlogger 520 Mini Temperature and Pressure Logger AQUAlogger 520 Aquatec s primary temperature and depth model, the AQUAlogger 520, combines years of product development
Practice Test: Vectors and Projectile Motion
 ame: Practice Test: Vectors and Projectile Motion Part A: Multiple Choice [15 points] 1. A projectile is launched at an angle of 30 0 above the horizontal. eglecting air resistance, what are the projectile
Atmospheric Rossby Waves in Fall 2011: Analysis of Zonal Wind Speed and 500hPa Heights in the Northern and Southern Hemispheres
 Atmospheric Rossby Waves in Fall 211: Analysis of Zonal Wind Speed and 5hPa Heights in the Northern and Southern s Samuel Cook, Craig Eckstein, and Samantha Santeiu Department of Atmospheric and Geological
Paper 2.2. Operation of Ultrasonic Flow Meters at Conditions Different Than Their Calibration
 Paper 2.2 Operation of Ultrasonic Flow Meters at Conditions Different Than Their Calibration Mr William Freund, Daniel Measurement and Control Mr Klaus Zanker, Daniel Measurement and Control Mr Dale Goodson,
Appendix 5: Currents in Minas Basin. (Oceans Ltd. 2009)
") Appendix 5: Currents in Minas Basin (Oceans Ltd. 29) Current in Minas Basin May 1, 28 March 29, 29 Submitted To: Minas Basin Pulp and Power P.O. Box 41 53 Prince Street Hansport, NS, BP 1P by 22, Purdy
Appendix 5: Currents in Minas Basin (Oceans Ltd. 29) Current in Minas Basin May 1, 28 March 29, 29 Submitted To: Minas Basin Pulp and Power P.O. Box 41 53 Prince Street Hansport, NS, BP 1P by 22, Purdy
Observations of Near-Bottom Currents with Low-Cost SeaHorse Tilt Current Meters
 DISTRIBUTION STATEMENT A. Approved for public release; distribution is unlimited. Observations of Near-Bottom Currents with Low-Cost SeaHorse Tilt Current Meters Vitalii A. Sheremet, Principal Investigator
Equation 1: F spring = kx. Where F is the force of the spring, k is the spring constant and x is the displacement of the spring. Equation 2: F = mg
 1 Introduction Relationship between Spring Constant and Length of Bungee Cord In this experiment, we aimed to model the behavior of the bungee cord that will be used in the Bungee Challenge. Specifically,
7.4 Temperature, Salinity and Currents in Jamaica Bay
 7.4 Temperature, Salinity and Currents in Jamaica Bay Arnold Gordon, Bruce Huber and Robert Houghton 7.4.1 INTRODUCTION Jamaica Bay stratification is weakly indicative of a shallow, tidally active environment,
The impact of ocean bottom morphology on the modelling of long gravity waves from tides and tsunami to climate
 The impact of ocean bottom morphology on the modelling of long gravity waves from tides and tsunami to climate Christian Le Provost and Florent Lyard Laboratoire d Etudes en Géophysique et Océanographie
Optimizing Sound Speed Profiling to Meet TPU Requirements using a CAST Gauge
 Optimizing Sound Speed Profiling to Meet TPU Requirements using a CAST Gauge (Computer Aided Sound speed Technology) Derrick R. Peyton, Steven Smyth, Arnold Furlong ODIM Brooke Ocean Jonathan Beaudoin
Pool Plunge: Linear Relationship between Depth and Pressure
 Activity 3 Pool Plunge: Linear Relationship between Depth and Pressure If you dive to the bottom of a swimming pool you will feel an increasing pressure on your eardrums as you descend. The deeper you
General Accreditation Guidance. User checks and maintenance of laboratory balances
 General Accreditation Guidance User checks and maintenance of laboratory balances January 2018 Copyright National Association of Testing Authorities, Australia 2010 All intellectual property rights in
Announcements. Lecture 19: Inference for SLR & Transformations. Online quiz 7 - commonly missed questions
 Announcements Announcements Lecture 19: Inference for SLR & Statistics 101 Mine Çetinkaya-Rundel April 3, 2012 HW 7 due Thursday. Correlation guessing game - ends on April 12 at noon. Winner will be announced
APPLICATION OF SOUND PROPAGATION (IN THE PERSIAN GULF AND OMAN SEA)
") APPLICATION OF SOUND PROPAGATION (IN THE PERSIAN GULF AND OMAN SEA) Seyed Majid Mosaddad Department of Physics, Shoushtar Branch, Islamic Azad University, Shoushtar, Iran Email: mosaddad5@gmail.com Abstract
APPLICATION OF SOUND PROPAGATION (IN THE PERSIAN GULF AND OMAN SEA) Seyed Majid Mosaddad Department of Physics, Shoushtar Branch, Islamic Azad University, Shoushtar, Iran Email: mosaddad5@gmail.com Abstract
Characterizing The Surf Zone With Ambient Noise Measurements
 Characterizing The Surf Zone With Ambient Noise Measurements LONG-TERM GOAL Grant Deane Marine Physical Laboratory Scripps Institution of Oceanography La Jolla, CA 93093-0213 phone: (619) 534-0536 fax:
Kathleen Dohan. Wind-Driven Surface Currents. Earth and Space Research, Seattle, WA
 Updates to OSCAR and challenges with capturing the wind-driven currents. Wind-Driven Surface Currents Kathleen Dohan Earth and Space Research, Seattle, WA ENSO OSCAR Surface currents from satellite fields
An experimental study of internal wave generation through evanescent regions
 An experimental study of internal wave generation through evanescent regions Allison Lee, Julie Crockett Department of Mechanical Engineering Brigham Young University Abstract Internal waves are a complex
IX. Upper Ocean Circulation
 IX. Upper Ocean Circulation World Ocean Covers 71% of Earth s surface Contains 97% of surface water Arctic Ocean NH: 61% ocean, 39% land Pacific Ocean Atlantic Ocean Southern Ocean Indian Ocean SH: 81%
Acoustic Techniques to Monitor and Troubleshoot Gas-lift Wells
 37 th Gas-Lift Workshop Houston, Texas, USA February 3 7, 2014 Acoustic Techniques to Monitor and Troubleshoot Gas-lift Wells Carrie-Anne Taylor, Engineer Lynn Rowlan, Engineer Echometer Company Feb. 3-7,
A tennis player hits a ball at a height of 2.4 m. The ball has an initial horizontal velocity.
 1991 Q31 A tennis player hits a ball at a height of 2.4 m. The ball has an initial horizontal velocity. The ball just passes over the net which is 0.6 m high and 6 m away from her. (Neglect air friction.)
An Observational and Modeling Study to Quantify the Space/Time Scales of Inner Shelf Ocean Variability and the Potential Impacts on Acoustics
 DISTRIBUTION STATEMENT A. Approved for public release; distribution is unlimited. An Observational and Modeling Study to Quantify the Space/Time Scales of Inner Shelf Ocean Variability and the Potential
Product Technical Bulletin #48
 AN INTEGRATED SOLUTIONS PROVIDER Product Technical Bulletin #48 Current-Carrying Capacity of R-Series Connectors AirBorn Proprietary Page 1 AN INTEGRATED SOLUTIONS PROVIDER R-Series Current-Carrying Capacity