Beach Sand Nourishment Scoping Study
|
|
|
- Beverly Simmons
- 6 years ago
- Views:
Transcription


1 Prepared for Sydney Coastal Councils Group Inc. 18 February 2010 Beach Sand Nourishment Scoping Study Maintaining Sydney s Beach Amenity Against Climate Change Sea Level Rise

2
3 Beach Sand Nourishment Scoping Study - Maintaining Sydney's Beach Amenity Against Climate Change Sea Level Rise Beach Sand Nourishment Scoping Study Maintaining Sydney's Beach Amenity Against Climate Change Sea Level Rise Prepared for Sydney Coastal Councils Group Inc. Prepared by Australia Pty Ltd Level 11, 44 Market Street, Sydney NSW 2000, PO Box Q410, QVB Post Office NSW 1230, Australia T F ABN February Australia Pty Ltd 2010 The information contained in this document produced by Australia Pty Ltd is solely for the use of the Client identified on the cover sheet for the purpose for which it has been prepared and Australia Pty Ltd undertakes no duty to or accepts any responsibility to any third party who may rely upon this document. All rights reserved. No section or element of this document may be removed from this document, reproduced, electronically stored or transmitted in any form without the written permission of Australia Pty Ltd. Revision C - 18 February
4 Beach Sand Nourishment Scoping Study - Maintaining Sydney's Beach Amenity Against Climate Change Sea Level Rise Quality Information Document Beach Sand Nourishment Scoping Study Ref Date 18 February 2010 Prepared by Reviewed by James Walker, Thomas Pinzone, Jasvinder Opkar, Leonid Bronfentrinker, Craig Niles, Deborah Bowden, Lindsay Shepherd, Alan Jones (Australian Museum Business Services), Theresa Dye (Cardno Ecology Lab) Lex Nielsen Revision History Revision Revision Date Details Authorised Name/Position Signature A 06/10/2009 Draft Peter Fountain Industry Director - Maritime B 09/12/2009 Final Draft Peter Fountain Industry Director - Maritime C 18/02/2010 Final Peter Fountain Industry Director - Maritime Revision C - 18 February
5 Beach Sand Nourishment Scoping Study - Maintaining Sydney's Beach Amenity Against Climate Change Sea Level Rise Table of Contents Executive Summary i 1.0 Introduction Threatened Assets and Amenity Scope of Project Project Background Climate Change and Sea-Level Rise Geological and Recent Historical Perspective of Sea-level rise Geological Recent Historical Sea-Level Rise Projections Other Climate Change Influences on Coastal Processes Beach Nourishment as a Coastal Management Strategy Relevant International Projects - A Brief Overview The European Experience The USA Historical and Present Applications in Australia Southern Gold Coast and Tweed River Bypass Northern Gold Coast Beaches Townsville Port Stephens Bate Bay Other Projects Discussion Beach Nourishment Volumes Bruun Rule Required Native Sand Volumes Offshore Sand Bodies Suitability as a Nourishment Source Typical Native Sand Properties Potential Sand Sources Most Suitable Borrow Sites A Practical Sand Nourishment Campaign Sand Extraction The Metromix Marine Aggregate Proposal Operating Constraints Weather Water Depths Operating Times Sailing Distances Extraction Methodology Types of Dredgers Recommended Dredging Method Physical Impacts Generalised Physical Constraints for the Design of Extraction Configurations Potential Impacts of the Metromix Marine Aggregate Proposal Wave Climate Tidal Currents Coastline Inner Shelf Ecological Impacts Potential Impacts of the Metromix Marine Aggregate Proposal Relevant International Projects Social Impacts Literature Review Nourishment Technique 45 Revision C - 18 February
6 Beach Sand Nourishment Scoping Study - Maintaining Sydney's Beach Amenity Against Climate Change Sea Level Rise 6.1 Operating Constraints Beach Closure Weather Water Depth Sand Placement Methods Offshore Placement Onshore Placement Beach Scraping Environmental Impacts Inter-tidal Habitat Subaqueous Near-Shore Habitat Social Impacts Media Review Targeted Stakeholder Workshop Users of the Coastal Zone Recommended Nourishment Technique Nourishment Costs Case Study 1: Collaroy-Narrabeen Beach Physical Do Nothing Scenario Nourishment Requirements Environmental Do Nothing Scenario Nourishment Impacts Social Do Nothing Scenario Nourishment Economic Costs Benefits Cost-Benefit Analysis Results Sensitivity Analysis Summary of Economic Viability Case Study 2: Manly Ocean Beach Physical Do Nothing Scenario Nourishment Requirements Environmental Do Nothing Scenario Nourishment Impacts Social Do Nothing Scenario Nourishment Economic Costs Benefits Cost-Benefit Analysis Results Sensitivity Analysis Summary of Economic Viability Case Study 3: Bate Bay Physical Do Nothing Scenario Nourishment Requirements Environmental Do Nothing Scenario Nourishment Impacts Social Do Nothing Scenario 83 Revision C - 18 February
7 Beach Sand Nourishment Scoping Study - Maintaining Sydney's Beach Amenity Against Climate Change Sea Level Rise Nourishment Economic Costs Benefits Cost-Benefit Analysis Results Sensitivity Analysis Summary of Economic Viability Sand Extraction and Nourishment Approval Process Project Details Key Legislation Background Approvals process overview State Government policy in respect of offshore sand extraction for beach nourishment Approvals Strategy Approvals Process Approval Process Summary Feasibility Critical success factors Environment Impact Assessment Requirements Director General Requirements under Part 3A Agency Consultation Agency Responses Formal Environmental Assessment Requirements Community and Stakeholder Consultation Required Studies and Data for Feasibility Phase and Part 3A Approval Process Additional Studies and Data Community and Consultation Plan A Framework Key Stakeholder Engagement Strategy Establish a Project Control Group (PCG) Stakeholder Working Group (SWG) Community Reference Group Other stakeholder engagement Community Education and Consultation Information and Education Communication and Media Community Consultation Application of Communication and Consultation Business Case Outline NSW Gateway Review Process Summary of Cost Benefit for each of the Beach Case Studies Case 1: Collaroy-Narrabeen Beach Case 2: Manly Beach Case 3: Bate Bay Financing Mechanisms USA Europe Application to Sydney Beaches Conclusions References 111 Appendix A How Beach Nourishment Projects Work Appendix B Native Sand Volume Calculations Appendix C Offshore Mineral Titles Revision C - 18 February
8 Beach Sand Nourishment Scoping Study - Maintaining Sydney's Beach Amenity Against Climate Change Sea Level Rise Appendix D Offshore Extraction - Coastal Processes Impacts Appendix E Offshore Extraction - Ecological Impacts Appendix F Nourishment - Ecological Impacts Appendix G Social Stakeholder Workshop Appendix H Economic Evaluation Appendix I Planning Approvals Process Appendix J EA Communications Revision C - 18 February
9 Executive Summary
10
11 Beach Sand Nourishment Scoping Study - Maintaining Sydney's Beach Amenity Against Climate Change Sea Level Rise Executive Summary Shoreline erosion issues are not unique to Sydney or the NSW coastline and it has long been held that beach nourishment is, in many cases, the best long-term management strategy. If sufficient sand deposits are available for nourishment works, hazards associated with storm events and sea-level rise can be alleviated. The primary purpose of this scoping study was to develop the outline of a sand nourishment programme utilising suitable offshore sand deposits for amenity enhancement and to ameliorate increased hazard risk from sea-level rise. A key environmental driver for the study was the projected climate change sea-level rise. Generally, sea-level rise causes beach erosion and recession which could result in permanent loss of beach amenity. The scoping study identified potential benefits and impacts of a nourishment programme associated with physical, environmental, social and economic issues. It also drew comparisons with the do nothing approach. While the study scoped a nourishment programme for the whole of Sydney that is closely aligned to nourishment of all NSW ocean beaches, it case studied three (3) Sydney beaches in more detail. The nominated beaches were Collaroy-Narrabeen, Manly and Bate Bay. The environmental, economic and social evaluations of the nourishment campaign demonstrated substantial positive benefits associated with the project. Some potential adverse ecological impacts may be caused by the nourishment programme with the smothering of aqueous benthic communities. These are likely to be less severe than the ecological impacts associated with a do nothing approach and the subsequent loss of the inter-tidal beach, resulting in a total loss of the beach ecosystem. Environmental monitoring programmes would need to be developed to measure and, if required, respond to ecological impacts. Nourishment campaigns are scheduled at intervals of approximately 10 years, with the first nourishment campaign estimated to cost $300M at a unit rate of approximately $25/m 3 of sand. The second and subsequent nourishment campaigns are estimated to cost $120M at a unit rate of $30/m 3 of sand. Beach Nourishment Past and Present Climate Change Sea-Level Rise Considerations The volume of sand required on the beaches to maintain the existing amenity in response to climate change sealevel rise is dependent on the amount of sea-level rise, with the economic assessment next dependent upon the rate of sea-level rise. In this study an upper-bound estimate of sea-level rise of 0.1m/10yrs has been adopted. From a cost/benefit perspective and nourishment campaign frequency approach this is the most conservative assessment. Adopting a lower rate of sea-level rise will result in a more favourable cost/benefit outcome. The volume of sand required to accommodate sea-level rise is small compared with that required to protect existing infrastructure along Sydney s foreshore. For example, at Manly Beach the volume of native sand required to accommodate a 0.1m sea-level rise is approximately 170,000m 3, but the volume of native sand required to protect the sea wall against storm damage is 2Mm 3 (WRL 2003). The main objective of the sand nourishment campaign is to maintain beach amenity in response to sea-level rise and not specifically to address present risk to infrastructure. Sea level has risen and beaches have been eroding for decades. Between 1870 and 2004 the mean global sea level has risen by almost 0.2m. The approach for the first 10-year sand nourishment campaign would be to accommodate both a past sea-level rise of 0.2m and a future sea-level rise of 0.1m. This would reinstate and maintain beach amenity and provide some storm protection buffer. Subsequent sand nourishment campaigns are scheduled to occur at sea-level rise increments of 0.1m (i.e. each 10 years). The entire campaign considers a 50 year planning period from a cost/benefit perspective, although sea-level rise will extend beyond this planning period. Offshore Sand Sources and Availability Potential offshore sand sources have been identified at Providential Head, Cape Banks, the Central Coast and offshore of the rocky cliffs at Bondi and Malabar. Cape Banks sand reserves are the most compatible with the native sand gradings on the beaches. The Providential Head, Cape Banks and Central Coast sand bodies are subject to exploration licenses and mining lease applications. No license or lease arrangements exist for the Bondi and Malabar offshore sand bodies. There is currently a prohibition on offshore minerals extraction due to the effect of the Offshore Minerals Act 1999 (NSW). It would require an amendment to Schedule 2 of the Offshore Minerals Act 1999 and the introduction of companion regulations to enable a mining licence to be issued over an area of sand within the State Government Revision C - 18 February 2010 i
12 Beach Sand Nourishment Scoping Study - Maintaining Sydney's Beach Amenity Against Climate Change Sea Level Rise 3Nm limit to enable sand to be recovered for beach nourishment purposes. Changes of this nature would require considerable discussions with Government at the highest levels. Sand Nourishment Volumes Based on a 0.3m sea-level rise increment, 9Mm 3 of native sand would be required to maintain the recreational amenity of all of Sydney s ocean beaches. This is equivalent to an average native sand volume of 300m 3 /m length of beach. Ideally, nourishment sands should have a similar size grading, shell content and colour to the native sands. Using the most suitable identified sand borrow source at Cape Banks (slightly smaller grain size), 12Mm 3 of borrow sand would be required. This is equivalent to an average borrow sand volume of 400m 3 /m length of beach. Subsequent nourishment campaigns (each 10 years) would require 3Mm 3 of native sand or 4Mm 3 of borrow sand that is of similar characteristics to Cape Banks sand. All costs quoted in this study are determined using Cape Banks as the borrow source. It is noted that the estimated volume of available sand at Cape Banks is approximately 10Mm 3 (based on a sand extraction depth of 5m) although reserves may be considerably greater. This will be close to being sufficient for the first nourishment campaign, but alternative borrow material will need to be sourced for subsequent nourishment campaigns. The extraction and delivery of 12Mm 3 of sand is likely to extend over a duration of 12 to 18 months. Sand Extraction Based on the high wave energy operating environment and the sand extraction water depth limitations of the dredging plant, the Trailer Suction Hopper Dredge is the most suitable dredging equipment for this project. Many sand extraction projects around the world utilise this equipment, particularly if the sand placement area is some distance away from the extraction area. The Trailer Suction Hopper Dredge skimming technique is considered to be more environmentally friendly than other techniques, such as a Cutter Suction Dredge, because plume generation is minimised. Physical Impacts Within specified constraints it was considered that it would be possible to undertake any extraction configuration within extraction areas without any measureable impact on the shorelines. Without these constraints extraction of sand offshore may affect the coastline in the following ways: If too close to the shore it may create a depression such that beach sediment is transported offshore (known as drawdown) into the extracted area. An offshore bank may protect the coastline, scattering or absorbing some of the wave energy, and the removal of such a barrier may result in beach erosion. The locally increased depths may alter the angle of incidence of waves and distribution of wave energy approaching the adjacent beaches, thereby resulting in erosion and accretion. The removal of offshore sediment may deprive the coast of a natural source of sediment. The coastal engineering criteria established for the design of the proposed extraction configurations, in conjunction with criteria from other specialised studies, led to the following generalised constraints: The near-shore depth limit for extraction off the rocky cliffed coast be the 25m isobath. The alongshore extent of extraction to the 25m isobath be beyond 1.5km of the end of a beach. The inshore limit of extraction directly off beaches be the 35m isobath. Extraction depth be limited to 5m below the natural surface. Allowance be made for initial batter slopes around the extraction configurations to develop to 1:20. Adequate buffers be left around shipwrecks and reefs. Ecological Impacts The following categories of potential ecological impacts associated with the sand extraction were identified: Effects on benthic macrofauna and demersal fish due to the removal of sand from the seabed. Effects on marine habitats, primary producers, benthic organisms, nektonic organisms, marine mammals and seabirds resulting from the release of fines with the excess water. Revision C - 18 February 2010 ii
13 Beach Sand Nourishment Scoping Study - Maintaining Sydney's Beach Amenity Against Climate Change Sea Level Rise Effects on the marine environment due to operation of, or accidents involving, the extraction vessel. Conflicts with users of other marine resources. The impacts on benthic invertebrates would be significant, but highly localised and short-term, persisting until recolonisation occurred. Longer-term or wider scale impacts are not expected. Mobile species, such as whales, fish and prawns, and large bivalves may be able to avoid the dredger extraction head by swimming away or burrowing, respectively. Some of the organisms extracted would be released back into the sea with the excess dredging water, however, not all would survive, because of the change in water pressure, abrasion against the sand, impact with the screens, deposition into unsuitable habitat or consumption by predators such as fish. Other organisms would be relocated to the nourishment zone with the sand. The removal of organisms would change the structure of benthic assemblages, affect their ability to recover from natural disturbances, resulting in a net loss of benthic productivity. Sand Placement From an engineering and economic perspective, beach nourishment utilising offshore placement (profile nourishment) is the simplest, natural and most cost effective solution. Environmental impacts are likely to be kept to a minimum using this method, with the volumes of nourishment sand placed offshore being of the same order of magnitude as the storm demand (sand moved offshore) for a severe storm. An offshore nourishment programme would not require closure of the beach and, therefore, most social and business activities would continue without disruption. Two options were considered feasible, both with similar cost structures. The preferred placement methods are: Method 1 A Trailer Suction Hopper Dredge would be used to extract the sand from the designated offshore sand body and then sail under its own power to the nourishment site. The Trailer Suction Hopper Dredge has a large draft (>10m) and the sand would be transferred via pipeline to a spreader pontoon at the deposition site (-5m AHD to -10m AHD) and then placed on the seabed. Method 2 The second method involves double handling of the extracted sand. A Trailer Suction Hopper Dredge would be used to extract the sand from the designated offshore sand body and then sail under its own power to offshore of the nourishment site. The sand would be discharged to the seabed in approximately 20m water depth (temporary storage site). A smaller Trailer Suction Hopper Dredge would load the sand from the temporary storage site and then sail close to the shoreline and place the sand within the nourishment zone (-5m AHD to -10m AHD). Ecological Impacts It is likely that the largest ecological effects of nourishment will occur in the near-shore environment where the spoil would be deposited. Given that inter-tidal species a) live within the sand, b) can probably survive some degree of burial and c) are adapted to sediment disturbance by waves, any nourishment effects on the inter-tidal biota are likely to be negligible if sand gradually accretes to the beach face via wave action. Social Considerations Compared with international case studies there are relatively few examples of near-shore and offshore exploration and mining within Australia. Following the release of a map indicating Australia has a wealth of offshore minerals, CSIRO has undertaken limited research on the social acceptance of seafloor exploration and mining for commercial purposes. However, little to no research has been conducted to investigate the social acceptance of sand extraction for beach nourishment purposes in the Australian context. As part of this study a review of media and literature was undertaken and a targeted stakeholder workshop convened to gain an understanding of the social acceptance of sand extraction and beach nourishment within NSW. Based on the media review, the public appear to be generally aware of the effects of climate change and the impact this will have on the coastlines, including sea-level rise. Although there appears to be a distinct lack of factual information available about sand extraction and beach nourishment it is felt that the public would be more accepting of sand extraction for beach nourishment purposes than for commercial reasons. This acceptance will only be achieved through implementation of a carefully planned Consultation and Communication Strategy. Revision C - 18 February 2010 iii
14 Beach Sand Nourishment Scoping Study - Maintaining Sydney's Beach Amenity Against Climate Change Sea Level Rise Cost - Benefit For each of the three case studies, a nourishment programme is economically viable. The main economic benefits of the beach nourishment programme to be valued are associated with the avoidance of flow-on effects from loss of beach amenity to beach visitors, local residents and businesses and government revenues. In the case of Collaroy-Narrabeen this also includes the potential loss of property. Much of the information required for the economic assessment is being collected in the Sydney Beaches Valuation Project being conducted at the UNSW for the SCCG ( Pending the completion of the UNSW study, has undertaken a high-level benefit valuation using data from secondary sources on key parameters of expenditure including coastal goods and services, and on indicators of other attributes of beach amenity where the market does not provide a satisfactory measure of economic value. Case Study Collaroy-Narrabeen Beach For Collaroy-Narrabeen Beach the cost-benefit analysis demonstrated that the proposed beach nourishment programme is economically viable it produced a net present value of $42M, a benefit-cost ratio of 1.6 and an economic internal rate of return of 12%. The high economic rate of return for Collaroy-Narrabeen Beach is due to the intensely developed shoreline. The value of the benefit-cost ratio indicates that, on the basis of the quantified benefits, the programme is expected to provide medium value for money. The main quantified benefits are the avoided loss of: Residential property values attributable to beach amenity (45% of total quantified benefits). Value of residential properties located within hazard lines (38%). Expenditure by beach visitors (8%). Rates revenue from residential property values within walking distance of the beach as a result of lower property values (4%). The sensitivity analysis showed that the economic viability is reasonably robust. However, the programme is not economically viable in the most extreme sensitivity test (where project benefits are reduced by 30% and project costs are increased by 30%). Adopting a lower discount rate (4% instead of 7%), as is increasingly the overseas practice in economic appraisal of social and environmental projects with long-term benefits, increases the benefit-cost from 1.6 to 2.2. The economic results are also sensitive to the shape of the relationship between beach width and the loss of economic value from the flow-on effects of reduced beach amenity. Use of an exponential rather than a linear relationship increases the benefit-cost ratio from 1.6 to 2.5. Case Study Manly Beach The cost-benefit analysis undertaken for Manly Beach also demonstrated that the proposed beach nourishment programme is economically viable it produced a net present value of $48M, a benefit-cost ratio of 2.4 and an economic internal rate of return of 20%. The high economic rate of return for Manly Beach is due to its iconic status and importance to regional tourism. The value of the benefit-cost ratio indicates that, on the basis of the quantified benefits, the programme is expected to provide high value for money. The main quantified benefits are the avoided loss of: Residential property values attributable to beach amenity (49% of total quantified benefits). Expenditure by beach visitors (23%). Rates revenue from businesses in the Manly Business District as a result of lower property values (13%). Non-traded value (consumer surplus) associated with beach visits (9%). The sensitivity analysis confirmed the robustness of the economic results, with the programme being economically viable in all sensitivity tests undertaken. Adopting the lower discount rate of 4% increases the benefit-cost ratio from 2.4 to 3.3. Revision C - 18 February 2010 iv
15 Beach Sand Nourishment Scoping Study - Maintaining Sydney's Beach Amenity Against Climate Change Sea Level Rise Case Study Bate Bay For Bate Bay the cost-benefit analysis demonstrated that the proposed beach nourishment programme is economically viable it produced a net present value of $13M, a benefit-cost ratio of 1.2 and an economic internal rate of return of 8%. However, the value of the benefit-cost ratio indicates that, on the basis of the quantified benefits, the programme is expected to provide low value for money. The whole of Bate Bay may not require nourishment because a considerable extent of the shoreline contains a natural dune system. Therefore a smaller sand nourishment volume for Bate Bay will generate a higher economic return. The main quantified benefits are the avoided loss of: Residential property values attributable to beach amenity (73% of total quantified benefits). Expenditure by beach visitors (13%). Rates revenue from residential property values within walking distance of the beach as a result of lower property values (5%). Non-traded value (consumer surplus) associated with beach visits (5%). The sensitivity analysis showed that the economic viability is not robust, with the programme not being viable in most of the sensitivity tests. However, adopting the lower discount rate of 4% increases the benefit-cost from 1.2 to 1.6. The economic results are also sensitive to the shape of the relationship between beach width and the loss of economic value from the flow-on effects of reduced beach amenity. Use of an exponential rather than a linear relationship increases the benefit-cost ratio from 1.2 to 1.8. Business Case Outline As a result of the positive cost-benefit assessment and the favourable environmental and social outcomes, the preparation of the Strategic Gateway Review will be the first gate in the establishment of a business case to NSW Treasury to seek funding to progress the programme. The NSW Gateway System is a process applied by the NSW Treasury to examine a project at critical stages of its lifecycle. There are six defined gates at which reviews are undertaken. The first gate is the Strategic Gateway Review, which requires the presentation of a preliminary business case to: Support the strategic assessment of the need for the proposed intervention and its priority and timing. Identify any realistic options for the intervention. Outline the high-level costs and benefits, risks and sustainability issues relevant to each option. Identify any relevant technical standards or legislative requirements associated with the proposal and the options. Outline the governance arrangements (key elements, milestones and risks) planned to take the intervention proposal through to the next stage of the Gateway System, the final business case. Way Forward The NSW Government has adopted a position prohibiting the commercial extraction of offshore marine sands. It is the intent of the SCCG that this study will provide a rational basis to inform both the member councils and the NSW Government of the pros and cons of utilising offshore marine sand sources to facilitate immediate and longer term demands for nourishment purposes in the Greater Metropolitan Region. The preparation of the Strategic Gateway Review is the first step in the establishment of a business case to the NSW Treasury to seek funding to progress the programme. Revision C - 18 February 2010 v
16
17 Chapter 1 Introduction
18
19 Beach Sand Nourishment Scoping Study - Maintaining Sydney's Beach Amenity Against Climate Change Sea Level Rise 1.0 Introduction The Australian coastline extends for a distance of over 34,000km (AGO 2006) with approximately 85% of the population living within 50km of its shores (ABS 2001). The New South Wales (NSW) coastline is a relatively small section (almost 2,000km), but is the most highly urbanised of all Australian coastal regions with over 520km (>26%) of developed foreshore (AGO 2006). Sydney Harbour and the coastal beaches of the greater metropolitan region are iconic features and are some of the city s foremost attractions to visitors from all parts of the globe. The beaches are also a major recreational destination used throughout the year by local residents and form an integral component of the Australian culture. Swimming, surfing and surf life saving carnivals are a common feature on the Sydney summer calendar together with less formal social gatherings of families and friends. Beaches are dynamic physical entities that readily respond to climatic influences. At many Sydney locations infrastructure has been developed close to the shoreline to service the needs of both the private and public sectors. Residential housing has also urbanised the shoreline of many beachside locales. Chapter Summary The primary purpose of this scoping study is to develop the outline of a sand nourishment programme utilising suitable offshore sand deposits for amenity enhancement and to ameliorate increased hazard risk from sea-level rise. The study scopes a nourishment programme for the whole of Sydney that is closely aligned to nourishment of all NSW ocean beaches. It case studies three (3) Sydney beaches in detail: Collaroy-Narrabeen, Manly and Bate Bay. From a broad engineering and logistical perspective the study addresses: 1) The location and suitability of sand nourishment sources. 2) The methods of sand extraction and transport to site. 3) The methods of sand nourishment, including volumes and frequency. Environmental and planning considerations include: 4) The potential environmental impacts of an offshore sand extraction process. 5) The potential environmental impacts of a near-shore sand nourishment campaign. 6) Future environmental studies required to develop an EIS. 7) The planning and approval process for a sand nourishment programme Social values are addressed with respect to: 8) Who will be impacted by loss of beach amenity and assets? 9) How will they be impacted (culture, recreation, leisure etc)? 10) What is the intangible cost to the community? The economic appraisal aims to: 11) Evaluate the costs and benefits of a nourishment programme based on engineering, environmental and social considerations. 12) Develop a business plan outline that may fund a future nourishment campaign. 1.1 Threatened Assets and Amenity Along the Sydney foreshore, beach management and planning issues arise due to the encroachment of infrastructure into the coastal buffer zone. The encroachments can reduce the available supply of sand for the beach system to respond naturally to seasonal and storm variability. During short episodic coastal storm events, shoreline erosion frequently threatens the stability of seawalls, promenade infrastructure, recreational facilities, car parks and housing (Figure 1.1). Revision C - 18 February
 Evidence of oceanic storm damage to assets and infrastructure along the Sydney foreshore is available in numerous")

 at the same location (Figure 1.2). Figure 1.")

20 Beach Sand Nourishment Scoping Study - Maintaining Sydney's Beach Amenity Against Climate Change Sea Level Rise Figure 1.1 Manly Beach - North Steyne Surf Club (left image 1950, right image 1980 s) Evidence of oceanic storm damage to assets and infrastructure along the Sydney foreshore is available in numerous historical photographs and newspaper reports. The most recent large storm events occurred in 1969, 1974 (~100 year storm) and 1978 and caused extensive damage along the NSW coastline. The sea-state since 1978, during the last 30 years, has been relatively benign. Oceanic storm damage to assets constructed in the coastal zone is not unique to Sydney; it is a problem that exists worldwide. Generally, in the past, infrastructure that is damaged or destroyed during one storm event is often rebuilt (bigger and stronger) at the same location (Figure 1.2). Figure 1.2 Collaroy-Narrabeen Beach (left image 1920, right image 1999) Community and business expectations pertaining to development in the coastal zone can be complex and, ultimately, is a balance between environmental, social and economic considerations. There is an expectation that assets and amenity should be able to remain where they are and will be protected by all levels of government. In some cases the protection of property has been achieved by the construction of seawalls (Figure 1.3). In other instances (Collaroy-Narrabeen Beach) the proposal to construct a seawall along the fore dune to protect private property has been met with strong community opposition. Concerns include the perceived loss of beach amenity due to construction of a seawall (including the environmental consequences) and the proposed funding model (i.e. who pays?). Revision C - 18 February
 Longer term loss of beach amenity is also evident along the Sydney foreshore.")
.")
, recent CSIRO modelling (McInnes et al.")
 sea level along the NSW coast may rise by up to 0.9m by 2100. Figure 1.")
21 Beach Sand Nourishment Scoping Study - Maintaining Sydney's Beach Amenity Against Climate Change Sea Level Rise Figure 1.3 Cronulla (left image 1974, right image late 1980 s) Longer term loss of beach amenity is also evident along the Sydney foreshore. In some cases the loss is due to historical town planning permitting development to the waterline. In other instances loss of sand has occurred along a beach during a storm event and has not recovered to its former state (Figure 1.4). Gordon (1987) estimated long term recession for many NSW beaches as between 0.2 and 0.5m/yr, and has attributed much of this to past sea-level rise. Sea-level rise also threatens local beach amenity. Based on projections by the Intergovernmental Panel on Climate Change (IPCC 2007), recent CSIRO modelling (McInnes et al. 2007) of localised sea-level rise along the NSW coast, the NSW Sea Level Rise Policy Statement (NSW 2009) and Department of Environment and Climate Change NSW (DECC, Watson 2008, pers. comm. 29 August) sea level along the NSW coast may rise by up to 0.9m by Figure 1.4 Fairy Bower (left image1924 [State Library], right image 2005 [courtesy James Carley, WRL]) Sea-level rise will generally result in a migration of the shoreline landward, further threatening existing vulnerable infrastructure and impacting on infrastructure that was previously outside the coastal hazard zone. A migration of the shoreline landward could result in the permanent loss of beach amenity. Besides the obvious economic and social impacts relating to increases in coastal hazards, such as storm damage to housing and utilities, the loss of beach amenity will have a devastating impact on both the local community culture and the national tourism based economy. Many NSW coastal communities are impacted by tidal inundation during Spring Tides. Sea-level rise will also result in more frequent tidal inundation of low lying coastal regions. 1.2 Scope of Project Shoreline erosion issues are not unique to Sydney or the NSW coastline and it has long been held that beach nourishment is, in many cases, the best long-term management strategy. If sufficient sand deposits are available for nourishment works, hazards associated with storm events and sea-level rise can be alleviated. The primary purpose of this scoping study is to develop the outline of a sand nourishment programme utilising suitable Revision C - 18 February
22 Beach Sand Nourishment Scoping Study - Maintaining Sydney's Beach Amenity Against Climate Change Sea Level Rise offshore sand deposits for amenity enhancement and to ameliorate increased hazard risk from sea-level rise. A key environmental driver for the study is the projected climate change sea-level rise. The scoping study will identify potential benefits and impacts of a nourishment programme associated with physical, environmental, social and economic issues. It will also draw comparisons with the do nothing approach. While the study will scope a nourishment programme for the whole of Sydney that will be closely aligned to nourishment of all NSW ocean beaches, it will case study three (3) Sydney beaches in detail. The nominated beaches are Collaroy-Narrabeen, Manly and Bate Bay (Figure 1.5). Each of the beach systems is unique and they present very different risk management criteria that need to be considered. For example, Collaroy-Narrabeen is suburban and is fronted by residential development whereas Manly is an iconic tourist destination fronted by promenades and public spaces. Bate Bay is the only one of Sydney s beaches directly accessible by train and attracts visitors from across the community. Each of the three beaches is described in more detail in subsequent Chapters. The nourishment campaign encompasses 31 Sydney ocean beaches extending from Forresters Beach (north of Sydney) to Cronulla Beach (south of Sydney). From a broad engineering and logistical perspective the study will address: 1) The location and suitability of sand nourishment sources. 2) The methods of sand extraction and transport to site. 3) The methods of sand nourishment, including volumes and frequency. Environmental and planning considerations will include: 4) The potential environmental impacts of an offshore sand extraction process. 5) The potential environmental impacts of a near-shore sand nourishment campaign. 6) Future environmental studies required to develop an EIS. 7) The planning and approval process for a sand nourishment programme. Social values will be addressed with respect to: 8) Who will be impacted by loss of beach amenity and assets? 9) How will they be impacted (culture, recreation, leisure etc)? 10) What is the intangible cost to the community? The economic appraisal will: 11) Evaluate the costs and benefits of a nourishment programme based on engineering, environmental and social considerations. 12) Develop a business plan outline that may fund a future nourishment campaign. Revision C - 18 February
23 Beach Sand Nourishment Scoping Study - Maintaining Sydney's Beach Amenity Against Climate Change Sea Level Rise Figure 1.5 Study region and case study beaches 1.3 Project Background For each of the three case study beaches, hazard definition studies have been completed. These studies identify the immediate and longer term hazard present at each location. Assets valued at close to $1BN are estimated to be at threat in these three locations over a 100 year planning horizon. Coastline Management Plans in each of the three case study sites have assessed various options for management of coastal hazards and concluded with a strategic approach for management of coastal erosion hazards. The approach recommended to protect property from immediate storm damage and coastline recession in the medium to long-term, is primarily the use of sand nourishment campaigns to provide a buffer to offset the immediate storm erosion demand and to restore/enhance degraded recreational beach amenities. There are no apparent feasible terrestrial sources of suitable sand that could adequately facilitate the endorsed management strategies. The only potential sand source identified for the long-term supply of nourishment material is offshore contained in the Inner Sydney Shelf Sand Body (Roy 2001). In early 2007 the Sydney Coastal Councils Group Inc (SCCG) in partnership with its Beach Management Working Group 1 (Project Steering Committee) applied for funding support under the Natural Disaster Mitigation Programme to undertake this scoping study. In 2008 the SCCG signed a funding agreement with the NSW State Emergency Management Committee enabling the SCCG to engage a consultant to undertake a scoping study to look at the information and data currently available in relation to the environmental, physical, social and economic aspects of utilising available offshore sands to meet immediate and medium term requirements of the adopted strategies for these beach environments. was appointed in March 2009 to undertake the study. 1 SCCG Beach Management Working Group includes delegates from the SCCG Secretariat; member council professional staff, State agency technical staff, academia and peak coastal community groups. Revision C - 18 February
24
25 Chapter 2 Climate Change and Sea-Level Rise
26
27 Beach Sand Nourishment Scoping Study - Maintaining Sydney's Beach Amenity Against Climate Change Sea Level Rise 2.0 Climate Change and Sea-Level Rise Climate change has been broadly defined by the Intergovernmental Panel on Climate Change (IPCC 2001; 2007) as any change in climate over time whether due to natural variability or as a result of human activity. This may be a natural variability of decadal oscillation or permanent trends that may result from such factors as changes in solar activity, long-period changes in the Earth's orbital elements (eccentricity, obliquity of the ecliptic, precession of equinoxes), or human induced factors such as increasing atmospheric concentrations of carbon dioxide and other greenhouse gases. In recent geological history, the Quaternary Period, the climate has been dominated by cycles of glaciations lasting approximately 100,000 years (IPCC 2007, p. 444). In more recent times, prior to industrialisation, the atmospheric concentration of CO 2 was relatively steady at approximately 280ppm (Petit et al. 1999). The present day concentration of CO 2 is approximately 380ppm and the increase in concentration of 80ppm over the last century is much more rapid than at any time in the past 650,000 years. Chapter Summary The volume of sand required on the beaches to maintain the existing amenity in response to climate change sealevel rise is dependent on the amount of sea-level rise, with the economic assessment next dependent upon the rate of sea-level rise. In this study an upper-bound estimate of sea-level rise of 0.1m/10yrs has been adopted. From a cost/benefit perspective and nourishment campaign frequency approach this is the most conservative assessment. Adopting a lower rate of sea-level rise will result in a more favourable cost/benefit outcome. 2.1 Geological and Recent Historical Perspective of Sea-level rise Geological Associated with climate change, whether natural or anthropogenic, are sea level variations. Eustatic global sealevel rise during warm interglacial periods is well documented and is due to thermal expansion of sea waters, the melting of terrestrial ice sheets, crustal rebound and the horizontal redistribution of water to maintain the ocean at gravitational equipotential (IPCC 2007, p. 457). Additionally, climate change may be associated with changes in other oceanic phenomena on a global scale including; sea surface temperature, acidity, salinity, ocean currents, biochemical concentrations and the frequency and intensity of storm events. Figure 2.1 Sea Level History - Last 140,000 years (CSIRO 2009) Due to the changing nature of the land mass of the Earth owing to tectonic forces, the actual eustatic global sea level is difficult to ascertain when looking beyond the Quaternary period. Information is available for eustatic sea Revision C - 18 February
. This period encompasses the most recent glacial-interglacial transition from the last glacial maximum at the end of the Pleistocene to the current Holocene.")
28 Beach Sand Nourishment Scoping Study - Maintaining Sydney's Beach Amenity Against Climate Change Sea Level Rise levels from coral carbon dating, ice-cores and model based research providing levels for the past 120,000 years (Figure 2.1). This period encompasses the most recent glacial-interglacial transition from the last glacial maximum at the end of the Pleistocene to the current Holocene. At the peak of the last warm interglacial period, approximately 120,000 years ago the eustatic mean sea level was 4 to 6m above the present mean sea level. During the last glacial maximum approximately 21,000 years ago, the global sea level was m below the present sea level (IPCC 2007, p. 409). Over the millennia that followed, a gradual increase in temperature led to thermal expansion of the world s oceans and melting of terrestrial ice sheets causing the sea level to rise. Coral and ice-core evidence suggests that between 2,000 and 3,000 years ago the sea level stabilised and did not change significantly till the late 19th Century (IPCC 2007 p. 409). The stabilisation of sea levels at this time is also supported by physical anthropogenic evidence such as bench marks carved into rocks in Tasmania and Roman fish tanks (Church & White 2006) Recent Historical Physical measurements of the sea level rely on two techniques; tide gauges and satellite altimetry. Reliable tide gauge data is available from the 1870 s and satellite data from Church and White (2006) analysed this data and found a global mean sea-level rise of 195mm from January 1870 to December 2004 (Figure 2.2). Additionally, Church and White (2006) detected an acceleration in the rate of sea-level rise of ± 0.006mm/yr 2, over this period, a result that had previously been hypothesized but never detected. Figure 2.2 Global Mean Sea-Level Rise 1870 to 2004 (Church and White 2006) Mitchell et al. (2000) summarised observed sea-level rise in Australia and the Pacific. Analysis of data from Fort Denison in Sydney showed that, between 1914 and 1997, the underlying trend in sea-level rise has been an average increase in relative sea level of 0.86mm/year (and 1.18mm/year in Newcastle). However, it was noted that there was considerable variation in the data, which was due to processes acting at inter-decadal scales, such as the El Niño Southern Oscillation (ENSO) phenomenon. It was noted further that the mean relative sea level in 1997 was lower than that measured in Part of this (25mm) was due to isostatic rebound inducing a rise of the land mass, which is occurring at a mean rate of 0.3mm/year. Mitchell et al. (2000) corrected sea-level changes at Fort Denison to an average increase of 1.16mm/year to account for this rate of post-glacial rebound. Revision C - 18 February
29 Beach Sand Nourishment Scoping Study - Maintaining Sydney's Beach Amenity Against Climate Change Sea Level Rise 2.2 Sea-Level Rise Projections The IPCC Fourth Assessment Report (2007 table 10.7) projections of global average sea-level rise range from 0.18 to 0.59m by relative to levels, with the upper ranges of projected sea-level rise possibly increasing by m due to an additional contribution from a future rapid dynamic melt of ice sheets. For clarity of timelines with respect to these dates, is established as the baseline time of 1990 and the projections to are assumed to represent the year Shorter term projections than 2100 are often required for engineering and planning designs. The IPCC Fourth Assessment Report does not notate intermediate values. The IPCC Third Assessment Report (2001) does not differ significantly from estimates provided in the IPCC Fourth Assessment Report (2007), but does provide estimates for the year Therefore, the IPCC Third Assessment (2001) has been adopted as an estimate of sea-level rise by 2050, thus being a sea-level rise of 0.05 to 0.30m above 1990 levels. CSIRO modelling undertaken on behalf of the NSW DECC indicated a further local (NSW) increase of up to 0.08m by 2030 and 0.12m by 2070 for the NSW coastline. This result is associated with a strong warming of the sea surface in the region and a strengthening of the East Australian Current (McInnes et al. 2007). By linear interpolation and extrapolation of these upper-limit projections, a value of 0.10m was adopted for 2050 and 0.14m for The estimated range of possible sea-level rise scenarios for the Sydney region has been provided by DECC (Watson 2008, pers. comm. 29 August) and, related to present day (2008 levels), are 0.04 to 0.38m by 2050 and 0.16 to 0.89m in The upper bound estimates are consistent with the NSW Sea Level Rise Policy Statement (NSW 2009). These estimates are summarised in Table 2.1. Table 2.1 Projected Sea-Level Rise Estimates Referenced to 2008 Sea-Level Rise Scenario Year 2050 Year 2100 Lower Bound Estimate 0.04m 0.16m Medium Estimate 0.21m 0.53m Upper Bound Estimate 0.38m 0.89m Between 2008 and 2050 the upper bound estimate is 0.4m (rounding to 1 significant figure), or an average rate of 0.1m/10yr period (Table 2.1). Between 2050 and 2100 the upper bound estimate is 0.5m, or an average rate of 0.1m/10yr period. The volume of sand required on the beaches is dependent on the amount of sea-level rise and the economic assessment will depend upon the rate of sea-level rise. From a cost/benefit perspective, sand volumes have been based on the upper bound estimate of sea-level rise only. Therefore, all estimates in this report have been based on a sea-level rise of 0.1m/10yrs. This is a conservative assumption. 2.3 Other Climate Change Influences on Coastal Processes The impacts of climate change in the coastal zone extend beyond sea-level rise. Changes in the frequency and intensity of storms (including the tracks of cyclones) are possible and may impact on the amount of sand eroded during storms and further threaten beach amenity and assets. Small changes in wave direction may modify littoral drift rates and beach alignment or orientation. Predicted changes in storm surge magnitude due to climate change have also been reported (McInnes et al. 2007). The uptake of CO 2 by the world s oceans will alter their ph and potentially cause dissolution of calcium carbonate and affect the calcium metabolism of many species. This, potentially, could have huge biological implications in the marine environment, and could also have major repercussions to beach volumes and gradings. At Dee Why beach, for example, quartzose sand at the water s edge contains up to 35% shell fragments (Gibbons 1967). At Collaroy-Narrabeen Beach the shell content of the beach is approximately 30% (Harley 2009). Production of these shells due to changes in ocean acidity could result in major changes to existing beach extent. Revision C - 18 February
30
31 Chapter 3 Beach Nourishment as a Coastal Management Strategy
32
33 Beach Sand Nourishment Scoping Study - Maintaining Sydney's Beach Amenity Against Climate Change Sea Level Rise 3.0 Beach Nourishment as a Coastal Management Strategy This chapter reviews beach nourishment campaigns that have been conducted within Australia and provides an overview of major international nourishment campaigns. Chapter Summary To maintain Sydney s existing beach amenity with climate change sea-level rise, the options available are: 1) Retreat relocate infrastructure from within the hazard zone to permit the shoreline to respond to sea-level rise. The shoreline will recede, but the beach amenity will be maintained if sufficient sand is available within the beach system. 2) Nourish nourishment campaigns are an effective solution to prevent shoreline recession. 3) Prevent minimise further sea-level rise due to anthropogenic activities. The retreat option is difficult to implement. The prevent option requires political cooperation and unification beyond the boundaries of NSW and Australia. Also, the protection of infrastructure by hard engineering solutions will not retain or improve beach amenity, leaving beach nourishment as the only viable present day solution. From a coastal zone management and coastal engineering perspective a beach nourishment campaign to maintain amenity and to ameliorate increased hazard risk from sea-level rise is a sound strategy within present planning timelines. The USA, Europe and Australia have embraced the concept of beach nourishment to maintain beach amenity and protect infrastructure. Development of low-lying and near-shore areas for residential, commercial, industrial and tourism activities has created an expectation that the shoreline does not regress. The implementation of fixed shoreline strategies can lead to interruptions of the natural sediment transport and accretion / erosion cycles that form part of the coastal processes on sandy beaches. In general, three responses to shoreline regression are available for threatened amenity and infrastructure: 1) Hard coastal structures such as groynes and seawalls (Protect). 2) Soft stabilisation techniques such as beach nourishment (Accommodate). 3) Planned retreat or relocation (Retreat). Historically, coastal engineering attempts at maintaining a fixed shoreline position or mitigating shoreline regression has usually involved the construction of hard engineering structures. Often, the hard engineering structures form part of the final utility (e.g. seawall promenades, port wharves) and have been demonstrated to be very successful in achieving their function. Where the hard engineering solution includes maintaining a beach amenity, beach nourishment is usually included as part of the solution. In many other cases, the hard engineering structures have been shown to be inappropriate and have either exacerbated or shifted erosion issues to other locations, particularly when beach nourishment is not included as part of the protection strategy. Artificial beach nourishment, the placement of material either on the beach face or offshore across the beach profile, is often considered the preferred coastal management option. The beach nourishment solution permits the shoreline to respond to coastal processes with adequate sand volumes available to meet storm demand, beach re-orientation, littoral drift and sea-level rise. Depending on the dominant coastal processes at the site, beach nourishment may be a one off programme or involve regular replenishment at nominated intervals. The third option, retreat, has been politically difficult to implement (Parsons and Powell 2001 and Leonard et al. 1990). The NSW Coastline Management Manual (1990) was developed to assist those responsible for management of the coastline in implementing the NSW Coastline Hazard Policy (1988). The Coastline Hazard Policy (1988) introduces a range of planning and structural measures which provide for: The establishment of a state-wide management system which requires balanced management of the coastline. Revision C - 18 February
34 Beach Sand Nourishment Scoping Study - Maintaining Sydney's Beach Amenity Against Climate Change Sea Level Rise To control the potential for losses in new development through the application of effective planning controls designed to ensure that the development is compatible with the hazards. A reduction in the impact of hazards on existing developed areas through the construction of protective works and/or the voluntary purchase of property at equitable prices. The construction of beach improvement works to protect or enhance the recreational amenity of the State's most heavily used beaches and their associated sand dune systems. Hazard management options referenced within the NSW Coastline Management Manual (1990) are: Environmental planning Development control conditions Dune management Protective works Beach nourishment falls within the auspices of protective works and the NSW Coastline Management Manual (1990) states:.. beach nourishment provides coastal protection and increases beach amenity by building a wider beach. However, unlike groynes, nourishment does not promote erosion in downdrift locations of the beach. In fact, beach nourishment programmes have few if any detrimental effects (this is part of their attraction) provided that an adequate supply of suitable sand is available and that it can be obtained without undue consequences. One potential drawback of beach nourishment is that further nourishments may be needed in the future. Europe and the USA have embraced the concept of beach nourishment during the past 100 years with millions of cubic metres of material placed. CEM (2006) developed a media release document describing how beach nourishment works, the benefits of such schemes and its acceptance in the USA. This is included in Appendix A. The overseas and Australian experience of beach nourishment as a coastal management strategy are summarised and discussed herein. 3.1 Relevant International Projects - A Brief Overview The European Experience The use of beach nourishment as a coastal management strategy in the European Union varies widely with respect to location, project type, objectives, design, evaluation procedures, legal framework and financial aspects. Northern countries, such as the Netherlands and Germany, have implemented extensive long-term nourishment and monitoring regimes to maintain their coastlines while southern countries such as Spain, Italy and France and the UK have a more ad-hoc approach to beach nourishment (Hanson et al. 2002). The Dutch have struggled for centuries to protect their coastline from flooding and erosion as many parts lie below mean sea level. Beach nourishment as a management strategy was adopted in the 1970 s. Since then, more than 200 projects have been undertaken at 35 sites with a total volume of more than 110 Mm 3 of material placed (Hanson et al. 2002). In 1990 a policy of dynamic preservation was adopted which was based on the presumption that it was technically and economically possible to compensate natural erosion by nourishment. The dynamic preservation policy aims to preserve the coastline at the 1990 location through the utilisation of beach nourishment. In many cases beaches are nourished with excess material to provide for a specific design life and to ensure the 1990 coastline is not breached by a large storm event. To monitor the performance of nourishment projects, and areas where nourishment may be required, beach profiles of the entire Dutch coastline are undertaken on an annual basis. Revision C - 18 February
 in 1987 prior to beach nourishment and in 1999 (Blott & Pye 2003) The Germans have completed more than 130 projects at around 60 sites with a combined volume of")
35 Beach Sand Nourishment Scoping Study - Maintaining Sydney's Beach Amenity Against Climate Change Sea Level Rise Figure 3.1 Mablethorpe Beach (Lincolnshire) in 1987 prior to beach nourishment and in 1999 (Blott & Pye 2003) The Germans have completed more than 130 projects at around 60 sites with a combined volume of 50Mm 3 of sand (Hanson et al. 2002). Storm surge and longshore transport are the main design parameters; wave run-up and depth of closure are not considered. Unlike the Dutch, performance evaluation programmes are rarely used. Of the southern European countries, Spain has undertaken the largest and most extensive beach nourishment project of more than 110Mm 3 of material placed since 1983 (Hanson et al. 2002). The vast majority of these projects have been on the Mediterranean coast where harbour developments have interrupted natural littoral drift. The Spanish experience differs from that of the Netherlands and Germany as most projects are undertaken to maintain beach amenity for tourists. In comparison, beach nourishment projects undertaken in Italy and France which are mostly coupled with hard structures are of a remedial rather than preventative nature. Early coastal engineering works in the UK consisted of seawalls and vast groyne fields although some earlier nourishment projects were undertaken in South West England in the 1930 s. Since the 1950 s, beach nourishment campaigns have become increasingly common with more than 20 Mm 3 of material placed at more than 30 locations (Hanson et al. 2002). The largest nourishment project in the UK took place in Lincolnshire where 7.5Mm 3 of material, both sand and shale, was placed between 1994 and 1999 (Figure 3.1). The nourishment material was dredged from offshore banks in the North Sea and was coarser and less finely graded than the natural material at the site. Unlike the majority of nourishment projects in Europe, a significant monitoring regime was adopted upon completion of the project. By 2003 it was found that less than 10% of the sediment added to the beaches had been lost from the nourishment area although there had been substantial re-alignment of the beach profile due to the coarseness of material (Blott & Pye 2003) The USA Along with continental Europe, the USA has implemented the largest number of beach nourishment projects. Beach nourishment as a coastal management strategy has become increasingly popular over hard coastal structures. Today beach nourishment is the most commonly used tool to mitigate the effects of coastal erosion and storms and it has been estimated that more than 500 Mm 3 of material had been placed on USA beaches (Trembanis et al. 1999). Planned or emergency storm erosion and flood mitigation projects make up the bulk of nourishment works in the USA. The majority of these projects are federally funded, although some have been funded by the states and a small number by private stakeholder. Beaches have also historically been used as spoil disposal sites for federally funded navigation channel maintenance projects. Similarly, harbours and marinas also use beaches for spoil disposal under routine maintenance regimes. Revision C - 18 February
36 Beach Sand Nourishment Scoping Study - Maintaining Sydney's Beach Amenity Against Climate Change Sea Level Rise Figure 3.2 Beach Nourishment Panama City Beach, Florida (CEM 2006) For the most part, nourishment projects undertaken in the US have been poorly documented with little to no monitoring upon completion, making it difficult to determine their effectiveness (Clayton 1991). A number of studies in the 1990 s (Leonard et al. 1990, Clayton 1991, Haddad & Pilkey 1998, Trembanis & Pikey 1998, Trembanis et al. 1999) attempted to document the number of nourishment projects that had occurred across the country. More recent projects have been better conceived and have included monitoring components. On the Atlantic Coast, more than 270 Mm 3 of sand has been placed on 268 beaches (Trembanis et al. 1999). The barrier island states of the east coast, New Jersey, North Carolina, South Carolina, and Florida have received the majority of this material (Figure 3.2). This is due, in part, to the barrier islands being the largest continuous length of foreshore development in the US. The large nourishment effort also reflects the great economic importance of recreational beaches in this region (Trembanis et al. 1999). On the Gulf coast, around 60 Mm3 of sand has been placed on 60 beaches since 1942 (Trembanis & Pilkey 1998). Nourishment has been used as a coastal management tool in all states of the Gulf coast, however, most of these projects have been on the central and southern coasts of Florida. Florida Statute, Title XI, Chapter 161, declares beach nourishment to be in the best interests of Florida citizens. Coastal tourism and recreation provide a substantial positive economic benefit in the United States. Over 90 percent of foreign tourism spending is concentrated in coastal states where beaches are the leading tourism destination (Houston 1996). For example, "Miami Beach reported more tourist visits (21 million) than were made to any National Park Service property" (Houston 1996). Houston estimates that the federal government receives annually about six times the tax revenues associated with foreign tourism spending at Miami Beach than it expends to restore beaches for the entire nation (Houston 1996). On the Pacific Coast, beach nourishment was being used in California as early as Since then, several hundred nourishment activities have taken place at more than 60 beaches, particularly in the southern California regions of Santa Barbara, Ventura, Santa Monica, Orange County and San Diego County. In total, approximately 250 Mm 3 of material had been placed to 2001 (Higgins et al. 2004). Revision C - 18 February

37 Beach Sand Nourishment Scoping Study - Maintaining Sydney's Beach Amenity Against Climate Change Sea Level Rise 3.2 Historical and Present Applications in Australia Southern Gold Coast and Tweed River Bypass In the NSW government extended the Tweed River entrance training walls to improve safe navigation. This interrupted the northward littoral drift of sand causing shoreline recession and loss of beach amenity along Queensland beaches including North Kirra and Coolangatta. When large storms hit the area in 1967 extensive erosion of the Gold Coast beaches occurred (Boak et al. 2001). Eventually a new bar formed at the entrance of the Tweed River, again creating a hazard for vessels using the channel. Intermittent sand nourishment was undertaken at North Kirra and Coolangatta in 1974/1975, 1985, using offshore sand reserves (Boak et al. 2001). Erosion continued in the area however, which eventually lead to a Deed of Agreement between Queensland and NSW and implementation of the Tweed River Entrance Bypass Project (TRESBP) which was undertaken to maintain a navigable channel at the Tweed River entrance and to restore and maintain the amenity of the Gold Coast beaches (Figure 3.3). Figure 3.3 Tweed River Entrance Bypass Project (Tweed River Entrance Sand Bypassing Project 2009b) Stage 1 of the project involved dredging the Tweed River entrance and placing sand directly on the south Gold Coast Beaches. Stage 2 involved a permanent sand bypassing system to intermittently pump built up sand from south of the Tweed River to the beaches in the north. To date, the project has involved the following (Boswood et al. 2001, TRESBP 2009a): Stage 1A 1995 Placement of 1.5Mm 3 in the near-shore zone in water depths of 6-10m (AHD) by a large trailing suction hopper dredge. 600,000m 3 of upper beach nourishment was achieved using a ship to shore pipeline. An additional 200,000m 3 was placed by a smaller vessel at a depth of 5m (AHD). Stage 1B 1997 A small trailing suction hopper dredge placed 800,000m 3 of sand in the near-shore zone. Stage TRESBP pre-commissioning nourishment was required to maintain the entrance to the Tweed River. By commissioning of the bypass system 532,000m 3 of material had been placed in the nearshore zone. Stage Commissioning of the TRESBP involved pumping 250,000m 3 of sand with 66,000m 3 discharged at Duranbah and the remainder at Snapper Rocks. Stage to 2009 The TRESBP has pumped over 5Mm 3 of sand since becoming operational. Continual ARGUS monitoring to quantify beach conditions. The permanent sand bypassing system discharges sand at Snapper Rocks (permanent outlets at Snapper Rocks East and Snapper Rocks West) which is then transported north by longshore drift. There are also outlets at Duranbah and Kirra Point that are used as discharging sites occasionally. This sand bypassing system feeds the sandbanks and beaches of the southern Gold Coast, and has proven to be more efficient than depositing the dredged sand in the near-shore area and waiting for shoreward migration to occur (Castelle et al. 2006). The TRESBP has been successful in providing wide beaches within Coolangatta Bay. The beaches have undergone significant and rapid improvements in beach width and are now thought to be the only Gold Coast beaches able to manage extreme events (Castelle et al. 2006). However, some social and environmental concerns have been expressed. The beach at Kirra is considered by many to be too wide. The sand bypassing Revision C - 18 February
38 Beach Sand Nourishment Scoping Study - Maintaining Sydney's Beach Amenity Against Climate Change Sea Level Rise has also resulted in the loss of surf amenity at Kirra Beach. Moreover, the natural reefs seaward of Kirra Beach face the potential threat of being covered by sand, raising ecological issues. Conversely, the formation of the straight and wide near-shore bar at Snapper Rocks has resulted in a 2km long wave known as the Superbank, considered one of the best (and most crowded) waves in the world Northern Gold Coast Beaches The northern beaches of the Gold Coast have also had a long history of erosion episodes (Figure 3.4). Large storms in 1968 led to Delft Hydraulics being commissioned to study the coastal processes in the area. Delft recommended a number of management strategies including; stabilisation of the river/creek mouths, nourishment of the beaches, restoration and maintenance of native dune vegetation and an ongoing data collection programme (Jackson et al. 1997). Following these recommendations, 1.4Mm 3 of sand was pumped from Broadwater to the beaches between Main Beach and South Surfers Paradise in The effectiveness of nourishment as a coastal management strategy was demonstrated in 1983/1984 and 1988/1989 when large storms hit the coast and had only a minor affect on the long term alignment of the beaches (Boak et al. 2001). Figure 3.4 Gold Coast Broadbeach and Surfers Paradise Esplanade, June 1967 (GCCC 2009) Another recommendation from the Delft report was enacted in 1985 when the Nerang River entrance was stabilised with the addition of training walls as part of the Gold Coast Seaway development. The river entrance was a key feature in the evolution of the northern Gold Coast shoreline and had migrated northward 4km between 1920 and 1985 (Patterson 2007). The world s first sand bypass scheme was established south of the Nerang River entrance in 1986 to ensure sand movement north did not form a bar across the newly secured navigation channel. Large storms in 1996 emphasised the vulnerability of the northern Gold Coast beaches to erosion, which prompted the formation of the Northern Gold Coast Beach Protection Strategy (NGCBPS). The strategy had two objectives: to widen the beach and dunes (increasing the volume of sand within the storm buffer and providing additional public open space); and to improve surf quality at Narrowneck by the construction of a submerged reef to stabilise the nourished beaches (GCCC 2000). Between 1999 and 2000, 1.1Mm 3 of sand was dredged from Broadwater and placed between Main Beach and Surfers Paradise. Construction of the reef was undertaken concurrently using large sand filled geo-containers. The area is continually monitored by roof mounted ARGUS coastal imaging cameras. A study undertaken by Jackson et al. in 2005 showed that the NGCBPS has been successful in fulfilling its objectives. Beach amenity has been maintained on the northern Gold Coast and surf conditions have improved at Narrowneck. The reef has also become a popular location for fishing, spear fishing, diving and snorkelling Townsville The Strand Foreshore is located in Townsville and since European settlement and subsequent construction of the port and weirs on the Ross River, has experienced severe erosion during cyclone events (Riedel et al & Muller et al. 2004). Prior to development, the beach was naturally fed with sand from the Ross River. Large storms in 1940 caused extensive erosion along the Strand Foreshore and a concrete revetment was constructed along a large portion of the foreshore to provide protection. This seawall fulfilled its purpose for a number of years until 1971 when Townsville was hit by Cyclone Althea which damaged a large portion of the wall. The revetment was repaired; however, subsequent large cyclone events in 1997 and 1998 eroded large sections of the beach and again damaged the seawall. Revision C - 18 February
 A more permanent and robust solution was required to maintain amenity and protect the foreshore")


39 Beach Sand Nourishment Scoping Study - Maintaining Sydney's Beach Amenity Against Climate Change Sea Level Rise Figure 3.5 The Strand Foreshore (left image prior to 1998, right image following sand nourishment in 1999) A more permanent and robust solution was required to maintain amenity and protect the foreshore infrastructure. Beach nourishment was considered the best option, as simply repairing / replacing the seawall was considered expensive and provided no united protection to beach amenity. Extensive investigations were undertaken to determine the coastal processes at the site. These indicated that 500,000m 3 of material would be required to sustain the beach at an acceptable width, an amount that was not possible to source in the area. Eventually it was decided to nourish the beach with 250,000m 3 of sand and construct a number of artificial headland structures to retain the nourished material and provide recreational nodes protruding into Cleveland Bay (Riedel et al. 1999). Construction took place over 1998/1999 at a cost of $29M and included extensive redevelopment of the foreshore, providing park areas, a 2.2km promenade, playgrounds and stinger-resistant enclosures (Figure 3.5). The headland structures have reduced near-shore littoral sediment transport at the site and retained the nourishment sands. Some sand is lost to the north and it is likely that re-nourishment will be required sometime in the future (Muller et al. 2004) Port Stephens Port Stephens is located 230km north of Sydney and is one of the most popular tourist destinations in NSW. Both Shoal Bay (south of Port Stephens) and Jimmy s Beach (to the north of Port Stephens) are subject to wave and wind erosion. Historically, a number of hard engineering structures, such as timber sleeper walls and rock groynes were constructed in an attempt to stop erosion. Following severe storms in 1983, the NSW Public Works Department undertook a coastal process study of the area and a number of management strategies were proposed, with sand nourishment decided as the most advantageous (Watson 1997). The Great Lakes Shire Council placed 43,000m 3 of material dredged from the entrance of the Myall River on Jimmy s Beach as an interim management measure in This was subsequently redistributed by waves and currents and the council then embarked on a policy of sand nourishment as an emergency response during storm events. By 1987 around 20,000m 3 of sand had been placed in this manner. A larger placement of 80,000m 3 was undertaken in In 1990, Council formally adopted a long-term management plan of periodic nourishment based on an estimated average loss of 10,000m 3 per annum dependent on storm activity (Watson 1997). From 1992 to 1995 a further 69,000m 3 of sand was placed on Jimmy s Beach under this policy (Figure 3.6). Figure 3.6 Jimmy s Beach (left image 1985, right image 1988 [photograph courtesy of Phil Watson, DL&WC]) Revision C - 18 February
40 Beach Sand Nourishment Scoping Study - Maintaining Sydney's Beach Amenity Against Climate Change Sea Level Rise Large scale nourishment at Shoal Bay, on the southern shore of Port Stephens, commenced in 1986 with the placement of 25,000m 3 of sand dredged from Nelson Bay as part of a boat harbour development. In 1994, 3,000m 3 of sand was placed as an emergency response. This was complemented with a further, longer-term initiative of 56,000m 3 of material dredged from an offshore shoal late in Monitoring programmes were established by the Department of Land and Water Conservation at both beaches to provide an accurate measurement of the performance of the various sand nourishment programmes. Profiles were set up at 20-40m intervals and extended from -3.0m AHD to the back beach area. Sand nourishment within Port Stephens has to date been effective in maintaining beach amenity and protecting foreshore assets at both Jimmy s Beach and Shoal Bay. The extensive monitoring programme implemented has provided vital information regarding sand loss rates, littoral drift rates and the destination of nourishment material. The intermittent approach to beach nourishment of the 1980 s and 1990 s was replaced in 1996 when Port Stephens Council prepared a long-term coastline management plan in partnership with local stakeholders utilising the extensive information gathered from the monitoring programmes Bate Bay Large storms in 1974 caused extensive damage to the beaches and dune system of Bate Bay, 20km south east of Sydney. Following the storm damage, comprehensive coastal process studies and monitoring programmes were implemented from which a management plan was developed. The emphasis of the management plan was to develop a soft management strategy aimed at establishing a well vegetated fore-dune throughout as much of the embayment as possible. Four significant nourishment projects have been undertaken on the Bate Bay beaches. From 1977 to 1978, 120,000m 3 of sand obtained from the dunes behind Wanda was placed on Cronulla Beach. The placed sand quickly moved offshore and was redistributed along the active beach profile to the north (PBP 2006). At the same time, dune stabilisation commenced by vegetating the dunes of Wanda, North Cronulla and what would become Greenhills. Dune stabilisation works continued until In addition, a 340m long Seabee seawall was constructed in 1985/86 at South Cronulla to protect threatened assets. Between 1998 and 1999 approximately 60,000m 3 of material dredged during navigation channel maintenance within Port Hacking was placed in the near-shore zone between North Cronulla and Elouera Beaches by a trailer suction hopper dredge (Figure 3.7). The material was placed in water depths of 4-8m around 200m offshore (PBP 2006). An additional 10,000m 3 of sand was placed on the subaerial profile at Cronulla Beach. Figure 3.7 Trailer Suction Hopper Dredge Beach Profile Nourishment at Cronulla Beach (1998/99) Between 2002 and 2003, 90,000m 3 of sand from maintenance dredging in Port Hacking was placed in the nearshore zone between South Cronulla and Elouera. The material was placed over a nominated area of 170m by 700m approximately 200m offshore. Finally, in 2007, 140,000m 3 of sand from maintenance dredging in Port Hacking was placed in the near-shore zone between South Cronulla and Elouera. The Bate Bay foreshore is now stable with some 5km of vegetated fore-dunes having been successfully established. In the hind-dune dune region, transgressive dunes stretching some 1.7km along the foreshores have also been stabilised. Gordon (1992) indicated that despite the occurrence of several major storms the net shoreline and fore-dune movement since the implementation of the management plan has shown an accretion trend. Revision C - 18 February
41 Beach Sand Nourishment Scoping Study - Maintaining Sydney's Beach Amenity Against Climate Change Sea Level Rise Other Projects Numerous other sand nourishment campaigns have been conducted on Australian beaches including: Collaroy-Narrabeen Beach Sand from the entrance to Narrabeen Lagoon is periodically dredged (i.e. every 3-4 years) and returned to the sub-aerial beach zone. This is primarily a flood mitigation measure for properties located in the Narrabeen Lagoon floodplain. Excavated sand from building construction sites, when available, is also placed on the beach. Sand has also been placed on the beach during large storm events as part of the emergency strategy to protect properties. Lady Robinsons Beach The southern end was stabilised in 1997 with 150,000m 3 of sand and 8 groynes. The northern end was stabilised in 2004/05 with 310,000m 3 of sand and 5 groynes. Sand was delivered to the beaches from offshore sources within Botany Bay. Park Beach, Coffs Harbour Maintenance dredging within Coffs Harbour is a regular occurrence. Recent dredging programmes have been conducted in 1997, 1999, 2001, 2004, 2008 and A total of 190,000m 3 has been removed during these campaigns with most of the sand placed either onshore or in the near-shore zone of Park Beach. During the most recent dredging campaign in 2009 the entrance to the Inner Harbour was dredged and 37,000m 3 of sand was placed on the sub-aerial profile of Park Beach. Towra Beach 60,000m 3. Ettalong Beach. Silver Beach 1969 and Noosa Main Beach Sand is historically extracted from the Noosa River and pumped on to Noosa Main Beach. More recently, sand has been sourced from near the entrance of the river and recycled on to the southern end of Noosa Main Beach. Port Phillip Bay Beaches (Victoria) Beaches within Port Phillip Bay have historically been nourished to provide or maintain beach amenity. Sand has mostly been sourced from offshore, within Port Phillip Bay. More recently PBP (2006) have completed an investigation to use offshore sand bodies to nourish beaches at Cape Byron. An initial nourishment campaign of 1Mm 3 was recommended with subsequent campaigns of 500,000m 3 at 25 year intervals. The cost for the nourishment programme over a 50 year period at a 0% discount rate is estimated at $52M. 3.3 Discussion The success of historical beach nourishment campaigns has been mixed. Higgins et al. (2004) reports on monitoring of a major nourishment programme in San Diego County. Twelve beaches received nourishment in During the 2003 monitoring year, the performance of the nourishment campaigns at the twelve beaches varied considerably; at approximately half of the beaches, previous gains in shore zone volumes were maintained, while at the others, the gains were short-lived. The success of beach nourishment campaigns is sensitive to a variety of factors. These include the local sand transport mechanisms (long-shore and cross-shore), the suitability and availability of the nourishment material (grain size), beach slope, the intensity and frequency of storm events and the maintenance strategy (renourishment frequency). Each of Sydney s beaches are essentially closed sediment systems (bounded by headlands) with the dominant transport mechanism being cross-shore transport (onshore offshore). This is conducive to beach nourishment as a coastal management strategy for the Sydney region. Longshore transport mechanisms with sand bypassing the headlands is small. Some headland bypassing of sand may be expected under extreme storms. To maintain Sydney s existing beach amenity with climate change sea-level rise, the options available are: Retreat relocate infrastructure from within the hazard zone to permit the shoreline to respond to sea-level rise. The shoreline will recede, but the beach amenity will be maintained if sufficient sand is available within the beach system. Nourish nourishment campaigns are an effective solution to prevent shoreline recession. Prevent minimise further sea-level rise due to anthropogenic activities. Revision C - 18 February
42 Beach Sand Nourishment Scoping Study - Maintaining Sydney's Beach Amenity Against Climate Change Sea Level Rise As previously discussed the retreat option is difficult to implement. The prevent option requires political cooperation and unification beyond the boundaries of NSW and Australia. Also, the protection of infrastructure by hard engineering solutions will not retain or improve beach amenity, leaving beach nourishment as the only viable present day solution. From a coastal zone management and coastal engineering perspective, a beach nourishment campaign to maintain amenity and to ameliorate increased hazard risk from sea-level rise is a sound strategy within present planning timelines. The successes of a nourishment campaign for Sydney s beaches will require investment in detailed coastal process investigations, monitoring programmes, economic assessments, social considerations and community consultation and education. The remainder of this report is the starting point in the advance of such a journey. Key Recommended Studies and Further Work Monitor performance of sand nourishment campaigns. Working group study tour of Florida beaches nourishment campaigns. Revision C - 18 February
43 Chapter 4 Beach Nourishment Volumes
44
45 Beach Sand Nourishment Scoping Study - Maintaining Sydney's Beach Amenity Against Climate Change Sea Level Rise 4.0 Beach Nourishment Volumes Land based sand reserves in the Sydney region are limited. At present most of the sand used in the building industry is sourced from Penrith Lakes. The Penrith Lakes extraction operation is due to cease in the next few years when supplies will be exhausted. New sand deposits will have to be considered to meet the needs of the Sydney building industry. The majority of land-based sand reserves will not be compatible with the requirements for beach nourishment because of grain size incompatibility, grain angularity, colour and transport distances. Together with the competing demands of the building industry, offshore sand sources are the best option for a beach nourishment campaign. Nourishment sand volumes, potential offshore sand sources for nourishment and sand compatibility are considered in this Chapter. Chapter Summary Sea level has risen and beaches have been eroding for decades. Between 1870 and 2004 the mean global sea level has risen by almost 0.2m. The approach for the first 10-year sand nourishment campaign would be to accommodate both a past sea-level rise of 0.2m and a future sea-level rise of 0.1m. This would reinstate and maintain beach amenity and provide some storm protection buffer. Based on a 0.3m sea-level rise increment, 9Mm 3 of native sand would be required to maintain the recreational amenity of all of Sydney s ocean beaches. This is equivalent to an average native sand volume of 300m 3 /m length of beach. Ideally, nourishment sands should have a similar size grading, shell content and colour to the native sands. Using the most suitable identified sand borrow source at Cape Banks (slightly smaller grain size), 12Mm 3 of borrow sand would be required. This is equivalent to an average borrow sand volume of 400m 3 /m length of beach. The extraction and delivery of 12Mm 3 of sand is likely to extend over a period of 12 to 18 months. Subsequent nourishment campaigns (each 10 years) will require 3Mm 3 of native sand or 4Mm 3 of borrow sand that is of similar characteristics to Cape Banks sand. Beach nourishment volumes are firstly estimated based on the sand characteristics for each beach (native sand). Available nourishment sands (borrow sands) do not usually exactly match the sand characteristics of the beach to be nourished. Borrow sand volumes are then estimated based on their compatibility to the native sand characteristics (e.g. grain size, density, shell content). 4.1 Bruun Rule The impact of sea-level rise, generally, would be to cause sand to be eroded from the top of the beach and to be deposited in deeper water. This process was described by Bruun (1962, 1983) and is commonly referred to as the Bruun Rule, which has become the most widely accepted method of estimating shoreline response to sea-level rise. Bruun (1962, 1983) investigated the long term erosion along Florida s beaches, which was assumed to be caused by a long term sea-level rise, and hypothesised that the beach assumed a profile that was in equilibrium with the wave climate; an equilibrium profile that kept pace with the rise in sea level without changing its shape, by an upward translation of sea-level rise (S) and shoreline retreat (R). Figure 4.1 illustrates the concept of the Bruun Rule. Revision C - 18 February
46 Beach Sand Nourishment Scoping Study - Maintaining Sydney's Beach Amenity Against Climate Change Sea Level Rise Figure 4.1 Bruun Rule concept For a beach profile that is in equilibrium with the prevailing wave climate, the Bruun Rule equation is: R S h B L c / where: R = shoreline recession due to sea-level rise (m) S = sea-level rise (m) h c = closure depth the limit of offshore transport of littoral drift (m) B = beach berm height (m) L = extent of the active zone the distance to closure depth (m) There are several methods for determining the closure depth. Nielsen (1994) reviewed the analytical methods and a large body of field data to define the limits of subaqueous fluctuations of open coast beaches in NSW. Nielsen (1994) found that, for open coast beaches on the New South Wales coast, the absolute limit of offshore sand transport under cyclonic or extreme storm events occurred at a depth of around 22m ±4m. For most of Sydney s beaches, this depth corresponds to the sedimentological boundary of the near-shore sands and the sediments of the Inner Continental Shelf, and lies at a distance of around 1,200m from the mid tide level. Assuming that Sydney s beaches are in equilibrium with the prevailing wave climate, the average beach slope of the equilibrium profile for Sydney s beaches is around 1: Required Native Sand Volumes For this study, based on an equilibrium profile, the volume of native sand required to account for a sea-level rise so that the shoreline does not recede landward (i.e., R = 0) equilibrates to the product of the amount of sea-level rise (S), the extent of the active beach profile (shoreline to closure depth, L) and the average length of the active beach (l = (l 1 +l 2 )/2) where l 1 and l 2 are defined in the example shown on Figure 4.2. Revision C - 18 February
47 Beach Sand Nourishment Scoping Study - Maintaining Sydney's Beach Amenity Against Climate Change Sea Level Rise Figure 4.2 Definition of parameters to calculate beach volume requirements The 1:25,000 series of Seabed Information Maps for Gosford, Broken Bay, Sydney Heads and Bate Bay have been used for defining beach dimensions. The berm height (B) has been taken to be 3m. Three criteria were used to estimate the depth of closure, these were: 22m water depth relative to mean sea level (21m Chart Datum). Bed slope of 1:5. The region where the sand changed from fine/medium grained (near-shore sands) to medium/coarse grained (Inner Continental Shelf sediments). For each of the three criteria, the extent of the active beach profile (shoreline to closure depth, L) was determined. The governing criterion was the method that resulted in the minimum length (L). For beaches with lagoons, an additional volume of sand was calculated following the method after Hennecke et al. (2004), being the product of the area of the active flood tide delta and sea-level rise. This was the case for Narrabeen Lagoon. The required volumes of native sand nourishment for a range of sea-level rise scenarios is presented in Figure 4.3 for all of Sydney s ocean beaches and for the individual beach embayments of Collaroy-Narrabeen Beach, Manly Beach and Bate Bay. Revision C - 18 February
48 Beach Sand Nourishment Scoping Study - Maintaining Sydney's Beach Amenity Against Climate Change Sea Level Rise Figure 4.3 Native sand nourishment volumes required to prevent shoreline recession due to sea-level rise The required native sand nourishment volume for all of Sydney s ocean beaches is 100m 3 /m length of beach or 3Mm 3 for each 0.1m rise in sea level. A spreadsheet of native sand volumes for each beach system is contained in Appendix B. 4.3 Offshore Sand Bodies Offshore sand reserves have been utilised in many countries overseas. Japan and the UK mine offshore sand and gravel reserves for aggregate while the US, Dubai and the Dutch mine offshore sand reserves for beach nourishment projects. Prior to the establishment of the Tweed River sand bypassing system, offshore sand extraction for beach nourishment was undertaken on Queensland s Gold Coast (Jackson & Tomlinson 1990; Boczar-Karakiewicz & Jackson 1990). The Inner Continental Shelf near Sydney is interspersed with marine sand deposits in depths ranging from around 20-75m. Some of these have been the subject of exploration licences and mining lease applications, as indicated in Figure 4.4. Details of current licences and lease applications are provided in Appendix C. The Providential Head lease is held by Metromix Pty Ltd. The Cape Banks lease is held by Archdall Investments Pty Ltd (Unisearch) and the Central Coast lease is held by Sydney Marine Sand Pty Ltd. Revision C - 18 February
49 Beach Sand Nourishment Scoping Study - Maintaining Sydney's Beach Amenity Against Climate Change Sea Level Rise Figure 4.4 Offshore sand mining exploration licences and mining lease application areas offshore Sydney. In most places these deposits display gently seaward sloping profiles, which are the seaward extensions of inshore and surf zone beach slopes. At several locations, however, directly adjacent to cliffs (20 to 40m water depth), the deposits form mildly to strongly convex bodies up to 50m thick, as shown in Figure 4.5. These sand bodies are geological features that were formed during the post-glacial marine transgression and subsequent stillstand of the sea that occurred over the past 17,000 years following the end of the Ice Age. Based on seismic profiles and the foraminiferal (shell species) content of these sand bodies, Albani et al. (1988) presented the following process that described the formation of these sand bodies (Figure 4.6). At the peak of the last Ice Age, some 17,000 years ago, the sea level was around 140m below that of today and NSW beaches existed eastwards of the present coastline (Phase 1, Figure 4.6). As the sea level rose, the unconsolidated beach sediments were pushed ashore progressively under wave action (Phase 2). As the sea level continued to rise, cliffs hindered this westward re-distribution of the sand, which then accumulated against the cliff face (Phase 3) only to be submerged as the present day sea level was attained some 7,000 years ago (Phase 4). Progressive erosion of the top of the most landward portion of the sand body caused deposition of the sand in a seaward prograding front (Phase 5). At other locations where cliffs did not exist, such as at the Hacking River, Georges River, Parramatta River and Hawkesbury River entrances, the sediment was pushed into the estuary embayments and formed the estuary beaches and shoals that we see today. It is apparent, therefore, that the ocean beaches, estuary beaches and shoals and the offshore sand bodies all have the one geological origin, which is why sand taken out of Port Hacking is suitable for deposition on the Bate Bay beaches. Vice versa, sand taken from offshore sand bodies, while it may no longer be connected by littoral drift transport processes, is likely to be suitable for the nourishment of the ocean beaches. Revision C - 18 February
50 Beach Sand Nourishment Scoping Study - Maintaining Sydney's Beach Amenity Against Climate Change Sea Level Rise Figure 4.5 The locations and shapes of the sand bodies on the Inner Continental Shelf off the southern Sydney coastline (Roy 2001). Figure 4.6 Diagrammatic representation of the formation of the Sydney sand bodies (after Albani et al. 1988). 4.4 Suitability as a Nourishment Source A key performance criterion of any beach nourishment project is the availability and compatibility of the sand. In the planning of a beach nourishment project, locating an affordable high quality sand source is a critical design aspect. Borrow sites may differ in terms of their geological origin and sediment characteristics, both physical and chemical, thereby affecting their suitability for beach nourishment purposes. Revision C - 18 February
51 Beach Sand Nourishment Scoping Study - Maintaining Sydney's Beach Amenity Against Climate Change Sea Level Rise Typical Native Sand Properties Native sand properties were assessed based on information available in the literature. Summaries of sand properties are available for Collaroy-Narrabeen Beach and Cronulla to Wanda (Table 4.1). The beach sands are classified as well sorted. Limited data is available for Sydney s beaches on sand grain size. Sand characteristics at Collaroy-Narrabeen and Cronulla-Wanda are similar and it has been assumed that these characteristics are representative of Manly Beach and all other Sydney beaches for this study. Further sampling of sand characteristics will be required in subsequent stages of the project. Table 4.1 Beach Sand Gradings Collaroy-Narrabeen 1 Cronulla to Wanda 2 D mm 0.35mm M n n M n = mean sediment diameter for native material in units, n = standard deviation or measure of sorting for native material in units. 1 Patterson Britton & Partners (1993) Collaroy/Narrabeen Beach Nourishment Investigations, for Warringah Council 2 Patterson Britton & Partners (2006) Bate Bay Coastline Management Plan, Beach Nourishment Strategy, for Sutherland Shire Council Potential Sand Sources Potential sand bodies for nourishment were identified in Section 4.3. These are: Providential Head (Figures 4.4 and 4.5). Cape Banks (Figure 4.4). Central Coast (Figure 4.4). Offshore of Bondi and Malabar (Figure 4.5). Sand grading and sand volumes are available in published literature for Providential Head, Cape Banks, Bondi and Malabar. Estimated sand volumes at each of these sites is presented in Table 4.2. Table 4.2 Sand Volumes (millions of m 3 ) Providential Head 1 Bondi 2 Malabar 2 Cape Banks 1 15Mm 3 50Mm 3 50Mm 3 10Mm 3 1 Pollution Research (1993) 2 Peter Roy (2001) Sand Deposits of the NSW Inner Continental Shelf The sand volume for Providential Head is based on published tonnage values and has been converted to a volume using a dry sand density of 1.6t/m 3. Only Grade 2 sands from Providential Head have been considered. The Grade 3 sands at Providential Head are too fine and not suitable as a nourishment source. The sand bodies at Bondi and Malabar each extend over an area of approximately 4km x 2.5km and are estimated to have an average sand depth of 5m. At Cape Banks the sand body extends over an area of approximately 2km x 1km. The depth of sand at Cape Banks may extend well beyond a depth of 5m used for the volume estimate (the proposed extraction depth for the Metromix project). This will require further consideration. The sand properties are presented in Table 4.3. Each of the sand bodies is classified as moderately well sorted. The most coarse diameter sand (D 50 ) is found at Cape Banks. Table 4.3 Sand Gradings Providential Head Bondi & Malabar Cape Banks D mm 0.30mm 0.36mm M n n The shell content at Providential Head is typically 4 to 15%, and 10% at Cape Banks. Cape Banks sand contains less than 1% mud. Typically, borrow material will not exactly match the native beach grain size (except perhaps in some bypassing projects). Ideally, it should be similar in grain size (or slightly coarser), composition, angularity and colour. An assessment is required of the compatibility of the borrow material with the native beach. The grain size distribution Revision C - 18 February
52 Beach Sand Nourishment Scoping Study - Maintaining Sydney's Beach Amenity Against Climate Change Sea Level Rise of the borrow material will affect the cross-shore shape of the nourished beach profile, sand loss rates and how the beach will respond to storms. This is demonstrated in Figure 4.7. The borrow sand compatibility is critical to the success of the nourishment campaign. Figure 4.7 Effect of nourishment sand compatibility on cross-shore slope and berm width (CEM 2006) In Figure 4.7 three nourished beach profiles are shown. In each profile the volume of nourishment sand is identical. The upper image shows a nourished profile using sand coarser than the native beach sand, in the middle image the nourished profile is achieved using sand similar to the native sand, and in the lower image the nourished profile is achieved using sand finer than the native beach sand. In the upper image, the nourished profile is steeper than the natural beach slope, and in the lower image, the nourished profile is flatter than the natural beach slope. Borrow sand grain size also has a pronounced effect on beach width, as demonstrated in each of the images. Two methods are used to estimate the volume of borrow sand required for nourishment. These are: The Overfill Factor Method. The Equilibrium Beach Profile Method. Each method assumes that the beach profile is in equilibrium with the wave climate. This was found to be the case for most Sydney beaches where the closure depth of 22m equated to a beach slope of approximately 1 in 50. CEM (2006) recommends using the Equilibrium Beach Profile Method Overfill Factor Method As a general recommendation, a beach nourishment project should use fill material with a composite median grain diameter equal to that of the native beach material, and with an Overfill Factor (RA) within the range of 1.00 to 1.05 (CEM 2006). The Overfill Factor is the ratio of fill material required for a given borrow site compared to that required using the existing beach sediments. This is the optimal level of sediment compatibility. However, Revision C - 18 February
53 Beach Sand Nourishment Scoping Study - Maintaining Sydney's Beach Amenity Against Climate Change Sea Level Rise obtaining this level of compatibility is not always possible due to limitations in available borrow sites. Both the Overfill Factor and Equilibrium Beach Profile concepts indicate that sediment compatibility is sensitive to the native composite median grain diameter. As such, the compatibility range varies depending on the characteristics of the native beach material, with coarse material being less sensitive to small variations between the native and borrow sediments than fine material. CEM (2006) recommends, as a rule of thumb, for native beach material with a composite median grain diameter exceeding 0.2mm, borrow material with a composite median diameter within plus or minus 0.02mm of the native median grain diameter. The Overfill Factor Method has been used to define the actual quantity of borrow material that will be required for a project fill based upon the desired design profile. Thus the overfill factor takes into consideration the mean grain size and distribution of the borrow and native materials and provides an indication of the loss of material that will occur as a result of the differing sediment distributions. The Overfill Factor was estimated using each of the Providential Head, Cape Banks and the Bondi and Malabar sands as nourishment material on Collaroy-Narrabeen Beach and Cronulla-Wanda Beach (Figure 4.8). Figure 4.8 Isolines of the Adjusted Overfill Factor, RA for Compatibility Analysis (SPM 1984) The estimated Overfill Factor is about 1.75 to 2.0 (1.9 adopted) using sand from Providential Head or Bondi / Malabar. The estimated Overfill Factor is in the range of 1.10 to 1.15 (1.13 adopted) for borrow sand from Cape Banks. Based on Cape Banks sand, the required borrow sand volume for all of Sydney s ocean beaches is 113m 3 /m length of beach for each 0.1m rise in sea level Equilibrium Beach Profile Method The Equilibrium Beach Profile Method as derived by Dean (1977) can be used to make preliminary estimates of required fill volumes, when the native and fill sediments have different composite median grain size. The equilibrium beach profile is given by Equation III-3-14 in CEM (2006) as: 2 / 3 h Ay Revision C - 18 February
54 Beach Sand Nourishment Scoping Study - Maintaining Sydney's Beach Amenity Against Climate Change Sea Level Rise Where: h = water depth A = sediment scale parameter y = distance offshore The native sand sediment scale parameter (AN) for Sydney s ocean beaches, based on a beach profile in equilibrium with the wave climate is (assumes native sand D 50 =0.35mm). Dean (1987b) presents a relationship between the sediment scale parameter and grain size. The Equilibrium Beach Profile method uses a sediment scale parameter for the borrow material (AF) to estimate the volume of sand required based on the equilibrium profile using the borrow material. Nielsen (1994) and Gordon (1987) have shown the vertical movement or mobility of the bed profile with water depth for the NSW coastline (Figure 4.9). Based on these observations, mixing of borrow material and native sands will occur and, therefore, a composite sediment scale parameter has been derived for this study assuming that the borrow sand is mixed with the native sand to depths of 2m. Based on Cape Banks sand, the required borrow sand volume for all of Sydney s beaches is 120m 3 /m length of beach or 3.6Mm 3 for each 0.1m rise in sea level. Figure 4.9 Measured Beach and Near-shore Seabed Fluctuations (Nielsen 1994) Most Suitable Borrow Sites Estimates of sand nourishment volumes based on the Bruun Rule, the Overfill Factor and the Equilibrium Beach Profile Method for each of the borrow sites of Providential Head, Cape Banks and Bondi & Malabar are presented in Figures 4.10 to Based on these estimates, the most suitable material as a nourishment source is Cape Banks sand (Figure 4.12). The Providential Head sand source (Figure 4.10) and the Bondi & Malabar sand source (Figure 4.11) volumes are considerably greater than the native sand volumes, indicating that they are less suitable than Cape Banks as a nourishment material. Required sand nourishment volumes using Cape Banks material are significantly less than the other potential sites identified, because the sand grading is coarser and closer to the sand grading of the native beaches. The selection of a nourishment source will affect both the cost of the nourishment campaign and also the final beach profile. Changes to the final beach profile may impact on environmental and social aspects. A flatter beach slope may result in smothering of benthic communities such as those that exist on rocky reefs. A flatter beach profile may also cause changes to wave shoaling and breaking. Revision C - 18 February
55 Beach Sand Nourishment Scoping Study - Maintaining Sydney's Beach Amenity Against Climate Change Sea Level Rise Equilibrium Beach Profile Method Overfill Factor Method Bruun Rule Method (Native Sand) Beach Fill Volume (m 3 /m) Sea Level Rise (m) Figure 4.10 Providential Head sand source Equilibrium Beach Profile Method Overfill Factor Method Bruun Rule Method (Native Sand) Beach Fill Volume (m 3 /m) Sea Level Rise (m) Figure 4.11 Bondi and Malabar sand source This analysis demonstrates the uncertainty in estimating required borrow sand volumes, with each of the methods giving sand volumes that differ significantly. The assessment methods are very sensitive to sand grain size. Nominating the Cape Banks borrow sand and adopting the Equilibrium Beach Profile Method (i.e. higher estimated volumes), the required borrow sand volume for all of Sydney s beaches is 120m 3 /m length of beach for each 0.1m rise in sea level. Revision C - 18 February
56 Beach Sand Nourishment Scoping Study - Maintaining Sydney's Beach Amenity Against Climate Change Sea Level Rise Equilibrium Beach Profile Method Overfill Factor Method Bruun Rule Method (Native Sand) Adopted nourishment volume 1400 Beach Fill Volume (m 3 /m) Sea Level Rise (m) Figure 4.12 Cape Banks sand source Required borrow sand volumes will vary, based on individual beach sediment characteristics, the consistency of the borrow sediments, depth of closure, sediment handling techniques (outlined in subsequent chapters of this report) and the validity or accuracy of the volume calculation methods. Further studies will be required to address some of these uncertainties. Therefore, a conservative 10% increase in the estimated borrow sand volume is used for all subsequent analysis. On this basis the required borrow sand volume for all of Sydney s beaches is approximately 130m 3 /m length of beach for each 0.1m rise in sea level (Figure 4.12). The estimated 3Mm 3 of native sand required for each 0.1m rise in sea level is equivalent to 4Mm 3 of Cape Banks borrow sand. 4.5 A Practical Sand Nourishment Campaign The volume of sand required on NSW beaches to maintain the existing amenity in response to climate change sea-level rise is dependent on the amount of sea-level rise. The economic assessment will also depend upon the rate of sea-level rise. In this study, the upper-bound estimate of sea-level rise of 0.1m/10yrs has been adopted as outlined in Section 2.2. From a cost/benefit perspective and nourishment campaign frequency approach this is the most conservative assessment. A lower rate of sea-level rise will provide a more favourable cost/benefit outcome. The volume of sand required to accommodate sea-level rise is small compared with that required to protect existing infrastructure along Sydney s foreshore. For example, at Manly Beach the volume of native sand required to accommodate a 0.1m sea-level rise is approximately 170,000m 3, but the volume of native sand required to protect the sea wall against storm damage is 2Mm 3 (WRL 2003). The main objective of the sand nourishment campaign is to maintain beach amenity in response to sea-level rise and not to address present risk to infrastructure. The sea level has been rising and our beaches eroding, for decades. Between 1870 and 2004 the mean global sea level has risen by almost 0.2m. The approach for the initial 10-year sand nourishment campaign would be to accommodate the recent past sea-level rise of 0.2m and a future sea-level rise of 0.1m (0.3m in total). This would reinstate and maintain beach amenity and provide some storm protection buffer. Based on a 0.3m sea-level rise, 9Mm 3 of native sand will be required to maintain the ocean beach amenity. This is equivalent to an average native sand volume of 300m 3 /m length of ocean beach. Using the most suitable identified sand borrow source at Cape Banks, 12Mm 3 of borrow sand will be required. This is equivalent to an average borrow sand volume of 400m 3 /m length of ocean beach. Subsequent nourishment campaigns (each 10 years) will require 3Mm 3 of native sand or 4Mm 3 of borrow sand that is of similar characteristics to Cape Banks sand. Revision C - 18 February
57 Beach Sand Nourishment Scoping Study - Maintaining Sydney's Beach Amenity Against Climate Change Sea Level Rise All costs are based on using Cape Banks as the borrow source. It is noted that the estimated volume of available sand at Cape Banks is approximately 10Mm 3 (based on a sand extraction depth of 5m) although reserves may be considerably greater. This will be close to being sufficient for the first nourishment campaign, but alternative borrow material will need to be sourced for subsequent nourishment campaigns. The extraction and delivery of 12Mm 3 of sand is likely to extend over a duration of 12 to 18 months. Sand extraction and nourishment techniques are discussed in subsequent chapters. Key Recommended Studies and Further Work Determination of sand composition on each of Sydney s ocean beaches. Determination of sand composition and sand volumes in identified offshore sand reserves. Identification of other offshore sand reserves. Refinement of depth of closure parameters. Revision C - 18 February
58
59 Chapter 5 Sand Extraction
60
61 Beach Sand Nourishment Scoping Study - Maintaining Sydney's Beach Amenity Against Climate Change Sea Level Rise 5.0 Sand Extraction Sand extraction at Providential Head and Cape Banks was proposed by Metromix Pty Ltd during the 1990 s. Community and political opposition to the disturbance of offshore sand deposits for commercial advantage were strong, and attempts by Metromix Pty Ltd to access the sand were denied. Extraction of offshore sands to maintain beach amenity may be met by greater community and political support. A brief description of the Metromix project is outlined below, followed by a discussion on extraction methodologies, potential physical impacts, potential ecological impacts and social considerations relevant to this project. Chapter Summary Based on the high wave energy operating environment and the sand extraction water depth limitations of the dredging plant, the Trailer Suction Hopper Dredge is the most suitable dredging equipment for this project. Many sand extraction projects around the world utilise this equipment, particularly if the sand placement area is some distance away from the extraction area. The Trailer Suction Hopper Dredge skimming technique is considered to be more environmentally friendly than other techniques, such as a Cutter Suction Dredge, because plume generation is minimised. The impacts of sand extraction on benthic invertebrates would be significant, but highly localised and short-term, persisting only until recolonisation occurred. Longer-term or wider scale ecological impacts are not expected. Mobile species, such as whales, fish and prawns, and large bivalves may be able to avoid the dredger extraction head by swimming away or burrowing, respectively. Within specified operating constraints it is considered that it would be possible to undertake any extraction configuration within extraction areas without any measureable physical impact on the shorelines. 5.1 The Metromix Marine Aggregate Proposal Metromix Pty Ltd proposed to extract sand from two separate areas of a large m deep sand body situated off the coast to the south of Sydney and deliver it to the Port Jackson terminal. The proposal included the extraction of 30 Mt of concrete grade sand and 39 Mt of finer-grained material for general construction purposes from an area of 7.4 km 2 situated approximately km off the coast between The Cobblers and Providential Head which varied in depth from 25-55m. Metromix also planned to extract 27 Mt of concrete grade sand and 24 Mt of finer grade sand from an area of 8.2 km 2 off Cape Banks, near the entrance to Botany Bay, which varied in depth from 43-65m (Corkery and Co. 1993). The sand would have been extracted by a Trailer Suction Hopper Dredge (TSHD) and stored in a 2000m 3 hopper inside the vessel until it could be offloaded. On site, the extraction head would have created a slurry consisting of approximately 90% seawater and 10% sand that would have been pumped up the suction pipe into the hopper, which would initially have been filled with ballast water drawn from Sydney Harbour. Approximately 30% of the water would have been retained with the sand the remainder would have been released into the sea via diffuser ports at a depth of about 15 m below the surface (Corkery and Co. 1993). Between 40 and 50% of the water retained in the sand would have been discharged into the ocean via a series of outlets in the vessel s hull en route to the offloading berth. The dredge would have needed to travel km over a period of about 2.5 hours to fill the hopper. It was expected that extraction and unloading together would take hours and that the vessel would make between 170 and 450 trips per year. The plan was to produce 0.6 Mt/yr of fine sand in the first five years of operation, 1 Mt/yr between years 6 and 10 and Mt/yr from year 11 onwards. Extraction of sand was set to continue for 25 years from Providential Head and for 24 years from Cape Banks. 5.2 Operating Constraints Weather The efficiency and selection of appropriate dredgers used to extract the sand will be constrained by adverse weather conditions and storm events. Offshore wave statistics for Sydney produced by Manly Hydraulic Laboratory (MHL) for the period of March 1992 to June 2009 are presented in Figure 5.1 as an exceedance graph. Modern medium to large Trailing Suction Hopper Dredgers (TSHD) can operate in swell waves of up to 3m height. In Sydney a 3m wave height is exceeded 5.4% of the time (Figure 5.1). This is equivalent to approximately 470 Revision C - 18 February
62 Beach Sand Nourishment Scoping Study - Maintaining Sydney's Beach Amenity Against Climate Change Sea Level Rise hours in a year. Lost operational time will be significantly greater than 470 hours when consideration is given to mobilisation, site establishment and storm duration Significant Wave Height (m) Percentage Exceedance (%) Figure 5.1 Sydney Wave Height Exceedance [Department of Environment, Climate Change and Water (DECCW) & Manly Hydraulics Laboratory (MHL)] Water Depths The selection of appropriate dredging plant will depend greatly on the water depths where the sand will be extracted. A modern Trailing Suction Hopper Dredger (TSHD) can dredge to water depths of up to 150m and a medium size TSHD up to 60m. The sand sources being considered in this study are in water depths of 25m to 55m (Providential Head), 30m to 70m (Cape Banks) and 20m to 60m (Bondi and Malabar). The central coast sand bodies are located in 50m to 100m water depth Operating Times Dredging activities of this magnitude are generally undertaken 24 hours a day, 7 days a week. A single nourishment campaign of this magnitude is likely to be conducted over a period extending beyond 12 months. Within the detailed design of a dredging schedule, consideration will need to be given to acceptance of nourishment practises during the peak summer period, environmentally sensitive periods (e.g. spawning times, migrating whales) and seasonal storminess Sailing Distances The distance from the most northern beach (Forresters Beach) to the most southern beach (Bate Bay) in the study area is 75km (Figure 1.5). The distance from the offshore sand body to each of the beaches will be reflected in the offshore sand body selected for extraction activities (Figure 4.4). The sailing distance will influence the total cycle time which consists of: dredging of sand, sailing to beach, sand placement and return to offshore sand body. An average sailing speed of 20km/hr and a single leg journey of 50km have been assumed for time and cost estimates. 5.3 Extraction Methodology Types of Dredgers Cutter Suction Dredgers (CSD) and/or TSHD s are the most appropriate dredging plant to be used for large scale sand extraction projects of this nature. The principal feature of all dredgers in this category is that the loosened material is raised from its in-situ state in suspension through a pipe system connected to a centrifugal pump. Various means can be employed to achieve the initial loosening of the material. If it is naturally very loose, suction alone may be sufficient, but firmer material may require mechanical loosening or the use of water jets. Hydraulic dredging is most efficient when working with fine materials, because they can easily be held in suspension. Coarser materials and even gravel can be worked, but with a greater demand on pump power and with greater wear on pumps and pipes. Revision C - 18 February
, by pumping its load ashore or by rain-bowing.")

63 Beach Sand Nourishment Scoping Study - Maintaining Sydney's Beach Amenity Against Climate Change Sea Level Rise Trailing Suction Hopper Dredgers (TSHD) A TSHD is a self-propelled vessel which fills its hold or hopper during dredging, while following a pre-set track. The hopper can be emptied by bottom doors or valves (dumping), by pumping its load ashore or by rain-bowing. This kind of dredger is predominantly used for extraction of unconsolidated sediments such as sands. An image of TSHD is shown in Figure 5.2. TSHD have a hull in the shape of a conventional ship, and are both highly seaworthy and able to operate without any form of mooring or spud. They are equipped with either single or twin (one on each side) trailing suction pipes. Material is lifted through the trailing pipes by one or more pumps and discharged into a hopper contained within the hull of the dredger. The measure of size of a hopper or trailer dredger is the hopper capacity. This may range from a few hundred cubic metres to over 20,000m 3. Increasingly larger vessels have been constructed in recent years to allow economic transport of the dredged material, especially for reclamation projects. The suction pipe terminates in a drag-head, which may be of the plain type or may incorporate a water jet system, blades or teeth, or other means of dislodging compacted material. The function of the drag-head is to allow the material to flow to the suction inlet as efficiently as possible. A B Figure 5.2 (A) Trailing Suction Hopper Dredger and (B) Cutter Suction Dredger A TSHD operates very much like a floating vacuum cleaner. It sails slowly (1-2 knots) over the area to be dredged filling its hopper as it proceeds. The accuracy of moving over a dredge area is enhanced by electronic displays in real time with information from an accurate Differential Global Positioning System (DGPS). On completion of loading the hopper, the TSHD sails to the disposal site with a sailing speed of knots where the dredged material can be discharged either by opening the doors or valves in the hopper bottom, by using the dredging pump to deliver to a shore pipeline, or directly to shore by using a special bow jet. This latter technique is known as rain-bowing and is commonly used for reclamation and beach nourishment. Some TSHD s split over their entire hull length to achieve a rapid discharge of material which may otherwise be difficult to discharge through doors. TSHD operate best by skimming off layers of material in long runs. The thickness of sand removed in each pass of the drag-head would be in the order of 300mm to 500mm. Cutter Suction Dredgers (CSD) A CSD is a stationary dredger which makes use of a cutter head to loosen the material to be dredged. It pumps the dredged material via a pipeline ashore or into barges. While dredging, the cutter head describes arcs and is swung around the spud pole powered by winches. The cutter head can be replaced by several kinds of suction heads for special purposes, such as environmental dredging. An image of CSD is shown in Figure 5.2. When the in-situ material is too compact to be removed by suction action alone, some form of mechanical loosening must be incorporated near the suction mouth. The most common method is a rotating cutter; the main feature of the cutter suction dredger. This is mounted at the lower end of the ladder used to support the cutter drive and the suction pipe. The loosened material then enters the suction mouth, passes through the suction pipe and pump (or pumps) and into the delivery line. Cutter suction dredgers operate by swinging about a central working spud using moorings leading from the lower end of the ladder to anchors. By pulling on alternate sides the dredger clears an arc of cut, and then moves Revision C - 18 February
64 Beach Sand Nourishment Scoping Study - Maintaining Sydney's Beach Amenity Against Climate Change Sea Level Rise forward by pushing against the working spud using a spud carriage. A generally smooth bottom can be achieved, and modern instrumentation allows profiles and side slopes to be dredged accurately. Some of the larger cutter suction dredgers are self-propelled to allow easy movement from site to site. The size of a cutter suction dredger is measured by the diameter of the suction pipe and by the installed machinery power. Pipe diameters are in the range 100 to 1500mm. A modern highly automated cutter suction dredger is capable of achieving high outputs over sustained periods and production rates of around 500,000m 3 per week are possible under good conditions. Cutter suction dredgers deliver the dredged material through a pipe-line. They may also be used simply as loosening devices for material to be re-handled by another type of dredger, in which mode, discharge is directly over the stern to the sea. Pipeline discharge is most common but is vulnerable to waves and currents and causes an obstruction to other vessels. To avoid these problems part of the pipeline may be submerged and laid on the channel-or sea-bed Recommended Dredging Method Based on the operating environment described in Section 5.2 and operational limitations of the dredging plant, the TSHD is the most suitable dredging method for this project. A TSHD can dredge to greater depths and operate in a higher wave climate than a CSD. Many sand extraction projects around the world utilise this method, particularly if the sand placement area is some distance away from the dredging area. The CSD method would require a number of self propelled hopper barges or tug propelled barges to transport the extracted sand. It is not practical to pump the sand long distances. The TSHD skimming method is considered more environmentally friendly than a CSD because plume generation is minimised. Typical TSHD and their capabilities considered suitable for this project are documented in Table 5.1. Table 5.1 Trailing Suction Hopper Dredgers TSHD Owner Hopper Capacity Dredging Depth Loaded Draft (m 3 ) (m) (m) Filippo Brunelleschi Jan de Nul 11, / 57.5 / Francis Beaufort Jan de Nul 11, / 57.5 / James Cook Jan de Nul 11, / 49.0 / Juan Sebastian de Elcano Jan de Nul 16, / Cornelis Zanen Boskalis 8, Seaway Boskalis 13, Lange Wapper Dredging International 13, / 41.0 / Nile River Dredging International 17, / Pearl River Dredging International 24, / 60.0 / Physical Impacts Physical impacts associated with the commercial extraction of sand at Providential Head and Cape Banks was undertaken by Geomarine Pty Ltd for the Metromix Marine Aggregate Proposal (MMAP) (Pollution Research 1993). Studies of extraction have shown that shoreline effects are dependent upon the depth of extraction and the water depth at which extraction occurs. The shoreline effects reduce dramatically and markedly with increasing water depth. The international experience is that extraction is commonly approved and undertaken in depths beyond the 18 to 25m isobath and it indicates universally that extraction can be undertaken safely beyond the 30m isobath. The extraction of marine aggregate from offshore of Cape Banks and Providential Head would result in minimal impact on the coastal processes of the region. Extraction would not alter the near-shore wave climates or current patterns. Consequently, there would be no measureable impact on the adjacent sandy beach areas or on the cliffed coastlines. The following outlines the potential impacts and physical constraints that were proposed with respect to the MMAP. Further details are provided in Appendix D. Extraction of sand offshore may affect the coastline in the following ways: If too close to the shore it may create a depression such that beach sediment is transported offshore (known as drawdown) into the extracted area. Revision C - 18 February
65 Beach Sand Nourishment Scoping Study - Maintaining Sydney's Beach Amenity Against Climate Change Sea Level Rise An offshore bank may protect the coastline, scattering or absorbing some of the wave energy, and the removal of such a barrier may result in beach erosion. The locally increased depths may alter the angle of incidence of waves and distribution of wave energy approaching the adjacent beaches thereby resulting in erosion and accretion. The removal of offshore sediment may deprive the coast of a natural source of sediment Generalised Physical Constraints for the Design of Extraction Configurations The coastal engineering criteria established for the design of the proposed extraction configurations, in conjunction with criteria from other specialised studies, led to the following generalised constraints: The near-shore depth limit for extraction off the rocky cliffed coast be the 25m isobath. The alongshore extent of extraction to the 25m isobath be beyond 1.5km of the end of a beach. The inshore limit of extraction directly off beaches be the 35m isobath. Extraction depth be limited to 5m below the natural surface Allowance be made for initial batter slopes around the extraction configurations to develop to 1:20. Adequate buffers be left around shipwrecks and from reefs. Within these constraints it was considered that it would be possible to undertake any extraction configuration within the proposed extraction areas without any measureable impact on the shorelines Potential Impacts of the Metromix Marine Aggregate Proposal The potential impacts of the Metromix project on coastal processes were categorised by Geomarine (1993) as follows: Effects on wave climate. Effects on tidal currents. Changes to the coastline. Effects on Inner Shelf sediment transport Wave Climate The wave climate studies are summarised as follows: The proposed extraction plans were designed so that any perturbations to the long term near-shore wave climate that may be occasioned by extraction would be an order of magnitude smaller than the natural variations in the average wave climate that are experienced annually on the sandy shorelines of the study region and, as such, would not be discernible nor would they be able to be measured. That is, the extraction plans proposed would have no measureable effect on the long term wave climates of the beaches. The proposed extraction plans would cause no measureable change to the effects that storms may have on the beaches of the study region. The changes that the extraction may cause to the shoreline wave energy along the rocky shore would be far smaller than the natural fluctuations of wave energy experienced and would not be discernible or measureable. The proposed extraction plans would have no discernible effect on the wave climate across the entrances to Botany Bay or Bate Bay-Port Hacking and, hence, to the beaches within Botany Bay, Bate Bay and Port Hacking Tidal Currents While extraction would have a localised effect on currents within the extraction areas there would be no change to the general current structure in the study region nor would there be any change to the tidal currents at the entrances to Botany Bay and Port Hacking. Within the extraction areas the currents would be reduced in speed slightly Coastline The sand extraction proposed would have no impact on beach processes. The proposed extraction areas are well seaward of the littoral zone and are outside the depth of offshore sand transport under extreme storm events. Changes to the wave climate at the shoreline resulting from the propagation of waves across the proposed Revision C - 18 February
66 Beach Sand Nourishment Scoping Study - Maintaining Sydney's Beach Amenity Against Climate Change Sea Level Rise extraction area would be negligible and would be an order of magnitude less than the average changes that occur naturally on the beaches on an annual basis in response to changing weather conditions. There would be virtually no changes made to the beaches. It should be anticipated that the beaches in the study region would undergo large fluctuations in response to future storms. Further, with a scenario of an increasing sea level as a result of a greenhouse warming, there could be an increased propensity for all the beaches to be eroded more severely and more frequently during storm events. This erosion would in no way be exacerbated by the aggregate extraction proposed. There would be no measurable changes to wave heights or directions along the rocky shorelines as a result of the extraction proposed. It is proposed that 250m buffers be left off the reef edge. Extraction offshore, therefore, would not affect the reef sand levels at the toe of the reef for several hundred years, at which time there would begin a slow lowering of the sand levels against the reef. The side slopes of this depression could not migrate onshore as they would be contained by the proximity of the reef Inner Shelf Extraction of 5m of sediment over the proposed extraction areas would reduce wave and current actions at the seabed where extraction occurs. However, because the sediments at depth are, generally, finer than those at the surface there would be little effect initially on the rates of shelf sediment transport following extraction. In the longer term, however, the natural armouring of the surface of the seabed that would occur with the winnowing of the finer fractions in the sediments within the extracted areas and with the transport into the extracted areas of the coarser sediments from without would result in a reduction of sand transport rates over the extracted areas. This would result in a very slow infilling of the extracted areas and flattening out of the batter slopes. Because the rates of sand transport assessed for the Cape Banks extraction area were very low, the effects of extraction would occur slowly. For the differential rates of transport considered above, the tops of the batter slopes would translate at very low rates calculated to be 0.1m/yr. The centrelines of the batter slopes would translate at even lower rates calculated to be 0.025m/yr. There would be no effect on the sand transporting processes at the entrance to Botany Bay or at the adjacent beaches. The dredged depression would remain stable for millennia. The rates of sand transport calculated over the extraction area at Providential Head indicated that the extracted configuration would remain stable for very many years and there would be no change to the long term wave refraction patterns or sand transport processes relating to the beaches. For example, the time period required for the top of the batter-slope in 25m water depth to extend to a position offshore of Marley Beach was calculated to be in excess of 1,500 years. Even by this time there would still be no effect on the beach. Further, there would be no effects from changing refraction patterns on Marley Beach (or any other beach adjacent to the proposed extraction area) as the rates of movement of the centrelines of the batter-slopes would be very much lower. In respect of onshore/offshore sand transporting processes, offshore of Marley Beach, where extraction to the 35m isobath is proposed, the top inshore edge of the dredged depression would move shoreward as the batter slope flattens out (given that the bed becomes armoured with coarser sediment). Such a process would continue until the bed slope of the batter coincides with the natural bed slope off the beach. The time required for this to occur was calculated to be in excess of some 3,000 years at which time the slope would be stabilised. That the point of intersection of the flattening slope would coincide with the limit of offshore sand transport at Marley Beach (after a period of 3,000 years) indicated that extraction to 5m at the 35m isobath would have no effect on beach drawdown even over these time scales. Potential drawdown along the cliffed coastline is limited by the extent of rock reef along the 25m isobath. Because of the depths of the shipwrecks in the immediate vicinity of the proposed extraction areas (the SS Woniora and the SS Tuggerah) and the adoption of a 250m buffer around these wrecks, there would be virtually no possibility, on coastal engineering grounds, of extraction within the proposed areas disturbing the stability of these wrecks. 5.5 Ecological Impacts Ecological impacts associated with the commercial extraction of sand at Providential Head and Cape Banks was undertaken by The Ecology Lab Pty Ltd in 1993 for the Metromix Marine Aggregate Proposal (Pollution Research 1993). Cardno Ecology Lab (2009) prepared a subsequent report for this study. While similar quantities of sand are estimated for extraction in this scoping study, a key difference from an operational and environmental perspective is the schedule of the works. For the MMAP, the extraction programme was relatively evenly spread Revision C - 18 February
67 Beach Sand Nourishment Scoping Study - Maintaining Sydney's Beach Amenity Against Climate Change Sea Level Rise over a 25 year period. For this sand nourishment programme, it is envisaged that activity will be high for a one to two year period, interspersed by non-activity for the following 10 years. This may have environmental implications that were not addressed within The Ecology Lab Pty Ltd (1993) marine ecological investigations. The following outlines the environmental impacts associated with the MMAP, together with a review of recent overseas studies on potential impacts arising from sand extraction projects. Further details are provided in Appendix E Potential Impacts of the Metromix Marine Aggregate Proposal The potential impacts of the Metromix project on marine habitats, biota and resources off the coastline adjacent to Sydney were identified and evaluated by Cardno Ecology Lab (2009). The following categories of potential impacts were identified: Potential Impacts Associated with Sand Extraction Marine Habitats The extraction head of the trailer suction dredge would initially create a furrow approximately 1.7m wide and 0.2m deep along the seabed (Corkery and Co. 1993). It was estimated that hectares of the seabed would be disturbed per trip and that the upper layer of the sand over an area of 2-5km 2 would be removed annually. The area disturbed per trip would be equivalent to 0.007% of the sandy inner shelf sediments between Broken Bay and Garie North Head and to less than 1% of these sediments over a three month period (Corkery and Co. 1993). The interval before an area would be re-extracted would vary from at least two years in the early stages of the operation to not less than 3 months near the end of extraction. The re-extraction of areas of seafloor would have resulted in a mosaic of patches in the following states: Never disturbed by extraction. Disturbed once. Disturbed more than 3 months previously. Disturbed within the previous 3 months. The sediment that would have been exposed would be similar to that occurring on the surface of the sand body, except for the lack of living organisms and probably having less organic matter (The Ecology Lab 1993). The sediment would, however, be slightly finer in areas from which Grade 2 marine aggregate was extracted (Corkery and Co. 1993). Sand extraction was not expected to expose any bedrock, because the sand body is 20-30m deep. The depth of the sand body within the two extraction areas would have been reduced by 5 m by the end of the extraction period. It was predicted that the edges of this depression would gradually flatten over thousands of years. According to Corkery and Co. (1993), the creation of the depressions on the seafloor would have negligible impacts upon regional bathymetry. The existing isobaths would move shorewards by km, which was considered negligible on a local scale. The effects of sand extraction on the coastline and on movement of sediment on the seabed were also considered (Geomarine et al. 1993). These studies indicated that extraction would have no measurable effects on beaches, coastal erosion, wave energy on rocky shores or coastal processes at Cape Banks. Revision C - 18 February


68 Beach Sand Nourishment Scoping Study - Maintaining Sydney's Beach Amenity Against Climate Change Sea Level Rise Marine Biota The powerful suction generated at the extraction head would pump the upper 20 cm layer of sand, and most of the associated benthic invertebrates and small sedentary and/or burrowing species of fish occurring directly below or immediately adjacent to the track of the head, up into the hopper on board the dredge (Cardno Ecology Lab 2009). Mobile species, such as whales, fish and prawns, and large bivalves may be able to avoid the extraction head by swimming away or burrowing, respectively. Some of the organisms extracted would be released back into the sea with the excess water, however, not all would survive because of the change in water pressure, abrasion against the sand, impact with the screens, deposition into unsuitable habitat or consumption by predators such as fish. Other organisms would be returned to port with the sand. The removal of organisms would change the structure of benthic assemblages, affect their ability to recovery from natural disturbances and result in a net loss of benthic productivity. The impacts on benthic invertebrates would thus be significant, but highly localised and short-term persisting until recolonisation occurred (Cardno Ecology Lab 2009). Longer-term or wider scale impacts were not expected, because: Less than 25% of the extraction area would be disturbed at any one time. A physical disturbance experiment indicated that recolonisation by macroinvertebrates would occur within two to three months. Sediments exposed by the extraction process would be similar to those occurring on the surface. The potential for smothering of organisms by fines in the excess water returned to the sea would be minimal. The Cardno Ecology Lab (2009) did, however, point out that the rate of recolonisation may change as the area of undisturbed seabed containing a potential source of new recruits declined. Figure 5.3 Port Jackson Shark and a Spotted Stingray (Chris Roberts, Cardno Ecology Lab) The relatively small area of seabed that would be disturbed at any one time and likely rate of recolonisation by benthic invertebrates indicated that there would be a minimal, localised reduction in potential benthic food resources for fish. There was no evidence that the proposed extraction areas were significant spawning or nursery grounds for fish. Impacts on demersal fish assemblages were consequently predicted to be small-scale and short-term. It was, however, noted that the eventual 5m increase in depth of the seabed might lead to assemblages in shallower parts of the extraction area becoming more similar to those in deeper water. If these assemblages include more species of economic value, this long-term, large-scale impact could be beneficial to local fisheries. The impacts of the plume generated by the extraction head as it passes over the surface of the seabed were not assessed, because it was predicted that this plume would be negligible due to the strong suction generated at the extraction head (Lawson and Treloar 1993) Potential Impacts Associated with Disposal of Excess Water According to Corkery and Co. (1993), the release of excess water and fine sediments into the sea would generate an underwater sediment plume up to 170m wide behind the dredge. This plume would disperse rapidly and be transported by ambient currents parallel to the coast or offshore. Lawson and Treloar (1993) estimated that the concentration of suspended fines would approach 9000 mg L -1 at the outlet pipe, but would be diluted by a factor Revision C - 18 February
69 Beach Sand Nourishment Scoping Study - Maintaining Sydney's Beach Amenity Against Climate Change Sea Level Rise of 18 within 35 m of the discharge points and would drop to < 9 mg L -1 at a distance of 1.5 km behind the extraction vessel. Given the proposed sub-surface release of excess water, rapid dispersion of the plume over a large area and large size of the coastal water body relative to the plume, Cardno Ecology Lab (2009) made the following predictions about impacts on marine biota in the water column: The plumes would be unlikely to have any detectable effects on primary productivity, except possibly at small spatial and temporal scales. The potential for impacts on plankton would be further reduced by the sub-surface release of the excess water. Clogging of the respiratory and feeding appendages of organisms would be limited to very small spatial scales. The migration of fish, prawns and marine mammals would not be affected. The decrease in water clarity would be unlikely to affect the foraging activities of seabirds. Lawson and Treloar (1993) indicated that the maximal annual average settlement of the fines released in the excess water would not exceed < 1 mm of sediment. On the basis of this low deposition rate, the fact that the settling fines would have originated at the site and relatively high energy nature of the Sydney coastline it was predicted that deposition of fines would have minimal effects (Cardno Ecology Lab 2009). This reflected the fact that survival of burial is greater when the settling material is comparable to that on the seafloor, the ability of burrowing organisms to withstand sedimentation and the fact that storms often resuspend greater amounts of sediment. The assessments undertaken by Pollution Research (1993) indicated that the release of contaminants and nutrients from the plume into the water column would not be significant. The Cardno Ecology Lab (2009) consequently predicted that there would be no increase in potential for bioaccumulation of contaminants and no detectable increase in primary productivity due to the release of nutrients into the water column Potential Impacts Associated with Operation of the Extraction Vessel The generation of noise would be limited to that associated with the day to day movements of the dredge and use of a suction pump to transfer the slurry into the hopper (Corkery and Co. 1993). The levels of noise generated by these sources were considered relative to what was known at that time about the effects of noise on marine organisms. Heggie et al. (1993) concluded that the noise of the extraction machinery would be attenuated by background shipping noises and that noise generated by the vessel steaming to and from the extraction area each day would not cause a significant change in existing ambient underwater noise levels. This was due to the relatively high density of shipping activity and likely presence of other vessels within the possible zone of influence or audibility of the extraction vessel. The extraction vessel would move at similar speeds (12 knots) to other vessels when moving between the terminal and extraction area, but would be moving at about 1 knot during extraction and therefore likely to be avoided by most marine mammals, reptiles and seabirds (The Ecology Lab 1993). The potential for impacts with marine mammals would also be limited by curtailing activities within the extraction area or by the vessel steaming away from them. It was also recognized that impacts could arise as a result of an accident, loss of the vessel, discarding of wastes or accidental spillages, but the likelihood of these could be reduced by adopting appropriate management practices. No additional impacts would be expected in relation to the present scoping study Potential Conflicts with Users of Other Marine Resources The waters off Providential Head and Cape Banks are utilised by a variety of other groups, including commercial and recreational fishers and divers. The Ecology Lab (1993) considered the potential for conflict between sand extraction and commercial fishing to be low, because fishing rarely took place in the proposed extraction areas and extraction was expected to have neither short- or long-term impacts on the marine ecosystem or fish stocks. The potential for conflict with recreational fishers and divers was considered to be low, for the following reasons: They could continue to access the extraction areas and their surrounds. Fish stocks and biodiversity would be maintained during and after sand extraction. The vessel would be in each extraction area for a relatively small time. Revision C - 18 February
70 Beach Sand Nourishment Scoping Study - Maintaining Sydney's Beach Amenity Against Climate Change Sea Level Rise Sand would not be extracted on weekends or during public holiday. The willingness of Metromix to develop a Code of Practice in conjunction with other user groups Relevant International Projects In the past decade, a number of studies have been undertaken overseas on the effects of offshore sand extraction. In the United States, site-specific, inter-disciplinary baseline studies have been carried out in potential offshore borrow areas (Byrnes et al. 2004a and b; Diaz et al. 2004; Maa et al. 2004) and a comprehensive physical and biological monitoring programme has been developed to evaluate the long-term impacts of sand dredging on the outer continental shelf (Nairn et al. 2004). In Europe, changes in the structure of benthic assemblages and physio-chemical environment resulting from the extraction of marine aggregates have been documented (Newell et al. 1999; Desprez 2000; Sarda et al. 2000; van Dalfsen et al. 2000; Nonnis et al. 2002; Newell et al. 2004). The major findings from some of the studies on impacts of aggregate extraction are highlighted below United States Nairn et al. (2004) prepared a comprehensive literature review of the potential impacts of sand extraction on the continental shelf environment for the U.S. Minerals Management Service. Their review indicated that plankton, benthic assemblages associated with soft and hard substrata, nekton, marine mammals and wildlife were the components that could potentially be affected by sand extraction. Impacts on plankton, fish and marine mammals were expected to be minimal and of short duration, because the plumes created by dredging operations were very small and temporary. Impacts on hard substrata were not expected, because these areas would either be avoided or surrounded by large buffer zones that would prevent discharges from dredging having any impacts. The impacts on biota that were identified were essentially the same as those highlighted in relation to the Metromix proposal (see Section 3.0), except for the following: Discharge from the cutter-head and changes in ridge morphology could alter sediment particle size composition and change nearfield habitat conditions, which, in turn, could have an impact on the composition and structure of assemblages in nearfield areas. Recolonisation by an altered benthic assemblage could alter productivity and energy transfer pathways in the food chain, which, in turn, could alter the composition of prey organisms available to fish and adversely affect the foraging efficiency of fish and other mobile predators. The evaluation of physical and biological impacts led to the recommendation that sediment sampling and analysis, wave monitoring and modelling, bathymetric and substratum surveys, shoreline monitoring and modelling, benthic assemblages and their relationships to fish, marine mammals and wildlife be included in monitoring programmes. Nairn et al. (2004) suggested that the benthic monitoring programme should focus on trophic energy transfer between the benthos and representative species of fish, because removal of sand and the resultant changes in substratum type and composition, surface texture, water circulation and nutrient distribution would affect benthic assemblages and the organisms that rely on benthic resources for food Europe The studies undertaken in European waters provide some indication of the types and quantities of organisms lost through dredging, rates of recolonisation and recovery of benthic assemblages after dredging. A review of the impacts of dredging works on a variety of coastal habitats including muddy embayments, lagoons and oyster shell deposits in the USA and sand and gravel deposits in the North Sea indicates that species richness may be reduced by 30 70% and that the number of individuals and biomass in dredged areas may be reduced by 40 95% (Newell et al. 1998). There is also evidence of declines in catch and drastic reduction of stocks of bivalves exploited by artisanal and commercial fishers after dredging (Sarda et al. 2000; Van Dalfsen et al. 2000). The impact of dredging is also likely to vary with the intensity of disturbance in a particular area and the degree of disturbance of the sediment. In gravel deposits, the level to which the benthos is reduced by anchor dredging depends on whether samples coincided with the middle of a dredge pit and the number of days elapsed since dredging (Newell et al. 2004). It should be noted that in the Metromix project sand would have been extracted from strips of seabed, the underlying sediments would have had a similar composition to those on the surface and a large proportion of the extraction area would have been relatively undisturbed. This would facilitate benthic recolonisation from adjacent areas, so the ecological effects would probably be less severe than those associated with the use of anchor dredgers. There is also a potential for impacts on marine organisms resulting from the sediment plumes generated by marine aggregate extraction operations. Extensive plumes may develop in areas where screening of aggregate Revision C - 18 February
71 Beach Sand Nourishment Scoping Study - Maintaining Sydney's Beach Amenity Against Climate Change Sea Level Rise occurs and the impacts of these plumes may be more significant in deeper water where benthic assemblages are less exposed to natural disturbances of their sedimentary regime (Hitchcock and Bell 2004). Trailer suction dredges are likely to cause a much reduced plume at the suction head, because the dredging action creates a slurry that entrains sand and fine materials. The physical impact of the material washed out through hopper overflow spillways and reject chutes on trailer suction dredgers depends on the amount and grade of deposit that is rejected by screening. The inorganic particulate load that is discharged generally settles a few hundred metres from the point of discharge. Outwash can lead to the generation of surface slicks which may extend several kilometres beyond the dredging site. There is evidence that these surface plumes may be associated with organic enrichment generated by fragments of marine benthos that are discharged in outwash water (Newell et al.1999). It has been hypothesized that such plumes may contribute to the enhanced benthic species diversity and population densities noted in deposits surrounding dredged areas (Newell et al. 2004). Recolonisation of dredged areas is generally relatively fast, occurring within a few months of the cessation of sand extraction. This is due to the rapid increase in opportunistic species (Sarda et al. 2000; van Dalfsen et al. 2000; Newell et al. 2004). Recovery of benthic assemblages to comparable pre-dredging conditions, however, takes much longer with sites in the North Sea showing recovery within 2-4 years and those in the Mediterranean expected to take even longer (Van Dalfsen et al. 2000; Sarda et al. 2000; Newell et al. 2004). In the North Sea, species diversity in the extraction area generally returned to within 70-80% of that in surrounding sediments within 100 days, but restoration of population density and biomass to similar levels took 175 days and more than 18 months, respectively (Newell et al. 2004). There is also evidence of recovery resulting in assemblages that are quite different in structure from that originally present, due to infilling of tracks with much finer sediment than was originally present (Van Dalfsen et al. 2000). The rate of recovery of infaunal assemblages depends on successful recruitment of larvae and immigration of mobile species, local hydrological conditions and the degree and duration of changes in sediment composition caused by sand extraction (Van Dalfsen et al. 2000). It has also been noted recovery is faster within narrow trailer-dredge tracks than in larger pits in the seabed caused by anchor-dredging (Newell et al. 2004). Newell et al. (1998) pointed out that benthic assemblages characterised by long-lived, slowgrowing species with a slow rate of reproduction will probably take longer to recover species diversity and population density, and to restore biomass by growth of individuals. Assemblages of this type are typical of stable deposits in low-energy environments and areas where deposits are coarse. In areas that are subject to frequent environmental disturbances, assemblages will be dominated by opportunistic species (Newell et al. 2004). Hydrodynamic conditions and rates of sediment transport also influence the recovery of the seabed environment. In deeper water, where conditions for regular redistribution of sediment are scarce, there is evidence of physical changes in the substratum persisting for long periods and of recovery being dependent on irregularly-occurring severe storms (Van Dalfsen et al. 2000). 5.6 Social Impacts Social impacts associated with the extraction of sand (in general and for beach nourishment purposes) have been explored via desktop research and a review of previous studies. The following summary on international exploration and mining experience has been extrapolated from a study undertaken by Commonwealth Scientific and Industrial Research Organisation (CSIRO) to explore the social dimensions of expanding the seafloor exploration and mining industry in Australia (CSIRO, 2007). An account of social acceptance of sand extraction within the Australian context has also been outlined Literature Review International Experience Within the South Pacific Region there is strong government support for seafloor mining and exploration in New Zealand, particularly for the seafloor mineral sand resources. Licences are currently granted under the Continental Shelf Act 1964 which has no system for undertaking environmental impact assessments or engaging the public. Seafloor mineral resources are being explored in Papua New Guinea, Tonga and Fiji, however it appears environmental issues are being addressed through applying regulatory framework relevant to land mining. Japan is adjacent to a number of areas with high potential for future deep seabed mining and seafloor mining and has been exploring both its exclusive economic zone (EEZ) and extended continental shelf (ECS) for these resources. Current exploration work is being carried out under land-based laws in the absence of specific marine minerals law. Revision C - 18 February
72 Beach Sand Nourishment Scoping Study - Maintaining Sydney's Beach Amenity Against Climate Change Sea Level Rise Within the European Union (EU), particularly the UK, Denmark, the Netherlands and France, significant sand and gravel resources exist along the North European Inner Continental Shelf. Exploration and mining of marine aggregates in this area is undertaken through a well organised system and has come about as a result of immense pressure on land resources and the relative ease of cross-border markets with the introduction of the EU. Environmental impact assessment appears to be a strong requirement of seafloor mining in the EU, with the level of requisite assessment proportional to the size of the project. The mainland United States has a rich resource base, however there is no mining for resources other than sand. There has been a recent shift in focus to mining for resources other than sand with the creation of a new marine regulatory framework. Namibia and South Africa in southern Africa both have a well established marine mining industry, predominantly focused on diamonds. Any risk to the industry as a result of a lack of social acceptance appears to be minimal, however the southern African mining industry does suffer from conflict interactions with recreational and fishing industries. Brazil is actively engaged in exploration of its EEZ although it is not a highly prospective area. India is one of the only countries in the world which has specific legislation related to marine mineral mining and the government is strongly committed to exploiting all available sources within its EEZ. Parallel with technological advances for seabed mining there is an emerging market for exploration in areas outside EEZs. A number of groups currently hold seabed exploration contracts with the International Seabed Authority (ISA). On a global scale, with the exception of information that has come from the EU, it appears that seabed mining is a relatively immature industry and due to lack of a specific marine regulatory framework in most countries, environmental assessment and public participation is severely limited. As such, on a global scale, social acceptance of seafloor mining appears to be largely undocumented at this point in time Australian Experience The Australian Offshore Minerals Location Map (the result of a collaborative project between GeoScience Australia, CSIRO s Wealth from Oceans Flagship and Division of Exploration and Mining, and each of the State and Northern Territory Geological Surveys) indicates that there is a wide range of minerals and commodity types located off Australia s coast in both the near-shore and deep-water environments. Various applications have been made to extract these minerals for commercial purposes in recent years with little success. One such application by Metromix was refused in the mid 1990s on grounds of significant environmental and perceived social impacts. CSIRO has recently conducted three research components to investigate the social dimensions of seafloor exploration and mining, including a desktop study of international experience in this area, an overview of the Australian context, and a series of stakeholder meetings and community workshops. The focus of the research was on marine mining and extraction of material, rather than the end use of material. Despite this, much of the discussion appeared to focus on extracting material for commercial purposes with limited discussion surrounding the option of using the material for beach nourishment. Furthermore, the focus of the research was on extracting material from Commonwealth waters due to the current opposition by NSW Government on seafloor mining in State waters. In general, it has been observed that the people who have participated in workshops and meetings to date have been fairly non committal, although the overall response to seafloor mining has been positive. The main concerns have centred on environmental impacts predominantly due to the lack of knowledge about their extent. Another concern was raised: ensuring any material that is extracted is used for Australian purposes and not exported for use overseas. A future research programme may involve a study to explore the potential environmental impacts associated with seafloor mining. The study would involve dredging specified volumes in a test study area within the marine environment and monitoring the environmental impact (Jo Parr, CSIRO, pers. comm. 28 October, 2009). Overall, the findings of the research undertaken by CSIRO indicate significant data gaps which have the potential to lead stakeholders to make negative, reactionary and uninformed responses. CSIRO concluded that there are three key areas that require further action if the seafloor exploration and mining industry in Australia is to expand: Build an information database. Enhance communication between stakeholders. Improve understanding of the policy and legislative process. Revision C - 18 February
73 Beach Sand Nourishment Scoping Study - Maintaining Sydney's Beach Amenity Against Climate Change Sea Level Rise At this stage there is no planned research that will focus on social acceptance of seafloor mining for amenity enhancement such as beach nourishment. Although the end purpose of the resources targeted for the present study differs to the CSIRO research (i.e. for beach nourishment as opposed to commercial purposes), it is felt that in the absence of any specific research, many of the findings of the CSIRO study would be relevant for this study, particularly with respect to the three key areas that require further investigation. Key Recommended Studies and Further Work Community education and consultation on the requirement to use offshore sand reserves. Formation of working group/s with key stakeholders. Update ecological impact studies associated with extraction activities. Revision C - 18 February
74
75 Chapter 6 Nourishment Technique
76
77 Beach Sand Nourishment Scoping Study - Maintaining Sydney's Beach Amenity Against Climate Change Sea Level Rise 6.0 Nourishment Technique The beach nourishment method can be a land based operation, an offshore operation or a combination of both. Each method has engineering and operational constraints that influence the duration, cost and effectiveness of the nourishment campaign. Environmental, business and social implications are also major considerations in selection of the preferred method. This section addresses aspects associated with beach nourishment methods and concludes with a recommended sand placement approach. Chapter Summary From an engineering and economic perspective, beach nourishment utilising offshore placement (profile nourishment) is the simplest, natural and most cost-effective solution. Environmental impacts are likely to be kept to a minimum using this method, with the volumes of nourishment sand placed offshore of the same order of magnitude as the storm demand (sand moved offshore) during a severe storm. An offshore nourishment programme would not require beach closure and, therefore, most social and business activities would continue without disruption. 6.1 Operating Constraints Beach Closure The frequency and duration of any potential beach closure are major considerations in the development of a successful sand nourishment campaign. If sand is to be pumped directly onshore and groomed with earth moving equipment, access to the beach will be restricted during operations. Consideration would also need to be given to the time of year that nourishment activities could be conducted. For example, high usage summer periods would be a less desirable nourishment time than lower usage winter periods Weather The wave climate is an important operational consideration in the development of a sand nourishment campaign. Both land-based (sand pumped onshore) and offshore (shallow water placement) sand nourishment techniques will be affected by the wave climate. Therefore, the selection of the one nourishment technique over another is relatively independent of the wave climate. However, in both cases the wave climate will influence costs of the overall project. While sand extraction activities are limited to a significant wave height of 3m, nourishment activities will need to be temporarily halted when the significant wave height exceeds 2.5m due to the use of smaller vessels Water Depth The near-shore water depth and slope governs how close to the shoreline the dredgers and hoppers can approach. Distances that sand slurries will need to be pumped will be based on water depth criteria. 6.2 Sand Placement Methods The following outlines sand placement methods for beach nourishment campaigns Offshore Placement For large sand volumes, placement of sand offshore is usually the most efficient and cost-effective method. Offshore placement of sand is by TSHD s, split-hopper barges or spreader pontoons. Offshore sand placement using a TSHD is shown in Figure 6.1. The concept behind the method is to deposit the material in shallow water and allow it to be transported towards the beach by coastal processes. Hands and Allison (1991) have reviewed a number of offshore nourishment projects and found that if the deposited depth is less than the closure depth, the deposited sand will move landward. Although offshore placement may be more economical, it does not provide the level of protection to upland property that direct on shore placement can. It is expected that an offshore placement campaign would need to also incorporate a beach grooming (scraping) programme. Revision C - 18 February
 Temporary offshore mounds of sand are likely to persist for short periods following the nourishment campaign.")
.")
78 Beach Sand Nourishment Scoping Study - Maintaining Sydney's Beach Amenity Against Climate Change Sea Level Rise Figure 6.1 Offshore Sand Nourishment (Photo Cronulla Beach 1998/99) Temporary offshore mounds of sand are likely to persist for short periods following the nourishment campaign. This may lead to short-term changes in near-shore wave breaking and wave refraction until the nourishment sand is redistributed. The volumes of nourishment sand are of the same order of magnitude as the storm demand for a large storm (e.g. 100 year storm). Therefore, short term changes in near-shore wave breaking and wave refraction (following nourishment) would be similar to that experienced following a large storm Onshore Placement Onshore sand placement is the most frequent method used for beach nourishment. Sand is placed along the length of beach to be improved. The sand is normally delivered to the shore via a pipeline or directly sprayed on to the shore (rainbow) from the dredger. Rainbow spraying can be restricted by water depth and vessel manoeuvrability close to shore. Pipeline delivery is used where there is insufficient water depth for the TSHD to manoeuvre close to the shore. Sand dredged using a CSD from nearby areas can be delivered via a pipeline to the shore. Booster pumps are normally used to pump sand from a greater distance. Onshore nourishment campaigns using pipeline and rainbow delivery methods are shown in Figures 6.2 and 6.3. Figure 6.2 Nourishment Campaign Using Pipeline Delivery Method The sand delivered to the shore is groomed using earth moving equipment to the desired design profile. Reshaping of the final design profile by coastal processes will also occur with some sand moving offshore. At the completion of the nourishment programme the beach width will reduce when some of the nourishment sand moves offshore to create an equilibrium profile. A common public misconception with this method is that this reduction in beach width is often perceived as a failure. Figure 6.3 Nourishment Campaign Using Rainbow Delivery Method Revision C - 18 February
79 Beach Sand Nourishment Scoping Study - Maintaining Sydney's Beach Amenity Against Climate Change Sea Level Rise Beach Scraping Beach scraping is artificial re-profiling or grooming of the beach using existing beach sediments. Sediments are scraped using dozers from the low water mark at low tide and placed at the back of the subaerial beach to form or improve the dune system. Beach scraping is amongst the cheapest beach maintenance plans. However, the process may have to be carried out several times before the right profile is achieved. 6.3 Environmental Impacts Sandy beaches provide habitats for a surprisingly high diversity of plant and animal species (McLachlan and Brown 2006). Most are small, buried and inconspicuous, but many achieve densities exceeding 10,000 per square metre (Jones et al. 1991). A few have commercial or conservation significance (e.g. donacid clams, onuphid beachworms, various birds, penguins). Consequently, beaches are far from the ecological deserts of popular belief. It is likely that the largest ecological effects of nourishment will occur in the near-shore environment where the spoil will be deposited. Given that inter-tidal species a) live within the sand, b) can probably survive some degree of burial (Maurer et al. 1986) and c) are adapted to sediment disturbance by waves, any nourishment effects on the inter-tidal biota are likely to be small if sand gradually accretes to the beach face via wave action. However, if sediments move rapidly and are contoured by bulldozing, effects may be substantial (Peterson et al. 2000). A detailed description of environmental impacts together with a review of available literature is provided in Appendix F. In Australia, the ecological consequences of inter-tidal and subaqueous nourishment are virtually unknown, with published studies limited to Jones et al Relatively little is known about: Australia s sandy beach and shallow subaqueous invertebrate and algal assemblages. The effects of deposition on subaqueous, near-shore biota (virtually no information). The effects of sand re-distributed from subaqueous near-shore deposition on inter-tidal biota (no information). Changes to beach morphology induced by nourishment and the consequences for the inter-tidal biota. The ability of biota in borrow sediments to survive the sediment transfer process. The effects of any translocated biota on existing biota. Long-term ecological recovery. The cumulative effects of repeated nourishment. Indirect trophic effects on birds and fish. Best-practice protocols Inter-tidal Habitat Impacts In general, nourishment affects both functional (e.g. trophic cascades) and structural (e.g. changes to population abundances and species richness) aspects of the shore ecosystem. Effects may be direct (e.g. benthos killed by burial) or indirect (e.g. shorebirds or fish affected by the shortage of benthic prey or loss of nursery or nesting areas) (Nelson 1993a, Peterson et al. 2006). Most international nourishment research has targeted the effects of the deposition of sediments on inter-tidal macrofaunal assemblages (Menn et al. 2003) or populations (Jones et al. 2007). The immediate impacts are usually very large, either by assumed burial, by emigration or miss-matched sediment. These effects may be compounded by changes to the beach morphology. For example, steepening of the foreshore creates a more reflective beach and such beaches are usually poorer in species richness and abundance than dissipative or intermediate beaches (McLachlan and Brown 2006). The engineering process itself may also have ecological effects. For example, visual and noise disturbance can affect the nesting and foraging of birds. Bulldozing to contour beaches may destroy dune vegetation and cause compaction of sediments. Revision C - 18 February
80 Beach Sand Nourishment Scoping Study - Maintaining Sydney's Beach Amenity Against Climate Change Sea Level Rise Recovery Since beach nourishment constitutes a pulse disturbance (Bender et al. 1984), recovery is highly likely unless the habitat is greatly changed or the process is repeated at short intervals. Unfortunately, recovery is less well studied than immediate impact but available information suggests that it can occur in weeks or months rather than years (Speybroeck et al. 2006). A major factor affecting the speed of recovery is the matching of sediments i.e., whether the nourishment sand is similar to the original beach sand (Speybroeck et al. 2006). Imported sediments that differ in having more shell hash or fines may cause long-term impacts. Other factors influencing recovery rates include the depth of deposited sediment, the availability of interspersed refuges and seasonal timing. It is also reasonable to suppose that sandy beach species are adapted to recovering from severe physical disturbances because storm events have been a frequent feature of their evolutionary history (Hall 1994) and rapid post-storm recovery has been observed (Ansell 1983). However, since climate change is also causing seawater to become more acidic, and this will affect the calcium metabolism of many species, their ability to withstand physical disturbances may become reduced Subaqueous Near-Shore Habitat Impacts Although this near-shore habitat is virtually unknown locally, other work (Clark 1997, Smith and Rule 2001) suggests that several ecosystem components would probably be affected by the nourishment campaign. These components include assemblages of a) benthic infauna, b) epibenthic / hyperbenthic invertebrates e.g., shrimps, crabs and squid. c) fish and d) plankton. In addition, this environment serves as a nursery for larval fish (Lasiak 1981). Of all these near-shore components, it is probable that the infauna would be most affected since they are relatively immobile and would suffer burial, the factor that appears to most affect the inter-tidal biota. Other components (fish, hyperbenthos) have greater ability to evade burial by swimming away or else their position in the water column (plankton) means that they may only be affected by the raised turbidity likely to occur (Newell et al. 1998). This factor would be of short duration and could be minimised by best practice techniques. Nevertheless, turbidity would affect light penetration and planktonic photosynthesis. Not only would this affect the plankton, it may affect the inter-tidal filter-feeding invertebrates that feed on plankton Recovery Recovery of the subaqueous benthos may not be an issue if sediments can be laid down in shallow layers that permit survival of the residents. Alternatively, if burial is too deep, the resident biota would be eliminated. Acceptable burial depths would need to be determined. Subsequent recovery would proceed as for the inter-tidal habitat with colonisation of the new sediments occurring via adult/juvenile migration and settlement of larvae from the plankton. However, since the new sediments will move upshore there may be insufficient time for recovery and the question then applies to the original underlying subaqueous sediments. In any case, it seems certain that recovery will occur (Newell et al. 1998). A final point concerns the possibility of biota surviving the transfer from deep borrow sites to the near-shore dump sites. There is evidence that this has occurred elsewhere (Jones 1986). The consequences of introducing deepwater species into shallow areas are unknown. Effects on the water column will occur if turbidity becomes elevated. This may affect the gills of fish and the photosynthesis of phytoplankton. However, it seems likely that mobile species such as fish would evade the turbid area and return subsequently. Phytoplankton would either suffer temporarily depressed photosynthesis, or if killed, would easily recover from nearby areas since the mixing is strong in this dynamic environment. 6.4 Social Impacts For the purpose of this scoping study, information pertaining to the social acceptance of beach nourishment has been gathered via a desktop media and literature review for the Sydney and NSW region, as well as a targeted stakeholder workshop. The purpose of the media review was to identify key related themes that have been reported in the local and State media. Synthesis and analysis of this information provides an indication as to the extent of exposure of the community to issues surrounding beach nourishment. The focus of the literature review was to reveal the importance of the beach and coastal zone and identify key user groups. The targeted stakeholder workshop was Revision C - 18 February
81 Beach Sand Nourishment Scoping Study - Maintaining Sydney's Beach Amenity Against Climate Change Sea Level Rise held to capture opinions and thoughts from a limited cross section of beach users and to complement the desk studies Media Review Up until about five decades ago, the majority of shore protection undertaken in Europe consisted of hard structures. Since the 1950s there has been a gradual shift from hard to soft protection measures in sandy coastal zones. This is in contrast to Sydney, where there have been very few beach nourishment projects undertaken to date. A review of media coverage of sand extraction and beach nourishment within Sydney, with a focus on each of the three case study areas, was undertaken in an attempt to gather direct knowledge of issues pertaining to the subject matter to date. The objective of the media review was to gather a set of key issues and concerns associated with sand extraction and beach nourishment as portrayed in the media in an attempt to gain an understanding of how the community and their representatives at local, State and Federal government levels may respond to the project, identifying potential concerns and priorities. A full list of articles reviewed as part of this study is presented as Appendix G. Over the past decade, the subjects of beach erosion and beach nourishment have attracted medium levels of media attention. Key areas of discussion have included the following: General acknowledgement of beach erosion on the Australian coastline including causes and consequences. Support for beach nourishment from local councils and communities. Options available for beach nourishment. General support for offshore sand extraction for the purpose of beach nourishment. A particular issue of debate has been the economic viability of offshore sand extraction for the purpose of beach nourishment without the involvement of commercial organisations. Commentators argue that ultimately costs will be recovered by selling up to 90 per cent of sand extracted to the construction industry. A range of key issues and discussion points were present within the articles that were reviewed, including the following: Acknowledgement that Sydney s beaches are shrinking. The need to improve/maintain amenity of beaches for local communities. Impact of climate change increased severity of storms. Current conditions are benefiting surfers good breaks. Options for beach nourishment: - Seawalls, sand nourishment onshore/offshore, purchase of affected properties - Sources and suitability of sand - Community opposition to seawalls - Availability of offshore sand, quality and safety of sand used to nourish beaches - Offshore sand extraction enormous operation and very expensive - Future of beach nourishment offshore sources will be a regular part of life - Historic opposition to offshore sand mining from State and federal governments - Beach nourishment using offshore sand has been successful in other locations (outside NSW) - Finding a balance between beach nourishment options - Previous incident of poor quality building site sand being dumped on beach (Collaroy-Narrabeen). Offshore Sand Extraction: - Off shore sourcing may not be popular - Impact of offshore sand mining on the ecosystem can be sustainable if done properly - Preferred by some environmentalists over onshore mining of sand - Support from local councils - General support for extraction if used for beach nourishment - Acknowledgement of adverse environmental impacts for offshore sand extraction. Revision C - 18 February
82 Beach Sand Nourishment Scoping Study - Maintaining Sydney's Beach Amenity Against Climate Change Sea Level Rise Cost: - Focus on economic cost cost of doing nothing (property loss) versus cost of nourishing beaches. Commercial: - Benefits of offshore dredging for mining and construction companies - Costly operation sell sand to construction industry to make up costs - Commercial mining of offshore sand will allow beach nourishment to take place not economically viable unless mines are created for the building industry - Council purchase of beachfront properties. Community: - Economic impact on communities if nothing done - Impact on residents adjacent to beaches loss of property and property value - Rise in sea levels could impact properties and public infrastructure - Disruption to community while dredging and nourishment is carried out - Expensive beach front properties political motivation? - Impact on water based recreational activities e.g. changes in wave patterns for surfers Targeted Stakeholder Workshop A targeted stakeholder workshop was held on 11 August The objective of the targeted workshop was to gather real (as opposed to perceived) issues, concerns and opinions from representatives of key user groups in the coastal zone who may be directly or indirectly affected (both positively and negatively) by activities associated with sand extraction and beach nourishment. It was felt that activities associated with beach nourishment would have a greater impact on a broader range of interest groups and stakeholders when compared with sand extraction. As a result the focus of the workshop was on potential impacts associated with the former. Although social and environmental concerns pertaining to the coastal zone are closely intertwined, the focus of the workshop was on social issues only. As such, no representatives from environmental groups were invited. Environmental issues will be discussed in workshops to be held as part of later stages of the project development Participants Interest groups were identified based on their perceived interest in the subject matter. A range of interest groups were invited in an attempt to capture as much of a representative cross section of stakeholders and interested parties, with varying interests and agendas, as possible within limited time and budgetary constraints. A record of stakeholders who were invited and attended is presented in Table 6.1. It is envisaged that this workshop will be the first of many similar workshops and community consultation sessions that will be held as part of the planning phases of this project. Table 6.1: Stakeholders who were invited to the targeted workshop held on 11 August 2009 Invited Attended Tourism NSW Strategy Unit Aaron Spadaro Yes Surf Life Saving NSW Steve McInnes Yes Dean Storey All at Sea Solutions Roland Persson Yes Bravo Fishing Charters Captain John Paton Yes Recreational Fishing Alliance of NSW Malcolm Poole Yes Australian National Sportfishing Association Ltd John Burgess Yes Surfrider Foundation Brendan Donahue Yes Diving Groups Jayne Jenkins Carl Falon Richard Nicholls No The general public are an important stakeholder but were not consulted as part of this study. It was felt that, given the highly sensitive nature of the subject matter, it would be best to capture the views of the general public once the findings of the scoping study were revealed and a comprehensive and technical data set is available to Revision C - 18 February
83 Beach Sand Nourishment Scoping Study - Maintaining Sydney's Beach Amenity Against Climate Change Sea Level Rise present. In this way the general public would be receiving up to date and reliable information that would allow them to make a well-informed decision. It is recommended that the general public is consulted in accordance with a Consultation and Communication Strategy developed as part of the next phase of planning for the project Method Comments and viewpoints of the participants were gathered during the targeted workshop by open discussion. The workshop was convened by asking open-ended questions and allowing the workshop participants to respond in a semi-structured manner. That is, participants were allowed to respond freely in the first instance, with the convener guiding the discussion to obtain responses from some participants when it was felt necessary. Attendees were encouraged to provide input during the workshop but were also informed that written comments would be welcome and accepted following the workshop. This option was provided to ensure that all participants felt they had ample opportunity to respond either within the workshop environment or following it. The workshop was divided into three sessions, the first of which began by asking participants about the nature of their interest in the beach and coastal zone. This session focused on gathering values that the participants associated with the beach and coastal zone. The second session focused on gathering general issues and concerns of the participants regarding the beach and coastal zone, particularly with respect to loss of values identified in the first session. The third session focused on the particular subject matter and sought to gather comments and concerns that the participants had with respect to sand extraction and beach nourishment. The purpose of leading the participants through the sessions was to facilitate an outcome that was founded on their values. A copy of the workshop minutes is presented as Appendix G. A summary of information gathered at the workshop is presented in Table 6.2. Table 6.2 Information gathered during the targeted stakeholder workshop Session Beach and coastal zone values Issues and concerns with existing beach environment Issues and concerns associated with sand extraction and beach nourishment Key Discussion Points Recreation and lifestyle - Sporting pursuits - Health benefits - Family enjoyment Historic symbolism Commercial opportunities Climate change and sea-level rise, coastal erosion - Loss of amenity - Safety issues - Loss or damage to facilities and heritage and cultural sites Altered conditions and impact on recreational and commercial fishing Timing and duration - Impact on marine ecology - Impact on beach users Nourishment technique - Impact on commercial and recreational fishing Short and long term changes to surfing conditions Who pays? Sand extraction approval for beach nourishment may set precedence for commercial extraction Revision C - 18 February
84 Beach Sand Nourishment Scoping Study - Maintaining Sydney's Beach Amenity Against Climate Change Sea Level Rise Users of the Coastal Zone The importance of the beach and coastal area for the Australian community and tourists alike is widely recognised and documented. Furthermore, in recent years many studies have documented the importance of the beach and coastal zone within NSW and the Sydney metropolitan area Beach users may frequent the beach and coastal zone for a wide range of reasons including: to be outdoors, exercise, relaxation, spend time with family and friends, sunbathing, diving and fishing, to name but a few. One of the most well documented activities within the coastal area is recreational and professional surfing. The definition of surfing incorporates all activities where the participant is riding a wave and includes those who ride long boards, short boards, boogie boards and those that body surf. A study undertaken on behalf of Tourism New South Wales in 2007 found that NSW captures 50% of the domestic surf market and the majority of the backpacker segment (Calais Consultants and Dhatom Tourism Consultants, 2007). This is due in part to the accessibility of the surfing coastline and beaches, and an existing and established urban beach culture, particularly in the Sydney region. As testament to the popularity and importance of surfing, there have been previous attempts to rank surf beaches in Australia. Based on one such ranking listed on a surfing website in 2007 (Realsurf website 2009), NSW has 77 of the top 100 surf beaches in Australia. Two of the top ten beaches (North Narrabeen and Shark Island) are located within the Sydney metropolitan region and a further eight Sydney beaches are located within the top It has been estimated that approximately 2.9 million people participated in surfing during the period of the 2006/07 Sweeney Sports Report. This figure is higher than the national figures for participation in netball, basketball and soccer. Interest in surfing is reportedly even higher with approximately 27% of the national population showing an interest by being a participant, spectator or keeping up to date with competition results through media reports. It should be noted that the Sweeney Sports Report survey is undertaken in national capital cities only and therefore major regional centres, including Wollongong and Newcastle and the north coast of NSW are not represented. In addition the survey excludes people under 16 years of age. As such, given the limited reaches of the survey, it is believed that the actual participation and interest rates are higher than those reported in the Sweeney Sports Report (Surfing Australia, 2007). According to a study on surf tourism in NSW, almost half of the overnight trips taken between 2004 and 2006 were during the months of January, February and March. This indicates that the primary surfing season is in summer and this would be reflected at all surfing locations within the Sydney metropolitan region and NSW. In addition, surfing is extremely popular with backpackers and results of TNT Magazine surveys undertaken in 2005 and 2006 reveal that approximately 60% of backpackers indicated they would be likely to undertake surf lessons while visiting NSW. Consequently, it is evident that surfing is extremely important as a recreational activity for both residents and visitors. The timing and duration of beach nourishment would need to consider Council applications and plans for upcoming professional surfing events. For instance, there are five World Championship Tours licensed to Australia, including the Beachley Classic at Manly. NSW also plays host to many World Qualifying Series including the Australian Open held at Cronulla in March Other national events, including one off events such as the Roxy Learn to Surf Jam, which is an all girls learn to surf camp across Queensland, NSW, Victoria, South Australia, Perth and New Zealand, should be considered. Surf events, such as NSW Surf Life Saving Championships, are another example of important events regularly held on beaches within the Sydney metropolitan region. The Surf Life Saving Championships were held in Cronulla in March 2007 and approximately 9000 competitors participated. In 2009, Surf Life Saving NSW events were held in Cronulla, Manly and Narrabeen, while an international Surf Life Saving event (World Masters Games) were held in Manly in October In addition, there are regular carnivals held over the summer at Cronulla, Queenscliff, Wanda, Manly, and Freshwater. Surf Life Saving NSW (SLS NSW) is the NSW branch of Surf Life Saving Australia. SLS NSW aims to supply services that minimise danger and prevent loss of life or injury to beach users in a beach and aquatic environment. SLS NSW has saved more than 300,000 lives since recording began in The organisation makes an invaluable contribution to NSW by providing safe environment for beach visitors. In addition, Surf Life 2 The reference to the top 50 beaches in Australia was sourced from in The web link was not active at the time of writing. Revision C - 18 February
85 Beach Sand Nourishment Scoping Study - Maintaining Sydney's Beach Amenity Against Climate Change Sea Level Rise Saving NSW is dependent on funding from sponsors. Funding is obtained from many sources including hosted ocean swims. The timing of nourishment activities thus has the potential to impact on the fundraising capacity and day-to-day functions of SLS NSW. This recognition of the importance of surfing and Surf Life Saving NSW events within Sydney and across NSW reinforces the need for careful and thorough planning prior to commencing a beach nourishment project. It also reinforces the importance of the beach to residents and visitors within Sydney and across NSW. 6.5 Recommended Nourishment Technique From an engineering and economic perspective, beach nourishment via offshore placement is the simplest and most cost effective solution (Figure 6.1). Environmental impacts are likely to be kept to a minimum using this method with the volumes of nourishment sand placed offshore of the same order of magnitude as the storm demand (sand moved offshore) for a large storm event. An offshore nourishment programme will not require beach closure and therefore social and business activities can continue without disruption. The recommended water depth for placement of the nourishment sand is principally based on both operational criteria and sediment transport processes. From a sediment transport perspective the water depth should not be greater than approximately -10m AHD. Beyond approximately -12m AHD, Nielsen (1994) found that active sediment transport and seabed fluctuations diminish rapidly. Figure 6.4 Measured Beach and Near-shore Seabed Fluctuations (Nielsen 1994) From an operational perspective, the placement of the nourishment sand should be seaward of the breaker zone, at say -5m AHD. The proposed barges and spreader pontoons to be used for depositing the nourishment sand have drafts that limit operations to a minimum of approximately -5m AHD. Therefore, the sand will need to be placed in water depths between -5m AHD and -10m AHD. Based on a 1 in 50 beach slope, this is equivalent to a deposition width of 250m. For the first nourishment campaign the volume of native sand required is 300m 3 /m length of beach. The equivalent mean sand depth across the deposition width is therefore 1.2m. Seabed fluctuations, based on Figure 6.4, indicate that higher natural variability can be expected. Revision C - 18 February

 and the sand will be transferred via pipeline to a spreader pontoon at the deposition site (-5m AHD to -10m AHD) and then placed on the seabed (Figure 6.5).")
86 Beach Sand Nourishment Scoping Study - Maintaining Sydney's Beach Amenity Against Climate Change Sea Level Rise Figure 6.5 Method 1- Spreader Pontoon Sand placement methods have been discussed with dredging contractors. Two options were considered feasible, both with similar cost structures. The preferred placement methods are: Method 1 A TSHD would be used to extract the sand from the designated offshore sand body and then sail under its own power to the nourishment site. The TSHD has a large draft (>10m) and the sand will be transferred via pipeline to a spreader pontoon at the deposition site (-5m AHD to -10m AHD) and then placed on the seabed (Figure 6.5). Method 2 The second method involves double handling of the extracted sand. A TSHD would be used to extract the sand from the designated offshore sand body and then sail under its own power to offshore of the nourishment site. The sand would be discharged to the seabed in approximately 20m water depth (temporary storage site). A smaller TSHD (Figure 6.6) would then excavate the sand from the temporary storage site and sail close to the shoreline, placing the sand within the nourishment zone (-5m AHD to -10m AHD). Figure 6.6 Method 2 Small Trailer Suction Hopper Dredge Key Recommended Studies and Further Work Community education and consultation on sand placement. Formation of working group/s with key stakeholders. Mapping of subaqueous, inter-tidal and subaerial ecology. Extensive ecological impact studies associated with sand placement activities. Survey monitoring of sand nourishment campaign performance. Revision C - 18 February
87 Chapter 7 Nourishment Costs
88
89 Beach Sand Nourishment Scoping Study - Maintaining Sydney's Beach Amenity Against Climate Change Sea Level Rise 7.0 Nourishment Costs Costs for the nourishment programme have been estimated to facilitate the cost-benefit assessment of the project. Costs are based on an economy of scale approach. It is envisaged that all of Sydney s oceans beaches will initially be nourished over a single specified period of time, and subsequently at trigger values (intervals) of approximately every 10 years. The first nourishment campaign is based on the extraction and placement of 12Mm 3 of Cape Banks or similar sand. Subsequent nourishment campaigns are based on the extraction and placement of 4Mm 3 of sand that is of equivalent suitability to the Cape Banks sand deposits and is of similar sailing distance to all beaches. Estimated costs have been developed following discussions with several dredging contractors. While the costs are order of magnitude estimates, the cost-benefit assessments for each of the three case study beaches include a sensitivity analysis based on a 30% increase in project cost estimates. Costs for the first nourishment campaign are contained in Table 7.1 and costs for subsequent nourishment campaigns are contained in Table 7.2. All costs are based on present day values. Costs for the first nourishment campaign are estimated at $25/m 3 of sand and costs for subsequent nourishment campaigns are estimated at $30/m 3 of sand. A sand nourishment volume has been included for the Narrabeen Lagoon flood tide delta. While, nourishment of Narrabeen Lagoon entrance is not an objective of the campaign, additional sand would migrate to the flood tide delta as sea level rises. This sand would originate from Collaroy-Narrabeen Beach and therefore, an allowance has been made for this coastal process. The migration of sand to the entrance in response to sea-level rise would not alter the present lagoon entrance maintenance regime. Within each of the nourishment campaigns, a fee has been allocated for a royalty payment to the leaseholder for extraction of the sand. This may or may not be required, but will be subject to further investigation and negotiation. Project fees extend well beyond the time period required to nourish all of the beaches. Fees would be incurred throughout the duration between subsequent nourishment campaigns. For example, fees have also been allocated to undertake annual hydrographic surveys of all nourished beaches, continuous environmental monitoring and ongoing project management. Within the first nourishment campaign additional fees have also been allocated to geotechnical considerations, the establishment of environmental monitoring programmes, the environmental approval processes and social workshops. As such, additional project management fees have also been allocated to the first nourishment campaign. Chapter Summary The first nourishment campaign is based on the extraction and placement of 12Mm 3 of Cape Banks or similar sand. Subsequent nourishment campaigns are based on the extraction and placement of 4Mm 3 of sand that is of equivalent suitability to the Cape Banks sand deposits. The first nourishment campaign is estimated to cost $300M at a unit rate of approximately $25/m 3 of sand. The second and subsequent nourishment campaigns are estimated to cost $120M at a unit rate of $30/m 3 of sand. Assumptions and explanatory notes addressing the fee breakdown in Tables 7.1 and 7.2 are as follows. Direct Dredging and Nourishment Costs Mobilisation and demobilisation cost - A THSD and associated equipment with the capacity to undertake a nourishment campaign of this magnitude will need to be engaged from an overseas location. The first nourishment campaign also includes initial set-up costs and site establishment that will not need to be budgeted for in the subsequent nourishment campaigns. Operating unit cost This is the unit rate to extract the sand, transport it to the beach and profile nourish. The unit rate of $15/m 3 is much higher than estimates for campaigns such as Byron Bay with unit rates estimated by PBP (2006) of $2.80 to $5.80 depending on the adopted methodology. The unit rate of $15/m 3 considers down time due to weather and maintenance, the large sailing distances between the borrow source and nourishment site, and the sand placement methodologies (i.e. the potential double handling). Revision C - 18 February
90 Beach Sand Nourishment Scoping Study - Maintaining Sydney's Beach Amenity Against Climate Change Sea Level Rise Royalties The current leaseholders of potential sand sources have invested in the exploration of the lease areas. A fee has been allocated for the payment of sand from the present leaseholders. Environmental management The dredging contractor will have environmental monitoring and compliance requirements that will need to be met for the nourishment campaign. The cost has been based on other dredging programmes and is estimated at 5% of the total operating cost. Associated Project Costs Pre and post construction survey Prior to the commencement of a nourishment campaign the sand extraction zone and all beaches would need to be hydro-surveyed. Surveys would also be required at the completion of the nourishment of each of the beaches and the extraction zone. Yearly post construction monitoring survey Annual post construction surveys of each of the beaches is required to monitor the performance of the nourishment programme. Beach sediment sampling and analysis A more detailed understanding of the sediment characteristics at each of the beach sites is required. At present, beach sediment data is very limited. Beach sediment characteristics are critical in estimated required beach volumes. Geotechnical investigation (Sand source coring) Volumes and compatibility of sand sources requires further investigation. Borrow sand compatibility is critical in estimating required beach volumes. Cape Banks has been identified as the most suitable sand body for the first nourishment campaign. In subsequent nourishment campaigns, alternate sand bodies may be required. Funding has been allocated to investigate other sand bodies for the subsequent nourishment campaigns. Environmental studies Mapping of existing benthic and mobile flora and fauna in both the subaerial and subaqueous environment for Sydney s beaches would be required prior to the commencement of a nourishment campaign. EIS and EMP Ecological and environmental monitoring programmes will need to be established to meet statutory, scientific and community requirements. These programmes would be ongoing. Social workshops Workshops would need to be scheduled for each of the beaches to be nourished to inform and educate the community on the nourishment campaign. A budget has been allocated for the first nourishment campaign only. Programme management Management of the dredging consultant, community liaison, reporting and performance monitoring have been budgeted within the project management budget. In the first 10 years, 3 people have been allocated on a full-time basis. In subsequent campaigns this has been reduced to 2 full-time workers. Design and tender documentation A budget of 8% of the associated project costs has been allocated to engineering design and contractual components of the nourishment campaign Revision C - 18 February
91 Beach Sand Nourishment Scoping Study - Maintaining Sydney's Beach Amenity Against Climate Change Sea Level Rise Table 7.1 First beach nourishment campaign (10 years) Direct Dredging and Nourishment Costs Associated Project Costs Case Study Areas Type Total Cost Breakdown Total Volume of Nourishment Sand 12,000,000 m 3 Mobilisation and demobilisation cost $15,000,000 Operating unit cost $15.00/m 3 Total operating cost $180,000,000 Royalties $24,000,000 $2 / m 3 Environmental management $9,000,000 5% x operating cost Total dredging and nourishment cost $228,000,000 Unit cost for dredging and nourishment $19.00/m 3 Pre and post construction survey $5,000,000 2 surveys Yearly post construction monitoring survey $10,000, surveys Beach sediment sampling and analysis $250, samples x $500 Geotechnical investigation (Sand source coring) $5,000,000 Environmental studies $10,000, beaches + 1 lagoon Social workshops (31 beaches) $792,000 2 person x 20 hours x $200/hour x 31 beaches x 3 workshops + 6 contingency workshops EIS for sand source area $500,000 1 sand source area EIS and EMP for beaches $15,000, beaches + 1 lagoon Programme Management $11,700,000 3 person x 37.5 hours/week x $200/hour x 52 x 10 years Subtotal $58,242,000 Design and tender documentation $4,659,360 8% x subtotal Contingency $8,736,300 15% x subtotal Total associated project costs $71,637,660 Average Sand Volume Unit Rate $24.97/m 3 Total Project Cost $299,637,660 Beach Length / Area Volume (m 3 ) Cost Collaroy/Narrabeen 2813m 1,125,200 $28,096,025 Narrabeen Lagoon 458,295m 2 137,489 $3,433,061 Manly 1563m 625,200 $15,611,122 Cronulla 3788m 1,515,200 $37,834,249 Totals 3,403,089 $84,974,456 Revision C - 18 February
92
93 Beach Sand Nourishment Scoping Study - Maintaining Sydney's Beach Amenity Against Climate Change Sea Level Rise Table 7.2 Second and subsequent beach nourishment campaigns (10 years) Type Total Cost Breakdown Total Volume of Nourishment Sand 4,000,000 m 3 Mobilisation and demobilisation cost $10,000,000 Operating unit cost $15.00/m 3 Total operating cost $60,000,000 Dredging and Nourishment Costs Royalties $8,000,000 $2 / m 3 Environmental management $1,500,000 5% x operating cost Total dredging and nourishment cost $79,500,000 Unit cost for dredging and nourishment $19.88 / m 3 Post construction survey $2,500,000 1 survey Yearly post construction monitoring survey $10,000, surveys Beach sediment sampling and analysis $250, samples x $500 Geotechnical investigation (Sand source coring) $7,500,000 New sand source area EIS for sand source area $500,000 1 sand source area Associated Project Costs EIS and EMP for beaches $5,000, beaches + 1 lagoon Programme Management $7,800,000 2 person x 37.5 hours/week x $200/hour x 52 x 10 years Subtotal $33,550,000 Design and tender documentation $2,684,000 8% x subtotal Contingency $3,355,000 10% x subtotal Total associated project costs $39,589,000 Average Sand Volume Unit Rate $29.77/m 3 Total Project Cost $119,089,000 Beach Length / Area Volume (m 3 ) Cost Collaroy/Narrabeen 2813 m 374,973 $11,163,787 Narrabeen Lagoon m 2 45,830 $1,364,447 Case Study Areas Manly 1563 m 208,348 $6,202,986 Cronulla 3788 m 504,940 $15,033,212 Totals 1,134,091 $33,764,432 Revision C - 18 February
94
95 Chapter 8 Case Study 1: Collaroy-Narrabeen Beach
96

97 Beach Sand Nourishment Scoping Study - Maintaining Sydney's Beach Amenity Against Climate Change Sea Level Rise 8.0 Case Study 1: Collaroy-Narrabeen Beach This chapter considers the social and economic implications of a sand nourishment campaign for Collaroy- Narrabeen Beach. Chapter Summary Collaroy-Narrabeen Beach is an intensely developed residential precinct, is popular with the surfing community and has restricted beach amenity and access following storms. For the do-nothing scenario properties along Collaroy-Narrabeen Beach will become more susceptible to storm hazards as beach amenity width reduces. The placement of 1.3Mm 3 (or 400m 3 /m length of beach plus 140,000m 3 for the Narrabeen Lagoon tidal delta) of sand from the Cape Banks borrow site would improve beach amenity by extending the mean beach width. This would also provide some additional buffer for storm erosion demand. The cost-benefit analysis demonstrated that the proposed beach nourishment programme is economically viable it produced a net present value of $42M, a benefit-cost ratio of 1.6 and an economic internal rate of return of 12%. The high economic rate of return for Collaroy-Narrabeen Beach is due to the intensely developed shoreline. Collaroy-Narrabeen Beach is located 20km north of the Sydney CBD. It is the second longest beach in Sydney with a shoreline length of 3.6km and extends from Narrabeen Head to the Collaroy baths. The southern section of the beach is called Collaroy and the northern section is known as Narrabeen. Narrabeen Lagoon is a prominent environmental and recreational feature located at the northern end of the beach. The area was first settled by Europeans in the early 19th century (Figure 8.1). The Sydney tram line was extended to Narrabeen in 1913 and the area quickly became a popular destination for camping and other activities. Throughout the 20th century the shoreline along the beach was extensively developed and today Collaroy-Narrabeen beach is the most intensely developed and highly capitalised shoreline in NSW (Hennecke et al. 2004). The beach is serviced by four surf lifesaving clubs; North Narrabeen, Narrabeen, South Narrabeen and Collaroy. Professional lifeguards from Warringah patrol the beach, as well as volunteer surf life savers on the weekends during the swimming season. Figure 8.1 Collaroy Beach 1907 (National Library of Australia) and August 2009 (WRL Coastal Imaging Camera) Although not as popular among tourists as Manly Ocean Beach to the south, Narrabeen holds its own place in the Australian psyche. The Narrabeen section of the beach is one of the most popular and consistent surf breaks in Sydney and has produced more world champion surfers than any other area in Australia. During the 1960 s and 1970 s Narrabeen was at the forefront of surf culture and surfboard design. Simon Anderson, from Narrabeen, is widely known for having invented the three fin thrusters which has become the most popular fin arrangement of all time, with millions of versions of the original design developed and sold around the world. The beach is also popular for swimming and fishing. Collaroy-Narrabeen Beach has a long history of storm erosion (Figure 1.2). Major storms in 1945, 1967 and 1974 caused erosion to dunes and damage to property. As the most at risk and highly capitalised shoreline in NSW, a suite of coastal process studies, hazard definition, management studies and emergency plans have been developed. It is one of the most intensively studied beaches in Australia. Extensive data sets have been acquired by the University of New South Wales Water Research Laboratory (WRL) and University of Sydney Coastal Revision C - 18 February

98 Beach Sand Nourishment Scoping Study - Maintaining Sydney's Beach Amenity Against Climate Change Sea Level Rise Studies Unit (CSU). The CSU has undertaken monthly beach profiles at selected locations since More recently WRL has installed and operated ARGUS cameras from the roof of a high rise apartment block on the beach face. These data sets provide an indicator of beach response to storm events and longer term beach behaviour to dominant wave directions. The Collaroy-Narrabeen Coastline Management Plan was adopted by Council in 1997 (Warringah Council 1997). The plan identified management strategies for dealing with coastal erosion along the beach. Management strategies included: 1) protective works; 2) environmental planning; 3) development control and conditions, and; 4) dune management. The protective works included an upgrade of ad-hoc seawalls constructed in front of approximately 55 properties. The proposed seawall upgrade was met by very strong community opposition (Figure 8.2). Figure 8.2 Collaroy-Narrabeen Beach 1991 Hazard Lines and Beach Users Protesting Against the Proposed Seawall Collaroy-Narrabeen Beach has been selected as one of the three case study beaches because it is an intensely developed residential precinct, it is popularity with the surfing community and access is routinely restricted following storms. 8.1 Physical The beach is composed of fine to medium quartz sand with around 30% carbonate (shell) content. Harley (2009) reports a grain size D 50 of 0.3mm for Collaroy Narrabeen Beach. Patterson Britton and Partners (1993) reports a grain size D 50 of 0.34mm for Collaroy Narrabeen Beach. The wave climate at Collaroy-Narrabeen is generally from the northeast through to southeast with an average H S of 1.6m and T P of 10s (Short & Trenaman 1992). It has a mean spring tide range of 1.3m (Short et al. 2000). The entrance to Narrabeen Lagoon features a large flood tide delta consisting of sand transported from Collaroy- Narrabeen Beach. This sand is removed on a regular basis (every 3 to 4 years) to alleviate rainfall-runoff flooding of properties adjacent to the lagoon and to maintain tidal flushing within the lagoon. Typically 40,000m 3 to 45,000m 3 of sand has been removed during each of the last three clearance operations in 1999, 2002 and 2006 (Cameron et al. 2007). The removed sand was used to replenish Collaroy-Narrabeen Beach. There are nine primary stormwater outlets along Collaroy-Narrabeen Beach, the majority of which discharge at the back of the beach. These are located at: Collaroy Rock Baths. Collaroy Street (outlet in the surf zone). Frazer Street. Ramsay Street. Goodwin Street. Albert Street. Octavia Street. Tourmaline Street. Revision C - 18 February

. Figure 8.")
99 Beach Sand Nourishment Scoping Study - Maintaining Sydney's Beach Amenity Against Climate Change Sea Level Rise Malcolm Street. The stormwater outlets cause localised scour during rainfall runoff events. Collaroy-Narrabeen Beach is essentially a closed sediment system bounded to the south by an extensive underwater bed-rock ridge extending seaward from Long Reef and bounded to the north by Turimetta Headland (Figure 8.3). Figure 8.3 Collaroy-Narrabeen Beach NSW Public Works Department (PWD 1987) undertook photogrammetric analysis for the period 1941 to 1986 and estimated a historical long-term recession of Collaroy-Narrabeen Beach of 0.1±0.1m/yr. Nielsen Lord Associates (1990) adopted a net sediment loss of 1.5m 3 /m/yr for hazard mapping along Collaroy-Narrabeen Beach which is equivalent to the PWD (1987) upper bound rate of 0.2m/yr. The historical long-term recession estimate of 0.1m/yr between 1941 and 1986 is close to what could be expected due to climate change sea-level rise over the same period. Dr Andrew Short from the University of Sydney commenced regular (approximately monthly) cross-shore surveys in April 1976 at 5 transects along Narrabeen-Collaroy Beach. Dr Short continued his transect surveys until July 2005 when Mitch Harley of UNSW (PhD student) continued regular surveys using a GPS unit mounted on a quad bike. Harley s work enabled full survey coverage of the beach above 0m AHD. These data sets (up to August 2008) have been plotted by Peter Horton of Worley Parsons (pers. comm. September 2009) as statistical beach widths and are reproduced in Figure 8.4. Revision C - 18 February
 The average beach width for Collaroy-Narrabeen Beach was approximately 50m during the period July 2005 to")
100 Beach Sand Nourishment Scoping Study - Maintaining Sydney's Beach Amenity Against Climate Change Sea Level Rise Figure 8.4 Collaroy-Narrabeen Beach Width July 2005-August 2008 (Source: Peter Horton, Worley Parsons) The average beach width for Collaroy-Narrabeen Beach was approximately 50m during the period July 2005 to August 2008, although spatially along the full extent of the beach the average width varied from 30m to 70m (Figure 8.4). The narrowest beach section was around Wetherill St, where minimum widths of less than 10m were surveyed Do Nothing Scenario The average beach width for Collaroy-Narrabeen Beach was approximately 50m during the period July 2005 to August 2008, although spatially along the full extent of the beach the average width varies and is only 30m at Wetherill St (Figure 8.4). Assuming that the dune face would not be permitted to migrate landwards, and using an upper-bound estimate of a 0.1m rise in sea level every 10 years, the beach width will theoretically reduce a further 5m every 10 years. Therefore, in 50 years the average beach width is predicted to reach half its present extent and there will be a total loss of beach amenity near Wetherill St. The average beach volume above 0m AHD in 30 years would be comparable to the minimum beach width recorded over the period July 2005 to August 2008 (Figure 8.4). The risk to private property and mapping of hazard lines has been extensively documented in Nielsen Lord Associates (1990). The findings of their report is presently being updated by Worley Parsons using more recently published climate change sea-level rise estimates. Properties along Collaroy-Narrabeen Beach will become more susceptible to storm hazards as beach width reduces. Revision C - 18 February
101 Beach Sand Nourishment Scoping Study - Maintaining Sydney's Beach Amenity Against Climate Change Sea Level Rise Nourishment Requirements The volume of native sand required to accommodate past sea-level rise (0.2m), as well as that projected to occur over the next 10 year period (0.1m) is 1Mm 3. The placement of 1Mm 3 would improve beach amenity by extending the mean beach width from 50m to approximately 65m. This is equivalent to 1.3Mm 3 (or 400m 3 /m length of beach plus 140,000m 3 for Narrabeen Lagoon tidal delta) of sand from the Cape Banks borrow site. This would also provide some additional buffer for storm erosion demand. A sand nourishment volume has been included for the Narrabeen Lagoon flood tide delta. While, nourishment of Narrabeen Lagoon entrance is not an objective of the campaign, additional sand would migrate to the flood tide delta as sea level rises. This sand would originate from Collaroy-Narrabeen Beach and therefore, an allowance has been made for this coastal process. The migration of sand to the entrance in response to sea-level rise would not alter the present lagoon entrance maintenance regime. Subsequent nourishment campaigns are scheduled at sea-level rise increments of 0.1m (i.e. each 10 years). This is equivalent to approximately 130m 3 /m length of beach of sand from the Cape Banks borrow site. 8.2 Environmental There are no published studies of the inter-tidal and subaqueous biotic assemblages at Collaroy-Narrabeen Beach. However, Collaroy-Narrabeen Beach is known to contain a number of aquatic habitats, including inter-tidal rock platforms, subaqueous rocky reefs, sandy beaches and subaqueous soft sediments. The biota of Sydney s ocean beaches and Collaroy-Narrabeen Beach comprise the following components: a) Vascular plants (and associated invertebrates) occupying dunes above high water. b) Air-breathing species on the upper beach including crustacean and insect assemblages inhabiting seaweed wrack and ghost crabs. c) Shore birds. d) The assemblages living under the inter-tidal sand. A general description of the biota assemblages for Sydney s beaches is provided in Appendix F Do Nothing Scenario A substantial length of Collaroy-Narrabeen Beach is backed by seawalls. These seawalls are ad-hoc structures, are not certified and are unlikely to be fully protective in the long-term. Sea-level rise will cause the beach to migrate landwards which is likely to result in the failure of many of these seawall structures. In such cases, the beach ecosystems would probably remain intact (albeit littered with seawall debris) with urban infrastructure being progressively impacted. In other cases, where the seawall structures remain intact, the beach width would reduce until no inter-tidal beach remains, resulting in a deterioration of the beach ecosystem Nourishment Impacts The generic inter-tidal and subaqueous ecological impacts of a nourishment campaign for all of Sydney s beaches are described in Section 6.3 and Appendix F of this report. Of particular concern at Collaroy-Narrabeen Beach is the potential smothering of the subaqueous rocky reefs and their associated flora and fauna. Nourishment could potentially result in the permanent loss of subaqueous rocky reef habitat. The presence or extent of seagrass beds and kelp fields is presently unknown. Monitoring of these key ecological issues will need to be considered as part of a proposed nourishment campaign. 8.3 Social Community Priorities The Warringah community and their Local Government representatives have a high level of interest in preserving their natural environment. Warringah s vision for the future as presented in Living Warringah 2005 (Warringah Council 2005) states: A vibrant community, improving our quality of life by living and working in balance with our special bush and beach environment. The community s key priority areas for the future include: Living Spaces A relaxing, enjoyable and safe environment with ease of access to shops and facilities. Living Environment Providing a legacy to future generations through conservation of the local environment. Revision C - 18 February
102 Beach Sand Nourishment Scoping Study - Maintaining Sydney's Beach Amenity Against Climate Change Sea Level Rise Living Community A sense of community belonging that encourages community participation and involvement by residents. Living Enterprise A range of businesses and services that provide job opportunities and encourage visitors to the area without compromising the environment. Media Review The Collaroy-Narrabeen Beach is widely cited in the media as one of the most vulnerable to coastal erosion in Australia. Mitigation measures addressed in the media have included building seawalls, buying back properties and sourcing sand from other locations. In 2002 the community voiced strong opposition to the proposal of a sea wall and the other options have been deemed expensive by Warringah Council. General support has been shown for the sourcing of offshore sand for the purpose of nourishing Collaroy-Narrabeen Beach Do Nothing Scenario If no action to mitigate the effects of sea-level rise and beach erosion is taken at Collaroy-Narrabeen potential impacts will include, but not be limited to, the following: Loss of sandy beach amenity and impeded access for beach users. Loss or damage to Surf Life Saving Clubs (South Narrabeen, Narrabeen, North Narrabeen, Collaroy). Loss or damage to recreational facilities within Collaroy Park. Loss of local revenue from learn to surf schools, and professional surfing tournaments. Loss or damage to residential property to the east of Pittwater Road and Ocean Street. The social implications associated with the do-nothing scenario are immense and predominantly negative Nourishment If a beach nourishment programme is commenced to mitigate the effects of sea-level rise and beach erosion Collaroy-Narrabeen beach will remain unchanged and beach users will be able to enjoy the benefits of the sandy beach and coastal area into the future. Social implications are predominantly positive and beneficial for beach users. Depending on the funding mechanism for the nourishment programme, some people may not be accepting of the costs associated with the nourishment programme, particularly if they are not beach users. 8.4 Economic The technique of cost-benefit analysis has been used to evaluate the net economic benefit of investment in a beach nourishment programme to mitigate the loss of beach amenity from reduced beach width as a result of future sea-level rise associated with climate change. The loss of beach amenity has the potential to cause economic costs, and it is the avoidance of these costs which is the economic benefit of the programme. In the case of Collaroy-Narrabeen this assessment also includes the potential loss of property. The cost-benefit analysis involved a comparison of the expected situation with the programme against the expected situation without the programme, the latter being referred to as the base case. The investment case is evaluated on an incremental basis from the base case. The evaluation involves assessing whether the economic benefits of implementing a beach nourishment programme exceed the economic costs of providing the programme. The evaluation is conducted over a 50-year period, because of the long-term nature of sea-level rise associated with climate change. In conducting a costbenefit analysis at a strategic level, it is standard practice to omit: a) Expenditures which are common to the base case and the investment case. For instance, any expenditures on lagoon entrance clearance, dune vegetation, seawalls and other protection works, etc. do not need to be included if they are common to the base case and the investment case. b) Minor capital or operating expenditures on beach management in the base case. This is because of the order of accuracy of the cost estimates for the investment case. This means that the estimated capital and operating costs of the investment case represent the incremental costs to be used in the cost-benefit analysis. The methodology for valuing the economic benefits of the beach Revision C - 18 February
103 Beach Sand Nourishment Scoping Study - Maintaining Sydney's Beach Amenity Against Climate Change Sea Level Rise nourishment programme is described in Appendix H. The parameter values used in the cost-benefit analysis are outlined below Costs The relevant capital and recurrent costs for the Collaroy-Narrabeen Beach nourishment programme are given in Table 8.1. Table 8.1 Beach Nourishment Programme Cost Estimates a) Collaroy-Narrabeen Beach 1st 10-year Campaign Following 10-year Campaigns Capital Unit Costs ($/m 3 ) Unit Costs ($/m 3 ) Dredging & nourishment Other Total Recurrent Unit Costs ($/m 3 ) Unit Costs ($/m 3 ) Monitoring Management Total Sand Volume (m 3 ) 1,262, ,803 Total Costs ($ 000) Total Costs ($ 000) Capital 28,726 10,318 Recurrent 2,803 2,230 Note: a) Derived from Tables 7.1 & 7.2 by separating out recurrent costs from the engineering cost estimates Benefits The quantified benefits of the Collaroy-Narrabeen beach nourishment programme are summarised in Table 8.2. The detailed calculations are presented in Appendix H. Total benefits shown allow for the application of an uplift factor to gross value added (GVA), which would provide some allowance for the value of non-traded attributes associated with beach amenity (these attributes include consumer surplus, which is the value of the beach to people over and above that indicated by expenditure). The sensitivity of the economic results to the uplift factor is assessed in Section Table 8.2 Beach Nourishment Programme Quantified Benefits Collaroy-Narrabeen Beach Avoided Loss a) Year Rate Revenue Residential ending June b) GVA c) Non-traded Tax Value d) Business f) Property Value g) Revenue h) Total , , , , , , , , , , , , ,719 Notes: a) Assumes beach width is an indicator of beach amenity and a linear relationship applies between the loss of beach width and the loss of economic value from flow-on effects. Based on existing average beach width of 50 metres and beach width receding five metres every ten years. b) First full year following each beach nourishment. c) GVA is gross value added and measures the total market value of output less net taxes (such as GST and excise duties). GVA per business is sourced from Tourism Research Australia (2009), Table 12; it has been adjusted for output that is not related to beach visits. The contribution of beach-related activities by type of business is: 33% for cafes, restaurants & take-aways; 33% for clubs, pubs, taverns & bars; 70% for accommodation; 33% for retail (the number of retail businesses excludes those primarily serving local residents, e.g. homewares); Revision C - 18 February
104 Beach Sand Nourishment Scoping Study - Maintaining Sydney's Beach Amenity Against Climate Change Sea Level Rise 10% for galleries, museums, etc; and 100% for businesses providing on-beach activities. Updated to 2009/10 by change in household final consumption expenditure from December Quarter d/ Non-traded attributes of beach amenity valued at 40% of GVA (average of ratios reported in other studies refer Appendix H). e/ Based on information provided by Warringah Council for properties within hazard lines; assumes that these properties do not exist in the base case. Also, allows for properties within easy walking distance (500m) of beach with property value differential of 40% between the base case and the investment case. f/ Businesses located in Collaroy and Narrabeen shopping centres and along Ocean Street; includes special purpose rate for Manly Business Centre Improvements. Adjusted for rates attributable to beach amenity refer Appendix H. g/ Reflects the impacts of beach amenity on residential property values, assuming that property value is an indicator of willingness to pay for beach amenity. Assumes that properties within hazard lines do not exist in the base case. h/ Average tax rate on tourism industry products is 21% - sourced from Tourism Research Australia (2008), page 8. This compares to the overall industry average of 9-10%. The following data/information needs to be verified during project development from the results of the Sydney Beaches Valuation Project being conducted for the SCCG by Dave Anning at UNSW or from additional specificpurpose surveys: Percentage of day visitors and overnight visitors attracted to Collaroy-Narrabeen by the beach. Number of beach visits and average expenditure per beach visit by visitors and residents. Consumer surplus ( willingness to pay ) associated with a beach visit. Number of retail outlets primarily serving Collaroy-Narrabeen residents. Property value attributable to beach amenity Cost-Benefit Analysis Results The cost-benefit analysis was undertaken over a 50-year period, using a real discount rate of 7% (alternative discount rates were used in the sensitivity analysis). All costs and benefits were expressed in 2009 prices, and 2009/10 was adopted as the discount year. Appendix H contains the parameter values and the detailed cost and benefit streams on which the cost-benefit analysis was based. The results of the cost-benefit analysis are summarised in Table 8.3. Revision C - 18 February
105 Beach Sand Nourishment Scoping Study - Maintaining Sydney's Beach Amenity Against Climate Change Sea Level Rise Table 8.3 Economic Evaluation Results Collaroy-Narrabeen Beach Incremental to without beach nourishment case ($ 000 in 2009 prices) Total cost a) $187,240 Present value b) Dredging & nourishment costs 36,460 Management & monitoring costs 34,803 Total costs 71,263 Avoided loss of: Gross value added 8,502 Non-traded value 3,401 Rates revenue Residential 4,922 Business 409 Residential property value 93,630 Tax revenue 1,785 Total benefits 112,649 Net present value $41,695 Benefit-cost ratio 1.6 Economic internal rate of return 12% Notes: a) Calculated from cost estimates in Table 8.2. b) Discounted to 2009 /10 at 7% real discount rate. Table 8.3 shows that the sand nourishment programme is economically viable, with a net present value of $42M, a benefit-cost ratio of 1.6 and an economic internal rate of return of 12%. The value of the benefit-cost ratio indicates that, on the basis of the quantified benefits, the programme is expected to provide medium value for money. Generally, a project requires a benefit-cost ratio in excess of 1.5 in order to be considered as providing medium value for money. The main quantified benefits are the avoided loss of: Residential property values attributable to beach amenity (45% of total quantified benefits). Value of residential properties located within hazard lines (38%). Expenditure by beach visitors (8%). Rates revenue from residential property values within walking distance of the beach as a result of lower property values (4%) Sensitivity Analysis The following sensitivity tests were undertaken to assess the robustness of the economic results: Alternative real discount rates of 4% and 10%. Uplift factor of 1.1 applied to GVA (1.4 in the main analysis). Exponential relationship between beach width and beach amenity (linear relationship in the main analysis). 30% increase in project cost estimates. 30% decrease in project benefits. The results of the analysis are shown in Table 8.4. Revision C - 18 February
106 Beach Sand Nourishment Scoping Study - Maintaining Sydney's Beach Amenity Against Climate Change Sea Level Rise Table 8.4 Sensitivity Analysis Results Collaroy-Narrabeen Beach Main Evaluation a) Net present value Incremental to without beach nourishment case $41.7M Benefit-cost ratio 1.6 Economic internal rate of return 12% Real discount rate of 4% Net present value $117.9M Benefit-cost ratio 2.2 Economic internal rate of return 12% Real discount rate of 10% Net present value $11.2M Benefit-cost ratio 1.2 Economic internal rate of return 12% Uplift factor of 1.1 applied to GVA Net present value $39.1M Benefit-cost ratio 1.5 Economic internal rate of return 12% Exponential relationship between beach width and beach amenity Net present value $108.8M Benefit-cost ratio 2.5 Economic internal rate of return 21% 30% increase in project cost estimates Net present value $20.4M Benefit-cost ratio 1.2 Economic internal rate of return 9% 30% decrease in project benefits Net present value $7.9M Benefit-cost ratio 1.1 Economic internal rate of return 8% 30% increase in project cost estimates and 30% decrease in project benefits Net present value -$13.4M Benefit-cost ratio 0.9 Economic internal rate of return 6% Note: a) From Table 8.3. Table 8.4 shows that the economic viability of the sand nourishment programme is reasonably robust. However, in the most extreme sensitivity test (where project benefits are reduced by 30% and project costs are increased by 30%), the programme is not economically viable. The sensitivity analysis showed that the economic results are particularly sensitive to the shape of the relationship between beach width and the loss of economic value from flow-on effects of reduced beach amenity. Use of an exponential rather than a linear relationship increases the benefit-cost ratio from 1.6 to 2.5. A combination of the exponential relationship and the most extreme sensitivity test results in a benefit-cost ratio of 1.4. Revision C - 18 February
107 Beach Sand Nourishment Scoping Study - Maintaining Sydney's Beach Amenity Against Climate Change Sea Level Rise One of the sensitivity tests involves a lower real discount rate of 4%. A lower discount rate is increasingly being adopted in other countries for the economic appraisal of social and environmental projects with long-term benefits. A real discount rate of 4% rather than 7% increases the benefit-cost ratio from 1.6 to Summary of Economic Viability The main cost-benefit analysis showed that the sand nourishment programme is economically viable and is expected to provide medium value for money. The sensitivity analysis showed that the economic viability is reasonably robust. However, the programme is not economically viable in the most extreme sensitivity test (where project benefits are reduced by 30% and project costs are increased by 30%). Adopting a lower discount rate, as is increasingly the overseas practice in economic appraisal of social and environmental projects with long-term benefits, increases the benefit-cost from 1.6 to 2.2. The economic results are also sensitive to the shape of the relationship between beach width and the loss of economic value from the flow-on effects of reduced beach amenity. Use of an exponential rather than a linear relationship increases the benefit-cost ratio from 1.6 to 2.5. Revision C - 18 February
108
109 Chapter 9 Case Study 2: Manly Ocean Beach
110


111 Beach Sand Nourishment Scoping Study - Maintaining Sydney's Beach Amenity Against Climate Change Sea Level Rise 9.0 Case Study 2: Manly Ocean Beach This chapter considers the social and economic implications of a sand nourishment campaign for Manly Ocean Beach. Chapter Summary Manly Ocean Beach has an iconic status, a prominent social standing and a significant cultural heritage. It has limited ability to respond to climate change sea-level rise due to the presence of the seawall and associated lack of back beach barrier dunes. Many local businesses rely on the existence of the beach and loss of beach amenity would have a devastating impact on economic turnover. Loss of the beach amenity and promenade would also impact significantly upon the sub-aerial and inter-tidal coastal environment. The placement of 625,000m 3 (or 400m 3 /m length of beach) of sand from the Cape Banks borrow site will improve beach amenity by extending the mean beach width. This will also provide some additional buffer against storm erosion and additional protection of the vulnerable seawall. The cost-benefit analysis demonstrates that the proposed beach nourishment programme is economically viable it produced a net present value of $48M, a benefit-cost ratio of 2.4 and an economic internal rate of return of 20%. The high economic rate of return for Manly Beach is a result of its iconic status and importance to regional tourism. Manly Ocean Beach is one of Australia s most iconic and popular beaches. The beach is located 16km north east of the Sydney CBD and extends from Manly Surf Club at the southern corner to Queenscliff Headland in the north. The beach is 1.5km long and is referred to as Manly/South Steyne at the southern end, North Steyne along the mid sector and Queenscliff at the most northern extent. The beach is backed by a seawall of varying design and age, with a promenade and foreshore reserve along its entirety. Figure 9.1 Manly Beach 1895 and present Manly was first settled by Europeans in the early 1800 s. Originally the area was accessed by ferry and paddle steamer via Sydney Harbour. By the late 19th and 20th century the area was one of early Australia s most popular seaside resorts. The renowned Norfolk Pines that line the shoreline were planted between 1860 and It was illegal to swim in the water at Manly until 1902 when a local man defied the law and bathed in daylight hours, paving the way for ocean swimming in Australia (Short 1993). Seventeen people drowned in 1903, leading to the creation of a number of ad-hoc volunteer surf lifesaving clubs, some of the earliest in Australia. Today, three surf lifesaving clubs operate on the beach; Manly, North Steyne and Queenscliff. The beach is also patrolled by professional lifeguards employed by Manly Council. The Manly region receives 5 to 8M visitors each year (Manly Council website 2009). The area is used for numerous recreational and social activities in the water, on the beach and on the adjoining promenade. The southern end of the beach has a walking mall with many shops, restaurants and bars. The beach is well serviced by public transport and the Manly Ferry Terminal is within walking distance. The area is also of significant importance to the surfing community and plans are underway to have the beach dedicated as a National Surfing Reserve (Farmer & Short 2007). Residents and tourists flock to Manly to learn to surf and to buy surf related products at the many stores in the area. Revision C - 18 February
112 Beach Sand Nourishment Scoping Study - Maintaining Sydney's Beach Amenity Against Climate Change Sea Level Rise During large or frequent storm events Manly Ocean Beach is subject to loss of amenity and damage to assets as there are insufficient volumes of sand to accommodate the storm erosion demand (PBP 2008b). In 1913, storm waves lashed the foreshore and destroyed beach facilities that had been constructed. Large storms also hit the beach in 1943 and 1950, damaging the seawall and threatening North Steyne SLSC (Figure 1.1). The largest storm events on record occurred in 1967 and 1974, causing extensive damage to the seawall. More recent storms in 1999, 2001 and 2007 have also damaged the seawall. Rock protection has been added to the toe of the seawall along much of the beach as part of stabilisation works. Exposure of this rock protection during storm events leads to amenity and safety issues in the period prior to natural beach recovery and reburial of the rock armour (PBP 2008b). Manly Ocean Beach has been selected as one of the three case study beaches because of its iconic status, its social and cultural heritage, and its limited ability to respond to climate change sea-level rise due to the presence of the seawall and associated lack of back-beach barrier dunes. Many local businesses rely on the existence of the beach and loss of beach amenity would have a devastating impact on their economic turnover. Loss of beach amenity and the promenade would also impact significantly on the sub-aerial and inter-tidal coastal environment. 9.1 Physical Manly Ocean Beach is bounded by Queenscliff Headland to the north and Blue Fish Point and North Head to the south. The embayment is essentially a closed sediment system with extensive rocky reefs offshore of Blue Fish Point, indicating no significant littoral sand supply from the south. The relatively shallow depths at Queenscliff Headland may permit minor transport of sand to Freshwater Beach during large storm events. The beach has a typical slope of 1 in 50 and consists of fine to medium grained golden sand to a depth of approximately 14m LAT (Figure 9.2). At depths greater than 14m the sand is classified as fine grained and fawn coloured. Details of actual grain size are not available, but could be expected to fall in the range 0.30mm to 0.35mm. Figure 9.2 Manly Beach Manly Lagoon entrance is situated at the northern extremity of Queenscliff Beach. Several large stormwater pipes also cross the beach and are clearly visible (Figure 9.3). In addition, several stormwater drains terminate at the back of the beach and create localised erosion zones following rainfall. Photogrammetric analysis of historical aerial photography between 1930 and 2002 indicates that the volume of sand above 0m AHD has, in the longer term, remained relatively stable (PBP 2008a). This provides some support to the notion that the embayment is a closed sediment system. Revision C - 18 February
 and a Coastline Management Plan (PBP 2008b) have been completed for Manly Ocean Beach.")
113 Beach Sand Nourishment Scoping Study - Maintaining Sydney's Beach Amenity Against Climate Change Sea Level Rise A coastline hazard definition study has been published for Manly Ocean Beach (PBP 2003). More recently a Coastline Management Study (PBP 2008a) and a Coastline Management Plan (PBP 2008b) have been completed for Manly Ocean Beach. Historical surveys of the beach have indicated that the short term cross-shore sand transport due to storm events is generally higher at the northern end of the beach. The southern end of the beach is afforded some protection from southerly storms by Blue Fish Point. PBP (2008a) recommended design volumes for storm demand along the subaerial beach for the 100yr ARI of between 100 and 180m 3 /m. Based on the more accreted beach conditions from the photogrammetric survey data, available subaerial beach volumes range from 55 to 125m 3 /m (PBP 2008a). During eroded conditions in July 1974 and May 1976 the volume of sand remaining on the beach above 0m AHD was less than 30m 3 /m. PBP (2008a) recommend nourishment of 300m 3 /m (subaerial and sub-aqueous) or a total volume of 500,000m 3 to guarantee protection of the Manly Seawall. This volume appears to be based on a depth of closure of approximately 10m. Figure 9.3 Stormwater pipes on Manly Beach 2009 (Courtesy Manly Council) In this report the adopted depth of closure is approximately 22m. WRL (2003) also adopted a similar closure depth to that used in this scoping study. This results in substantially higher estimated nourishment volumes to protect the seawall than those estimated by PBP (2008a) and is discussed further in Section Do Nothing Scenario The average beach width (between South Steyne and the Queenscliff boatshed) determined from photogrammetry is approximately 50 m (WRL 2003). Based solely on a 200mm sea-level rise between 1870 and the present, the theoretical width of Manly Ocean Beach, using the Bruun Rule, would have reduced by approximately 10m during this period. Using an upper-bound estimate for sea-level rise of 0.1m every 10 years, the beach width will theoretically reduce a further 5m every 10 years. Therefore, in 50 years the average beach width will be half its present extent. The average beach volume above 0m AHD by 2050 would be comparable to the most eroded condition recorded (e.g. Figure 1.1) over the period 1930 to 2001 (WRL 2003). Consequently, the threat of major damage to the existing seawall is very high Nourishment Requirements The volume of native sand required to accommodate past sea-level rise (0.2m), and that for the next 10 year period (0.1m) is 520,000m 3. The placement of 520,000m 3 would improve beach amenity by extending the mean beach width from 50m to approximately 65m. This is equivalent to 625,000m 3 (or 400m 3 /m length of beach) of sand from the Cape Banks borrow site. This would also provide some additional buffer against storm erosion and some additional protection of the vulnerable seawall. This volume will not guarantee protection of the seawall as reported by PBP (2008a). WRL (2003) estimated that Manly Ocean Beach width would need to be increased by 57m (to 107m) to provide adequate protection of the existing seawall based on present sea level elevation. This would require Revision C - 18 February
114 Beach Sand Nourishment Scoping Study - Maintaining Sydney's Beach Amenity Against Climate Change Sea Level Rise approximately 2Mm 3 of native sand. This can probably be considered an upper-bound volume because it includes sufficient sand to prevent exposure of the rocks near the toe of the seawall. Subsequent nourishment campaigns are scheduled at sea-level rise increments of 0.1m (i.e. each 10 years). This is equivalent to approximately 130m 3 /m length of beach of sand from the Cape Banks borrow site. 9.2 Environmental There are no published studies of the inter-tidal and subaqueous biotic assemblages at Manly Beach. However, Manly Beach is known to contain a number of aquatic habitats, including inter-tidal rock platforms, subaqueous rocky reefs, sandy beaches and subaqueous soft sediments. The region also includes Cabbage Tree Bay Aquatic Reserve that provides protection and sanctuary for the weedy sea dragon, elegant wrasse, black rock cod and the blue groper. The biota of Sydney s ocean beaches and Manly Beach comprise the following components: a) Vascular plants (and associated invertebrates) occupying dunes above high water. b) Air-breathing species on the upper beach including crustacean and insect assemblages inhabiting seaweed wrack and ghost crabs. c) Shore birds. d) The assemblages living under the inter-tidal sand. A general description of the biota assemblages for Sydney s beaches is provided in Appendix F Do Nothing Scenario At beaches with seawalls (Manly Beach), sea-level rise and erosion will reduce the width of the beach until no inter-tidal beach remains, resulting in a total loss of the beach ecosystem Nourishment Impacts The generic inter-tidal and subaqueous ecological impacts of a nourishment campaign for all of Sydney s beaches are described in Section 6.3 and Appendix F of this report. Of particular concern at Manly Beach and Cabbage Tree Bay Aquatic Reserve is the potential smothering of the subaqueous rocky reefs and their associated flora and fauna. Nourishment could potentially result in the permanent loss of subaqueous rocky reef habitat. The presence or extent of seagrass beds and kelp fields is presently unknown. Monitoring of these key ecological issues will need to be considered as part of a proposed nourishment campaign. 9.3 Social Community Priorities The Manly community and their Local Government representatives have a high level of interest in the built and natural environment. Manly s vision for the future as presented in the Surfing the Future A Vision for the Manly Local Government Area for 2025 (Manly Council 2006) states: A thriving community where residents and visitors enjoy a clean, safe and unique natural environment enhanced by heritage and lifestyle. Manly s coastal location defines the character of the area. The iconic beach and associated surf culture attracts visitors, tourists and residents to the area. Protection of the natural environment and culture is strongly linked to a sense of identity and quality of life for local residents. Mitigating the negative impacts of sea-level rise, coastal erosion and shoreline retreat resulting from increases in the frequency and intensity of coastal storms and floods, therefore, is an important priority. The Manly Ocean Beach Coastline Management Plan, Support Document (PBP 2004) identifies features associated with Manly Ocean Beach that are deemed valuable by the community. Key areas of value include: Costal Ecology The community place value on maintaining the range of habitats, flora and fauna associated with the beach environment. Heritage The Manly Beach area encompasses a range of indigenous and non-indigenous heritage areas and issues. The recognition of the beach as a historically iconic area and its cultural associations with Revision C - 18 February
115 Beach Sand Nourishment Scoping Study - Maintaining Sydney's Beach Amenity Against Climate Change Sea Level Rise surfing, beach recreation and scenery provide a foundation for the identity of the local community and suburbs. Aesthetics The iconic beach and local amenity attract visitors, tourists and residents to the area. The beach provides a stage for beach culture and events. Recreation The beach provides a number of areas for recreational use in the form of the surf zone (surfing, body boarding, body surfing, swimming, water play, surf lifesaving and nipper activities, surf schools, and surf competitions), sandy beach (surf life saving and nipper activities, surf schools, surf competitions, sunbathing, socialising, sand play, jogging, walking, beach volleyball) and surrounding promenade and parklands (sightseeing and tour groups, walking, jogging, socialising, picnicking, relaxing, bicycling, skateboarding). Social and Economic Benefits Manly beach provides a focus for Manly as a tourist destination. The high volumes on visitors to the area provide a wide ranging customer base which benefits local businesses. The beach culture has also seen the associated development of recreational clubs and groups providing a range of activities and services to residents of the area. Media Review Manly Beach is often cited in the media as one vulnerable to sand erosion. Media commentary to date has focused on the impacts of sand erosion on the amenity of the area and the emergency plans put in place by Manly Council to combat sand erosion. Media reports of future options for nourishment of Manly Beach have been within general discussions of Australia wide beach nourishment options Do Nothing Scenario If no action to mitigate the effects of sea-level rise and beach erosion is taken at Manly Ocean Beach potential impacts will include: Loss or damage to Manly Surf Life Saving Club, North Steyne Surf Life Saving Club and Queenscliff Surf Life Saving Club. Loss or damage to recreational facilities including the promenade and associated car parking. Loss of heritage sites including the Norfolk Island Pines. Loss of sandy beach amenity and impeded access for beach users. Loss of local revenue from learn to surf schools, and professional surfing tournaments. The social implications associated with the do-nothing scenario are immense and predominantly negative Nourishment If a beach nourishment programme is commenced to mitigate the effects of sea-level rise and beach erosion Manly Ocean Beach will remain unchanged and beach users will be able to enjoy the benefits of the sandy beach and coastal area into the future. Social implications are predominantly positive and beneficial for beach users. Depending on the funding mechanism for the nourishment programme, some people may not be accepting of the costs associated with the nourishment programme, particularly if they are not beach users. 9.4 Economic The technique of cost-benefit analysis has been used to evaluate the net economic benefit of investment in a beach nourishment programme to mitigate the loss of beach amenity from reduced beach width as a result of future sea-level rise associated with climate change. The loss of beach amenity has the potential to cause economic costs, and it is the avoidance of these costs which is the economic benefit of the programme. The cost-benefit analysis involved a comparison of the expected situation with the programme against the expected situation without the programme, the latter being referred as the base case. The investment case is evaluated on an incremental basis from the base case. The evaluation is to assess whether the economic benefits of implementing a beach nourishment programme exceed the economic costs of providing the programme. The evaluation is conducted over a 50-year period, because of the long-term nature of sea-level rise associated with climate change. In conducting a cost-benefit analysis at a strategic level, it is standard practice to omit: Revision C - 18 February
116 Beach Sand Nourishment Scoping Study - Maintaining Sydney's Beach Amenity Against Climate Change Sea Level Rise a) Expenditures which are common to the base case and the investment case. For instance, any expenditures on lagoon entrance clearance, dune vegetation, seawalls and other protection works, etc. do not need to be included if they are common to the base case and the investment case. b) Minor capital or operating expenditures on beach management in the base case. This is because of the order of accuracy of the cost estimates for the investment case. This means that the estimated capital and operating costs of the investment case represent the incremental costs to be used in the cost-benefit analysis. The methodology for valuing the economic benefits of the beach nourishment programme is described in Appendix H. The parameter values used in the cost-benefit analysis are outlined below Costs The relevant capital and recurrent costs for the Manly beach nourishment programme are given in Table 9.1. Table 9.1 Beach Nourishment Programme Cost Estimates a) Manly Ocean Beach 1st 10-year Campaign Following 10-year Campaigns Capital Unit Costs ($/m 3 ) Unit Costs ($/m 3 ) Dredging & nourishment Other Total Recurrent Unit Costs ($/m 3 ) Unit Costs ($/m 3 ) Monitoring Management Total Sand Volume (m 3 ) 625, ,348 Total Costs ($ 000) Total Costs ($ 000) Capital 14,223 5,109 Recurrent 1,388 1,104 Note: a) Derived from Tables 7.1 & 7.2 by separating out recurrent costs from the engineering cost estimates Benefits The quantified benefits of the Manly beach nourishment programme are summarised in Table 9.2. The detailed calculations are presented in Appendix H. Total benefits shown allow for the application of an uplift factor to gross value added (GVA), which would provide for some allowance for the value of non-traded attributes associated with beach amenity (these attributes include consumer surplus, which is the value of the beach to people over and above that indicated by expenditure). The sensitivity of the economic results to the uplift factor is assessed in Section Table 9.2 Beach Nourishment Programme Quantified Benefits Manly Ocean Beach Avoided Loss a) Year Rate Revenue Residential ending June b) GVA c) Non-traded Tax Value d) Business f) Property Value g) Revenue h) Total , , , , , , ,313 4, , ,040 1, ,751 6, , ,800 1, ,189 8, ,769 Notes: a) Assumes beach width is an indicator of beach amenity and a linear relationship applies between the loss of beach width and the loss of economic value from flow-on effects. Based on existing average beach width of 50 metres and beach width receding five metres every ten years. b) First full year following each beach nourishment. Revision C - 18 February
117 Beach Sand Nourishment Scoping Study - Maintaining Sydney's Beach Amenity Against Climate Change Sea Level Rise c) GVA is gross value added and measures the total market value of output less net taxes (such as GST and excise duties). GVA per business is sourced from Tourism Research Australia (2009), Table 12; it has been adjusted for output that is not related to beach visits. The contribution of beach-related activities by type of business is: 33% for cafes, restaurants & take-aways; 33% for clubs, pubs, taverns & bars; 70% for accommodation; 33% for retail (the number of retail businesses excludes those primarily serving local residents, e.g. homewares); 10% for galleries, museums, etc; and 100% for businesses providing on-beach activities. Updated to 2009/10 by change in household final consumption expenditure from December Quarter d) Non-traded attributes of beach amenity valued at 40% of GVA (average of ratios reported in other studies refer Appendix H). e) Based on average rate revenue per occupied private dwelling of $824; 500 occupied private dwellings affected (those along North Steyne); and property value differential of 30% between the base case and the investment case. Also, allows for properties within easy walking distance (500m) of beach. f) Businesses located in Manly Business District; includes special purpose rate for Manly Business Centre Improvements. Adjusted for rates attributable to beach amenity refer Appendix H. g) Reflects the impacts of beach amenity on residential property values, assuming that property value is an indicator of willingness to pay for beach amenity. h) Average tax rate on tourism industry products is 21% - sourced from Tourism Research Australia (2008), page 8. This compares to the overall industry average of 9-10%. The following data/information needs to be verified during project development from the results of the Sydney Beaches Valuation Project being conducted for the SCCG by Dave Anning at UNSW or from additional specificpurpose surveys: Percentage of day visitors and overnight visitors attracted to Manly by the ocean beach. Number of beach visits and average expenditure per beach visit by visitors and residents. Consumer surplus ( willingness to pay ) associated with a beach visit. Number of retail outlets primarily serving Manly residents. Property value attributable to beach amenity Cost-Benefit Analysis Results The cost-benefit analysis was undertaken over a 50-year period, using a real discount rate of 7% (alternative discount rates were used in the sensitivity analysis). All costs and benefits were expressed in 2009 prices, and 2009/10 was adopted as the discount year. Appendix H contains the parameter values and the detailed cost and benefit streams on which the cost-benefit analysis was based. The results of the cost-benefit analysis are summarised in Table 9.3. Revision C - 18 February
118 Beach Sand Nourishment Scoping Study - Maintaining Sydney's Beach Amenity Against Climate Change Sea Level Rise Table 9.3 Economic Evaluation Results Manly Ocean Beach Incremental to without beach nourishment case ($ 000 in 2009 prices) Total cost a) $91,967 Present value b) Dredging & nourishment costs 17,733 Management & monitoring costs 17,232 Total costs 34,965 Avoided loss of: Gross value added 18,843 Non-traded value 7,537 Rates revenue Residential 1,614 Business 10,852 Residential property value 40,344 Tax revenue 3,957 Total benefits 83,148 Net present value $48,183 Benefit-cost ratio 2.4 Economic internal rate of return 20% Notes: a) Calculated from cost estimates in Table 9.1. b) Discounted to 2009 /10 at 7% real discount rate. Table 9.3 shows that the sand nourishment programme is economically viable, with a net present value of $48M, a benefit-cost ratio of 2.4 and an economic internal rate of return of 20%. The value of the benefit-cost ratio indicates that, on the basis of the quantified benefits, the programme is expected to provide high value for money. Generally, a project requires a benefit-cost ratio in excess of 2.0 in order to be considered as providing high value for money. The main quantified benefits are the avoided loss of: Residential property values attributable to beach amenity (49% of total quantified benefits). Expenditure by beach visitors (23%). Rates revenue from businesses in the Manly Business District as a result of lower property values (13%). Non-traded value (consumer surplus) associated with beach visits (9%) Sensitivity Analysis The following sensitivity tests were undertaken to assess the robustness of the economic results: Alternative real discount rates of 4% and 10%. Uplift factor of 1.1 applied to GVA (1.4 in the main analysis). Exponential relationship between beach width and beach amenity (linear relationship in the main analysis). 30% increase in project cost estimates. 30% decrease in project benefits. The results of the analysis are shown in Table 9.4. Revision C - 18 February
119 Beach Sand Nourishment Scoping Study - Maintaining Sydney's Beach Amenity Against Climate Change Sea Level Rise Table 9.4 Sensitivity Analysis Results Manly Ocean Beach Incremental to without beach nourishment case Main Evaluation a) Net present value $48.2M Benefit-cost ratio 2.4 Economic internal rate of return 20% Real discount rate of 4% Net present value $110.7M Benefit-cost ratio 3.3 Economic internal rate of return 20% Real discount rate of 10% Net present value $22.4M Benefit-cost ratio 1.8 Economic internal rate of return 20% Uplift factor of 1.1 applied to GVA Net present value $42.5M Benefit-cost ratio 2.2 Economic internal rate of return 18% Exponential relationship between beach width and beach amenity Net present value $97.7M Benefit-cost ratio 3.8 Economic internal rate of return 34% 30% increase in project cost estimates Net present value $37.6M Benefit-cost ratio 1.8 Economic internal rate of return 14% 30% decrease in project benefits Net present value $23.2M Benefit-cost ratio 1.7 Economic internal rate of return 13% 30% increase in project cost estimates and 30% decrease in project benefits Net present value $12.7M Benefit-cost ratio 1.3 Economic internal rate of return 10% Note: a) From Table 9.3. Revision C - 18 February
120 Beach Sand Nourishment Scoping Study - Maintaining Sydney's Beach Amenity Against Climate Change Sea Level Rise Table 9.4 shows that the economic viability of the sand nourishment programme is robust. The programme remains economically viable in all of the sensitivity tests undertaken. The sensitivity analysis shows that the economic results are more sensitive to variations in benefits than costs. One of the sensitivity tests involves a lower real discount rate of 4%. A lower discount rate is increasingly being adopted in other countries for the economic appraisal of social and environmental projects with long-term benefits. A real discount rate of 4% rather than 7% increases the benefit-cost ratio from 2.4 to Summary of Economic Viability The main cost-benefit analysis showed that the sand nourishment programme is economically viable and is expected to provide high value for money. The sensitivity analysis confirmed the robustness of this result, with all of the sensitivity tests showing an economically viable programme. Adopting a lower discount rate, as is increasingly the overseas practice in economic appraisal of social and environmental projects with long-term benefits, increases the benefit-cost ratio from 2.4 to 3.3. Revision C - 18 February
121 Chapter 10 Case Study 3: Bate Bay
122
123 Beach Sand Nourishment Scoping Study - Maintaining Sydney's Beach Amenity Against Climate Change Sea Level Rise 10.0 Case Study 3: Bate Bay This chapter considers the social and economic implications of a sand nourishment campaign for Bate Bay. Chapter Summary Bate Bay has been selected as one of the three case study beaches for a number of reasons. It is the longest beach in Sydney, has a history of storm damage, has an extensive dune system and is the only suburban beach with direct access to the rail system. Along the majority of the beach, backed by a dune system, the shoreline could be allowed to continue to recede and the beach amenity will remain constant. Nourishment efforts could be concentrated towards the southern end of the beach where beach amenity would most likely be threatened. The placement of 1.5m 3 (or 400m 3 /m length of beach along the entire beach) of sand from the Cape Banks borrow site will improve beach amenity by extending the mean beach width. This will also provide some additional buffer against storm erosion and additional protection of the vulnerable seawall at the southern end of the beach. The cost-benefit analysis demonstrates that the proposed beach nourishment programme is economically viable it produced a net present value of $13M, a benefit-cost ratio of 1.2 and an economic internal rate of return of 8%. However, the value of the benefit-cost ratio indicates that, on the basis of the quantified benefits, the programme is expected to provide low value for money. The whole of Bate Bay may not require nourishment because a considerable extent of the shoreline contains a natural dune system. Therefore a smaller sand nourishment volume for Bate Bay will generate a higher economic return. Bate Bay is located 20km to the south-east of the Sydney CBD and extends from the suburb of Cronulla at the southern corner to Boat Harbour in the north. The beach is 5.5km long and is known, from south to north as; South Cronulla, North Cronulla, Elouera, Wanda and Boat Harbour. South Cronulla is a small beach and is separated from North Cronulla by a rock shoreline. The area was settled by Europeans in the mid 1800 s. At this time the area was largely covered by sand dunes and native grasses. The early settlers attempted to establish a variety of agriculture, including sheep and cattle. The cattle ate all the grass covering the dunes. Once the original grass was lost, the dunes migrated north. American bull grass was planted in an attempt to stabilise the dunes. The area was subdivided in the early 20th century. A train line was constructed to Sutherland and then to Cronulla. After World War II many people moved to the area and it became urbanised. Figure 10.1 Bate Bay 1930 s showing denuded dunes in background and stabilised dunes in Cronulla is the only Sydney ocean beach serviced by train. Consequently, the beach is popular with public transport commuters. The beaches of Cronulla are enjoyed by surfers with some of the best surfing breaks in Australia. Cronulla was officially cited as a National Surfing Reserve in 2008 by the NSW Department of Lands. This designation highlights the social significance of the area and provides legal protection to ensure the beaches of Cronulla are accessible to surfers and everyone else who wants to enjoy them. The area is also popular for other ocean activities such as swimming and fishing. The beaches of Cronulla are serviced by four surf lifesaving clubs; Wanda, Elouera, North Cronulla and Cronulla. The beaches are patrolled by professional lifeguards employed by Sutherland Shire Council. A unique feature of Cronulla, compared with most other Sydney beaches, is the extensive dune system (Figure 10.1). The sand dunes at the northern end of the beach were extensively mined during the 20th century. The dunes were originally 50-60m high. Revision C - 18 February
. Following the storm damage, comprehensive coastal process studies and monitoring programmes were implemented, from which a management plan was developed (PBP 2006).")
124 Beach Sand Nourishment Scoping Study - Maintaining Sydney's Beach Amenity Against Climate Change Sea Level Rise Large storms in 1974 caused extensive damage to the beaches and dune system at Cronulla (Figure 1.3). Following the storm damage, comprehensive coastal process studies and monitoring programmes were implemented, from which a management plan was developed (PBP 2006). The emphasis of the management plan was to develop a soft management strategy aimed at establishing a well-vegetated fore-dune throughout as much of the embayment as possible. Four significant nourishment projects have been undertaken on the Bate Bay Beaches, , and These nourishment programmes are described in more detail in Section A 340m long Seabee seawall was constructed in 1985/86 at South Cronulla to protect the Prince St roadway (Figure 1.3). This seawall was recently damaged during storms. Bate Bay has been selected as one of the three case study beaches for a number of reasons. It is the longest beach in Sydney, has a history of storm damage, has an extensive dune system and is the only suburban beach with direct access to the rail system. Many local businesses rely on the existence of the beach and a loss of beach amenity would have a devastating impact on economic turnover. A loss of the beach amenity would also significantly impact the sub-aerial and inter-tidal coastal environment Physical The embayment is essentially a closed sediment system bounded by rocky headlands and submerged reefs. Prominent features include Merries Reef to the north and Shark Island to the south. A 30m deep bed depression is evident to the west of Merries Reef. The beach has a typical slope of 1 in 50 and consists of fine to medium grained golden sand to a depth of approximately 10m LAT (Figure 10.2). At depths greater than 10m the sand is classified as coarse grained and is orange in colour. Typical D 50 sand grain size is 0.35mm (excluding shell fragments). The sand has a shell content of 30 to 40%. Merries Reef Shark Island Figure 10.2 Bate Bay PBP (2001b) used a wave refraction analysis technique to estimate longshore sand transport within the bay. PBP (2001b) found that the net average longshore sand transport was 40,000m 3 /yr to the north in the southern portion of the embayment, 20,000m 3 /yr to the north within the central portion of the embayment and essentially a very small (1,000m 3 /yr) net transport to the south within the northern section of the embayment. The lower longshore transport rates in the northern section of the embayment are attributed to protection provided by Merries Reef and the orientation of the shoreline to the prevailing wave climate. Subsequently, PBP (2006) conclude that long term shoreline erosion occurs in the southern section of the embayment and long term accretion towards the northern section of the embayment. Revision C - 18 February
125 Beach Sand Nourishment Scoping Study - Maintaining Sydney's Beach Amenity Against Climate Change Sea Level Rise Photogrammetric analysis has been undertaken during previous investigations of Bate Bay (PBP 2006) with beach width estimated for beach segments defined in Table Table 10.1 Bate Bay Average and Maximum Beach Width from Photogrammetry /2001 (PBP 2006) Beach Segment Average Beach Width Maximum Beach Width Cronulla Seawall (2001) 40m 60m 1 North Cronulla (1999) 40m 50-60m Elouera (1999) 40m 50m Wanda (1999) 40m 50m Note: 1 A minimum beach width of 25m was estimated following the 1974 storms. Following the 1978/79 nourishment campaign the beach width increased to 80m Do Nothing Scenario PBP (2006) noted that earlier investigations report long term shoreline recession from 1890 to 1970 with rates of up to 2m/yr. PBP (2006) also note that stabilisation and revegetation of the dune system in the central section of the embayment appeared to have curtailed further recession in this region. Based solely on a 200mm sea-level rise between 1870 and the present, the theoretical recession of dune backed Bate Bay Beaches, using the Bruun Rule, is approximately 10m. Using an upper-bound estimate for sea-level rise of 0.1m every 10 years, the beach would theoretically recede a further 5m every 10 years. The present average beach width (Table 10.1) determined from photogrammetry is approximately 40 m (PBP 2006). At the Cronulla Seawall, where the shoreline cannot recede, the beach width would theoretically reduce by 5m every 10 years, based on an upper-bound estimate for sea-level rise of 0.1m every 10 years. Therefore, in 30 years the average beach width at Cronulla Seawall would be equivalent to the beach width following the 1974 storms Nourishment Requirements The volume of native sand required to accommodate past sea-level rise (0.2m), and for the next 10 year period (0.1m) is 1.3Mm 3. The placement of 1.3Mm 3 would improve beach amenity by extending the mean beach width by an average of 15m. This is equivalent to 1.5Mm 3 (or 400m 3 /m length of beach) of sand from the Cape Banks borrow site. This would also provide some additional buffer for storm demand and additional protection of the vulnerable seawall. Subsequent nourishment campaigns are scheduled at sea-level rise increments of 0.1m (i.e. each 10 years). This is equivalent to approximately 130m 3 /m length of beach of sand from the Cape Banks borrow site. Along the majority of the beach, backed by a dune system, the shoreline could continue to recede without major impacts to beach amenity or infrastructure. Therefore, nourishment may not be required along the majority of the beach. Nourishment efforts could be concentrated towards the southern end of the beach, where beach amenity would most likely be threatened. Consequently, the first nourishment campaign could require sand volumes substantially less than the estimated 1.3Mm 3. Sand transport processes at the southern end of the beach and their impacts on nourishment volumes would require further investigation when considering this nourishment option Environmental Bate Bay contains a number of aquatic habitats, including intertidal rock platforms, subtidal rocky reefs, sandy beaches, subtidal soft sediments and seagrasses (PBP 2003). The aquatic flora and fauna assemblages found at the rock platforms at Potter Point and around Cronulla are considered to be typical of those found at rock platforms in the Sydney region. Nevertheless, concern has been expressed by Coastal Management Committee members at the degradation of the rocky platform ecology due to excessive collection and human interference. The aquatic flora of the rock platforms is dominated by species of algae such as Ulva lactuca, Corallina officianalis and several species of filamentous red algae. Ulva lactuca is the dominant species immediately adjacent to the sewage outfall at Potter Point. Barnacles, limpets, anemones and ascidians are the most dominant animals in the intertidal zone of the rock platforms. The sub-tidal reefs in Bate Bay are dominated by algae such as Ecklonia radiata (kelp), Sargassum sp., Padina pavonea and Corallina officianalis in the shallow areas while in deeper water these species are joined by species such as Phyllospora comosa and Amphiroaa sp (PBP 2003). Revision C - 18 February
126 Beach Sand Nourishment Scoping Study - Maintaining Sydney's Beach Amenity Against Climate Change Sea Level Rise There are two areas of seagrass within Bate Bay. There is a large bed of Posidonia at Jibbon Beach and there is a large bed of paddleweed (Halophila) on the north western side of Merries Reef. The presence of the Halophila is unusual as this seagrass does not usually occur on exposed NSW coastlines and its existence is thought to be due to the protection afforded by Merries Reef. The bed is considered to be rare or possibly even unique in a regional context and should be protected (PBP 2003). On 31 March 2002, Boat Harbour Aquatic Reserve was declared under section 194 of the Fisheries Management Act The National Parks and Wildlife Service (NPWS) has indicated it is seeking to establish a nature reserve over the rocky platform of Merries Reef and the adjacent sandy shore for the protection of migratory wading birds and other important bird species. This would complement the existing Aquatic Reserve managed by NSW Fisheries (PBP 2003) Do Nothing Scenario At South Cronulla, sea-level rise and erosion will reduce the width of the beach until no inter-tidal beach remains, resulting in a deterioration of the beach ecosystem. Along the majority of the beach, backed by the dune system, the shoreline will continue to recede but the beach amenity will remain constant Nourishment Impacts The generic inter-tidal and subaqueous ecological impacts of a nourishment campaign for all of Sydney s beaches are described in Section 6.3 of this report. Of particular concern at Cronulla is the potential smothering of seagrass fields and the subaqueous rocky reefs and their associated flora and fauna. Nourishment could potentially result in the permanent loss or redistribution of seagrasses and algae such as kelp. Monitoring of these key ecological issues will need to be considered as part of a proposed nourishment campaign Social Community Priorities The Sutherland Shire community and their Local Government representatives have a high level of interest in promoting a sense of community and culture. Sutherland s vision for the future, as presented in the Sutherland Shire Council publication Our Guide to Shaping the Shire to 2030, is for: "A community working together, to attain safe, healthy and active lifestyles, through accountable decision-making, that achieves sustainable development and economic opportunities, which respect people and nature." Key priorities for the area include: People Creating a safe and harmonious community founded on social networks, community participation and healthy and active lifestyle supported by a range of community facilities and services. Place Maintaining access to suitable housing, transport, public facilities and economic opportunities that reflect the needs of a changing population and acknowledging the importance of historically and culturally significant places to the Shire s identity for both current and future generations. Nature Nurturing the natural environment through environmentally friendly approaches to living and minimising the environmental, economic and social impacts of disasters. Media Review Cronulla beach is cited in the media as one vulnerable to sand erosion. Reference to Cronulla Beach has been within general discussion of coastal erosion and beach nourishment. There have been limited references to issues specific to Cronulla Do Nothing Scenario If no action to mitigate the effects of sea-level rise and beach erosion is taken at Cronulla beach, potential impacts will include, but not be limited to, the following: Loss or damage to Cronulla Surf Life Saving Club Loss or damage to recreational facilities in the vicinity of South Cronulla Loss of sandy beach amenity and impeded access for beach users in the vicinity of South Cronulla Revision C - 18 February
127 Beach Sand Nourishment Scoping Study - Maintaining Sydney's Beach Amenity Against Climate Change Sea Level Rise Loss of local revenue from learn to surf schools, and professional surfing tournaments The social implications associated with the do-nothing scenario are immense and predominantly negative Nourishment If a beach nourishment programme is commenced to mitigate the effects of sea-level rise and beach erosion, Cronulla beach will remain unchanged and beach users will be able to enjoy the benefits of the sandy beach and coastal area into the future. Social implications are predominantly positive and beneficial for beach users. Depending on the funding mechanism for the nourishment programme, some people may not be accepting of the costs associated with the nourishment programme, particularly if they are not beach users Economic The technique of cost-benefit analysis has been used to evaluate the net economic benefit of investment in a beach nourishment programme to mitigate the loss of beach amenity from reduced beach width as a result of future sea-level rise associated with climate change. The loss of beach amenity has the potential to cause economic costs, and it is the avoidance of these costs which is the economic benefit of the programme. The cost-benefit analysis involved a comparison of the expected situation with the programme against the expected situation without the programme, the latter being referred as the base case. The investment case is evaluated on an incremental basis from the base case. The evaluation is to assess whether the economic benefits of implementing a beach nourishment programme exceed the economic costs of providing the programme. The evaluation is conducted over a 50-year period, because of the long-term nature of sea-level rise associated with climate change. In conducting a cost-benefit analysis at a strategic level, it is normal practice to omit: a) Expenditures which are common to the base case and the investment case. For instance, any expenditures on lagoon entrance clearance, dune vegetation, seawalls and other protection works, etc. do not need to be included if they are common to the base case and the investment case b) Minor capital or operating expenditures on beach management in the base case. This is because of the order of accuracy of the cost estimates for the investment case This means that the estimated capital and operating costs of the investment case represent the incremental costs to be used in the cost-benefit analysis. The methodology for valuing the economic benefits of the beach nourishment programme is described in Appendix H. The parameter values used in the cost-benefit analysis are outlined below Costs The relevant capital and recurrent costs for the Bate Bay nourishment programme are given in Table Table 10.2 Beach Nourishment Programme Cost Estimates a) Bate Bay 1st 10-year Campaign Following 10-year Campaigns Capital Unit Costs ($/m 3 ) Unit Costs ($/m 3 ) Dredging & nourishment Other Total Recurrent Unit Costs ($/m 3 ) Unit Costs ($/m 3 ) Monitoring Management Total Sand Volume (m 3 ) 1,515, ,940 Total Costs ($ 000) Total Costs ($ 000) Capital 34,471 12,381 Recurrent 3,364 2,676 Note: a) Derived from Tables 7.1 & 7.2 by separating out recurrent costs from the engineering cost estimates. Revision C - 18 February
128 Beach Sand Nourishment Scoping Study - Maintaining Sydney's Beach Amenity Against Climate Change Sea Level Rise Benefits The quantified benefits of the Bate Bay nourishment programme are summarised in Table The detailed calculations are presented in Appendix H. Total benefits shown allow for the application of an uplift factor to gross value added (GVA), which would provide for some allowance for the value of non-traded attributes associated with beach amenity (these attributes include consumer surplus, which is the value of the beach to people over and above that indicated by expenditure). The sensitivity of the economic results to the uplift factor is assessed in Section Table 10.3 Beach Nourishment Programme Quantified Benefits Bate Bay Avoided Loss a) Year Rate Revenue Residential ending June b) GVA c) Non-traded Tax Value d) Business f) Property Value g) Revenue h) Total , , , , , , , , , , , ,526 1, , ,891 Notes: a) Assumes beach width is an indicator of beach amenity and a linear relationship applies between the loss of beach width and the loss of economic value from flow-on effects. Based on existing average beach width of 50 metres and beach width receding five metres every ten years. b) First full year following each beach nourishment. c) GVA is gross value added and measures the total market value of output less net taxes (such as GST and excise duties). GVA per business is sourced from Tourism Research Australia (2009), Table 12; it has been adjusted for output that is not related to beach visits. The contribution of beach-related activities by type of business is: 59% for cafes, restaurants & take-aways; 59% for clubs, pubs, taverns & bars; 90% for accommodation; 59% for retail (the number of retail businesses excludes those primarily serving local residents, e.g. homewares); 10% for galleries, museums, etc; and 100% for businesses providing on-beach activities. Updated to 2009/10 by change in household final consumption expenditure from December Quarter d) Non-traded attributes of beach amenity valued at 40% of GVA (average of ratios reported in other studies refer Appendix H). e) Based on calculations from Sutherland Shire Council for properties in Prince Street and in the Eloura Rd/Bate Bay area; and property value differential of 40% between the base case and the investment case. Also, allows for properties within easy walking distance (500m) of beach. f) Businesses located in Cronulla CBD. Adjusted for rates attributable to beach amenity refer Appendix H. g) Reflects the impacts of beach amenity on residential property values, assuming that property value is an indicator of willingness to pay for beach amenity. h) Average tax rate on tourism industry products is 21% - sourced from Tourism Research Australia (2008), page 8. This compares to the overall industry average of 9-10%. The following data/information needs to be verified during project development from additional specific-purpose surveys: Percentage of day visitors and overnight visitors attracted to Cronulla by the beach Number of beach visits and average expenditure per beach visit by visitors and residents Consumer surplus ( willingness to pay ) associated with a beach visit Number of retail outlets primarily serving Cronulla residents Property value attributable to beach amenity Revision C - 18 February
129 Beach Sand Nourishment Scoping Study - Maintaining Sydney's Beach Amenity Against Climate Change Sea Level Rise Cost-Benefit Analysis Results The cost-benefit analysis was undertaken over a 50-year period, using a real discount rate of 7% (alternative discount rates were used in the sensitivity analysis). All costs and benefits were expressed in 2009 prices, and 2009/10 was adopted as the discount year. Appendix H contains the parameter values and the detailed cost and benefit streams on which the cost-benefit analysis was based. The results of the cost-benefit analysis are summarised in Table Table 10.4 Economic Evaluation Results Bate Bay Incremental to without beach nourishment case ($ 000 in 2009 prices) Total cost a) $224,680 Present value b) Dredging & nourishment costs 43,922 Management & monitoring costs 41,762 Total costs 85,685 Avoided loss of: Gross value added 12,523 Non-traded value 5,009 Rates revenue Residential 4,616 Business 2,200 Residential property value 71,650 Tax revenue 2,630 Total benefits 98,627 Net present value $13,484 Benefit-cost ratio 1.2 Economic internal rate of return 8% Notes: a) a) Calculated from cost estimates in Table 9.2. b) b) Discounted to 2009 /10 at 7% real discount rate. Table 10.4 shows that the sand nourishment programme is economically viable, with a net present value of $13M, a benefit-cost ratio of 1.2 and an economic internal rate of return of 8%. However, the value of the benefit-cost ratio indicates that, on the basis of the quantified benefits, the programme is expected to provide low value for money. Generally, a project requires a benefit-cost ratio in excess of 1.5 in order to be considered as providing reasonable value for money. The main quantified benefits are the avoided loss of: Residential property values attributable to beach amenity (73% of total quantified benefits) Expenditure by beach visitors (13%) Rates revenue from residential properties within walking distance of the beach as a result of lower property values (5%) Non-traded value (consumer surplus) associated with beach visits (5%). Revision C - 18 February
130 Beach Sand Nourishment Scoping Study - Maintaining Sydney's Beach Amenity Against Climate Change Sea Level Rise Sensitivity Analysis The following sensitivity tests were undertaken to assess the robustness of the economic results: Alternative real discount rates of 4% and 10%; Uplift factor of 1.1 applied to GVA (1.4 in the main analysis); Exponential relationship between beach width and beach amenity (linear relationship in the main analysis); 30% increase in project cost estimates; and 30% decrease in project benefits. The results of the analysis are shown in Table Table 10.5 shows that the economic viability of the sand nourishment programme is not robust. The programme is not economically viable in most of the sensitivity test cases undertaken. However, the sensitivity analysis shows that the economic results are particularly sensitive to the shape of the relationship applying between beach width and the loss of economic value from flow-on effects of reduced beach amenity. The use of an exponential rather than linear relationship increases the benefit-cost ratio from 1.2 to 1.8. One of the sensitivity tests involves a lower real discount rate of 4%. A lower discount rate is increasingly being adopted in other countries for the economic appraisal of social and environmental projects with long-term benefits a real discount rate of 4% rather than 7% increases the benefit-cost ratio from 1.2 to 1.6. Table 10.5 Sensitivity Analysis Results Bate Bay Incremental to without beach nourishment case Main Evaluation a) Net present value $13.5M Benefit-cost ratio 1.2 Economic internal rate of return 8% Real discount rate of 4% Net present value $71.9M Benefit-cost ratio 1.6 Economic internal rate of return 8% Real discount rate of 10% Net present value -$8.8M Benefit-cost ratio 0.9 Economic internal rate of return 8% Uplift factor of 1.1 applied to GVA Net present value $9.7M Benefit-cost ratio 1.1 Economic internal rate of return 8% Exponential relationship between beach width and beach amenity Net present value $72.3M Benefit-cost ratio 1.8 Economic internal rate of return 15% 30% increase in project cost estimates Net present value -$12.1M Benefit-cost ratio 0.9 Economic internal rate of return 6% Revision C - 18 February
131 Beach Sand Nourishment Scoping Study - Maintaining Sydney's Beach Amenity Against Climate Change Sea Level Rise 30% decrease in project benefits Net present value Incremental to without beach nourishment case -$16.1M Benefit-cost ratio 0.8 Economic internal rate of return 5% 30% increase in project cost estimates and 30% decrease in project benefits Net present value -$41.6M Benefit-cost ratio 0.6 Economic internal rate of return b) Notes: a) From Table 9.4. b) Could not be calculated because of the profile of the net economic benefits stream Summary of Economic Viability The main cost-benefit analysis showed that the sand nourishment programme is economically viable but is expected to provide low value for money. The sensitivity analysis showed that the economic viability is not robust, with the programme not being economically viable in most of the sensitivity test cases. However, adopting a lower discount rate, as is increasingly the overseas practice in economic appraisal of social and environmental projects with long-term benefits, increases the benefit-cost from 1.2 to 1.6. The economic results are also sensitive to the shape of the relationship applying between beach width and the loss of economic value from the flow-on effects of reduced beach amenity. The use of an exponential rather than linear relationship increases the benefit-cost ratio from 1.2 to 1.8. Revision C - 18 February
132
133 Chapter 11 Sand Extraction and Nourishment Approval Process
134
135 Beach Sand Nourishment Scoping Study - Maintaining Sydney's Beach Amenity Against Climate Change Sea Level Rise 11.0 Sand Extraction and Nourishment Approval Process This chapter provides an overview of the key legislation and the likely approval process that influences the feasibility of the proposed beach nourishment project. Chapter Summary The extraction of marine aggregate for purposes of beach nourishment from NSW statutory waters requires satisfaction of one principal Commonwealth Act and two principal NSW Acts: 1) Commonwealth Environment Protection and Biodiversity Conservation Act 1999 (EPBC Act) 2) Offshore Minerals Act 1999 (OM Act) 3) Environmental Planning and Assessment Act 1979 (EP&A Act) An amendment to Schedule 2 of the OM Act and the introduction of companion regulations is required to enable a mining licence to be issued over an area of sand within the 3Nm limit before sand may be recovered for beach nourishment purposes Project Details In respect of the approvals process, the following assumptions have been made: Sand would be won from the ocean floor within 3 nautical miles (Nm) of the Sydney metropolitan coastline (water depth of approximately 25-70m). While sand bodies may exist more than 3Nm offshore, the focus of this report is on known sand bodies, which all exist within 3Nm of the shoreline Sand would be transported by waterborne craft (e.g. barge) The sand would be placed offshore of beaches along the Sydney Metropolitan coastline Beach nourishment would occur at approximately 10 year intervals for a period of 50 years It is not proposed to stockpile sand at any location on land, nor is it proposed to transport sand over land. The following sections summarise the key aspects of the planning approvals process that would apply to works of this nature as well as a description of lessons learned from past proposals for similar projects. A more comprehensive outline of the planning approvals process is provided in Appendix I Key Legislation This section provides an overview of the key legislation that influences the feasibility of the proposed beach nourishment project. The background discussion below (Section ) is informed by a Discussion Paper prepared by Rob Corkery (Principal), R.W. Corkery & Co Pty Ltd (RW Corkery), which is provided in Appendix I of this report Background Following the Constitutional Settlement of 1979, the Governments of NSW and the Commonwealth of Australia agreed that coastal waters adjacent to the NSW State boundary were recognised to be: NSW Statutory Waters for a distance of less than 3Nm from the coast (herein referred to as the baseline ) Commonwealth Statutory Waters for a distance of greater than 3Nm from the baseline In light of this Constitutional Settlement, it is a requirement for any person or enterprise to seek approvals under NSW legislation for the exploration and recovery of marine aggregate (sand) within the 3Nm limit. Conversely, it is a requirement for any persons or enterprise to seek approval under Commonwealth legislation for the exploration and recovery of marine aggregate beyond the 3Nm limit. Notwithstanding this agreement, there remains an understanding between the NSW and Commonwealth Governments that the views of the NSW Government would be sought regarding any proposals for exploration or mining beyond the 3Nm limit. This has in fact recently occurred with an application to the Commonwealth Government for a mineral exploration licence off the NSW Coast. Revision C - 18 February
136 Beach Sand Nourishment Scoping Study - Maintaining Sydney's Beach Amenity Against Climate Change Sea Level Rise Approvals process overview On the basis of this study, the extraction of marine aggregate for purposes of beach nourishment from NSW statutory waters requires satisfaction of one principal Commonwealth Act and two principal NSW Acts: Commonwealth Environment Protection and Biodiversity Conservation Act 1999 (EPBC Act) Offshore Minerals Act 1999 (OM Act) Environmental Planning and Assessment Act 1979 (EP&A Act). There are other Commonwealth and NSW Acts and regulations that must be addressed in order to gain approval, such as Protection of the Environment Operations Act 1997, Threatened Species Conservation Act 1995, Fisheries Management Act 1994, Telecommunications and Other Legislation Amendment (Protection of Submarine Cables and Other Measures) Act These and other relevant Acts are discussed in Appendix I of this report. Environment Protection and Biodiversity Conservation Act 2000 The Commonwealth Environment Protection and Biodiversity Conservation Act 1999 (EPBC Act) governs the Commonwealth environmental assessment process and provides protection for matters of National Environmental Significance (NES), which include: Nationally threatened species and ecological communities Australia s World heritage properties Ramsar wetlands of international importance Migratory species listed under the EPBC Act (species protected under international agreements) Commonwealth marine areas Nuclear actions, including uranium mining National heritage. The EPBC Act defines proposals that are likely to have an impact on a matter of NES as a controlled action. Proposals that are, or may be, a controlled action are required to be referred to the Commonwealth Minister for the Environment, Heritage and the Arts for a determination as to whether or not the action is a controlled action. The Project will likely require a referral to the Commonwealth Minister for the Environment, Heritage and the Arts for an assessment of whether or not it includes a controlled action under the EPBC Act. If the action is a controlled action, the Commonwealth Department of Environment, Water, Heritage and the Arts (DEWHA) will provide assessment requirements to be addressed under Part 3A of the EP&A Act, in accordance with the bilateral agreement. Investigations are required to determine the potential impact on matters of NES, including, but not limited to, the following items protected under the EPBC Act: Migratory species (e.g. whales) Marine fishes Important wetlands Offshore Minerals Act 1999 Sand, or marine aggregate, is recognised to be a mineral under Section 22 of the OM Act. To recover marine aggregate from the seabed within the 3Nm limit from the baseline, an enterprise is required to hold a mining licence under Part 2.4 of the OM Act. Since the OM Act has been gazetted (31 March 2000), no regulations have been gazetted or promulgated that will allow any enterprise to apply for a mining licence off the NSW coast. This situation reflects the current NSW Government draft policy statement opposing sand mining off the NSW coastline, both within and beyond the 3Nm limit. It is understood that this policy has been referred to by Government as recently as February At present, Clause 4 of Schedule 2 of the OM Act provides for Reserves No and 2894 to be reserves that prohibit mineral extraction under Section 18 of the OM Act. It would require an amendment to Schedule 2 of the OM Act and the introduction of companion regulations to enable a mining licence to be issued over an area of sand within the 3Nm limit before sand may be recovered for beach nourishment purposes. Changes of this magnitude will require considerable discussions with Government at the highest levels. Revision C - 18 February
137 Beach Sand Nourishment Scoping Study - Maintaining Sydney's Beach Amenity Against Climate Change Sea Level Rise The Department of Industry and Investment (Mineral Resources) has verbally advised that the reserved blocks exclude the areas that are subject to the existing exploration licences currently in force. Under Section 18(2) of the OM Act, the Minister may not declare a block in coastal waters to be a reserved block if a licence over that block is in force. As, in accordance with Clause 2 of Schedule 2 of the OM Act, exploration licences granted under the Mining Act 1992 are taken to be exploration licences under Part 2.2 of the OM Act. It follows that the reserved blocks do not affect the areas that are affected by the current exploration licences. Due to Government policy, acting upon the existing exploration licences would be difficult. The Department of Industry and Investment (Mineral Resources) has verbally advised that planning approval would be required for exploration for minerals. Due to current policy regarding offshore mineral recovery for commercial purposes, the State Government is unlikely to grant planning approval under the EP&A Act for such exploration activities. However, as these areas are excluded from the reserved blocks (that is, they would be standard blocks within the meaning of the OM Act) the Minister may grant a mining licence over these areas. Under Section 198(1) of the OM Act, the holder of exploration or retention licence may apply to the Minister for a mining licence over all or some of the blocks in the licence area. Environmental Planning and Assessment Act 1979 To obtain approval for the recovery of marine aggregate under the EP&A Act, it will be necessary for an enterprise to obtain project approval under Part 3A of the EP&A Act. Part 3A applies to major extractive industry projects such as extraction of marine aggregate that meets the following criteria: a) The total resource size exceeds 5Mt; or b) The annual production exceeds 200,000t/yr The Part 3A approval process is discussed in more detail in Appendix I of this report State Government policy in respect of offshore sand extraction for beach nourishment While there is a prohibition on offshore minerals extraction due to the effect of the OM Act, a report prepared by Patterson Britton & Partners for Byron Bay Shire Council (PBP 2006) titled Scoping Study on the Feasibility to Access the Cape Byron Sand Lobe for Sand Extraction for Beach Nourishment includes a discussion regarding the current government policy with respect to offshore sand extraction. The report states that a letter was written by the NSW Premier to The Northern Beaches Branch of the Surfrider Foundation Incorporated dated 6 March 2001, specifically in relation to Collaroy/Narrabeen Beach, which stated: As you are aware, the Government does not support offshore commercial sandmining, and the areas off the coast are currently protected by reserves under the Mining Act, which do not permit exploration or mining activity. Your proposal of dredging for beach nourishment, however, is a different matter, and bears further investigation. (PBP 2006) An officer of the Department of Primary Industries (Mineral Resources) has recently confirmed that the understanding of the Government s policy position, being opposed to offshore commercial sand mining remains. It is recommended that this position be formally confirmed with the NSW Minister for Mineral Resources Approvals Strategy Approvals Process The two key legislative approvals that would be required for recovery (or extraction) of sand from coastal waters for the purposes of beach nourishment are described in Table Revision C - 18 February
138 Beach Sand Nourishment Scoping Study - Maintaining Sydney's Beach Amenity Against Climate Change Sea Level Rise Table 11.1 Process for Key Legislative Approvals Act Approval Key Steps OM Act EP&A Act Licence for offshore sand recovery within NSW coastal waters. Part 3A planning approval for beach nourishment and associated off shore sand extraction. To obtain approval to engage in offshore recovery of sand (marine aggregate) the following tasks would be undertaken. Engage with Department of Primary Industries (Mineral Resources) to confirm approval process and licence requirements. From an initial review of the OM Act and discussions with officers of the Department of Planning and Department of Primary Industries(Mineral Resources) as part of preparing this study, the two alternative process are: a) If the area of coastal waters preferred for sand recovery is not affected by a reserved block 3 (i.e. within an existing exploration licence area): The exploration licence holder may apply for a mining licence under Section 198 of OM Act. b) If the area of coastal waters preferred for sand recovery is affected by a reserved block declaration (either within or outside existing exploration licence areas): Seek amendment of the reserved block (i.e. offshore mining reserve) affecting the preferred sand recovery site under Section 18 of OM Act to allow sand recovery (Section 12 of OM Act allows Minister to revoke or amend reserved block by notice published in the Gazette). Seek mining licence for recovery of minerals from coastal waters under Part 2.4 of the OM Act. Seeking a mining licence, regardless of the approval path under the OM Act, would require preparation and gazettal of an Offshore Minerals Regulation to support the application for such a licence. This would be undertaken by the NSW Government. Seek confirmation of the policy position of the NSW Government with respect to offshore sand recovery for beach nourishment purposes. This would constitute initiating the process for consideration of the proposal to recover sand from coastal waters for beach nourishment. Based on the findings of discussions, it is recommended that a briefing paper be developed for Ministerial consumption (if appropriate) that describes and justifies the proposal. This should outline the key approval process steps, being informed by this study. A Simplified Part 3A approval process would comprise the following steps: 1) Seek confirmation from the Minister for Planning that the proposed marine aggregate extraction (for beach nourishment) is a major development under Part 3A of the Act. 2) Prepare a Preliminary Environmental Assessment. 3) Prepare detailed studies to identify environmental constraints and design parameters. 4) Prepare a detailed project design. 5) Consult with key stakeholders (government agencies, community groups) and community. 6) Undertake detailed environmental assessment and prepare justification of proposal. 3 It is understood from discussions with an officer of the Department of Primary Industries (Mineral Resources) that the entire coast has been declared a reserved block, except those areas already granted an exploration licence Note, it is understood there are no existing mining or retention licences in NSW coastal waters. Revision C - 18 February
139 Beach Sand Nourishment Scoping Study - Maintaining Sydney's Beach Amenity Against Climate Change Sea Level Rise 7) Finalise the Environmental Assessment. 8) Exhibit and respond to submissions. 9) Minister s determination Approval Process Summary Feasibility Notwithstanding the potential environmental impacts and the need to undertake a comprehensive impact assessment (Chapter 12), the above process indicates that there is a feasible approval pathway for the proposed beach nourishment and sand extraction project under the OM Act and the EP&A Act Critical success factors Government support It is likely that the approval process will be complex and will involve a wide range of stakeholders. To avoid unreasonable delays or assessment requirements, it will be vital to seek government support at the outset of the project. In particular, it is recommended to seek support from the Minister for Planning and the Minister for Mineral Resources as key approval authorities, as well as the Minister for Environment and Climate Change with respect to determining environmental assessment requirements. Robust approvals Key factors to the success of the approval process(es) are: Robust approval Due to the potential for opposition to the project (based on current Government policy and community opposition to past offshore sand extraction proposals 4 ) it is important that the approval process be appropriate to minimise risk of third party challenge/appeal on procedural grounds. It is possible that third party appeals may occur on merit grounds, for which the risk can be minimised (but not eliminated) through comprehensive impact assessments using best practice methodologies. Flexibility Within the terms of the approval, flexibility is important to enable nourishment and extraction activities to respond to the coastal conditions that warrant beach nourishment. Adequate certainty The ability to act upon the approval granted at the outset of the project for future stages when the need is triggered, is important for the long term viability of the project. It is understood that offshore extraction will only be undertaken to provide the necessary material for beach nourishment and no stockpiling will occur. Accordingly the conditions that trigger the need for beach nourishment and extraction will require careful consideration as part of the application for planning approval. Consultation Due to the need for political support for the proposed offshore mineral extraction and the potentially controversial nature of the project in the wider community, it is recommended that a comprehensive Engagement Strategy be prepared to guide all discussions with stakeholders and the public. This strategy would: Describe key stages in the approval process and assign communication and engagement protocols for achieving desired outcomes Guide the timing and nature of project information that is released to stakeholders and to the community, to coincide with approval process(es) and formulation of project design/methodologies Key Recommended Studies and Further Work Community education and consultation on the nourishment programme. Formation of working group/s with key stakeholders. Political representation and support to amend Schedule 2 of the OM Act. 4 Metromix Pty Ltd (1993) and Goldfields Pty Ltd (early 1980s). Revision C - 18 February
140
141 Chapter 12 Environment Impact Assessment Requirements
142
143 Beach Sand Nourishment Scoping Study - Maintaining Sydney's Beach Amenity Against Climate Change Sea Level Rise 12.0 Environment Impact Assessment Requirements Chapter Summary The project is likely to be subject to planning approval under Part 3A of the EP&A Act. As part of the Part 3A approval process, environmental assessment requirements (commonly referred to as Director-General Requirements) are issued by the Department of Planning. The Environmental Assessment for the project must address all issues raised within the Director-General Requirements. Indicative environmental assessment requirements were obtained from Department of Environment, Climate Change and Water, and Industry and Investment NSW as part of the scoping study to identify likely studies that may be required before planning approval is granted. Additional studies and research will be required as part of the feasibility phase. A baseline data set will be required for benchmarking during the Part 3A approval process. The current NSW Government policy opposes sand mining off the NSW coastline, both within and beyond the 3Nm limit. At present, Clause 4 of Schedule 2 of the OM Act provides for reserves that prohibit extraction under Section 18 of the OM Act. It would require an amendment to Schedule 2 of the OM Act and the introduction of companion regulations to enable a mining licence to be issued over an area of sand within the 3Nm limit, to enable sand to be recovered for beach nourishment purposes. It is recommended that in-principle political, social and environmental support be granted prior to investment in additional studies and data collection. An estimate of all fees for the project including the additional studies is outlined in Section 7 of this report. In an attempt to appreciate the likely acceptance of a sand extraction project by State government agencies, and to gather preliminary environmental impact assessment requirements, key government agencies were consulted as part of this scoping study. Copies of the government agency responses are presented as Appendix J and are discussed below Director General Requirements under Part 3A The project is likely to be subject to planning approval under Part 3A of the EP&A Act (refer to Chapter 11 and Appendix I for a full discussion of the statutory framework and approval processes). One of the steps of a Part 3A planning approval process is the preparation of environmental assessment requirements by the Director-General of the Department of Planning (DoP). The environmental assessment requirements are needed under Section 75F of the EP&A Act and are commonly referred as Director-General s Requirements (DGRs). The purpose of the DGRs is to outline the level of assessment, general requirements and specific key issues that must be included within an Environmental Assessment for a particular project. The DGRs are tailored to a specific project and may also outline consultation requirements. When preparing the DGRs, the Department of Planning will consult with relevant government agencies and other key stakeholders with regard to their respective requirements for the project. The DGRs may also be informed by issues raised at a Planning Focus Meeting that is held for the project. The Director-General may require a Statement of Commitments to be included within the EA that documents the commitments a proponent is prepared to make to mitigate impacts associated with the proposal, including development contributions. An environmental risk analysis may also be required and would comprise potential environmental impacts associated with all phases of the project, proposed mitigation measures and residual environmental impacts. Prior to the EA being placed on public exhibition, DoP will review the document to determine if it adequately addresses the DGRs. If the EA is not adequate it will need to be revised. The public will have an opportunity to provide formal comment on the EA during the public exhibition phase. Depending on the nature of the public submissions, the project and design may need to be redefined. As such, it is crucial that the proponent understands issues early in the project planning and fully comprehends the assessment required within the EA, in an attempt to minimise undue costs and programme delays. Revision C - 18 February
144 Beach Sand Nourishment Scoping Study - Maintaining Sydney's Beach Amenity Against Climate Change Sea Level Rise Agency Consultation It is standard practice to formally request environmental assessment requirements from government agencies when a project is defined and an application is being made for planning approval. However, it is not standard practice to request environmental assessment requirements at such an early stage in project planning, prior to a project being defined. Despite this, consultation with agencies as part of this scoping study will allow SCCG to identify and appreciate likely key issues associated with the project. This will enable SCCG to have a greater confidence moving forward by being able to adequately plan (both future costs and timing) for later stages. This is critical for such a project where there are potentially many uncertainties and potential impediments associated with government support, stakeholder and community sentiment, and approvals. Although many agencies will need to be consulted as part of an environmental assessment for a sand extraction and beach nourishment project, two State agencies (Department of Industry and Investment and Department of Environment, Climate Change and Water) will have a central role in providing technical advice and guidance on an environmental assessment for such a project. Both agencies were consulted as part of the scoping study. The agencies were informed about the project and the motivation for requesting environmental assessment requirements at this stage. In accordance with the planning approval process within NSW it is not appropriate to request formal environmental assessment requirements prior to seeking approval. Based on this rationale, the agencies were asked to provide indicative assessment requirements to inform later stages of project development and to enable the SCCG to appreciate the likely requirements associated with such a project. If the location of sand extraction is within Commonwealth Waters, consultation with Department of Environment, Water, Heritage and the Arts (DEWHA) will also be required. The DEWHA requirements are likely to be similar to those received from the State agencies and will focus on potential impacts on Commonwealth matters of National Environmental Significance, which includes the Commonwealth marine environment (refer Chapter 11 for full discussion on Commonwealth planning approvals) Agency Responses Industry and Investment NSW Industry and Investment NSW (I&I NSW) was established earlier this year from three agencies including Primary Industries, State and Regional Development and Energy. I&I NSW was selected as a relevant regulatory agency to consult as a result of its interest in potential offshore environmental impacts associated with the project (including commercial fishing, recreational fishing, aquatic habitats, habitat management including threats to habitats, and species protection), as well as offshore resources and investment. Two separate divisions within I&I NSW were consulted: Mineral Resources and Fisheries. A copy of the I&I NSW response is provided in Appendix J and a summary of the key matters raised are outlined below: A proposal to extract sand in offshore waters would face many impediments including: - NSW Government opposition to sand mining off the NSW coastline - There is a reserve on the area covered by the Offshore Minerals Act 1999 that prevents the lodgement of any titles - Planning approval would likely be required under Part 3A of the EP&A Act. Indicative assessment requirements are as follows: I&I NSW require more detailed information to assess the potential impacts of the proposal on the marine environment and fisheries including: - Broad description of aquatic habitats, species and fisheries in the study area - Methods and locations of extraction and deposition and associated volumes and suitability of sand for beach nourishment - Predicted impacts on the aquatic habitats, species and fisheries - Proposed mitigation, offset and /or compensatory measures. Revision C - 18 February
145 Beach Sand Nourishment Scoping Study - Maintaining Sydney's Beach Amenity Against Climate Change Sea Level Rise Department of Environment, Climate Change and Water The Department of Environment, Climate Change and Water (DECCW) was selected as a relevant regulatory agency to consult as a result of its interest in the effects of climate change, water pollution, noise pollution, contamination and hazardous materials, as well as cultures and heritage. A copy of the DECCW response is provided in Appendix J and a summary of key matters raised are outlined below: The provision of indicative assessment requirements does not represent DECCW support for the project. The Minister for Climate Change and Environment has a concurrence role under the provisions of the Coastal Protection Regulation 2004 for development in the coastal zone between mean high water mark and the limit of the State s coastal waters. When making a concurrence determination the Minister is to consider the matters outlined in Section 44 of the Coastal Protection Act Indicative assessment requirements are as follows: The effects of dredging on and from the natural physical coastal processes are to be assessed including infilling mechanisms, alterations to wave climate and impact on neighbouring beaches. The effects of sand nourishment on and from the natural physical coastal processes of the nourished beachfront are to be assessed including: - Onshore and offshore and alongshore processes - Aeolian transport processes - Alteration to lagoon entrance dynamics and infilling mechanisms - Infilling of existing infrastructure including stormwater pipes and ocean pools - Headland bypassing under extreme storm events - Profile adjustment under a climate-induced sea-level rise. Environmental protection impacts associated with dredging and sand emplacement operations are to be assessed including impacts on water quality, noise emissions, air emissions including odour, contaminated sediments, impacts on threatened species, such as the little tern and beach stone-curlew, Aboriginal cultural heritage, and impacts on existing bathymetry Formal Environmental Assessment Requirements The matters raised by I&I NSW and DECCW should be considered as an indication of the likely environmental assessment requirements from those agencies for a sand extraction and beach nourishment proposal. That is, the matters raised by I&I NSW and DECCW should be considered to inform the next stage of the project, and act as a prompt to identify likely cost and time requirements (taking into account seasonality of surveys) to assist with determining the feasibility of the project. Formal environmental assessment requirements (in the form of Director General Requirements (DGRs)) will need to be requested from I&I NSW, DECCW, DoP and other relevant agencies when a project is defined and an application is being made for Part 3A planning approval. The request for DGRs is made when a project application is lodged with DoP together with a Preliminary Environmental Assessment report. The formal assessment requirements will replace the indicative assessment requirements obtained during this scoping study and should be used to guide the level of assessment required for planning approval. Refer to Chapter 11 and Appendix I for a full discussion of the statutory framework and approvals processes relevant to the project Community and Stakeholder Consultation The social acceptability of a sand extraction and beach nourishment project will hinge upon the availability and technical level of information surrounding the social, environmental and economic issues. In turn, the success of such a project will be delicately balanced on the level and quality of consultation undertaken with government, stakeholders, interested parties including indigenous communities, environmental organisations, and the media, as well as the general public. Revision C - 18 February
146 Beach Sand Nourishment Scoping Study - Maintaining Sydney's Beach Amenity Against Climate Change Sea Level Rise Consultation with the community and with stakeholders is a fundamental component of any environmental assessment undertaken under Part 3A. Consultation requirements vary from project to project and will be determined by the extent and magnitude of the likely environmental, social and economic impacts. These in turn will be dependent on the nature of the project, magnitude, location, duration of construction phase and residual impacts once the project is operational. Consultation requirements will be outlined within the DGRs and should be undertaken in accordance with a DoP publication that outlines guidelines for major project community consultation. Based on the information gathered during this scoping study, it is recommended that a Community and Consultation Strategy (CCS) be developed and implemented during subsequent stages of the project. Key objectives of the CCS should include: To develop information packages for stakeholders, local, State and Federal Governments, interested parties (including non-government organisations and indigenous communities) and the general public, that are based on factual and expert scientific information in an attempt to dispel historical myths associated with sand extraction and beach nourishment and to build an information base. To engage all relevant stakeholders, interested groups and the general community including locals, visitors (from within Australia) and tourists (international visitors) in an open and transparent process. To define key milestones to keep the community and general public well informed about likely project timing and duration through local updates in media. To nominate key project spokespeople, who are well informed and well respected, to deliver information about the project. To develop strong relationships with government, media groups and environmental organisations to ensure the right messages are being consistently delivered. A framework for the CCS is outlined in Chapter Required Studies and Data for Feasibility Phase and Part 3A Approval Process As outlined in this scoping study, a range of existing studies are available that document environmental impacts associated with sand extraction and beach nourishment. These studies have been undertaken for specific projects, predominantly related to mining the seafloor for commercial purposes. Depending on the confirmed location of sand extraction and beach nourishment activities, some data from existing studies may be extrapolated for use in this project. However, new studies will need to be undertaken to supplement the existing knowledge base and provide a comprehensive and current data set. The project parameters, including location of sand sources and beach nourishment, will be refined during the feasibility phase. Once the location of the project activities have been identified, the validity of existing studies can be reviewed and the need for additional studies confirmed. The focus of the additional studies will be on ensuring a comprehensive baseline data set exists for the study area. This data set will be used as a benchmark for studies undertaken as part of the Part 3A approval process. Studies required as part of the Part 3A planning approval will be detailed within the DGRs. The indicative assessment requirements obtained as part of this scoping study provide an indication as to the likely studies that should be undertaken to satisfy the requirements of State agencies. Based on the indicative assessment requirements the likely studies that will be required as part of the EA include the following: Aquatic ecology assessment. Terrestrial ecology assessment. Noise and vibration assessment. Air quality assessment. Socio-economic assessment. Hydrodynamics and coastal processes. Water quality assessment. Contaminated sediments, soil and groundwater investigation. Revision C - 18 February
147 Beach Sand Nourishment Scoping Study - Maintaining Sydney's Beach Amenity Against Climate Change Sea Level Rise Indigenous and historic heritage assessment. Sustainability and climate change. Landscape and visual amenity assessment. Waste management. Impacts on the marine environment will be a key issue for the project and therefore the aquatic ecology study has been outlined in more detail. The aquatic ecology assessment should provide a broad description of aquatic habitats, species and fisheries in the study area. The study methodology for an aquatic ecology assessment should comprise: Desktop research. Field investigations including SCUBA divers to undertake surveys of marine biota. Laboratory work. Data analysis. Impact assessment. Reporting. In particular, the impact assessment of an aquatic ecology assessment should focus on the following: Impacts on marine habitats, primary producers, benthic organisms, nektonic organisms, marine mammals and seabirds. Impacts on benthic macrofauna and demersal fish. Potential smothering of benthic communities. Impacts of increased turbidity from dredging. Effects on the marine environment due to operation of dredging equipment. Conflicts with other marine vessels and users including commercial and recreational fishers and divers. Direct and indirect effects on the inter-tidal habitat and subaqueous near-shore habitat. The level of assessment for each of the other studies will be confirmed once the project parameters have been defined Additional Studies and Data Numerous studies, public information seminars/workshops, data collection programmes and environmental monitoring programmes would need to be established when the project is commissioned. Prior to commissioning of the project, a host a programmes would need to be considered. The majority of these would be associated with the EA requirements, but some would also have an engineering consideration. Additional studies would include: Review and update the physical processes and impacts associated with offshore extraction at the potential borrow sites. This is essentially an extension of the investigations conducted for the Metromix Marine Aggregate Proposal by Geomarine Pty Ltd. It would update the science with recent developments and address other possible sand sources. Review and update the ecological processes and impacts associated with offshore extraction at the potential borrow sites. This is essentially an extension of the work undertaken for the Metromix Marine Aggregate Proposal by The Ecology Lab Pty Ltd. Establish an ecological monitoring programme for the pre-commissioning phase of the project, but also consider the commissioning and post-commissioning stages of the project. Examples of monitoring requirements may include: 1) Baseline/Description of existing environment. Temporal/seasonal variation should be accommodated Revision C - 18 February
148 Beach Sand Nourishment Scoping Study - Maintaining Sydney's Beach Amenity Against Climate Change Sea Level Rise a) Describe the taxonomic composition of assemblages in both the subaqueous and inter-tidal areas to be affected (possibly 12 beaches could be considered to represent different morphodynamic types and kinds of disturbance envisaged see below under point 3). b) Locate potentially vulnerable biota outside the immediate impact area e.g., kelp beds. All beaches should be examined. c) Survey all beaches for birdlife, especially threatened or vulnerable species. d) Physical environment describe all beaches (sediments and slopes). The subaqueous sediments should also be described. 2) Pilot sampling that would: a) Estimate structural features of the macrobenthic assemblage (e.g., taxonomic richness, abundance). b) Estimate error variation in order to inform the design of sampling that would address effects of deposition and recovery. c) Inform estimates of sample processing times. The descriptive sampling and pilot sampling could be combined. Pilot studies could be limited to one beach of each morphodynamic type, with results assumed to be an adequate guide to other beaches. 3) Effects and Recovery sampling that would estimate: a) The magnitude of the effects of sediment deposition on assemblages (especially macrobenthos). b) The rate of recovery of assemblages. c) The magnitude of any changes to the physical environment, especially sedimentary variables. A before, after/control, impact (BACI) design would be appropriate. This would require a) the identification of the kinds of disturbance at each beach (e.g., sediment only or sediment plus bulldozing), b) the stratification of beaches according to their morphodynamic status (i.e. reflective, intermediate or dissipative) and c) the designation of multiple control sites. Details of replication would be guided by the pilot project. Questions of sieve mesh size and taxonomic resolution will depend on resources available (both financial and human skills) although there is information available to guide the choice. Not all the beaches need to studied for impact and recovery. However, each combination of beach type and disturbance type needs be addressed with replicate beaches. A total of 12 impacted beaches may be sufficient, depending on the range of engineering processes (disturbance type) envisaged. Six control beaches are also necessary. A pilot programme could be used to develop the full BACI monitoring programme. Undertake sediment sampling of all Sydney beaches to characterise the sands within each beach system. The estimated nourishment volumes from the borrow sites are very sensitive to grain size. Determination of sand composition and sand volumes in identified offshore sand reserves. Identification of other offshore sand reserves. Refinement of depth of closure parameters. Key Recommended Studies and Further Work Detailed design of ecological studies for sand placement Review and update the physical and ecological processes and impacts associated with offshore extraction at the potential borrow sites Revision C - 18 February
149 Chapter 13 Community and Consultation Plan A Framework
150
151 Beach Sand Nourishment Scoping Study - Maintaining Sydney's Beach Amenity Against Climate Change Sea Level Rise 13.0 Community and Consultation Plan A Framework The framework for the development of a Community and Consultation Plan is developed in this Chapter. Chapter Summary Consideration should be given to the establishment of three key stakeholder consultation groups a Project Control Group, Stakeholder Working Group, and Community Reference Group. Stakeholder engagement would need to focus on information and education, communication, media and community consultation. One of the key determinants for the progression of efficient, cost effective sand nourishment strategies will be the amendment of the Offshore Minerals Act 1999 and introduction of companion regulations to allow mining/dredging of offshore sand and mineral supplies from NSW statutory waters (refer to Chapter 11 for a full discussion of approval processes and statutory framework). Consideration needs to be given to preferred government approach to facilitating this amendment. The Offshore Minerals Act 1999 can be amended on the basis of multifunction investment benefits across several government sectors and communicated to the broader public via media release and parliamentary statements. This announcement will then pave the way for communication and consultation on future investigation and implementation of sand nourishment strategies. A second approach could be to test the stakeholder and community sentiment towards amending the Act, and subsequent sand extraction, via a broad community consultation campaign in the Sydney area around the nominated beaches. This consultation campaign could be a combination of educational communication material and media releases and stakeholder and community feedback via public information days, website surveys, newsletters, focus groups and or market research surveys. The basic tools and methodology for these consultation approaches has been outlined and matched to each key project phase in a timeline table Key Stakeholder Engagement Strategy Given the need for political support to amend legislation and progress state and national planning approvals, as well as the potential for the scheme to attract controversial media and feedback, it is important that strong relationship based stakeholder networks are established at the beginning of the project. Establishing stakeholder consultation groups will assist with the following: Identify issues and concerns. Identify mitigation measures and solutions. Facilitate project decision making. Endorse outcomes and findings for progression. Manage information distribution. Three key stakeholder consultation groups are proposed, ranging from: Decision making and advocacy = Project Control Group (PCG). Influencing and advice = Stakeholder Working Group (SWG). Community input and feedback = Community Reference Group (CRG) Establish a Project Control Group (PCG) We recommend establishing a Project Control Group (PCG) comprising senior local, state and federal government agency representatives. The PCG would oversee the processes for further investigation and scoping, securing a licence for offshore sand recovery within NSW waters and planning approval for beach nourishment. For example; Revision C - 18 February
152 Beach Sand Nourishment Scoping Study - Maintaining Sydney's Beach Amenity Against Climate Change Sea Level Rise Monitor the engagement with Department of Industry and Investment (Mineral Resources) to confirm approval processes and licence requirements. Endorse gazettal of Offshore Mineral Regulation to support application. Seek confirmation of policy position of Commonwealth and NSW Governments with respect to offshore sand recovery for beach nourishment. Approve the briefing paper for Ministerial consumption that describes and justifies the proposal. The PCG would also play a consistent role in advising on, and endorsing, subsequent project phases, including each of the key steps within the planning approval process, provide guidance on the timing and nature of project information, consultation and approval processes. The project phases are anticipated to be: Feasibility Study and preparation of Economic Business Case. This would include detailed studies into environmental constraints and design parameters. The project would be defined at this stage. Commence planning approval process and prepare Preliminary Environmental Assessment (assuming planning approval will be under Part 3A of the EP&A Act). EPBC Act approvals should also commence at this stage, if required. Detailed project design and progressive development of Environmental Assessment. Preparing the Environmental Assessment in parallel with the detailed design would enable key environmental issues to be incorporated into the design and vice versa. Finalisation of Environmental Assessment. Public exhibition and preparation of submission report. Ministerial determination of the project. Project implementation. Underpinning all of these project phases would be staged communication and consultation programmes. Depending on the needs of each phase, programmes would vary between key stakeholder consultation, educational communication, media announcements, community feedback and active consultation Stakeholder Working Group (SWG) The Stakeholder Working Group (SWG) would comprise key government agency officers working in association with the project and relevant impacted agencies. The role of the SWG is to meet regularly throughout the various project phases and provide strategic operational advice, and to identify conflicts and concerns early. It would also provide a forum to harness practical and innovative approaches and solutions to sand extraction and nourishment in Sydney. The group would act as an internal stakeholder group and would not provide public information. This group would be managed under the guidance of the PCG and operate under workshops discussions and individual meetings, as required Community Reference Group The Community Reference Group (CRG) would provide input and advice throughout phases of the project, but would not be a decision making body. The group would act as an informed focus group to test ideas, highlight community and interest group opinions and help facilitate information sharing. The reference group does not need to meet regularly but would need to meet at key milestones, when information is relevant and input is required Other stakeholder engagement It would be necessary to consult with a broad range of stakeholders during the project. Prior to the development of the Communication and Consultation Plan a community and stakeholder profiling exercise would identify key government, industry, commercial and community stakeholders, and: Their concerns. Areas of influence. Their preferred method of contact. Once drafted the Plan would be a living document and updated on an ongoing basis to identify other stakeholders and agencies that may require consultation. Revision C - 18 February
153 Beach Sand Nourishment Scoping Study - Maintaining Sydney's Beach Amenity Against Climate Change Sea Level Rise 13.2 Community Education and Consultation In addition to being a best practice method to gain approvals - to inform the community of the project and opportunities and concerns - consultation is required under the EP&A Act (and potentially under EPBC Act). A flexible Communication and Consultation Plan would need to be developed to tailor communication tools and techniques to suit the needs of each target audience and establish timelines for delivery, evaluation and reporting. Each phase of the project would require varied approaches to communication and consultation. The three main approaches, other than the stakeholder consultation listed above, would be: Information and education. Communication and media. Community consultation. An opportunity also presents itself to assist the socio-economic impact assessment opportunities, constraints and design parameters - via well-crafted and well facilitated consultation, including the development of surveys and questionnaires, focus group facilitation, market research and integrated analysis of community feedback. Given the escalating awareness and importance of global climate change strategies, social marketing can also feature as an additional communication and consultation approach. Social marketing can be used for the long term strategy to educate, inform and influence communities, monitor success and acceptance, maintain support and set benchmarks for similar future projects in NSW. Each of the above approaches would engage a variety of tactics and tools. Strong record keeping and data capture systems will ensure thorough evaluation and reporting that can be used to facilitate transparent processes for planning approvals, legislation changes, Ministerial and Council endorsement, and community acceptance. The Communication and Consultation Plan would need to have embedded processes to monitor and review the effectiveness of stakeholder and community engagement Information and Education The initial information and education strategy would involve informing local, state and federal government, interested parties (including non-government organisations and indigenous communities), the broader community, and the media on the need for sand nourishment, the basic principles of implementation and the requirement to use offshore sand reserves. Key messages would need to be developed in consultation with respective Councils: Why climate change, social and economic amenity and storm recovery/erosion prevention. When outline proposed investigation time frames and approval stages. What use of offshore sand reserves, legislation changes, planning approvals, investigations and implementation phases. How - sand extraction techniques, sand nourishment techniques, monitoring programmes and reporting mechanisms. Impacts: - Environmental impacts and protections - Social impacts - Economic impacts. Timing investigation and proposed implementation, consultation and approval process. Consultation methodology, community opportunities and timeframes. Monitoring and reporting. Messages would be based on factual and expert scientific information in an attempt to dispel historical myths associated with sand extraction and beach nourishment. Information and education would most likely be an iterative approach, with new material being prepared in response to stakeholder and community feedback, emerging data and project outputs and the changing needs of the project and political environment. Revision C - 18 February
154 Beach Sand Nourishment Scoping Study - Maintaining Sydney's Beach Amenity Against Climate Change Sea Level Rise Communication and Media Due to the political and economic implications of amending the current legislation, and the potential controversy surrounding sand extraction and nourishment, a comprehensive media strategy is required. The media strategy would identify risks and mitigation measures regarding progressing investigation and implementation, a list of distribution agencies and reach, and a briefing structure for Sydney Coastal Councils Group and local and state government. It would include pre-planned milestones for media releases, provide internal questions and answers for Council speaking notes, case study examples, and identify opportunities for proactive local media stories. It would need to be a flexible strategy that responds to the changing environment and phases of the project. The objectives of a strong media and communication campaign are to: Highlight the positive drivers for sand nourishment: - Climate Change initiatives to protect social and economic infrastructure and environmental places from rising sea levels - Maintaining social and economic amenity for future generations. Announce activities, actions and policy. Define key milestones to keep the community and general public well informed about project timing and duration. Educational material supporting these campaigns would also address the anticipated concerns of impacts on the sea life and ecology; altering beach conditions for recreational and commercial activities and management of setting a precedent for commercial extraction. Background information and education material would be available on the website and via media kits and public information packages Community Consultation Once an information base has been established, two way consultations would need to commence, to understand stakeholder and community impediments, respond to community concerns and harness ideas, collaboration and innovations. This Scoping Study identifies three options to maintain Sydney s existing beach amenity with climate change sealevel rise: Do nothing (Retreat), Nourish or Prevent. These three options can be used to consult on the risks of rise in sea levels and increasing natural major weather events and the differing levels of impact they may have (social, economic and environmental amenity), based on scenarios. We recommend scenarios maintain a local focus with information available on other successful Australian and international schemes. Local case studies will be used to explain concepts, provided factual examples based on what has worked well locally (and internationally) and demonstrate the results that can be achieved. The consultation programme would aim to achieve community buy-in, support and participation into the project, which would lead to: Greater and mutual understanding of the issues and objectives. Greater understanding of stakeholder and community attitudes. Insight into what the stakeholder and community sentiment regarding legislation and policy changes. A forum for ideas, concerns and constraints to be raised and discussed. Inviting participation into the consultation process would be inclusive and interactive to encourage a broad cross section of stakeholders and community members to participate. A mix of online and hard copy surveys, newsletter feedback forms, information days and written submissions would be used to gather feedback and reach different sections of the community. Consultation feedback and evaluation would promote the development of the business case and inform the Minister s determination Application of Communication and Consultation The communication and consultation approaches to be applied to the various stages of the project are listed in Table It is recommended that community consultation be commenced early in the project. This approach would allow ideas and concerns to surface early in the process and enable issues to be incorporated and addressed as part of the design development. More detailed methodologies and activity plans will need to be developed as part of the next project stage. Revision C - 18 February
155 Beach Sand Nourishment Scoping Study - Maintaining Sydney's Beach Amenity Against Climate Change Sea Level Rise Table 13.1 Staged approach for communication and consultation throughout project delivery Likely project phases Feasibility Study and Economic Business Case. Detailed studies into approvals processes, environmental constraints and design parameters Commence Planning Approval Process (including Preliminary Environmental Assessment) and referral under EPBC Act, if required Detailed project design and progressive preparation of Environmental Assessment Finalisation of Environmental Assessment Public exhibition and submission report Ministerial determination of the project. Project implementation Communication and consultation approach Key stakeholder engagement Information and education Communication and media Community consultation Key stakeholder engagement Information and education Communication and media Key stakeholder engagement Information and education Communication and media Possible consultation socio-economic impact assessment Key stakeholder engagement Communication and media Key stakeholder engagement Information and education Communication and media Community consultation. Possibly social marketing campaign Key stakeholder engagement Communication and media Key stakeholder engagement Information and education Communication and media Community consultation. Chapter Summary Preparation of a detailed Community and Consultation Plan with timing and milestones. Revision C - 18 February
156
157 Chapter 14 Business Case Outline
158
159 Beach Sand Nourishment Scoping Study - Maintaining Sydney's Beach Amenity Against Climate Change Sea Level Rise 14.0 Business Case Outline This chapter outlines a business case strategy for a sand nourishment campaign. Chapter Summary As a result of the positive cost-benefit assessment and the favourable environmental and social outcomes, the preparation of the Strategic Gateway Review will be the first gate in the preparation of a business case to NSW Treasury to seek funding to progress the programme NSW Gateway Review Process The NSW Gateway System is a process applied by NSW Treasury to examine a project at critical stages of its lifecycle. It is applied to projects that procure construction, goods and services, property and accommodation, and information technology and communications. There are six defined gates at which reviews are undertaken: Strategic, Business Case, Pre-Tender, Tender Evaluation, Pre-Commissioning and Post Implementation. The Strategic Gateway Review, the first gate, requires the presentation of a preliminary business case to: Support the strategic assessment of the need for the proposed intervention and its priority and timing. Identify any realistic options for the intervention. Outline the high-level costs and benefits, risks and sustainability issues relevant to each option. Identify any relevant technical standards or legislative requirements associated with the proposal and the options. The information enables Government to determine the rationale for the intervention and if it is consistent with Government objectives or priorities before it progresses. This is a crucial stage in the planning of a project or programme, with the preliminary business case constituting the planning framework for the final business case. As well as demonstrating the need for the intervention and that the intervention strategy offers value for money relative to alternative strategies, the preliminary business case should outline the governance arrangements planned to take the intervention proposal through to the next stage of the Gateway System, the final business case. This outline should summarise the key elements, milestones and risks to achieve the final business case. A template for preparing a preliminary business case is given in Appendix 1 of NSW Treasury Guidelines for Capital Business Cases, TPP08-5, December Summary of Cost Benefit for each of the Beach Case Studies Case 1: Collaroy-Narrabeen Beach The cost-benefit analysis demonstrated that the proposed beach nourishment programme is economically viable it produced a net present value of $42M, a benefit-cost ratio of 1.6 and an economic internal rate of return of 12%. The value of the benefit-cost ratio indicates that, on the basis of the quantified benefits, the programme is expected to provide medium value for money. The main quantified benefits are the avoided loss of: Residential property values attributable to beach amenity (45% of total quantified benefits). Value of residential properties located within hazard lines (38%). Expenditure by beach visitors (8%). Rates revenue from residential property values within walking distance of the beach as a result of lower property values (4%). The sensitivity analysis showed that the economic viability is reasonably robust. However, the programme is not economically viable in the most extreme sensitivity test (where project benefits are reduced by 30% and project costs are increased by 30%). Revision C - 18 February
160 Beach Sand Nourishment Scoping Study - Maintaining Sydney's Beach Amenity Against Climate Change Sea Level Rise Adopting a lower discount rate (4% instead of 7%), as is increasingly the overseas practice in economic appraisal of social and environmental projects with long-term benefits, increases the benefit-cost from 1.6 to 2.2. The economic results are also sensitive to the shape of the relationship applying between beach width and the loss of economic value from the flow-on effects of reduced beach amenity use of an exponential rather than linear relationship increases the benefit-cost ratio from 1.6 to Case 2: Manly Beach The cost-benefit analysis demonstrated that the proposed beach nourishment programme is economically viable it produced a net present value of $48M, a benefit-cost ratio of 2.4 and an economic internal rate of return of 20%. The value of the benefit-cost ratio indicates that, on the basis of the quantified benefits, the programme is expected to provide high value for money. The main quantified benefits are the avoided loss of: Residential property values attributable to beach amenity (49% of total quantified benefits). Expenditure by beach visitors (23%). Rates revenue from businesses in the Manly Business District as a result of lower property values (13%). Non-traded value (consumer surplus) associated with beach visits (9%). The sensitivity analysis confirmed the robustness of the economic results, with the programme being economically viable in all sensitivity tests undertaken. Adopting the lower discount rate of 4% increases the benefit-cost ratio from 2.4 to Case 3: Bate Bay The cost-benefit analysis demonstrated that the proposed beach nourishment programme is economically viable it produced a net present value of $13M, a benefit-cost ratio of 1.2 and an economic internal rate of return of 8%. However, the value of the benefit-cost ratio indicates that, on the basis of the quantified benefits, the programme is expected to provide low value for money. The main quantified benefits are the avoided loss of: Residential property values attributable to beach amenity (73% of total quantified benefits). Expenditure by beach visitors (13%). Rates revenue from residential property values within walking distance of the beach as a result of lower property values (5%). Non-traded value (consumer surplus) associated with beach visits (5%). The sensitivity analysis showed that the economic viability is not robust, with the programme not being viable in most of the sensitivity tests. However, adopting the lower discount rate of 4% increases the benefit-cost from 1.2 to 1.6. The economic results are also sensitive to the shape of the relationship applying between beach width and the loss of economic value from the flow-on effects of reduced beach amenity use of an exponential rather than linear relationship increases the benefit-cost ratio from 1.2 to Financing Mechanisms USA The financing of beach nourishment programmes is most advanced in the USA, where the primary source of funding is the Federal Government. The agencies that are responsible for such funding are: U.S. Army Corps of Engineers (the primary source of funds). Continuing Authorities Programme: Federal government and non-federal government agencies share the cost of funding, which can be granted under emergency shoreline erosion, hurricane damage, beneficial uses of dredged materials and aquatic ecosystem restoration. General Investigations: for larger projects that do not fit under the Continuing Authorities Programme. Under US legislation, Federal funding for nourishment projects beyond the normal extent is generally released in the case of emergencies. When extreme weather events cause extreme erosion of the coast line, regions can secure funding to repair damage. Revision C - 18 February
161 Beach Sand Nourishment Scoping Study - Maintaining Sydney's Beach Amenity Against Climate Change Sea Level Rise There are also State government run organisations that are capable of providing funding for beach nourishment programmes; this can be done alone or in partnership with the Federal government. Local/Regional Matching Funds Within the USA, for a region to secure funding from a Federal body (such as the U.S. Army Corps of Engineers), they must be able to provide capital generally equal to half the value of the studies and construction that needs to be undertaken. However, not all members of the region will benefit from a beach nourishment programme, as properties in close proximity to the beach will be expected to appreciate in value, while the value of properties further away is likely to be unaffected. It is therefore argued that the cost of the programme should be borne by the beneficiaries. Below are examples of the way in which this can be done: Transient Occupancy Tax/Hotel Tax This is a tax that is levied on visitors to the area, where they are charged a tax on their accommodation when they are staying in the area which benefits from the beach nourishment programme. For example, a Transient Occupancy tax was introduced in New Hanover County (North Carolina) where a room occupancy tax is levied at a rate of 6%. The revenue from this tax is split among promotion of travel and tourism in the region, beach projects (nourishment and other) and other capital works projects determined by the controlling authorities. However, the proportion of the revenue given over to each activity varies within the county, with the Town of Wrightsville Beach, the Town of Carolina Beach, the town of Kure Beach and City of Wilmington all deciding on their own break-up. Real Estate Transfer Tax This is a tax that is levied on properties when they are bought and sold properties can be residential and/or commercial. This tax has in the past been very unpopular with the residents of regions that propose to, or do introduce real estate transfer taxes. For example, in 2005 the implementation of a real estate tax in Dare County (North Carolina) was discussed. The proposal was that the revenue from the tax would be used to pay for the estimated $32M that would be needed to pay for the nourishment of ten miles of beach. However, the tax was rejected under a referendum vote by the residents of Dare County. Taxation of Sports Goods Revenue from taxation on the sale of sports goods has been used to pay for the cost of a beach nourishment programme in Texas. User Fees User fees are a way in which those who use the beach pay for the benefits of the nourishment project, this can include paid parking or beach use fees. In some cases these are only levied on visitors, not residents. Summary Funding types are as follows: 1) Federal storm and erosion this type of funding is up to 65% Federal and is used for shore protection, hurricane protection, and erosion control. 2) Federal navigation this involves taking sand from Federal navigation maintenance and placing it on the beach, though if beach disposal of this sand is not the most cost efficient method than the local community will have to pay. 3) Federal Emergency - Federally funded projects that occur in response to storm events. 4) State projects funded by the State. 5) State/local; projects in which the State and local government share costs. 6) Local/private; funded by local government or private parties Europe Most European countries undertaking beach nourishment (e.g. France, Italy, Netherlands, Spain, UK, etc) have legislated for whom and under what circumstances beach nourishment projects are funded. Funding sources generally include international, national and regional governments and other local sources. The funding sources in Revision C - 18 February
162 Beach Sand Nourishment Scoping Study - Maintaining Sydney's Beach Amenity Against Climate Change Sea Level Rise the UK (mixed), Spain (central government) and France (local area) are described below, representing different approaches that countries in Europe take to funding beach nourishment programmes. The UK adopts a combined approach, where funding from several sources is and can be used for coastal protection projects. Coastal defence/protection policy is set by the central government and carried out by local government authorities in England, Scotland and Wales, consulting with relevant environmental agencies and stakeholders. The department responsible for coastal defence in each region will give ultimate approval and sometimes offers financial assistance. However, funding for most coastal defence schemes comes from the central government, the environmental agency, and local government authorities. In some cases, financial contributions to works associated with coastal defence schemes may be made by the European Regional Development Fund, by special interest groups such as the Sports Council or by charities, such as the National Lottery. Land owners may undertake works on their own property with governmental consent, the cost to be borne by the individual. In Spain, all beaches are State-owned and all works within the jurisdictions of the central government are financed directly from the national budget. If applicable, contributions from the regional governments, local governments, international organisations, and private parties may be required. In practice, almost all nourishments are financed by the central government, as coastal defence is strictly its responsibility. For projects that are more concerned with development rather than protecting the coast line (such as beachfront promenades), both regional and local governments may contribute financially along with the central government. In France, historically the costs associated with maintaining and protecting the shore line has been borne by the local land owners. However, since 1970 the local government from time to time has provided funding (10 30%) in cases of the protection of urban areas. Realistically though, such funding is uncommon. Local communities are permitted to initiate beach nourishment when common interests are threatened. In practice, local municipalities are in charge of coastal defence works with possible partial financial support from regional authorities. As a consequence, there is no national coastal management in France and no national standard for beach nourishment design and evaluation. Each project is managed according to prevailing and local conditions. However, this is changing as regional funders are becoming aware of the need to think at a regional level before committing funds locally. The European High Commission in specific instances has supplied funding to countries in the European Union for beach nourishment research and capital works. These funds are supplied from the European Regional Development Fund, the purpose of which is to strengthen economic and social cohesion in the European Union by correcting imbalances between its regions. Part of this involves funding environmental projects. As a large number of countries in Europe share a common coast line, the European Regional Development Fund helps converge the goals of individual countries to the benefit of Europe as a whole Application to Sydney Beaches Funding beach nourishment programmes in Sydney is also likely to involve a combination of funding measures, given the mix of potential beneficiaries. Beneficiaries comprise: Beach visitors, who can be residents of the local government area or visiting from elsewhere (including international and interstate tourists). Businesses supplying goods and services to beach users. Owners/occupiers of properties within proximity of the beach where beach amenity has an influence on property values. A hypothecated beach nourishment levy could be imposed by councils on residential properties within a certain distance from the beach and on business properties within close proximity of the beach which service beach visitors. This would establish a new source of targeted funds to achieve a specific programme with measurable results which can be reported on the local communities. This approach would contribute to the funding of a new programme without upsetting the conventional funding regime. Councils could also levy a surcharge on beach car parking area charges, which could be a complementary source of funds from beach users residing in the local government area but away from the beach or from beach users outside the local government area. This source of funding is unlikely to be a dominant part of the funding mix but could play a role in funding the recurrent costs of the programme. The State Government could provide capital funding on the grounds that the beach nourishment programme represents a long-term investment in the city s future, given the role and economic contribution of beaches to the Revision C - 18 February
163 Beach Sand Nourishment Scoping Study - Maintaining Sydney's Beach Amenity Against Climate Change Sea Level Rise Sydney economy. To the extent that debt finance is used, programme costs are shared over time between current and future generation beneficiaries. Key Recommended Studies and Further Work Entry into NSW Gateway System Formation of working group with key stakeholders to address the funding mechanism Revision C - 18 February
164
165 Chapter 15 Conclusions
166
167 Beach Sand Nourishment Scoping Study - Maintaining Sydney's Beach Amenity Against Climate Change Sea Level Rise 15.0 Conclusions Shoreline erosion issues are not unique to Sydney or the NSW coastline and it has long been held that beach nourishment is, in many cases, the best long-term management strategy. If sufficient sand deposits are available for nourishment works, hazards associated with storm events and sea-level rise can be alleviated. The primary purpose of this scoping study was to develop the outline of a sand nourishment programme utilising suitable offshore sand deposits for amenity enhancement and to ameliorate increased hazard risk from sea-level rise. A key environmental driver for the study was the projected climate change sea-level rise. Generally, sea-level rise causes beach erosion and recession which could result in permanent loss of beach amenity. The scoping study identified potential benefits and impacts of a nourishment programme associated with physical, environmental, social and economic issues. It also drew comparisons with the do nothing approach. While the study scoped a nourishment programme for the whole of Sydney that is closely aligned to nourishment of all NSW ocean beaches, it case studied three (3) Sydney beaches in more detail. The nominated beaches were Collaroy-Narrabeen, Manly and Bate Bay. The environmental, economic and social evaluations of the nourishment campaign demonstrated substantial positive benefits associated with the project. Some potential adverse ecological impacts may be caused by the nourishment programme with the smothering of aqueous benthic communities. These are likely to be less severe than the ecological impacts associated with a do nothing approach and the subsequent loss of the inter-tidal beach, resulting in a total loss of the beach ecosystem. Environmental monitoring programmes would need to be developed to measure and, if required, respond to ecological impacts. The nourishment campaign encompasses 31 Sydney ocean beaches extending from Forresters Beach (north of Sydney) to Cronulla Beach (south of Sydney). The first nourishment campaign is estimated to cost $300M at a unit rate of approximately $25/m 3 of sand. The second and subsequent nourishment campaigns are estimated to cost $120M at a unit rate of $30/m 3 of sand. Key recommended studies and further works outlined in the report are summarised as follows: Monitor performance of sand nourishment campaigns (Chapters 3 & 6). Working group study tour of Florida beaches nourishment campaigns (Chapter 3). Determination of sand composition on each of Sydney s ocean beaches (Chapter 4). Determination of sand composition and sand volumes in identified offshore sand reserves (Chapter 4). Identification of other offshore sand reserves (Chapter 4). Refinement of depth of closure parameters (Chapter 4). Community education and consultation on the requirement to use offshore sand reserves (Chapter 5). Formation of working group/s with key stakeholders (Chapters 5, 6, 11 & 14). Update ecological impact studies associated with extraction activities (Chapters 5 & 12). Community education and consultation on sand placement (Chapter 6). Mapping of subaqueous, inter-tidal and subaerial ecology (Chapter 6). Extensive ecological impact studies associated with sand placement activities (Chapters 6 & 12). Community education and consultation on the nourishment programme (Chapter 11). Political representation and support to amend Schedule 2 of the OM Act (Chapter 11). Preparation of a detailed Community and Consultation Plan with timing and milestones (Chapter 13). Entry into NSW Gateway System (Chapter 14). Revision C - 18 February
168
169 Chapter 16 References
170
171 Beach Sand Nourishment Scoping Study - Maintaining Sydney's Beach Amenity Against Climate Change Sea Level Rise 16.0 References ABS (Australian Bureau of Statistics), (2001). Regional Population Growth, Cat. no , Australian Bureau of Statistics, Canberra. Albani, A. D., Tayton, J. W., Rickwood, P. C., Gordon, A. D., & Hoffman, J. G. (1988). Cainozoic Morphology of the Inner Continental Shelf Near Sydney. Journal and Proceedings of the Royal Society of New South Wales 121, AGO (Australian Greenhouse Office), (2006). Unpublished Data, Department of the Environment and Heritage, Canberra. Ansell, A.D. (1983). The biology of the genus Donax. In Sandy Beaches as Ecosystems. Ed. A. McLachlan and T. Erasmus, The Hague: Junk. Bender, E.A., T.J. Case, and M.E. Gilpin. (1984). Perturbation experiments in community ecology: theory and practice. Ecology 65: Blott S.J. & Pye K. (2003). Morphological and Sedimentological Changes on an Artificially Nourished Beach, Lincolnshire, UK, Journal of Coastal Research, 20(0), USA Boak, E. H., Jackson, L. A., McGrath, J. E., & Brosnan, M. P. (2001). An Overview of Gold Coast Coastal Management Boczar-Karakiewicz, B., & Jackson, L. A. (1990). The Analysis and Role of bars on the Protection of a Beach System at Gold Coast, Queensland, Australia. Proceedings of International Coastal Engineering Conference. DELFT. Boswood P., Victory S. and Lawson S. (2001), Placement Strategy and Monitoring of the Tweed River Entrance Sand Bypassing Project Nourishment Works, Paper to be presented to Conference on COASTS & PORTS 2001, Gold Coast. Bruun, P. (1962). Sea-level rise as a cause of shore erosion. Journal of the Waterways and Harbors Division, 88, Bruun, P. (1983). Review of conditions for use of the Bruun Rule of erosion. Coastal Engineering 7, Byrnes, M.R., Hammer, R.M., Thibaut, T.D. and Snyder, D.B. (2004a). Physical and biological effects of sand mining offshore Alabama, USA. Journal of Coastal Research 20, pp Cameron, D.W., Morris, B.D., Collier, L. and Mackenzie, T. (2007), Management and Monitoring of an ICOLL Entrance Clearance, 16th NSW Coastal Conference, Yamba, 7-9 November, available online at < Calais Consultants and Dhatom Tourism Consultants, (2007). Surf Tourism Scoping Study. An Initiative of Tourism New South Wales. June Cardno Ecology Lab (2009). Extraction of Offshore Sand Reserves - Potential Environmental Impacts, Cardno Ecology Lab. Castelle, B., Lazarow, N., Marty, G., & Tomlinson, R. (2006). Impact of Beach Nourishment on Coolangatta Bay Morphology Over the Period Proceedings of 15th NSW Coastal Conference, (pp. 1-12). CEM, (2006). Coastal Engineering Manual, U.S. Army Engineer Research and Development Center, Coastal and Hydraulics Laboratory, Vicksburg, MS. Church, J.A., White, N.J. (2006). A 20th century acceleration in global sea-level rise, Geophysical Research Letters, Vol 33. Clark, B.M. (1997). Variation in surf-zone fish community structure across a wave-exposure gradient. Estuarine Coastal and Shelf Science 44: Clayton, T.D. (1991). Beach Replenishment Activities on US Continental Pacific Coast, Journal of Coastal Research, 7(4), , USA. Corkery, R.W. and Co. Pty Ltd (1993). Sydney Marine Aggregate Proposal Environmental Impact Statement. Report prepared for Metromix Pty Ltd. Revision C - 18 February
172 Beach Sand Nourishment Scoping Study - Maintaining Sydney's Beach Amenity Against Climate Change Sea Level Rise CSIRO, (2007). Exploring the social dimensions of an expansion to the seafloor exploration and mining industry in Australia. Synthesis Report. November CSIRO, (2009). CSIRO Marine and Atmospheric Research, viewed 10 June 2009, < Dean, R. G. (1977). Equilibrium beach profiles: U.S. Atlantic and Gulf coasts. Ocean Engineering Technical Report. 12, January. Dean, R.G. (1987). Coastal Sediment Processes: Toward engineering solutions. Proceedings Coastal Sediments '87, Am. So. Civ. Eng., Desprez, M. (2000). Physical and biological impact of marine aggregate extraction along the French coast of the Eastern English Channel: short- and long-term post-dredging restoration. ICES Journal of Marine Science, 57, pp Diaz, R.J., Cutter, G.R. and Hobbs, C.H. (2004). Potential impacts of sand mining offshore of Maryland and Delaware: Part 2 - Biological considerations. Journal of Coastal Research 20, pp Farmer, B. & Short, A. (2007). Australian National Surfing Reserves Rationale and Process for Recognising Iconic Surfing Locations, Journal of Coastal Research, Australia, Geomarine, Lawson and Treloar (1993). Marine Aggregate Proposal Coastal Processes. Report prepared for Metromix Pty Ltd. Gibbons, G.S. (1967). Shell content in quartzose beach and dune sands, Dee Why, New South Wales, Journal of Sedimentary Petrology, V37, No. 03, pp GCCC (2000). Northern Gold Coast Beach Protection Strategy, Gold Coast City Council. GCCC (2009). viewed 15 June 2009, < Gold Coast City Council Gordon, A.D. (1987) Beach Fluctuations and Shoreline Change, New South Wales, in Proceedings of the 8th Australasian Conference on Coastal and Ocean Engineering, Launceston, New Zealand. Gordon, A. (1992). Restoration of Bate Bay, Australia Plugging The Sink, Proceedings of the Coastal Engineering Conference, v 3, p Haddad, T.C., & Pilkey O.H. (1998). Summary of the New England Beach Nourishment Experience ( ), Journal of Coastal Research, 14(4), , USA. Hall, S.J., (1994). Physical disturbance and marine benthic communities: life in unconsolidated sediments. Oceanography and Marine Biology Annual Review 32: Hanson, H, Brampton, A, Capobianco, M, Dette, HH, Hamm, L, Laustrup, C, Lechuga, A, Spanhoff, R (2002). Beach nourishment projects, practices, and objectives - A European overview, Coastal Engineering, 47, 2, , Shore nourishment in Europe. Harley (2009), Post-doctoral researcher, Water Research Laboratory, University of New South Wales Heggie, Richard and Associates (1993). Proposed Marine Aggregate Extraction and Terminal Operations Noise Impact Assessment. Report prepared for Metromix Pty Ltd. Hennecke, W. G., Greve, C. A., Cowell, P. J. and Thom, B. G. (2004). GIS-Based Coastal Behavior Modeling and Simulation of Potential Land and Property Loss: Implications of Sea-Level Rise at Collaroy/Narrabeen Beach, Sydney (Australia). Coastal Management, 32(4), Higgins, C. T., Downey, C. I., & Clinkenbeard, J. P. (2004). LITERATURE SEARCH AND REVIEW OF SELECTED TOPICS RELATED TO COASTAL PROCESSES, FEATURES, AND ISSUES IN CALIFORNIA. California Coastal Sediment Management Workgroup. Hitchcock, D.R. and Bell, S., (2004). Physical impacts of marine aggregate dredging on seabed resources in coastal deposits. Journal of Coastal Research 20, pp Houston, James R. (1996). International Tourism and U.S. Beaches. Shore and Beach: Journal of the American Shore and Beach Preservation Association. Volume 64, Number 2. Pages 3 to 4. IPCC (Intergovernmental Panel on Climate Change), (2001). Climate Change 2001: The Scientific c Basis. Contribution of Working Group I to the Third Assessment Report of the Intergovernmental Panel on Climate Revision C - 18 February
173 Beach Sand Nourishment Scoping Study - Maintaining Sydney's Beach Amenity Against Climate Change Sea Level Rise Change. J.T. Houghton, Y. Ding, D.J. Griggs, M. Noguer, P. J. van der Linden, and D. Xiaosu (Eds.).Cambridge University Press, UK, 944 pp. IPCC (Intergovernmental Panel on Climate Change), (2007). Climate Change 2007: The Physical Science Basis. Contribution of Working Group I to the Fourth Assessment Report of the Intergovernmental Panel on Climate Change. S. Solomon, D. Qin, M. Manning, Z. Chen, M. Marquis, K.B. Averyt, M. Tignor and H.L. Miller (Eds.). Cambridge University Press, Cambridge, United Kingdom and New York, NY, USA, 996 pp. Jackson, L. A., & Tomlinson, R. B. (1990). Nearshore Nourishment Implementation, Monitoring & Model Studies of 1.5m3 at Kirra Beach. Proceedings of International Coastal Engineering Conference. DELFT. Jackson, A.L, McGrath J. and Tomlinson R. (1997). Strategy for Protection of Northern Gold Coast Beaches. 13thAustralasian Conf. on Coastal and Ocean Engineering, Auckland. Jackson, A.L., Tomlinson, R., Turner, I., Corbett, B., D'Agata, M., & McGrath, J. (2005). Narrowneck Artificial Reef Results of 4 Years of Monitoring and Modifications. Proceedings of the 4th International Surfing Reef Symposium, (p. 11). Manhattan Beach, USA. Jones, A.R. (1986). The effects of dredging and spoil disposal on macrobenthos, Hawkesbury Estuary, NSW. Marine Pollution Bulletin 17: Jones, A.R., Murray, A. and Marsh, R.E. (1991). Patterns of abundance of Exoedicerotid amphipods on sandy beaches near Sydney, Australia. Hydrobiologia 223: Jones, A.R., Gladstone, W. and Hacking, N.J. (2007). Australian sandy-beach ecosystems and climate change: ecology and management. Australian Zoologist 34: Jones, A.R., Murray, A., Lasiak, T. and Marsh, R.E. (2008). The effects of beach nourishment on the sandy-beach amphipod Exoediceros fossor in Botany Bay, New South Wales, Australia. Marine Ecology 28: 1 9. Lasiak, T.A. (1981). Nursery grounds of juvenile teleosts: Evidence from the surf zone of Kings Beach, Port Elizabeth. South African Journal of Zoology 77: Lawson and Treloar Pty Ltd (1993). Marine Aggregate Proposal: An Assessment of Sediment Plumes. Report prepared for Metromix Pty Ltd. Leonard, L.A., Dixon, K.L., Pilkey, O.H., Schwartz, M.L., Bird, E.C. (1990) A comparison of beach replenishment on the U.S. Atlantic, Pacific, and Gulf coasts, Journal of Coastal Research, Special Issue 6, , Artificial beaches. Maa, J.P.-Y., Hobbs, C.H., Kim, S.C. and Wei, E. (2004). Potential impacts of sand mining offshore of Maryland and Delaware: Part 1 impacts on physical oceanographic processes. Journal of Coastal Research, 20, pp Manly Council, (2006). Surfing the Future: A Vision for the Manly Local Government Area for Manly Council (2009), Manly Council Press Release 29/11/04, Viewed 10 June < Maurer, D., Keck, R.T., Tinsman, J.C., Leathem, W.A., Wethe, C., Lord, C. and Church, T.M. (1986). Vertical migration and mortality of benthos in dredged material: a synthesis. Internationale Review des gesamten Hydeobiologie 71: Menn, I., Junghans, C., & Reise, K. (2003). Buried alive: Effects of beach nourishment on the infauna of an erosive shore in the North Sea, Senckenbergiana Maritima, v 32, n 1-2, p McInnes, KL, Abbs, DJ, O Farrell, SP, Macadam, I, O Grady, J & Ranasinghe, R. (2007). Projected changes in climatological forcing for coastal erosion in New South Wales, A project undertaken for the NSW Department of Natural Resources. McLachlan A., and Brown, A.C. (2006). The Ecology of Sandy Shores. Burlington MA, Academic Press. Mitchell, W, Chittleborough, J, Ronai, B, Lennon, GW, Grzechnik, M. (2000). Sea level rise in Australia and the Pacific, Proceedings of the science component, Pacific Islands conference on Climate change, climate variability and sea level rise; linking science and policy, Muller, J., Wust, R. A., & Hearty, P. J. (2006). Sediment transport along an artificial shoreline: The Strand, Townsville, NE-Queensland, Australia. Estuarine, Coastal and Shelf Science 66, (pp ). Revision C - 18 February
174 Beach Sand Nourishment Scoping Study - Maintaining Sydney's Beach Amenity Against Climate Change Sea Level Rise Nairn, R., Johnson, J.A., Hardin, D. and Michel, J. (2004). A biological and physical monitoring program to evaluate long-term impacts from sand dredging operations in the United States Outer Continental Shelf. Journal of Coastal Research 20, pp Nelson, W.G. (1993). Beach restoration in the southeastern US: environmental effects and biological monitoring. Ocean and Coastal Management 19: Newell, R.C., Seiderer, L.J. and Hitchcock, D.R. (1998). The impact of dredging works in coastal waters: a review of the sensitivity to disturbance and subsequent recovery of biological resources in the sea bed. Oceanography and Marine Biology: Annual Review, 36, pp Newell, R.C., Hitchcock, D.R. and Seiderer, L.J. (1999). Organic enrichment associated with outwash from marine aggregates dredging: a probable explanation for surface sheens and enhanced benthic production in the vicinity of dredging operations. Marine Pollution Bulletin, 38, pp Newell, R.C., Seiderer, L.J., Simpson, N.M. and Robinson, J.E (2004). Impacts of marine aggregate dredging on benthic macrofauna off the south coast of the United Kingdom. Journal of Coastal Research 20, pp Nielsen, AF (1994), Subaqueous Beach Fluctuations on the Australian South-Eastern Seaboard, Australian Civil Engineering Transactions, Volume CE36, No. 1, December, Institution of Engineers Australia, ISSN , pp Nielsen Lord Associates (1990), Collaroy-Narrabeen Beach Hazard Mapping, Geomarine Report No R01, for Warringah Shire Council, August. Nonnis, O., Nicoletti, L., La Valle, P., Magno, C.M. and Gabellini, M. (2002). Environmental Impact after Sand Extraction for Beach Nourishment in an Area off Latium Coast (Tyrrhenian Sea, Italy). Littoral 2002, The Changing Coast. EUROCOAST / EUCC, Porto Portugal. NSW (1990). Coastline Management Manual, New South Wales Government, 50p. NSW (1988), Coastline Hazard Policy, New South Wales Government. NSW (2009). NSW Sea Level Rise Policy Statement, Department of Environment, Climate Change and Water NSW. Parsons, G.R., and M. Powell Measuring the Cost of Beach Retreat. Coastal Management 29: Peterson, C.H., D.H.M. Hickerson, and G.G. Johnson. (2000). Short-term consequences of nourishment and bulldozing on the dominant large invertebrates of a sandy beach. Journal of Coastal Research 16: Peterson C.H., M.J. Bishop, G.A. Johnson, L.M. D Anna, and L.M. Manning. (2006). Exploiting beach filling as an unaffordable experiment: Benthic inter-tidal impacts propagating upwards to shore birds. Journal of Experimental Marine Biology and Ecology 338: Patterson, D. C. (2007). Sand Transport and Shoreline Evolution, Northern Gold Coast, Australia. Journal of Coastal Research, PBP (1993), Collaroy/Narrabeen Beach Nourishment Investigations, Draft, 22 July, Patterson Britton & Partners for Warringah Council. PBP (2001b), Bate Bay Coastline Study, Stage 1 Coastline Hazard Definition Report, Issue No.1, November, Job 3828, Patterson Britton & Partners. PBP (Patterson Britton & Partners) (2003), Narrabeen Lagoon Entrance Clearance Operation, Post-completion Report, Issue No. 2, January, Patterson Britton & Partners. PBP (2006), Bate Bay Coastline Management Plan, Beach Nourishment Strategy, Patterson Britton & Partners for Sutherland Shire Council. PBP (2008a). Manly Ocean Beach Coastline Management Plan: Support Document. Patterson Britton & Partners. PBP (2008b). Emergency Action Plan for Coastal Erosion: Support Document. Patterson Britton & Partners Petit, JR., Jouzel, J., Raynaud, D., Barkov, N.I., Barnola, J.M., Basile, I., Benders, M., Chappellaz, J., Davis, M., Delayque, G., Delmotte, M., Kotlyakov, V.M., Legrand, M., Lipenkov, V.Y., Lorius, C., Pépin, L., Ritz, C., Saltzman, E., and Stievenard, M. (1999). Climate and atmospheric history of the past 420,000 years from the Vostok ice core, Antarctica, Nature 399: Revision C - 18 February
175 Beach Sand Nourishment Scoping Study - Maintaining Sydney's Beach Amenity Against Climate Change Sea Level Rise Pollution Research Pty Ltd (1993). Metromix Pty Ltd Marine Aggregate Proposal: Sea Water and Sediment Chemistry. Report prepared for Metromix Pty Ltd. PWD (Public Works Department) (1987), Collaroy / Narrabeen Beaches, Coastal Process Hazard Definition Study, PWD Report No , Coastal Branch, December, Volumes 1 and 2, ISBN Realsurf, (2009), Realsurf website, viewed 9 June 2009, < Riedel, P., O Brien, P., Smith, R. & Macfarlane, B. (1999). Beach Renourishment at The Strand, Townsville, 14th Australasian Coastal and Ocean Engineering Conference, Perth. Roy, P. S. (2001). Offshore transport and Sand Body Formation: Evidence from a Steep High Energy Shoreface, Southeastern Australia. Report to Sydney Coastal Councils Group. Sarda, R., Pinedo, S., Gremare, A. and Taboada, S. (2000). Changes in the dynamics of shallow sandy-bottom assemblages due to sand extraction in the Catalan Western Mediterranean Sea. ICES Journal of Marine Science, 57, pp Short, A. D. (1993). Beaches of the New South Wales Coast. Sydney, Australia: Australian Beach Safety and Management Project. P Short, A. D., Trembanis, A. C., Turner, I. L. (2000). Beach oscillations, rotation and the Southern Oscillation, Narrabeen Beach, Australia. In: Cox, R. (Ed.), International Coastal Engineering Conference. Sydney, pp. 2439{2452. Smith, S. D. A. and Rule, M. J. (2001). The effects of dredge-spoil dumping on a shallow water soft-sediment community in the Solitary Islands Marine Park, NSW, Australia, Marine Pollution Bulletin 42, pp Speybroeck, J, Bonte, D, Courtens, W, Gheskiere, T, Grootaert, P, Maelfait, J, Mathys, M, Provoost, S, Sabbe, K, Stienen, E, Van Lancker, V, Vincx, M, Degraer, S. (2006). Beach nourishment: An ecologically sound coastal defence alternative? A review, Aquatic Conservation: Marine and Freshwater Ecosystems, v 16, n 4, p SPM (1984) Shore Protection Manual. US Army Corps of Engineers. Surfing Australia, (2007). A Snapshot of Surfing in Australia Sweeney Sports Report Summer 2006/2007. Sutherland Shire Council, (2006). State of the Environment Report 2006/07. Sutherland Shire Council, (2007). Our Shire, Our Future: Our Guide to shaping the Shire to The Ecology Lab Pty Ltd (1993). Marine Aggregate Proposal: Marine Ecological Investigations Volume 1. Report prepared for Metromix Pty Ltd. 356 pp. Trembanis A.C. & Pilkey O.H. (1998). Summary of Beach Nourishment Along the U.S. Gulf of Mexico Shoreline, Journal of Coastal Research, 14(2) , USA. Trembanis A.C., Pilkey O.H. & Valverde H.R. (1999). Comparison of Beach Nourishment along the U.S. Atlantic, Great Lakes, Gulf of Mexico, and New England Shorelines, Coastal Management, v 27, n 4, p TRESBP (2009a). Tweed River Entrance Sand Bypassing Project Sand Pumping Details. TRESBP (2009b). Tweed River Entrance Sand Bypassing Project, viewed 15 June 2009, < Van Dalfsen, J.A., Essink, K., Toxvig Madsen, H., Birklund, J., Romero, J. and Manzanera, M. (2000). Differential response of macrozoobenthos to marine sand extraction in the North Sea and Western Mediterranean. ICES Journal of Marine Science, 57, pp Warringah Council (1997), Collaroy Narrabeen Coastline Management Plan, A Coastline Hazards Policy Plan of Management, August. Warringah Council, (2005). Living Warringah 2005, Warringah Council. Warringah Council, (2007). State of Warringah Report Watson, P. (1997). Port Stephens Sand Nourishment Projects Evaluation, Monitoring & Sustainability. Combined Australasian Coastal Engineering and Ports Conference, Christchurch. WRL (Water Research Laboratory) (2003). Manly Ocean Beach Seawall and Beach Amenity Risk Assessment and Remedial Options WRL Technical Report 2002/39. Revision C - 18 February
176 Beach Sand Nourishment Scoping Study - Maintaining Sydney's Beach Amenity Against Climate Change Sea Level Rise Media Beach is now pristine (2003), Manly Daily, 27 November, viewed 18/09/2009, < Developers accused of beach-sand theft (2008), Manly Daily, 3 December, viewed 18/09/2009, < Frew W. (2006) Life s a beach, and then it disappears, Sydney Morning Herald, July 19, viewed 17/09/2009 < Frew W. (2006) Sydney s vanishing future, Sydney Morning Herald, October 30, viewed 16/09/ Frew W. (2005) Drive to mine sand offshore, Sydney Morning Herald, August 13, viewed 16/09/ Gilmore H. (2007) Council offer of $3m for at-risk house declined, Brisbane Times, June 24, viewed 16/09/2009 < Glass and asbestos dumped on beach (2003), Manly Daily, 30 October, viewed 18/09/2009, < Govt to consider sand redistribution plan for Cronulla (2002) ABC News Online, 4 May, viewed 17/09/2009 < Offshore sand bid No. 2 (2006), Manly Daily, 11 August, viewed 18/09/2009, < Offshore sand mining plan Councils seek to rebuild beaches (2008), Manly Daily, 19 January, viewed 18/09/2009, < O Neill S. (2004) Slipping Away Stateline NSW, 16 July, viewed 17/09/2009 < Plans on table to weather the storm (2007), Manly Daily, 1 September, viewed 18/09/2009, < Sand shift a mixed bag for locals (2007), Manly Daily, 21 August, viewed 18/09/2009, < Sands of time, (2008) Sydney Morning Herald, January 8, viewed 16/09/2009 < Seabed study reveals sand shortage threat (2008), Manly Daily, 13 December, viewed 18/09/2009, < Smith D. & O Rourke C. (2002) Wall of humanity lines up against councils, Sydney Morning Herald, November 18, viewed 16/09/2009 < This tide waits for no man (2008) Sydney Morning Herald, December 6, viewed 16/09/ We re under water: study (2008), Manly Daily, 30 October, viewed 18/09/2009, < Woodford J. (2005) Battle lines in the sand, Sydney Morning Herald, November 2, viewed 16/09/2009 < Revision C - 18 February
177 Appendix A How Beach Nourishment Projects Work
178
179 Beach Sand Nourishment Scoping Study - Maintaining Sydney's Beach Amenity Against Climate Change Sea Level Rise Appendix A How Beach Nourishment Projects Work Shore Protection Assessment Beach Nourishment How Beach Nourishment Projects Work Revision C - 18 February 2010
180


181 BEACH NOURISHMENT HOW BEACH NOURISHMENT PROJECTS WORK


182 HEALTHY BEACHES ARE VITAL TO OUR WAY OF LIFE People in the United States highly prize the thousands of miles of sandy beaches along our nation s coasts Our beaches a precious national resource help define the physical, economic, environmental, and social fabric of our nation: Many of us choose to live near a beach. The population in counties along U.S. coasts more than doubled from 1960 to By 2006, more than one half of all Americans lived in coastal counties, which make up just 17 percent of land in the 48 contiguous states. People are still moving to the coasts, which see 3,600 new residents daily. 1 Local, regional, and national economies thrive on the prosperity of American beaches. Coastal watersheds generated a remarkable $6 trillion in 2003 more than half of the nation s economy. 1 The tourism industry is now the nation s largest employer and fastest growing economic sector. Shipping and commercial fishing industries also contribute significantly to coastal regions and the nation. Clean oceans and wide beaches are crucial elements of our environment. Beaches sustain animals, fish, sea turtles, birds, plants, and other wildlife including many rare, threatened, and endangered species. Development continues near our nation s beaches. Over the last three decades, Americans have built 19 million homes in coastal areas, and people are still building at the rate of 1,500 homes a day. 1,2 New roads, bridges, and sewers are being constructed to support these increasing populations. Photo courtesy of Scott L. Douglass Travelers from diverse economic, ethnic, and racial populations choose the beach over any other American tourist attraction. 3 Each year, our coasts are the preferred vacation destination for an estimated 180 million people, who spend billions of dollars and support more than 2 million jobs. 2 As long as our beaches are healthy, they will continue to lure national and international travelers. Florida s 800 miles of sandy beaches, which contribute more than $15 billion annually to the state s economy, are its greatest economic asset. 4 Photo courtesy of the City of Jacksonville, Fla.


183 Healthy beaches not only are important to our quality of life but also protect people and property along the coasts from hurricanes and coastal storms A beach s size, shape, and sand volume help determine how well the beach can protect a developed area during a storm. All the various elements of a beach, such as bluffs, dunes, berms, and offshore sand bars even the width and slope of the beach itself offer a level of natural protection against hurricanes and coastal storms by absorbing and dissipating the energy of breaking waves, either seaward or on the beach itself. DYNAMIC AND DIVERSE, COASTAL BEACHES FUNCTION AS A SYSTEM Photo courtesy of Scott L. Douglass Dunes like this provide protection to people, property, and infrastructure, such as roads, along the coasts. For thousands of years, the forces of wind, water, storms, sea level changes, and other natural processes have moved the sediments that shape and reshape our coastlines and beaches These sediments, which range from fine, white sand to coarse gravel and cobblestones, continuously build up, or accrete, only to drift away, or erode, again and again over time in complex and sometimes unpredictable ways. Wind, tides, currents, and waves constantly keep sediment on the move to build up and wear down natural features such as bluffs, dunes, beaches, sand bars, and inlets. Under normal conditions, wind shapes the dry beach and its dunes while tides, currents, and waves shape the wet part of the beach. Wind, tides, currents, and waves move sediment continuously. Coastal beaches function as a system. The beach not only includes the dunes and berm, or the dry part of the beach, but also the wet part of the beach that slopes underwater.


184 It is natural for hurricanes and coastal storms which move huge volumes of sediment through the system to erode beaches Storms erode and transport sediment from the beach into the active zone of storm waves. Once caught in the waves, this sediment is carried along the shore and redeposited farther down the beach, or is carried offshore and stored temporarily in submerged sand bars. Periodic and unpredictable hurricanes and coastal storms, with their fierce breaking waves and elevated water levels, can change the width and elevation of beaches and accelerate erosion: Longer lasting storms, which give the waves more time to attack the beach, cause more erosion and sediment transport than fast-moving storms. Very intense storms create higher winds and larger waves, inducing more erosion than less intense storms. After storms pass, gentle waves usually return sediment from the sand bars to the beach, which is restored gradually to its natural shape. Sometimes, however, sediment moving along the shore leaves the beach system entirely, swept into inlets or taken far offshore into deep water where waves cannot return it to the beach. This causes the shoreline to recede, or move farther landward. Over time, these processes combined with sea level rise produce larger waves that break farther landward. In flat coastal areas, beach erosion and shoreline recession can have dramatic consequences to people and property. Photo courtesy of the City of Virginia Beach A storm with modest waves affecting the coast for several days shown here in Scituate, Mass., during the Blizzard of 1978 can cause more damage to structures and infrastructure than a much larger storm moving quickly over the coast. Storm waves break farther up on an eroding beach in 1991 at Sandbridge, Va., threatening people and property. Complex coastal processes, which vary in intensity and significance, determine how sediment moves Wind not only produces currents and waves but also picks up and moves sediment on the beach and dunes. Tides whose rise and fall depend on local physical conditions and the gravitational effects of the sun, moon, and earth generate currents. Currents near the beach are formed through a combination of wind, tides, waves, and the shape of adjacent sand bars. Currents can move large volumes of sediment along the beach or to deep water offshore. Waves that break during calm weather cause turbulence, which stirs up sediment from the shore bottom. This sediment can be deposited onshore and offshore, parallel or perpendicular to the beach. Accretion and erosion refer to changes in sediment volume in a coastal area. Shoreline recession and shoreline advance refer to a change in position of the shoreline, farther landward and farther seaward, respectively. Sea level rise exposes areas farther inland to the coastal processes that move sediment.


185 Photo courtesy of Marlowe & Company Human activities have increased the rate and severity of beach erosion Decades of beachfront development have interrupted the natural and necessary movement of sediment and interfered with coastal processes at our nation s beaches. Beginning in the early 1900s, construction along the shoreline began to forever alter the natural setting and topography to make way for resorts, hotels, boardwalks, roads, houses, marinas, and other recreational amenities. This development, which increased after World War II, frequently eliminated protective sand dunes, weakened bluffs and banks, and reduced beach widths, making coastal communities more vulnerable to winds and high waves. Development today continues to affect accretion and erosion processes upstream and downstream. The dredging of inlets and harbors, which removes sediment to improve navigation, has changed sediment processes in coastal waters. The construction of dams and stormwater retention ponds for inland flood control has blocked new sediment from entering the coastal system. The addition of hard structures, such as groins for coastal stabilization, sometimes has made erosion worse. Structures like these have been designed to retain sediment moving along the shore and help maintain wide beaches by minimizing or slowing down local erosion. In the past, however, if these structures were not designed properly, they sometimes transferred erosion problems farther down the beach. Because of natural processes coupled with the effects of development and other human interventions sediment in certain areas is being lost to the coastal system In some regions, wide beaches are narrowing, or retreating. 2 When accretion and erosion are not in balance, there are consequences to beaches, coastal habitats, people, recreation, and the economy. For example, too little sediment in some areas can make valuable real estate, coastal wetlands, or recreational amenities more vulnerable to damage; too much sediment in commercial shipping channels can restrict the passage of ships delivering goods to our ports. Coastal development driven by economics and aesthetics and regulated at the local level has been occurring for decades. Even though government at all levels has created programs and restrictions to discourage further growth in vulnerable areas, coastal development continues. Photo courtesy of Marlowe & Company Photo courtesy of NOAA Coastal Services Center If nature cannot take its course with natural renourishment, coasts can erode. Beginning in the 1930s, communities attempted to control erosion by installing structures such as groins.


186 NARROW, ERODING BEACHES HAVE INSUFFICIENT SAND VOLUME TO PROTECT DEVELOPED COASTAL AREAS FROM THE EFFECTS OF HURRICANES AND STORMS Significant destruction from flooding, wave attack, and storm surge is more likely as an eroding beach assumes a steeply sloping profile and the coastline moves inland, ever closer to people and property along the shore Photo courtesy of Scott L. Douglass The physical characteristics of the coastline, tides, and other factors can affect what happens when a storm makes landfall on an eroding beach. While the width of the beach affects wave attack, the elevation of the beach affects storm surge, a higher than normal rise in sea level caused by high winds and topped by waves. Storm surge can inundate and destroy coastal areas. The higher the storm surge, the closer the water and waves are to more people and property. On an eroding beach at a low elevation, even a modest storm surge can cause significant damage. Rising water can inundate low barrier islands, cut a new inlet, and wash sediment inland. Waves can attack the base of a dune or create vertical cuts that erode the dune completely, exposing people and property to potential damage. Waves can scour sediment from around structures and pilings and strip bricks off of homes. Erosion can undermine slabs, which can fail and then damage homes. Even property farther inland is at risk as shorelines continue to recede and dunes collapse, since the storm surge s fast-moving water can rapidly inundate and destroy structures behind the beach. Hurricane Ivan in 2004 caused the shoreline to recede 40 feet on the Alabama and Florida panhandle coasts and produced up to 165 feet of erosion in certain areas. Some dunes that were 30-feet high were eroded to just 2 feet. Ivan s storm surge washed over the low-lying barrier islands near Gulf Shores, Ala., transporting sediment and cutting a new inlet. Several miles east, where barrier islands rose higher, dunes eroded, undercutting and toppling five-story condominium buildings. 5 Heavily populated areas with significant coastal development but without sufficient sand volume, a wide beach, and protective dunes risk great damage from hurricanes and coastal storms. Eroding beaches threaten the environment, recreation If a beach cannot provide a protective buffer, coastal wetlands are at risk: In fact, sediment overwash, salt water inundation, and erosion may cause essential wetlands to disappear. Beach erosion may harm ecosystems by changing habitat conditions for wildlife. In some cases, habitat for sea turtles, birds, fish, plants, and other organisms may be lost. Sufficient sand with the right characteristics and in the proper locations is crucial for sea turtles to nest, and for birds to nest and feed. A receding shoreline also can jeopardize a coastal area s capacity for recreation. If beaches become narrow or unstable, travel and tourism along the coasts will suffer.


187 BEFORE SOCIETY RESPONDS Because people highly value the economic, recreational, and environmental resources on the coasts, there is public interest in protecting our nation s beaches People are driven by a strong desire to protect life and property. Trillions of dollars in property, structures, and infrastructure overlook our nation s shorelines. Eroding beaches, left alone, will continue to put people, as well as our cultural, historic, economic, and environmental resources, at risk for damages from hurricanes and coastal storms. Measures designed to protect our nation s coasts and prevent or reduce damages ultimately cost less than federal disaster assistance and insurance payouts if overwhelming economic losses occur after a natural catastrophe. 6 If significant damages can be prevented, emergency equipment can get into a coastal region faster, evacuated residents can return home sooner, and the high costs of cleanup and rebuilding structures and infrastructure can be avoided. Shore protection can help safeguard the public s investment in our nation s coasts Shore protection projects are designed to retain and rebuild natural systems such as bluffs, dunes, wetlands, and beaches and to protect structures and infrastructure landward of the shoreline. Shore protection not only can reduce a storm s potential physical and economic damages from waves, storm surge, and the resulting coastal flooding but also can mitigate coastal erosion and even help restore valuable ecosystems that may have been lost such as beaches, wetlands, reefs, and nesting areas. There are several ways to protect the shore: Hard coastal structures; Non-structural solutions such as relocation or retreat (controls that restrict building and coastal development); and Soft measures such as beach nourishment. AFTER Storm surge can inundate structures on an eroding beach and cause them to collapse. Hurricane Ivan in 2004 destroyed these structures at Orange Beach, Ala. Hard structures parallel to the shore, such as breakwaters or seawalls, help stop waves from affecting the shore or beachfront dwellings; structures perpendicular to the shore, such as groins, influence the movement of sediment along the shore by waves and currents. In the past, hard structures were used exclusively for shore protection, but sometimes they changed the shape and nature of beaches and even blocked sediment transport. Today hard structures are still used when appropriate, either alone or in combination with beach nourishment. Non-structural solutions such as increasing building setbacks, elevating structures, and implementing zoning restrictions may lessen the consequences of erosion, but they won t slow it down. And retreating from the shore, leaving property, structures, and infrastructure behind some $3 trillion along the East Coast alone is rarely practical or politically feasible. 7,8 It is difficult to reverse some 300 years of development. Photos courtesy of USGS Breakwaters, constructed offshore but parallel to the shore, break waves before they reach the shore. Breakwaters help retain sand and reduce local erosion.


188 Photo courtesy of the City of Virginia Beach Beach nourishment, the only shore protection method that adds sand to the coastal system, is the preferred method for shore protection today During a beach nourishment project, large volumes of beach-quality sand, called beach fill, are added from This beach nourishment project is under construction at Virginia Beach, Va. Coastal engineers often place beach fill directly on the beach to extend the natural berm seaward. In some cases, beach fill is placed as underwater mounds. outside sources to restore an eroding beach. Or, a beach is constructed where only a small beach, or no beach, existed. 8 Ultimately, beach nourishment widens a beach and advances the shoreline seaward. Beach nourishment projects are designed and engineered to work like natural beaches, allowing sand to shift continuously in response to changing waves and water levels. Coastal engineers may decide to place beach fill as underwater mounds, directly on the beach, as dunes or all three. This sand, once placed, is redistributed gradually by natural processes affecting the beach system. Ultimately, the wider, nourished beach, which slopes gently downward below the water, and the taller sand dunes protect the shore by acting as naturally protective buffers. The gradual slope of the nourished beach causes waves to break in shallow water as they begin to feel bottom. As water rushes up the beach, wave energy dissipates. Water running back down the beach redistributes sediment, which is deposited in deeper water or moved along the shore. These sediments often create an offshore bar that causes waves to break farther offshore, again dissipating wave energy, and thus protecting people and property behind the beach. To ensure that a nourished beach continues to provide protection and mitigate the effects of hurricanes and coastal storms, the project must be supplemented with additional quantities of sand, called periodic renourishment, as needed. The federal government helps communities protect certain beaches by providing shore protection with beach nourishment Coastal development began in the early 1900s. In those days, individual property owners attempted to build their own structures to control erosion after hurricanes and coastal storms but with unacceptable results. These structures not only were ineffective and unattractive but also harmful to the environment. 9 In 1930, Congress authorized the U.S. Army Corps of Engineers to play a role in shore protection. During the 1950s, construction began on the first 18 federal shore protection projects, most of them involving beach nourishment. Through 2006, the Corps has constructed 87 major shore protection projects, most on the Atlantic coast. Today the Corps continues to provide shore protection, including beach nourishment, under the Flood and Coastal Storm Damage Reduction Program as part of its civil works mission. Other Corps Photos courtesy of Tom Campbell BEFORE AFTER Beach nourishment, which adds sand to the coastal system, protects people and property from the effects of hurricanes and coastal storms by widening a beach and advancing the shoreline seaward. This project was constructed at Panama City Beach, Fla.


189 The Corps of Engineers manages the federal shore protection program. water resource activities include navigation, recreation, ecosystem restoration, and emergency response. Local governments often initiate beach nourishment projects Beach nourishment projects often begin after a local government decides that it has valuable resources dense development and other economic and environmental resources behind a beach needing protection from hurricanes and coastal storms. The community already may have endured flooding and property damage from recent storms, or its narrowing beach may be affecting recreational capacities and threatening the local economy. The local government approaches the federal government with a request for assistance; the federal government must determine that there is a federal interest in protecting these areas to prevent damages. For projects with federal involvement, the beach receiving protection must be accessible to the public; for example, there must be adequate parking or access to public transportation. Additionally, the community requesting the project must be willing to help pay for it, since Congress requires that costs for beach nourishment and periodic renourishment be shared by the federal government and the local sponsor, which operates the project over time. Not all proposed projects will get built. Projects must go through a rigorous evaluation process, including an environmental analysis, reviews by state and federal agencies, public hearings, and the Corps internal review process. From 1950 through 2006, the Corps has helped construct beach nourishment projects on approximately 350 miles of U.S. shoreline, with most projects on the Atlantic and Gulf coasts. Beach nourishment projects constructed by the Corps have reduced damages to coastal development caused by erosion, hurricanes, and flooding; protected and renewed the natural habitat; and provided recreation and economic benefits. BEFORE AFTER Dunes included in a beach nourishment project act as a protective barrier, preventing flooding and storm damage caused by storm surge, wave runup, and overtopping. This project was constructed at Ocean City, N.J. Photo courtesy of the City of Virginia Beach Photo courtesy of Scott L. Douglass Photo courtesy of J. Richard Weggel


190 Photo courtesy of Marlowe & Company BEACH NOURISHMENT PROJECTS ARE ENGINEERED Coastal engineers use their knowledge of complex coastal processes and decades of experience in beach nourishment to plan and design projects Every beach nourishment design is unique, since different beaches in different areas have different physical, geologic, environmental, and economic characteristics and different levels of protection justified. Because it s impossible to predict with certainty what wave or storm conditions will be in a given year, coastal engineers use computer models to help design beach nourishment projects based on a range of expected beach behavior and certain types of storms. During the planning process, the study team must evaluate complex environmental issues; find ways to maximize benefits and minimize construction costs; and ensure that the project complies with federal, state, and local laws and regulations. Some key questions are: What are the site boundaries and design considerations? Will beach nourishment take place on a long, straight beach the typical location within a pocket beach, or next to an inlet? The design must consider climatology, the shape of the beach, type of native sand, volume and rates of sediment transport, erosion patterns and causes, waves and water levels, historical data and previous storms, probability of certain beach behaviors at the site, existing structures and infrastructure, and past engineering activities in the area. Photo courtesy of the City of Virginia Beach By understanding beach topography above and below the water, coastal engineers can identify coastal processes at the site, calculate the volume of beach fill needed, and determine how long the project will last before renourishment is required. Periodic renourishment intervals which vary based on the initial design, wave climate, sand used, types of storms, and project age range on average from two to 10 years. 8 This beach nourishment project is under construction at Sandbridge Beach in Virginia. Beach nourishment is not an exact science; variables and uncertainties exist. Actual periodic renourishment intervals may differ from planned intervals based on conditions at the nourished beach and the frequency and intensity of storms from year to year.


191 What features should be designed and constructed? Monitoring of past beach nourishment projects and better scientific information on how these projects interact with sediment transport and other coastal processes have improved beach nourishment designs, which can include beach berms, sand dunes, feeder beaches, underwater berms, and some types of hard structures. A higher and wider beach berm is designed to reduce wave energy. New sand dunes may need to be constructed or existing dunes improved to reduce damage from inundation. By acting as a protective barrier, dunes help prevent flooding and storm damage caused by storm surge, wave runup, and overtopping. Berm height and width, dune height, and offshore slope are critical elements of a beach nourishment design. Sometimes a feeder beach, which stockpiles beach fill for distribution naturally to other parts of the project area, may be required. In some cases, sand is placed in shallow water so waves can move it gradually toward the beach; in other cases, sand may be placed offshore in an underwater berm. Hard structures such as groins may be included to reduce the forces that cause rapid sediment losses and extend the time between renourishment events. Beach nourishment projects are designed to optimize storm damage reduction benefits relative to costs. Designing a project to protect against any and all storms is not economically feasible. Extreme conditions and severe storms could exceed the capacity of a beach nourishment project to protect people and property. Photos courtesy of the City of Jacksonville, Fla. During project design, coastal engineers often include features that improve habitat and encourage turtles and shorebirds to nest and dwell on the nourished beach. Photo courtesy of Scott L. Douglass Photo courtesy of Scott L. Douglass What borrow source for beach fill should be used? The sand to nourish a beach comes from a borrow source, chosen based on compatibility of sand, cost, removal and transportation, and environmental factors. Beach fill can be dredged from underwater sources of sediment such as harbors, navigation channels, or waterways, or from other large, offshore deposits, which is now common. Dredged material can be pumped through pipelines directly onto the beach or transported to the shore via specially designed barges before being pumped onto the beach. Or, sand for beach fill can be taken from dry land sources and transported by trucks. Finding an affordable borrow source with sufficient quantities of high-quality beach fill is challenging. Grain size, color, composition, and texture of the material should match the native sand as closely as practical to ensure proper project performance. If one borrow source is depleted over time, coastal engineers find another affordable borrow source.
192 During construction of a beach nourishment project, sand is placed so that natural coastal processes can reshape the nourished beach into the desired configuration as intended by coastal engineers The dry beach may seem overbuilt during construction, since sand is often placed on the shore at fairly steep slopes. After construction, it is normal for the newly nourished beach to readjust and change substantially within the first few months. Engineers expect modest waves to move and spread the sediment so that the nourished beach can begin assuming a more natural form. This sediment will continue to move offshore, so that larger waves are prevented from reaching the shore, and along the shore. This movement of sediment, while decreasing the width of the nourished beach somewhat, is not erosion; rather, it indicates that the project is performing as designed. ENVIRONMENTAL CONSIDERATIONS ARE INTEGRAL TO BEACH NOURISHMENT PROJECTS Since sediment is constantly being redistributed and coastlines and beaches are always on the move plants, fish species, and other marine life are well adapted to the natural processes of accretion and erosion. Nevertheless, the type, timing, extent, and duration of these changes can affect our ecological resources. Studies are still being conducted to determine how these species become accustomed to the physical changes that occur when a beach nourishment project is constructed and periodic renourishment occurs. Because beach nourishment projects can affect environmental resources at the borrow source and placement site, responsible planning and design are needed to prevent or reduce adverse effects to the environment and wildlife before, during, and after construction: Beach fill can be dredged from borrow sources in ways to minimize turbidity and in thin layers to protect organisms and habitat. Sensitive areas such as reefs and hard bottom areas can be avoided or protected from damage during dredging. Beach fill can be selected to match the native sand size and composition as closely as possible; closely matched beach fill helps accommodate species needs for sea turtle nesting, egg incubation, and hatching success. Construction can be scheduled during specific months to avoid disrupting nesting, spawning, or other behaviors and associated habitat. Care can be taken to avoid creating steep berms or scarps, which can force female sea turtles and beach nesting birds to lay their eggs too close to the water, where they could be washed away by tides. After a beach nourishment project is constructed, coastal engineers expect the beach to change gradually over time and assume a more natural form. Beach nourishment projects can have multiple benefits Besides mitigating coastal erosion and protecting life and property through hurricane and storm damage reduction, beach nourishment projects can provide environmental, recreational, and aesthetic benefits. For example, nourishing and widening an eroding beach can: Protect threatened or endangered plants in the dune area; Protect habitat behind dunes or next to beaches; Create or restore habitat, lost through erosion, for sea turtles, shorebirds, and other beach organisms; and Create new nesting areas for endangered sea turtles and spawning grounds for other species. Beach nourishment projects also can create and sustain wider beaches for recreational activities such as fishing and boating and protect infrastructure enjoyed by tourists. Healthy beaches not only are crucial to the nation s travel and tourism industry but also can help revitalize local economies by increasing property values, condominium rentals, retail sales, and demand for services. Photo courtesy of the City of Virginia Beach


193 HOW BEACH NOURISHMENT WORKS WHEN A STORM COMES ASHORE e s It is natural for nourished beaches and dunes to erode and change as they dissipate and absorb wave energy during a storm Coastal engineers expect that large storms will induce sediment transport from the nourished beach and move sand offshore. When this happens, waves begin to break farther from the shoreline, thus weakening their force before they reach the shoreline itself. In this way, beach nourishment projects help protect dunes and property from further erosion, decrease flooding, and limit how far ashore storm surge will go. Coastal engineers can build environmental amenities into a project based on needs at the site. In an eroding area, the project can be designed to produce an artificial overwash fan, which spreads sand landward of the dune line into waters behind a barrier island, for example. In an area with a sensitive-species habitat, however, the project can be designed to prevent a natural overwash fan, since additional sand could harm such habitats. Photo courtesy of S. Brooke Photo courtesy of the City of Virginia Beach A wide, flat beach berm with a sufficient volume of sand keeps the erosive power of the waves from reaching and destroying the dunes and structures and can reduce damages significantly from waves, inundation, and erosion. Without beach nourishment, the starting point for damage would be farther onshore; a nourished beach, with sufficient sand volume and healthy dunes, absorbs the storm s energy, even during slow-moving storms, and helps prevent damages to structures and infrastructure. An estimated $105 million in damage was prevented after Hurricane Isabel struck a nourished beach with a seawall at Virginia Beach in fall The project was designed to stop a 9-foot storm surge and it did. The nourished beach minimized wave attack and overtopping of the seawall, the community s last line of defense. A nourished beach (pre-storm) A nourished beach (post-storm)


194 Photo courtesy of the City of Jacksonville, Fla. Beach nourishment projects work by allowing the destructive forces of waves to strike the beach instead of the structures and infrastructure behind the beach. Illustration courtesy of USGS The height and sand volume of a dune, stabilized by vegetation, also play an important role in reducing damages. During large storms, the dune on a nourished beach is usually the last line of defense that can absorb wave energy, protect against storm surges, and minimize or prevent flood damages. When a storm strikes a nourished beach, sediment is redistributed in two ways: in the longshore direction, to adjacent beaches, and in the cross-shore direction, either toward the sea or toward land. At first, shoreline recession produced by the cross-shore transport of sediment may seem significant. But it is not unusual for nourished beaches to change dramatically in response to storms. Storm-generated currents and waves will redistribute great quantities of sediment, changing the profile of the nourished beach. Nourished beaches begin to heal after a storm Within hours or days with milder weather and time sediment that has moved offshore or alongshore during a storm begins to move back onshore, since much of it remains in the system. After a few months, dunes begin to recover with wind-blown sand. The sediment returns gradually, carried by smaller waves, to restore the beach and prepare it to protect the shore during future storms. Sand that moves to other areas offshore or alongshore can nourish adjacent beaches and also have a positive effect by dissipating wave energy in other locations. Photo courtesy of USGS shoreline may have moved landward, waves may have eroded or even overtopped the dunes, great quantities of sand may have moved offshore or alongshore, and the beach may need renourishment. But that doesn t mean the project was a failure. A beach nourishment project is considered successful if damages from waves, inundation, and erosion have been prevented or reduced significantly, and development and ecosystems behind the dunes are still intact. post-storm dune pre-storm duneline During Hurricane Fran in 1996, no structures were destroyed and no oceanfront development endured significant damage at Wrightsville Beach, N.C., the site of a Corps beach nourishment project. However, as shown here on Topsail Island, an unprotected area, the shoreline eroded, and the dunes and hundreds of structures were destroyed. 6 However, a beach nourishment project can last only so long before natural processes and storms will have transported too much sediment outside the project area. If the volume of sand on the dry beach cannot provide adequate shore protection, renourishment may be required to rebuild and restore the berm before erosive processes affect dunes, development, and valuable ecosystems behind the beach. Beach nourishment projects can be considered successful even when a beach changes dramatically after a storm The goal of beach nourishment is not to maintain a wide, dry, exposed beach. In fact, after a storm, a nourished beach may be narrow, the Photo courtesy of Scott L. Douglass A beach nourishment project at Ocean City, Md., constructed in 1990 and 1991 at an initial cost of $37.5 million, immediately prevented an estimated $93 million in damage to structures and infrastructure after severe storms struck the area the following two winters.


195 THE FUTURE OF OUR COASTS: WHAT S IN STORE Continued population migration and development along the coasts, impacts from global climate changes, relative sea level rise, and more frequent and intense storms will continue to affect our coastlines From 1985 to 1994, when sea surface temperatures were lower in the tropics, there were only half as many hurricanes as there have been since 1995, when sea surface temperatures and wind conditions in the Atlantic shifted. Now that the United States is in the midst of a new, long-term weather cycle, scientists predict that frequent, clustered hurricanes will become more common, with more major hurricanes making landfall over the next 10 to 30 years. As waters remain warm, they re likely to spawn more intense hurricanes. Societal changes, however, pose the greatest threat Photos courtesy of USGS The more people and property along the coasts, the more vulnerable we are, and the larger the potential losses including loss of life from the effects of hurricanes and coastal storms on eroded beaches. Eroding beaches if left alone will continue to lose their naturally protective function. Nourishing an eroded beach in a highly developed area allows nature to take its protective course. However, if we don t take care of our nation s beaches, they will lose their naturally protective function, putting people, property, and the environment at great risk. These are considerable challenges for the 21 st century. As long as beach nourishment projects are planned, engineered, and constructed properly and periodically renourished beach nourishment is a sound and costeffective shore protection method. In the future, it is likely that more communities may turn to beach nourishment as the preferred method of shore protection to reduce storm damages and help protect life and property, mitigate coastal erosion, and restore the ecosystem. Photo courtesy of Scott L. Douglass Our highly developed coastlines will continue to be vulnerable to the effects of hurricanes and coastal storms. Photo courtesy of Marlowe & Company Beaches will continue to retreat if sediment in certain areas is lost to the coastal system.
, at CHL-Info@erdc.usace.army.mil.")
196 Beach nourishment of an eroding beach can protect people and property from the effects of hurricanes and coastal storms. FOR MORE INFORMATION ABOUT BEACH NOURISHMENT Please contact the Coastal and Hydraulics Laboratory, Engineer Research and Development Center (ERDC), at WORKS CITED 1 Bourne, Joel K. Jr. Loving Our Coasts to Death. National Geographic. Washington, D.C. July U.S. Commission on Ocean Policy. An Ocean Blueprint for the 21 st Century. Final Report. Washington, D.C National Oceanic and Atmospheric Administration, Office of Policy and Strategic Planning. NOAA Economic Statistics. U.S. Department of Commerce. May Shivlani, Manoj P.; Letson, David; and Theis, Melissa. Visitor Preferences for Public Beach Amenities and Beach Restoration in South Florida. Coastal Management, 31: Taylor & Francis Inc Waymer, Jim. Survey Details Battered Beaches; Panhandle Dunes Hardest Hit. Florida Today. March 25, Institute for Water Resources, U.S. Army Corps of Engineers. Hurricane Fran Effects on Communities With and Without Shore Protection: A Case Study at Six North Carolina Beaches. Alexandria, Va. December Tennant, Diane. Sea Change, Part 2: At the Oceanfront. The (Norfolk, Va.) Virginian-Pilot. Sept. 19, Committee on Beach Nourishment and Protection. Marine Board, Commission on Engineering and Technical Systems, National Research Council. Beach Nourishment and Protection. National Academy Press. Washington, D.C Morang, Andrew, and Chesnutt, Charles B. Historical Origins and Demographic and Geologic Influences on Corps of Engineers Coastal Missions. National Shoreline Management Study, Institute for Water Resources, U.S. Army Corps of Engineers. IWR Report 04-NSMS-4. January Shore Protection Assessment is an initiative to evaluate how federal shore protection projects performed in the wake of hurricanes Charley, Frances, Ivan, and Jeanne in Shore Protection Assessment is a unique opportunity for a comprehensive and coordinated technical evaluation. The U.S. Army Corps of Engineers and others will use these findings to improve future projects by better predicting how storms move sediment, change shores, and cause damage.
197 Appendix B Native Sand Volume Calculations
198
199 Beach Sand Nourishment Scoping Study Maintaining Sydney s Beach Amenity Against Climate Change Sea Level Rise Appendix B Native Sand Volume Calculations The following tables outline the beach dimensions and the required native volumes of sand to maintain existing beach amenity in response to climate change sea level rise. Each of Sydney s beaches from Forresters Beach (north of Sydney) to Cronulla Beach (south of Sydney) is tabulated. The beach dimensions (referenced to Figure 4.2 and reproduced below) and the governing depth of closure criteria are documented in Table 1. Figure 4.2 (reproduced from main report) Definition of parameters to calculate beach volume requirements Native sand volumes to maintain beach amenity for 0.1m incremental rises in sea level are tabulated in Table 2. Native sand volumes per metre length of beach are also provided. The final column in Table 2 presents the volume of sand required to nourish that beach relative to all of Sydney s beaches.
200
201 Beach Sand Nourishment Scoping Study Maintaining Sydney s Beach Amenity Against Climate Change Sea Level Rise Table 1 Beach Dimensions and Depth of Closure Criteria Name Line 1 (m) Line 2 (m) Beach Length (m) Distance to 21m (CD) contour (m) Governing Criteria Depth at Criteria (m) Forresters Beach m (CD) water depth 21 1: 44 Wamberal Beach m (CD) water depth 21 1: 36 Terrigal Beach fine/medium sand 20 1: 49 Avoca Beach m (CD) water depth 21 1: 45 MacMasters Beach m (CD) water depth 21 1: 40 Little Beach m (CD) water depth 21 1: 30 Maitland Bay fine/medium sand 14 1: 52 Putty Beach m (CD) water depth 21 1: 47 Tallow Beach m (CD) water depth 21 1: 47 Palm Beach m (CD) water depth 21 1: 41 Whale Beach m (CD) water depth 21 1: 36 Avalon Beach m (CD) water depth 21 1: 36 Bilgola Beach m (CD) water depth 21 1: 40 Newport Beach fine/medium sand 20 1: 47 Bungan Beach m (CD) water depth 21 1: 48 Basin Beach fine/medium sand 4 1: 34 Mona Vale Beach m (CD) water depth 21 1: 36 Warriewood Beach m (CD) water depth 21 1: 52 Turimetta Beach fine/medium sand 16 1: 60 Narrabeen Lagoon Flood Delta Area =458,295m 2 Sydney Collaroy/Narrabeen Beach Slope 1: : 52 Fishermans Beach fine/medium sand 4 1: 45 Long Reef Beach fine/medium sand 10 1: 63 Dee Why Beach Slope 1: : 73 Slope Gosford Broken Bay
202
203 Beach Sand Nourishment Scoping Study Maintaining Sydney s Beach Amenity Against Climate Change Sea Level Rise Table 1 Beach Dimensions and Depth of Closure Criteria (cont) Name Line 1 (m) Line 2 (m) Beach Length (m) Distance to 21m (CD) contour (m) Governing Criteria Depth at Criteria (m) Curl Curl Beach m (CD) water depth 21 1: 47 Freshwater Beach m (CD) water depth 21 1: 54 Manly Beach m (CD) water depth 21 1: 50 Bondi Beach m (CD) water depth 21 1: 36 Coogee Beach m (CD) water depth 21 1: 20 Maroubra Beach m (CD) water depth 21 1: 40 Malabar Beach fine/medium sand 9 1: 53 Cronulla Beach Slope 1: : 109 Slope Bate Bay Table 2 Native Sand Volumes Beach Dimensions Native Sand Volumes (m 3 ) Name Distance to Beach 21m (CD) Length (m) contour (m) Governing Criteria Depth at Criteria (m) Slope SL Rise 0.1m /m length of beach SL Rise 0.2m /m length of beach SL Rise 0.3m /m length of beach 1 Forresters Beach m (CD) water depth 21 1: 44 51, , , Wamberal Beach m (CD) water depth 21 1: , , , Terrigal Beach fine/medium sand 20 1: , , , Avoca Beach m (CD) water depth 21 1: , , , MacMasters Beach m (CD) water depth 21 1: , , , Little Beach m (CD) water depth 21 1: 30 18, , , Maitland Bay fine/medium sand 14 1: 52 27, , , Putty Beach m (CD) water depth 21 1: , , , Tallow Beach m (CD) water depth 21 1: , , , Palm Beach m (CD) water depth 21 1: , , , Whale Beach m (CD) water depth 21 1: 36 52, , , Volume Proportion (%)
204
205 Beach Sand Nourishment Scoping Study Maintaining Sydney s Beach Amenity Against Climate Change Sea Level Rise Table 2 Native Sand Volumes (cont) Beach Dimensions Native Sand Volumes (m 3 ) Name Beach Length (m) Distance to 21m (CD) contour (m) Governing Criteria Depth at Criteria (m) Slope SL Rise 0.1m /m length of beach SL Rise 0.2m /m length of SL Rise 0.3m beach /m length of beach 12 Avalon Beach m (CD) water depth 21 1: 36 52, , , Bilgola Beach m (CD) water depth 21 1: 40 32, , , Newport Beach fine/medium sand 20 1: 47 99, , , Bungan Beach m (CD) water depth 21 1: 48 56, , , Basin Beach fine/medium sand 4 1: 34 4, , , Mona Vale Beach m (CD) water depth 21 1: 36 84, , , Warriewood Beach m (CD) water depth 21 1: 52 43, , , Turimetta Beach fine/medium sand 16 1: 60 53, , , Narrabeen Lagoon Area = ,830 91, , Collaroy / Narrabeen Slope 1: : , , , Beach 22 Fishermans Beach fine/medium sand 4 1: 45 10, , , Long Reef Beach fine/medium sand 10 1: 63 30, , , Dee Why Beach Slope 1: : 73 95, , , Curl Curl Beach m (CD) water depth 21 1: , , , Freshwater Beach m (CD) water depth 21 1: 54 85, , , Manly Beach m (CD) water depth 21 1: , , , Bondi Beach m (CD) water depth 21 1: 36 95, , , Coogee Beach m (CD) water depth 21 1: 20 15, , , Maroubra Beach m (CD) water depth 21 1: , , , Malabar Beach fine/medium sand 9 1: 53 11, , , Cronulla Beach Slope 1: : , , ,306, Volume Proportion (%) TOTAL ,101, ,203, ,304,
206
207 Appendix C Offshore Mineral Titles
208
209 Beach Sand Nourishment Scoping Study Maintaining Sydney s Beach Amenity Against Climate Change Sea Level Appendix C Offshore Mineral Titles The Inner Continental Shelf near Sydney is interspersed with marine sand deposits in depths ranging from around m. Some of these have been the subject of exploration licences and mining lease applications, as indicated in the following figure. Details of current licences and lease applications are provided in this Appendix. The Providential Head lease is held by Metromix Pty Ltd. The Cape Banks lease is held by Archdall Investments Pty Ltd (Unisearch) and the Central Coast lease is held by Sydney Marine Sand Pty Ltd. All leases have currently expired and applications have been received by the NSW Department of Primary Industries, Industry and Investment NSW for renewal.

210 Beach Sand Nourishment Scoping Study Maintaining Sydney s Beach Amenity Against Climate Change Sea Level

211 Beach Sand Nourishment Scoping Study Maintaining Sydney s Beach Amenity Against Climate Change Sea Level

212 Beach Sand Nourishment Scoping Study Maintaining Sydney s Beach Amenity Against Climate Change Sea Level

213 Beach Sand Nourishment Scoping Study Maintaining Sydney s Beach Amenity Against Climate Change Sea Level
214
215 Appendix D Offshore Extraction Coastal Processes Impacts
216
217 Beach Sand Nourishment Scoping Study - Maintaining Sydney's Beach Amenity Against Climate Change Sea Level Rise Appendix D Offshore Extraction - Coastal Processes Impacts Marine Aggregate Proposal Coastal Processes, Alexander F Nielsen, Douglas B Lord Revision C - 18 February 2010
218
219

220
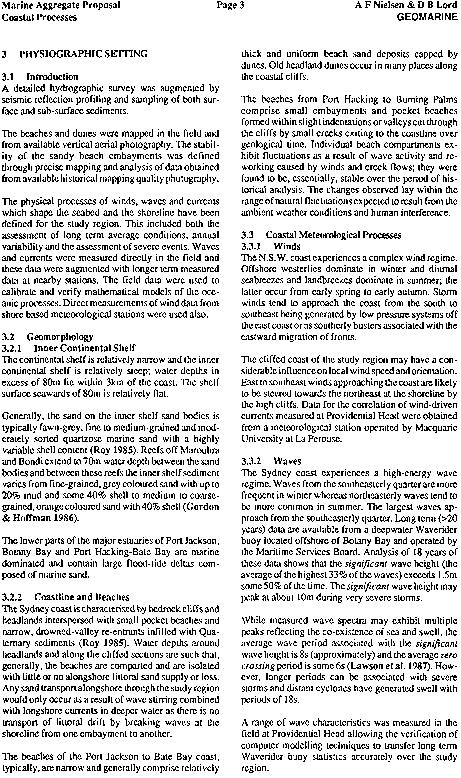
221
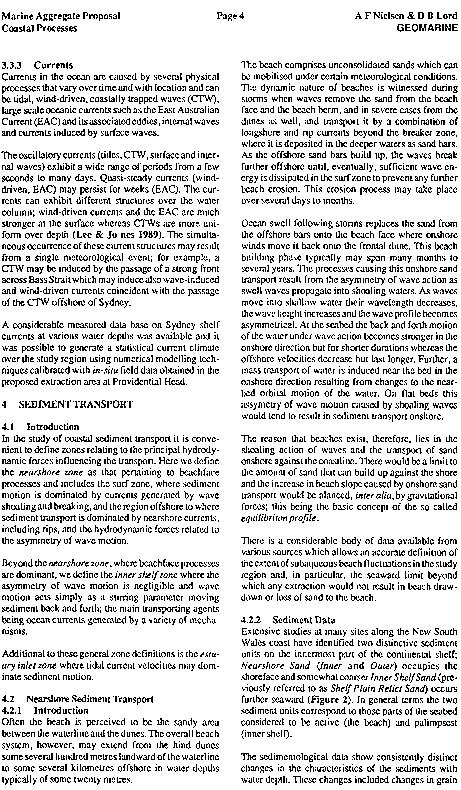
222
223
224
225
226
227
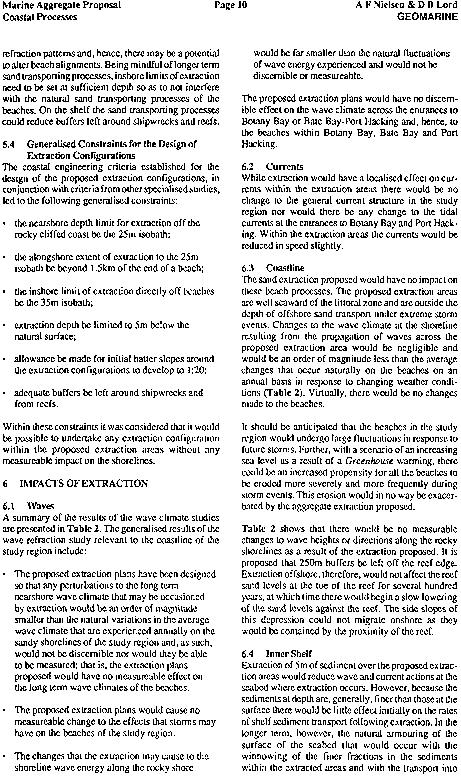
228
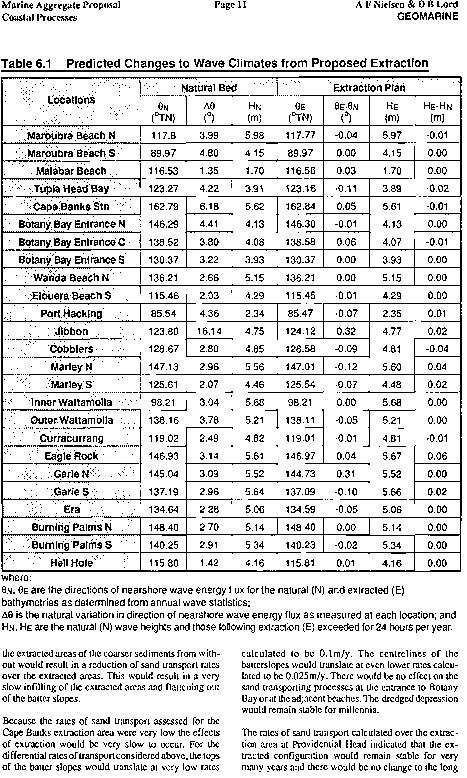
229
230
231 Appendix E Offshore Extraction Ecological Impacts
232
233 Beach Sand Nourishment Scoping Study - Maintaining Sydney's Beach Amenity Against Climate Change Sea Level Rise Appendix E Offshore Extraction - Ecological Impacts Cardno Ecology Lab, Extraction of Offshore Sand Reserves, Potential Environmental Impacts, August 2009 Revision C - 18 February 2010
234

 Extraction of Offshore Sand Reserves - Potential Environmental")
235 (Insert a photograph for the report here. Stretch and move so that it doesn t cover the Marine and Freshwater logo above, and make it flush with the blue box below, and full width of page. Delete this text) Extraction of Offshore Sand Reserves - Potential Environmental Impacts Job Number: Prepared for August 2009
236 Extraction of Offshore Sand Reserves: Potential Environmental Impacts Prepared for Cardno Ecology Lab Pty Ltd ABN Green Street Brookvale New South Wales 2100 Australia Telephone: Facsimile: International: ecologylab@cardno.com.au Cover Image: Close-up of sand grains. Photographer Arthur Dye, Cardno Ecology Lab Document Control Job Number Status Date Author Reviewer Draft 12 August 2009 Dr Theresa Dye TAD Dr Peggy O Donnell POD " 2009 Cardno Ecology Lab Pty Ltd All Rights Reserved. Copyright in the whole and every part of this document belongs to Cardno Ecology Lab Pty Ltd and may not be used, sold, transferred, copied or reproduced in whole or in part in any manner or form or in or on any media to any person without the prior written consent of the Director of Cardno Ecology Lab Pty Ltd. EL A Draft, August 2009 i
237 Extraction of Offshore Sand Reserves: Potential Environmental Impacts Prepared for Table of Contents 1 Introduction Overview of the Metromix Proposal Environmental Impacts of the Metromix Project Introduction Potential Impacts Associated with Sand Extraction Impacts on Marine Habitats Impacts on Marine Biota Potential Impacts Associated with Disposal of Excess Water Potential Impacts Associated with Operation of the Extraction Vessel Potential Conflicts with Users of Other Marine Resources Potential Impacts Identified in Studies Elsewhere United States Europe Acknowledgements References EL A Draft, August 2009 ii
238 Extraction of Offshore Sand Reserves: Potential Environmental Impacts Prepared for 1 Introduction Cardno Ecology Lab Pty Ltd (formerly The Ecology Lab) was commissioned by to summarise the environmental impacts associated with dredging of offshore sand reserves in the Sydney region as indicated in the Metromix Marine Aggregate Proposal. This assessment forms part of the Scoping Study for the Extraction of Sand Reserves from the Sydney Shelf Sand Body for Protection of Threatened Assets and Amenity Enhancement prepared by for the Sydney Coastal Councils Group. This report comprises: a brief overview of the Metromix proposal; a description of the potential impacts of the Metromix project on marine habitats, biota and resources; and an overview of additional potential impacts arising from sand extraction that have been identified in recent overseas studies. 2 Overview of the Metromix Proposal Metromix Pty Ltd proposed to extract sand from two separate areas of a large m deep sand body situated off the coast to the south of Sydney and deliver it to the Port Jackson terminal. The proposal included the extraction of 30 million tonnes of concrete grade sand and 39 million tonnes of finer-grained material for general construction purposes from an area of 7.4 km 2 situated approximately km off the coast between The Cobblers and Providential Head which varied in depth from m. Metromix also planned to extract 27 million tonnes of concrete grade sand and 24 million tonnes of finer grade sand from an area of 8.2 km 2 off Cape Banks, near the entrance to Botany Bay, which varied in depth from 43-65m (Corkery and Co. 1993). The sand would have been extracted by a trailer suction dredge and stored in a 2000 m 3 hopper inside the vessel until it could be offloaded. On site, the extraction head would have created a slurry consisting of approximately 90% seawater and 10% sand that would have been pumped up the suction pipe into the hopper, which would initially have been filled with ballast water drawn from Sydney Harbour. Approximately 30% of the water would have been retained with the sand the remainder would have been released into the sea via diffuser ports at a depth of about 15 m below the surface (Corkery and Co. 1993). Between 40 and 50% of the water retained in the sand would have been discharged into the ocean via a series of outlets in the vessel s hull en route to the offloading berth. The dredge would have needed to travel km over a period of about 2.5 hours to fill the hopper. It was expected that extraction and unloading together would take hours and that the vessel would make between 170 and 450 trips per year. The plan was to produce 0.6 million EL A Draft, August
239 Extraction of Offshore Sand Reserves: Potential Environmental Impacts Prepared for tonnes of fine sand in the first five years of operation, 1 million tonnes between years 6 and 10 and million tonnes from year 11 onwards and for extraction of sand to continue for 25 years from Providential Head and for 24 years from Cape Banks. 3 Environmental Impacts of the Metromix Project 3.1 Introduction The potential impacts of the Metromix project on marine habitats, biota and resources off the coastline adjacent to Sydney were identified and evaluated by The Ecology Lab (1993). The following categories of potential impacts were identified: Effects on benthic macrofauna and demersal fish due to the removal of sand from the seabed; Effects on marine habitats, primary producers, benthic organisms, nektonic organisms, marine mammals and seabirds resulting from the release of fines with the excess water; Effects on the marine environment due to operation of, or accidents involving, the extraction vessel; and Conflicts with users of other marine resources Potential Impacts Associated with Sand Extraction Impacts on Marine Habitats The extraction head of the trailer suction dredge would initially create a furrow approximately 1.7 m wide and 0.2 m deep along the seabed (Corkery and Co. 1993). It was estimated that hectares of the seabed would be disturbed per trip and that the upper layer of the sand over an area of 2-5 km 2 would be removed annually. The area disturbed per trip would be equivalent to 0.007% of the sandy inner shelf sediments between Broken Bay and Garie North Head and to less than 1% of these sediments over a three month period (Corkery and Co. 1993). The interval before an area would be re-extracted would vary from at least two years in the early stages of the operation to not less than 3 months near the end of extraction. The re-extraction of areas of seafloor would have resulted in a mosaic of patches in the following states: Never disturbed by extraction; Disturbed once; Disturbed more than 3 months previously; and Disturbed within the previous 3 months. The sediment that would have been exposed would be similar to that occurring on the surface of the sand body, except for the lack of living organisms and probably having less EL A Draft, August
240 Extraction of Offshore Sand Reserves: Potential Environmental Impacts Prepared for organic matter (The Ecology Lab 1993). The sediment would, however, be slightly finer in areas from which Grade 2 marine aggregate was extracted (Corkery and Co. 1993). Sand extraction was not expected to expose any bedrock, because the sand body is m deep. The depth of the sand body within the two extraction areas would have been reduced by 5 m by the end of the extraction period. It was predicted that the edges of this depression would gradually flatten over thousands of years. According to Corkery and Co. (1993), the creation of the depressions on the seafloor would have negligible impacts upon regional bathymetry. The existing isobaths would move shorewards by km, which was considered negligible on a local scale. The effects of sand extraction on the coastline and on movement of sediment on the seabed were also considered (Geomarine et al. 1993). These studies indicated that extraction would have no measurable effects on beaches, coastal erosion, wave energy on rocky shores or coastal processes at Cape Banks Impacts on Marine Biota The powerful suction generated at the extraction head would pump the upper 20 cm layer of sand and most of the associated benthic invertebrates and small sedentary and/or burrowing species of fish occurring directly below or immediately adjacent to the track of the head up into the hopper on board the dredge (The Ecology Lab 1993). Mobile species, such as fish and prawns, and large bivalves may be able to avoid the extraction head by swimming away or burrowing, respectively. Some of the organisms extracted would be released back into the sea with the excess water, however, not all would survive, because of the change in water pressure, abrasion against the sand, impact with the screens, deposition into unsuitable habitat or consumption by predators such as fish. Other organisms would be returned to port with the sand. The removal of organisms would change the structure of benthic assemblages, affect their ability to recovery from natural disturbances and result in a net loss of benthic productivity. The impacts on benthic invertebrates would thus be significant, but highly localised and short-term persisting until recolonisation occurred (The Ecology Lab 1993). Longer-term or wider scale impacts were not expected, because: Less than 25% of the extraction area would be disturbed at any one time; A physical disturbance experiment indicated that recolonisation by macroinvertebrates would occur within two to three months; Sediments exposed by the extraction process would be similar to those occurring on the surface; and EL A Draft, August
241 Extraction of Offshore Sand Reserves: Potential Environmental Impacts Prepared for The potential for smothering of organisms by fines in the excess water returned to the sea would be minimal. The Ecology Lab (1993) did, however, point out that the rate of recolonisation may change as the area of undisturbed seabed containing a potential source of new recruits declined. The relatively small area of seabed that would be disturbed at any one time and likely rate of recolonisation by benthic invertebrates indicated that there would be a minimal, localised reduction in potential benthic food resources for fish. There was no evidence that the proposed extraction areas were significant spawning or nursery grounds for fish. Impacts on demersal fish assemblages were consequently predicted to be small-scale and short-term. It was, however, noted that the eventual 5 m increase in depth of the seabed might lead to assemblages in shallower parts of the extraction area becoming more similar to those in deeper water. If these assemblages include more species of economic value, this long-term, large-scale impact could be beneficial to local fisheries. The impacts of the plume generated by the extraction head as it passes over the surface of the seabed were not assessed, because it was predicted that this plume would be negligible due to the strong suction generated at the extraction head (Lawson and Treloar 1993) Potential Impacts Associated with Disposal of Excess Water According to Corkery and Co. (1993), the release of excess water and fine sediments into the sea would generate an underwater sediment plume up to 170 m wide behind the dredge. This plume would disperse rapidly and be transported by ambient currents parallel to the coast or offshore. Lawson and Treloar (1993) estimated that the concentration of suspended fines would approach 9000 mg L -1 at the outlet pipe, but would be diluted by a factor of 18 within 35 m of the discharge points and would drop to < 9 mg L -1 at a distance of 1.5 km behind the extraction vessel. Given the proposed sub-surface release of excess water, rapid dispersion of the plume over a large area and large size of the coastal water body relative to the plume, The Ecology Lab (1993) made the following predictions about impacts on marine biota in the water column: the plumes would be unlikely to have any detectable effects on primary productivity, except possibly at small spatial and temporal scales; the potential for impacts on plankton would be further reduced by the sub-surface release of the excess water; clogging of the respiratory and feeding appendages of organisms would be limited to very small spatial scales; the migration of fish, prawns and marine mammals would not be affected; and the decrease in water clarity would be unlikely to affect the foraging activities of seabirds. EL A Draft, August
242 Extraction of Offshore Sand Reserves: Potential Environmental Impacts Prepared for Lawson and Treloar (1993) indicated that the maximal annual average settlement of the fines released in the excess water would not exceed < 1 mm of sediment. On the basis of this low deposition rate, the fact that the settling fines would have originated at the site and relatively high energy nature of the Sydney coastline it was predicted that deposition of fines would have minimal effects (The Ecology Lab 1993). This reflected the fact that survival of burial is greater when the settling material is comparable to that on the seafloor, the ability of burrowing organisms to withstand sedimentation and the fact that storms often resuspend greater amounts of sediment. The assessments undertaken by Pollution Research (1992) indicated that the release of contaminants and nutrients from the plume into the water column would not be significant. The Ecology Lab (1993) consequently predicted that there would be no increase in potential for bioaccumulation of contaminants and no detectable increase in primary productivity due to the release of nutrients into the water column Potential Impacts Associated with Operation of the Extraction Vessel The generation of noise would be limited to that associated with the day to day movements of the dredge and use of a suction pump to transfer the slurry into the hopper (Corkery and Co. 1993). The levels of noise generated by these sources were considered relative to what was known at that time about the effects of noise on marine organisms. Heggie et al. (1993) concluded that the noise of the extraction machinery would be attenuated by background shipping noises and that noise generated by the vessel steaming to and from the extraction area each day would not cause a significant change in existing ambient underwater noise levels. This was due to the relatively high density of shipping activity and likely presence of other vessels within the possible zone of influence or audibility of the extraction vessel. The extraction vessel would move at similar speeds (12 knots) to other vessels when moving between the terminal and extraction area, but would be moving at about 1 knot during extraction and therefore likely to be avoided by most marine mammals, reptiles and seabirds (The Ecology Lab 1993). The potential for impacts with marine mammals would also be limited by curtailing activities within the extraction area or by the vessel steaming away from them. It was also recognized that impacts could arise as a result of an accident, loss of the vessel, discarding of wastes or accidental spillages, but the likelihood of these could be reduced by adopting appropriate management practices Potential Conflicts with Users of Other Marine Resources The waters off Providential Head and Cape Banks are utilised by a variety of other groups, including commercial and recreational fishers and divers. The Ecology Lab (1993) considered the potential for conflict between sand extraction and commercial fishing to be EL A Draft, August
243 Extraction of Offshore Sand Reserves: Potential Environmental Impacts Prepared for low, because fishing rarely took place in the proposed extraction areas and extraction was expected to have neither short- or long-term impacts on the marine ecosystem or fish stocks. The potential for conflict with recreational fishers and divers was considered to be low, for the following reasons: they could continue to access the extraction areas and their surrounds; fish stocks and biodiversity would be maintained during and after sand extraction; the vessel would be in each extraction area for a relatively small time; sand would not be extracted on weekends or during public holiday; and the willingness of Metromix to develop a Code of Practice in conjunction with other user groups. 3.2 Potential Impacts Identified in Studies Elsewhere In the past decade, a number of studies have been undertaken overseas on the effects of offshore sand extraction. In the United States, site-specific, inter-disciplinary baseline studies have been carried out in potential offshore borrow areas (Byrnes et al. 2004a and b; Diaz et al. 2004; Maa et al. 2004) and a comprehensive physical and biological monitoring program has been developed to evaluate the long-term impacts of sand dredging on the outer continental shelf (Nairn et al. 2004). In Europe, changes in the structure of benthic assemblages and physico-chemical environment resulting from the extraction of marine aggregates have been documented (Newell et al. 1999; Desprez 2000; Sarda et al. 2000; van Dalfsen et al. 2000; Nonnis et al. 2002; Newell et al. 2004). The major findings from some of the studies on impacts of aggregate extraction are highlighted below United States Nairn et al. (2004) prepared a comprehensive literature review of the potential impacts of sand extraction on the continental shelf environment for the U.S. Minerals Management Service. Their review indicated that plankton, benthic assemblages associated with soft and hard substrata, nekton, marine mammals and wildlife were the components that could potentially be affected by sand extraction. Impacts on plankton, fish and marine mammals were expected to be minimal and of short duration, because the plumes created by dredging operations were very small and temporary. Impacts on hard substrata were not expected, because these areas would either be avoided or surrounded by large buffer zones that would prevent discharges from dredging having any impacts. The impacts on biota that were identified were essentially the same as those highlighted in relation to the Metromix proposal (see Section 3.0), except for the following: EL A Draft, August
244 Extraction of Offshore Sand Reserves: Potential Environmental Impacts Prepared for Discharge from the cutter-head and changes in ridge morphology could alter sediment particle size composition and change nearfield habitat conditions, which, in turn, could have an impact on the composition and structure of assemblages in nearfield areas; and Recolonisation by an altered benthic assemblage could alter productivity and energy transfer pathways in the food chain, which, in turn, could alter the composition of prey organisms available to fish and adversely affect the foraging efficiency of fish and other mobile predators. The evaluation of physical and biological impacts led to the recommendation that sediment sampling and analysis, wave monitoring and modelling, bathymetric and substratum surveys, shoreline monitoring and modelling, benthic assemblages and their relationships to fish, marine mammals and wildlife be included in monitoring programs. Nairn et al. (2004) suggested that the benthic monitoring program should focus on trophic energy transfer between the benthos and representative species of fish, because removal of sand and the resultant changes in substratum type and composition, surface texture, water circulation and nutrient distribution would affect benthic assemblages and the organisms that rely on benthic resources for food Europe The studies undertaken in European waters provide some indication of the types and quantities of organisms lost through dredging, rates of recolonisation and recovery of benthic assemblages after dredging. A review of the impacts of dredging works on a variety of coastal habitats including muddy embayments, lagoons and oyster shell deposits in the USA and sand and gravel deposits in the North Sea indicates that species richness may be reduced by 30 70% and that the number of individuals and biomass in dredged areas may be reduced by 40 95% (Newell et al. 1998). There is also evidence of declines in catch and drastic reduction of stocks of bivalves exploited by artisanal and commercial fishers after dredging (Sarda et al. 2000; Van Dalfsen et al. 2000). The impact of dredging is also likely to vary with the intensity of disturbance in a particular area and the degree of disturbance of the sediment. In gravel deposits, the level to which the benthos is reduced by anchor dredging depends on whether samples coincided with the middle of a dredge pit and the number of days elapsed since dredging (Newell et al. 2004). It should be noted that in the Metromix project sand would have been extracted from strips of seabed, the underlying sediments would have had a similar composition to those on the surface and a large proportion of the extraction area would have been relatively undisturbed. This would facilitate benthic recolonisation from EL A Draft, August
245 Extraction of Offshore Sand Reserves: Potential Environmental Impacts Prepared for adjacent areas, so the ecological effects would probably be less severe than those associated with the use of anchor dredgers. There is also a potential for impacts on marine organisms resulting from the sediment plumes generated by marine aggregate extraction operations. Extensive plumes may develop in areas where screening of aggregate occurs and the impacts of these plumes may be more significant in deeper water where benthic assemblages are less exposed to natural disturbances of their sedimentary regime (Hitchcock and Bell 2004). Trailer suction dredges are likely to cause a much reduced plume at the suction head, because the dredging action creates a slurry that entrains sand and fine materials. The physical impact of the material washed out through hopper overflow spillways and reject chutes on trailer suction dredgers depends on the amount and grade of deposit that is rejected by screening. The inorganic particulate load that is discharged generally settles a few hundred metres from the point of discharge. Outwash can lead to the generation of surface slicks which may extend several kilometres beyond the dredging site. There is evidence that these surface plumes may be associated with organic enrichment generated by fragments of marine benthos that are discharged in outwash water (Newell et al.1999). It has been hypothesized that such plumes may contribute to the enhanced benthic species diversity and population densities noted in deposits surrounding dredged areas (Newell et al. 2004). Recolonisation of dredged areas is generally relatively fast, occurring within a few months of the cessation of sand extraction, due to the rapid increase in opportunistic species (Sarda et al. 2000; van Dalfsen et al. 2000; Newell et al. 2004). Recovery of benthic assemblages to comparable pre-dredging conditions, however, takes much longer with sites in the North Sea showing recovery within 2-4 years and those in the Mediterranean expected to take even longer (Van Dalfsen et al. 2000; Sarda et al. 2000; Newell et al. 2004). In the North Sea, species diversity in the extraction area generally returned to within 70-80% of that in surrounding sediments within 100 days, but restoration of population density and biomass to similar levels took 175 days and more than 18 months, respectively (Newell et al. 2004). There is also evidence of recovery resulting in assemblages that are quite different in structure from that originally present, due to infilling of tracks with much finer sediment than was originally present (Van Dalfsen et al. 2000). The rate of recovery of infaunal assemblages depends on successful recruitment of larvae and immigration of mobile species, local hydrological conditions and the degree and duration of changes in sediment composition caused by sand extraction (Van Dalfsen et al. 2000). It has also been noted recovery is faster within narrow trailer-dredge tracks than in larger pits in the seabed caused by anchor-dredging (Newell et al. 2004). Newell et al. (1998) pointed out that benthic assemblages characterised by long-lived, slow-growing species with a slow rate of EL A Draft, August
246 Extraction of Offshore Sand Reserves: Potential Environmental Impacts Prepared for reproduction will probably take longer to recover species diversity and population density and for biomass to be restored by growth of individuals. Assemblages of this type are typical of stable deposits in low-energy environments and areas where deposits are coarse. In areas that are subject to frequent environmental disturbances, assemblages will be dominated by opportunistic species (Newell et al. 2004). Hydrodynamic conditions and sediment transport also influence the recovery of the physical environment of the seabed. In deeper water, where conditions for regular redistribution of sediment are scarce, there is evidence of physical changes in the substratum persisting for long periods and of recovery being dependent on irregularly-occurring severe storms (Van Dalfsen et al. 2000). 4 Acknowledgements This report was written by Dr Theresa Dye and reviewed by Dr Peggy O Donnell. 5 References Byrnes, M.R., Hammer, R.M., Thibaut, T.D. and Snyder, D.B. (2004a). Physical and biological effects of sand mining offshore Alabama, USA. Journal of Coastal Research 20, pp Byrnes, M.R., Hammer, R.M., Thibaut, T.D. and Snyder, D.B. (2004b). Effects of sand mining on physical processes and biological communities offshore New Jersey, USA. Journal of Coastal Research 20, pp Corkery, R.W. and Co. Pty Ltd (1993). Sydney Marine Aggregate Proposal Environmental Impact Statement. Report prepared for Metromix Pty Ltd. Desprez, M. (2000). Physical and biological impact of marine aggregate extraction along the French coast of the Eastern English Channel: short- and long-term post-dredging restoration. ICES Journal of Marine Science, 57, pp Diaz, R.J., Cutter, G.R. and Hobbs, C.H. (2004). Potential impacts of sand mining offshore of Maryland and Delaware: Part 2 - Biological considerations. Journal of Coastal Research 20, pp Geomarine, Lawson and Treloar (1993). Marine Aggregate Proposal Coastal Processes. Report prepared for Metromix Pty Ltd. Heggie, Richard and Associates (1993). Proposed Marine Aggregate Extraction and Terminal Operations Noise Impact Assessment. Report prepared for Metromix Pty Ltd. Hitchcock, D.R. and Bell, S., (2004). Physical impacts of marine aggregate dredging on seabed resources in coastal deposits. Journal of Coastal Research 20, pp Lawson and Treloar Pty Ltd (1993). Marine Aggregate Proposal: An Assessment of Sediment Plumes. Report prepared for Metromix Pty Ltd. Maa, J.P.-Y., Hobbs, C.H.; Kim, S.C. and Wei, E. (2004). Potential impacts of sand mining offshore of Maryland and Delaware: Part 1 impacts on physical oceanographic processes. Journal of Coastal Research, 20, pp EL A Draft, August
247 Extraction of Offshore Sand Reserves: Potential Environmental Impacts Prepared for Nairn, R., Johnson, J.A., Hardin, D. and Michel, J. (2004). A biological and physical monitoring program to evaluate long-term impacts from sand dredging operations in the United States Outer Continental Shelf. Journal of Coastal Research 20, pp Newell, R.C., Seiderer, L.J. and Hitchcock, D.R. (1998). The impact of dredging works in coastal waters: a review of the sensitivity to disturbance and subsequent recovery of biological resources in the sea bed. Oceanography and Marine Biology: Annual Review, 36, pp Newell, R.C., Hitchcock, D.R. and Seiderer, L.J. (1999). Organic enrichment associated with outwash from marine aggregates dredging: a probable explanation for surface sheens and enhanced benthic production in the vicinity of dredging operations. Marine Pollution Bulletin, 38, pp Newell, R.C., Seiderer, L.J., Simpson, N.M. and Robinson, J.E ( 2004). Impacts of marine aggregate dredging on benthic macrofauna off the south coast of the United Kingdom. Journal of Coastal Research 20, pp Nonnis, O., Nicoletti, L., La Valle, P., Magno, C.M. and Gabellini, M. (2002). Environmental Impact after Sand Extraction for Beach Nourishment in an Area off Latium Coast (Tyrrhenian Sea, Italy). Littoral 2002, The Changing Coast. EUROCOAST / EUCC, Porto Portugal. Pollution Research Pty Ltd (1993). Metromix Pty Ltd Marine Aggregate Proposal: Sea Water and Sediment Chemistry. Report prepared for Metromix Pty Ltd. Sarda, R., Pinedo, S., Gremare, A. and Taboada, S. (2000). Changes in the dynamics of shallow sandy-bottom assemblages due to sand extraction in the Catalan Western Mediterranean Sea. ICES Journal of Marine Science, 57, pp The Ecology Lab Pty Ltd (1993). Marine Aggregate Proposal: Marine Ecological Investigations Volume 1. Report prepared for Metromix Pty Ltd. 356 pp. Van Dalfsen, J.A., Essink, K., Toxvig Madsen, H., Birklund, J., Romero, J. and Manzanera, M. (2000). Differential response of macrozoobenthos to marine sand extraction in the North Sea and Western Mediterranean. ICES Journal of Marine Science, 57, pp EL A Draft, August
248
249 Appendix F Nourishment Ecological Impacts
250
251 Beach Sand Nourishment Scoping Study - Maintaining Sydney's Beach Amenity Against Climate Change Sea Level Rise Appendix F Nourishment - Ecological Impacts Australian Museum Business Services, Proposed Beach Nourishment in the Sydney Region Region of its Ecological Effects and Recommendations for Future Monitoring, February Revision C - 18 February 2010
252
 9320 6311, Fax (02) 9320 6428 australianmuseum.net.au/ambs ambs@austmus.")
253 Proposed Beach Nourishment in the Sydney Region Review of its Ecological Effects and Recommendations for Future Monitoring Prepared by Australian Museum Business Services for Final Report February 2010 AMBS Reference Australian Museum Business Services - 6 College Street, Sydney NSW 2010, Ph (02) , Fax (02) australianmuseum.net.au/ambs ambs@austmus.gov.au
254 Proposed Beach Nourishment in the Sydney Region Review of its Ecological Effects and Recommendations for Future Monitoring Document Information Citation: Versions: Recipient: Author: Jones, A Proposed Beach Nourishment in the Sydney Region Review of its Ecological Effects and Recommendations for Future Monitoring. Report prepared by Australian Museum Business Services for. Version 1: Draft Report issued November 2009 Version 2: Final Report issued 19 February 2010 James Walker, Alan Jones II
255 Proposed Beach Nourishment in the Sydney Region Review of its Ecological Effects and Recommendations for Future Monitoring Contents 1 Introduction Review of the ecological effects of beach nourishment Review of the ecological study component of sand nourishment General description of flora and fauna at the three case study sites of Collaroy/Narrabeen, Manly and Cronulla General description of the flora and fauna for all of Sydney s ocean beaches Macrofauna Other Biota General impacts and subsequent recovery associated with nourishment Intertidal Habitat Subtidal Nearshore Habitat Outline of recommended studies Baseline descriptive sampling of existing environment Pilot sampling project Effects and recovery sampling Best Practice Nourishment Discussion References Appendix1: Summary of general impacts and recovery associated with nourishment Appendix 2: Cost of recommended ecological monitoring III
256 Proposed Beach Nourishment in the Sydney Region Review of its Ecological Effects and Recommendations for Future Monitoring 1 Introduction The importance of coastal areas is illustrated by the fact that 85% of Australians live within 50 km of the coastline (ABS, 2003). Sandy beaches are particularly important since they comprise 60% of the coast (Short 1999), protect coastal assets, provide a prime recreational setting and are essential for coastal economies (Blackwell 2007). Less appreciated is the fact that sandy beaches also provide habitat for a surprisingly high diversity of plant and animal species (McLachlan and Brown 2006). Most are small, buried and inconspicuous but some can attain densities exceeding 10,000 per square metre (Jones et al. 1991). A few have commercial or conservation significance (e.g., donacid clams, onuphid beachworms, various birds, turtles). Consequently, beaches are far from the ecological deserts of popular belief and, in order to meet the stated goals of ecologically sustainable development (Council of Australian Governments, 1992) and subsequent State and Commonwealth Coastal Policies, they require credible management informed by sound scientific research. This has long been acknowledged (Coastal Management Manual, 1990) and some coastal protection legislation is now in place (e.g., SEPP 71, 2002). Unfortunately, ecological studies in Australia are few, being grossly underrepresented in our published work. (Fairweather, 1990, p.71). Such a knowledge deficit severely compromises our ability to manage beaches in the face of various threats. Moreover, the need for knowledge is growing since beaches are under increasing pressure (see Defeo et al. 2009, Brown and McLachlan 2002 for reviews). In particular, erosion is an issue with about 75% of the world s beaches erosding and less than 10% accreting (Bird 1985). Historically, much of this erosion has been caused by the damming of coastal rivers and the instream extraction of sand, processes that reduce the supply of sand to beaches (Sherman et al. 2002), and the use of traditional hard-engineering solutions such as seawalls, breakwaters and groynes. Now however, new factors associated with climate change are exacerbating the erosion pressures on beaches. These factors include sea-level rise and the increased intensity of storm surges and will cause geomorphic adjustments to coasts (Cowell and Thom 1994). Sand will be eroded from the upper beach and deposited on the near-shore bottom, causing the shoreline to recede horizontally at times the vertical sea-level rise (Bruun 1962). Note that this Bruun Rule has recently been criticised and may lack accuracy (Cooper and Pilkey 2004). This recession was forecast to be metres by 2100 (CSIRO 2002) but this may be an underestimate for some of Sydney s beaches (Anon 2005, Brahic 2008). Overall, this means that currently-retreating beaches will retreat further, stable beaches will begin to retreat, and the number of accreting beaches will decrease (Burkett et al. 2001). If we wish to retain the socio-economic and ecological values of beaches in developed, urban areas, protective engineering strategies will be required. Unfortunately, the hard-engineering option (e.g., seawalls) can cause the total loss of the intertidal beach (Pilkey and Wright 1989). Consequently, more environmentally-friendly, soft-engineering solutions such as beach nourishment (also called beach replenishment, restoration or renourishment) have become more popular both globally and in Australia. For example, between 1923 and 1999 there were >573 episodes at 154 locations on the U.S. east coast from New York to Florida (Valverde et al. 1999). Individual episodes vary greatly in scale from tens of millions of cubic metres of sand to less than 50,000 cubic metres (Finkl & Walker 2004). Assuming that sea level rise and increased storminess associated with global warming will exacerbate erosion, nourishment operations are likely to proliferate. This document considers the ecological consequences of nourishment operations and is organised into several sections as follows. 4
257 Proposed Beach Nourishment in the Sydney Region Review of its Ecological Effects and Recommendations for Future Monitoring 2 Review of the ecological effects of beach nourishment 2.1 Review of the ecological study component of sand nourishment At nourished intertidal sites, various components of the biota may be affected. These components were grouped into benthic micro-algae, vascular plants, terrestrial arthropods, marine zoobenthos and avifauna by Speybroeck et al. (2006). Since the current proposal involves the deposition of borrowed sand into the subtidal zone (depth of 8-15 metres), additional nearshore components will be affected. These include benthos and epibenthos/hyperbenthos, phytoplankton, zooplankton and fish assemblages. As well, it seems possible that some sand may move to rocky reefs with smothering effects on the fauna and flora including kelp beds. In Australia, the ecological consequences of intertidal nourishment are virtually unknown with published studies limited to (Jones et al. 2008). This study addressed impacts and recovery concerning the abundance of a single species of intertidal zoobenthos at Towra Point, Botany Bay. As there is a scarcity of studies in this field, relatively little is known about: Australia s sandy beach and shallow subtidal invertebrate and algal assemblages the effects of deposition on subtidal, nearshore biota (virtually no information) the effects of sand re-distributed from subtidal nearshore deposition on intertidal biota (no information) changes to beach morphology induced by nourishment and the consequences for the intertidal biota the ability of biota in borrow sediments to survive the sediment transfer process the effects of any translocated biota on existing biota long-term ecological recovery the cumulative effects of repeated nourishment indirect trophic effects on birds and fish changes to biologically-mediated sediment erodability best-practice protocols (some suggestions are available, see below) 2.2 General description of flora and fauna at the three case study sites of Collaroy/Narrabeen, Manly and Cronulla. There are no published studies of the intertidal and subtidal biotic assemblages at these beaches other than Paxton (1979). She sampled species of onuphid beachworm including Australonuphis parateres (found from half tide to low tide) and A. teres which displays size zonation (largest at lowest tide, youngest highest on the beach). Whether these three beaches are representative of all of Sydney s beaches is unknown although it is a reasonable assumption if morphology and grain size characteristics differ little among all the beaches. A general description of Sydney s ocean beaches follows. 2.3 General description of the flora and fauna for all of Sydney s ocean beaches The biota of Sydney s ocean beaches comprises the following components: vascular plants (and associated invertebrates) occupying dunes above high water; air-breathing species on the upper beach including crustacean and insect assemblages inhabiting seaweed wrack and ghost crabs; 5
258 Proposed Beach Nourishment in the Sydney Region Review of its Ecological Effects and Recommendations for Future Monitoring shore birds; and the assemblages living under the intertidal sand. Biota inhabiting the nearshore, subtidal habitat include benthic infauna, epi/hyperbenthic fauna, nekton (fish and cepalopods) and plankton. The plankton includes dispersive larvae of benthic species and phytoplankton that are food for intertidal filter-feeders. As well, this habitat provides a nursery function for the larvae of fish (Lasiak 1981). In the intertidal habitat, some non-resident animals become stranded e.g., bluebottles, sea-slugs, goose barnacles. Although they (and wrack) contribute to the ecological economy of the beach, they will not be considered further. The biota of the intertidal sand comprise the tiny meiobiota (that occupy the interstitial species between sand grains) and the larger macrofauna (invertebrates larger than 0.5mm long). Although these species are usually buried and inconspicuous, they constitute the great majority of sandy beach biodiversity. Moreover, they are the biotic component that is most at risk from nourishment. The interstitial biota comprise hundreds of species of microalgae such as diatoms and meiofauna such as nematodes and copepods (Brown 2001). Unfortunately, virtually nothing is known about the interstitial biota of Sydney s beaches although some ecological work on the nematodes of beaches at Moruya, NSW exits (Nicholas and Hodda 1999, Nicholas 2001). The macrofaunal component comprises tens of species (mostly crustaceans, polychaetes and molluscs). A few Sydney studies concerning macrofaunal assemblages and populations exist Macrofauna Prior to 1980, there were no published accounts of sandy-beach macrofaunal ecology in the Sydney region (or in Australia). Subsequently, 84 NSW beaches were studied by a visiting American (Dexter 1983). These included 27 beaches in the Sydney region from Broken Bay to Port Hacking although few were open ocean beaches (i.e., Palm, Narrabeen, Coogee, Maroubra, Garie). At least 78 species and 16,778 individuals were found, most species being crustaceans (55%) and polychaetes (25%). In general, species richness, total abundance and the proportion of polychaetes were greater on beaches with relatively low action. Amphipods were abundant in all habitats. The species characteristic of, or limited to, different kinds of beaches (e.g., reflective, semi-exposed, protected etc) were identified. Marked across-beach zonation patterns occurred in which the upper beach (dominated by crustaceans) differed from the lower beach (crustaceans and polychaetes). Greater species richness and abundance usually occurred at lower levels. In subsequent publications, Dexter addressed temporal and spatial variability in assemblage structure at four beaches i.e., La Perouse, Ocean, Doll s Point and Towra (Dexter 1984) and the life history of abundant crustaceans (Dexter 1985). In addition to spatial changes noted above, densities changed during the year (related to reproductive activity) but no seasonal changes in across-beach zonation patterns were found. Other sandy-beach biological research in Sydney includes Jones et al. 1991) and Barros (2001). The former studied the patterns of abundance and life histories of two dominant exoedicerotid amphipods in Botany Bay, Middle Harbour, Dee Why Lagoon and Curl Curl Lagoon. In general, abundance patterns varied among sites and reproduction was continuous but with peaks. As well, the responses of the amphipod crustacean Exoediceros fossor to oil pollution in Port Jackson (Jones et al. 2003) and beach nourishment at Towra Point (Jones et al. 2006) were addressed. Oil pollution appeared to have 6
259 Proposed Beach Nourishment in the Sydney Region Review of its Ecological Effects and Recommendations for Future Monitoring a large affect on abundance and recovery varied among sites. At Towra Point, the immediate impacts of nourisment were very large but recovery started within a few weeks and may have been complete in a year. Ghost crabs were used as a tool for assessing human impacts on exposed sandy beaches by Barros (2001). He found fewer crab burrows on urban (Bondi, Bronte and Coogee) than non-urban beaches (Port Stephens and Jervis Bay). Outside of Sydney, relevant work in NSW includes James and Fairweather (1996) who described spatial variation in intertidal invertebrate assemblages at Catherine Hill Bay, and Hacking (1996, 1998) who studied assemblage structure and zonation in northern NSW beaches. Although most macrofaunal species are unfamiliar to the public, others are better known. These include the commercial pipi/surf clam (Donax deltoides), the sand crab (Ovalipes australiensis), soldier crabs (Mictyris spp.) and giant onuphid beachworms (Australonuphis spp.) which occur from intertidal to shelf depths. Some distributional and life-history information on beachworms is available from Narrabeen Beach, Sydney (Paxton 1979) while pipis have been studied elsewhere in NSW (James and Fairweather 1995, Murray-Jones, unpubl. PhD thesis). Other species inhabit the upper beach. These include the ghost crabs Ocypode cordimana and O. ceratopthalma whose burrows occur above high water, sand hoppers (Allorchestes spp., Talorchestia spp.), amphipods that can be very abundant in seaweed wrack, and some insect species. The effects of urbanisation (especially seawalls) on ghost crabs were examined by Barros (2001) and their utility as an indicator of human disturbance was assessed by Schlacher et al. (2007) in south east Queensland Other Biota Other biota include shore birds and dune vegetation (Underwood and Chapman 1993). About 86 plant species occur with about 20% being introduced. The most common types in Sydney are the hairy spinifex (Spinifex sericeus) and the sea rocket (Cakile maritima). Since a) dunes are non-existent or poorly-developed at most of Sydney s ocean beaches and b) existing dunes and their vegetation are unlikely to be affected by the proposed nourishment (since they primary effects will occur initially nearshore and subsequently intertidally), they are not further considered. Shore birds include the silver gull (Larus novaehollandiae), crested tern (Sterna hirundo), oystercatcher (Haematopus longirostris), red-capped dotterel (Charadrius ruficapillus) and the sharp-tailed sandpiper (Calidris acuminate). The last three are waders that prefer more sheltered sandflats to ocean beaches. It is possible that nourishment may affect shore birds indirectly by reducing the abundance of their prey (Peterson et al. 2006). As well, penguins that feed at sea but nest in the dunes at Manly may be affected by nourishment disturbance to nearshore waters and the beachface. 2.4 General impacts and subsequent recovery associated with nourishment It is likely that the largest ecological effects of nourishment will occur in the nearshore environment where the spoil will be deposited. Given that intertidal species a) live within the sand, b) can probably survive some degree of burial (Maurer et al. 1986) and c) are adapted to sediment disturbance by waves, any nourishment effects on the intertidal biota are likely to be small if sand gradually accretes to the beachface via hydrological action. However, if sediments move rapidly and is contoured by bulldozing, effects may be substantial (Peterson et al. 2000). Past findings concerning the impacts of nourishment on intertidal biota and subsequent recovery are summarised below. These impacts arise from direct deposition onto the intertidal zone and would be 7
260 Proposed Beach Nourishment in the Sydney Region Review of its Ecological Effects and Recommendations for Future Monitoring much greater than impacts resulting from deposition into the shallow nearshore zone as proposed. General impacts are summarised in Appendix Intertidal Habitat Impacts Although nourishment is considered more eco-friendly than hard-engineering alternatives (Speybroeck et al. 2006), it nonetheless imposes substantial impacts on both the physico-chemical, sandy-beach habitat (Blott and Pye 2004) and its biota (see Goldberg 1988, Nelson 1988, and Speybroeck et al for reviews. Published Australian studies appear to be limited to Jones et al. (2007) although there is information concerning the effects of nourishment on seagrass beds at Towra Point (Cardno EcologyLab) and the intertidal macrobenthos on the Gold Coast (Rocio unpublished MS). Various components of the biota at or near nourished sites may be affected, these being listed under Section 2.1 and in Appendix 1. In general, nourishment affects both functional (e.g., trophic cascades) and structural (e.g., changes to population abundances and species richness) aspects of the shore ecosystem. Effects may be direct (e.g., benthos killed by burial) or indirect (e.g., shorebirds or fish affected by the shortage of benthic prey or loss of nursery or nesting areas) (Nelson 1993a, Peterson et al. 2006). Most international nourishment research has targeted the effects of the deposition of sediments on intertidal macrofaunal assemblages (e.g., Rakocinski et al. 1996, Menn et al. 2003) or populations (e.g. Hayden and Dolan 1974, Peterson et al. 2000, Bilodeau and Bourgeois 2004, Jones et al. 2007). The immediate impacts are usually very large, either by assumed burial (Menn et al. 2003, Peterson et al. 2006, Jones et al. 2007), by emigration (Hayden and Dolan 1974) or mis-matched sediment (Peterson et al. 2000, 2006). These effects may be compounded by changes to the beach morphology. For example, steepening of the foreshore creates a more reflective beach and such beaches are usually poorer in species richness and abundance than dissipative or intermediate beaches (McLachlan and Brown 2006). Several factors probably contribute to such impoverishment (Defeo and McLachlan 2005) including the reduction of the habitat area for some species (Peterson et al. 2006). As well, the engineering process itself can have ecological effects (summarised by Speybroeck et al. 2006). For example, visual and noise disturbance can affect the nesting and foraging of birds. Bulldozing to contour beaches may destroy dune vegetation, cause compaction of sediments and reduce populations of ghost crabs (Peterson et al. 2000). Compaction affects the interstitial spaces, capillarity, water retention, permeability and the exchange of gases and nutrients. The burrowing of turtles and infauna, and the bill penetration of wading birds may be affected although turtles are not an issue in Sydney. Recovery Since beach nourishment constitutes a pulse disturbance (Bender et al. 1984), recovery is highly likely unless the habitat is greatly changed or the process is repeated at short intervals. Unfortunately, recovery is less well studied than immediate impact but available information suggests that it can occur in weeks or months rather than years (Speybroeck et al. 2006). A major factor affecting the speed of recovery is the matching of sediments i.e., whether the nourishment sand is similar to the original beach sand (Nelson 1988, 1993a, Peterson et al. 2000, 2006, Speybroeck et al. 2006). Imported sediments that differ in having more shell hash or fines may cause long-term impacts. Other factors influencing recovery rates include the depth of deposited sediment, the availability of interspersed refuges and seasonal timing. For example, some sedimentary invertebrates can survive some degree of burial by burrowing upwards (Maurer et al. 1986). Further, if nourishment activities cease just before the breeding season, available recruits would effect a faster recovery than at other times. This factor may be less important for Sydney since the available life-history information of local species (Paxton 8
261 Proposed Beach Nourishment in the Sydney Region Review of its Ecological Effects and Recommendations for Future Monitoring 1979, Dexter 1985, Murray-Jones unpubl. PhD thesis, Murray in prep.) suggests that many species have continuous reproduction. The mechanism of recovery involves the settlement of larvae out of the plankton or the movements of adults or juveniles. Many marine invertebrates have planktonic dispersing larvae but the peracarid crustaceans (including amphipods, isopods and mysids which are often important taxa in beaches and the surf zone) have no larvae. Instead they brood eggs which hatch as juveniles. Consequently, recovery rates would depend on the size of the nourishment operation and would be accelerated by leaving patches of undisturbed beach from which adults or juveniles could move into new sediment. Such movements may be facilitated by alongshore sediment drift as suggested by Jones et al. (2007) for amphipods at Towra Point. Since beach sediments drift from south to north in Sydney, leaving undisturbed areas of beach to the south of engineering operations may be useful in accelerating recovery. It is also reasonable to suppose that sandy beach species are adapted to recovering from severe physical disturbances because storm events have been a frequent feature of their evolutionary history (Hall 1994) and rapid post-storm recovery has been observed (Saloman & Naughton 1977, Ansell 1983). However, since climate change is also causing seawater to become more acidic, and this will affect the calcium metabolism of many species, their ability to withstand physical disturbances may become reduced Subtidal Nearshore Habitat Impacts Virtually all the above published studies relate to deposition of sand directly onto the intertidal beach whereas the current project proposes to deposit sand in the subtidal, nearshore zone (8-15 metres depth). Consequently, results from the above published literature do not relate directly to the current project but nonetheless provide useful guidance. Although this nearshore habitat is virtually unknown locally, other work (Clark 1997, Smith and Rule 2001, Beyst et al. 2001) suggests that several ecosystem components would probably be affected by the current nourishment proposals. These components include assembages of a) benthic infauna, b) epibenthic /hyperbenthic invertebrates e.g., shrimps, crabs and squid). c) fish and d) plankton. As well, this environment serves as a nursery for larval fish (Lasiak 1981). Of all these nearshore components, it is probable that the infauna would be most affected since they are relatively immobile and would suffer burial, the factor that appears to most affect the intertidal biota. Other components (fish, hyperbenthos) have greater ability to evade burial by swimming away or else their position in the water column (plankton) means that they may only be affected by the raised turbidity likely to occur (Newell et al. 1998). This factor would be of short duration and could be minimised by best practice techniques. Nevertheless, turbidity would affect light penetration and planktonic photosynthesis. Not only would this affect the plankton, it may affect the intertidal filterfeeding invertebrates that feed on plankton. Concerning infauna, McLachlan and Brown (2006), proposed a model in which species richness of macrofauna falls from lower intertidal lavels to a minimum at the break point of waves (where disturbance is greatest) and then rises as depth increases. Consequently, effects would be least if deposition occurred at the break point of waves. Although there is substantial information on the effects of dredging operations on benthic biota (see Newell et al for a review), little information concerning sediment deposition on nearshore infauna exists. However, the work of Smith and Rule (2001) is relevant since they examined the effects 9
262 Proposed Beach Nourishment in the Sydney Region Review of its Ecological Effects and Recommendations for Future Monitoring of dumping sediment spoil at a six-metre-deep site at Park Beach near Coffs Harbour NSW. They were unable to detect any effects on the benthos and attributed this to several factors: the sediments were well matched and contaminant free, spoil was laid down in shallow layers (allowing fauna to survive by migrating upwards), and the high energy environment at the disposal site meant that the resident biota could cope with dynamic sedimentary conditions. Recovery Recovery of the subtidal benthos may not be an issue if sediments can be laid down in shallow layers that permit survival of the resident biota as suggested by Smith and Rule (2001) i.e., impacts are nonexistent or minimal. Alternatively, if burial is sufficiently deep, the resident biota would be eliminated. Subsequent recovery would proceed as for the intertidal habitat with colonisation of the new sediments occurring via adult/juvenile migration and settlement of larvae from the plankton. However, since the new sediments will move upshore there may be insufficient time for recovery and the question then applies to the original underlying subtidal sediments. In any case, it seems certain that recovery will occur (Newell et al. 1998). A final point concerns the possibility of biota surviving the transfer from deep borrow sites to the nearshore dump sites. There is evidence that this has occurred elsewhere (Jones 1986). The consequences of introducing deep-water species into shallow areas are unknown. Effects on the water column will occur if turbidity becomes elevated. This may affect the gills of fish and the photosynthesis of phytoplankton. However, it seems likely that mobile species such as fish would evade the turbid area and return subsequently. Phytoplankton would either suffer temporarily depressed photosynthesis, or if killed, would easily recover from nearby areas since the mixing is strong in this hydrologically-dynamic environment. Impacts associated with do nothing At beaches with seawalls (South Cronulla, Manly), sea-level rise and erosion will reduce the width of the beach until no intertidal beach remains i.e., the total loss of the beach ecosystem. At beaches without seawalls (Collaroy/Narrabeen, North Cronulla) sea-level rise will cause the beach to migrate landwards. Beach ecosystems would probably remain intact with urban infrastructure being progressively buried. Impacts associated with nourishment Refer to Section 4. Identify potential show stoppers None are obvious since the proposed operations constitute pulse disturbances from which recovery should occur. It is possible that kelp beds could be destroyed but operations can be managed to minimise the risk. 3 Outline of recommended studies Research for an EIS concerning the proposed operations should include descriptive sampling, a pilot sampling project and a program of sampling to determine the impact of nourishment. Each stage is detailed below. See Appendix 2 for costings. 3.1 Baseline descriptive sampling of existing environment describe the taxonomic composition of assemblages in both the subtidal and intertidal areas to be affected and 10
263 Proposed Beach Nourishment in the Sydney Region Review of its Ecological Effects and Recommendations for Future Monitoring locate potentially vulnerable biota outside the immediate impact area e.g., kelp beds. All beaches should be examined. 3.2 Pilot sampling project estimate structural features of the macrobenthic assemblage (e.g., taxonomic richness, abundance); and estimate error variation in order to inform the design of sampling that would address effects of deposition and recovery. The descriptive sampling and pilot sampling could be combined. Pilot studies could be limited to one beach and results assumed to be an adequate guide to other beaches. 3.3 Effects and recovery sampling estimate the magnitude of the effects deposition on assemblages (especially macrobenthos) and their rate of recovery. estimate the magnitude of any changes to the physical environment, especially sedimentary variable. A before, after/control, impact (BACI) design would be appropriate. This would require knowledge of the impact locations and the designation of multiple control sites. Details of replication would be guided by the pilot project. Questions of sieve mesh size and taxonomic resolution will depend on resources available (both financial and human skills) although there is information available to guide the choice. It would be preferable to include all impact beaches. Not all the 33 beaches need to studied for impact and recovery. However, each combination of beach type and disturbance type be addressed with replicate beaches. A total of 12 impacted beaches may be sufficient, depending on the range of engineering processes (= disturbance type) envisaged. Six control beaches are also necessary. 4 Best Practice Nourishment Potential Issue Sediment grade Best Practice Recommendation Use sediments that match the original beach sediments in terms of grain size and shell content. This is complicated by the fact that sediments may differ between the beach and nearshore environments. Since the ultimate destination of the borrow sediments is the intertidal beach, these sediments should be similar to the beach sediments. Engineering techniques Depth of deposition Recovery islands Timing Dredging near sensitive areas Altered Beach profile Active adaptive management Piping sediments from the borrow sites to the deposition sites as a slurry may enable some biota to survive. Deposit the borrow sediments in shallow layers, thus enhancing the chances of survival by upwards burrowing. Intersperse some untouched areas among deposition areas to accelerate recovery. In particular, leave the southern part of the beach untouched to enhance recovery by longshore drift. Time operations such that they conclude just before breeding seasons. Leave buffer zones around rocky reefs to minimise the effects on non-sedimentary biota e.g., reef/shore invertebrates, kelp beds. Retain original beach profile and morphology since beach biota are sensitive to beach morphodynamic state. Institute monitoring programmes to test explicit hypotheses concerning the effects of nourishment. Since nourishment is likely to be a repeated process, lessons learned early will be help to optimise the process and minimise ecological effects and accelerate recovery. These effects will depend on the engineering process and the quality and quantity of the new sediment (Speybroeck et al. 2006). It appears that post-nourishment recovery is fast provided that the new sediments matched the original (Nelson 1988, 1993a). Where new sediments were different with increased silt-clay or shell hash, recovery rates were much slower (Goldberg 1988, Peterson et al. 2000, 2006, Speybroeck et al. 2006). 11
264 Proposed Beach Nourishment in the Sydney Region Review of its Ecological Effects and Recommendations for Future Monitoring 5 Discussion The spatial placement of sediment and its timing are also likely to be important. For example, profile nourishment distributes sediment across the entire intertidal zone and may affect all species whereas foreshore and backshore nourishment has its greatest effects on the lower and upper beach, respectively. The timing of the engineering is relevant since feeding and reproductive activities are often seasonal. Consequently, both the magnitude and duration of impact are affected by timing. It appears that the nourishment of sandy beaches usually acts as a short-term, pulse disturbance (Bender et al. 1984) that elicits a pulse ecological response (i.e. recovery occurs). In general, the immediate effects of both dredging and nourishment are large but recovery occurs in weeks or months rather than years (Newell et al. 1998, Speybroeck et al. 2006). This is expected since sandy-beach species are adapted to severe physical disturbances, storm events having been a frequent feature of their evolutionary history (Hall 1994). However, recovery probably depends on the scale and design of the engineering operation and on the biology of the species (e.g., their life-history and motility). As well, it is important that the nourished beach profile and new sediments match the original condition. Where these differ from the original (especially via increased amounts of shell hash or fines), full zoobenthic recovery to natural, pre-existing assemblages may not occur (Goldberg 1988, Peterson et al. 2000, 2006). In such cases, especially where unnaturally coarse sediments persist, nourishment operations can be considered press disturbances (Peterson et al. 2006). As such, they are of greater concern than pulse events with fast recovery. Best practice therefore demands similar profiles and sediments if recovery to natural assemblages is desired. Other management recommendations include the avoidance (by ploughing) of sediment compaction, the timing of operations to minimise biotic impacts and enhance recovery, the selection of locallyappropriate engineering techniques, and the implementation of several small projects rather than a single large project Speybroeck et al. (2006). The last would accelerate recovery if untouched areas of beach were interspersed with nourished areas. In particular, interspersion would assist recovery in species such as peracarid crustaceans since these that lack planktonic larval stages. Instead, they depend on adult motility or passive alongshore drift to colonise nourished areas. Other beneficial operational techniques include the deposition of new sediment in repeated, thin layers (Smith and Rule 2001). This would probably allow many benthic species to evade mortality since some macrofaunal species can survive burial (series of papers synthesized in Maurer et al. 1986). In practice, nourishment depths often exceed one metre and thus burial is likely to be the major source of mortality associated with nourishment operations. Management is hindered by a shortage of research on the life history of the dominant species, the long-term rates of recovery and the cumulative effects of repeated nourishment (Speybroeck et al. 2006). This issue is exacerbated by the fact that little nourishment research is published in the peerreviewed primary literature and much of it is poorly designed (Peterson and Bishop 2005). In particular, few studies have employed the before-after, control-impact (BACI) designs needed to isolate the effects of nourishment from natural factors. Since nourishment is highly likely to flourish as a beach management technique, the need for further, well-designed studies is clear. 12
265 Proposed Beach Nourishment in the Sydney Region Review of its Ecological Effects and Recommendations for Future Monitoring 6 References Anon Deadline set on climate disaster. The Australian, 01/02/06. Ansell, A.D The biology of the genus Donax. In Sandy Beaches as Ecosystems. Ed. A. McLachlan and T. Erasmus, The Hague: Junk. Australia s Oceans Policy Integrated and Ecosystem-Based Oceans Planning and Management. Barros, F Ghost crabs as a tool for rapid assessment of human impacts on exposed sandy beaches. Biological Conservation 97: Bender, E.A., T.J. Case, and M.E. Gilpin Perturbation experiments in community ecology: theory and practice. Ecology 65: Bertasi, F., M.A. Colangelo, M. Abbiati, and V.U. Ceccherelli Effects of an artificial protection structure on the sandy shore macrofaunal community: the special case of Lido di Dante (Northern Adriatic Sea). Hydrobiologia 586: Beyst, B., D. Buysse, A. Dewicke and J. Mees Surf zone hyperbenthos of Belgian sandy beaches: seasonal patterns. Estuarine, Coastal and Shelf Science 53: Bilodeau, A.L., and R.P. Bourgeois Impact of beach restoration on the deep-burrowing Ghost Shrimp, Callichirus islagrande. Journal of Coastal Research 20: Bird, E.C.F Beach Management. Chichester, UK: Wiley. Bishop M.J., C.H. Peterson, H.C. Summerson, H.S. Lenihan, and J.H. Grabowski Deposition and long-shore transport of dredge spoils to nourish beaches: impacts on benthic infauna of an Ebb- Tidal Delta. Journal of Coastal Research 22: Blackwell, B The value of a recreational beach visit: An application to Mooloolaba beach and comparisons with other outdoor recreation sites. Economic Analysis and Policy 37: Bouchard, S.S., and K.A. Bjorndal Sea turtles as biological transporters of nutrients and energy from marine to terrestrial ecosystems. Ecology 81: Brahic, C Sea level rises could far exceed IPCC estimates. New Scientist 1 st September. Brazeiro, A Relationship between species richness and morphodynamics in sandy beaches: what are the underlying factors? Marine Ecology Progress Series 224: Brazeiro, A., and O. Defeo Effects of harvesting and density-dependence on the demography of sandy beach populations: the yellow clam Mesodesma mactroides of Uruguay. Marine Ecology Progress Series 182: Brown, A The ecophysiology of sandy beach animals - a partial review. In Sandy Beaches as Ecosystems, ed. A. McLachlan and T. Erasmus, The Hague, Junk. 13
266 Proposed Beach Nourishment in the Sydney Region Review of its Ecological Effects and Recommendations for Future Monitoring Brown, A.C Biology of Sandy Beaches. In Encyclopedia of Ocean Sciences, ed. J.H. Steele, S.A. Thorpe & K.K.Turekian. Volume 5, London, Academic Press. Brown, A.C., A. McLachlan, G.I.H. Kerley, and R.A. Lubke Functional Ecosystems: Sandy Beaches and Dunes. In: Marine Biodiversity Status Report, ed. B.D. Durham & J.C. Pauw. Brown, A.C., and A. McLachlan Sandy shore ecosystems and the threats facing them: some predictions for the year Environmental Conservation 29: Bruun, P The Bruun Rule of erosion by sea level rise: a discussion of large-scale two- and threedimensional usages. Journal of Coastal Research 4: Burkett, V., J.O. Codignotto, D.L. Forbes, N. Mimura, R.J. Beamish, and V. Ittekkot Coastal zones and marine ecosystems pp in McCarthy, J.J., Canziani, O.F., Leary, N.A., Dokken, D.J., and White, K.S. (eds) Climate Change 2001: Impacts, Adaptation, and Vulnerability. Contribution of Working Group II to the Third Assessment report of the Intergovernmental Panel on Climate Change (Cambridge, Cambridge University Press,). Clark, B.M Variation in surf-zone fish community structure across a wave-exposure gradient. Estuarine Coastal and Shelf Science 44: Cooper, J.A.G., and O.H.Pilkey Sea-level rise and shore-line retreat: time to abandon the Bruun Rule. Global and Planetary Change 43: Cowell, P.J., and B.G. Thom Coastal impacts of climate change modelling procedures for use in local government. Proc. 1st National Coastal Management Conference, Coast to Coast 94. Hobart, Cowell, P.J., B.J. Thom, R.A. Jones, C.H. Everts and D. Simanovic Management of uncertainty in predicting climate-change impacts on beaches. Journal of Coastal Research 22: CSIRO Climate Change and Australia s Coastal Communities. Defeo, O., 1996a Experimental management of an exploited sandy beach bivalve population. Revista Chilena de Historia Natural 69, Defeo, O., 1996b Recruitment variability in sandy beach macroinfauna: much to learn yet. Revista Chilena de Historia Natural 69, Defeo, O., 1998 Testing hypotheses on recruitment, growth and mortality in exploited bivalves: an experimental perspective. Canadian Special Publication Fisheries Aquatic Sciences 125, Defeo, O., Marine invertebrate fisheries in sandy beaches: an overview. Journal of Coastal Research SI 35, Defeo, O., McLachlan, A., Patterns, processes and regulatory mechanisms in sandy beach macrofauna: a multi-scale analysis. Marine Ecology Progress Series 295,
267 Proposed Beach Nourishment in the Sydney Region Review of its Ecological Effects and Recommendations for Future Monitoring Defeo, O., Lercari, D. and Gomez, J The role of morphodynamics in structuring sandy beach populations and communities: What should be expected? Journal of Coastal Research 35: Defeo, O, A. McLachlan, D.Schoeman, T.Schlacher, J.Dugan, A.Jones, M. Lastra and F. Scapini Threats to sandy beach ecosystems: a review. Estuarine, Coast and Shelf Science. 81:1-12. Dexter D.M. 1983a Community structure of intertidal sandy beaches in New South Wales, Australia. In: A. McLachlan & T. Erasmus (Eds) Sandy Beaches as Ecosystems. Junk, The Hague: Dexter D.M. 1983b A guide to the sandy beach fauna of New South Wales. Wetlands, 3, Dexter D.M Temporal and spatial variability in the community structure of the fauna of four sandy beaches of south-eastern New South Wales. Australian Journal of Marine and Freshwater Research, 35, Dexter D.M Distribution and life histories of abundant crustaceans of four sandy beaches on south-eastern New South Wales. Australian Journal of Marine and Freshwater Research, 36, DLWC Coastal Dune Management: A Manual of Coastal Dune Management and Rehabilitation Techniques. NSW Department of Land and Water Conservation, Coastal Unit, Newcastle, Australia. Dugan, J.E., and D.M. Hubbard Ecological responses to coastal armouring on exposed sandy beaches. Shore and Beach 74: Dugan, J.E., D.M. Hubbard, M.D. McCrary, and M.O. Pierson The response of macrofauna communities and shorebirds to macrophyte wrack subsidies on exposed sandy beaches of southern California. Estuarine, Coastal and Shelf Science 58S: Dugan, J.E., D.M. Hubbard, I. Rodil, D.L. Revell, and S. Schroeter Ecological effects of coastal armoring on sandy beaches. Marine Ecology 29: Du Preez, H.H., A. McLachlan, J.F.K. Marais, and A.C. Cockroft Bioenergetics of fishes in a high-energy surf-zone. Marine Biology 106: Fairweather, P.G Ecological changes due to our use of the coast: research needs versus effort. Proc. Ecological Society Australia 16: Finkl, C.W., and H.J. Walker Beach nourishment. In: The Encyclopedia of Coastal Science, ed. M. Schwartz, 37-54, Dordrecht, The Netherlands, Kluwer Academic Press. Galbraith, H., R. Jones, R. Park, S. Herrod-Julius, B. Harrington, and G. Page Global climate change and sea level rise: potential losses of intertidal habitat for shorebirds. Waterbirds 25: Gladstone W., N. Hacking, and V. Owen Effects of artificial openings of intermittently opening estuaries on assemblages of macroinvertebrates in the entrance barrier. Estuarine Coastal and Shelf Science 67: Godfrey, P.J., and M. Godfrey Ecological effects of off-road vehicles on Cape Cod. Oceanus 23:
268 Proposed Beach Nourishment in the Sydney Region Review of its Ecological Effects and Recommendations for Future Monitoring Griffiths, C.L. and J. Stenton-Dozey The fauna and rate of degradation of stranded kelp. Estuarine Coastal and Shelf Science 12: Hacking, N Tidal movement of sandy beach macrofauna. Wetlands (Australia) 15: Hacking, N Macrofaunal community structure of beaches in northern New South Wales, Australia. Marine and Freshwater Research 49: Hall, S.J., Physical disturbance and marine benthic communities: life in unconsolidated sediments. Oceanography and Marine Biology Annual Review 32: Harley, C.D.G., A.R. Hughes, K.M. Hultgren, B.G. Miner, C.J.B. Sorte, C.S. Thornber, L.F. Rodriguez, L. Tomanek, and S. L. Williams The impacts of climate change in global marine systems. Ecology Letters 9: Hubbard, D.M., and J.E. Dugan Shorebird use of an exposed sandy beach in southern California. Estuarine Coastal and Shelf Science 58, Hughes, L Climate change and Australia: trends, projections and impacts. Austral Ecology 28: International Scientific Steering Committee Avoiding Dangerous Climate Change. Report presented at: International Symposium on the Stabilisation of Greenhouse Gas Concentrations. Exeter, UK. 1-3 February IPCC A common methodology for assessing vulnerability to sea level rise, 2 nd revision. In: Global Climate Change and the Rising Challenge of the Sea. Report of the Coastal Zone Management Subgroup. IPCC, The Hague IPCC Intergovernmental Panel on Climate Change web site. (accessed March 2004) IPCC Intergovernmental Panel on Climate Change web site. (accessed December 2007). James, R.J. 2000a. From beaches to beach environments: linking the ecology, human-use and management of beaches in Australia. Ocean & Coastal Management 43: James, R.J. 2000b. The first step for the environmental management of Australian beaches: establishing an effective policy framework. Coastal Management 28: James, R.J., and P.G. Fairweather Spatial variation of intertidal macrofauna on a sandy ocean beach in Australia. Estuarine Coastal and Shelf Science 43: Jaramillo, E., and A. McLachlan Community and population responses of the macroinfauna to physical factors over a range of exposed sandy beaches in South-central Chile. Estuarine Coastal and Shelf Science 37: Jaramillo, E., H. Contreras, and A. Bollinger Beach and faunal response to the construction of a seawall in a sandy beach of south central Chile. Journal of Coastal Research 18:
269 Proposed Beach Nourishment in the Sydney Region Review of its Ecological Effects and Recommendations for Future Monitoring Jones, A.R The effects of dredging and spoil disposal on macrobenthos, Hawkesbury Estuary, NSW. Marine Pollution Bulletin 17: Jones, A.R., A. Murray and R.E. Marsh Patterns of abundance of Exoedicerotid amphipods on sandy beaches near Sydney, Australia. Hydrobiologia 223: Jones, A.R. 2003b. Assessing ecological recovery of amphipods on sandy beaches following oil pollution. Journal of Coastal Research 35: Jones, A.R., A. Murray, and R.E. Marsh A method for sampling sandy beach amphipods that tidally migrate. Marine and Freshwater Research 49: Jones, A.R., W. Gladstone, and N.J. Hacking Australian sandy-beach ecosystems and climate change: ecology and management. Australian Zoologist 34: Jones, A.R., A. Murray, T. Lasiak, and R.E. Marsh The effects of beach nourishment on the sandy-beach amphipod Exoediceros fossor in Botany Bay, New South Wales, Australia. Marine Ecology 28: 1 9. Kennedy, V.S., R.R. Twilley, J.A. Kleypas, J.H. Cowan, Jr., and S.R. Hare Coastal and Marine Ecosystems & Global Climate Change: Potential Effects on U.S. Resources. Prepared for the Pew Center on Global Climate Change, Arlington, VA. Lasiak, T.A Nursery grounds of juvenile teleosts: Evidence from the surf zone of Kings Beach, Port Elizabeth. South African Journal of Zoology 77: Lastra, M., Page, H.M., Dugan, J.E., Hubbard, D.M., and I.F. Rodil Processing of allochthonous macrophyte subsidies by sandy beach consumers: estimates of feeding rates and impacts on food resources. Marine Biology. Online first, DOI /s Llewellyn, P. J., and S.E. Shackley The effects of mechanical beach-cleaning on invertebrate populations. British Wildlife 7: Luckenbach, R.A., and B.R. Bury Effects of off-road vehicles on the biota of the Algodones Dunes, Imperial County, California. Journal of Applied Ecology 20: Martin, D., Bertasi, F., Colangelo, M.A., de Vries, M., Frost, M., Hawkins, S.J., MacPherson, E., Moschella, P.S., Satta, M.P., Thompson, R.C., Ceccherelli, V.U., Ecological impact of coastal defense structures on sediment and mobile fauna: evaluating and forecasting consequences of unavoidable modifications of native habitats. Coastal Engineering 52, Maurer, D., Keck, R.T., Tinsman, J.C., Leathem, W.A., Wethe, C., Lord, C. and Church, T.M Vertical migration and mortality of benthos in dredged material: a synthesis. Internationale Review des gesamten Hydeobiologie 71: McGwynne, L.E., A. McLachlan, and J.P. Furstenburg Wrack break-down on sandy beaches. Its impact on interstitial meiofauna. Marine Environmental Research 25: McLachlan, A The biomass of macro- and interstitial fauna on clean and wrack-covered beaches in Western Australia. Estuarine Coastal and Shelf Science 21:
270 Proposed Beach Nourishment in the Sydney Region Review of its Ecological Effects and Recommendations for Future Monitoring McLachlan, A Dissipative beaches and macrofauna communities on exposed intertidal sands. Journal of Coastal Research 6: McLachlan, A Sandy beach ecosystems. In Ecology of Sandy Shores. Ed. A.C. Brown and A. McLachlan, New York: Elsevier Science. McLachlan, A., E. Jaramillo, T. E. Donn and F. Wessels Sandy beach macrofauna communities and their control by the physical environment: a geographical comparison. Journal of Coastal Research 15: McLachlan, A., and E. Jaramillo Zonation on Sandy Beaches. Oceanography and Marine Biology: an Annual Review 33: McLachlan, A., T.Wooldridge and A.H.Dye The ecology of sandy beaches in southern Africa. South African Journal of Zoology 16: McLachlan, A., and A. Dorvlo Global patterns in sandy beach macrofauna communities. Journal of Coastal Research 21: McLachlan A., and A.C. Brown The Ecology of Sandy Shores. Burlington MA, Academic Press. McLachlan, A., and I. Turner The interstitial environment of sandy beaches. PZNI Marine Ecology 15: Moffett, M.D., A. McLachlan, P.E.D. Winter, and A.M.C. De Ruyck Impact of trampling on sandy beach macrofauna. Journal of Coastal Conservation 4: Nelson, W.G., An overview of the effects of beach nourishment on the sand beach fauna. In Beach Preservation Technology 88. Problems and Advancements in Beach Nourishment. ed. L.S.Tait, Tallahassee GA: Florida Shore and Beach Preservation Association Inc. Nelson, W.G., Beach restoration in the southeastern US: environmental effects and biological monitoring. Ocean and Coastal Management 19: Newell, R.C., Seiderer, L.J. & Hitchcock, D.R The impact of dredging works in coastal waters: a review of the sensitivity to disturbance and subsequent recovery of biological rsources on the sea bed. Oceanogr. Mar. Biol. Ann. Rev. 36, Nicholas, W.L Seasonal variation in nematode assemblages on an Australian temperate ocean beach; the effect of heavy seas and unusually high tides. Hydrobiologia 464: Nicholas, W.L. and M. Hodda The free-living nematodes of a temperate, high energy, sandy beach: faunal composition and variation over space and time. Hydrobiologia 394: Nicholls, R.J., and S.P. Leatherman Adapting to sea-level rise: relative sea level trends to 2100 for the United States. Coastal Management 24: Nordstrom, K.F Beaches and Dunes on Developed Coasts. Cambridge: Cambridge University Press. Paxton, Hannelore Taxonomy and aspects of the life history of Australian beachworms. Australian Journal of Marine and Freshwater Research 30:
271 Proposed Beach Nourishment in the Sydney Region Review of its Ecological Effects and Recommendations for Future Monitoring Pearse, A.S., H.J. Humm, and G.W. Wharton Ecology of sandy beaches at Beaufort, North Carolina. Ecological Monographs 12: Peterson C.H., and Bishop M Assessing the environmental impacts of beach nourishment. Bioscience 55: Peterson C.H., M.J. Bishop, G.A. Johnson, L.M. D Anna, and L.M. Manning Exploiting beach filling as an unaffordable experiment: Benthic intertidal impacts propagating upwards to shore birds. Journal of Experimental Marine Biology and Ecology 338: Peterson, C.H., D.H.M. Hickerson, and G.G. Johnson Short-term consequences of nourishment and bulldozing on the dominant large invertebrates of a sandy beach. Journal of Coastal Research 16: Pilkey, O.H., and H.L. Wright Seawalls versus beaches. Journal of Coastal Research, Special Issue 4: Quammen, M.L Influence of subtle substrate differences on feeding by shorebirds on intertidal mudflats. Marine Biology 71: Rakocinski, C.F., R.W. Heard, S.E. Lecroy, J.A. McLelland, and T. Simons Responses by macrobenthic assemblages to extensive beach restoration at Perdido Key, Florida, U.S.A. Journal of Coastal Research 12: Richardson, A.J., and D.S. Schoeman Climate impact on plankton ecosystems in the Northeast Atlantic. Science 305: Rickard, C.A., A. McLachlan, and G.I.H. Kerley The effects of vehicular and pedestrian traffic on dune vegetation in South Africa. Ocean and Coastal Management 23: Salafsky, N., R. Margolis, K.H. Redford and J.G. Robinson Improving the practice of conservation: a conceptual framework and research agenda for conservation science. Conservation Biology 16: Schlacher, T.A., L.M.C. Thompson, and S. Price Vehicles versus conservation of invertebrates on sandy beaches: quantifying direct mortalities inflicted by off-road vehicles (ORVs) on ghost crabs. Marine Ecology - Evolutionary Perspective 28: Schlacher, T.A., D.S. Schoeman, J. Dugan, M. Lastra, A. Jones, F. Scapini, and A. McLachlan Sandy beach ecosystems: key features, management challenges, climate change impacts, and sampling issues. Marine Ecology 29: Schlacher, T.A., D. Richardson and, I. McLean Impacts of off-road vehicles (ORVs) on macrobenthic assemblages on sandy beaches. Environmental Management DOI /s Schoeman, D.S.and A.J. Richardson Investigating biotic and abiotic factors affecting the recruitment of an intertidal clam on an exposed sandy beach using a generalized additive model. Journal of Experimental Marine Biology and Ecology 276:
272 Proposed Beach Nourishment in the Sydney Region Review of its Ecological Effects and Recommendations for Future Monitoring Schoeman, D.S., A. McLachlan, and J.E. Dugan Lessons from a disturbance experiment in the intertidal zone of an exposed sandy beach. Estuarine Coastal and Shelf Science 50: Sherman, D.J., K.M. Barron, and J.T. Ellis Retention of beach sands by dams and debris basins in southern California. Journal of Coastal Research SI 36: Short, A.D Wave-dominated beaches. In Handbook of Beach and Shoreface Morphodynamics, ed. A.D. Short, Chichester: John Wiley and Sons. Short, A.D., and P.A. Hesp Wave, beach and dune interactions in southeastern Australia. Marine Geology 48: Short A.D., and L.D. Wright Morphodynamics of high energy beaches: an Australian perspective. In: Coastal Geomorphology in Australia, ed. B.G. Thom. Australia, Academic Press. Slott, J.M., A.B. Murray, A.D. Ashton, and T.J. Crowley Coastline responses to changing storm patterns. Geophysical Research Letters 33: L Soares, A.G., A. McLachlan, and T.A. Schlacher Disturbance effects of stranded kelp on populations of the sandy beach bivalve Donax serra (Röding). Journal of Experimental Marine Biology and Ecology 205: Speybroeck, J., D. Bonte, W. Courtens, T. Gheskiere, P. Grootaert, J-P. Maelfait, M. Mathys, S. Provoost, K. Sabbe, W.M. Stienen, V. Van Lancker, M. Vincx, and S. Degraer Beach nourishment: an ecologically sound coastal defence alternative? A review. Aquatic Conservation: Marine and Freshwater Ecosystems 16: Stenton-Dozey, J.M.E., and C.L. Griffiths The fauna associated with kelp stranded on a sandy beach. In Sandy Beaches as Ecosystems, ed.a. McLachlan, A., and T. Erasmus, The Hague: Junk, The Hague. Tarr, J. G., and P.W. Tarr Seasonal abundance and the distribution of coastal birds on the northern Skeleton Coast, South West Africa/Namibia. Madoqua 15: Tomlinson, R Beaches our asset. Planning and management for natural variability on open coastlines. In: Proceedings of the Public Workshop Beach Protection and Management, Yeppoon 2002, ed. J. Piorewisz, 7-33, CRC for Coastal Zone, Estuary and Water Management and Faculty of Engineering and Physical Systems. Turley, C., J. Blackford, S. Widdicombe, D. Lowe, and P. Nightingale Report presented at: International Symposium on the Stabilisation of Greenhouse Gas Concentrations. Exeter, UK. 1-3 February Van der Merwe, D., and D. van der Merwe Effects of off-road vehicles on the macrofauna of a sandy beach. South African Journal of Science 87: Veloso, V.G., E.S. Silva, C.H.S. Caetano, and R.S. Cardoso Comparison between the macroinfauna of urbanized and protected beaches in Rio de Janeiro State, Brazil. Biological Conservation 127:
273 Proposed Beach Nourishment in the Sydney Region Review of its Ecological Effects and Recommendations for Future Monitoring Voice, M., N. Harvey and K. Walsh eds Vulnerability to Climate Change of Australia s Coastal Zone: Analysis of gaps in methods, data and system threshold. Rept to the Australian Greenhouse Office, Canberra, Australia. June Walther, G-R., E. Post, P. Convey, A. Menzels, C. Parmesan, T.J.C. Beebee, J-M. Fromentin, O. Hoegh-Guldberg, and F. Bairlein Ecological responses to recent climate change. Nature 416: Wieser, W., J. Ott, F. Schiemer, and E. Gnaiger An ecophysiological study of some meiofauna species inhabiting a sandy beach at Bermuda. Marine Biology 26: Wilks, L National Coastal Vulnerability Assessment. Waves 14:22 Williams, J.A., V.L. Ward, and L.G. Underhill Waders respond quickly and positively to the banning of off-road vehicles from beaches in South Africa. Wader Study Group Bulletin 104:
274
275 Proposed Beach Nourishment in the Sydney Region Review of its Ecological Effects and Recommendations for Future Monitoring Appendix1: Summary of general impacts and recovery associated with nourishment Activity/Pressure Sediment extraction dredging in deep water. Possible release of contaminants and bioaccumulation Sediment deposition in 5-10m depth. Sediments will move to intertidal Turbidity in extraction and deposition areas Ecosystem Affected Seabed: Benthos, Reefs, Kelp, Mobile epibenthos Seabed: Benthos, Reefs, Kelp, Seagrass, Intertidal biota, Fish Nursery. Water column. Impact Recovery Mitigation Showstopper Research needed Consultant Large on benthos (structure and productivity). Reefs and kelp probably absent. Possible effects on epibenthos (eg prawns). Indirect effects of benthos loss on fish. Large on resident subtidal benthos. Large on kelp and seagrass if present. Small on reefs. Uncertain effects on juvenile fish. Impact on intertidal biota depends on rate of accretion. Possible indirect effects on seabirds and penguins. Some biota may be translocated from deep to shallow. Small effect on phytoplankton and photosynthesis. Light intensity reduced but nutrients possibly enhanced. Possible small effect on gills. Yes. Fast (weeks to months for some benthos). Slower for large slow-growing spp. BUT, if habitat is changed (eg sediments, depth), dredging becomes a press disturbance with long-term consequences. Yes for benthos. Uncertain for kelp and seagrass (if present). Fast for reefs. BUT, if habitat is changed (eg sediments, depth), deposition becomes a press disturbance with long-term consequences for the biota. Yes. Pulse disturbance. Noise Water column Possible effect on migrating marine mammals Yes. Pulse disturbance. All the above Humans Recreation, fishing, aesthetics Yes if total ecosystem (especially intertidal sand) is changed little. Shipping accidents causing pollution Bulldozing Intertidal sand Probable effects on biota via Yes. Pulse disturbance. disturbance, sediment compaction and crushing Yes. Pattern and depth of dredging. Yes. Rate, depth and pattern of deposition. Yes. Deep discharge of wastes.? noise suppression? Ensure match of sediments No. BUT, problem exists if deep sediments are contaminated. Possible re seagrass, kelp and penguins. Baseline re benthos. Monitoring to test predictions. Spatial and temporal scale important. Baseline mapping of kelp and reefs (available?). Testing of sediments for contaminants. As above. No No n/a? Expert opinion. Review? literature.? Review literature? All of the above Pollution effects on all the biota Yes Yes No No N/A Yes. Minimise effects on dunes and vegetation. Maintain original beach slope and morphology. No Monitor to test predictions re the effects of sediment compaction and direct crushing of biota AMBS/Cardno Ecology AMBS/Cardno Ecology AMBS/Cardno Ecology 22
276
277 Proposed Beach Nourishment in the Sydney Region Review of its Ecological Effects and Recommendations for Future Monitoring Appendix 2: Cost of recommended ecological monitoring Item Components Cost (AUD) Baseline descriptive samping describe the taxonomic composition of assemblages in both the subtidal and intertidal areas to be affected (possibly 12 beaches could be considered to represent different morphodynamic types and kinds of disturbance envisaged see below under point 3). $50,000 locate potentially vulnerable biota outside the immediate impact area e.g., kelp beds. All beaches should be examined. survey all beaches for birdlife, especially threatened or vulnerable species. physical environment describe all beaches re sediments and slope in order to provide the basis for stratification. The subtial sediments should also be described. Pilot sampling Effects and recovery sampling of subtidal and intertidal biota estimate structural features of the macrobenthic assemblage (e.g., taxonomic richness, abundance) estimate error variation in order to inform the design of sampling that would address effects of deposition and recovery. inform estimates of sample processing times the magnitude of the effects of sediment deposition on assemblages (especially macrobenthos) the rate of recovery of assemblages the magnitude of any changes to the physical environment, especially sedimentary variables Equipment & Personnel Costs $25,000 $500,000 Boat hire N/A $50,000 Sample processing. Extraction and identification of biota from sediment cores/grabs $500,000 Materials and personnel costs Statistical analysis and N/A $20,000 interpretation. Sediment analysis. N/A $20,000 Report preparation. N/A $20,000 Report refereeing N/A $5,000 Attendance at workshops. N/A $5,000 Miscellaneous. N/A $20,000 Total $1,215,000 23
278
279 Appendix G Social Stakeholder Workshop
280
281 Targeted Stakeholder Workshop Level 5 Office 44 Market Street, Sydney 11 August 2009 Attendees Aaron Spadaro Steve McInnes Dean Storey Roland Persson Captain John Paton Malcolm Poole John Burgess Brendan Donohue Geoff Withycombe Craig Morrison Lex Nielsen James Walker Deborah Bowden Tourism NSW Strategy Unit Surf Life Saving Surf Life Saving All at Sea Solutions Bravo Fishing Charters Recreational Fishing Alliance of NSW Australian National Sportfishing Association Ltd Surfrider Foundation Sydney Coastal Councils Group Sydney Coastal Councils Group Apologies Jayne Jenkins Carl Falon Richard Nicholls Ecodivers Distribution As above Minutes from workshop sessions Values The purpose of this session was to explore and record some of the values that attendees attribute to the beach and coastal zone. It includes activities enjoyed in the coastal precinct, what the coastal zone means and the emotions associated with time spent in the coastal zone. Recreation Lifestyle Health benefits Sporting purists: - Fishing - Surfing - Spear fishing - snorkelling - Whale or dolphin watching - Beach volleyball
282 Historic symbolism iconic, good for branding and promoting Australia Unrestrictive activity open to anyone Freedom for community and visitors Family enjoyment Free no cost to visit and use beach Nippers Commercial fishing Commercial fishing and beach hauling Coastal zone represents the edge it s the location where mans influence ends greatest wilderness area Moving from land to sea is moving into a habitat that uncontrolled by us Dynamic environments that are ever changing which makes them attractive, fresh Pristine different to some Asian countries that have used coastal area for livelihood Precious quality Issues and Concerns The purpose of this session was to explore and investigate current issues and concerns with the beach and coastal environment. Attendees were asked to reflect on their values when responding. Sea level rise will impact upon beaches and cliffs (hydrology and wave climate) Sea level rise will impact on existing development, existing sandy beaches i.e. impact of doing nothing Coastal erosion. More extreme storm events Bait collecting, impart on recreational fishing, retaining access, compensatory habitat - potential to create artificial reefs the but also negative impact if volume of sand on beach is altered Change in pattern of warm water currents. Currents are occurring a lot later. Unacceptable to change existing conditions re recreational/commercial fishing impact on fisheries and aquatic ecology More extreme weather moving south, potential for increased occurrence of cyclones in Brisbane Barometric pressure changes will result in greater fluctuations in beach. Added to this will be sea level rise and movement of sand offshore Coastal erosion has a negative impact on the following - Integrity of facilities and safety - Access to beach - Public may move to another beach which is more aesthetically pleasing which may not be patrolled safety issues
283 SLSA mass sand movement has implications on safety, surfing Implications, potential for rips, dangerous conditions There is potential for education of public with respect to these issues. Potential to impact on heritage/cultural aspects, Beach Nourishment issues and concern The purpose of this session was to explore some issues and concerns associated with beach nourishment Timing - Recreational fishing - timing is irrelevant - DPI Fisheries would be concerned with timing with respect to potential impacts on marine ecology and habitat Turbidity associated dredging and nourishment in the near shore environment would create a negative impact on spear fishing and scuba diving Plume migration would need to be investigated to ensure impacts are minimised Turbidity resulting from dredging and nourishment in the near shore environment would impact on recreational activities such as whale watching Charter operations - Affected by volume (higher levels) of sand which may affect navigation - SLSA - timing - summer more popular period - SLSA - non invasive nourishment techniques (i.e. in the near shore as opposed to on the beach) would be more acceptable - SLSA - night dredging and nourishment may be good option to minimise impact on beach users although noise impacts would need to be carefully considered. - stirring up and disturbance of sand may lead to potential for more fish, and in turn more sharks. This will affect safety of beach users - consideration should be given to mid week nourishment as opposed to weekends to minimise impact on users - commercial fishing operation at night currently an issue - great surf breaks need to be maintained - Dredging would need to be undertaken properly from the beginning i.e. planned to minimise impact and public education program in place - Surfrider Foundation there needs to be a public education program - Need to look at surfing reserves what is aquired to preserve these? What are the environmental impacts associated with depositing sand on rock platforms Site works would need to be carefully planned i.e. where would construction compounds be sited and storage of plant Issue of Kirra - not a precedent - need to consider contracting
284 Recreational fishers would like to fish off pumping system Sand type - Research should be undertaken to investigate receiving/existing sand type and source to potentially match grain size and colour although SLSA were of opinion that colour of sand not really an issue as long as not replacing white sand with black sand Tourism - better to deposit sand off shore - less disruption of beach users particularly if summer is deemed to be the best time for nourishment Waverley Council has had issues with footing the bill of maintaining a beautiful beach for all Potential for users pays? Potential for federal government to get involved with respect to funding? Timing for project and action - within years Byron Bay study ruled out beach nourishment - study on website Council sand nourishment needs - SCCG to provide study Coast care - Dune care there is potential for erosion of dunal areas and rehabilitation, who pays? Threatened species, penguins etc. - impact associated with coastal erosion Beach nourishment is a positive as it is putting sand back where it belongs Where will the sand be sourced from? Approval to extract sand for beach nourishment may set precedence for commercial mining There needs to be political support for such a project. Is the political will to act about potential loss of sand on our beaches present or absent?
285 Appendix H Economic Evaluation
286
287 Beach Sand Nourishment Scoping Study Maintaining Sydney s Beach Amenity Against Climate Change Sea Level Rise Appendix H Economic Evaluation The main economic benefits of the beach nourishment program to be valued are associated with the flow-on effects from loss of beach amenity. Much of the information required is being collected in the on-going Sydney Beaches Valuation Project being conducted by Dave Anning at UNSW for the SCCG. The Project will produce an estimate of the Total Economic Value of two of the Scoping Study beaches (Manly and Narrabeen/Collaroy). Total Economic Value (TEV) In cost-benefit analysis and welfare economics, TEV is conventionally estimated on a willingness-to-pay (WTP) basis. It comprises an expenditure component based on market prices of traded goods and services and a nonmarket based component where the market does not provide a satisfactory measure of economic value. For the latter component, values of non-traded attributes need to be derived using surrogate or proxy measures of WTP indicators, the approach being used in the UNSW study. Non-traded attributes include: Consumer surplus the value of the beach to people over and above that indicated by the expenditure component of TEV; Indirect use value the value which the beach provides as protection of foreshore assets from storms; and non-use value the value people hold for the beach s actual existence even though they may never use it. Scoping Study Approach Pending the completion of the UNSW study toward the end of 2009 and the valuation of the non-traded components of TEV for Sydney beaches, will undertake high-level benefit valuation using data from secondary sources on key parameters of the expenditure component of TEV. These parameters determine the change in expenditure on coastal goods and services and the change in government revenues as a result of flowon effects following the loss of beach amenity. Fiscal impacts need to be part of the assessment of value for money of a public investment as affordability to government will often be a critical factor in deciding whether an investment program is realistic and practical. The inclusion of fiscal impacts along with impacts on economic efficiency and wider economic impacts is consistent with the latest developments in project appraisal. At this stage, the avoided loss of the non-market component of TEV can only be approximated. This is because, pending the results of the specific valuations that are being undertaken in the UNSW study: For beach use, the value of WTP for beach amenity would need to be based on transferring benefits from studies of other coastal areas to the Sydney context we believe this approach is limited because of the individual nature and characteristics of specific beaches; 1 1 It is only under certain conditions that benefits transfer provides a credible basis for valuation. Factors influencing these conditions include: Purpose of original value estimates Consumer groups considered Location of original study site Good or service valued Type of environmental impact Reference and target levels (existing quality and quality outcome sought) Reliability of source data Market structure Demographic and socio-economic characteristics of the population General attitudes, perceptions, or levels of knowledge of the population
288 Beach Sand Nourishment Scoping Study Maintaining Sydney s Beach Amenity Against Climate Change Sea Level Rise For price differentials of properties in close proximity to beaches, information is not available on what is driving the willingness to pay a price premium it could be the beach, the water views, the open space or a combination of these. 2 Benefits Measurement The following benefits of the beach nourishment investment program will be valued in the Scoping Study: Avoided loss of the expenditure component of TEV - The current level of expenditure will be estimated by combining Tourism Research Australia estimates of Gross Value Added (GVA) per tourism business and information on the number of potentially affected business properties; - The percentage of this expenditure which is beach-related is assumed for each type of tourism business, based on the factors shown below: Cafes, restaurants & take-aways resident: visitor ratio Clubs, pubs, taverns & bars ratio of visitor average daily expenditure to resident average daily expenditure Retail % of visitors attracted by the beach Accommodation % of visitors attracted by the beach Galleries, museums, etc weak association with beach amenity Other entertainment services only on-beach activities included - The annual loss of expenditure over the evaluation period will be derived from the rate of beach width reduction in the base case; - Inclusion of this benefit assumes that beach-related expenditure is not diverted to other coastal locations where beach width reduction is less severe. 3 - Uplift factor for the non-traded component of TEV - An uplift factor will be applied to the expenditure component of TEV to provide some allowance for the value of non-traded attributes; - A possible range for the uplift factor will be derived from relevant Australian studies where non-traded attributes have been valued; - The range of values will enable assessment of the sensitivity of the economic results to this factor. Avoided loss of Council rate revenue - This will be estimated by assuming that: 1) There will be a differential of about 30% between rate revenue from residential properties with direct beach access: - This property price differential is based on analysis of property values 4 in Adelaide reported in Burgan (2003)5; - This will be assumed to apply to rateable land value - The annual loss of rate revenue will align with the rate of beach width reduction in the base case 2) There will be a differential of about 40% between rate revenue from residential properties within easy walking distance of a beach 2 For this component, we have drawn on the property willingness-to-pay relativities reported in Burgan (2003). 3 This benefit will be overestimated to the extent that expenditure is diverted to other beaches. 4 For properties having water views with direct access to the beach and those having water views only. The relativity is derived using the coefficients of the dummy variables in Model 4 which is the preferred model using the 2003 data (refer Page 16). 5 In the case of Collaroy/Narrabeen (because this is where the potential impact on residential property values is most significant), the differential has been checked for reasonableness with local real estate agents.
289 Beach Sand Nourishment Scoping Study Maintaining Sydney s Beach Amenity Against Climate Change Sea Level Rise - This property price differential is based on analysis of property values 6 in Adelaide reported in Burgan (2003) 4 - This will be assumed to apply to rateable land value - The annual loss of rate revenue will align with the rate of beach width reduction in the base case 3) Rate revenue from properties within easy walking distance assumed to be over 3 times that of properties with direct beach access - from Burgan (2003); 4) Rate revenue from potentially affected business properties will reduce at the same rate as the reduction in the expenditure component of TEV. A WTP factor to reflect the impacts of beach amenity on residential property values - This assumes that property value is an indicator of WTP for beach amenity; - This will be approximated by annualising the property value impacts derived from the application of a ratio of residential property value to rate revenue to the avoided loss of residential rate revenue (the ratio assumes that property value is typically 75% higher than land (site) value); - The annualisation factor is calculated using 7% interest rate over 50 years. Avoided loss of tax revenue - This will be estimated by applying the average tax on tourism industry products to the reduction in the expenditure component of TEV (when expenditure is measured in terms of GVA it excludes taxes on products); - Taxes in the tourism industry are significantly higher than the national average in , 21% for the tourism industry compared to the national average of 9-10%. In summary, the benefits of the beach nourishment program will be measured as: Benefits = (Avoided loss of expenditure component of TEV) x Uplift factor for non-traded component of TEV + Avoided loss of Council rate revenue + (Avoided loss of Council residential rates revenue) x Property value factor x Annualisation factor + Avoided loss of tax revenue Parameter Values The parameter values used in the three case study cost-benefit analyses are set out in the following table. 6 For properties within easy walking distance of a beach (defined as within 500 metres) and those not within this distance. The relativity is derived using the coefficients of the dummy variables in Model 4 which is the preferred model using the 2003 data (refer Page 16).
290 Beach Sand Nourishment Scoping Study Maintaining Sydney s Beach Amenity Against Climate Change Sea Level Rise PARAMETER VALUES Collaroy Unit Manly Narrabeen Cronulla Discount rate % 7.0% With Sand Nourishment Unit Costs 1st Campaign Capital Dredging & nourishment $/m Other $/m Total $/m Recurrent $/m 3 Monitoring $/m Management $/m Total $/m Sand Volume m 3 625,200 1,262,689 1,515,200 Total Costs 1st Campaign Capital $'000 14,223 28,726 34,471 Recurrent $'000 1,388 2,803 3,364 Unit Costs 2nd & subsequent Campaigns Capital Dredging & nourishment $/m Other $/m Total $/m Recurrent $/m 3 Monitoring $/m Management $/m Total $/m Sand Volume m 3 208, , ,940 Total Costs 2nd & subsequent Campaigns Capital $'000 5,109 10,318 12,381 Recurrent $'000 1,104 2,230 2,676 Benefits GVA $'000 7,601 3,344 4,965 Uprate factor a/ Residential rates revenue $' ,330 1,862 Property value factor b/ Annualisation factor c/ Residential property value d/ $'000 16,273 25,301 28,900 Business rates revenue $'000 4, Tax revenue $'000 1, ,043 Base Case e/ Year Year Year Year Year
291 Beach Sand Nourishment Scoping Study Maintaining Sydney s Beach Amenity Against Climate Change Sea Level Rise Notes: a/ Derived using the travel cost method as indicator of the consumer surplus associated with a beach visit. Average of values from relevant studies: (i) Lower and upper value of 1.10 and 1.45 based on expenditure per beach visit of $5.09 (excl parking and public transport) [Table 9] and travel cost per beach visit of $0.50 (lower) and $2.30 (upper) [Table 18], from Raybould (2009). (ii) 1.62 for residents and 1.72 for visitors based on on site expenditure of $3.85 by residents and $16.53 by visitors [Table 3, calculated as TTSCALL TTSCTIM] and travel cost per beach visit of $2.39 for residents and $11.86 for visitors [Table 6], from Blackwell (2007). b/ Residential rates revenue = land value x residential rate. Therefore, ratio of residential property value to rates revenue can be approximated as: (Land value x 1.75 x 1/Residential rate) assuming property value is typically 75% higher than land (site) value. c/ Calculated using 7% interest rate over 50 years. d/ Assumes property value is an indicator of willingness to pay for beach amenity. e/ Proportion of 2009/10 beach amenity benefits.
292 Beach Sand Nourishment Scoping Study Maintaining Sydney s Beach Amenity Against Climate Change Sea Level Rise Collaroy-Narrabeen Case Study VALUE OF BEACH RELATED EXPENDITURE AND ASSOCIATED TAX REVENUE: COLLAROY NARRABEEN GVA per Total Beach related business a/ No. of GVA % of GVA ($'000) businesses ($'000) Base b/ ($'000) 2006/07 Cafes, restaurants & take aways ,624 59% 965 Clubs, pubs, taverns & bars % 187 Accommodation ,836 90% 1,652 Retail c/ % 125 Galleries, museums, etc % 0 Other entertainment services % 114 Beach related expenditure 3,043 Tax revenue d/ /10 e/ Beach related expenditure 3,429 Tax revenue 720 Notes: a/ From Tourism Research Australia, Tourism Businesses in Australia June 2004 to June 2007, March 2009, Table 12. b/ Assumed percentage contribution of beach related activities to economic base. Assumptions based on: Cafes, restaurants & take aways ) 2:1 resident:visitor ratio, visitor average daily expenditure Clubs, pubs, taverns & bars ) twice that of residents, with 90% of visitors attracted by the Retail ) beach Accommodation 90% of overnight visitors attracted by beach Galleries, museums, etc weak association with beach amenity Other entertainment services only on beach activities included c/ Excludes retail outlets that primarily serve local residents (eg. homewares). d/ From Tourism Research Australia, Tourism's contribution to the Australian economy to , October 2008, page 8. Average tax rate in tourism sector is: 21% e/ Updated by change in household final consumption expenditure from Dec Qtr 2006 to June Qtr
293 Beach Sand Nourishment Scoping Study Maintaining Sydney s Beach Amenity Against Climate Change Sea Level Rise VALUE OF RATES REVENUE: COLLAROY NARRABEEN Affected area Value Residential Direct Beach Access Units No. of occupied private dwellings 392 Average rates revenue per occupied private dwelling a/ $923 Rates revenue $361,816 Houses No. of occupied private dwellings 96 Average rates revenue per occupied private dwelling b/ $5,000 Rates revenue $480,000 Total $841,816 Value differential c/ 100% Loss of rates revenue $841,816 Walking Distance Ratio of impact on property values d/ 3.2 Rates revenue e/ 2,693,811 Value differential f/ 40% Loss of rates revenue $1,077,524 Total Loss of Residential Rates Revenue $1,919,340 Business No. of businesses 53 Average rates revenue per business property g/ $3,113 Rates revenue $164,989 Notes: a/ Assumes the minimum rate for occupied private dwellings. b/ Based on average land value for a selection of beachfront properties. c/ These properties will not exist in the base case. d/ From Burgan (2003). e/ Assumes same housing mix as for properties with direct beach access (20% houses, 80% units/ flats/apartments) f/ Based on premium in Adelaide property values of being within easy walking distance of a beach (defined as 0.5 km) from Burgan (2003). g/ Based on average rates revenue for properties within hazard lines.
294 Beach Sand Nourishment Scoping Study Maintaining Sydney s Beach Amenity Against Climate Change Sea Level Rise COST BENEFIT ANALYSIS: COLLAROY NARRABEEN ($'000 in 2009 prices) Costs Year Dredging Mgmnt Benefits a/ Net ending & & Non traded Rates Revenue Resid'tl Tax Economic June Nourish Monitor GVA Value Resid'tl Business WTP Revenue Total Benefits ,726 2, , ,408 28, , , ,544 1, , , ,544 1, , , ,544 1, , , ,544 1, , , ,544 1, , , ,544 1, , , ,544 1, , , ,544 1, , , ,544 1, ,318 2, , ,816 5, , , ,087 6, , , ,087 6, , , ,087 6, , , ,087 6, , , ,087 6, , , ,087 6, , , ,087 6, , , ,087 6, , , ,087 6, ,318 2, , ,223 2, ,230 1, , ,631 11, ,230 1, , ,631 11, ,230 1, , ,631 11, ,230 1, , ,631 11, ,230 1, , ,631 11, ,230 1, , ,631 11, ,230 1, , ,631 11, ,230 1, , ,631 11, ,230 1, , ,631 11, ,318 2,230 1, , ,631 1, ,230 1, , ,175 15, ,230 1, , ,175 15, ,230 1, , ,175 15, ,230 1, , ,175 15, ,230 1, , ,175 15, ,230 1, , ,175 15, ,230 1, , ,175 15, ,230 1, , ,175 15, ,230 1, , ,175 15, ,318 2,230 1, , ,039 4, ,230 1, , ,719 20, ,230 1, , ,719 20, ,230 1, , ,719 20, ,230 1, , ,719 20, ,230 1, , ,719 20, ,230 1, , ,719 20, ,230 1, , ,719 20, ,230 1, , ,719 20, ,230 1, , ,719 20,488
295 Beach Sand Nourishment Scoping Study Maintaining Sydney s Beach Amenity Against Climate Change Sea Level Rise PV at 7.0% 36,460 34,803 8,502 3,401 4, ,630 1, ,649 41,695 Notes: a/ Assumes benefits accrue for only 9 months of first year of NPV ($m) 41.7 each campaign. BCR 1.6 EIRR 12%
296 Beach Sand Nourishment Scoping Study Maintaining Sydney s Beach Amenity Against Climate Change Sea Level Rise Manly Ocean Beach Case Study VALUE OF BEACH RELATED EXPENDITURE AND ASSOCIATED TAX REVENUE: MANLY GVA per Total Beach related business a/ No. of GVA % of GVA ($'000) businesses ($'000) Base b/ ($'000) 2006/07 Cafes, restaurants & take aways ,800 33% 1,914 Clubs, pubs, taverns & bars ,050 33% 347 Accommodation ,508 70% 3,856 Retail c/ ,680 33% 554 Galleries, museums, etc % 17 Other entertainment services % 57 Beach related expenditure 6,744 Tax revenue d/ 1, /10 e/ Beach related expenditure 7,601 Tax revenue 1,596 Notes: a/ From Tourism Research Australia, Tourism Businesses in Australia June 2004 to June 2007, March 2009, Table 12. b/ Assumed percentage contribution of beach related activities to economic base. Assumptions based on: Cafes, restaurants & take aways ) 2:1 resident:visitor ratio, visitor average daily expenditure Clubs, pubs, taverns & bars ) twice that of residents, with 50% of visitors attracted by the Retail ) beach Accommodation 70% of overnight visitors attracted by beach Galleries, museums, etc weak association with beach amenity Other entertainment services only on beach activities included c/ Excludes retail outlets that primarily serve local residents (eg. homewares). d/ From Tourism Research Australia, Tourism's contribution to the Australian economy to , October 2008, page 8. Average tax rate in tourism sector is: 21% e/ Updated by change in household final consumption expenditure from Dec Qtr 2006 to June Qtr
297 Beach Sand Nourishment Scoping Study Maintaining Sydney s Beach Amenity Against Climate Change Sea Level Rise VALUE OF RATES REVENUE: MANLY Affected area Value Residential Direct Beach Access No. of occupied private dwellings fronting North Steyne 500 Average rates revenue per occupied private dwelling a/ $824 Total rates revenue $412,000 Value differential b/ 30% Loss of rates revenue $123,600 Walking Distance Ratio of impact on property values c/ 3.2 Rates revenue d/ 1,318,400 Value differential e/ 40% Loss of rates revenue $527,360 Total Loss of Residential Rates Revenue $650,960 Business Manly Business District f/ $4,377,000 Attributable to beach amenity g/ 50% Loss of Business Rates Revenue $2,188,500 Notes: a/ Estimate from Manly Council. b/ Based on difference in Adelaide property values between having water views with direct access to a beach and having water views only from Burgan (2003). c/ From Burgan (2003). d/ Assumes same housing mix as for properties with direct beach access (1% houses, 99% units/ flats/apartments) e/ Based on premium in Adelaide property values of being within easy walking distance of a beach (defined as 0.5 km) from Burgan (2003). f/ Includes special purpose rate for Manly Business Centre Improvements. g/ Based on percentage of GVA of businesses that is beach related (from preceding table).
298 Beach Sand Nourishment Scoping Study Maintaining Sydney s Beach Amenity Against Climate Change Sea Level Rise COST BENEFIT ANALYSIS: MANLY ($'000 in 2009 prices) Costs Year Dredging Mgmnt Benefits a/ Net ending & & Non traded Rates Revenue Resid'tl Tax Economic June Nourish Monitor GVA Value Resid'tl Business P'ty Value Revenue Total Benefits ,223 1, , ,515 13, , , ,354 1, , , ,354 1, , , ,354 1, , , ,354 1, , , ,354 1, , , ,354 1, , , ,354 1, , , ,354 1, , , ,354 1, ,924 1,104 1, , , ,104 1, , ,708 5, ,104 1, , ,708 5, ,104 1, , ,708 5, ,104 1, , ,708 5, ,104 1, , ,708 5, ,104 1, , ,708 5, ,104 1, , ,708 5, ,104 1, , ,708 5, ,104 1, , ,708 5, ,924 1,104 1, , ,546 1, ,104 2, ,313 4, ,061 8, ,104 2, ,313 4, ,061 8, ,104 2, ,313 4, ,061 8, ,104 2, ,313 4, ,061 8, ,104 2, ,313 4, ,061 8, ,104 2, ,313 4, ,061 8, ,104 2, ,313 4, ,061 8, ,104 2, ,313 4, ,061 8, ,104 2, ,313 4, ,061 8, ,924 1,104 2, ,313 4, ,061 4, ,104 3,040 1, ,751 6, ,415 12, ,104 3,040 1, ,751 6, ,415 12, ,104 3,040 1, ,751 6, ,415 12, ,104 3,040 1, ,751 6, ,415 12, ,104 3,040 1, ,751 6, ,415 12, ,104 3,040 1, ,751 6, ,415 12, ,104 3,040 1, ,751 6, ,415 12, ,104 3,040 1, ,751 6, ,415 12, ,104 3,040 1, ,751 6, ,415 12, ,924 1,104 2,850 1, ,641 6, ,577 6, ,104 3,800 1, ,189 8, ,769 15, ,104 3,800 1, ,189 8, ,769 15, ,104 3,800 1, ,189 8, ,769 15, ,104 3,800 1, ,189 8, ,769 15, ,104 3,800 1, ,189 8, ,769 15, ,104 3,800 1, ,189 8, ,769 15, ,104 3,800 1, ,189 8, ,769 15, ,104 3,800 1, ,189 8, ,769 15, ,104 3,800 1, ,189 8, ,769 15,665
299 Beach Sand Nourishment Scoping Study Maintaining Sydney s Beach Amenity Against Climate Change Sea Level Rise PV at 7.0% 17,733 17,232 18,843 7,537 1,614 10,852 40,344 3,957 83,148 48,183 Notes: a/ Assumes benefits accrue for only 9 months of first year of NPV ($m) 48.2 each campaign. BCR 2.4 EIRR 20%
300 Beach Sand Nourishment Scoping Study Maintaining Sydney s Beach Amenity Against Climate Change Sea Level Rise Bate Bay Case Study VALUE OF BEACH RELATED EXPENDITURE AND ASSOCIATED TAX REVENUE: CRONULLA GVA per Total Beach related business a/ No. of GVA % of GVA ($'000) businesses ($'000) Base b/ ($'000) 2006/07 Cafes, restaurants & take aways ,176 59% 2,481 Clubs, pubs, taverns & bars % 125 Accommodation ,224 90% 1,102 Retail c/ ,113 59% 661 Galleries, museums, etc % 0 Other entertainment services % 38 Beach related expenditure 4,406 Tax revenue d/ /10 e/ Beach related expenditure 4,965 Tax revenue 1,043 Notes: a/ From Tourism Research Australia, Tourism Businesses in Australia June 2004 to June 2007, March 2009, Table 12. b/ Assumed percentage contribution of beach related activities to economic base. Assumptions based on: Cafes, restaurants & take aways ) 2:1 resident:visitor ratio, visitor average daily expenditure Clubs, pubs, taverns & bars ) twice that of residents, with 90% of visitors attracted by the Retail ) beach Accommodation 90% of overnight visitors attracted by beach Galleries, museums, etc weak association with beach amenity Other entertainment services only on beach activities included c/ Excludes retail outlets that primarily serve local residents (eg. homewares). d/ From Tourism Research Australia, Tourism's contribution to the Australian economy to , October 2008, page 8. Average tax rate in tourism sector is: 21% e/ Updated by change in household final consumption expenditure from Dec Qtr 2006 to June Qtr
301 Beach Sand Nourishment Scoping Study Maintaining Sydney s Beach Amenity Against Climate Change Sea Level Rise VALUE OF RATES REVENUE: CRONULLA Affected area Value Residential Prince Street a/ $102,507 Eloura Rd/Bate Bay area a/ $1,005,676 Total rates revenue $1,108,183 Value differential b/ 40% Loss of rates revenue $443,273 Walking Distance Ratio of impact on property values c/ 3.2 Rates revenue d/ 3,546,186 Value differential b/ 40% Loss of rates revenue $1,418,474 Total Loss of Residential Rates Revenue $1,861,747 Business Cronulla CBD e/ $1,365,004 Attributable to beach amenity f/ 65% Loss of Business Rates Revenue $887,253 Notes: a/ Calculation from Sutherland Shire Council. b/ Based on premium in Adelaide property values of being within easy walking distance of a beach (defined as 0.5 km) from Burgan (2003). c/ From Burgan (2003). d/ Assumes same housing mix as for properties in Eloura Rd/Bate Bay area. e/ Calculation from Sutherland Shire Council for CBD rateable area. f/ Based on percentage of GVA of businesses that is beach related (from preceding table).
302 Beach Sand Nourishment Scoping Study Maintaining Sydney s Beach Amenity Against Climate Change Sea Level Rise COST BENEFIT ANALYSIS: CRONULLA ($'000 in 2009 prices) Costs Year Dredging Mgmnt Benefits a/ Net ending & & Non traded Rates Revenue Resid'tl Tax Economic June Nourish Monitor GVA Value Resid'tl Business WTP Revenue Total Benefits ,471 3, , ,984 34, , , , , , , , , , , , , , , , , , , , , , , , , , , , ,381 2, , ,967 9, ,676 1, , ,956 5, ,676 1, , ,956 5, ,676 1, , ,956 5, ,676 1, , ,956 5, ,676 1, , ,956 5, ,676 1, , ,956 5, ,676 1, , ,956 5, ,676 1, , ,956 5, ,676 1, , ,956 5, ,381 2,676 1, , ,951 6, ,676 1, , ,934 9, ,676 1, , ,934 9, ,676 1, , ,934 9, ,676 1, , ,934 9, ,676 1, , ,934 9, ,676 1, , ,934 9, ,676 1, , ,934 9, ,676 1, , ,934 9, ,676 1, , ,934 9, ,381 2,676 1, , ,934 3, ,676 2, , ,913 13, ,676 2, , ,913 13, ,676 2, , ,913 13, ,676 2, , ,913 13, ,676 2, , ,913 13, ,676 2, , ,913 13, ,676 2, , ,913 13, ,676 2, , ,913 13, ,676 2, , ,913 13, ,381 2,676 1, , , ,676 2,526 1, , ,891 17, ,676 2,526 1, , ,891 17, ,676 2,526 1, , ,891 17, ,676 2,526 1, , ,891 17, ,676 2,526 1, , ,891 17, ,676 2,526 1, , ,891 17, ,676 2,526 1, , ,891 17, ,676 2,526 1, , ,891 17, ,676 2,526 1, , ,891 17,215
303 Beach Sand Nourishment Scoping Study Maintaining Sydney s Beach Amenity Against Climate Change Sea Level Rise PV at 7.0% 43,922 41,762 12,523 5,009 4,616 2,200 71,650 2,630 98,627 13,484 Notes: a/ Assumes benefits accrue for only 9 months of first year of NPV ($m) 13.5 each campaign. BCR 1.2 EIRR 8%
304
305 Appendix I Planning Approvals Process
306
307 Beach Sand Nourishment Scoping Study Maintaining Sydney s Beach Amenity Against Climate Change Sea Level Rise Appendix I Sand Extraction and Nourishment Approval Process I.1 Project Details In respect of the approvals process the following assumptions have been made: Sand would be won from the ocean floor within 3 nautical miles (Nm) of the Sydney metropolitan coastline (water depth of approximately 25-70m). Sand would be transported by waterborne craft (e.g. barge) The sand would be placed offshore of beaches along the Sydney Metropolitan coastline Beach nourishment would occur at approximately 10 year intervals (depending on trigger for nourishment that is selected) for a period of 50 years. It is not proposed to stockpile sand at any location on land, nor is it proposed to transport sand on land. The following sections describe the planning approvals process that would apply to works of this nature as well as a description of lessons learned from past proposals for similar projects. I.2 Key Legislation This section provides an overview of the key legislation that influences the feasibility of the proposed beach nourishment project. The background discussion below (Section I.2.2) is informed by a Discussion Paper prepared by Rob Corkery (Principal), R.W. Corkery & Co Pty Ltd (RW Corkery), which is provided in Appendix I of this report. I.2.1 Background Following the Constitutional Settlement of 1979, the Governments of NSW and the Commonwealth of Australia agreed that coastal waters adjacent to the NSW State boundary were recognised to be: NSW Statutory Waters for a distance of less than 3Nm from the coast (herein referred to as the baseline ); and Commonwealth Statutory Waters for a distance of greater than 3Nm from the baseline. In light of this Constitutional Settlement, it is a requirement for any person or enterprise to seek approvals under NSW legislation for the exploration and recovery of marine aggregate (sand) within the 3Nm limit. Conversely, it is a requirement for any persons or enterprise to seek approval under Commonwealth legislation for the exploration and recovery of marine aggregate beyond the 3Nm limit. Notwithstanding this agreement, there remains an understanding between the NSW and Commonwealth Governments that the views of the NSW Government would be sought regarding any proposals for exploration or mining beyond the 3Nm limit. This has in fact recently occurred with an application to the Commonwealth Government for a mineral exploration licence off the NSW Coast. I.2.2 Approvals process overview On the basis of this study, the extraction of marine aggregate for purposes of beach nourishment from NSW statutory waters requires satisfaction of two principal NSW Acts: Offshore Minerals Act 1999 (OM Act) Environmental Planning and Assessment Act 1979 (EP&A Act). There are other NSW Acts and regulations that must be addressed in order to gain approval, such as Protection of the Environment Operations Act 1997, Threatened Species Conservation Act 1995, Fisheries Management Act These and other relevant Acts are discussed in Appendix I of this report. Offshore Minerals Act 1999 Sand, or marine aggregate, is recognised to be a mineral under Section 22 of the OM Act. To recover marine aggregate from the seabed within the 3Nm limit from the baseline, an enterprise is required to hold a mining licence under Part 2.4 of the OM Act. Since the OM Act has been gazetted (31 March 2000), no regulations have been gazetted or promulgated that will allow any enterprise to apply for a mining licence off the NSW coast. This
308 Beach Sand Nourishment Scoping Study Maintaining Sydney s Beach Amenity Against Climate Change Sea Level Rise situation reflects the current NSW Government policy opposing sand mining off the NSW coastline, both within and beyond the 3Nm limit. It is understood this policy has been referred to by Government as recently as February At present, Clause 4 of Schedule 2 of the OM Act provides for Reserves No and 2894 to be reserves that prohibit extraction under Section 18 of the OM Act. It would require an amendment to Schedule 2 of the OM Act and the introduction of companion regulations to enable a mining licence to be issued over an area of sand within the 3Nm limit to enable sand to be recovered for beach nourishment purposes. Changes of this magnitude will require considerable discussions with Government at the highest levels. The Department of Primary Industries (Mineral Resources) has verbally advised that the reserved blocks exclude the areas that are subject to the existing exploration licences currently in force. Under Section 18(2) of the OM Act, the Minister may not declare a block in coastal waters to be a reserved block if a licence over that block is in force. As, in accordance with Clause 2 of Schedule 2 of the OM Act, exploration licences granted under the Mining Act 1992 are taken to be exploration licences under Part 2.2 of the OM Act. It follows that the reserved blocks do not affect the areas that are affected by the current exploration licences. Due to Government policy, acting upon the existing exploration licences would be difficult. The Department of Primary Industries (Mineral Resources) has verbally advised that planning approval would be required for exploration for minerals. Due to current policy regarding offshore mineral recovery for commercial purposes, the State Government is unlikely to grant planning approval under the EP&A Act for such exploration activities. However, as these areas are excluded from the reserved blocks (that is, they would be standard blocks within the meaning of the OM Act) the Minister may grant a mining licence over these areas. Under Section 198(1) of the OM Act, the holder of exploration or retention licence may apply to the Minister for a mining licence over all or some of the blocks in the licence area. Environmental Planning and Assessment Act 1979 To obtain approval for the recovery of marine aggregate under the EP&A Act, it will be necessary for an enterprise to obtain project approval under Part 3A of the EP&A Act. Part 3A applies to major extractive industry projects such as extraction of marine aggregate that meets the following criteria: a) the total resource size exceeds 5Mt; or b) the annual production exceeds t/a. The Part 3A approval process is discussed in more detail in Section I.4.1 of this report. I.2.3 State Government policy in respect of offshore sand extraction for beach nourishment While there is a prohibition on offshore minerals extraction due to the effect of the OM Act, a report prepared by Patterson Britton & Partners for Byron Bay Shire Council (PBP 2006) titled Scoping Study on the Feasibility to Access the Cape Byron Sand Lobe for Sand Extraction for Beach Nourishment includes a discussion regarding the current government policy with respect to offshore sand extraction. The report states that a letter was written by the NSW Premier to The Northern Beaches Branch of the Surfrider Foundation Incorporated dated 6 March 2001, specifically in relation to Collaroy/Narrabeen Beach, which stated: As you are aware, the Government does not support offshore commercial sandmining, and the areas off the coast are currently protected by reserves under the Mining Act, which do not permit exploration or mining activity. Your proposal of dredging for beach nourishment, however, is a different matter, and bears further investigation. (PBP 2006) An officer of the Department of Primary Industries (Mineral Resources) has recently confirmed that the understanding of the Government s policy position, being opposed to offshore commercial sand mining remains. It is recommended that this position be formally confirmed with the NSW Minister for Mineral Resources. I.3 Federal Government Approval I.3.1 Environmental Protection and Biodiversity Conservation Act 2000 The Commonwealth Environment Protection and Biodiversity Conservation Act 1999 (EPBC Act) governs the Commonwealth Environmental Assessment process and provides protection for matters of National Environmental Significance (NES), which include:
309 Beach Sand Nourishment Scoping Study Maintaining Sydney s Beach Amenity Against Climate Change Sea Level Rise Nationally threatened species and ecological communities Australia s World heritage properties Ramsar wetlands of international importance Migratory species listed under the EPBC Act (species protected under international agreements) Commonwealth marine areas Nuclear actions, including uranium mining National heritage. The EPBC Act defines proposals that are likely to have an impact on a matter of NES as a controlled action. Proposals that are, or may be, a controlled action are required to be referred to the Commonwealth Minister for the Environment, Heritage and the Arts for a determination as to whether or not the action is a controlled action. The Project will likely require a referral to the Commonwealth Minister for the Environment, Heritage and the Arts for an assessment of whether or not it includes a controlled action under the EPBC Act. If the action is a controlled action, the Commonwealth Department of Environment, Water, Heritage and the Arts (DEWHA) will provide assessment requirements to be addressed under Part 3A of the EP&A Act, in accordance with the Bilateral Agreement. Investigations are required to determine the potential impact on matters of NES, including, but not limited to, the following items protected under the EPBC Act: migratory species (e.g. whales) marine fishes important wetlands. I.3.2 Native Title Act 1993 The Native Title Act 1993 sets up processes through which native title can be recognised and provides protection for native rights and interests. Native title arises as a result of the recognition, under Australian common law, of indigenous rights and interests according to traditional indigenous laws and customs, in relation to land or waters. Consultation with the National Native Title Tribunal (NNTT) and review of the National Native Title Register (NNTR) is required to determine whether there are any approved determinations of native title over land or water subject to the beach nourishment works. I.4 State Government approval I.4.1 Environmental Planning and Assessment Act 1979 The EP&A Act and the Environmental Planning and Assessment Regulation 2000 (EP&A Regulation) provide the framework for the assessment and approval of proposed developments in NSW. Part 3A projects Part 3A of the EP&A Act consolidates the assessment and approvals process for all major development, which was previously dealt with under Parts 4 and 5 of the Act and that require approval of the Minister for Planning. The Part 3A approval process involves a single assessment and approval regime for all major development, which includes an integrated and streamlined assessment process for all environmental and planning approvals, through preparation of an Environmental Assessment (EA). Section 75B(1) of the EP&A Act states that this part [Part 3A] applies to the carrying out of development that is declared under this section to be a project to which this part applies: (a) by a State environmental planning policy, or (b) by order of the Minister published in the Gazette (including by an order that amends such a policy).. Under Section 75(2) the following kind of development may be declared to be a project to which Part 3A of the EP&A Act applies: (a) major infrastructure or other development that, in the opinion of the Minister, is of State or regional environmental planning significance,
310 Beach Sand Nourishment Scoping Study Maintaining Sydney s Beach Amenity Against Climate Change Sea Level Rise (b) major infrastructure or other development that is an activity for which the proponent is also the determining authority (within the meaning of Part 5) and that, in the opinion of the proponent, would (but for this Part) require an environmental impact statement to be obtained under that Part. Further, Section 75B(3) states that if only part of any development is a project to which this Part applies, the other parts of the development are taken to be a project to which this Part applies. The development is to be dealt with under this Part as a single project. Accordingly, if part of the project is declared to be a project to which Part 3A applies, then the whole project is taken to be a project to which Part 3A applies (Section I.4.2 of this report). Under Section 75D of the EP&A Act, the Minister is the approval authority for Part 3A projects. It is highlighted that, in accordance with Section 75J(3) the Minister cannot approve a project that would be otherwise prohibited under an environmental planning instrument. Clause 8N(1) of the EP&A Regulation states that approval for a project application may not be given under Part 3A for any project, that: (a) is located within an environmentally sensitive area of State significance or a sensitive coastal location, and (b) is prohibited by an environmental planning instrument that would not (because of section 75R of the Act) apply to the project if approved. The proposed sand extraction and beach nourishment is proposed to be carried out in an environmentally sensitive area of State significance. However Section I.4.3 of this report establishes that the proposed beach nourishment is not prohibited and can be approved under Part 3A of the EP&A Act. Part 3A approval process A flow chart showing the steps in the Part 3A approval process is provided in Figure I1. A more detailed approval process for a Part 3A application for the proposed beach nourishment (including sand extraction) is described in the RW Corkery discussion paper (Appendix I) and also reproduced below. The approval process stages that of relevance to the proposed beach nourishment project are described as follows. Stage 1: Confirmation that the Minister for Planning would accept a project application for the proposed marine aggregate extraction (for beach nourishment) as a major project under Part 3A of the Act. Comment: This initial stage is a very important stage as it would provide the enterprise with an opportunity to establish with the Minister for Planning on behalf of the NSW Government what the prevailing Government policy is towards marine aggregate recovery for beach nourishment purposes. Stage 2: Preparation of a Preliminary Environmental Assessment setting out the preliminary concepts for the project and the results of preliminary environmental studies to assist the NSW Government to identify the key issues that should be addressed in an environmental assessment for the project. Comment: This document will provide the basis for discussions with Government agencies and the compilation of the Director-General's requirement for the Environmental Assessment. Stage 3: Detailed studies to identify environmental constraints and design parameters for the project. Comment: An appreciation of the various environmental and operational constraints will assist in the design of a project and identification of design and operational safeguards required to achieve an acceptable level of impact. Stage 4: Preparation of a detailed project design reflecting the environmental constraints identified during Stage 3. Comment: The level of design needs to be sufficient for all potential environmental impacts to be accurately assessed. Stage 5: Detailed environmental assessment involving specific studies to quantify and describe the impacts associated with the detailed project design and reflecting the adoption of the proposed design and operational safeguards. Comment: A wide range of assessments will be required to accurately predict the potential environmental impacts, should the project proceed.
311 Beach Sand Nourishment Scoping Study Maintaining Sydney s Beach Amenity Against Climate Change Sea Level Rise Stage 6: Finalisation of the Environmental Assessment and submission for adequacy. Comment: The Department of Planning requires an Environmental Assessment to be submitted for relevant State Government Agencies to review the document to ensure all key issues nominated in the Director-General s Requirements have been satisfied. Stage 7: The Environmental Assessment would be finalised, if required, to address any deemed inadequacies in the version submitted in Stage 6. Comment: The "final" Environmental Assessment would then be placed on public exhibition and circulated to relevant government agencies for comment. The process beyond the exhibition of the Environmental Assessment will reflect the Minister s assessment of public interest and the views of government agencies. Based on the current legislation, policies and practice, it is envisaged an application for project approval would be referred to a Planning Assessment Commission for an independent assessment of the project for incorporation with the Department s own assessment before being submitted to the Minister for Planning for determination. It is noted that a project approval would need to be granted under the EP&A Act prior to the issue of a mining licence under the OM Act. A fundamental component of the approval process is the initial phase to garnish Government support for off shore sand extraction to nourish Sydney s beaches, in light of the current Government policy to oppose off shore sand extraction (Section I.2.2).
312
313 Beach Sand Nourishment Scoping Study Maintaining Sydney s Beach Amenity Against Climate Change Sea Level Rise Figure I1 Part 3A approval flow chart Request Minister s opinion that Proposal is subject to the provisions of Part 3A Part 3A applies Part 3A does not apply STEP 1 : Preparation of Environmental Assessment Submit project application and preliminary assessment. This should include: v Project description v Project justification v Site / route context v Consider and evaluate alternatives v Consider other approvals required v Outline consultation plan Environmental assessment methodologies v Issue Director General s (DG s) requirements prioritising and focusing on key issues. These will be circulated to relevant Government agencies and posted on the DoP website SEE or EIS under Part 4 of the EP&A Act Hold initial Planning Focus Meeting enabling Government agencies to identify key issues Prepare Environmental Assessment (EA) based upon the DG s requirements. EA to include draft Statement of Commitments (e.g. how potential environmental impact will be managed and mitigated) Statement of Commitment workshop with Applicant Potential for peer review of EA to ensure adequacy of assessment AN INDEPENDENT PANEL ASSESSMENT COULD BE TRIGGERED AT ANY TIME STEP 2 : Exhibition and Consultation Respond to issues and modify the concept design and/or Statement of Commitments Lodgement of the EA with DoP Pre-exhibition review DoP may seek advice from relevant Government agencies to ensure consistency with DG s requirements and that the EA is adequate for exhibition EA placed on exhibition for a minimum of 30 days and submissions invited from public, relevant Government agencies and Stakeholders DG will provide a copy of the submissions or of the issues raised Potential refinement of EA Respond to issues but do not modify the concept design and/or the Statement of Commitments Issue a Preferred Project Report (PPR) including the revised Statement of Commitments if necessary. Note: the PPR will be exhibited for a 30 day period DoP undertake an assessment and prepare a draft assessment report for the DG STEP 3 : Assessment and Determination DG will consult with Government agencies before finalising the assessment report, including reference to the Statement of Commitments Assessment Report submitted to Minister for Planning for determination / Applicant responsibility DoP responsibility
314
315 Beach Sand Nourishment Scoping Study Maintaining Sydney s Beach Amenity Against Climate Change Sea Level Rise I.4.2 State Environmental Planning Policy (Major Development) 2005 State Environmental Planning Policy (Major Development) 2005 (MD SEPP) specifies development to which the development assessment and approval process under Part 3A of the Act applies. The aims of the Major Development SEPP are: (a) to identify development to which the development assessment and approval process under Part 3A of the Act applies. (b) to identify any such development that is a critical infrastructure project for the purposes of Part 3A of the Act. (c) to facilitate the development, redevelopment or protection of important urban, coastal and regional sites of economic, environmental or social significance to the State so as to facilitate the orderly use, development or conservation of those State significant sites for the benefit of the State. (d) to facilitate service delivery outcomes for a range of public services and to provide for the development of major sites for a public purpose or redevelopment of major sites no longer appropriate or suitable for public purposes. (e) to rationalise and clarify the provisions making the Minister the approval authority for development and sites of State significance, and to keep those provisions under review so that the approval process is devolved to councils when State planning objectives have been achieved. Development that is listed in Schedule 1 of MDSEPP requires Ministerial approval under Part 3A of the EP&A Act. The following criteria (Clause 7 of Schedule 1 of MDSEPP) are used to determine whether a project is subject to assessment under Part 3A of the EP&A Act: (1) Development for the purpose of extractive industry that: (a) extracts more than 200,000 tonnes of extractive materials per year, or (b) extracts from a total resource (the subject of the development application (or other relevant application under the Act)) of more than 5 million tonnes, or (c) extracts from an environmentally sensitive area of State significance. (2) Development for the purpose of extractive industry related works (including processing plants, water management systems, or facilities for storage, loading or transporting any construction material or waste material) that: (a) is ancillary to or an extension of another Part 3A project, or (b) has a capital investment value of more than $30 million. Under Clause 3(1) of MD SEPP, environmentally sensitive area of State significance means: (a) coastal waters of the State, or (c) land reserved as an aquatic reserve under the Fisheries Management Act 1994 or as a marine park under the Marine Parks Act The proposed sand extraction component of the project meets the criteria of a Major development as it: will extract more than 200,000 tonnes of material in a single year (during each phase) would extract from a total resource more than 5 million tonnes (over the 50 year program) is proposed to be carried out within the coastal waters of the State. As it is understood the beach nourishment component of the project does not require the construction of any works, the beach nourishment does not strictly meet the criteria for a Major Development under Clause 7(1) or 7(2) of Schedule 1 of MD SEPP. However, as discussed in Section I.4.1 of this report, where part of a project is declared to be a project to which Part 3A of the EP&A Act applies, the related parts are taken to be a project to which Part 3A applies. Accordingly, as the proposed beach nourishment is fundamental component of the project, it would be subject to approval under Part 3A of the EP&A Act together with the proposed off shore sand extraction.
316 Beach Sand Nourishment Scoping Study Maintaining Sydney s Beach Amenity Against Climate Change Sea Level Rise I.4.3 State Environmental Planning Policy (Infrastructure) 2007 General State Environmental Planning Policy (Infrastructure) 2007 (ISEPP) came into effect on 1 January The aim of the ISEPP is to facilitate the effective delivery of infrastructure across the State through increased regulatory certainty and improved efficiency and flexibility in the location of infrastructure and service facilities while providing adequate stakeholder consultation. Clause 8(1) of ISEPP states that where there is an inconsistency between this Policy and any other environmental planning instrument, whether made before or after the commencement of this Policy, this Policy prevails to the extent of the inconsistency. Consequently, ISEPP overrides, to the extent of the inconsistency, all Local Environmental Plans, Regional Environmental Plans and State Environmental Planning Policies, with the exception of: State Environmental Planning Policy No 14 - Coastal Wetlands (SEPP 14); State Environmental Planning Policy No 26 - Littoral Rainforests (SEPP 26); and State Environmental Planning Policy Major Projects 2005 (subsequently renamed State Environmental Planning Policy (Major Development) 2005). Beach nourishment Under Clause 129(1) of Division 25 (Waterway or foreshore management activities) of ISEPP development for the purposes of waterway or foreshore management activities may be carried out by or on behalf of a public authority without consent on any land. Under Division 25, waterway or foreshore management activities means: (a) riparian corridor and bank management, including erosion control, bank stabilisation, resnagging, weed management, revegetation and the creation of foreshore access ways, and (b) instream management or dredging to rehabilitate aquatic habitat or to maintain or restore environmental flows or tidal flows for ecological purposes, and (c) coastal management and beach nourishment, including erosion control, dune or foreshore stabilisation works, headland management, weed management, revegetation activities and foreshore access ways. Under Clause 129(2) waterway or foreshore management activities includes development for any of the following connected purposes: (a) construction works, (b) routine maintenance works, (c) emergency works, including works required as a result of flooding, storms or coastal erosion, (d) environmental management works. I.4.4 Protection of the Environment Operations Act 1997 The Protection of the Environment Operations Act 1997 (POEO Act) relates to pollution management and waste disposal in NSW. The objects of the POEO Act are: To protect, restore and enhance the quality of the environment in New South Wales, having regard to the need to maintain ecologically sustainable development To provide increased opportunities for public involvement and participation in environment protection To ensure that the community has access to relevant and meaningful information about pollution To reduce risks to human health and prevent the degradation of the environment. The POEO Act also established licensing of certain activities which are listed in Schedule 1 of the Act. Waterbased extractive activities that involve the extraction of more than 30,000 cubic metres per year of extractive materials are listed within Schedule 1 and would therefore require an Environment Protection Licence from the Department of Environment, Climate Change and Water to undertake the activity.
317 Beach Sand Nourishment Scoping Study Maintaining Sydney s Beach Amenity Against Climate Change Sea Level Rise I.4.5 Threatened Species Conservation Act 1995 The Threatened Species Conservation Act 1995 (TSC Act) provides for the conservation of threatened species, populations and ecological communities of animals and plants. Section 91 of the TSC Act requires that a license be obtained should a development result in one or more of the following: Harm to any animal that is of, or is part of, a threatened species, population or ecological community The picking of any plant that is of, or is part of, a threatened species, population or ecological community Damage to critical habitat Damage to habitat of a threatened species, population or ecological community. The requirement for a permit under Section 91 of the TSC Act will be determined following completion of a detailed impact assessment. I.4.6 Fisheries Management Act 1994 The objects of the Fisheries Management Act 1994 (FM Act) are to conserve, develop and share the fishery resources of the State for the benefit of present and future generations. In particular, the objects of this Act include: To conserve fish stocks and key fish habitats To conserve threatened species, populations and ecological communities of fish and marine vegetation To promote ecologically sustainable development Including the conservation of biological diversity. A dredging permit would be required under Part 7 of the FM Act. However the Department of Planning will be required to consult with the Department of Primary Industries (Fisheries) with respect to details of dredging and environmental management. A permit to remove seagrass, mangroves and macroalgal habitat may be required under Part 7 of the FM Act should the proposal impact on such habitats. It is likely that compensatory habitat would be required for any losses of seagrass. I.4.7 Other applicable statutory approvals The following Acts may be applicable to the Project: Historic Shipwrecks Act 1976 (Cwth) Navigation Act 1912 (Cwth) Customs Act 1901 (Cwth) Protection of the Sea (Prevention of Pollution from Ships) Act 1983 (Cwth) Telecommunications and Other Legislation Amendment (Protection of Submarine Cables and Other Measures) Act 2005 (Cwth) Mining Act 1992 Mine Health and Safety Act 2004 Coastal Protection Act 1979 Navigation Act 1901 Fisheries Management Act 1994 Marine Pollution Act 1987 Pollution Control Act 1970 Water Act 1912 Maritime Services Act Relevant licences or approvals required under these Acts would need to be obtained as required.
318 Beach Sand Nourishment Scoping Study Maintaining Sydney s Beach Amenity Against Climate Change Sea Level Rise I.4.8 Other Planning instruments State Environmental Planning Policy No 71 Coastal Protection State Environmental Planning Policy No 71 Coastal Protection (SEPP 71) commenced on 1 November As part of acknowledging the increasing development pressure to which the NSW coastline is being subject, the NSW Government announced its $11.7 million Coastal Protection Package in June As part of this package, planning and development within the coastal zone is subject to policies including SEPP 71, the NSW Coastal Policy 1997 and MD SEPP (Section I.4.2). SEPP 71 was formulated to ensure that: Development in the NSW coastal zone is appropriate and suitably located There is a consistent and strategic approach to coastal planning and management There is a clear development assessment framework for the Coastal Zone (Department of Planning, 2006). Pursuant to Clause 7, the matters for consideration documented in Clause 8 are to be taken into account by a consent authority when it determines a development application within the coastal zone. As the proposal would be subject to approval under Part 3A of the EP&A Act, assessment against matters for consideration in Clause 8 is not required. Although not a regulatory requirement, Clause 8 matters for consideration and how they have been considered should be documented in any submission for approval. The matters for consideration are: (a) the aims of [SEPP 71] (b) existing public access to and along the coastal foreshore for pedestrians or persons with a disability should be retained and, where possible, public access to and along the coastal foreshore for pedestrians or persons with a disability should be improved, (c) opportunities to provide new public access to and along the coastal foreshore for pedestrians or persons with a disability, (d) the suitability of development given its type, location and design and its relationship with the surrounding area, (e) any detrimental impact that development may have on the amenity of the coastal foreshore, including any significant overshadowing of the coastal foreshore and any significant loss of views from a public place to the coastal foreshore, (f) the scenic qualities of the New South Wales coast, and means to protect and improve these qualities, (g) measures to conserve animals (within the meaning of the Threatened Species Conservation Act 1995) and plants (within the meaning of that Act), and their habitats, (h) measures to conserve fish (within the meaning of Part 7A of the Fisheries Management Act 1994) and marine vegetation (within the meaning of that Part), and their habitats (i) existing wildlife corridors and the impact of development on these corridors, (j) the likely impact of coastal processes and coastal hazards on development and any likely impacts of development on coastal processes and coastal hazards, (k) measures to reduce the potential for conflict between land-based and water-based coastal activities, (l) measures to protect the cultural places, values, customs, beliefs and traditional knowledge of Aboriginals, (m) likely impacts of development on the water quality of coastal waterbodies, (n) the conservation and preservation of items of heritage, archaeological or historic significance, (o) only in cases in which a council prepares a draft local environmental plan that applies to land to which this Policy applies, the means to encourage compact towns and cities, (p) only in cases in which a development application in relation to proposed development is determined: (i) the cumulative impacts of the proposed development on the environment, and
319 Beach Sand Nourishment Scoping Study Maintaining Sydney s Beach Amenity Against Climate Change Sea Level Rise (ii) measures to ensure that water and energy usage by the proposed development is efficient. NSW Coastal Policy 1997 Also promoted as part of the Governments Coastal Protection Package, the NSW Coastal Policy 1997 addresses key themes including: Population growth in terms of physical locations and absolute limits, Coastal water quality issues, especially in estuaries, Disturbance of acid sulphate soils, Establishing an adequate, comprehensive and representative system of reserves, Better integration of the range of government agencies and community organisations involved in coastal planning and management, Indigenous and European cultural heritage; and integration of the principles of ESD into coastal zone management and decision making. (Department of Planning, 2006). The policy contains nine goals establishing the desired long term goals for outcomes of the policy. Following on from the goals are objectives, which help to achieve the goals. Beyond each objective are strategic actions, which set a context for local and State Government decision and policy making. The long-term goals of the policy are reflected in SEPP 71. I.5 International agreements I.5.1 Migratory bird agreements The Australian Government has entered into three bilateral migratory bird agreements, including: Japan-Australia Migratory Bird Agreement (JAMBA) China-Australia Migratory Bird Agreement (CAMBA) Republic of Korea-Australia Migratory Bird Agreement (ROKAMBA) The JAMBA, CAMBA and ROKAMBA agreements list terrestrial, water and shorebird species which migrate between Australia and the respective countries. The majority of the listed bird species are shorebirds. The bilateral agreements provide an important mechanism for pursuing conservation outcomes for migratory birds, including migratory shorebirds. A number of bird species listed in the bilateral agreements are matters of NES under the EPBC Act and based on initial investigations some birds use Sydney beaches as habitat. In this regard, a detailed ecological assessment may be required to determine whether any matters of NES will be impacted and whether a referral under the EPBC Act is required. I.6 Approvals strategy I.6.1 Approvals process The two key legislative approvals that would be required for recovery (or extraction) of sand from coastal waters for the purposes of beach nourishment are described in the following table: Act Approval Key steps OM Act Licence for offshore sand recovery within NSW coastal waters. To obtain approval to engage in offshore recovery of sand (marine aggregate) the following tasks describe the process. Engage with Department of Primary Industries (Mineral Resources) to confirm approval process and licence requirements. From an initial review of the OM Act and discussions with officers of the Department of Planning and Department of Primary Industries(Mineral Resources) as part of preparing this study, the two alternative
320 Beach Sand Nourishment Scoping Study Maintaining Sydney s Beach Amenity Against Climate Change Sea Level Rise EP&A Act Part 3A planning approval for beach nourishment and associated off shore sand extraction. process are: a) If the area of coastal waters preferred for sand recovery is not affected by a reserved block 1 (i.e. within an existing exploration licence area): The exploration licence holder may apply for a mining licence under Section 198 of OM Act. b) If area of coastal waters preferred for sand recovery is affected by a reserved block declaration (either within or outside existing exploration licence areas): Seek amendment of the reserved block (i.e. offshore mining reserve) affecting the preferred sand recovery site under Section 18 of OM Act to allow sand recovery (Section 12 of OM Act allows Minister to revoke or amend reserved block by notice published in the Gazette). Seek mining licence for recovery of minerals from coastal waters under Part 2.4 of the OM Act. Seeking a mining licence, regardless of approval path under OM Act, would require preparation and gazettal of Offshore Minerals Regulation to support the application for such a licence. This would be undertaken by the NSW Government. Seek confirmation of policy position of NSW Government with respect to offshore sand recovery for beach nourishment purposes. This would constitute initiating the process for consideration of the proposal to recover sand from coastal waters for beach nourishment. Based on the findings of discussions, it is recommended that a briefing paper for Ministerial consumption (if appropriate) that describes and justifies the proposal. This should outline the key approval process steps and would be informed by this study. Simplified Part 3A approval process would comprise the following steps: 1) Seek confirmation from the Minister for Planning that the proposed marine aggregate extraction (for beach nourishment) is major development under Part 3A of the Act. 2) Preparation of a Preliminary Environmental Assessment. 3) Detailed studies to identify environmental constraints and design parameters. 4) Preparation of a detailed project design. 5) Consultation with key stakeholders (government agencies, community groups) and community. 6) Undertake detailed environmental assessment and prepare justification of proposal. 7) Finalisation of the Environmental Assessment. 8) Exhibition and respond to submissions 9) Minister s determination. 1 It is understood from discussions with an officer of the Department of Primary Industries (Mineral Resources) that the entire coast has been declared a reserved block, except those areas already granted an exploration licence Note, it is understood there are no existing mining or retention licences in NSW coastal waters.
321 Beach Sand Nourishment Scoping Study Maintaining Sydney s Beach Amenity Against Climate Change Sea Level Rise I.7 Approval process summary I.7.1 Feasibility Notwithstanding the potential environmental impacts and the need to undertake a comprehensive impact assessment (Section 11), the above process indicates that there is a feasible approval pathway for the proposed beach nourishment and sand extraction project under the OM Act and the EP&A Act. I.7.2 Government support Critical success factors It is likely the approval process will be complex and will involve a wide range of stakeholders. To avoid unreasonable delays or assessment requirements, it will be vital to seek government support at the outset of the project. In particular, it is recommended to seek support from the Minister for Planning and the Minister for Mineral Resources as key approval authorities as well as the Minister for Environment and Climate Change with respect to determining environmental assessment requirements. Robust approvals Key factors to the success of the approval process(es) are: Robust approval Due to the potential for opposition to the project (based on current Government policy and community opposition to past offshore sand extraction proposals 2 ) it is important that the approval process be appropriate to minimise risk of third party challenge/appeal on procedural grounds. It is possible that third party appeals may occur on merit grounds, for which the risk can be minimised (but not eliminated) through comprehensive impact assessments using best practice methodologies. Flexibility Within the approval flexibility is important to enable nourishment and extraction activities to respond to the coastal conditions that warrant beach nourishment. Adequate certainty Ability to act upon the approval granted at the outset of the project for future stages when the need is triggered, which is important for the long term viability of the project. It is understood offshore extraction will only be undertaken to provide the necessary material for beach nourishment and no stockpiling will occur. Accordingly the conditions that trigger the need for beach nourishment and extraction will require careful consideration as part of the application for planning approval. Consultation Due to the need for political support for the proposed offshore mineral extraction and the potentially controversial nature of the project in the wider community, it is recommended that a comprehensive Engagement Strategy be prepared to guide all discussions with stakeholders and the public. This strategy would: Describe key stages in the approval process and assign communication and engagement protocols for achieving desired outcomes Guide timing and nature of project information that is released to the stakeholders and the community, to coincide with approval process(es) and formulating project design/methodologies 2 Metromix Pty Ltd (1993) and Goldfields Pty Ltd (early 1980s).
322
323 Appendix J EA Communications
324

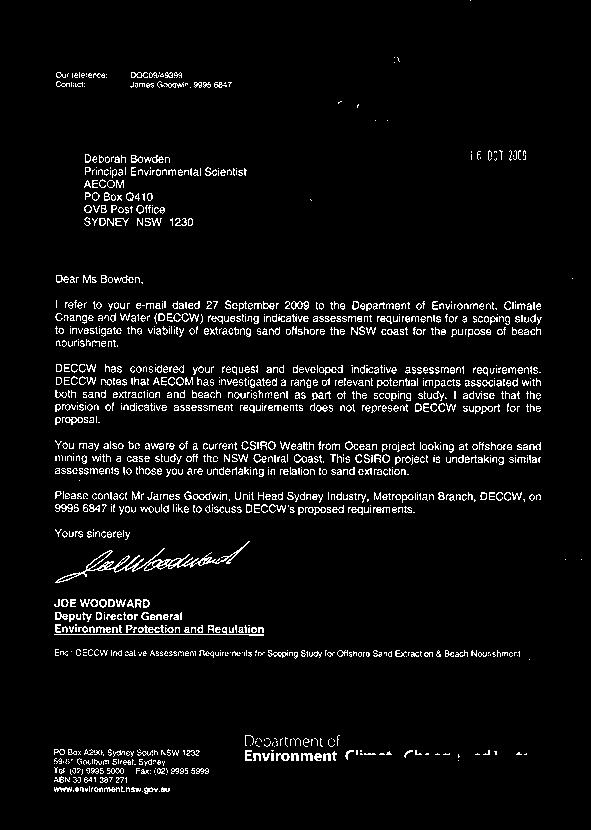
325
326
327
328

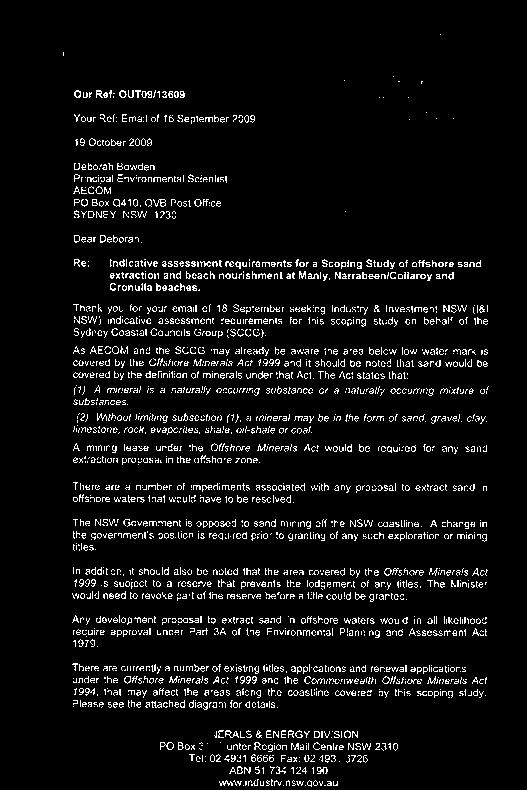
329
330
331
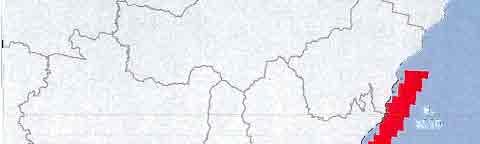
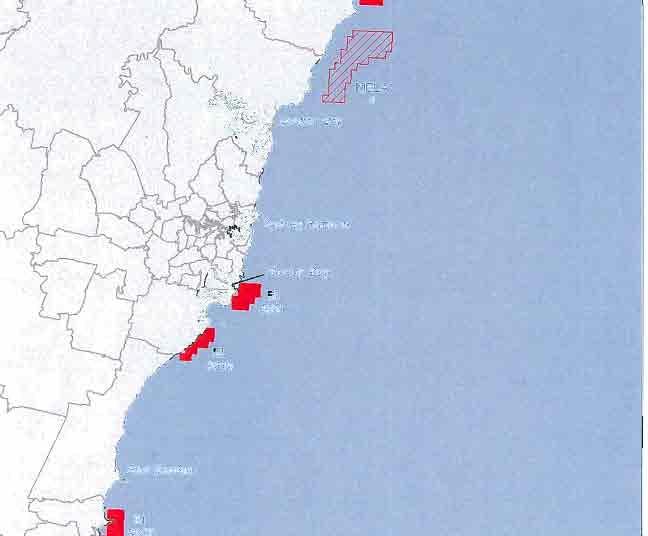
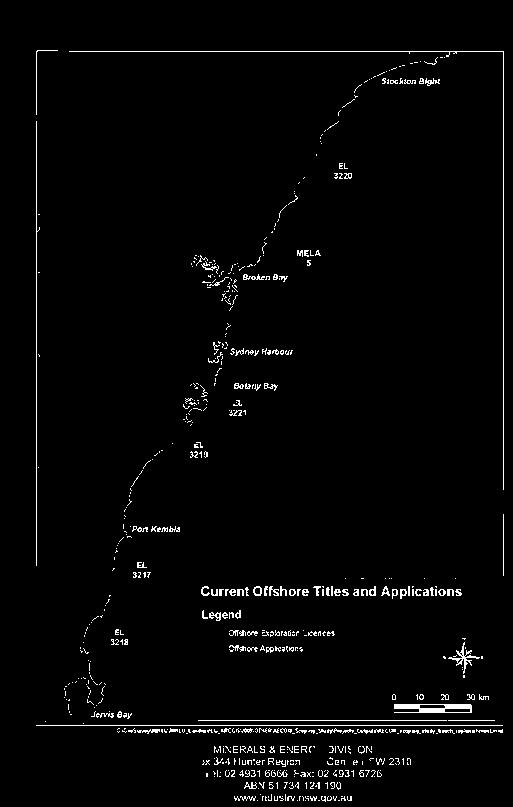
332

333
Australian Coastal Councils Conference
 Australian Coastal Councils Conference Kiama March 2019 Where Has My Beach Gone? (and what can I do about it?) Dr Andrew McCowan Water Technology Where Has My Beach Gone? Where Has My Beach Gone? Where
PUBLIC EXHIBITION OF COASTAL ZONE MANAGEMENT PLAN FOR COLLAROY-NARRABEEN BEACH AND FISHERMANS BEACH
 ITEM 8.3 REPORTING MANAGER TRIM FILE REF 2014/110936 ATTACHMENTS PUBLIC EXHIBITION OF COASTAL ZONE MANAGEMENT PLAN FOR COLLAROY-NARRABEEN BEACH AND FISHERMANS BEACH GROUP MANAGER NATURAL ENVIRONMENT 1
Environmental Protection on the Gold Coast of Queensland, Australia. 1. What is the appeal of the Gold Coast to tourists?
 Environmental Protection on the Gold Coast of Queensland, Australia Sections 1. What is the appeal of the Gold Coast to tourists? 2. How are Gold Coast visitor trends changing? 3. How can the impacts of
Quantifying the Value of Sydney s Beaches
 Quantifying the Value of Sydney s Beaches Dave Anning Economics, Management & the Coastal Zone Forum 24 February 2011 Sydney Beaches Valuation Project Collaboration between UNSW and SCCG Value case study
NORTHERN CELL OPTIONS SHORTLIST RECOMMENDATIONS
 OPTIONS SHORTLIST RECOMMENDATIONS Coastal Unit C: Bayview Options recommended for MCDA scoring. Status quo. Planting 3. Renourishment (gravel) 6. Beach-scraping 7. Restore shingle crest. Inundation accommodation
April 7, Prepared for: The Caribbean Disaster Emergency Response Agency Prepared by: CEAC Solutions Co. Ltd.
 April 7, 2006 Prepared for: The Caribbean Disaster Emergency Response Agency Prepared by: Introduction CEAC Solutions Co. Ltd was commissioned in May 2005 to prepare coastal beach erosion hazard maps for
# Post Consultation and Submissions Resource Consent Conditions for Surfing Impact Mitigation August 2016
 # Post Consultation and Submissions Resource Consent Conditions for Surfing Impact Mitigation August 2016 Surf Mitigation Management Plan 1 1 Not less than 6 months prior to the commencement of the construction
Impacts of breakwaters and training walls
 Across the eastern seaboard of Australia, breakwaters and training walls have instigated fundamental perturbations to coastal and estuary processes. This has induced long-term changes to foreshore alignments,
Inlet Management Study for Pass-A-Grille and Bunces Pass, Pinellas County, Florida
 Inlet Management Study for Pass-A-Grille and Bunces Pass, Pinellas County, Florida Final Report Submitted By Ping Wang, Ph.D., Jun Cheng Ph.D., Zachary Westfall, and Mathieu Vallee Coastal Research Laboratory
Report to COUNCIL for decision
 17 152 Title: Section: Prepared by: Olympic Pool Business Case Community & Recreation Andrew White (Community & Recreation Manager) Meeting Date: 18 May 2017 Legal Financial Significance = Medium Report
WHALE SHARK (Rhincodon typus) RECOVERY PLAN
 RECOVERY PLAN") WHALE SHARK (Rhincodon typus) RECOVERY PLAN 2004-2009 Great Barrier Reef Marine Park Authority Background The whale shark (Rhincodon typus) is the world s largest fish, and one of only 3 filter-feeding
WHALE SHARK (Rhincodon typus) RECOVERY PLAN 2004-2009 Great Barrier Reef Marine Park Authority Background The whale shark (Rhincodon typus) is the world s largest fish, and one of only 3 filter-feeding
AGGREGATE DREDGING AND THE MARINE ENVIRONMENT
 AGGREGATE DREDGING AND THE MARINE ENVIRONMENT The marine Aggregate Levy Sustainability Fund ( marine ALSF ) programme represents one of the most substantial investments in UK marine research. The research
SHOREHAM BEACH LOCAL NATURE RESERVE
 SHOREHAM BEACH LOCAL NATURE RESERVE Coastal Geography Education Programme 2014-15 S. Savage 2014 COASTAL GEOGRAPHY OPPORTUNITIES Shoreham Beach Shoreham Beach is a shingle spit formed over many centuries
Implications of changes to El Niño Southern Oscillation for coastal vulnerability in NSW
 Implications of changes to El Niño Southern Oscillation for coastal vulnerability in NSW By Thomas Mortlock (Thomas.mortlock@mq.edu.au) El Niño Southern Oscillation (ENSO) has a strong impact on weather
Draft Coastal Zone Management Plan for Byron Shire Coastline
 Byron Shire Council Draft Coastal Zone Management Plan for Byron Shire Coastline 26 November 2010 #1030842 Presentation Outline o o o o o o o Brief Byron Shire erosion history What is a CZMP? Why Develop
SELECTION OF THE PREFERRED MANAGEMENT OPTION FOR STOCKTON BEACH APPLICATION OF 2D COASTAL PROCESSES MODELLING
 SELECTION OF THE PREFERRED MANAGEMENT OPTION FOR STOCKTON BEACH APPLICATION OF 2D COASTAL PROCESSES MODELLING C Allery 1 1 DHI Water and Environment, Sydney, NSW Abstract This paper presents an approach
EXISTING AND PLANNED STRATEGIES AND ACTIONS CONNECTED WITH COASTAL PROTECTION IN ASPECT OF PREDICTED SEA LEVEL RISE
 EXISTING AND PLANNED STRATEGIES AND ACTIONS CONNECTED WITH COASTAL PROTECTION IN ASPECT OF PREDICTED SEA LEVEL RISE Andrzej Cieślak Long term coastal protection strategy In 2000 a new 1 Polish long term
CHAPTER 8 ASSESSMENT OF COASTAL VULNERABILITY INDEX
 124 CHAPTER 8 ASSESSMENT OF COASTAL VULNERABILITY INDEX 8.1 INTRODUCTION In order to assess the vulnerability of the shoreline considered under this study against the changing environmental conditions,
Coastal and marine recreation in New England is ingrained in the region s economic and
 RECREATION Coastal and marine recreation in New England is ingrained in the region s economic and social fabric. Recreation on the ocean and coast includes many of New Englanders most time-honored and
ST LEONARDS COASTAL HAZARD VULNERABILITY ASSESSMENT
 Level 12, 333 Collins Street Melbourne VIC 3000 Australia Telephone: +61 3 8676 3500 Facsimile: +61 3 8676 3505 www.worleyparsons.com WorleyParsons Services Pty Ltd ABN 61 001 279 812 23 November 2011
Beach profile surveys and morphological change, Otago Harbour entrance to Karitane May 2014 to June 2015
 Beach profile surveys and morphological change, Otago Harbour entrance to Karitane May 2014 to June 2015 Prepared for Port Otago Ltd Martin Single September 2015 Shore Processes and Management Ltd Contact
Chapter 10 Lecture Outline. The Restless Oceans
 Chapter 10 Lecture Outline The Restless Oceans Focus Question 10.1 How does the Coriolis effect influence ocean currents? The Ocean s Surface Circulation Ocean currents Masses of water that flow from one
Town of Duck, North Carolina
 Tracking No. 00.00.2010 Erosion Mitigation And Shoreline Management Feasibility Study Town of Duck, North Carolina Coastal Planning & Engineering of North Carolina August 15, 2012 Tom Jarrett Robert Neal
The Maritime Law Association of Australia and New Zealand
 The Maritime Law Association of Australia and New Zealand Protecting the Environment and Promoting Safe Navigation: Australia s System of Pilotage in the Torres Strait Adam McCarthy Assistant Secretary
HURRICANE SANDY LIMITED REEVALUATION REPORT UNION BEACH, NEW JERSEY DRAFT ENGINEERING APPENDIX SUB APPENDIX D SBEACH MODELING
 HURRICANE SANDY LIMITED REEVALUATION REPORT UNION BEACH, NEW JERSEY DRAFT ENGINEERING APPENDIX SUB APPENDIX D SBEACH MODELING Rev. 18 Feb 2015 1 SBEACH Modeling 1.0 Introduction Following the methodology
DUNE STABILIZATION AND BEACH EROSION
 DUNE STABILIZATION AND BEACH EROSION CAPE HATTERAS NATIONAL SEASHORE NORTH CAROLINA ROBERT DOLAN PAUL GODFREY U. S. DEPARTMENT OF INTERIOR NATIONAL PARK SERVICE OFFICE OF NATURAL SCIENCE WASHINGTON, D.
MINE SAFETY TARGETED ASSESSMENT PROGRAM. Ground or strata failure NSW metalliferous mines. April
 MINE SAFETY TARGETED ASSESSMENT PROGRAM Ground or strata failure NSW metalliferous mines April 2017 www.resourcesandenergy.nsw.gov.au Document control Publication title: Ground or strata failure NSW metalliferous
VENICE LOCAL COASTAL PROGRAM UPDATE: COASTAL HAZARDS WELCOME
 VENICE LOCAL COASTAL PROGRAM UPDATE: COASTAL HAZARDS WELCOME 1 Introducing the Team Hosted by the Department of City Planning and grant funded in part by the California Coastal Commission 2 Workshop Purpose
To: William Woods, Jenni Austin Job No: CentrePort Harbour Deepening Project - Comments on community queries
 Memo To: William Woods, Jenni Austin From: Richard Reinen-Hamill Date: Subject: cc: 1 Purpose This memo sets out our response to issues raised at and after Seatoun community consultation sessions held
INTRODUCTION TO COASTAL ENGINEERING
 The University of the West Indies Organization of American States PROFESSIONAL DEVELOPMENT PROGRAMME: COASTAL INFRASTRUCTURE DESIGN, CONSTRUCTION AND MAINTENANCE A COURSE IN COASTAL DEFENSE SYSTEMS I CHAPTER
TECHNICAL NOTE THROUGH KERBSIDE LANE UTILISATION AT SIGNALISED INTERSECTIONS
 TECHNICAL NOTE THROUGH KERBSIDE LANE UTILISATION AT SIGNALISED INTERSECTIONS Authors: Randhir Karma NDip: Eng (Civil) B. Tech Eng (Civil) M Eng (Hons) (Transportation) Auckland Traffic Service Group Manager
LAB: WHERE S THE BEACH
 Name: LAB: WHERE S THE BEACH Introduction When you build a sandcastle on the beach, you don't expect it to last forever. You spread out your towel to sunbathe, but you know you can't stay in the same spot
Lecture Outlines PowerPoint. Chapter 15 Earth Science, 12e Tarbuck/Lutgens
 Lecture Outlines PowerPoint Chapter 15 Earth Science, 12e Tarbuck/Lutgens 2009 Pearson Prentice Hall This work is protected by United States copyright laws and is provided solely for the use of instructors
Ocean Beaches Strategy Version 1.0 August 2013
 Ocean Beaches Strategy 2013 2023 Version 1.0 August 2013 Contents Foreword 3 Introduction 5 Executive Summary 7 Strategy Background 9 Gold Coast City 9 Background 9 Current Services to the community 10
Overview. Beach Features. Coastal Regions. Other Beach Profile Features. CHAPTER 10 The Coast: Beaches and Shoreline Processes.
 Overview CHAPTER 10 The Coast: Beaches and Shoreline Processes Coastal regions constantly change. The beach is a dominant coastal feature. Wave activity continually modifies the beach and coastal areas.
Draft Greater Sydney Region Plan
 Powered by TCPDF (www.tcpdf.org) Draft Greater Sydney Region Plan Submission_id: 31452 Date of Lodgment: 15 Dec 2017 Origin of Submission: Online Organisation name: UNSW Sydney Organisation type: Other
Essentials of Oceanography Eleventh Edition
 Chapter Chapter 1 10 Clickers Lecture Essentials of Oceanography Eleventh Edition The Coast: Beaches and Shoreline Processes Alan P. Trujillo Harold V. Thurman Chapter Overview Coastal regions have distinct
14 NOISE AND VIBRATION
 14 NOISE AND VIBRATION 14.1 EXISTING ENVIRONMENT 14.1.1 The noise environment within Poole Harbour is generally characterised by low to medium noise levels depending on location. For example, certain areas
Case Study 3. Case Study 3: Cebu Island, Philippines MPA Network 10
 Case studies of mpa networks Case Study 3: Cebu Island, Philippines MPA Network 10 Location and background Cebu Island in the Philippines lies in the center of the Visayan Islands, known as an area high
North Shore of Long Island, Feasibility Study
 North Shore of Long Island, Asharoken New York Asharoken, Feasibility Study Asharoken, NY Public Meeting June 30, 2015 US Army Corps of Engineers US Army Corps of Engineers New York BUILDING STRONG BUILDING
Transportation Master Plan Advisory Task Force
 Transportation Master Plan Advisory Task Force Network Alternatives & Phasing Strategy February 2016 BACKGROUND Table of Contents BACKGROUND Purpose & Introduction 2 Linking the TMP to Key Council Approved
Re: Disposal of Maintenance Dredge Material and Impacts on Surfing Breaks and Coastal Processes.
 ecoast Marine Consulting and Research PO Box 151 Raglan, New Zealand. Ph. +64 21 423 224 www.ecoast.co.nz info@ecoast.co.nz 25 August 2015 Reuben Fraser Consents Manager Bay of Plenty Regional Council
GERALDTON NORTHERN BEACHES STABILISATION PROGRAMME (NBSP)
") GERALDTON NORTHERN BEACHES STABILISATION PROGRAMME (NBSP) J:Executive/Documents/Document 2006/A1150606/File No: 073-04-01 25/08/06 Page 1 of 12 Geraldton Port Authority Northern Beaches Stabilisation Programme
GERALDTON NORTHERN BEACHES STABILISATION PROGRAMME (NBSP) J:Executive/Documents/Document 2006/A1150606/File No: 073-04-01 25/08/06 Page 1 of 12 Geraldton Port Authority Northern Beaches Stabilisation Programme
The Sand Beaches of New Hampshire and Maine
 The Sand Beaches of New Hampshire and Maine Beach Preservation and Erosion Control Photographs provided by Joe Kelly and Steve Adams Cover photo: Reid State Park, ME Introduction The sand beaches of New
Surf Survey Summary Report
 Port Otago Limited 15 Beach Street Port Chalmers Surf Survey Summary Report August 13-September 1 Leigh McKenzie Summary of Surf Locations of Interest Port Otago Ltd is undertaking monitoring of changes
COUPLED MANAGEMENT STRATEGY LAKE CATHIE ESTUARY & COAST
 Lake Cathie Progress Association Inc. ABN 28 251 433 854 P.O. Box 247 Lake Cathie NSW 2445 PHONE/FAX: 02 6584 8211 EMAIL: r3packag@bigpond.com 20 th October 2009 Port Macquarie Hastings Council PO Box
INTRODUCTION SEAS AND OCEANS: A PRECIOUS RESOURCE KEY FACTS
 6 ~ SEAS FOR LIFE INTRODUCTION SEAS AND OCEANS: A PRECIOUS RESOURCE We all benefit from our seas and oceans. In addition to the more traditional uses like transport, fishing, aquaculture, tourism and recreation,
Pre Feasibility Study Report Citiwater Cleveland Bay Purification Plant
 SOLAR POWER SPECIALISTS.Pure Power ACN 074 127 718 ABN 85 074 127 718 POWER MAGIC PTY LTD 245 INGHAM RD GARBUTT QLD 4814 Phone: 1800 068 977 Fax: 07 4725 2479 Email: FNQSOLAR@bigpond.com Pre Feasibility
SA New Trial Artificial Reef Project
 BACKGROUND PAPER SA New Trial Artificial Reef Project Development of options for the trial artificial reef 1. Summary CONTENTS Each year, an estimated 236,000 South Australians participate in recreational
Thank you for the opportunity to comment on the Draft Freshwater Fisheries Management Plan on behalf of Victoria s recreational fishing sector.
 Anthony Forster Inland Fisheries Manager Victorian Fisheries Authority By email: Anthony.Forster@vfa.vic.gov.au DRAFT FRESHWATER FISHERIES MANAGEMENT PLAN Dear Anthony, Thank you for the opportunity to
SURGE SUPPRESSION ACHIEVED BY DIFFERENT COASTAL SPINE (IKE DIKE) ALIGNMENTS. Bruce A. Ebersole, Thomas W. Richardson and Robert W.
 ALIGNMENTS. Bruce A. Ebersole, Thomas W. Richardson and Robert W.") SURGE SUPPRESSION ACHIEVED BY DIFFERENT COASTAL SPINE (IKE DIKE) ALIGNMENTS Abstract Bruce A. Ebersole, Thomas W. Richardson and Robert W. Whalin, Jackson State University, Jackson, Mississippi The primary
SURGE SUPPRESSION ACHIEVED BY DIFFERENT COASTAL SPINE (IKE DIKE) ALIGNMENTS Abstract Bruce A. Ebersole, Thomas W. Richardson and Robert W. Whalin, Jackson State University, Jackson, Mississippi The primary
TRAFF IC CALMING POLICY
 TRAFF IC CALMING POLICY Policy No: 45396 Approved by Council 28 May 2008 C11/05/08 Further amendment by Council 22 June 2011 vide c08/06/11 Contents 1 Problem Statement 1 2 Desired Outcomes 2 3 Strategic
Broad Beach Sand & Dune Habitat Restoration Project. Revetment Owners Meeting July 12, 2017
 Broad Beach Sand & Dune Habitat Restoration Project Revetment Owners Meeting July 12, 2017 Status of Project Entitlement Coastal Commission CDP approved 10/15 (consolidated with City of Malibu), PTI conditions
Submission on summary of the Draft Convention on Biological Diversity National Report
 23 November 2018 Submission on summary of the Draft Convention on Biological Diversity National Report The New Zealand Marine Sciences Society (NZMSS) is a professional society affiliated to the Royal
Shoreline Management Planning A Gold Coast Journey
 Shoreline Management Planning A Gold Coast Journey Queensland Coastal Conference 2011 Ancient Knowledge Contemporary Innovation Wednesday 19 Friday 21 October 2011 THE PULLMAN REEF HOTEL, CAIRNS Kim Bowra
Oceans and Coasts. Chapter 18
 Oceans and Coasts Chapter 18 Exploring the oceans The ocean floor Sediments thicken and the age of the seafloor increases from ridge to shore The continental shelf off the northeast United States Constituent
University of Victoria Campus Cycling Plan Terms of Reference. 1.0 Project Description
 University of Victoria Campus Cycling Plan Terms of Reference 1.0 Project Description The Campus Cycling Plan, a first for the University, will provide a comprehensive and coordinated approach to support
THE INEVITABLE RIPPLE 2ND OF APRIL TSUNAMI
 THE INEVITABLE RIPPLE 2ND OF APRIL TSUNAMI Structure Background Preparedness for 2nd of April Response Operations 2nd of April Lessons learnt Future work Hawaii 1957 Background Approx 250,000 people live
Chapter - Oceans and Coasts
 Chapter - Oceans and Coasts Discussion: What do oceans contribute to the environment of Earth? How do Earth s major systems relate to the oceans? Oceans and Coasts Oceans are important - Thermal regulation
The Dynamic Coast. Right Place Resources. A presentation about the interaction between the dynamic coast and people
 The Dynamic Coast Houses threatened by coastal erosion in California Right Place Resources A presentation about the interaction between the dynamic coast and people For the rest of the presentations in
Montserrat. Wise practices for coping with. i b bea n Se a
 Wise practices for coping with Montserrat Car i b bea n Se a Fisheries Division, Montserrat Physical Planning Department, Montserrat University of Puerto Rico, Sea Grant College Program Caribbean Development
NCCOE EA Coastal Adaptation Guidelines. Section I Emerging Technology Novel Alternative Approaches to Coastal Erosion
 NCCOE EA Coastal Adaptation Guidelines Section I Emerging Technology Novel Alternative Approaches to Coastal Erosion Alessio Mariani, Doug Lord, Tony Webb James Carley, Matt Blacka, Brett Miller Ian Turner,
Marine Renewables Industry Association. Marine Renewables Industry: Requirements for Oceanographic Measurements, Data Processing and Modelling
 Marine Renewables Industry Association Marine Renewables Industry: Requirements for Oceanographic Measurements, Data Processing and Modelling October 2009 Table of Contents 1. Introduction... 1 2. Measurements
Chapter. The Dynamic Ocean
 Chapter The Dynamic Ocean An ocean current is the mass of ocean water that flows from one place to another. 16.1 The Composition of Seawater Surface Circulation Surface Currents Surface currents are movements
Beach Profiles. Topics. Module 9b Beach Profiles and Crossshore Sediment Transport 3/23/2016. CE A676 Coastal Engineering
 Beach Profiles AND CROSS-SHORE TRANSPORT Orson P. Smith, PE, Ph.D., Professor Emeritus Topics Features of beach and nearshore profiles Equilibrium profiles Cross-shore transport References Text (Sorensen)
APLC/MSP.16/2017/WP.1
 Meeting of the States Parties to the Convention on the Prohibition of the Use, Stockpiling, Production and Transfer of Anti-Personnel Mines and on Their Destruction APLC/MSP.16/2017/WP.1 28 November 2017
PAEKĀKĀRIKI HILL ROAD / BEACH ROAD / SH1 INTERSECTION PROGRESS REPORT
 Chairperson and Committee Members ENVIRONMENT AND COMMUNITY DEVELOPMENT COMMITTEE 6 DECEMBER 2011 Meeting Status: Public Purpose of Report: For Decision PAEKĀKĀRIKI HILL ROAD / BEACH ROAD / SH1 INTERSECTION
Request Number IR1-12: Flow Passage. Information Request
 Request Number IR1-12: Flow Passage Information Request Provide additional information about the 100 metre flow passage channel scenario between the Westshore Terminals and the proposed Project terminal
SACO RIVER AND CAMP ELLIS BEACH SACO, MAINE SECTION 111 SHORE DAMAGE MITIGATION PROJECT APPENDIX F ECONOMIC ASSESSMENT
 SACO RIVER AND CAMP ELLIS BEACH SACO, MAINE SECTION 111 SHORE DAMAGE MITIGATION PROJECT APPENDIX F ECONOMIC ASSESSMENT Department of the Army New England District, Corps of Engineers 696 Virginia Road
Monitoring beach usage on Gold Coast beaches: Is it beneficial?
 Monitoring beach usage on Gold Coast beaches: Is it beneficial? Peta Williams 1, Gervase Tuxworth 2 and Chris Lane 2 1 Griffith Centre for Coastal Management (GCCM) Gold Coast Campus, Griffith University
Coastal Inundation. An Overview for TCDC
 Coastal Inundation An Overview for TCDC Rick Liefting Team Leader Regional Hazards and Environmental Compliance Integrated Catchment Management Waikato Regional Council Photo: Sugar Loaf Wharf, Coromandel.
Appendix E Mangaone Stream at Ratanui Hydrological Gauging Station Influence of IPO on Stream Flow
 NZ Transport Agency Peka Peka to North Ōtaki Expressway Hydraulic Investigations for Expressway Crossing of Mangaone Stream and Floodplain Appendix E Mangaone Stream at Ratanui Hydrological Gauging Station
Coastal management has lagged behind the growth in population leading to problems with pollution
 Fifty percent of the population of the industrialized world lives within 100 km of a coast. Coastal management has lagged behind the growth in population leading to problems with pollution and natural
Inspection of Clarence City Beaches following Winter 2011 Storm Events
 18 July 2011 WRL Ref: WRL10086TDS L20110718 Messrs P Watson & I Preece Clarence City Council PO Box 96 Rosny Park TAS 7018 By email: pwatson@ccc.tas.gov.au ipreece@ccc.tas.gov.au Dear Phil/Ian, Inspection
GD 0043/18 ACTIVE TRAVEL STRATEGY
 GD 0043/18 ACTIVE TRAVEL STRATEGY 2018-2021 May 2018 Minister s Introduction There is strong evidence that regular physical activity reduces the risk of a range of health conditions. The best way to increase
Climate Change Risks for Victoria s Surf Coast
 Climate Change Risks for Victoria s Surf Coast Craig A, Clifton 1, Dan Ware 1, Simon Coverdale 2 and Chloe Hanson-Boyd 1 1 Sinclair Knight Merz, Melbourne, AUSTRALIA. email: cclifton@globalskm.com 2 Great
CROSS-SHORE SEDIMENT PROCESSES
 The University of the West Indies Organization of American States PROFESSIONAL DEVELOPMENT PROGRAMME: COASTAL INFRASTRUCTURE DESIGN, CONSTRUCTION AND MAINTENANCE A COURSE IN COASTAL DEFENSE SYSTEMS I CHAPTER
Volume and Shoreline Changes along Pinellas County Beaches during Tropical Storm Debby
 Volume and Shoreline Changes along Pinellas County Beaches during Tropical Storm Debby Ping Wang and Tiffany M. Roberts Coastal Research Laboratory University of South Florida July 24, 2012 Introduction
Sea Level Rise in South Florida: Causes, Consequences and Opportunities
 Sea Level Rise in South Florida: Causes, Consequences and Opportunities Dr. Todd A. Crowl Director, Institute of Water & the Environment Director, Southeast Environmental Research Center Co-Founder, Sea
Effectiveness of Beach Nourishment in Response to Sea Level Rise
 2014 FSBPA Annual Conference Effectiveness of Beach Nourishment in Response to Sea Level Rise Navarre Beach Santa Rosa County July 18, 2005 Lovers Key Lee County April 23, 2012 South County St. Lucie County
March Maidstone Integrated Transport Strategy Boxley Parish Council Briefing Note. Context. Author: Parish Clerk 2 March 2016
 Context. Author: Parish Clerk 2 The Draft Integrated Transport Policy (DITS) sets out a vision and objectives, and identifies a detailed programme of interventions to support the Maidstone Borough Local
Wave-dominated embayed beaches. Andrew D Short School of Geosciences University of Sydney
 Wave-dominated embayed beaches Andrew D Short School of Geosciences University of Sydney Wave-dominated embayed beaches wave-dominated beaches embayed beaches morphodynamics of W-D embayed beaches circulation,
Beach Nourishment Impact on Beach Safety and Surfing in the North Reach of Brevard County, Florida
 Beach Nourishment Impact on Beach Safety and Surfing in the North Reach of Brevard County, Florida Prepared by John Hearin, Ph.D. Coastal Engineering Vice Chairman Cocoa Beach Chapter Port Canaveral Patrick
Longshore sediment transport
 and Orson P. Smith, PE, Ph.D., Professor Emeritus Longshore transport Waves breaking at an angle to shore Sediment under breakers lifted by saltation Drops back to sea bed a little down drift Swash (runup)
Appendix N(b): Portishead Station Outline Travel Plan
: Portishead Station Outline Travel Plan") Portishead Branch Lane (MetroWest Phase 1): Environment Impact Assessment Appendix N(b): Portishead Station Outline Travel Plan Prepared for West of England Councils September 2017 1 The Square Temple
Portishead Branch Lane (MetroWest Phase 1): Environment Impact Assessment Appendix N(b): Portishead Station Outline Travel Plan Prepared for West of England Councils September 2017 1 The Square Temple
OECS Regional Engineering Workshop September 29 October 3, 2014
 B E A C H E S. M A R I N A S. D E S I G N. C O N S T R U C T I O N. OECS Regional Engineering Workshop September 29 October 3, 2014 Coastal Erosion and Sea Defense: Introduction to Coastal Dynamics David
Shorelines Earth - Chapter 20 Stan Hatfield Southwestern Illinois College
 Shorelines Earth - Chapter 20 Stan Hatfield Southwestern Illinois College The Shoreline A Dynamic Interface The shoreline is a dynamic interface (common boundary) among air, land, and the ocean. The shoreline
4/20/17. #31 - Coastal Erosion. Coastal Erosion - Overview
 Writing Assignment Due Monday by 11:59 pm #31 - Coastal Erosion Beach front property! Great View! Buy now at a great price! See main class web pages for detailed instructions Essays will be submitted in
Best Practice Guidance for Assessing the Financial Performance of Fishing Gear: Industry-led gear trials
 Best Practice Guidance for Assessing the Financial Performance of Fishing Gear: Industry-led gear trials Prepared for The UK Fisheries Economic Network (UKFEN) by Seafish Introduction and Background Reducing
Implications of proposed Whanganui Port and lower Whanganui River dredging
 PO Box 637 Wanganui 4540 Attention: Rowan McGregor Dear Rowan 1 Summary We understand that it has been proposed to bring large vessels into the Port at Whanganui requiring the excavation of a channel up
Pacific Pilotage Authority. submission to the. Canada Transportation Act Review Panel. January 2015
 Pacific Pilotage Authority submission to the Canada Transportation Act Review Panel January 2015 This submission is respectfully submitted to the Canada Transportation Act Review Panel by the Pacific Pilotage
TRANSPORTATION NEEDS ASSESSMENT
 TRANSPORTATION NEEDS ASSESSMENT A travel demand analysis was carried out to determine the operational issues and the potential benefit that adding traffic capacity would have on the road network. All the
Part 9 Specific Land Uses - Foreshore & Waterway Development
 7 FORESHORE AND WATERWAY DEVELOPMENT This section applies to the following development uses proposed within the foreshore area (defined by LM LEP 2014), and contains Council s specific requirements for
Shoreline Change in Response to Sea Level Rise on Florida s Panhandle Coast. Jim Houston `
 Shoreline Change in Response to Sea Level Rise on Florida s Panhandle Coast Jim Houston james.r.houston @usace.army.mil ` Approach Calculate historical shoreline change by county (1867-2015) Determine
Chesil Beach, Dorset UK High energy, shingle coastline. Brighton Beach, Sussex UK Pebble beach
 Beaches: Depositional landform Extends from the highest high tide to the lowest low tide. Very important temporary store in coastal system. Accretion: sediment returning to the visible portion of a beach
Wave Prediction in the Santa Barbara Channel
 Wave Prediction in the Santa Barbara Channel OCS Study MMS 2001-055 Final Technical Summary Final Study Report U.S. Department of the Interior Minerals Management Service Pacific OCS Region Wave Prediction
INTERNATIONAL DECADE OF OCEAN SCIENCE FOR SUSTAINABLE DEVELOPMENT ( ) OUTLINE
 OUTLINE") 39th Session, Paris, 2017 39 C 39 C/52 19 October 2017 Original: English Item 4.13 of the provisional agenda INTERNATIONAL DECADE OF OCEAN SCIENCE FOR SUSTAINABLE DEVELOPMENT (2021-2030) OUTLINE Source:
39th Session, Paris, 2017 39 C 39 C/52 19 October 2017 Original: English Item 4.13 of the provisional agenda INTERNATIONAL DECADE OF OCEAN SCIENCE FOR SUSTAINABLE DEVELOPMENT (2021-2030) OUTLINE Source:
Salmon Five Point Approach restoring salmon in England
 Salmon Five Point Approach restoring salmon in England Our Mission To restore the abundance, diversity and resilience of salmon stocks throughout England We will do this by:- a) Maximising the production
Geology of the Hawaiian Islands
 Geology of the Hawaiian Islands Class 24 8 April 2004 Any Questions? Rise and fall of sea level and its effect on Hawai`i Sea level Has fluctuated up and down many times in the geologic past Evidence?
Moving beyond BACI: What do to when science and reality clash in marine reserve monitoring? Workshop Held: June 10 th, 2015
 Moving beyond BACI: What do to when science and reality clash in marine reserve monitoring? Workshop Held: June 10 th, 2015 Challenges have arisen when implementing a BACI (Before-After-Control-Impact)