The Richard Stockton College of New Jersey Coastal Research Center
|
|
|
- Abel Price
- 6 years ago
- Views:
Transcription


1 The Richard Stockton College of New Jersey Coastal Research Center New Jersey Beach Profile Network 20-Year Report On Shoreline Changes In New Jersey Raritan Bay to Delaware Bay Prepared for: New Jersey Department of Environmental Protection Division of Construction and Engineering 1510 Hooper Avenue Toms River, New Jersey Prepared by: Dr. Stewart C. Farrell Steven Hafner Crist Robine Mark Finley Brent Howard Dan Barone Robert Koch Eileen Linzner March 21, 2008
2 BLANK PAGE
3 TABLE OF CONTENTS Executive Summary ii Acknowledgements 1 Introduction 1 Shore Protection in the State of New Jersey 1 Storm Vulnerability Assessment of New Jersey Figure , 20-, and 50-Year Storm Beach-Dune Erosion Susceptibility for Surf City, NJ. 5 NJ Beach Profile Network Methodology 6 Figure 2. NJBPN Methodology 8 Figure 3. Beach Nourishment Project Areas, 1989 Through Monmouth County Figure 4. Monmouth County Station Locations 11 How to Interpret the Data 12 Figures Year Trend Graphics for Station Locations, Sites Summary of Monmouth County 118 Summary Illustrations 1 & Table Year Beach Volume Changes, Master Table 123 Table Year Shoreline Changes, Master Table 124 Ocean County Figure 73. Ocean County Station Locations 126 How to Interpret the Data 127 Figure Year Trend Graphics for Station Locations, Sites Summary of Ocean County 209 Summary Illustrations 3 & Table Year Beach Volume Changes, Master Table 213 Table Year Shoreline Changes, Master Table 214 Atlantic County Figure 128. Atlantic County Station Locations 216 How to Interpret the Data 217 Figure Year Trend Graphics for Station Locations, Sites Summary of Atlantic County 245 Summary Illustrations 5 & Table Year Beach Volume Changes, Master Table 249 Table Year Shoreline Changes, Master Table 250 Cape May County Figure 147. Cape May County Station Locations 252 How to Interpret the Data 253 Figure Year Trend Graphics for Station Locations, Sites Summary of Cape May County 341 Summary Illustrations 7 & Table Year Beach Volume Changes, Master Table 345 Table Year Shoreline Changes, Master Table 346 Glossary of Coastal Terms 347 Bibliography 349 i
4 BLANK PAGE

5 EXECUTIVE SUMMARY In 1986 the New Jersey Department of Environmental Protection (NJDEP) authorized the formation of the New Jersey Beach Profile Network (NJBPN). This report summarizes the two decades of changes to each of the four coastal counties in New Jersey with the goal to provide a document that gives a thorough overview with enough detail that the reader can understand the nature and trends seen since These observations on beach changes along the New Jersey coastline provide a means to determine both rapid seasonal changes and follow long-term trends in shoreline position or beach volume. The 100 sites extend from the lower Raritan Bay, along the four-oceanfront county shorelines and into Delaware Bay along the western shoreline of Cape May County. Previous reports focused on the recent changes as told by the last four surveys at each of the 100 locations. The graphics and text displayed and discussed the seasonal and year to year changes observed since the previous report. This pattern of data presentation is followed on the website as well To celebrate twenty years of research, the CRC has generated graphics intended to focus attention on the trends detected in beach sand volume and shoreline position. These trends are then grouped into averages for each county to show rather dramatically the impact of three significant causes for change. The enormous positive impact of beach nourishment over the past 15 years. The beneficial results of the low incidence of serious storm events impacting the NJ coast. The enhanced shoreline protection benefits of 20 years of dune growth in height and width. Far and away the most impressive change seen along the NJ shoreline has been the construction of the New York District Corps of Engineers Monmouth County Storm Protection Project. Twenty one miles of beaches had between 210 and 350 cubic yards of sand pumped from offshore sources onto each foot of beachfront. The cost of $210,000,000 was spread between 1994 and 2000 with only one renourishment completed in 2002 along the Sea Bright region, to address local erosional hot spots. The entire Monmouth County shoreline was not completed due to real estate and access issues arising from private ownership of the beach between Elberon, Deal and Allenhurst. The CRC program followed sand movement within and from the project beaches and has determined that the vast majority of the sand (over 17,000,000 cubic yards) remain in place as of the fall of Losses were documented at the ends of the project where sand moved north into the Sandy Hook National Seashore; south from the southern end of Long Branch, but little sand left Asbury Park to the north into Allenhurst or Deal. Manasquan Inlet dredging frequency and volume increased substantially due to the huge increase in sand volume present north of the inlet, but the dredged material is returned to the Manasquan shoreline as a matter of best practice. The research has shattered the shrill advance condemnation of this project as doomed to see the sand disappear within six months and require nearly constant pumping to be successful. In stark contrast, the Ocean County shoreline remained reasonably stable without the vast influx of beach replenishment sands, mostly due to the lack of severe storms since December There was only one ii
6 sizable beach restoration project undertaken in the county until the 2007 Surf City Federal project started on Long Beach Island. The State-sponsored fill in Harvey Cedars placed 465,000 cubic yards of sand trucked to the beach in 1994 and Too small a scale project to produce other than temporary improvement, the compiled data shows that the county beaches did conclude the interval with an increase in sand volume, but little advance in the shoreline position. The major exception was the change associated with the reconstruction of the south Barnegat Inlet jetty between 1988 and 1991 where immediately south of the jetty, the shoreline advanced over 2,400 feet seaward and all the sand surrounding the inlet ebb-tidal delta moved into an dry beach fillet tapering to the south to a point beyond the municipal limits of Barnegat Light Borough on Long Beach Island. Multiple beach restoration efforts in Cape May and Atlantic Counties show sizable impacts in shoreline advances and sand volume improvements in both counties. Projects were completed in the municipalities of Brigantine, Atlantic City, Ventnor, Ocean City, Strathmere, Avalon, Stone Harbor and Cape May City extending south including the Cape May Meadows and the Borough of Cape May Point. Each project had a Federal (65%), State (26.25%), and a local (8.75%) financial component that provided a tremendous fiscal advantage to each local municipality in leveraging their local tax funding of large scale beach restoration projects. The 1985 and 2001 Strathmere beach projects were State and locally sponsored on a 75% State 25% local funding basis. Avalon, Brigantine, Atlantic City, and Stone Harbor have conducted State local beach projects prior to the Federal sponsorship during the past two decades. Sea Isle City cooperated with the State to nourish the local beach three times since The upsurge in real estate related issues has plagued both the Absecon Island and the Long Beach Island projects and is causing problems for the Northern Ocean County effort as well. The problem revolves around private ownership of the beach to the high tide line conflicting with the use of public funds to benefit private land without gaining public access to the beach built with public money. The refusal by many beachfront lot owners to grant access easements to the State and ACOE in perpetuity to manage the project and perform maintenance is the heart of the conflict. This conflict between some property owners and the public agencies must be solved before these projects can move forward. Suggestions have varied but have reached to the level of the State moving to condemn all private holdings seaward of the primary dune toe and declare all lands seaward of the seaward dune toe to be forever public. The rising resistance by Congress to fund large-scale shore protection efforts by the ACOE further complicates the drive to gain 100% coverage for the developed NJ shoreline under Federal project supervision. The Cape May Point 227 experimental project assessed the performance of reef structures in preventing sand loss offshore along Cape May Point. The project compares the 6-foot high Beachsaver concrete units with the standardized Double Tee concrete parking garage floor-beam units, which are only about 30 inches tall. Both types of reef structures reduced erosion and consist of the only such ACOE project under the 227 program taken to construction and four years of performance monitoring. The reef modules were placed on the sea floor about 200 feet seaward of the low tide line and extend between rock groins spaced about 700 feet apart. Sand was pumped onto the beach in 2004 and monitored to determine residence time contrasted to that for sand placed in a similar groin cell without structures across the seafloor between them. The results appear to support this closed system retention of significant quantities of sand fill on the beach. The fall 2005 hurricane season was one to remember for the Gulf coast as Hurricanes Katrina and Rita demolished entire resort shorelines for several blocks inland. Hurricane Wilma crossed the State of Florida and damaged both coasts. Fortunately the storms missed the Mid-Atlantic coastline, but 28 named tropical depressions, 15 hurricanes and 4 category five events made 2005 the most active Atlantic basin storm season in history and the most expensive in terms of damages (100 billion dollars and 2,280 deaths). After the last hurricane faded to a tropical depression (Tropical Storm Zeta, Jan. 6, 2006), the iii
7 northeast storm season failed to develop any significant coastal storms sparing the Mid-Atlantic coast further damage following the mid-october events discussed above. In spite of top research organizations prediction for severe subsequent hurricane seasons, the past two years have seen no serious damage to the US coastline and many fewer named storms in 2006 and As a matter of fact the past six months (to the end of October 2007) have been the absolute calmest in wind and wave intensity in many years. However, Katrina and Rita vividly demonstrated that for a coastal community to survive these catastrophic events they must be well prepared in advance for the possibility of severe events occurring during any given year. Beach nourishment projects remain the most efficient and effective means available to enhance the dune and beach system to resist storm damage and protect our oceanfront public infrastructure and private properties while ensuring the recreational use of our national shoreline treasures for future generations.
8 ACKNOWLEDGEMENTS This research was funded by the State of New Jersey Department of Environmental Protection, Division of Construction and Engineering under the Shore Protection legislation authorizing the stable funding of coastal projects (NJ PL 93 Chap 155). This is the final report under contract # INTRODUCTION: The New Jersey Beach Profile Network (NJBPN) provides local and regional information on coastal zone changes and is designed to document storm-related damage assessments to the New Jersey shoreline. This report is focused on long-term trends at sites to develop statistically meaningful information for State and local coastal zone managers. The database consists of 100 locations between Raritan Bay (three sites in the lower bay), the Atlantic Ocean coastline, and Delaware Bay (four sites on the western shoreline of Cape May County). Each site has been visited annually in the fall since Semiannual visits, each spring and fall, began in 1994 following the passage of the bill establishing the New Jersey shore protection funding through the NJ real estate transfer tax. The program was expanded to take surveys every spring following the winter northeasters and in the fall following the summer beach accretion. In addition, new sites were established in the gaps of coverage and adjacent tidal inlet shorelines. Information collected consists of photographs of the beach/dune system at each site, a topographic profile of the dune, beach and seafloor to a minimum depth of 12 feet, and field notes on significant geologic change in progress. Any construction activity is noted and necessary information regarding quantity and duration of such activity is gathered. The field data is used to generate graphical cross section plots, which compare profiles across the width of the active coastal zone. The cross section is also used to calculate sand volume and shoreline position changes. Analysis may be performed for any selection of survey dates at any site across a specifically defined section of the profile. This report is the latest in a series of annual reports prepared for the New Jersey Department of Environmental Protection (NJDEP) that began in The geomorphology of the New Jersey coastline was defined by Nordstrom, 1977 and has been used to divide the State s coastline into five distinct zones with different characteristics. The variation is most dramatic between the bluff where the upland surface ends at the beach as a cliff in the older sedimentary deposits and the barrier spits or islands. The bays and lagoons are found to the south of Bay Head, NJ where the bluff disappears and the older sedimentary upland surface is submerged below the deposits and waters of the Barnegat Bay lagoon. There are two long sand spits attached at the north end of the bluff (Sandy Hook) and at Bay Head, extending south to Barnegat Inlet. Tidal inlets occur about every 10 miles and number 11 from Shark River to Cold Springs Inlet. Finally, a shore segment of uplands bluff is exposed at Cape May Point where the Cape May County peninsula extends into Delaware Bay. A detailed discussion on the geologic changes and the present-day emergence of the New Jersey coastal plain and coastline has been included for a number of years in previous reports. This information is still found on the website devoted to the New Jersey Beach Profile Network data generated by the Richard Stockton Coastal Research Center (CRC) (page 5, 2002-report). SHORE PROTECTION IN THE STATE OF NEW JERSEY: New Jersey is considered the most developed and densely populated shoreline in the country, but out of a 130-mile distance between Sandy Hook and Cape May Point, there are 31.2 miles of shoreline with no human development between the salt marshes and the sea. The Sandy Hook National
9 Seashore was established on the northern spit in Monmouth County, long used for military defense of New York harbor. Continuous development extends from Sea Bright south to Seaside Park in Ocean County. The 10.5-mile Island Beach State Park provides a nearly pristine coastal environment utilized in ever increasing recreational and eco-tourist activities. Long Beach Island has the Holgate unit of the Forsythe National Wildlife Refuge at its southern tip as part of a 10.8-mile gap in development consisting of Holgate, Little Beach Island and the northern part of Brigantine Island. Shorter segments of undeveloped protected shoreline exist on Pecks Beach Strathmere (Corson s Inlet State Park), the Two-Mile Beach Unit; Cape May National Wildlife Refuge, and the Cape May Meadows in Cape May County. Seventy six percent of the coast is developed, with abundant public and private land use activities of great economic value to the State and its citizens. Shore protection is the science and strategy of devising methods, structures, and practices that together, promote the art of living safely within a geologically unstable environment with the constant threat of storm damage. Made of unconsolidated sediments, the New Jersey coastal zone is not able to resist alteration by waves, tides and storms that move sediment from place to place. The total absence of bedrock along the shoreline means that all the oceanfront is vulnerable to be removed and re-deposited elsewhere over relatively short periods of time. Protection has involved a host of structural solutions beginning with timber bulkheads and piles of brush contained inside a double row of cedar pilings (early groins). During the 20 th Century truck transportation of large rocks added to the ability of placing large armor stone along erosional shorelines. Concrete came into play to create seawalls and other structures. Finally, the development of large-scale methodology for moving millions of cubic yards of sand from areas of surplus at inlets or offshore to eroded beaches created the beach replenishment industry. Between 1990 and 2006 over a half billion Federal, State and local dollars were expended at over 50% of the developed shoreline placing 10 s of millions of cubic yards of sand on beaches between Sandy Hook and Cape May Point. 37 years of State regulation of the coastal zone has produced a large volume of policy designed to guide and safeguard development especially along the inlet and oceanfront shorelines. Implemented by the Land Use Regulation Program (LURP) within the New Jersey Department of Environmental Protection (NJDEP), the shore protection aspect of the regulation has focused on building design, setbacks from the shoreline and the creation of a wider beach with a storm resistant dune system built between the development and the beach. Policies in the form of rules govern the density, proximity and type of development permitted at various points where the changing environment and human construction come in conflict. As the Federal/State and local municipal beach restoration program emerged in the late 1980 s, the wider beaches created by bringing in new sand have reduced storm damage to public and private property. The first reaches completed under the Federal program were Cape May City and northern Ocean City to 34 th Street, NJ. Ocean City was completed in the summer of 1992 following the October 31, 1991 northeast storm which did over $4,000,000 in damage just to the municipal boardwalk and other public infrastructure along the shoreline. In December 1992 an equally intense event produced another Federal disaster declaration for New Jersey, but damage to the Ocean City oceanfront infrastructure was negligible. In Cape May City there was one minor area of overwash into the community at the very northern oceanfront street intersection. Following the two early 1990 s northeast storms, the State Division of Engineering and Construction reviewed the damage history and looked for ways to accelerate the Federal Shore Protection Program
10 for other New Jersey beaches. In 1994 the NJ legislature established the Shore Protection Stable Funding Act that initially provided $15 million dollars annually for the specific purpose of conducting shore protection projects along the coastline. The policy was to provide 75% of the project cost with State funds, with the local contribution equal to 25% of the project. Following consultation with the New Jersey Shore Partnership, local coastal public officials, coastal consultants, public and private, the decision was made to use the Stable Funding Act revenue to provide much of the required 35% local partner(s) matching funds to obtain Federal assistance. With the Federal Government paying 65% of the project cost, the State/local funds became tremendous financial leverage to proceed with far larger efforts than could be undertaken by the State and municipal entities alone. The State and its municipal governments began the process of lobbying the Congress for authorization of Shore Protection work along the New Jersey shoreline. The US Army Corps of Engineers (ACOE) is the Federal agency charged with initiating, planning, designing, and carrying out the construction of these projects. By far the largest co-sponsored project was the Monmouth County Shore Protection Project covering 21 miles of shoreline between the Sandy Hook National Seashore and Manasquan Inlet. The New York District is the division of the ACOE responsible for Monmouth County. All ACOE projects have three distinct phases required to take a project from concept to construction, the effort has proceeded to get started on nearly every shoreline reach in the State. The first step is a Congressional authorization directing the ACOE to undertake a Reconnaissance Study of the selected shoreline to determine the nature and magnitude of the erosion or storm damage threat and recommend moving to the Feasibility Study phase. Federal funds cover the reconnaissance study, with the State matching funds required for the Feasibility Study that follows. That study is conducted by the ACOE and is focused on providing engineering, geo-technical, environmental, and economic answers to the questions raised by the reconnaissance study. In order to proceed to the next step the Feasibility Report must (among other things) show a cost to benefit ratio greater than 1.25 to obtain Congressional project authorization. The Planning and Engineering Design phase is where the actual project is laid out and cost documentation with predicted benefits to the region is formulated into a sizable document that will be used to generate a funding request from Congress to go to construction. Finally, after approval and signature at Department of the Army in Washington DC, the project is authorized and funded by Congress to go to the construction phase. Most of the effort is expended in lobbying Congress, pursuing the goals of the project and seeing that the State is on-board with the project design in order to proceed from reconnaissance to construction in less than 8 years. Projects were initiated in rapid succession for nearly all developed shoreline sections in the State. The political activism did move the Monmouth County, Absecon Island, Seven-Mile Island and Brigantine Island projects to construction following the initial success of the Cape May City and Ocean City projects. Work is completed or near complete on the studies for all other reaches in the State. Construction funding authorization from Congress has become increasingly difficult. As the need for beach maintenance has increased, the willingness of the Congress to fund these projects has decreased with multiple attempts to return the burden of funding back to the States and local communities. Coastal communities and economies are clearly important to New Jersey s prosperity and quality of life, but they are vulnerable to devastating affects from northeast storms and hurricanes. This was demonstrated during the 2004 hurricane season in Florida. This threat came to pass again along the Gulf Coast in While the next two hurricane seasons failed to match 2005, the prediction is for a continuation of a year long trend of enhanced activity in the Atlantic basin that began in This increasing trend in storm activity coincides with a decreasing trend in Federal funding for shore protection and beach nourishment. Funding for the 2006 budget proposal is 32% lower than was proposed for 2005, and nearly 50% lower than was proposed for Responsibility for protecting and maintaining the coast is incrementally
11 shifting to the State and municipal governments. The 2007 budget contained the least amount of Federal dollars authorized for the Corps to spend on coastal construction projects in some time. Congressional conflict with the President over Iraq policy and spending has resulted in no FY2008 budget for the US government as of mid-october STORM VULNERABILITY ASSESSMENT OF THE NJ COASTLINE: The CRC began to focus on just how susceptible the New Jersey coastal communities were to storm damage triggered by an upsurge in intense hurricane activity beginning in The 2005 season saw extreme damage from dune breaching and overwash during four Gulf Coast storms. The next two seasons failed to match the levels seen in 2004 and 2005 to every forecaster s surprise, but the potential for severe events along the eastern seaboard of the US has not diminished. Research revealed an initial attempt at quantifying the damage potential from coastal barrier erosion (Williams & Johnson, 1995) where the national shorelines were categorized as Stable, Moderately Eroding or Severely Eroding. The northeast portion of the US was shown as a color scheme with New Jersey depicted as severely eroding along all but the Atlantic County shoreline. In a 2001 USGS report, which took the analysis of the southern Atlantic shoreline up a level to evaluate the relative elevations of the primary dune along the coast with illustration of decreased vulnerability to overwash and breaching based on an increase in dune elevation, the relative storm damage vulnerability was indicated by colors of increasing relative potential for damage due to overwash. In 2002 the CRC commenced development of a storm vulnerability assessment for the New Jersey shoreline based on new technology called LIDAR. LIDAR is a laser light pulse sent from an aircraft to the ground and detected as a reflection from the ground and converted to an elevation based on GPS determination of the plane s position and elevation and the time for the light to reach the ground and return to the plane s detection system. Digital elevation data with points from about every square foot on the ground form a swath along the shoreline from the existing swash line back landward of the dunes. Water penetration is imperfect, but is under development and sub-aqueous data is improving. An initial 2002 project evaluated the relative effectiveness of a stretch of Long Beach Island dunes in Holgate to storm damage based on width, elevation, seaward slope, and vegetation density. The Holgate shoreline was subdivided using each oceanfront property s width. Each resulting segment of dune was categorized into five classes of increasing ability to resist breaching. In 2004, the Borough of Mantoloking requested that the CRC evaluate the community dune system and add to the model the impact of multiple storms defined by Federal Emergency Management Agency (FEMA) into probability of occurrence between a 2-year event up to 100-year storm intensity. Each storm s defined parameters of wave height, storm surge elevation, storm duration and wave run-up calculations were entered into the ACOE computer program called S-Beach. This one-dimensional model uses the LIDAR data and offshore NJBPN data to provide the existing dune/beach topographic conditions for the test to see if the shoreline can withstand the erosional recession in the beach/dune caused by a particular intensity storm event. If the dune crest is reached by the storm-generated recession it is said to have been compromised and the determination is made that dune failure occurs and overwash into the community begins. This assessment was extended to all of the Northern Ocean County shoreline by 2006 and showed the ease of breaching produced by just a 10-year storm event in some cases. Figure 1 below shows the relative impact of three FEMA storm events superimposed on the Surf City shoreline for the 10-, 20-, and 50-year storm events. The left image shows the storm potentials prior to the 2006 Federal shore protection project and the right image show the dune breaching potential


12 following the project s completion. The 2005-dated LIDAR and 2002 digital aerial photography were combined with beach profiles taken prior to the project and following it in early Blue and green colors indicate dunes that resisted the storm surge with yellow representing up to 50% sand loss to the dune crest. 90% erosion to the dune crest is shown in dark orange. Red indicates dune failure. Figure , 20-, and 50-Year Storm Beach-Dune Erosion Susceptibility for Surf City, NJ. 5 5
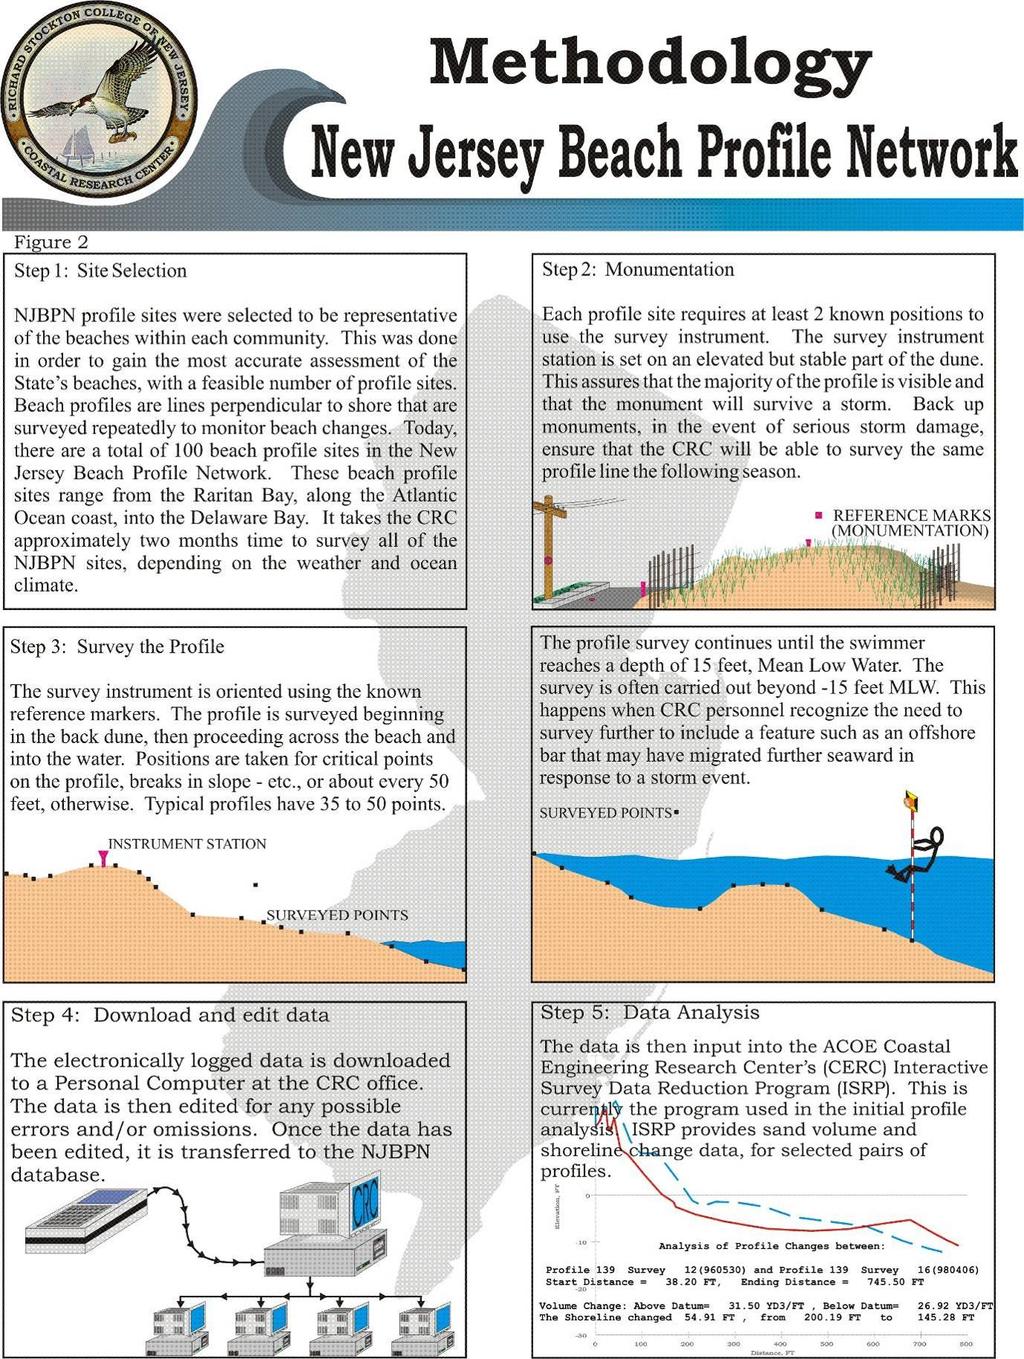
13 This data clearly demonstrates the ability of the methodology to discriminate among dune segments along the shoreline (based on 250-foot intervals), but dramatically shows the improvement to the storm protection afforded by the Federal project to this community. No impact is observed from the 10-year storm event while prior to the project this event breached in two places and took 90% of the dune to the crest at most places. The breaching became nearly universal with the 50-year storm event, but failed to take more than 50% of the sand between the seaward dune toe and the crest following the project. This data includes pre-construction surveys obtained using the 2005 LIDAR data, field measurements of dune height, width and slopes, plus a set of post-construction profiles across the completed project done by CRC personnel. NJ BEACH PROFILE NETWORK (NJBPN) METHODOLOGY: The monitoring program performed by the Richard Stockton College of New Jersey Coastal Research Center (CRC) monitors shoreline and beachface conditions twice a year. This data aids NJDEP regulatory and planning personnel in the following ways: Determining areas of potential erosion problems. Implementing policies to protect beaches, dunes, overwash fans and erosion hazard areas (EHA), as well as reducing risks to development in these high hazard areas. Facilitating assessment of disaster impacts following future storm events. Providing useful background information, when evaluating LURP permit applications. Providing evidence on dune development at any site. Assisting local municipal governments in developing policies or plans for dealing with coastal erosion or improving storm preparedness. Beach survey stations were chosen based on the following criteria: Each location represented typical community beach conditions. Each shoreline community would have at least one site. Where possible, sites utilized positions with prior survey data. Control profiles were sited on State or County undeveloped beaches. Presently there are 100 sites that must be profiled after the winter storm season has ended in spring. The second annual survey occurs before the summer beach accretion is removed by the increasing frequency of storms that occur in the fall and winter. The CRC crew uses a Sokkia Set-530-R Electronic Total Station, which transfers the data to an SDR-33 Electronic Field Book. The unit is initialized with position coordinates, the elevation for two known locations, transit height, and target height. Environmental factors such as temperature and atmospheric pressure, and unit columniation errors are entered. Field personnel equipped with an optical prism mounted to a range pole traverse the dunes, beach, shoreface, and continue into the water up to a depth of feet NGVD29. The prism pole height can be changed between data points as necessary. The data is stored in the SDR-33 Electronic Field Book then downloaded at the office into a personal computer. A beach profile typically consists of 35 to 55 individual data points (Figure 2). The survey information is edited, checked against field notes and sent to a database for use and storage. The profile plots and computations have been performed using ISRP27 a survey reduction program designed by the Coastal Engineering Research Center (CERC) of the ACOE. A new program called BMAP (Beach Morphology Analysis Package, v.2.0) is being used to format the survey data. Also designed by CERC, this program is windows compatible and has more versatile data
14 presentation capabilities. The computation of the sand volume change between any two surveys can be set to run in several ways. These unit volumes are given in cubic yards of sand per foot of beachfront (yds 3 /ft). These unit volumes are typically valid for up to 1000 feet north or south of any of the profile sites along the beachfront or to any groin/jetty structure. Structures invalidate the calculation because of their sand collecting or starving effect. The profiles were located as close to the center of any groin cell as possible to limit this impact on sand quantity and beach configuration. Electronic reports are available for 1998 and 2000 through the present, including a special 15-year review of select profiles that date back to 1986, which is included as part of the 2000 report. The electronic reports are available on-line to the public at the Coastal Research Center s web page, which is hosted by the Richard Stockton College s web site. They are provided in both web page (html) and Adobe Acrobat (PDF) format. Visiting the Richard Stockton College web site and clicking on the Community & Visitors menu item to access the New Jersey Beach Profile Network link can reach the Coastal Research Center web page. The site can also be accessed directly by visiting
15
16 Beach Nourishment in New Jersey: (Information provided by ACOE New York & Philadelphia Districts and local entities.) The oceanfront coast of New Jersey has received large scale Shore Protection projects cosponsored by the State and the Federal US Army Corps of Engineers. Sandy Hook receives sand carried by littoral currents from the beaches in Sea Bright, nourished by the ACOE as well as direct placement north of the end of the Sea Bright seawall. The Sandy Hook to Manasquan Inlet Shore Protection Project was completed by the ACOE New York District and has placed 21 million cubic yards of sand, to date. The Ocean County shoreline is mostly in the Planning and Engineering Design phase of study by the Philadelphia District, with Long Beach Island commencing construction in Surf City in spite of continuing real estate issues. Both Brigantine and Absecon Islands were completed in 2006 and The ACOE maintains the Great Egg Harbor to Corson s Inlet (Peck Beach) project area (Ocean City), placing over 9.9 million cubic yards thus far. Cape May City (1989), Avalon and Stone Harbor (2002), are complete. The District also is sponsoring two Ecosystem Restoration/Shore Protection projects in southern Cape May County as well as an experimental 227 project to evaluate wave barrier systems in Cape May Point. Beach nourishment provides both storm protection for public and private infrastructure and builds a recreational area, the latter supporting New Jersey s 21 billion dollar coastal tourist economy that creates 260,000 jobs annually. Figure 3 MIDDLESEX Sandy Hook 114,000 cy emergency authorized in 2001 MERCER MONMOUTH Sandy Hook to Manasquan Inlet Shore Protection Project (NY Dist. ACOE - initial construction 1994 to 2001 with Sea Bright maintenance in 2002) BURLINGTON OCEAN Manasquan Inlet to Barnegat Inlet Shore Protection Project - (Phil. Dist. ACOE - Planning and Engineering Design Phase with funding issues and real estate easement problems slowing progress) GLOUCESTER CAMDEN SALEM CUMBERLAND ATLANTIC Long Beach Island - Philadelphia District Construction commenced in 2006, but funding shortfalls and private property issues are hampering work. Absecon Island, Phase I completed 2004; Brigantine done in Atlantic Ocean Delaware Bay Cape May Environmental projects stalled w/o funding CAPE MAY Great Egg Harbor, Peck Beach, Ocean City Beachfill (ACOE 1992 and multiple maintenance efforts following) Corson s Inlet to Townsend s Inlet project in PED phase Townsend s Inlet to Hereford Inlet (Avalon & Stone Harbor) Beach Nourishment Project. Initial Construction started Cape May Point 227 Project in performance monitoring phase. Cape May City Beachfill (ACOE 1989) In Maintenance phase with multiple fills - Cape May Meadows fill completed in 2005.
New Jersey Coastal Zone Overview. The New Jersey Beach Profile Network (NJBPN) 3 Dimensional Assessments. Quantifying Shoreline Migration
 3 Dimensional Assessments. Quantifying Shoreline Migration") New Jersey Coastal Zone Overview The New Jersey Beach Profile Network (NJBPN) Objectives Profile Locations Data Collection Analyzing NJBPN Data Examples 3 Dimensional Assessments Methodology Examples Quantifying
New Jersey Coastal Zone Overview The New Jersey Beach Profile Network (NJBPN) Objectives Profile Locations Data Collection Analyzing NJBPN Data Examples 3 Dimensional Assessments Methodology Examples Quantifying
UPPER BEACH REPLENISHMENT PROJECT RELATED
 ASSESSMENT OF SAND VOLUME LOSS at the TOWNSHIP of UPPER BEACH REPLENISHMENT PROJECT RELATED to the LANDFALL OF HURRICANE SANDY - PURSUANT TO NJ-DR 4086 This assessment is in response to Hurricane Sandy
New Jersey Beach Profile Network Atlantic County Profile Site Locations
 215 RICHARD STOCKTON COLLEGE OF NEW JERSEY New Jersey Beach Profile Network Atlantic County Profile Site Locations COASTAL RESEARCH CENTER Figure 128 There are nine NJBPN survey sites on the Atlantic County
Figure79. Location map for the 10 NJBPN profile sites in Atlantic County, NJ 155
 154 Figure79. Location map for the 10 NJBPN profile sites in Atlantic County, NJ 155 ATLANTIC COUNTY SPRING 2009 to FALL 2010 The Atlantic County coastline consists of three barrier islands. Between Little
ATLANTIC COUNTY 2006 to 2008
 ATLANTIC COUNTY 2006 to 2008 The Atlantic County oceanfront shoreline consists of three barrier islands where the northern one, Little Beach Island and a third of the second, Brigantine Island, are undeveloped
23- Year Sand Volume Changes at Site 132, 15th Street, Brigantine
 149 Figure75. Location map for the 9 NJBPN profile sites in Atlantic County, NJ ATLANTIC COUNTY SPRING 2008 to FALL 2009 150 The Atlantic County oceanfront shoreline consists of three barrier islands.
Figure 262. Location map for the 10 NJBPN profile sites in Atlantic County, NJ 279
 278 Figure 262. Location map for the 10 NJBPN profile sites in Atlantic County, NJ 279 ATLANTIC COUNTY SUMMARY The Atlantic County coastline consists of three barrier islands. The island of Little Beach
Figure 38. Locations of the 28 NJBPN profile stations in Ocean County, NJ.
 55 Figure 38. Locations of the 28 NJBPN profile stations in Ocean County, NJ. 56 Individual Site Descriptions: Northern Ocean County recovered its beaches approaching pre-hurricane Sandy elevation or width,
SPECIAL SPRING 2018 STORM REPORT ON THE CONDITION OF THE MUNICIPAL BEACHES FOR THE BOROUGH OF STONE HARBOR, CAPE MAY COUNTY, NEW JERSEY
 SPECIAL SPRING 2018 STORM REPORT ON THE CONDITION OF THE MUNICIPAL BEACHES FOR THE BOROUGH OF STONE HARBOR, CAPE MAY COUNTY, NEW JERSEY Aerial photograph taken April 21, 2018 showing the view up the beach
RE: Hurricane Matthew Beach Damage Assessment and Recommendations [CSE 2416]
![RE: Hurricane Matthew Beach Damage Assessment and Recommendations [CSE 2416]](/thumbs/83/87675702.jpg "RE: Hurricane Matthew Beach Damage Assessment and Recommendations [CSE 2416]") October 25, 2016 Iris Hill Town Administrator Town of Edisto Beach 2414 Murray St Edisto Beach SC 29438 RE: Hurricane Matthew Beach Damage Assessment and Recommendations [CSE 2416] Dear Iris, Hurricane
October 25, 2016 Iris Hill Town Administrator Town of Edisto Beach 2414 Murray St Edisto Beach SC 29438 RE: Hurricane Matthew Beach Damage Assessment and Recommendations [CSE 2416] Dear Iris, Hurricane
The Stockton University Coastal
 Hurricane Sandy: Beach-dune recovery at New Jersey Beach Profile Network (NJBPN) sites By Kimberly K. McKenna 1, Stewart C. Farrell 1, and Jeffrey A. Gebert 2 1 Stockton University Coastal Research Center
A REVIEW OF THE CONDITION OF THE MUNICIPAL BEACHES AS A RESULT OF HURRICANE SANDY IN THE BOROUGH OF STONE HARBOR, CAPE MAY COUNTY, NEW JERSEY
 A REVIEW OF THE CONDITION OF THE MUNICIPAL BEACHES AS A RESULT OF HURRICANE SANDY IN THE BOROUGH OF STONE HARBOR, CAPE MAY COUNTY, NEW JERSEY View along the dune scarp from 103 rd Street on October 31,
Figure 106. Locations of the 28 NJBPN profile stations in Ocean County, NJ.
 130 Figure 106. Locations of the 28 NJBPN profile stations in Ocean County, NJ. 131 2016-2017 Beach Fills in Ocean County: The federal/state/local storm damage reduction project (beachfill) between Manasquan
Beach Dune Performance Assessment of. New Jersey Beach Profile Network (NJBPN) Sites at. Long Beach Island, New Jersey. After Hurricane Sandy
 Sites at. Long Beach Island, New Jersey. After Hurricane Sandy") Beach Dune Performance Assessment of New Jersey Beach Profile Network (NJBPN) Sites at Long Beach Island, New Jersey After Hurricane Sandy November 13, 2012 The Richard Stockton College of NJ Coastal Research
Beach Dune Performance Assessment of New Jersey Beach Profile Network (NJBPN) Sites at Long Beach Island, New Jersey After Hurricane Sandy November 13, 2012 The Richard Stockton College of NJ Coastal Research
Figure 46. Locations of the 28 NJBPN profile stations in Ocean County, NJ. A new site was added in the Borough of Seaside Heights (#248).
.") 90 Figure 46. Locations of the 28 NJBPN profile stations in Ocean County, NJ. A new site was added in the Borough of Seaside Heights (#248). 91 OCEAN COUNTY SPRING 2008 to FALL 2009 The Ocean County shoreline
90 Figure 46. Locations of the 28 NJBPN profile stations in Ocean County, NJ. A new site was added in the Borough of Seaside Heights (#248). 91 OCEAN COUNTY SPRING 2008 to FALL 2009 The Ocean County shoreline
New Jersey Beach Profile Network Ocean County Profile Site Locations
 125 RICHARD STOCKTON COLLEGE OF NEW JERSEY COASTAL RESEARCH CENTER New Jersey Beach Profile Network Ocean County Profile Site Locations Figure 73 156 155 154 153 152 151 15 149 The Ocean County shoreline
Beach, dune and development in the Borough of Mantoloking as of January Prepared for The Borough of Mantoloking: April 2, 2008
 Summary of 20-years of Shoreline Monitoring Between Maryland Avenue, Point Pleasant Beach, Bay Head, Mantoloking, Brick Township, to 1 st Avenue in Normandy Beach, Ocean County, New Jersey & an Evaluation
Volume and Shoreline Changes along Pinellas County Beaches during Tropical Storm Debby
 Volume and Shoreline Changes along Pinellas County Beaches during Tropical Storm Debby Ping Wang and Tiffany M. Roberts Coastal Research Laboratory University of South Florida July 24, 2012 Introduction
TABLE OF CONTENTS APPENDIX & BIBLIOGRAPHY
 TABLE OF CONTENTS Executive Summary 1 Acknowledgements 3 Introduction 3 The New Jersey Coastal Zone 3 Storm Recovery and Beach Project Effectiveness 3 Monmouth County 4 Figure 1. Monmouth County Station
Recycling of Surplus Sand to Extend the Time Between Beach Fill Episodes
 Recycling of Surplus Sand to Extend the Time Between Beach Fill Episodes Cape May County, New Jersey Dr. Stewart Farrell Coastal Research Center 1795 Franklin Map Shows Inlets Inlet Morphology has Remained
OCEAN COUNTY 2006 to 2008
 OCEAN COUNTY 2006 to 2008 Ocean County finally started to benefit from long-awaited startup of Federal beach nourishment projects when sand was pumped onto Surf City, Long Beach Island in late 2006. This
Long Beach Island Holgate Spit Little Egg Inlet Historical Evolution Introduction Longshore Transport Map, Survey and Photo Historic Sequence
 Appendix B Long Beach Island Holgate Spit Little Egg Inlet Historical Evolution Introduction The undeveloped southern end of Long Beach Island (LBI) is referred to as the Holgate spit as it adjoins the
2014 ANNUAL REPORT - TO THE CITY OF NORTH WILDWOOD ON THE CONDITION OF THE CITY BEACHES
 2014 ANNUAL REPORT - TO THE CITY OF NORTH WILDWOOD ON THE CONDITION OF THE CITY BEACHES View on September 25, 2014 looking northwest into Hereford Inlet. Considerable southerly expansion of the tip of
North Shore of Long Island, Feasibility Study
 North Shore of Long Island, Asharoken New York Asharoken, Feasibility Study Asharoken, NY Public Meeting June 30, 2015 US Army Corps of Engineers US Army Corps of Engineers New York BUILDING STRONG BUILDING
Executive Director and Director of Education New Jersey Sea Grant Consortium
 Welcome to the 12 th Annual State of the Shore Media Event Claire antonucci Executive Director and Director of Education New Jersey Sea Grant Consortium CLAIRE ANTONUCCI Characterized by endless snowfall,
Absecon Island Shore Protection The planning behind the project
 Absecon Island Shore Protection The planning behind the project Most residents of Atlantic City, Ventnor, Margate and Longport are now aware of upcoming plans to protect their common coastline with a beachfill
Beach Dune Performance Assessment of. New Jersey Beach Profile Network (NJBPN) Sites at. Between Manasquan Inlet and Allenhurst, New Jersey
 Sites at. Between Manasquan Inlet and Allenhurst, New Jersey") Beach Dune Performance Assessment of New Jersey Beach Profile Network (NJBPN) Sites at Between Manasquan Inlet and Allenhurst, New Jersey Related to FEMA DR JI 4086 Declared for Hurricane Sandy December
Beach Dune Performance Assessment of New Jersey Beach Profile Network (NJBPN) Sites at Between Manasquan Inlet and Allenhurst, New Jersey Related to FEMA DR JI 4086 Declared for Hurricane Sandy December
PREPARED FOR: THE BOROUGH OF AVALON 3100 DUNE DRIVE AVALON, NJ 08202
 FINAL REPORT FOR 2012 ON THE CONDITION OF THE MUNICIPAL OCEANFRONT BEACHES FOLLOWING HURRICANE SANDY IN THE BOROUGH OF AVALON, CAPE MAY COUNTY, NEW JERSEY View from 78 th Street to the north immediately
2013 ANNUAL REPORT - TO THE CITY OF NORTH WILDWOOD ON THE CONDITION OF THE CITY BEACHES
 2013 ANNUAL REPORT - TO THE CITY OF NORTH WILDWOOD ON THE CONDITION OF THE CITY BEACHES View on June 18, 2013 from the 2 nd Avenue jetty looking south while the 2013 beach nourishment project was under
Figure 41. Locations of the 28 NJBPN profile stations in Ocean County, NJ.
 57 Figure 41. Locations of the 28 NJBPN profile stations in Ocean County, NJ. 58 Hurricane Sandy s Impact on the Ocean County Shoreline; In general terms, all forms of damage to beaches, dunes and public
FINAL REPORT FOR 2013 ON THE CONDITION OF THE MUNICIPAL BEACHES IN THE TOWNSHIP OF UPPER, CAPE MAY COUNTY, NEW JERSEY
 FINAL REPORT FOR 2013 ON THE CONDITION OF THE MUNICIPAL BEACHES IN THE TOWNSHIP OF UPPER, CAPE MAY COUNTY, NEW JERSEY Aerial photograph at Corson s Inlet showing conditions on December 1, 2013 of the north
FINAL REPORT FOR 2012 ON THE CHANGES SEEN ON THE OCEANFRONT BEACHES
 FINAL REPORT FOR 2012 ON THE CHANGES SEEN ON THE OCEANFRONT BEACHES IN THE BOROUGH OF MANTOLOKING, OCEAN COUNTY, NEW JERSEY FOCUSED ON THE IMPACTS OF HURRICANE SANDY View looking north on Route 5 on October
FINAL REPORT FOR 2013 ON THE CONDITION OF THE MUNICIPAL OCEANFRONT BEACHES THE BOROUGH OF AVALON, CAPE MAY COUNTY, NEW JERSEY
 FINAL REPORT FOR 2013 ON THE CONDITION OF THE MUNICIPAL OCEANFRONT BEACHES THE BOROUGH OF AVALON, CAPE MAY COUNTY, NEW JERSEY View from 12 th Street to the south taken February 28, 2013, following completion
Figure 38. Locations of the 28 NJBPN profile stations in Ocean County, NJ.
 52 Figure 38. Locations of the 28 NJBPN profile stations in Ocean County, NJ. 53 Individual Site Descriptions: Beaches in Northern Ocean County continued to recover slowly as sand transported offshore
FINAL REPORT FOR 2009 ON THE CONDITION OF THE MUNICIPAL OCEANFRONT BEACHES IN THE BOROUGH OF AVALON, CAPE MAY COUNTY, NEW JERSEY
 FINAL REPORT FOR 2009 ON THE CONDITION OF THE MUNICIPAL OCEANFRONT BEACHES IN THE BOROUGH OF AVALON, CAPE MAY COUNTY, NEW JERSEY Storm waves pound the inlet revetment September 10, 2009 as the series of
DUNE STABILIZATION AND BEACH EROSION
 DUNE STABILIZATION AND BEACH EROSION CAPE HATTERAS NATIONAL SEASHORE NORTH CAROLINA ROBERT DOLAN PAUL GODFREY U. S. DEPARTMENT OF INTERIOR NATIONAL PARK SERVICE OFFICE OF NATURAL SCIENCE WASHINGTON, D.
HURRICANE SANDY LIMITED REEVALUATION REPORT UNION BEACH, NEW JERSEY DRAFT ENGINEERING APPENDIX SUB APPENDIX D SBEACH MODELING
 HURRICANE SANDY LIMITED REEVALUATION REPORT UNION BEACH, NEW JERSEY DRAFT ENGINEERING APPENDIX SUB APPENDIX D SBEACH MODELING Rev. 18 Feb 2015 1 SBEACH Modeling 1.0 Introduction Following the methodology
2015 ANNUAL REPORT - TO THE CITY OF NORTH WILDWOOD ON THE CONDITION OF THE CITY BEACHES
 2015 ANNUAL REPORT - TO THE CITY OF NORTH WILDWOOD ON THE CONDITION OF THE CITY BEACHES Ariel view of North Wildwood looking south from the Hereford Inlet perspective on June 24, 2015. The main channel
Figure 78. Map of Cape May County showing the locations of the 31 profile sites in the county.
 103 Figure 78. Map of Cape May County showing the locations of the 31 profile sites in the county. 104 Cape May County in 2015: Cape May County has 31 survey stations between Reeds Beach on the Western
Assateague Island National Seashore North End Restoration Project Timeline
 Assateague Island National Seashore North End Restoration Project Timeline Date Event Some information provided in the Project Introduction document. Detailed events are available in a timeline compiled
Delaware Chapter Surfrider Foundation - Indian River Inlet Monitoring
 Delaware Chapter Surfrider Foundation - Indian River Inlet Monitoring In 2012, the Delaware Surfrider Foundation Chapter formed the Surf Quality and Access Committee to focus on issues such as surf spot
Figure 1. Survey site locations in Monmouth County.
 6 Figure 1. Survey site locations in Monmouth County. 7 Individual Site Descriptions: The restoration of the Sea Bright shoreline was essentially complete by the fall 2013 survey. The NY Corps District
FINAL REPORT FOR 2011 ON THE CONDITION OF THE MUNICIPAL BEACHES IN THE CITY OF BRIGANTINE BEACH, ATLANTIC COUNTY, NEW JERSEY
 FINAL REPORT FOR 2011 ON THE CONDITION OF THE MUNICIPAL BEACHES IN THE CITY OF BRIGANTINE BEACH, ATLANTIC COUNTY, NEW JERSEY Photograph was taken October 10, 2011 from 10 th Street North looking south
SACO RIVER AND CAMP ELLIS BEACH SACO, MAINE SECTION 111 SHORE DAMAGE MITIGATION PROJECT APPENDIX F ECONOMIC ASSESSMENT
 SACO RIVER AND CAMP ELLIS BEACH SACO, MAINE SECTION 111 SHORE DAMAGE MITIGATION PROJECT APPENDIX F ECONOMIC ASSESSMENT Department of the Army New England District, Corps of Engineers 696 Virginia Road
ST. JOSEPH PENINSULA, GULF COUNTY, FLORIDA Beach Re-Nourishment and Environmental Enhancement Project RECOMMENDATIONS
 ST. JOSEPH PENINSULA, GULF COUNTY, FLORIDA Beach Re-Nourishment and Environmental Enhancement Project RECOMMENDATIONS January 23, 2018 543 Harbor Boulevard, Suite 204 Destin, Florida 32541 850.654.1555
Chapter 15 SEASONAL CHANGES IN BEACHES OP THE NORTH ATLANTIC COAST OF THE UNITED STATES
 Chapter 15 SEASONAL CHANGES IN BEACHES OP THE NORTH ATLANTIC COAST OF THE UNITED STATES By John M. Darling Hydraulic Engineer, Research Division U. S. Army Coastal Engineering Research Center Corps of
Climate Change Impacts to KSC Launch Complex
 Climate Change Impacts to KSC Launch Complex Presented to: 2010 International Workshop on Environment and Energy By: John Shaffer NASA Environmental Management Branch Kennedy Space Center Hurricane Season
Atlantic Coast of Long Island, Jones Inlet to East Rockaway Inlet, Long Beach Island, NY Construction Update
 Atlantic Coast of Long Island, Jones Inlet to East Rockaway Inlet, Long Beach Island, NY Construction Update June 2016 US Army Corps of Engineers Project Purpose Three specific damage mechanisms of coastal
Aspects of New Jersey Geology 2009 The Jersey Shore
 Aspects of New Jersey Geology 2009 The Jersey Shore Looking towards Belmar at sunset. Photo from VisitUSA.com. This calendar is available for free download from www.ganj.org, the website of the Geological
FINDING OF NO SIGNIFICANT IMPACT
 DEPARTMENT OF THE ARMY CHARLESTON DISTRICT, CORPS OF ENGINEERS 69A HAGOOD AVENUE CHARLESTON, SOUTH CAROLINA 29403-5107 FINDING OF NO SIGNIFICANT IMPACT EDISTO BEACH COASTAL STORM DAMAGE REDUCTION GENERAL
ATLANTIC COAST OF LONG ISLAND, JONES INLET TO EAST ROCKAWAY INLET, LONG BEACH ISLAND, NY. Contract #2 Construction Scope. April 18th-19th 2018
 ATLANTIC COAST OF LONG ISLAND, JONES INLET TO EAST ROCKAWAY INLET, LONG BEACH ISLAND, NY Contract #2 Construction Scope April 18th-19th 2018 New York District PLAN COMPONENTS Length of Beachfill 35,000
Impact of Hurricane Matthew on the Atlantic Coast of Florida
 Impact of Hurricane Matthew on the Atlantic Coast of Florida A coastal engineer was driving across country and his jeep broke down in front of a monastery. It was late in the day and the monks invited
Town of Duck, North Carolina
 Tracking No. 00.00.2010 Erosion Mitigation And Shoreline Management Feasibility Study Town of Duck, North Carolina Coastal Planning & Engineering of North Carolina August 15, 2012 Tom Jarrett Robert Neal
STATUS REPORT FOR THE SUBMERGED REEF BALL TM ARTIFICIAL REEF SUBMERGED BREAKWATER BEACH STABILIZATION PROJECT FOR THE GRAND CAYMAN MARRIOTT HOTEL
 August 23 STATUS REPORT FOR THE SUBMERGED REEF BALL TM ARTIFICIAL REEF SUBMERGED BREAKWATER BEACH STABILIZATION PROJECT FOR THE GRAND CAYMAN MARRIOTT HOTEL performed by Lee E. Harris, Ph.D., P.E. Consulting
CHAPTER 8 ASSESSMENT OF COASTAL VULNERABILITY INDEX
 124 CHAPTER 8 ASSESSMENT OF COASTAL VULNERABILITY INDEX 8.1 INTRODUCTION In order to assess the vulnerability of the shoreline considered under this study against the changing environmental conditions,
Building Coastal Resiliency at Plymouth Long Beach
 Building Coastal Resiliency at Plymouth Long Beach Department of Marine and Environmental Affairs March 30, 2017 Introducing Green Infrastructure for Coastal Resiliency Plymouth Long Beach & Warren s Cove
US Beach Nourishment Experience:
 Beach Nourishment: Introduction of new sand to the beach by truck or dredge Large beach >1 million cubic yards (100,000 dump truck loads) Funding is a combination of federal, state, local & private Also
Dauphin Island East End Beach and Barrier Island Restoration Project. Beau Buhring South Coast Engineers
 Dauphin Island East End Beach and Barrier Island Restoration Project Beau Buhring South Coast Engineers Funding Funded with qualified outer continental shelf oil and gas revenues by the Coastal Impact
Coastal management has lagged behind the growth in population leading to problems with pollution
 Fifty percent of the population of the industrialized world lives within 100 km of a coast. Coastal management has lagged behind the growth in population leading to problems with pollution and natural
Overview. Beach Features. Coastal Regions. Other Beach Profile Features. CHAPTER 10 The Coast: Beaches and Shoreline Processes.
 Overview CHAPTER 10 The Coast: Beaches and Shoreline Processes Coastal regions constantly change. The beach is a dominant coastal feature. Wave activity continually modifies the beach and coastal areas.
Reading Material. Inshore oceanography, Anikouchine and Sternberg The World Ocean, Prentice-Hall
 Reading Material Inshore oceanography, Anikouchine and Sternberg The World Ocean, Prentice-Hall BEACH PROCESSES AND COASTAL ENVIRONMENTS COASTAL FEATURES Cross section Map view Terminology for Coastal
ALTERNATIVES FOR COASTAL STORM DAMAGE MITIGATION
 ALTERNATIVES FOR COASTAL STORM DAMAGE MITIGATION Dave Basco Old Dominion University, Norfolk, Virginia, USA National Park Service Photo STRUCTURAL (changes to natural, physical system) hardening (seawalls,
Figure 1. Schematic illustration of the major environments on Mustang Island.
 STOP #1: PACKERY CHANNEL BEACH TO BAY We will start this field guide near the north jetty of Packery Channel and hike across the island to Corpus Christi Bay (fig. 1). The island emerges from the Gulf
Protecting our Beaches
 Protecting our Beaches South Amelia Island Shore Stabilization Project Nassau County, FL Mr. Drew Wallace President South Amelia Island Shore Stabilization Association (SAISSA) Mr. Bill Moore, AICP Project
Marginal Marine Environments
 Marginal Marine Environments Delta: discrete shoreline protuberances formed where rivers enter oceans, semi-enclosed seas, lakes or lagoons and supply sediment more rapidly than it can be redistributed
Performance of Upham Beach T-Groin Project and Its Impact to the Downdrift Beach
 Performance of Upham Beach T-Groin Project and Its Impact to the Downdrift Beach Progress Report for the Period of October 2008 to April 2009 Submitted by Ping Wang, Ph.D., and Tiffany M. Roberts Department
LAB: WHERE S THE BEACH
 Name: LAB: WHERE S THE BEACH Introduction When you build a sandcastle on the beach, you don't expect it to last forever. You spread out your towel to sunbathe, but you know you can't stay in the same spot
National Shoreline Erosion Control Demonstration Program Overview
 National Shoreline Erosion Control Demonstration Program Overview William R. Curtis 1 (Phone: (601) 634-3040, Fax: (601) 634-3080, CURTISW@wes.army.mil), Joan Pope 1 (Phone: (601) 634-3040, Fax: (601)
Inlet Management Study for Pass-A-Grille and Bunces Pass, Pinellas County, Florida
 Inlet Management Study for Pass-A-Grille and Bunces Pass, Pinellas County, Florida Final Report Submitted By Ping Wang, Ph.D., Jun Cheng Ph.D., Zachary Westfall, and Mathieu Vallee Coastal Research Laboratory
Dear Mr. Howard Ruben,
 Mr. Howard Ruben ( Howard.Ruben@usace.army.mil) The U.S. Army Corps of Engineers New York District Planning Division-Environmental Branch 26 Federal Plaza New York, New York 10278-0090 Dear Mr. Howard
USE OF SEGMENTED OFFSHORE BREAKWATERS FOR BEACH EROSION CONTROL
 .. CETN-III-22 4/84 PURPOSE: USE OF SEGMENTED OFFSHORE BREAKWATERS FOR BEACH EROSION CONTROL To provide information on the functional application of and general design considerations for using offshore
Lecture Outlines PowerPoint. Chapter 15 Earth Science, 12e Tarbuck/Lutgens
 Lecture Outlines PowerPoint Chapter 15 Earth Science, 12e Tarbuck/Lutgens 2009 Pearson Prentice Hall This work is protected by United States copyright laws and is provided solely for the use of instructors
Nearshore Sediment Transport What influences the loss of sediment on Beaches? - Waves - Winds - Tidal Currents - River discharge - Runoff
 Tides & Beaches Nearshore Sediment Transport What influences the loss of sediment on Beaches? - Waves - Winds - Tidal Currents - River discharge - Runoff Oceans Ocean Topography Physical Structure of the
ALTERNATIVES FOR COASTAL STORM DAMAGE MITIGATION AND FUNCTIONAL DESIGN OF COASTAL STRUCTURES
 The University of the West Indies Organization of American States PROFESSIONAL DEVELOPMENT PROGRAMME: COASTAL INFRASTRUCTURE DESIGN, CONSTRUCTION AND MAINTENANCE A COURSE IN COASTAL DEFENSE SYSTEMS I CHAPTER
Oceans and Coasts. Chapter 18
 Oceans and Coasts Chapter 18 Exploring the oceans The ocean floor Sediments thicken and the age of the seafloor increases from ridge to shore The continental shelf off the northeast United States Constituent
3/9/2013. Build house on cliff for a view of the ocean - be one with said view Pearson Education, Inc. Shorelines: summary in haiku form
 Introduction to Environmental Geology, 5e Edward A. Keller Shorelines: summary in haiku form Chapter 11 Coastal Processes Lecture Presentation prepared by X. Mara Chen, Salisbury University Build house
Chapter 10 Lecture Outline. The Restless Oceans
 Chapter 10 Lecture Outline The Restless Oceans Focus Question 10.1 How does the Coriolis effect influence ocean currents? The Ocean s Surface Circulation Ocean currents Masses of water that flow from one
The Sand Beaches of New Hampshire and Maine
 The Sand Beaches of New Hampshire and Maine Beach Preservation and Erosion Control Photographs provided by Joe Kelly and Steve Adams Cover photo: Reid State Park, ME Introduction The sand beaches of New
4/20/17. #32 - Coastal Erosion Case Histories - Lake Michigan
 Writing Assignment Due Monday by 11:59 pm #32 - Coastal Erosion Case Histories - Lake Michigan See main class web pages for detailed instructions Submit papers Illinois Compass No copying: Compass will
Chapter 20 Lecture. Earth: An Introduction to Physical Geology. Eleventh Edition. Shorelines. Tarbuck and Lutgens Pearson Education, Inc.
 Chapter 20 Lecture Earth: An Introduction to Physical Geology Eleventh Edition Shorelines Tarbuck and Lutgens The Shoreline: A Dynamic Interface The Coastal Zone The shoreline is constantly modified by
Coastal Hazards and Management in North Carolina. Braxton Davis April 14, 2015
 Coastal Hazards and Management in North Carolina Braxton Davis April 14, 2015 Coastal Facts and Figures 320 miles of ocean beaches 12,000+ miles of estuarine shoreline 2 million + acres of sounds, creeks,
Figure 4, Photo mosaic taken on February 14 about an hour before sunset near low tide.
 The Impact on Great South Bay of the Breach at Old Inlet Charles N. Flagg and Roger Flood School of Marine and Atmospheric Sciences, Stony Brook University Since the last report was issued on January 31
EVALUATION OF BEACH EROSION UP-DRIFT OF TIDAL INLETS IN SOUTHWEST AND CENTRAL FLORIDA, USA. Mohamed A. Dabees 1 and Brett D.
 EVALUATION OF BEACH EROSION UP-DRIFT OF TIDAL INLETS IN SOUTHWEST AND CENTRAL FLORIDA, USA Mohamed A. Dabees 1 and Brett D. Moore 1 The paper discusses the analysis of up-drift beach erosion near selected
Montserrat. Wise practices for coping with. i b bea n Se a
 Wise practices for coping with Montserrat Car i b bea n Se a Fisheries Division, Montserrat Physical Planning Department, Montserrat University of Puerto Rico, Sea Grant College Program Caribbean Development
4/20/17. #31 - Coastal Erosion. Coastal Erosion - Overview
 Writing Assignment Due Monday by 11:59 pm #31 - Coastal Erosion Beach front property! Great View! Buy now at a great price! See main class web pages for detailed instructions Essays will be submitted in
CHAPTER 281 INFLUENCE OF NEARSHORE HARDBOTTOM ON REGIONAL SEDIMENT TRANSPORT
 CHAPTER 281 INFLUENCE OF NEARSHORE HARDBOTTOM ON REGIONAL SEDIMENT TRANSPORT Paul C.-P. Lin, Ph.D., P.E. 1 and R. Harvey Sasso, P.E. 2 ABSTRACT The influence of nearshore hardbottom on longshore and cross-shore
Dune Monitoring Data Update Summary: 2013
 Dune Monitoring Data Update Summary: 13 Shoreline Studies Program Virginia Institute of Marine Science College of William & Mary Gloucester Point, Virginia September 13 Dune Monitoring Data Update Summary:
An Update of Coastal Erosion in Puerto Rico
 Jack Morelock and Maritza Barreto An Update of Coastal Erosion in Puerto Rico Department of Marine Sciences, University of Puerto Rico at Mayagüez and Geography Department, University of Puerto Rico at
Shorelines Earth - Chapter 20 Stan Hatfield Southwestern Illinois College
 Shorelines Earth - Chapter 20 Stan Hatfield Southwestern Illinois College The Shoreline A Dynamic Interface The shoreline is a dynamic interface (common boundary) among air, land, and the ocean. The shoreline
OECS Regional Engineering Workshop September 29 October 3, 2014
 B E A C H E S. M A R I N A S. D E S I G N. C O N S T R U C T I O N. OECS Regional Engineering Workshop September 29 October 3, 2014 Coastal Erosion and Sea Defense: Introduction to Coastal/Marine Structures
Sediment Transport Analysis Village of Asharoken, New York
 Sediment Transport Analysis Village of Asharoken, New York NORTH SHORE OF LONG ISLAND, NEW YORK COMBINED EROSION CONTROL AND STORM DAMAGE PROTECTION FEASIBILITY STUDY FINAL REPORT August 2004 Cell 0 Asharoken
Julebæk Strand. Effect full beach nourishment
 Julebæk Strand Effect full beach nourishment Aim of Study This study is a part of the COADAPT funding and the aim of the study is to analyze the effect of beach nourishment. In order to investigate the
Long Term Success and Future Approach of the Captiva and Sanibel Islands Beach Renourishment Program
 2017 National Conference on Beach Preservation Technology February 8-10, 2017; Stuart, Florida Long Term Success and Future Approach of the Captiva and Sanibel Islands Beach Renourishment Program Thomas
Table 4. Volumetric Change Rates Pre-Project and Post-Project for the Town of Duck
 V. VOLUMETRIC CHANGES General Volumetric changes measured over the entire monitoring area for various time periods are provided in Table 4. The volume changes are given in terms of cubic yards/foot of
FINAL ENVIRONMENTAL IMPACT STATEMENT ON BROWARD COUNTY SHORE PROTECTION PROJECT SEGMENTS II AND III BROWARD COUNTY, FLORIDA
 FINAL ENVIRONMENTAL IMPACT STATEMENT ON BROWARD COUNTY SHORE PROTECTION PROJECT SEGMENTS II AND III BROWARD COUNTY, FLORIDA 1. PROJECT PURPOSE AND NEED 1.1. PROJECT AUTHORITY. 1.1.1. INITIAL AUTHORIZATION.
April 7, Prepared for: The Caribbean Disaster Emergency Response Agency Prepared by: CEAC Solutions Co. Ltd.
 April 7, 2006 Prepared for: The Caribbean Disaster Emergency Response Agency Prepared by: Introduction CEAC Solutions Co. Ltd was commissioned in May 2005 to prepare coastal beach erosion hazard maps for
Deep-water orbital waves
 What happens when waves approach shore? Deep-water orbital waves Fig. 9.16, p. 211 Wave motion is influenced by water depth and shape of the shoreline wave buildup zone surf zone beach Wave base deepwater
Environmental Protection on the Gold Coast of Queensland, Australia. 1. What is the appeal of the Gold Coast to tourists?
 Environmental Protection on the Gold Coast of Queensland, Australia Sections 1. What is the appeal of the Gold Coast to tourists? 2. How are Gold Coast visitor trends changing? 3. How can the impacts of
Ninilchik Harbor Page 2 of 11
 Ninilchik Harbor Ninilchik Harbor Page 2 of 11 Condition of Improvements 31 December 2017 Ninilchik Harbor, Alaska (CWIS No. 012640, 087345) Authorization Rivers and Harbors Act, 3 July 1958 (P.L. 85-500
Earth Science Chapter 16 Section 3 Review
 Name: Class: Date: Earth Science Chapter 16 Section 3 Review Multiple Choice Identify the choice that best completes the statement or answers the question. 1. The movement of water that parallels the shore