IMPACTS OF WAVES and SEA LEVEL RISE ON PORTs DUE TO GLOBAL CLIMATE CHANGES
|
|
|
- Arleen Montgomery
- 5 years ago
- Views:
Transcription
 Dr. ir. R.J. Labeur (TU Delft) Ir. W.F.")
1 IMPACTS OF WAVES and SEA LEVEL RISE ON PORTs DUE TO GLOBAL CLIMATE CHANGES Viet Nam Sea Ports Case study Pham Lan Anh Delft, April 2012 Student number Master thesis committee: Prof. drs. ir. J.K. Vrijling (TU Delft) Dr. ir. R.J. Labeur (TU Delft) Ir. W.F. Molenaar (TU Delft)
2 Preface This thesis is the finalization of my master program in Hydraulic Engineering at Delft University of Technology. This study has been carried out mainly at TU Delft and a part in Viet Nam. Climate change is a phrase, a terminology that is daily mentioned on public media, governmental strategy, lectures, books One of the serious consequences of climate change is rising of mean sea level all over oceans which directly impacts to coastal protection structures, typically are breakwaters and port structures which are not well protected like jetty structures. Viet Nam is the country in the region of direct impact of climate change and sea level rise. The theme "Impacts of Wave and Sea Level Rise due to Climate Changes on Ports - Viet Nam Sea Ports Case study" is actually essential pressing problems at present. I would like to express my deep gratitude to Associate Prof. Pham Van Quoc at Water Resources University of Ha Noi who suggests me this idea via one of his article on the university website. I would like to express my deep gratitude and respect to my supervisors - Prof. Dr. Ir. J.K. Vrijling, Dr. Ir. R.J. Labeur, Ir. W.F. Molenaar and the professors, lecturers and staff of TU Delft for their instruction, assist in my study process. Also, my deep gratitude is to Shell Centenary Scholarship who gave me the chance to be in Delft and awarded me the MSc. program. And last but not least my family is an indispensible mental support to finish this MSc study. April 2012 Pham Lan Anh ii
3 Contents Preface... ii Abstract... vii Outline of this report... viii ABBREVIATION... ix List of figures... x List of tables... xiii Chapter 1. Introduction Global climate change review Background Sea level rise due to climate changes Hurricanes, Storm surge, Waves in climate change conditions Summary of climate change and SLR scenarios of Viet Nam Sea level rise scenarios of Viet Nam Inundation Maps of Ho Chi Minh City and Mekong River Delta Features of Viet Nam sea port development Classification of Viet Nam sea ports Existing aspects of several main sea ports Scale of Viet Nam sea ports in planning...13 Chapter 2: Problem analysis and definition of study Analysis of climate change and SLR impacts on sea ports Negative impacts of climate change factors on ports Strong negative SLR impacts due to climate changes on Viet Nam sea ports Study objectives Study methodology Problem definition of study...21 Chapter 3. Wave loads on jetties and breakwaters Background Wind wave theory Regular waves Irregular waves Types of wave impact loads Quasi-static wave loads pulsating loads Dynamic impact wave loads Background...34 iii
4 Breaking Wave Loads Wave loads on exposed jetties Background Kaplan s Model Bea et al. Suggestion Sterndoff s Suggestion Kaplan s Model Update Cuomo and Allsop (2006)...41 b. Prediction of horizontal wave forces on jetty deck elements...42 c. Wave impact forces Wave loads and overtopping experiments on jetties Background Example of Wave Load Experiments on Jetties Wave overtopping on breakwaters Mean Wave Overtopping Discharge Maximum Wave Overtopping Volumes Wave Transmission by wave Overtopping Wave diffraction in port basin Regular wave diffraction Irregular wave diffraction...52 Chapter 4. Wave and sea level rise impacts on Nam Du port Introduction to Nam Du port Nam Du Island Location Overview of Nam Du Island Nam Du deep sea port: Nam Du jetty structure for General cargo terminal and coal terminal Natural conditions Topography Bathymetry Hydrographic and Meteorological Conditions Geotechnical conditions Seismicity Wave designed determination SWAN modeling results Sea level rise impacts on Nam Du port Sea Level Rise accounted in Nam Du Port Master Plan...70 iv
5 Prediction of maximum water surface elevations along Nam Du jetty Imaginary case for the impact of waves to the underside deck...73 Chapter 5 Wave and sea level rise impacts on Tien Sa port Introduction to Tien Sa port Geographical coordinate system Project features Tien Sa port capacity Tien Sa breakwaters Database Topography Seismicity Geotechnical Conditions Rainfall regime Mist and vision Wind regime Typhoons, hurricanes Sea water level Storm surge and current Wave regime Wave analysis in the designed phase of Tien Sa port The grade of Tien Sa Port's breakwater The designed wind condition Designed water level Waves for Design Determination of the breakwater's length Prediction of wave heights at Tien Sa site in SLR scenarios Background Predicted wave heights in Ultimate Limit State of SLR Scenarios Wave loads and stability of Tien Sa breakwater in SLR scenarios Background Input data Equations for Calculating Wave Loads and Stability of Caisson The Results of Calculating Loads and Stability of Caisson at the breakwater s head The assumption of repairing Tien Sa Breakwater Caissons in Sea Water Level Rise Scenarios...97 v
6 The assumption of newly designing Tien Sa Breakwater's Caissons in sea water level rise Scenarios Wave overtopping on Tien Sa breakwater Mean Wave Overtopping Discharge Maximum Wave Overtopping Volumes by one wave Wave Transmission by wave Overtopping Applications and results of calculations The Remarks for the calculated results Wave diffraction at Tien Sa port site Input Data Calculated Results of Wave diffraction heights in Tien Sa Port Bay The Remarks for the calculated results Chapter 6: Conclusions and recommendation Conclusions Recommendations References Appendix A1. Appendix 1 (of Chapter 1) A2. Appendix 2 (of Chapter 4) A3. Appendix 3 (of Chapter 5) vi
7 Abstract The idea of this thesis is conceived from the global climate change phenomenon and the heating up of the earth that causes sea level rise. Extreme heat events are predicted to become more and more frequent, intense and longer lasting in the global scale. Consequently, changes in glaciers and icecaps: Glacial and permafrost melt from Greenland and Antarctica, snow on land; subsidence of sea bottom due to gas and oil extraction at the mainland cause sea level rise. In conditions of sea level rise due to climate changes, the phenomena of storms, hurricanes, waves, storm surges, flooding, tropical cyclones are likely getting more and more intensive and heavier which poses a serious global threat. History has seen a lot more severe hurricanes with increase in intensity and level of attack. There are several historic storms during the first decade of the 21st century, viz Ivan (2004) in the Caribbean, Katrina (2005) in the south east of the State, Nargis (2008) in Myanmar... Coastal and marine structures are directly exposed to hurricane generated waves, wind generated waves during their whole life of operation. This means that coastal protection structures like breakwaters and marine structures like jetty structures are the most vulnerable to sea level rise and climate change Viet Nam lies in the region of direct impact of sea level rise and climate change, especially in the East Sea where branches of Me Kong river run off. In the annual report on Climate change and sea level rise in Viet Nam MONRE has proposed 3 scenarios of sea level rise in the next 100 years viz. 60 cm (low emission scenario), 75 cm (medium emission scenario), 100 cm (high emission scenario). This study is implemented these 3 scenarios on 2 case studies of 2 sea ports: Nam Du deep sea port with researched structure is jetty structure and Tien Sa sea port with researched structure is breakwater. The thesis focuses on the impact of waves and sea level rise on these two types of structures. The objective of this report is to better understanding of how the hydraulic structure(breakwaters and jetties) be impacted by the rising sea level and waves in that SLR condition in the future; answer the question whether the designed structures are stable and functional enough to sustain with SLR. By the results from study, some conceptual recommendations will be proposed to account SLR in the future design. The results of this report shows that jetty structures which are designed by Royal Haskoning (the Netherlands) are not touched by extreme maximum waves in 3 SLR scenarios. The structures themselves are designed included 30 cm of SLR and high enough for water not to transmit to the deck. However, Tien Sa breakwater is unstable if the sea level rises in next 100 years. The structure was not well designed enough to sustain with rising sea level and higher wave conditions. The solution for repairing is ballasting the caisson breakwater to 1m thickness or another proposing conceptual design is enlarging the caisson toe to 6m length to ensure the stability. vii
8 Outline of this report The thesis mention and deal with the problems about impacts of wave and sea level rise due to climate changes on ports in general and case studies for Viet Nam sea ports. The thesis consists of three parts (Introduction and problem analysis - part 1; Literature overview of loads on jetties and breakwaters - part 2 and Viet Nam sea port case study - part 3) and it is divided in to six chapters. In the part 1 the contents of chapters (1, 2) investigate the problems of waves, sea level rise and climate change scenarios, Vietnamese sea ports capacity in existing conditions and in near future. Based on Data collection, summary and analysis for the officially studied results on climate changes, SLR, waves, existing and future of Vietnamese sea ports etc. of the international and Vietnamese scientists, institutions, governments, organizations, those have been refined to definite the limited significant problems for study in this thesis. The part 2 - Literature overview of wave loads on jetties and breakwaters is carried out in the chapter 3. The problems of waves, calculation methods for wind waves, wave loads on exposed jetties, breakwater and caissons, wave overtopping on breakwaters, wave diffraction in port bays are shown in this chapter. The part 3 - Viet Nam sea port case study is fulfilled as following: The chapter 4 investigates Nam Du Port in the Master Plan Phase. Based on the calculating prediction results of extreme wave crest elevation max in for Nam Du port in the designed case and in Viet Nam SLR scenarios, the conclusion is the max crest elevation in the highest SLR 3 scenario below the bed elevation of the desks; the extreme waves only impact on the piles of jetties. Therefore the problems of wave loads on jetties' desks are not taken account in this thesis. The chapter 5 deal with the problems: calculations of wave loads, wave overtopping on breakwaters, wave diffraction in port bay and caisson s stability for Tien Sa Port Breakwater in the designed case and in the Viet Nam sea level rise scenarios due to global climate changes, in which: - Using the formulae of Goda for calculations of wave and SLR loads on Tien Sa, breakwater's caissons in the designed case and the SLR scenarios. - Using the diagrams of Goda for calculations of wave diffraction in Tien Sa port bay. - Using the formulae of Franco et al. (1995); Besley (1999) for calculations of mean wave overtopping discharges, maximum wave overtopping volumes, wave transmission by wave overtopping in the designed case and the SLR scenarios. - Setting up the solution of wider caisson's bed width for enhancing stability for caissons. Stability of the Tien Sa breakwater's caisson with new solution is re-calculated in the SLR scenarios due to climate changes. Based on the studied achievements the necessary conclusions and recommendations are refined in the Chapter 6. viii
9 ABBREVIATION SLR: Sea Level Rise due to Climate Changes SLR1: The 65 cm of sea level rise (in SLR1 scenario of Viet Nam - Low emission scenario B1) SLR2: The 75 cm of sea level rise (in SLR2 scenario of Viet Nam - Medium emission scenario B2) SLR3: The 100 cm sea level rise (in SLR3 scenario of Viet Nam - High emission scenario A1FI) SLS: Service Limit State ULS: Ultimate Limit State IPCC: Intergovernmental Panel on Climate Change; IWTC: International Water Technology Conference; NOAA: The National Oceanic and Atmospheric Administration (NOAA) is a federal agency of United States focused on the condition of the oceans and the atmosphere. MONRE: Ministry of natural resources and environment AIT: Asian Institute of Technology Mtpa: million tons per annum HD : Hon Dau Data SS : Storm surge DWT: Dead Weight Tonnage TEU: Twenty Equivalent Units GRT: Gross Register Tonnage ix
10 List of figures Fig Observed and Projected Global Average Temperature... 1 Fig The typical picture of glacial melting... 2 Fig Global Mean Sea Level (GMSL) 1880 to Fig Change sea level rise at Hon Dau oceanographical gauge station... 4 Fig Inundation map of Ho Chi Minh City at 65 cm of SLR1 scenario... 5 Fig Inundation map of Ho Chi Minh City at 75 cm of SLR2 scenario... 5 Fig Inundation map of Ho Chi Minh City at 100 cm of SLR3 scenario... 6 Fig Inundation map of Me Kong River Delta at 65 cm of SLR1 scenario... 6 Fig Inundation map of Me Kong River Delta at 75 cm of SLR2 scenario... 7 Fig Inundation map of Me Kong River Delta at 100 cm of SLR3 scenario... 7 Fig The centre of Hai Phong port... 9 Fig A corner of Van Phong port... 9 Fig Cai Mep port with DWT vessels Fig Container vessels in Hon Gai port Fig Berth at Han river port Fig The map of Viet Nam existing sea ports Fig The Map of Master plan for main container Ports Fig Typical exposed jetty in front of sea Fig Direct wave impacts on breakwaters Fig Sinusoidal wave shape (Magchiel van Os (2002)) Fig Jonswap and Pierson-Moskowitz spectrumfig Fig The individual wave record for 7 11 February Fig The wave records for the three largest measured individual waves Fig Pulsating and impact loads for a vertical wall (Kortenhaus et al 1997) Fig PROVERBS parameter map (Kortenhaus et al 1997)..29 Fig Parameter Diagram for Calculation Quasi-Static Loads and Impact Loads 30 Fig Wave pressure distribution by Sainflou.30 Fig Broken wave pressure due to Minikin (1963) 31 Fig Wave pressure distribution for non-breaking waves by Goda's formulae 33 Fig Nam Du port location in Viet Nam port master plan map...55 Fig Zoom in to the South-West port master plan...56 Fig Overview of Northern side of Nam Du island...56 Fig Overview of Nam Du island...57 Fig Overview of Nam Du deep sea port (coal terminal on the left side, general cargo terminal on the right side)...58 Fig Front view of Nam Du port and the island (coal terminal on the right side, general cargo terminal on the left side)...59 x
11 Fig Master plan, coal terminal 12 mtpa (dwell time 30 days) General cargo terminal 6 mtpa...61 Fig Nam Du port master plan(coal terminal on the right side, general cargo terminal on the left side)...62 Fig Section A-A General cargo terminal...63 Fig Top view general cargo terminal...63 Fig Top view coal terminal - Jetty...64 Fig Top view coal terminal berth...64 Fig All year wind speed exceedance [%] per direction...66 Fig Key locations in the Nam Du port area...70 Fig Location of Tien Sa port on Viet Nam map...77 Fig Tien Sa breakwater from satellite (from Google earth)...78 Fig 5. 3.Cross Section of Tien Sa Caisson Breakwater...90 Fig Plan of Tien Sa Breakwater Caisson...91 Fig Longitudinal section of Tien Sa Breakwater Caisson...91 Fig Cross section of Tien Sa Breakwater Caisson...91 Fig The wave load distribution on Caisson...92 Fig The wave Goda loads on Tien Sa breakwater's Caisson in Designed Case...96 Fig Enhancing stability of caissons by adding more the concrete block s thickness of 1.0 m on the caisson s top in SLR 3 scenario...99 Fig Expanding more the caisson's bed width by two concrete plates, the each plate's length of 1.2 m at each side of the caisson, the average concrete plate s thickness of 1 m Fig The wave Goda loads on Tien Sa breakwater Caisson in SLR3 Scenario Fig Designed Case - Wave Diffraction in Tien Sa Bay setup by the diagram of Goda with the wave direction from the North to the South, S max = Fig SLR1 Case - Wave Diffraction in Tien Sa Bay setup by the diagram of Goda with the wave direction from the North to the South, S max = Fig SLR2 Case - Wave Diffraction in Tien Sa Bay setup by the diagram of Goda with the wave direction from the North to the South, S max = Fig SLR3 Case - Wave Diffraction in Tien Sa Bay setup by the diagram of Goda with the wave direction from the North to the South, S max = Fig Designed Case - Wave Diffraction in Tien Sa Bay setup by the diagram of Goda with the wave direction from the North to the South, S max = Fig SRL1 Case - Wave Diffraction in Tien Sa Bay setup by the diagram of Goda with the wave direction from the North to the South, S max = Fig SRL2 Case - Wave Diffraction in Tien Sa Bay setup by the diagram of Goda with the wave direction from the North to the South, S max = Fig SRL3 Case - Wave Diffraction in Tien Sa Bay setup by the diagram of Goda with the wave direction from the North to the South, S max = xi
12 Fig Designed Case - Wave Diffraction in Tien Sa Bay setup by the diagram of Goda the wave direction from the North to the South, S max = Fig SLR1 Case - Wave Diffraction in Tien Sa Bay setup by the diagram of Goda with the wave direction from the North to the South, S max = Fig SRL2 Case - Wave Diffraction in Tien Sa Bay setup by the diagram of Goda with the wave direction from the North to the South, S max = Fig SRL3 Case - Wave Diffraction in Tien Sa Bay setup by the diagram of Goda with the wave direction from the North to the South, S max = Fig General View of Da Nang Bay (Source: Google map) Fig General View of Tien Sa Port and Breakwater (Source: Google map) Fig Layout and Longitudinal Cross Section of Tien Sa Breakwater Fig A. 1. View of Breakwater of Hon La Port in Quang Binh province Fig A. 2. View of Jetties of Chan may Port in Thua Thien - Hue province Fig A. 3. View of Breakwater and Jetties of Dung Quat Port in Quang Ngai province Fig A. 4. Vung Ang Sea Port and Industrial Area in Ha Tinh province Fig A. 5. Master Plan of Van Phong International Port in Khanh Hoa province Fig A. 6. The sea ports of Group 1- From Quang Ninh to Ninh Binh province in Master Plan. 131 Fig A. 7. The sea ports of Group 2 - From Thanh Hoa to Ha Tinh province in Master Plan Fig A. 8. The sea ports of Group 3 - From Quang Binh to Quang Ngai province in Master Plan Fig A. 9. The sea ports of Group 4 - From Binh Dinh to Binh Thuan province in Master Plan. 134 Fig A. 10. The sea ports of Group 5 - Ho Chi Minh City, Dong Nai and Ba Ria Vung Tau provinces in Master Plan Fig A. 11. The sea ports of Group 6 - Cuu Long River Delta in Master Plan Fig A. 12. The typical cross section of Tien Sa breakwater segment 1 (250 m of phase 1) Fig A. 13. The typical cross section of Tien Sa breakwater segment 1 (200 m of phase 2) xii
13 List of tables Table Sea Level Rise Scenarios of Vietnam in comparison with the baseline period of Table Negative Impacts of Climate Change Factors on Ports [37]...19 Table Coefficients for prediction of vertical wave forces on jetty structures...42 Table Coefficient for prediction of horizontal wave force on jetty deck element...43 Table Coefficient for prediction of impact forces on jetty strcuture...43 Table 4. 1.Tidal water level...67 Table Extreme water levels...67 Table Designed water levels...68 Table The SWAN model results for the number of near shore points...70 Table The Water Level in the Designed and SLR Scenarios Table The highest wind speed due to months in Da Nang ( )...80 Table Tidal water level (H) vs. Frequency (P) at Son Tra station...81 Table The wave heights for Design...83 Table Five main wind directions in the NSW Module...84 Table 5. 5.The co-ordinates of computed points in Da Nang Bay...85 Table The wave heights at the head of breakwater in Service Limit State with the wind velocity 10m/s...85 Table The wave heights at the head of breakwater with the wind probability 2%...85 Table The wave heights at the head of breakwater with the wind probability 2%...85 Table Wind setups in front of the breakwater's head...86 Table The wind directions and wind velocities in the computation EMS Model for the alternative of the breakwater length of 450 m...86 Table The wave diffraction heights at the points...87 Table Wave height in SLR scenarios 1: Sea level rise 65 cm...88 Table Wave height in SLR scenarios 2: Sea level rise 75 cm...89 Table Wave height in SLR scenarios 3: 100 cm...89 Table The designed parameters of one caisson...90 Table The mass of Tien sa caisson s parts...92 Table The Results of Calculating Loads and Stability of Caisson at the head of Breakwater having the sea bed elevation of m (the point (3))...96 Table The calculated results of caisson's stability by adding more the concrete block s thickness of 1.0 m on the caisson s top...99 xiii
14 Table The calculated results of stability of Tien Sa Caissons by adding two concrete plates, the each plate's length of 1.2m at each side of the caisson, the average concrete plate s thickness of 1 m Table Results of Calculations of Mean Wave Overtopping Discharge, Maximum Wave Overtopping Volumes, Wave Transmission by wave Overtopping Table Input data for calculating wave diffraction heights in Ultimate Limit State of Tien Sa Bay Table A. 1. Calculating the free board between the expected maximum wave crest elevation and the jetty berm bed elevation for the designed case in Master Plan Table A. 2. Calculating the free board between the expected maximum wave crest elevation and the jetty berm bed elevation for the SLR1 Scenario Table A. 3. Calculating the free board between the expected maximum wave crest elevation and the jetty berm bed elevation for the SLR2 Scenario Table A. 4. Calculating the free board between the expected maximum wave crest elevation and the jetty berm bed elevation for the SLR3 Scenario Table A. 5. PREDICTION OF THE WAVE HIEIGHTS AT POINTS (1), (2) and (3) INFRONT OF TIEN SA BREAK WATER Table A. 6. Large hurricanes attacked Da Nang sea ( ) xiv
15 Chapter 1. Introduction 1.1. Global climate change review Background As known that global warming refers to the rising average temperature of Earth's atmosphere and oceans, which began to increase in the late 19th century and is projected to continue rising. Since the early 20th century, Earth's average surface temperature has increased by about 0.8 C, with about two thirds of the increase occurring since Warming of the climate system is unequivocal, and scientists are more than 90% certain that most of it is caused by increasing concentrations of greenhouse gases produced by human activities such as deforestation and the burning of fossil fuels. These findings are recognized by the national science academies of all major industrialized nations [4]. The evidences of instrumental records and scientific research reveal that the world s oceans have warmed since 1955, accounting over this period for more than 80% of the changes in the energy content of the Earth s climate system. Extreme heat events are predicted to become more frequent, intense and longer lasting in the global scale. The observed and projected global average temperature is shown in figure 1-1. Fig Observed and Projected Global Average Temperature (Source: Overview Global Climate Change Impacts in the United States Thomas C. Peterson NOAA s National Climatic Data Center, Asheville, North Carolina) According to the IPCC AR4 Report several major factors currently contribute to sea level change. These are: Ocean thermal expansion; Changes in glaciers and icecaps; glacial melt from the Greenland and Antarctica Ice Sheets. A smaller contribution is from snow on land and permafrost [3]. 1

16 Fig The typical picture of glacial melting (Source: Sài Gòn online Sea level rise due to climate changes Sea-level rise (SLR) due to climate change is a serious global threat. The scientific evidences are now clear and overwhelming. According IPCC, 2007, the rate of global sea level rise was faster from 1993 to 2003, about 3.1 mm per year, as compared to the average rate of 1.8 mm per year from 1961 to 2003; and significantly higher than the average rate of 0.1 to 0.2 mm/year increase recorded by geological data over the last 3,000 years. Global sea level is projected to rise during the 21st century at a greater rate than during the period 1961 to 2003 and unanimous agreement that SLR will not be geographically uniform. Ocean thermal expansion is projected to contribute significantly, so land ice will increasingly lose mass at an accelerated rate. Recently the evidence on the vulnerability of Greenland and west Antarctic ice sheets to climate warming raises the alarming possibility of SLR by one meter or more by the end of the 21st century [1]. Fig Global Mean Sea Level (GMSL) 1880 to 2010 (Source: Figures marked by CSIRO- Commonwealth Scientific and Industrial Research Organization, is Australia's national science agency in the world). 2
17 Hurricanes, Storm surge, Waves in climate change conditions Along the coast, storm surge is often the greatest threat to life and property from a hurricane. Hurricane Katrina (2005) is a serious example of the damage and devastation that can be caused by surge. At least 1500 persons lost their lives during Katrina and many of those deaths occurred directly, or indirectly, as a result of storm surge. Changes in sea level rise have a profound implication on the impact of storm surges, which occur annually and typically with devastating consequences on coastal areas. Sea level rise basically acts as the baseline reference point to which storm surge height is added. If the baseline rises at a faster rate than what was originally believed (or invested upon), storm surges become even more unpredictable in their damage capability. According to IPCC estimates of the potential destructiveness of hurricanes/ cyclones show a significant upward trend since the mid-1970s, with a trend towards longer lifetimes and greater storm intensity, and such trends are strongly correlated with tropical sea surface temperature. It is likely (greater than 66% probability) that future tropical cyclones will become more intense, with larger peak wind speeds and heavier precipitation associated with ongoing increases of tropical sea surface temperatures (IPCC, 2007) [3]. According to IWTC if the projected rise in sea level due to global warming occurs, then the vulnerability to tropical cyclone storm surge flooding would increase and it is likely that some increase in tropical cyclone peak wind-speed and rainfall will occur if the climate continues to warm. Ocean thermal expansion, changes in glaciers and icecaps as glacial melt from the Greenland and Antarctica ice sheets, melt from snow on land and permafrost are the directly major factors causing sea level rise. As consequences, the projected rise in sea level due to global warming can increase. Tropical cyclones, storms, hurricanes, waves will become heavier negative impacts [2] Summary of climate change and SLR scenarios of Viet Nam Sea level rise scenarios of Viet Nam The Ministry of Natural Resources and Environment of Viet Nam has set up the scenarios of climate change, sea level rise for Vietnam since According to these scenarios, climate would significantly change over all regions of Vietnam. By the end of the 21 st century, average temperature in Vietnam is expected to increase about 2.3 C relative to the average of The increase in temperature would be in the range of 1.6 C to 2.8 C in different climate zones. Temperatures in Northern and Central climate zones of Vietnam would increase faster than those in Southern zones. In each climate zone, winter temperatures would increase faster than summer ones. Both annual rainfall and rainy season's rainfall would increase, while dry season's rainfall tends to decrease, especially in Southern climate zones. For the whole country, annual rainfall by the end of the 21" century would increase by 5% compared to that of the period In Northern climate zones, rainfall increasing rate would be more than that of Southern ones [5]. 3

18 Fig Change sea level rise at Hon Dau oceanographical gauge station from 1960 to 2005 (Source: Ministry of Natural Resources and Environment, Climate Change, Sea Level Rise Scenarios for Viet Nam, Hanoi, June ) Data from tidal gauges along Vietnamese coast show that sea level rise was at the rate of about 3 mm/year during the period of which is comparable with the global tendency. In the past 50 years, sea level at Hon Dau gauge station rose about 20 cm (see fig.1-4). The sea level rise scenarios for Vietnam have been computed on the basic of the lowest (B1), the medium (B2), and the highest (A1FI) emission scenarios. The results show that by middle 21 st century sea level may rise by 28 to 33 cm and by the end 2100 sea level may rise up about 65 to 100 cm in comparison with the baseline period of as in the table 1-1. Scenarios Low emission scenario (B1) Medium emission scenario (B2) Sea Level Rise (cm) by the Decades in the 21 century High emission scenario (A1FI) Table Sea Level Rise Scenarios of Vietnam in comparison with the baseline period of The medium emission scenario (B2) is preferable and recommended to be used currently for climate change and sea level rise scenarios for Viet Nam [5] Inundation Maps of Ho Chi Minh City and Mekong River Delta The inundation data, maps of Ho Chi Minh City and Mekong River Delta are shown in form Fig.1-5 to Fig.1-10 [5]. 4
 in red Fig 1. 6.")
19 Fig Inundation map of Ho Chi Minh City at 65 cm of SLR1 scenario, inundation area 128 km 2 (6.3%) in red Fig Inundation map of Ho Chi Minh City at 75 cm of SLR2 scenario, inundation area 204km 2 (10%) 5
 Fig 1. 8.")
20 Fig Inundation map of Ho Chi Minh City at 100 cm of SLR3 scenario, inundation area 473km 2 (23%) Fig Inundation map of Me Kong River Delta at 65 cm of SLR1 scenario, inundation area 5233 km 2 (12.8%) 6
21 Fig Inundation map of Me Kong River Delta at 75 cm of SLR2 scenario, inundation are 7580 km 2 (19%) Fig Inundation map of Me Kong River Delta at 100 cm of SLR3 scenario, inundation are km 2 (37.8%) 7
22 1.3. Features of Viet Nam sea port development Classification of Viet Nam sea ports Viet Nam sea port system has been classified by the level of capacity and quality of sea ports in 3 categories as followed [7], [8]: Class I - The main sea ports: Total 17 sea ports including Cam Pha - Hon Gai - Quang Ninh sea ports, Hai Phong sea ports, Nghi Son (Thanh Hoa province) sea port, Cua Lo (Nghe An province), Vung Ang (Ha Tinh province), Chan May (Hue), Da Nang (Tien Sa), Dung Quat (Quang Ngai), Quy Nhon (Binh Dinh), Van Phong, Nha Trang, Ba Ngoi (Khanh Hoa), Ho Chi Minh City sea ports, Vung Tau sea ports, Dong Nai and Can Tho sea ports. Class II - The province's ports: Total 23 sea ports including Mui Chua (Quang Ninh), Diem Dien (Thai Binh), Nam Dinh sea port, Le Mon (Thanh Hoa province), Ben Thuy (Nghe An province), Xuan Hai (Ha Tinh), Quang Binh sea port, Cua Viet (Quang Tri), Thuan An sea port (Hue city), Quang Nam, Sa Ky (Quang Ngai province), Vung Ro (Phu Yen province), Ca Na (Ninh Thuan), Phu Quy (Binh Thuan), Binh Duong sea port, Dong Thap sea port, My Thoi (An Giang), Vinh Long sea port, My Tho sea port (Tien Giang), Nam Can sea port (Ca Mau), Hon Chong seaport (kien Giang), Con Dao sea port (Ba Ria Vung Tau). Class III - The local sea ports: Total 9 sea ports including Rong Doi, Rang Dong, Hong Ngoc, Lan Tay, Su Tu Den, Dai Hung, Chi Linh, Ba Vi, Vietso Petrol 01 (belonging to Ba Ria Vung Tau). And the other small sea ports. (see the map of Viet Nam existing sea ports in Fig.1.16) Existing aspects of several main sea ports a Hai Phong Port Complexion Hai Phong port complexion are the international, integrated national gateway ports with functional areas. It consists: Lach Huyen is the main port of Hai Phong port complexion, serves for general cargo vessels of DWT and container vessels of 4000 to 6000 TEU. This port is served for vessels transporting to international route. Dinh Vu mainly serves for general cargo and container; there are specialized terminals for small ships from from to DWT. Here are the overall ports of Hai Phong port complexion: Vat Cach port: Constructed in 1965, initially constructed as the bridge pier with terminal area 8X 8 m, which has five abutments for crane running for loading coal and some other goods from barges with tonnage from 100 to 200 tons. Hai Phong port (main terminal area, also known as Hoang Dieu berth, first called Six Warehouses berth) on the Cam River serves for inland container vessels, stevedoring of loading, unloading bulk cargoes, mainly for the domestic market. The port, with 11 8

. However at present it is only the second class port in the rank of Viet Nam sea ports (after Hai Phong port). Fig 1. 12.")
23 berths, the depth at berth is -8.4 meters, storage area of 31,320 m 2, yard area of m 2. Chua Ve port on the River Cam: dedicated container port, with 5 berths, the yard area is m 2. Dinh Vu and South of Dinh Vu port: can receive vessels of DWT [11]. Fig The centre of Hai Phong port b Van Phong port complexion Van Phong Port located in Van Phong Bay, Khanh Hoa Province will be the integrated large international transshipment port (as the Master Plan of Viet Nam sea Port System). However at present it is only the second class port in the rank of Viet Nam sea ports (after Hai Phong port). Fig A corner of Van Phong port A special feature Van Phong is having naturally good depth. Of the total 110 km of coastline there can have up to 60 km from the coast of Hon Gom and Hon Lon Peninsula with depths of between 15-22m which can benefit to building a port. In addition, short and stable approaching channel with depth of 22 m due to no large river 9
24 flows into is another advantage of this area. This depth is twice the limited depth of Sai Gon port (10m), and more than 4 times deeper than the port of Hai Phong (7m). Flow at the narrowest width is over 400 m, allowing two-way traffic safety [11]. c. Vung Tau ports Sea Ports in Ba Ria - Vung Tau are identified as the international gateway ports in the south of the country. Their main function is to serve for the import and export of international marine time routes for whole South of Viet Nam. Vung Tau port currently consists of four terminals. 1. The Cai Mep, Ben Dinh Sao Mai berth: This is the main port for container vessels. Currently, the terminal is capable of receiving vessels up to DWT. The government intends to develop this port in 2015 to be able to receive vessels of up to DWT. 2. The Phu My, My Xuan berth: an integrated port including container terminal is capable of receiving vessels up to DWT. As planned by the Government of Vietnam, in 2015 the station will be able to receive ships up to DWT. 3. The Song Dinh berth is capable of receiving up to DWT ships; by 2015 can receive up to DWT vessels. 4. Cai Mep International Port is a joint venture between General Maritime Corporation of Vietnam, Saigon Port and APM Terminals Group. Port has 600m of berth length, area of 48 ha, is designed for container vessels up to 160,000 DWT. After more than two years under construction, one phase of the port has completed with 400m berth length. Cai Mep international Port is also the first container port of Vietnam to allow large carriers can moor directly into the newly dredged depth of -14m; addition Cai Mep International Port is also the first port in Vietnam can accommodate largest ships in the world today with crane system Post-Panamax. Cai Mep International Terminal (Tan Thanh District) is designed to receive container ships with a tonnage of up to 80,000 DWT capacity by reaching 600,000 to 700,000 TEU per year. Wharf length is 600 m with a total area of up to 48 hectares. Thi Vai port can also receive general cargo ship with a tonnage of up to 75,000 DWT. Power through the port reached 1.6 to 2 million tons per year. The total area is 27 hectares of the port. As planned, Thi Vai-Cai Mep port will be connected to the industrial zone in Ba Ria - Vung Tau, Dong Nai province and other provinces with the provincial road 965 and highway 51. The port is capable of receiving vessels of 50,000 to 80,000 DWT. Access channel Cai Mep: Length: Channel depth: 18 miles m (CD). Tidal regime: in-equal diurnal tide. Tidal amplitude: from 1m to 4m. Average difference: 1.5 m. High water level for ship access: m. Maximum size of vessel accepted: 110,000 DWT. Berths: 10

25 Length: 590 m; Depth: m ; Vessels types: Container Warehousing of total area: m 2 Equipments: 6 cranes with outreach 55m/above rail 40m; 20 mobile cranes with 6 rows; 30 trailers for 390 passengers [11]. d. Hon Gai Ports Fig Cai Mep port with DWT vessels Hon Gai Ports are located in Ha Long Bay of Vietnam. Hon Gai Ports include: Cai Lan port: Cai Lan is a major terminal area of Hon Gai port, mainly served general cargo, container vessels with DWT, 3,000 TEU respectively. Cai Lan port has got: - 8 berths, two container terminals - An area of 10,000 m² warehouse, storage yard of 17,000 m²; - Loading and unloading equipment: a 20-ton crane, two 30-ton cranes, two 50-ton mobile crane, three 70-ton cranes and several mobile cranes from 8 to 10 tons; - The ability to ship access: Ships from to tons can berth; - Ability to handling: from 5 to 8 million tons / year. - Approaching channel: + Overall length: 36 km, including two stages: From buoy 0 to Hon Mot: 22.5 km long, m wide, -13m to -20m deep From Hon Mot to Cai Lan Port: 10.5 km long, m wide, -10m deep Maximum size of vessel accepted: 50,000 DWT Cai Lan port will be upgraded to be able to accommodate DWT ships and cargo handling capacity reached 12 million tons in 2015, 18 million tons in

![The wharf is capable of receiving ships of 80000 to 100000 tons [11]. e. Da Nang Port Complexion Fig 1. 14.](/docs-images/87/95064550/images/26-1.jpg "Container vessels in Hon Gai port Da Nang port complexions are located in Da Nang City with diurnal tidal mode (average water level difference of 0.9 meters).")
26 Thang Long wharf: It is dedicated to the transportation of cement, clinker and coal, capable of receiving vessels up to 20 thousand DWT Ben oil B12 wharf: dedicated to the carriage of liquid, capable of receiving vessels up to 40000DWT Hon Gai customers wharf: It is dedicated to passenger travel, passengers north-south, combined with clean transportation. The wharf is capable of receiving ships of to tons [11]. e. Da Nang Port Complexion Fig Container vessels in Hon Gai port Da Nang port complexions are located in Da Nang City with diurnal tidal mode (average water level difference of 0.9 meters). They consist of Tien Sa port and Han River port. The total area of yard is m 2, total area of storage and warehouse is m 2. The total length of the berth is 1647 meters. Annual cargo handling capacity is from 3 to 4 million tons per year. Ports of Da Nang are also equipped with many facilities and instruments to meet the needs of customers such as 07 tugs (power from 305HP to 1750HP); 16 mobile cranes (from 5 tons - 80 tons), 19 forklift trucks (from 1.5 tons - 42 tons), including 2 container forklifts with lifting capacity of 42 tons, 6 locomotive semi - trailers; 25 trucks [11]. Fig Berth at Han river port 12
27 Scale of Viet Nam sea ports in planning The scale of Viet Nam sea ports in planning is shown in the decision of The Prime Minister (No 202/2009/QĐ-TTg dated 24 December 2009) approved the Master Plan for Viet Nam Sea Port System by 2020 and orientation until 2030 as following [9], [10]: a) Group 1: The group in the North of Viet Nam including sea ports from Quang Ninh to Ninh Binh province. The total volume of cargo through the port is from 86 to 90 million tons per year. The main sea ports in Group 1: Hai Phong ports consist of Lach Huyen port, Dinh Vu port, Cai Lan port and the other special and local smaller ports. The ports can receive vessels of to DWT, 4000 to 6000 TEU. b) Group 2: The group in the north of the Middle of Viet Nam including sea port from Thanh Hoa to Ha Tinh province. The total volume of cargo through the port is 69 to 80 million tons per year (2015) and is 212 to 248 million tons per year (2030). The main sea ports in Group 2: Nghi Son port, Nghe An port, Son Duong and Vung Ang ports and the other special and local smaller ports. The ports can receive vessels of to DWT. c) Group 3: The group in the center of the Middle of Viet Nam including sea ports from Quang Binh to Quang Ngai province. The total volume of cargo through the port is 41 to 46 million tons per year (2015) and is from 154 to 205 million tons per year (2030). The main sea ports in Group 3: Da Nang port, Dung Quat port and the other special and local smaller ports. The ports can receive vessels of to DWT, TEU. d) Group 4: The group in the south of the Middle of Viet Nam including sea ports from Binh Dinh to Binh Thuan province. The total volume of cargo through the port is 63 to 100 million tons per year (2015) and is from 142 to 202 million tons per year (2020), is from 271 to 384 million tons per year (2030). The main sea ports in Group 4: Qui Nhon port, Van Phong port, Dam Mon port, Nha Trang port, Ba Ngoi and the other special and local smaller ports. The ports can receive vessels of to DWT. e) Group 5: The group of South-East part (Ho Chi Minh City Dong Nai Ba Ria Vung Tau). The total volume of cargo through the port is 185 to 200 million tons per year (2015) and is from 265 to 305 million tons per year (2020), is from 495 to 650 million tons per year (2030). The main sea ports in Group 5: Vung Tau port, Cai Mep port, Sao Mai-Ben Dinh port, Phu My port, Long Son port, Ho Chi Minh City ports, Dong Nai ports and the other special and local smaller ports. The ports can receive vessels of to DWT, TEU. f) Group 6: The group of sea ports of Cuu Long River Delta, the South West of Viet Nam and Con Dao islands. The total volume of cargo through the port is 54 to 74 million tons per year (2015) and is from 132 to 156 million tons per year (2020), is from 206 to 300 million tons per year (2030). The main sea ports in Group 6: Can Tho ports, Phu Quoc ports, Tien River and Hau River ports, Nam Du port and the other special and local smaller ports. The maximum port capacity can receive vessels of to DWT. (see the Fig The Map of Master Planning main container Ports) 13
28 Fig The map of Viet Nam existing sea ports (source: Ministry of Science and Technology 2010) 14

29 Fig The Map of Master plan for main container Ports (Source: Ministry of Science and Technology) The detailed maps of Master Plan for each group are shown in the appendix 1. 15
30 Chapter 2: Problem analysis and definition of study 2.1. Analysis of climate change and SLR impacts on sea ports Global warming has rooted from climate change and green house effects. When the earth is warming up the ice caps at both poles is melting together with the heavy precipitation which rises up the mean sea level faster than normal. If the situation is only a few centimeters of sea level increase per century then the matter does not pay attention so much. However, the alarming is prediction of SLR up to one meter or more by the end of the 21st century [1]. Apart from that, like a vicious circle, climate change causes higher mean sea level, more robust storming and huger wave attack to the structure. History has seen a lot more severe hurricanes with increase in intensity and level of attack. There are several historic storms during the first decade of the 21st century, viz Ivan (2004) in the Caribbean, Katrina (2005) in the south east of the State, Nargis (2008) in Myanmar... They have taken millions lives, devastated material, infrastructures Warnings have indeed grounds to worry the global people and governments [2]. Sea ports and inland ports play a significant role for economic growth and development of Viet Nam and many other countries in the world. They keep a key role in international trade; create jobs, generate wealth and value, contribute to national gross domestic product (GDP) and promote the expansion of related and near-by industries and cities. In current situation, the relative mean sea level rise in combination with hurricanes (especially in tropical regions) can bring about larger storming waves hitting the port structures which worries many port owners, designers, clients. Meanwhile port structures in developing countries have been widely designed without noticing the fact of sea level rise in their life time management. Many small to medium-scale ports in VN were designed with very small air gap above to the relative mean sea level. As known that the type, range and the magnitude of climate change impacts will vary depending on local conditions, sea ports are expected to be directly and indirectly affected by climatic changes. Direct impacts Direct impacts of SLR are likely to affect infrastructure, operations and services. Direct threats include accelerated coastal erosion, sea port and coastal road inundation or submersion, increased runoff and siltation, requiring increased dredging, water supply problems, access restrictions to docks and marinas, deterioration of the condition and problems with the structural integrity of road pavements, bridges and railway tracks. In addition, sea ports and other transport operations (e.g. shipping volumes and costs, cargo loading/capacity, sailing and/or loading schedules, storage and warehousing) may also be severely impacted. Climate change and SLR impacts directly to the hydraulic boundary conditions in designing and operation: Waves and mean sea water level. For sea ports protected by breakwaters, wave impact loads always are the main factors to reduce stability of coastal structures such as breakwaters, quay walls and jetties etc. SLR due to climate changes can cause more wave overtopping of breakwater crest, wave transmission, and consequently increase wave heights in port bays etc. 16
31 In order to enhance stability of caissons used in breakwaters, reduce waves overtopping on breakwaters, if using a solution to heighten the breakwaters more and more then it conflicts with the economical costs. If the higher crest elevation of quay walls or breakwaters then the more cost investment to create a more stable structure and stability with longer life time. Obviously, feasible technical solutions for those should be found out in the SLR due to climate changes to reduce the costs. Indirect impacts For functioning of a port (good operation), coastal protection structures are constructed like breakwaters or seawalls to create a tranquil water are inside the port. If sea level rises, these defense structures may not be well-functioned enough as in designed which causes more wave overtopping and wave transmission. The tide-window and the wave window of the port become narrower and ships have to wait longer at the anchorage to reach certain condition to enter the port. This is exactly causing more downtime problem. Indirect impacts include changes in demand for port services resulting from climate change effects on trade, investment decisions, demographics, agriculture production, forestry, energy exploration and consumption as well as fishing activity. Indirect impacts on sea ports are even harder to assess, arise through, for example, changes in the population concentration or distribution, as well as through changes in production, trade and consumption patterns, which are likely to lead to considerable changes in demand for transportation. Associated risks, vulnerabilities and costs will be significant, in particular for sea ports in developing regions with low adaptive capacity, and those in low land deltas or low-lying islands of developing countries which are often characterized by high-exposure potential and low adaptation capability. For coastal zones, climatic change factors may severely impact coastal transport infrastructure and services pose particularly serious threats to national economic development prospects. In the above situation, the theme Impacts of waves and sea level rise on ports due to global climate changes is significant for concern and study Negative impacts of climate change factors on ports Climate change factors Rising sea levels - Flooding and inundation - Erosion of coastal areas Negative Impacts - Reduce stability of coastal structures such as breakwaters, caissons, revetment etc. - Waves overtopping on breakwater crest, wave transmission and increasing wave heights in port bays etc. - Damage to infrastructure, equipment and cargo (coastal infrastructure, port-related structures etc.) - Increased erosion and sedimentation - Variation in demand for and supply of shipping and port services (e.g. relocating) 17
32 - Modal shift - Change in the structure and direction of trade (indirectly through impact on agriculture, fishing, energy) - Relocation of business and migration of people, with further economic repercussions (e.g. labour market, closures) - Challenge to service reliability - Increased dredging due to higher siltation of sediment when higher sea level occurs - Create longer downtime: port cannot well-functioned because of higher water levels combined with high waves - Increased construction, maintenance and replacement costs Extreme weather conditions - Hurricanes - Storms - Floods - Increased precipitation - Wind - Larger wave loads. - Reduce stability of coastal structures such as breakwaters, caissons, revetment etc. - Damage to infrastructure, equipment and cargo (coastal infrastructure, port-related structures etc.) - Wave over topping of jetty, breakwaters and platform of sea ports etc. - Causing non-safety for ships and vessel standing in port bays. - Erosion and sedimentation, subsidence and landslide - Reduced safety (e.g. sailing conditions) - Change in the structure and direction of trade (indirectly through impact on agriculture, fishing, energy) - Relocation of business and migration of people, with further economic repercussions (e.g. labour markets, closures) - Increases in weather-related delays and traffic disruptions - Drainage systems being overloaded causing flooding - More frequents and extensive emergency evacuations - Reduced clearance under bridges - Increased construction, maintenance and replacement costs - Challenge to service reliability Rising temperatures - Additional support services and navigation aids such as ice-breaking, waterway search and rescue. 18
33 - Melting ice - Frequent freeze and thaw cycles - Competition, lower passage tolls and reduced transport costs - New trade, diversion of existing trade, changes in structure and direction of trade (indirectly through impact on agriculture, fishing and energy) - Damage to port infrastructure, equipment and cargo - Increased construction, maintenance and replacement costs - New ship design and strengthened hulls - Environmental, social, ecosystem related and political implications - Higher energy consumption in ports, including for cargo storage and air conditioning - Variation in demand for and supply of shipping and port services - Challenge to service reliability - Increased maintenance and replacement costs Table Negative Impacts of Climate Change Factors on Ports [37] 2.3. Strong negative SLR impacts due to climate changes on Viet Nam sea ports Vietnam sea ports can be more strongly impacted by waves and sea level rise than the other countries due to the following reasons: - According IPCC, 2007, Vietnam is one of a few most vulnerable (even catastrophic) countries due to climate changes and SLR [3]. - Viet Nam located in the geographic zone has been impacted by large storms, hurricanes and tropical cyclones. For 50 years, there are 390 large storms and hurricanes that enter in Viet Nam, in which 31% of those entered in the North, 36% of those entered in the Centre, 33% of those entered the South of Center and the Southern Part. Large storms and hurricanes usually take place simultaneously with high tide water levels, strong and long lasting rains that causing floods and inundation on large scales. About 80-90% Vietnamese population is annually affected by storms and hurricanes [6]. - Strong vulnerability of SLR due to climate changes is specially paid attention by Vietnamese government. Large wave and SLR impacts are not only on port and protection structures but also on port s infrastructure, equipment, cargo, navigation, operation and maintenance of ports, services etc. Particularly inundation, slope failure, scour, siltation etc. can reduce transportation capacity of water ways, port bays in the Southern Part. - SLR due to climate changes can cause more sequent inundation in five large cities: Ho Chi Minh City, Can Tho City, Ca Mau City, Hai Phong City and Vinh Long City. In addition Hue City and Centre provinces are the most sequent inundation during flash floods and high tides that take place simultaneously in a rainy season in annual. 19
34 Transportation in general and transportation for a port operation can be interrupted in those situations. - Ho Chi Minh City and Mekong River Delta have many large important sea ports. They will be heavily impacted by SLR due to climate change. - For Ho Chi Minh City, if SLR1 scenario takes place with 65 cm of sea level rise, then the inundation area equal 128 km 2 (occupy 6,3% of total area); if SLR2 scenario takes place with 75 cm of sea level rise, then the inundation area equal 204 km2 (occupy 10% of total area), if SLR3 scenario takes place with 100 cm of sea level rise, then the inundation area equal 473 km 2 (occupy 23% of total area). - For Me Kong River Delta, if SLR1 scenario takes place with 65 cm of sea level rise, then the inundation area equal 5133 km 2 (occupy 12,8% of total area); if SLR2 scenario takes place with 75 cm of sea level rise, then the inundation area equal 7580 km 2 (occupy 19% of total area); if SLR3 scenario takes place with 100 cm of sea level rise, then the inundation area equal km 2 (occupy 37,8% of total area)[5]. - Storm surge caused by storms and hurricanes in Viet Nam is must be specially paid attention. The recorded data show that storm surge heights can raise from 2.0 m up to 4.0 m and their transmission goes a long distance to inlands by rivers. Consequently the free board for ships, the capacity of ports and waterways will be reduced in operation. - So far, all of the built sea ports as well as their wharfs, storages, roads to the ports, jetties, breakwaters etc. in Viet Nam have been not taken account SLR due to climate changes. If SLR3 scenario (with 100 cm of sea level rise) and a large storm surge taking place, the all most sea ports of Ho Chi Minh City, Dong Nai, Ba Ria-Vung Tau, Con Dao Island and Mekong River Delta can be submerged under sea levels and the ports of Bac Bo Delta (as Hai Phong, Quang Ninh ports) can be submerged significantly. - For last decades the sea port system, particularly the large sea ports of Viet Nam as Hai Phong, Hon Gai, Vung Ang, Chan May, Da Nang, Dung Quat and Ho Chi Minh City ports has met the international and inland transportation requirements for economic growth and development of Viet Nam. - In the Master Plan of Viet Nam sea ports by 2020 and oriented by 2030, all most sea ports will be expanded to upgrade their capacity. Especially Van Phong and Vung Tau ports will be the international the port integrated national, international transit (type 1A) and Nam Du port will be the first deep sea port of Vietnam able to receive large vessels, Nam Du is also expected to act as an export hub for rice and seafood, two of South Vietnam's major export products [9]. In the near future the strong sea port development of Viet Nam is being faced with the strong negative impacts of wave and sea level rise due to climate changes Study objectives The General objective is: - To have better understanding of global climate changes, ocean thermal expansion, glacial melt, sea level rise, tropical cyclones, storms, hurricanes and waves will become heavier negative impacts; - To have better understanding of the impacts of waves and sea level rise due to climate changes on sea ports and their protective structures. 20
35 - To have better understanding of Viet Nam Sea ports in the existing condition and in the near future. Specific Objectives in the case studies are: - To determine wave and sea level rise loads on breakwater s caissons; - To determine waves overtopping on breakwaters, wave diffraction in port bays; - To determine the feasible solutions for enhancing stability of caissons, adaptation measures for sea ports in sea level rise scenarios; - To compare the situation of breakwater s caissons with and without climate change conditions; - To withdraw the necessary conclusions and recommendations for sea ports in global climate changes Study methodology Data collection, summary and analysis of the officially studied results (on climate changes, SLR, waves, existing and future conditions of Vietnamese sea ports etc.) of the international and Vietnamese scientists, institutions, governments, organizations are carried out to refine and to definite the significant and limited problems of study in this thesis. Literature overview of wave loads on jetties and breakwaters. Using the formulae of Goda for calculations of wave and SLR loads on breakwaters in the designed case and the SLR scenarios. Using the diagrams of Goda for calculations of wave diffraction in port bays. jetties, Using the formulae of Franco et al. (1995); Besley (1999) for calculations of mean wave overtopping discharges, maximum wave overtopping volumes, wave transmission by wave overtopping in the designed case and the SLR scenarios for composite breakwaters. Setting up the feasible structure solutions so that to ensure the sliding stability of caissons in composite breakwaters impacted by SLR due to climate changes. Withdrawing of the conclusions, recommendations and adaptation measures for sea ports impacted by wave and SLR due to climate changes. 2.5 Problem definition of study Climate changes and SLR not only impact on structures of sea ports but also on infrastructure, equipment, cargo, navigation, operation and maintenance of ports, services etc. Their impacts are in a large sphere. This thesis only mentions and deals with some direct impacts of waves and SLR due to climate changes on sea ports. The problems for study in this thesis are: - To investigate waves, sea level rise due to climate changes and climate change scenarios; - To investigate capacity of Vietnamese sea ports in existing conditions and in near future; 21
36 - To investigate the calculation methods for wind waves, wave loads on exposed jetties, breakwater and caissons, wave overtopping on breakwaters, wave diffraction in port bays; For Nam Du Port case study: - To review the wave and SLR conditions for Nam Du port in the designed case and in Viet Nam SLR scenario; - To calculate the extreme wave crest elevation of max and to check the wave impacts on desks of jetties (the wave can touch the desk's underneath of jetties or not). - To assess the designed crest elevation of Nam Du jetties in SLR scenarios of Viet Nam. For Nam Tien Sa Port case study: - Based on the wave analytical results in the designed phase, carrying out a prediction of wave heights at the sites of Tien Sa breakwater in SLR scenarios. - Calculating wave and sea water loads and stability of Tien Sa breakwater/s caisson in the designed case and in SLR scenarios. - To propose a solution so that enhancing stability of the caissons in SLR scenarios (in the repairing case of Tien Sa breakwater). - To propose a solution so that enhancing stability of the caissons in SLR scenarios (in the newly designing case of Tien Sa breakwater). - Calculating wave overtopping on Tien Sa breakwater (mean wave overtopping discharge, maximum wave overtopping volumes by one wave, wave transmission by wave overtopping). - Calculating wave diffraction in Tien Sa port bay by using the schemata of Goda for calculations of wave diffraction in port bays. To withdraw the necessary conclusions and recommendations based on the achievements in this study. 22

37 Chapter 3. Wave loads on jetties and breakwaters 3.1. Background Jetties and breakwaters are two types of structures that have differences in functioning and workability condition. A jetty is the structure that runs from shallow to deep sea water. Thanks to that vessels can utilize the deep sea level without dredging or constructing a sheltered area. Typically, those for Liquid Natural Gas, and Liquid Petroleum Gas or bulk cargoes which do not require deep water and sheltered berths for larger vessels. As mentioned, the advantage of this type of structure is the convenience, economic and light and can accommodate at remote location without entering a port. The shortcoming of a jetty is that due to light structure composing of piles and decks and placed in remote location where horrendous hurricanes often occur, jetties are directly impacted by high storm waves with short period and strong magnitude; hence the light structures are easy response the that high frequency which lead to an avoidable phenomenon: resonance. A breakwater is the one that used for two purposes. In functioning of a port, breakwaters introduce new possibility for commodity exchange and maintenance procedures (the serviceability aspect). For defending a harbor, coastal inlets and polders or other types of land from flooding, the necessity to construct such breakwater types arises. The type of cargoes that a port with breakwater serves for is general cargoes, containers, bulk cargoes. They are heavy type structures with much more investment, however, it can well sustain with extensive wave loads and easy to extension or enhancing if it is needed for further development [19], [20], and [22]. Fig Typical exposed jetty in front of sea 23

38 Fig Direct wave impacts on breakwaters In fact, wave loads on caisson breakwaters is the combination of horizontal quasi-static or impact pressure and also uplift pressure which work against the bottom slab of a vertical breakwater. For the stability analysis, semi-empirical formulae of Goda (1985), Goda & Takahashi (1994) are satisfactory predicted the quasi-static load under breaking and non-breaking wave conditions. In this method, the maximum wave pressure occurs at the still water level and the uplift force occurs at the seaward edge of caisson and decrease linearly to zero at the other end. This uplift force may be due to wave action, the buoyant force or the hydrostatic pressure difference. For details, see section 3.3 Unlike the case of a vertical structure when the propagation of energy is obstructed by an upright wall, in case of a horizontal platform, energy is partly continued to be transferred after partly interaction with the plate or even totally dissipated after totally interaction with the plate. Because there is left a safety gap between the deck and the water level, waves will propagate underside the deck or when reaching higher they will propagate over the deck. In that situation, wave impact to the deck (and the beam) in the vertical direction from underside or above the deck, as well. Horizontal loads on beam elements often exhibit different characteristics from vertical wave loads. The magnitude of the first impact load on an external beam (i.e. vertical element at the edge of the jetty) is generally lower than the corresponding vertical impact. This report will not go in detail in horizontal beam loads on horizontal plates [20], [21]. 24
39 3.2. Wind wave theory Regular waves The distinction is often made between regular and irregular waves. Regular waves are periodic repetitions of the same wave, while irregular waves show continuously different wave heights and periods. Regular wave never happens in nature but swell can come close to regular waves [26]. Linear wave theory is the basic theory to describe a single wave. A wave is the profile of the surface elevation between two successive downward zero-crossings of the elevation (zero = mean of surface elevations, see Fig. 3.3). A surface elevation can be negative, whereas a wave cannot. The most important characteristics of the waves are: Fig 3. 3.Sinusoidal wave shape (Magchiel van Os (2002)) Irregular waves In practice, wave climate is random field which is dependent on temporal and spatial concept, factor relating to bottom and coast geometry, the sea climate, meteorology Wave theory that account for such factors is non-linear wave theory. According to this, waves are described randomly over a long range of observed data statistics over time and space. There are 2 ways of expressing non-linear waves: Wave statistics and wave spectra. a Wave statistics According to statistical analysis, wave parameters are described due to p% frequency (0.1%, 1%, 2%...) Wave parameters are: + Wave height is expressed in H 1/3 or H s : significant wave height which is average of the highest third of the waves. Maximum individual wave height H max Mean root square wave height H rms + Wave period: significant wave period, root mean square wave period 25

40 b Wave spectra In theory of wave spectrum, the water elevation is the summation of numerous different harmonics sinusoidal waves with different amplitudes, frequencies, direction and phase. Each of irregular random waves is composed of a number of single waves, harmonics and linear. Wave spectrum is named due to researchers and places: Pierson-Moskowiz, Jonswap, NeuMann, Roll-Fisher, Storckelov, Burling, Crulov, Bretschneider, and Davidan. The relation between wave spectral energy density and frequency is described as followed: JONSWAP spectrum (Joint North Sea Wave project spectrum). (Fig.3.4) Considerable data taken off from the western shore of Denmark was used to produce a model of the wave spectrum (Hasselmann, 1973). The model is Eq 3. 1 Where: Eq 3. 2 f is the frequency, f p is the peak frequency (frequency at which S(f) is a maximum), α is the Phillips constant (sometimes called the equilibrium-range parameter), γ is the peakenhancement factor (usually taken to be 3.3), and β = 0.07 for f< f p or β = 0.09 for f > f p There is a slight dependence on the fetch in f p and α. Hasselmann (1973, 1976) used the non-dimensional quantities derived above to create two empirical relations. They are Eq 3. 3 Pierson-Moskowitz Spectrum (Fig. 3.4) E PM g ( f) exp f f f p 4 Eq 3. 4 where --- constant depending on wind 26

41 Fig Jonswap and Pierson-Moskowitz spectrumfig Observations to record wave events are very significant for setting up wave spectra and statistics. The following example shows the case of extreme wave ever was recorded: In February 2000 those onboard a British oceanographic research vessel near Rockall, west of Scotland experienced the largest waves ever recorded by scientific instruments in the open ocean. Under severe gale force conditions with wind speeds averaging 21 m/s a ship-borne wave recorder measured individual waves up to 29.1 m from crest to trough, and a maximum significant wave height of 18.5 m. The fully sea developed in unusual conditions as westerly winds blew across the North Atlantic for two days, during which time a frontal system propagated at a speed close to the group velocity of the peak waves [26]. Fig The individual wave record for 7 11 February Data recorded at 1 second intervals with 10-minute breaks every 8 hours while data were saved. 27
42 Fig The wave records for the three largest measured individual waves (Source: Naomi P. Holliday, Margaret J. Yelland, Robin Pascal, Val R. Swail, Peter K. Taylor, Colin R. Griffiths, and Elizabeth Kent; Were extreme waves in the Rockall Trough the largest ever recorded? GEOPHYSICAL RESEARCH LETTERS, VOL. 33, L05613, doi: /2005gl025238, 2006) 3.3. Types of wave impact loads The wave behaviors on structures will cause relative load types: - Reflected waves on structures cause a type pulsating wave loads; - Breaking waves on structures cause a type wave impact loads; - Broken waves on structures cause a type broken wave loads. It is necessary to distinguish types of wave impact loads, as following: (a) Quasi static loads (Quasi - standing loads or Pulsating loads) for which available formulae (e.g. Sainflou, Minikin, Goda below) without any account for load duration. Slightly breaking wave loads which already consist of some breaking waves but not significantly exceeding the Goda loads (Fig. 3.7). (b) Dynamic impact loads for which new formulae including impact duration; That means the wave impact duration is taken account in formulae. (c) Dynamic broken wave impact loads, i.e. the waves already brake before reaching the structure. Application of Goda Formulas for calculating Quasi-static wave loads on vertical walls is shown in Fig
43 Fig Pulsating and impact loads for a vertical wall (Kortenhaus et al 1997) Under a standing wave or a slightly breaking wave, a quasi-static force is generated after the instance of impact. The duration of this load is in the order of wave period. This load has actually varied slightly over time but when looking at larger scale, this variation can be neglected and it can be considered as quasi-static. Goda & Takahashi (1994) is almost solved to estimate the quasi-static load but the dynamic impact load. For the above purpose the PROVERBS parameter map (Fig. 3-8) was developed by Kortenhaus et al Input for this map are geometric and wave parameters which in combination yield an indication of a certain probability that one of the aforementioned breaker types will occur [22]. Fig PROVERBS parameter map (Kortenhaus et al 1997) 29
: Probabilistic Design of Vertical Breakwaters. Balkema, Amsterdam 316 p.) 3.4.")
44 A Parameter Diagram for Calculation Quasi-Static Loads and Impact Loads is shown in Fig Fig Parameter Diagram for Calculation Quasi-Static Loads and Impact Loads (Source: Oumeraci et al (2001): Probabilistic Design of Vertical Breakwaters. Balkema, Amsterdam 316 p.) 3.4. Quasi-static wave loads pulsating loads Sainflou s formula (1928) As well known, Saiflou published a theory of trochoidal waves in front of a vertical wall in 1928 and presented a simplified formula for pressure estimation. The pressure distribution is sketched as in Fig and the pressure intensities and the quantity of water level rise h 0 are given as Fig Wave pressure distribution by Sainflou 30
45 Eq 3. 5 h o = the height increase of the middle level [m] H i = the wave height of the incoming wave [m] k = the wave number of the incoming wave [m -1 ] Sainflou and Stoke s second order wave theory conclude the maximum pressures at the middle of the water level. And the mean water level increases to MSL + ho. Sainflou [1928] presented the above formula for standing wave pressures of non-breaking type and the formula has been so utilized. The formula does not tell which H i is chosen. So in application Hi is often taken as H 1/3. Sainflou does not include the reduction factor of pressure due to wave overtopping and oblique wave direction. It also underestimated of wave pressure under storm conditions. Minikin Model (1963) Minikin s model is based on both laboratory tests and on prototype measurements. He developed a prediction method for estimation of local wave impact pressures caused by waves breaking directly on a vertical seawall. As the field measurement at Dieppe revealed the existence of very high pressures caused by impinging breaking waves and the phenomenon was confirmed by laboratory experiments by Bagnold [1939], harbor engineers in western countries began to worry about the impact breaking wave pressures. The maximum pressure is: Fig Broken wave pressure due to Minikin (1963) Eq 3.6 C mk - coefficient of the impact 2 H b - breaker height (m) 31
46 d s - depth in front of the wall (m) D- depth at one wave length in front of the wall (m) L D - wave length at depth D (m) The resultant force according to Minikin: Eq 3.7 More recent study demonstrated those formulae to be qualitatively incorrect as F h in (3-7) decreases with increasing wave length (actually it should increase with increasing wave length as explained above) Minikin did not give any explanation how he derived the above formulation except for citing the experiments of Bagnold. In the light of present knowledge on the nature of impact breaking wave pressures, the formula has several contradictory characteristics. First, the maximum intensity of wave pressure increases as the wave steepness increases, but the laboratory data indicates that waves with long periodicity tends to generate well developed plunging breakers and produce the impact pressure of high intensity. In fact, Bagnold carried out his experiments using a solitary wave. Second, Eq. 3-6 yields the highest p max when d s is equal to D or when no rubble foundation is present. It is harbor engineers' experience that a breakwater with a high rubble mound has a larger possibility of being hit by strong breaking wave pressures than a breakwater with a low rubble mound. Goda s Formula (1984) Goda did a broad set of laboratory work and theoretical considerations for wave pressure on a rock sill. This expression can be used for broken and breaking waves. Latter his work has further developed by Takahashi et al. (1993) including the effects of berm, sloping top, wave breaking and incident wave angle. The Goda prediction method represents a benchmark in the evolution of physically rational approaches to the assessment of wave loads at walls. The wave pressure formula proposed by Goda [1984] for the design of vertical breakwaters assumes the existence of a trapezoidal pressure distribution along a vertical wall, regardless whether the waves are breaking or non-breaking waves. Goda takes H max as the highest wave out of 250 waves. This has a probability of exceedance of 0.4%. Furthermore, the wave height is taken seaward of the surf zone. Within the surf zone the height is taken as the highest of the random breaking waves H max at a distance of 5H 1/3 seaward of the breakwater. The assumption of a trapezoidal pressure distribution results from measurements in which he found the distribution shown in Figure
![Fig 3. 12. Wave pressure distribution for non-breaking waves by Goda's formulae (modified by Tanimoto) In the experiments done by Goda [1984] regular waves were used.](/docs-images/87/95064550/images/47-0.jpg "The maximum pressure at the still water level for a non-broken wave is defined by: Eq 3.")
47 Fig Wave pressure distribution for non-breaking waves by Goda's formulae (modified by Tanimoto) In the experiments done by Goda [1984] regular waves were used. The maximum pressure at the still water level for a non-broken wave is defined by: Eq 3.8 = angle of the wave direction Other parameter used in Goda s formulae: Parameters Formulae Description P 1 p max Maximum pressure at still water level P 2 P 1 /cosh(2 h/l) Pressure at the bottom of structure P 3 α 3 p 1 Pressure at toe depth p u ½(1+cos )α 1 α 3 gh max Uplift pressure under wave side * 0.75(1+cos )H max α /2[(4 h/l)/sinh(4 h/l)] 2 Wave period influence α 2 Foundation height influence α 3 Interpolation between α 1 and α 2 H b the water depth at distance 5H 1/3, d- depth in front of the breakwater, h - water depth above the foundation plane The original Goda formula has many advantages like the ability to be employed both for standing and slightly breaking waves and the clarification of uplift pressures. To use this 33
48 formula for impact waves, it was subsequently extended with the incident wave direction, correction factors applicable to other types of vertical walls and the impulsive pressure coefficient (Takahashi et al., 1994). Eq = 3 =1 2 = max(1, α I /α 2 ) α I = Impulsive coefficient α I = α m α n α m = min(h 1/3 /d,2) α n = [cos( 2 )]/cosh( 1 ) if 2 0 if 2 > 0 1 = if = if 11 > 0 2 = if = 3 22 if 22 > 0 B M = the width of the berm in front of the wall [m] 3.5. Dynamic impact wave loads Background Under a breaking wave, the model of dynamic impact loads need be applied for two cases as following: - Dynamic impact loads for which new formulae including impact duration. That means the wave impact duration is taken account in formulae. - Dynamic broken wave impact loads, i.e. the waves already broke before reaching the structure. When waves impact a seawall, vertical breakwater, exposed jetty, pier or a coastal bridge, they abruptly transfer their momentum into the structure. This energy transfer can be very violent and its duration exceptionally short. Unlike unbroken waves, for breaking waves, the pressure distribution is not a measure for the force on the wall. The particle velocity hitting the wall is of importance to the magnitude of loads. The shape of breaking waves and the possible of air trapped between the wall and the waves largely determines the maximum peak pressure and the duration time of impact. Due to the collision between the wave and the structure a transfer of impulse takes place. At the instance of impact to the structure the wave 34

![]. 3.5.2. Breaking Wave Loads The impact waves on maritime structures generate a high intensity pressures that vary quickly in time.](/docs-images/87/95064550/images/49-1.jpg "So, it is necessary to determine wave impact loads by a method of dynamic analysis.")
49 causes a peak pressure that has a substantially greater intensity than the pulsating load (in order of 10 times) but in very short duration (in order 1/100s). Still a lot of questions remain on the accuracy of prediction formulae for the dynamic impact, especially concerning to the role of air compression [13], [19], [21] Breaking Wave Loads The impact waves on maritime structures generate a high intensity pressures that vary quickly in time. So, it is necessary to determine wave impact loads by a method of dynamic analysis. The simple method to determine dynamic wave impact loads is summarized as follows: a) Replacement of impact load history by a triangular load Fig The replacement of impact load history by a triangular load (Oumeraci et al (2001): Probabilistic Design of Vertical Breakwaters. Balkema, Amsterdam 316 p.) b) Setting up diagram of wave impact pressure distribution on structures Fig A diagram of wave impact pressure distribution on structures (Oumeraci et al (2001): Probabilistic Design of Vertical Breakwaters. Balkema, Amsterdam 316 p.) 35

50 c) Calculation of dynamic impact loads as Static Equivalent wave Loads ( F ) v. F Eq 3.10 h stat D h, max with v D = dynamic load factor. Calculation of dynamic load factor ν D by assuming a triangular load-time function: Maximum Impact force F h, max [kn/m]: Eq 3.11 H b = Breaker height Rise time of impact force t r : h = Water depth directly at the wall Total load duration t d : Eq 3.12 T p = Peak period Or approximated by: Eq 3.13 t d = 2.5t r Eq 3.14 Determination of the dynamic load factor v D : The formula: v D With t d 0.55 td 1.4 tanh( ) ( T ). N TN c Eq 3.15 T N - natural frequency of the structure The diagram of relation between v D and ratio t D /T N : Fig The diagram for determination of vd = f(t d /T N ) (Source: Oumeraci et al (2001): Probabilistic Design of Vertical Breakwaters. Balkema, Amsterdam 316 p.) 36
51 3.6. Wave loads on exposed jetties Background Wave induced loads on a platform, deck or beams take place when the waves hit and/or inundate the structure. Wave-in-deck loads are listed below and shown in Fig. 3-17: Horizontal wave loads on beams, fenders or other projecting elements; Wave uplift loads on decks; Wave uplift loads on beams, fenders or other projecting elements; Wave downward loads on decks (inundation and suction). Fig Wave-in-deck loads on exposed jetties Wave-in-deck loads may be considered as the three phases in Fig At the instant of contact between the wave crest and the soffit of the deck, the impulsive force is potentially large in magnitude and short in duration. This is followed by a pulsating (slowly-varying) positive force and then by a pulsating (slowly-varying) negative force, especially if the deck is consistently inundated. When a wave propagates underneath the platform, outshooting jets are evident at the wave front at all times as impact occurs continuously along this front. The laterally outshooting jets disappear as soon as the free surface of the water alongside the platform starts to rise up along the soffit level. A difference in elevation between the fluid underneath the platform and that alongside the platform starts to develop which gives rise to the generation of the pulsating positive force (uplift). Laboratory studies have shown that wave height (or wave crest elevation) and clearance above the still water level (i.e. vertical distance from the bottom of the deck and the SWL) mainly govern this kind of force. Eventually, the free surface of the undisturbed wave falls below the soffit level; the free surface underneath the platform moves inward, reducing the contact area between the platform and the wave. A pulsating (suction) force acts under the platform, mainly governed by its width and clearance, and from wave height. When the wave inundates the deck consistently, another contribution to the negative load, due to the weight of the green water above the deck, is applied. This type of force, coupled with suction force 37
52 can generate a significant downward load, sometimes of the same order as the pulsating positive uplift force [13], [19], [21]. Fig Vertical force history on deck (units at model scale) Source: Matteo Tirindelli, Giovanni Cuomo, William Allsop, Alberto Lamberti, Proceedings of The Thirteenth (2003) International Offshore and Polar Engineering Conference) A jetty is a structure projecting from the shore and providing berths to vessels in relatively deep water. For these structures, wave-loads depends on both the kinematics of the incoming wave and the characteristics of the structure; more specifically, in some cases, in addition to the loads acting on the supporting elements, also wave-in-deck loads, acting on the deck, are to be considered. Starting from the original work by Morison, sophisticated models of wave-in-deck loads have been developed in recent years. Vertical elements (beams, fenders or other projecting elements). The characteristics of these loads vary for different structures. In general, a wave propagating along a jetty transfers its momentum to the structure: thus, the resulting loading process is strongly related to both the kinematics of the wave-induced flow and the characteristics of the structural element of or protruding from the suspended deck. Moreover, as most structural elements are located above the still water level, the projected wetted area varies with time as a function of the immersion of the elements as the wave travels along the structure. Although deformations within both the fluid and the structure could be noticeable during most severe events, to fully take into account the complex phenomena that are involved in wave-structure interaction is not practical; several simplifications have to be made to model the overall loading process. In what follows, the incoming wave kinematics is assumed to be unaffected by the presence of the structure. With regard to exposed jetties, guidelines for the evaluation of the design loads have been recently formulated in the framework of the Piers and jetties and related structures exposed to waves in McConnell et al They represent an efficient engineering tool to predict wave forces on jetties for standard design purposes; in particular, in order to generate the time-histories of the wave loads to be used in 38
53 evaluating the nonlinear dynamic responses of such structures, the model proposed in (Kaplan et al. 1995) is indicated. This model, like the one proposed by (Bea et al. 2001), is based on the superposition of the inertia, drag and buoyancy terms, in turn expressed as a function of the kinematics of the incoming wave and introducing semi-empirical coefficient Kaplan s Model Kaplan (1992), Kaplan et al. (1995) and Murray & Kaplan (1997) investigated wave forces on flat decks and horizontal beams on offshore platforms. Wave-induced forces on platforms can be considered as combined of momentum (inertia + added mass), drag force and buoyancy. Kaplan developed a model based on Morison s equation to predict horizontal and vertical wave-induced forces. He found a clear dependence of impulsive forces on deck clearance and wave crest elevation, while pulsating positive and negative forces were found to be dependent on wave period through the wetted length of the testing element. His model works through the following equations Eq. 16 for vertical forces, Eq. 17 for horizontal forces. Eq 3.16 Eq 3-17 where: b is the width of the deck; η is the wave surface elevation; l (platform length) and l/ t are determined from the relative degree of wetting of the flat deck underside on which loading occurs; a is the thickness of the deck; C d is the drag coefficient, L is the horizontal length dimension of the element, c is the vertical wetted length of the element, u is the wave velocity in horizontal direction Bea et al. Suggestion Bea et al. (1999) state that wave-in-deck loading is an extremely complex problem that needs an integrated approach. Their analysis treats the total wave-in-deck force (Ftw) on a platform deck as an extended version of Morison s equation, where the different components are: slamming (Fs), drag (Fd); lift (Fl), inertia (Fi) and buoyancy forces (Fb). Their suggestions for wave-in-deck forces is Ftw FS Fd Fl Fi F b Eq Sterndoff s Suggestion Sterndorff (2002) analysed large scale tests to measure wave loading on an offshore platform. He focused on horizontal loads on beam elements, testing different structure configurations, with series of regular and irregular waves. He compared experimental 39
54 results with a numerical procedure for prediction of wave forces on offshore platform decks derived from a modification of Morison s equation, with an approach quite similar to Kaplan s model: Eq 3-19 where: M is the added mass, V is the velocity, ρ is the density of the water, S is the immersed surface of the element, P is the total pressure, A is the area. He found substantial agreement between measured and calculated forces and pointed out a strong linear dependence of horizontal pulsating wave forces on deck inundation [38] Kaplan s Model Update Referring to Kaplan s model (1995), it has to be noted that the time variation of the force is not predicted satisfactorily if compared with empirical records (Cuomo et al. 2003). Wave-in-deck loads are more consistently modeled adapting Kaplan s model that is, replacing the added mass term according to the more general expression given by Payne (1981). This updated model gives results that are in good agreement with the analytical expressions that can be applied to structures of simple geometry (Sarpkaya and Isacson, 1981), but is able to take into account the three dimensional effects given by the finite dimensions of the elements. Thus, the vertical F V and horizontal F H timevarying loads on the suspended deck are respectively given by the following Equations 20, 21: Eq 3.20 Eq 3.21 In the equations: b is the width of the element; h is its supporting thickness; l is the wetted length, that is, the projection, normal to the direction of the wave load, of the part of the element that is inundated [after (Kaplan et al. 1995)]; () t is the free surface elevation; dv = dv(t) is the volume of the element inundated at each time; C d is an empirical coefficient [whose value can be taken as 2.0, in Eq. (3-20) and as 1.0, in 40
55 Eq. (3-21), as suggested in (Kaplan et al. 1995); finally, u = u (t) and v = v (t) are, respectively, the horizontal and vertical components of the velocity of the water particle located at the centroid of the wetted length Cuomo and Allsop (2006) Cuomo and Allsop have done tests on laboratory and their results is based on experiment as following: F max Fig Definition of force parameters impact force (short duration, high magnitude) F qs+,v or h Maximum positive (upward or landward) quasi-static (pulsating) force F qs-,v or h Maximum negative (downward or seaward) quas-static (pulsating) force t r the time elapsing between start of the event and the maximum being reached max Clearance c 1 Fig Definition of Fv* and Fh* and dimension of the calculated deck This basic force F* v is calculated for a wave reaching the predicted maximum crest elevation, max, whilst assuming no water pressure on the reverse side of the element. F* v is defined by a simplified pressure distribution using hydrostatic pressures, p 1 and p 2 at the top and the bottom of the particular element being considered: 41
56 p 1 = [ max (b h + c 1 )] p 2 = ( max c 1 ) g where p 1, p 2 are the pressures at the top and bottom of the element, b w and b h are the element width and height, b l is the element length, c 1 is the deck clearance and max is the maximum wave crest elevation. The basic horizontal wave force F h * is defined as followed: And a. Prediction of vertical wave forces on jetty deck elements for for Vertical force measurements (upward and downward) from model tests at HR Wallingford are presented in dimensionless form: Eq 3.22 F vqs (+/-) is the force to be determined, positive/negative vertical quasi-static force; F* v is defined in Fig. 3.20; a &b is the shape of fitting curve Coefficient for prediction of vertical wave forces using Eq Wave load and configuration a b Upward vertical forces (seaward beam and deck) Upward vertical forces (internal beam only) Upward vertical forces (internal deck, two-and three dimensional effects) Downward vertical forces (seaward beam and deck) Downward vertical forces (internal beam only) Downward vertical forces (internal deck, two dimensional effects) Downward vertical forces (internal deck, three dimensional effects) Table Coefficients for prediction of vertical wave forces on jetty structures b. Prediction of horizontal wave forces on jetty deck elements Horizontal wave force measurements (seaward and landward) from model tests at HR Wallingford are presented in dimensionless form: Eq
57 F vqs (+/-) is the force to be determined; F* h is defined in Fig Coefficient a,b: the shape of fitting curve for various configurations are given below: Wave load and configuration a b Shoreward horizontal forces, F hqs+ (seaward beam) Shoreward horizontal forces F hqs+ (internal beam only) Seaward horizontal forces (seaward beam) Seaward horizontal forces ( internal beam) c. Wave impact forces Table Coefficient for prediction of horizontal wave force on jetty deck element In the tests done by Cuomo and Allsop, for each impact the maximum value reached by signal (F max ) within each event has been extracted, together with rise time t r. For any particular impact event, it is possible to define a dimensionless load as F max /F qs+250, where F max is the peak force recorded during that event (Fig 3.19), and F qs+250 is the average of the maximum four values of quasi-static force extracted from each test (of 1000 waves). Dimensionless rise time can also be defined as t r /T m, in which T m is the mean wave period for each test. The general expression for the impact force as followed: Eq 3.24 With a and b constants for each dataset and is taken as followed for the vertical impact force on deck and beam element. Configuration a b Moderate prediction Conservative prediction Moderate prediction Conservative prediction Deck elements Beam elements Table 3. 3a. Coefficient for prediction of vertical impact forces on jetty structure With a and b constants for each dataset and is taken as followed for the horizontal impact force on deck and beam element. Configuration a b Moderate prediction Conservative prediction Moderate prediction Conservative prediction Deck elements Beam elements Table 3. 4b. Coefficient for prediction of vertical impact forces on jetty structure 43
58 The response of the structure depends on the relationship between the natural frequency, 1/T N and the frequency of loading, f. For wave forces, f is equivalent to the inverse of the duration of the loading represented by the rise time, t r (f = 1/t r ). For quasistatic loads the rise time is typically of the order of times the wave period. However, impact duration is significantly shorter. A generalized representation of dynamic response of structures is shown in Fig There are 3 key regions in this figure: Fig Dynamic response curve - f<1/t N in this region the response of the structure is quasi-static and will be similar to the static response, being controlled by structural stiffness. - f 1/T N in this region, where the load frequency is similar to natural frequency of the structure, the response can be significantly greater. The actual response is controlled by damping of the structure. - f>1/t N in this region, the loading frequency is higher than the natural frequency of the structure. Response is controlled by mass (inertia) of the structure, and typically reduces as loading frequency increases. Response may be less than that for static forces of the same magnitude, although fatigue may be an issue. It can be seen that impacts are the most of concern for elements with high natural frequencies, close to frequency of impacts loads. To get an efficient estimate of impact loads, it should be taken into account with the dynamic amplification/reduction factor due to structural resonance during the loading process. However, it requires more sophisticated analysis of the dynamic behaviour of the structure than what is often available. Chapter 4 will give an imaginary case to calculate the wave impact loads and their short duration on jetty deck Wave loads and overtopping experiments on jetties Background Of particular concern in these locations is the risk of occurrence of wave forces on the jetty superstructure and the likely magnitude of such forces should they occur. As well as being important for the design of structure elements, these loads need to be considered when assessing the potential for damage to equipment located on approach 44
59 trestles and jetty heads. There are also potential environmental risks arising from damage to exposed jetty facilities, particularly those carrying oil or other hazardous materials. The maximum wave crest elevation is predicted for the design condition and the deck (or soffit) level is located at an allowance or 'air gap' above this elevation to ensure a low probability of occurrence of wave forces on the superstructure. The 'air gap' approach is often adopted in the design of shore connected trestles and jetties, however the design of structures in this environment may be dictated by other constraints which prevent the adoption of this method. Constraints may include vessel freeboard at berth, the need for loading / offloading and tidal range, all of which dictate practical deck levels to ensure efficient operations. In addition there may be considerations such as material costs, member sizes and construction methodology. In such cases there may be a risk of wave loads on the structure. Methods available to the designer for prediction of the forces are limited, complex to apply and practical guidance for their use is not readily available [19]. Jetties and off-shore platforms cannot easily be placed so high above the mean sea level that they are never reached by the waves. Waves hitting the front and the soffit or the deck apply a horizontal and a vertical load. In some cases, mainly dependent on the wave shape and velocity, severe impacts may occur producing damages [20] Sea structures as jetties are very often designed for allowable wave overtopping conditions. Physical modeling or numerical modeling or a combination of both are used in the design. These experiment models need to be calibrated and model results need to be verified against prototype conditions Example of Wave Load Experiments on Jetties The large scale tests were carried out in the period August-September 2009 at the Grosse Wellen Kanal of the Forschungs Zentrum Küste (FZK) in Hanover. The wave flume is 309 m long, 7 m high and 5 m wide. The aim of the experiments was to investigate on the loads applied by waves on exposed jetties and, more specifically, on scale effects Model geometry, tested configurations, instruments position and the structure dynamics are described in detail and will form a reference for future investigations. The system eigenfrequancies and eigenmodes are studied, and in particular a 11 Hz vertical oscillations is recognized. Based on the convective velocity of the wave, pressure data are low-pass filtered at 100 Hz and forces on the structure are obtained by spatial integration. Initial analysis show that the vertical impact load process is inherently uncertain, but quite dependent on the venting and confinement conditions under the deck. The air cushion effect, studied also by means of a numerical model, tends to reduce the maximum uplift force [20]. 45

 the vibrations of the steel frame.")
60 Fig The rigid steel framework holding the jetty from above (the wave is just touching the deck soffit). The structure dynamics is investigated in the experiment by means of two accelerometers placed within the first bay. One instrument, measuring the acceleration along the horizontal direction, does not record only on the overall jetty oscillations, but unfortunately- also on the wooden vibrations. The other one, along the vertical direction, measures (beside the overall oscillations) the vibrations of the steel frame. The latter disturbances were approximately 5 times greater than the former ones. Figure 3-23 shows the vertical acceleration of the deck. Fig Accelerations of the structure measured in absence and in presence of wave impacts (Source: Luca Martinelli, Alberto Lamberti, Maria Gabriella Gaeta,Matteo Tirindelli, John Alderson, And Stefan Schimmels: Wave loads on exposed jetties : Description of large scale experiments and preliminary results) 46
61 3.8. Wave overtopping on breakwaters Mean Wave Overtopping Discharge The mean overtopping discharge q is given in m 3 /s per m width for smooth sloping structures (dike, sea walls); rubble mound structures (break waters, roc slopes); and vertical structures (caissons, sheet pile walls) [23]: Or: Eq 3.25.a R c 3 ( b. ) Hm 0 m0 q a. gh. e Eq 3.25.b It is an exponential function with the dimensionless overtopping discharge and relative crest freeboard R c /H mo. Where: H m0 is the incident significant wave height at the toe of the structure, called the spectral wave height. H m0 = 4(m 0 ) 1/2. Another definition of significant wave height is the average of the highest third of the waves, H 1/3. Based on more than 80 hydraulic model tests performed in the Directional Wave Basin at Delft Hydraulics, Franco et al. (1995) suggested the use of a = 0,082 and b = 3 for plain vertical structures exposed to head on waves. To take into account the effects of wave obliquity and multidirectionality a reduction factor was put in the equation: R c b (. ) 3 Hm0 m0 q a. gh. e Eq 3.26 Franco et al. (1995) suggested the use: 0.83 for 0 o 20 o 0.83.cos(20 o - ) for 0 o 20 o Maximum Wave Overtopping Volumes The exceedance probability (P v ) of an overtopping volume per wave is then similar to: With: Eq 3.27 The scale parameter a depends on the overtopping discharge q, the mean period Tm, probability of overtopping Pv, N ow /N w, the storm duration t and the actual number of overtopping waves N w. 47
62 The maximum overtopping volume by only one wave during an event depends on the actual number of overtopping waves, N ow and can be calculated by: Where N ow is the number of overtopping waves Eq 3.28 Van der Meer and Janssen (1995) gives the following formula to calculate the number of overtopping waves N ow : Eq 3.29 N w is the number of waves. R c is the freeboard and H s is the incident significant wave height at the toe. The value of the c coefficient follows from the assumption that the runup distribution is similar to the distribution of the waves, i.e. run-up is assumed to be a linear phenomenon. By assuming the waves Reyleigh distributed, Van der Meer and Janssen (1995) found for non-breaking waves ( > 2): The values take into account a shallow foreshore, roughness and angle of attack. The curves expresses the equation of Van der Meer and Janssen is shown in Fig Fig The curves of Van der Meer and Jannsen for determining number of overtopping waves (1995) with f ; h 1 ; 48
 has presented two different sets of equations for the probability of overtopping on sloping structures. Eq 3.")
63 Fig A scheme for calculating Wave Overtopping Discharge Besley (1999) has presented two different sets of equations for the probability of overtopping on sloping structures. Eq 3.30 The curves expresses the equations of Besley (1999) is shown in Fig Fig The curves of Besley for determining the dimensionless of discharge (1999) 49

64 Wave Transmission by wave Overtopping If water is overtopped behind a breakwater there is high possibility that overtopping waves cause new waves behind the structure. This is called wave transmission and defined by wave transmission coefficient K t = H s,t /H s,i, with H s,t is transmitted significant wave height and Hs,i is incident significant wave height. The limits of wave transmission are K t =0 (no transmission) and 1 (no reduction in wave height). If the crest is above water level the transmission coefficient will never be larger than about Wave transmission has been investigated in the European DELOS project. For smooth sloping structures the following prediction formulae were derived: Eq 3.28 With as a minimum K t = and maximum K t = 0.8, and limitations 1< op <3, and 1<B/H i <4, and where is the angle of wave attack and B is the crest width (and not berm width). Wave transmission for rubble mound structures has also been investigated in the European DELOS project and the following prediction formulae were derived for wave transmission: Eq 3.31 Fig Wave transmission versus wave overtopping for a smooth 1:4 slope and a wave height of H mo =3 m A simple equation for wave transmission at vertical structures has been given by Goda (2000): 50

65 Fig Wave transmission versus wave overtopping discharge for a rubble mound structure, cot = 1.5; 6-10 ton rock, B =4.5m and H mo = 3m 3.9. Wave diffraction in port basin Many ports in the world are established in open sea where direct influence of oceanic waves is robust. Hence, breakwater to reduce impact of wave climate is of compulsory. Due to influence of an object in ocean, diffraction will be occurred which means waves will be reduced after the shadow line of breakwaters. In order to ensure safety for vessels inside basin, diffraction must be calculated to determine the tranquil water area. Design wave height should satisfy [25]: H d 0,5 m H d 2,0 m for service limit state condition for hurricane condition (ultimate limit state) In fact, H i wave height at a certain point in port basin should be: H i = H d + H 2 + H 3 + H 4 + H 5 Eq 3.32 In which: H d - Wave height due to diffraction H 2 - Wave height due to reflection of diffraction H 3 - Wave height due to wave overtopping in low crest level situation H 4 - Wave height due to wave transmission over permeable breakwater body H 5 - Wave height due to interference of waves through more than 1 opening Because of other wave height parameters are smaller than Hd and the depth d is constant. Most of current methodology for diffraction calculation supposed: Regular wave diffraction H i =H d Eq 3.33 Airy theory based on 5 equations as following: Continuous equations: 51
66 Eq 3.34 Halminton operation: V = grad Eq 3.35 Gradient Laplace operation: Eq 3.36 Div Grad = 2 = = Eq 3.37 Bernoulli: In which: - Potential function; T time; - sea water density; g: gravitational acceleration x,z: horizontal and vertical coordinate; P: wave pressure; Eq 3.38 By linearization the differential equation with boundary condition at the bottom and the free surface, the diffracted wave height is calculated as followed: H i = H d = H 0.K d H d - diffracted wave height without other factors; K d - diffracted coefficient; K d = H d /H o Irregular wave diffraction The effects of wave diffraction on an individual wave depend on the incident wave frequency and direction. Thus, each component of a directional wave spectrum will be affected differently by wave diffraction and have a different K value at a particular point in the lee of a breakwater. To evaluate the effect of diffraction on a directional wave spectrum, Goda, Takayama, and Suzuki (1978) calculated diffraction coefficients for a semi-infinite breakwater and a breakwater gap by breaking the spectrum into number of frequency (10) and direction (20 to 36) components and combining the result at points in the breakwater lee. This produced an effective diffraction coefficient defined by Eq 3.39 where K e is the diffraction coefficient for each frequency/direction component when acting as a monochromatic wave, M 0 is the zero moment of the spectrum, df and dθ are the frequency and direction ranges represented by each component of the spectrum, 52
67 θ max and θ min are the limits of the spectral wave component directions, and S(f,θ) is the spectral energy density for the individual components. The spectral frequency distribution they employed was similar to most typical storm spectra such as the JONSWAP spectrum. The directional spread of the spectrum was characterized by a directional concentration parameter S max, which equals 10 for widely spread wind waves and 75 for swell with a long decay distance, so the directional spread is quite limited. Many calculated results shown by diffraction diagram has set up for a breakwater that is beyond from the coast and wave direction is perpendicular to the breakwaters. For example, Goda (2000) proposed the diagram for diffraction coefficient for wave height and wave period T i with S max is the directional concentration parameter S max =10; S max =25; S max =75, with =90 o. With the same basin and the breakwaters is perpendicular to the coast, if S max is chosen at lower boundary S max (10,25,75), the same K d will increasingly shift away from the water area that is not protected. Fig. 3-29, 3-30 and 3-31 present the diagram for diffraction coefficient with the breakwaters perpendicular to the coast, S max =10, S max =25 and S max =75 with =90 o respectively (Goda 2000) [24, [25]. Fig Diffraction diagram of a semi-infinite breakwater for directional random waves of normal incidence, Smax =10 (Goda 2000) 53
68 Fig Diffraction diagram of a semi-infinite breakwater for directional random waves of normal incidence, Smax =25 (Goda 2000) Fig Diffraction diagram of a semi-infinite breakwater for directional random waves of normal incidence (Goda 2000) 54

69 Chapter 4. Wave and sea level rise impacts on Nam Du port In this chapter pictures, map of Nam Du island and data source about Nam Du master plan phase are all supplied from Royal Haskoning s project in Viet Nam. This case study will show the implementation of 3 SLR scenarios on Nam Du jetty and assessment of the possibility that waves impact on a jetty deck. 4.1 Introduction to Nam Du port Nam Du port is possessed by Tan Tao group, one of the powerful group in port logistics and transportation. The project was started in 2010 and Nam Du port is expected to be in operation in Nam Du island has the potential to become to the deep water transhipment port for the Mekong area in Viet Nam. Forecasted cargo flows include up to 50 mtpa of coal import and up to 12 mtpa of rice and sea food export Nam Du Island Location Nam Du Island is located in the West South of Viet Nam. It is 65 nautical miles from Rach Gia coastal area, comprising of 21 small to large islands with a total area of 40km 2, directly under management of 2 district An Son and Nam Du (Kien Giang province). The Nam Du Deep Sea Port will be constructed on the largest island of the archipelago (Nam Du Islands), which is approximately 70 km south southwest of Kien Luong (N 9 41, E ). The elevation level used in the project is Hon Dau Datum (HD), which is approximately mean sea level. Fig Nam Du port location in Viet Nam port master plan map 55

70 Fig Zoom in to the South-West port master plan Overview of Nam Du Island In Figure 4-3. and Figure 4-4, a overview of Nam Du island with settlement area, water basin, military point is provided. Fig Overview of Northern side of Nam Du island Vegetation Nam Du Island has a rocky coastline with steep vegetated slopes of thick bush. Within the several bays, the foreshore is milder and less rocky; the topography is less steep and palm trees grow in abundance. Settlement areas The bays in the northern part of the island are inhabited by families of local fishermen; mainly in the west and east bay. Based on the observations made during the site visit of 27 July 2010, it is expected that about 3,000 inhabitants (primarily children) are situated at the island. Restricted areas The southern part of the island is a restricted military area of the navy, is inaccessible by road, with the exception of the lighthouse and military look-out point, and has a high risk of mines. 56
71 Infrastructure A concrete access jetty located in the east bay allows for safe access to the island by small fishing boats. The deck is also used to handle the catch of the day into Styrofoam boxes (primitive handling of general cargo). North of this east settlement area, a basin seems to be collecting rain / run-off water. The different settlement areas are connected by means of a road, which also extends to the military look-out point and the light house at the centre of the island. Fig Overview of Nam Du island Nam Du deep sea port: a. Port requirement At Kien Luong in the Kien Giang province, a large scale Industrial Zone is expected to enhance the development of the area. A new dedicated power plant at Kien Luong will 57

72 generate the required electricity, fired by thermal coal. Coal to fire the plant will be imported primarily from lndonesla and Australia by means of large bulk carriers. Since no natural deepwater location port exists along the coast of Vietnam, a key logistics element of the delivery of thermal coal to the power plant is the development of two new ports: 1. A new offshore transshipment hub at Nam Du island to receive the large coal carriers from the Pacific, named the Nam Du Deep Sea Port. 2. A port with limited draft at Kien Luong to receive the coal barges that will feeder the coal between Nam Du and Kien Luong Port. The Kien Luong Port will be constructed at the power plant in Binh An village, Kien Luong district, part of Kien Giang province (N 10 14, E ). Fig Overview of Nam Du deep sea port (coal terminal on the left side, general cargo terminal on the right side) b. Port Master Plan Phase As Nam Du will be the first deep sea port of Vietnam able to receive large vessels, Nam Du is also expected to act as an export hub for rice and seafood, two of South Vietnam's major export products. The Project Developer of the Kien Luong power plant and port as well as the Nam Du Deep Sea Port is the Tan Tao Group, a private Vietnamese developer of industrial Zones. The port Master plan for Nam Du Deep Sea Port carried out by Royall Haskoning has three main port activities: Thermal coal terminal, General cargo terminal, General port facilities Nam Du Deep Water Sea port project: The project would be implemented in two phases: In the first phase, the seaport will have total yearly designed capacity of 12 million tons of coal and five million tons of goods. In addition, the port will be able to 58

73 receive 80,000 DWT carriers. In the second phase, the seaport s designed capacity will be raised to 50 million tons of coal, 12 million tones of goods per year as well as having capacity to welcome 150, ,000 DWT. General The development of Nam Du Deep Sea Port is expected to occur over longer period of time in order to accommodate an increasing throughput of thermal coal and general cargo. It should be stressed that the port Master plan should be adaptable to accommodate market changes, since the expected throughout and the established Logistics flow of the products are estimates, subject to change. Fig Front view of Nam Du port and the island (coal terminal on the right side, general cargo terminal on the left side) Thermal coal The import of thermal coal is proposed to completely supply the new electrical power plant at Kien Luong. In addition the coal terminal will also handle coal for two other new electrical power plants in the Mekong Delta, resulting in the need to gradually increase of necessary throughput capacity. The import of coal will originate from international sources such as Indonesia, Australia and Russia. During Phase 1, the size of the coal bulk carries range from 35, DWT, Where the lower range originates from Indonesia. With time, the transport of coal carriers from Australia (and potentially Russia) will grow to 150,000 DWT. After storage of the coal at Nam Du, the coal will be transported to the mainland by means of 10,000 DWT barges assisted by tugs. General cargo With regard to general cargo, the following export products of Vietnam are expected to be transshipped through Nam Du island: Rice Agriculture and fruits Seafood (dried and frozen) Industrial Park goods produced at Kien Luong 59
74 The following import commodities are expected to be transshipped through Nam Du Island. Fertilizers Equipment Construction materials General cargo export products will arrive at Nam Du island in DWT barges, to be transferred to general cargo carriers ranging 35,000-50,000 DWT. Import products, on the other hand, will arrive at Nam Du island in general cargo carriers (36,000-60,000 DWT) to be transferred to 10,000 DWT barges heading for the mainland. c. Alternatives of port lay-out Due to the existing conditions of the project site and the berth and yard requirements, several alternative port layouts have been compared quantitatively as well as qualitatively in order to arrive at the preferred option. In addition, a sensitivity analysis of the key project risks has been performed to confirm the selected port Master plan layout. The preferred alternative is located at the northern tip of Nam Du Island, where all vessels may enter the port through the North West access channel. d. Refined Port Master Plan The refined port Master plan is shown in figure 4-5. Thermal coal terminal Unloading The ocean going coal carriers (ranging in size from DWT) enter the port by the North West access channel. A total of three berths equipped with grab bucket unloaders are required to handle the expected coal traffic. The bucket unloaders travel along the entire length of the wharf to unload the vessel evenly. Unloaders can be used in tandem to improve the reclaim rate during the unloading cycle of a vessel. Additional advances of grab bucket unloaders include relatively low initial investments, easy maintenance and availability with low lead times. Stockyard Stacker 1 reclaimers are recommended for the stockyard operations, since these offer a balanced solution between stockyard size, capability and cost effectiveness. Bulldozers are proposed for stockyard maintenance. A total of 22.5 ha required for the stockpiling of coal during Phase 1 (12 mtpa), based on a dwell time of 30 days and the recommended coal handing equipment. Loading The , DWT coal barges are loaded with long travelling barge loaders at one of the two available berths. These loaders discharge material at high rates from a conveyor belt onto the barge. Since the barges are stationary, the barge loaders move back and forth to ensure that the barges are loaded evenly. General cargo terminal General It must be noted that the top-works (buildings, utilities and equipment) of the general cargo terminal and general port facilities area are not within the existing scope of work. 60

75 However, a preliminary definition of these facilities has been included in the Master plan. The current uncertainly in the logistics flow of the general cargo goods specially the total throughout the distribution of commodities and packaging requires an easily adaptable general cargo terminal. Fig Master plan, coal terminal 12 mtpa (dwell time 30 days) General cargo terminal 6 mtpa Unloading/ loading The general cargo vessels will enter the port by the same access channel as the coal vessels. reducing the dredging costs. All commodities (with the exception of loading bulk goods) are proposed to be (un) loaded with mobile multipurpose harbor cranes. These crane are suitable to be equipped with spreader hook and grab as well as other attachments geared towards general cargo handling. This flexibility allows for easy adaptability of the terminal. The loading of bulk goods (i.e. rice and fertilizer) into vessels is best handled via a mobile conveyor ship loader where the material travels over the conveyor and into the vessel. Terminal area 61

76 Based on an average dwell time of 6-10 days and the distribution of general cargo through per commodity and packaging type, a total terminal area of 55 ha are required for Phase 1 (6 mtpa). Reach Stackers are proposed for container stack handling. Reach stackers possibly in combination with tractor-trainers are proposed for container transport between stacks and apron. Forklift trucks may be deployed at the terminal to transport pallets big bags and other packaged goods. Bulk goods (rice and fertilizers) to be unloaded with a mobile crane may be dumped in a moveable hopper on the quay. From the hopper the bulk material is then transported in dump trucks/conveyors to the intake of the silos (for rice) or warehouses (for fertilizer). Bulk goods to be unloaded with mobile conveyor ship loader are proposed to be transported from the silo/warehouse to the quay via conveyor or dump trucks. Fig Nam Du port master plan(coal terminal on the right side, general cargo terminal on the left side) General port facilities In addition to the coal and general cargo terminal, an area for general port facilities has been allocated in the port layout. These facilities include Offices, Auxiliary berthing facilities for pilot boats, tug boats, mooring launches, Helipad, Utilities Power (generation on the terminal), Water treatment, Waste treatment. Bunkering of ocean going vessels will take place via side- by-side operations. Therefore no bunkering facilities on land will be created. For the auxiliary berthing facilities, facilities have been foreseen for 3 tugs (which is sufficient for Phase 1, where about 3 vessel moves per day are expected), and some supporting small vessels (pilot boat and line boats), 62

77 For the power generation in Phase 1 diesel driven generators are foreseen. It is recommended that in future phases, an option study be undertaken to assess the viability of a cable from the mainland being installed to access power from the nearby power plants which may result in a significant reduction of the operational costs. A separate study (outside this scope) will be undertaken to investigate the supply of raw water and potable water. A possible option is the transportation by returning coal barges. A portion of the raw water will be treated on site for use as potable water. Treated potable water will be stored in a potable water tank, while raw water will be stored in a raw water dam. The port Master plan for the Nam Du Deep Sea Port have been developed, with a focus on adaptability in order to accommodate phasing of development integration between general cargo and coal terminal and to optimize the capital expenditure Nam Du jetty structure for General cargo terminal and coal terminal The Coal Terminal Berth and Jetty of Nam Du port are shown in the following Figures: Fig Section A-A General cargo terminal Fig Top view general cargo terminal 63

78 Fig Top view coal terminal - Jetty Fig Top view coal terminal berth In the design of Royal Haskoning, a jetty structure is chosen mainly because this a deep sea area, with depth near the slope coast more than -15m. In regions away from the coast, water depth varies from -25 to 30m (see Appendix 3). If in that condition, designing a quay wall will cost more money than building a jetty structure with piles and deck. 4.2 Natural conditions Topography The highest point on the island reaches 275 m HD, forming a natural boundary in the centre between the northern and southern part of the island. The terrain in the southern part of the island is higher than the north side; only two bays with mild slopes can be observed. The northern part of the island has an elongated form (long and narrow). Across the whole island, the rocky coastline, as well as the bays with milder foreshore, 64
79 can be found. Settlement areas however, are only found in the northern part of the island Bathymetry The offshore bathymetry is to be based on the Vietnam nautical chart, which corresponds well to the Admiralty chart. Around Nam Du Island, near shore to the project site, surveyed data provides more bathymetrical information than the first two sources of data. Offshore, water depths deeper than 20 m are common, whereas near shore water depths of 5-15 m characterize the bathymetry around the island. However, to the north of the island, a few local scour holes have been with water depths up to m. In between these locations, the surveyor has noted the presence of reefs with water depths less than 5 m Hydrographic and Meteorological Conditions a. Wind and wave directions All directions referred to are given in nautical convention, which means that for wind and waves the direction refers to the direction where the wind or waves are coming from and measured positive in degrees from true north. This means that waves from a direction of 0 N are coming from the north and waves with direction 270 N are coming from west. b. Current directions Current directions refer to the direction towards which the current is flowing. Directions of current are always given as bearings (clockwise with respect to North). The unit is degrees, where 360 degrees cover the circle. For example: current direction 90 means that the current is flowing towards the East. c. Winds and typhoons The offshore wind climate is determined from wind hindcast data ( ) simulated by NOAA at the offshore data point (9.00'N, 'E). According to the available observations and statistics, there are two main seasons: Northeast monsoon season: October to February, Southwest monsoon May to September. 65
![Fig 4. 13. All year wind speed exceedance [%] per direction There are 3 to 5 typhoons landing the east coast of Vietnam every year, primarily during the third and fourth quarter.](/docs-images/87/95064550/images/80-0.jpg "Although the project area is much less exposed than the east coast of Vietnam, typhoons or remnants of these are likely to affect the area.")
80 Fig All year wind speed exceedance [%] per direction There are 3 to 5 typhoons landing the east coast of Vietnam every year, primarily during the third and fourth quarter. Although the project area is much less exposed than the east coast of Vietnam, typhoons or remnants of these are likely to affect the area. For example, the largest wind velocity recorded was 40 m/s (SW direction, typhoon whirlwind in 2000). The second largest wind speed was 26 m/s (WSW direction, in d. Waves The offshore wave climate is determined from hindcast data ( ) simulated by NOAA at the offshore data point (9.00'N, 'E). The data has been analyzed and processed in a spectral numerical wave modeling to establish the design wave criteria under normal and extreme weather conditions for structural and operational design. e. Water levels Tidal elevations The tidal regime at Nam Du Island can be characterized as an irregular to regular diurnal tide. The average water levels to be expected at the project site can be found in Table 4-1. R Abbreviation Water level [m HD] Highest astronomical tide HAT 1.2 Mean high water spring MHWS 0.7 Mean high water MHW 0.5 Mean sea level MSL
81 Mean low water MLW -0.4 Mean low water spring MLWS -0.6 Lowest astronomical tide LAT -0.9 Table 4. 1.Tidal water level Extreme tidal elevations According to the data collected and processed by FHDI, the extreme tidal elevations as in Table 4-2 are applicable. Return period [yr] Abbreviation Water level [m HD] Extreme high water level 100 EHWL Extreme high water level 10 EHWL Extreme low water level 10 ELWL Extreme low water level 100 ELWL Table Extreme water levels f. Sea level rise Due to global climate change the long term sea level rise expected. The Intergovernmental Panel of Climate Change (IPCC) predicts a sea level rise (SLR) of about 0.5 m over the next century. For this Project, a sea level rise of 0.3 m for the 50 year design life will be adopted. g. Storm surge Due to the uncertain behavior of typhoons in the region, the surge is considered as a constant and does not change with respect to the storm s return period. A storm surge (SS) of 0.9 m is considered for design water levels, which is a summation of the following: Wind setup: 0.5 m, Barometric pressure 0.4 m. According to Vietnamese standard 14 TCN , the maximum storm surge to be considered is 2 m. However this surge applies to locations along the shore of Kien Giang province (shallow waters). Nam Du is located in relatively deep water, and the surge (wind set up) is expected to be considerably less. This conclusion of limited wind set up is (indirectly) supported by the extreme water levels listed in the CCCCFHDI report, which don t seem to have any (significant) wind set up included in the extreme water levels. In the Basic Design, a storm surge of 0.9 m will be used. 67
82 h. Design water levels (extreme water levels) The maximum and minimum design water levels to be used during design are as in Table 4-3. Water level Return period [yr] Abbreviation Water level [m HD] Design high water level 100 DHWL 100 EHWL SLR + SS = 2.3 Design high water level 10 DHWL 10 EHWL 10 + SLR + SS = 2.2 Design high water level 1 DHWL 1 MHWS 1 + SLR + SS = 1.9 Design low water level 1 DLWL 1 MLWS 1 - SS = -1.5 Design low water level 10 DLWL 10 ELWL 10 - SS = -1.6 Design low water level 100 DLWL 100 ELWL SS = -1.8 Table Designed water levels i. Currents The current is noted to be mainly tidal driven. The currents during flood tide were observed to be stronger than during ebb tide. The following (relatively weak) currents were observed during flood tide: j. Meteorology Maximum current speed: 36 cm/s at the surface layer, 35 cm/s at the middle layer, 34 cm/s at the bottom layer, Mean current speed: 20 cm/s at the surface layer, 15 cm/s at the middle layer, 13 cm/s at the bottom layer. With its subtropical climate (subtropical monsoon), two distinct seasons are typical for Nam Du Island; a dry and a wet season. The dry season is from October to the next February, when the wind direction is primarily northeast, the humidity is low and the rainfall is less. During the rainy season, which is from May to September, the dominant wind direction shifts to the west / southwest. Furthermore, this season is highly humid and accounts for at least 80 % of the annual rainfall (approx. 2,500 mm/yr). Regardless of the two seasons, the temperature remains relatively constant throughout the year with an average temperature of C Geotechnical conditions The bottom samples collected during mild weather conditions showed that the suspended sediment concentration was relatively small in the seawater at all stations (range: mg/dm 3 ). Only 2.1 % of the observational samples were greater than 68
83 5.0 mg/dm 3. The sediments at stations near Nam Du Island mainly included sandy silt with some gravel. From the first analysis it seems that the rock type is predominantly extrusive igneous rock. In some boreholes layers of pumice have been detected, although in general the complete rock column consists of porphyry. On land only a limited overburden of loose material is found (1-4 m), while offshore the overburden is much thicker. This overburden consists of sandy clay which is (judging from the first odometer test results) highly over consolidated. In this geological region it is hard to explain the presence of highly over consolidated clay and it is therefore assumed that the sandy clay is in fact a residual soil formed by complete weathering of the igneous rock. This type of formation in general indicates an undulating boundary between the intact rock and the weathered material. From the laboratory tests a subdivision can be made between the highly plastic sandy clay and the sandy clay with a low plasticity. The top layer has a maximum thickness of approximately 10 m Seismicity The southwest coast of Vietnam is located in an area that is rated as a mild hazard region for seismic activity. According to the Vietnamese national standard for seismic design, TCXDVN 375: 2006, the Kien Giang province has a reference Peak Ground Acceleration (PGA) at bedrock of g (0.04 m/s 2 ) with a return period of 475 years (corresponding with a probability of exceedance of 10 % in 50 years) Wave designed determination SWAN modeling results Since hurricanes may hit the Gulf of Thailand, both hurricane data and overall sea state data have been used as boundary conditions for a SWAN (Simulating Waves Near shore) wave model. From the overall sea state data (provided by NOAA) extreme values for wave and wind characteristics have been derived. In order to determine wave design conditions for a the Nam Du port, a SWAN (Simulating Waves Near shore) has been setup spanning over 150 km 2. The boundaries of large model are fed with the extreme hurricane and overall sea state wind and wave characteristics. This large model has a 400x400 meter grid size. To accommodate a higher resolution grid, a second (nested) grid has been introduced spanning a 25 km 2 are with grid size 50 meters. The SWAN model results for the above combinations of offshore boundary conditions show the result below for a number of near shore points. For all directions the hurricane events have proven to be dominant [27]. 69

84 Fig Key locations in the Nam Du port area Point H s (m) T p (s) Offshore Direction ( o ) S o (-) U w (m/s) H s (m) T p Near shore Direction ( o ) S o (-) Table The SWAN model results for the number of near shore points 4.4. Sea level rise impacts on Nam Du port Sea Level Rise accounted in Nam Du Port Master Plan In Nam Du Port Master Plan, a sea level rise of 0.3 m for the 50 year design life has been taken account for designing jetty of port. 70
85 According to the official Sea Level Rise Scenarios of Vietnam above, the sea level scenarios of 65 cm, 75 cm and 100 cm, so these SLR scenarios should be taken account for in this study. Sea level rise in 3 scenarios as followed: Calculation cases Return period [yr] EHWL 100 (m) SS (m) SLR (m) Water level [m HD] Designed case SLR 1 Scenarios SLR 2 Scenarios SLR 3 Scenarios Table The Water Level in the Designed and SLR Scenarios Prediction of maximum water surface elevations along Nam Du jetty Extreme wave crest elevation Chapter 3. max, the deck clearance c 1 is defined in Fig 3.20 in Particular wave condition can be described: H s, H 1/3 T m, T p N z H max significant wave height mean or peak wave periods Number of waves during the storm/tide peak Highest wave (depends on N z, from laboratory tests was taken as highest of 1000 waves) Extreme wave heights and elevations vary randomly, so a deterministic prediction of H max is not possible, but a probability density can reasonably be defined for the ratio H max /H 1/3. Adopting Rayleigh distribution as a first approximation to the distribution of individual wave heights (valid in deep water, and probably conservative in shallower water) a theoretical relation between H max and H 1/3 can be derived. The most probable value of H max is given as a modal value of H max /H 1/3 by Goda (2000) based on Longuet-Higgins (1952), and earlier tests shown that this value most closely corresponds to wave measurements. The probability that the maximum wave height is exceed during a storm with N z waves is: Pr(H>H max ) = exp(-2 ) = 1/N z Other wave height distribution can be used on shallow foreshores. A model distribution has been proposed by Battjes and Groenendijk (2000). This model consists of Rayleigh 71
86 distribution, or a Weibull distribution with exponential equal to 2, for the lower wave heights and a Weibull with a higher exponent for higher wave heights. The parameters of this distribution have been estimated from laboratory data and expressed in terms of local wave energy, depth and bottom slope. Maximum crest elevations ( max ) can be obtained from H max by various non-linear theories. For a range of test conditions used in studies at HR Wallingford, it was seen that Stream Function Theory, or Rienecker and Fenton s (1981) Fourier approximation method, can safely be used to derive max from H max. Stansberg (1991) gives a rather simpler approximation for crest height in deep water, where the expected maximum crest elevation, max, for a given wave extreme height, H max, can be obtained by: L m is derived from the linear wave theory, using wave period Duration of a storm (hours) 4 Point Hs (m) Tp (s) s (-) L m (m) N z H max/ H s H max (m) Neta max (m) EHWL (m) SS (m) SLR (m) Deck level (m) Beam thickness b h ( m) Table 4.6. Extreme crest elevation corresponding to 8 calculated points along the port) (For detailed calculations of the designed case and SLR1,2, see App 2 for Chapter 4) Deck thickness d (m) c1 (m) Conclusion Neta max < c1 Neta max < c1 Neta max < c1 Neta max < c1 Neta max < c1 Neta max < c1 Neta max < c1 Neta max < c1 72
 The calculated results in the table 4-6 and the extreme wave crest elevation of max in the Fig.")
 when sea level due to climate changes rises up 1meter in comparison with the current mean sea level, the extreme wave crest elevation of a maximum individual")
87 a) Front view Barge loading Side Conclusion: b) The cross Section of Jetty Fig Elevation of η max Crest in SLR3 Scenarios underneath of the deck (in red color) The calculated results in the table 4-6 and the extreme wave crest elevation of max in the Fig.4-15 show that the wave does not touch the underneath jetty deck ( max < c 1 ). Waves only attack to the piles and rakings of jetty. Even in the severest scenario (SLR 3) when sea level due to climate changes rises up 1meter in comparison with the current mean sea level, the extreme wave crest elevation of a maximum individual wave has not reached the jetty deck. Nam Du jetty structure is designed based on the air gap approach. Hence, with the designed desk crest elevation at +10.0m has provided enough safety free board for the extreme waves not to touch the underneath of the deck, even in the SLR3 scenario if sea level can rise up 1meter in the next 100 year. Therefore, the wave impact loads on Nam Du jetties are not calculated in this thesis Imaginary case for the impact of waves to the underside deck + The calculation is taken for 8 points as in Fig Structural characteristics of the jetty beam structure (see Fig 3.20 for details of parameters): b l = element length (in the direction of wave attack) = 1.6m 73
88 b h = element thickness = 1.6 m b w = element width (perpendicular to the direction of wave attack) = 12 m + Structural characteristics of the deck element: b l = 6.7m d = 0.5m b w = 12m These parameters are taken based on reference drawing (Royal Haskoning), see Fig.A12 in Appendix 2. Duration of a storm (hours) The designed condition for 8 points calculation is presented in this table: Table Calculation of deck clearance corresponding to 8 calculated points with SLR3 scenario and SS = 2m The result shows that there are 4 points that the water level is higher than the deck level: 1,5,6 (see Fig. 4.14). a. Prediction of vertical and horizontal wave forces on seaward jetty beam element To calculate the quasi-static vertical wave forces, calculate first the basic vertical wave force F v *: F v * = b l b w p 2 p 2 = ( max c 1 ) g 4 Point Hs (m) Tp (s) s (-) L m (m) N z H max/ H s H max (m) Neta max (m) EHWL (m) SS (m) SLR3 (m) Deck level (m) Beam thickness b h ( m) Deck thickness d (m) c1 (m) Conclusion Neta max > c1 Neta max < c1 Neta max < c1 Neta max < c1 Neta max >c1 Neta max > c1 Neta max < c1 Neta max <c1 For seaward beam, a and b is 0.82 and 0.61 respectively (with upward vertical forces) For seaward beam, a and b is and 0.91 respectively (with downward vertical forces) To calculate the quasi-static horizontal wave force, calculate first the basic vertical wave force F h *: c 1 + b h = = 5.4m; so c 1 + b h > max F* h = (( max c 1 )p 2 /2 74
89 Ro 1025 g 9.81 Neta max Point Hs (m) Tp(s) (m) c1 b w b l b h p2(n/m 2 ) Fv*(N) a b F vqs+ (N) Table Prediction of positive quasi-static vertical wave force (F vqs+ ) on the seaward beam element of Nam Du jetty (coal and general cargo) Ro 1025 g 9.81 Point Hs (m) Tp(s) Neta max (m) c1 b w b l b h p2(n/m2) Fv*(N) a b F vqs- (N) Table Prediction of negative quasi-static vertical wave force F vqs- on the seaward beam element of Nam Du jetty (coal and general cargo) Ro 1025 g 9.81 Point Hs (m) Tp(s) Neta max (m) c1 b w b l b h p2(n/m 2 ) F h *(N) a b F hqs+ (N) Table Prediction of positive quasi-static horizontal wave force (F hqs+ ) on the seaward beam element of Nam Du jetty (coal and general cargo) Ro 1025 g 9.81 Point Hs (m) Tp(s) Neta max (m) c1 b w b l b h p2(n/m 2 ) F h *(N) a b F hqs- (N) Table Prediction of negative quasi-static horizontal wave force F hqs- on the seaward beam element of Nam Du jetty (coal and general cargo) b. Prediction of wave impact force on the jetty deck element Supposing that the structural analysis of the jetty for vertical motion gave a natural period of t N = 0.3s, it can be assumed that the deck might respond to wave loads of this duration, i.e. when load duration t r = t N = 0.3s For vertical impact forces, coefficients a and b of the beam element is taken in moderate way as 0.5 and 0.9 respectively. 75
90 Conclusion: Point Hs (m) Tp(s) F vqs+ (N) a b t r (s) a/(t r /Tp) b F imp (N) Table Prediction of vertical impact force on seaward beam elements of Nam Du jetty It can be noted that vertical wave impact force on a longitudinal beam element with dimension of 12x1.6x1.6m is quite larger than the positive quasi-static vertical wave force. For instance, at point 1 (coal terminal), vertical impact force is 12 times larger than vertical quasi-static force. Hence, the recommended load for design in this situation should be: F max = 3481 KN This approach is rather simple to take into account the dynamic response of the structure to short duration wave-induced loads. It does not take into account dynamic amplification factor or damping effects. 76

91 Chapter 5 Wave and sea level rise impacts on Tien Sa port 5.1. Introduction to Tien Sa port Geographical coordinate system The position of Tien Sa port is in range from N; E to N; E Project features a. Da Nang Bay Fig Location of Tien Sa port on Viet Nam map Tien Sa port was located in the bay of Da Nang [28]. + Da Nang Bay is directed in North West South East direction. In the West and North West there is Hai Van range with an altitude of 1000m. In the South is Da Nang city. In the East and South East is Son Tra peninsula with the altitude of 690m. + There is smooth beach with the slope at the Bay is approximately 1/1000, near the Bay, the beach slope changes from 1/200 to 1/ At the edge of Son Tra alone and one end of Isabella alone is steep slope of which rock is directly impacted by waves. The primary wind direction is from the North to East- North East. b. Tien Sa Port + Tien Sa port is located at the South West of Da Nang Bay, the water are in front of the port is -9.0 to -10.0m deep. Spreading over a large arc from North West to East and North East, Tien Sa Port is hidden behind Hai Van range and Son Tra peninsula. + Tien Sa port is located between the mountains of Son Tra peninsula. The total green area is 14 ha and 460m of coastline. 77
 + Depth of berths: -11 meters (not including tide). + Yards of total area: 115.000m 2. + Total warehouse area: 20.290m 2.")
92 Tien Sa port capacity Tien Sa port is belonging to Da Nang Port Complex which is located in the North East of Da Nang City. + Berths: Total length of 897 meters. These include two overhanging bridge (four ports) + Depth of berths: -11 meters (not including tide). + Yards of total area: m 2. + Total warehouse area: m 2. + Type of receiving vessel <30,000 DWT. + Maximum Capacity through from 4 million tons / year Tien Sa breakwaters Tien Sa breakwater has got the following function: + Reduce wave height in the water area to increase the operational hours and reduce downtime to satisfy the planned cargo throughput at each phase planning. + Ensure the safety of berths and bridge when high intensity storming occurs. In order to protect the water area and port structures against high waves, a breakwater of 450m is constructed, with one end is located at the South of Son Tra peninsula, the centre line is directed East-West, and the other end reached to -11.5m (Nautical chart). 250m toward the shoreline is sloped breakwater constructed in 2004 (phase 1) and the remained 200m is completely constructed in 2006 (phase 2) Database Topography Fig Tien Sa breakwater from satellite (from Google earth) + Tien Sa port is located at the South West of Da Nang Bay, the water are in front of the port is -9.0 to -10.0m deep. Spreading over a large arc from North West to East and North East, Tien Sa Port is hidden behind Hai Van range and Son Tra peninsula. 78
93 Seismicity According to seismic map, Da Nang is located in 7 th grade of earthquake region (seismic map has got 12 grades in which the strongest one is the 1 st grade) Geotechnical Conditions Layer 1: Mud clay is distributed in top layer from -12.1m to -12.8m. Layer 2: Second layer is black grey sand soil, which is incoherent and soft, distributed from the bottom of layer 1: -13.9m to -15.6m Layer 3: Clay mud with grey color is wet and pasty, soft, sometimes shell occur, distributed from the bottom of layer 2: -16.0m & -23.0m to -19.4m and -22.7m Layer 4: Sand composes clay which is soft, grey distributed from bottom of layer 3 to m and -25.7m Layer 5: Sand of small to medium grain size which is slightly tight, grey, distributed from the bottom of layer 4 to -25.8m and -29.1m Layer 6: Sand of medium to larger grain size which is grey alternate with grit, sometimes gravel occurs with diameter of 10-20mm, distributed from the bottom of layer 5 to m and -32.0m Rainfall regime Due to complicated and unique topography in combination with circulation of atmosphere, rainy regime is fairly strong. Rainy season is often coincident with storming period (from September to November). With a large amount of rainfall creates flooding which is often happened unexpectedly. Dry season lasts over a long period (from December to August next year). + The total average rainfall in rainy season is 4015 mm + The maximum rainfall in a year is mm; the minimum rainfall in a year is mm + The maximum rainfall in a day is mm + The rainy days in dry season are of 849 days + The rainy days in wet season are of 520 days + On average, each month in dry season has got 8.4 rainy days and in wet season has got 17.3 days of rainfall Mist and vision + Mist is primarily due to radiation. In the period of mist, vision is limited considerably and the transparency of atmosphere is reducing. + Mist occurs from January to May, mainly on February, March and April. On March and April, on average, the number of day that has got mist is 9-10 days; sometimes up to 17 days. From June to October, it is hardly mist. + On average, in a year, there is one day that has got 1 km of vision; 17.2 days has got 1 to 10km of vision and days has got vision above 10km. 79
94 Wind regime According to observation of Da Nang weather station, from 1986 to 1995 and according to data from Tien Sa station from 1978 to 1979, 1990 and 1997, wind regime has got the following characteristics: + Most of time is calm wind with frequency is 46.23% + The most prevailing wind direction is the east which is 14.36% of proportion; the second prevailing wind direction is the North which is 13.1% and North West which is 7.36%. + In winter from November to March next year the prevailing wind direction is North and North West, mean wind speed is 4-5m/s. + In summer, from May to September the prevailing wind direction is West-South West. However, high wind speed is in North East. + Wind speed of 1-4m/s takes 47.57% of the time + The highest wind speed is 40m/s (gale) in North direction on According to statistics of weather forecast station of Da Nang, the highest wind speed as below: Month Direction N N N NNW N W NW SW NNW NNW NW NE Speed m/s Table The highest wind speed due to months in Da Nang ( ) The highest wind speed in each month lies in range of m/s (8/12 times). Wind speed > 24 m/s is in September, October, November with the prevailing wind direction is North, North West. These directions directly impact on Tien Sa port. That shows the importance of Hai Van range to the wind direction of Da Nang Bay Typhoons, hurricanes According to data of weather forecast station, from 1961 to 2001 there are 44 hurricanes that reach to Quang Nam-Da Nang sea. On average, each year there is 1 hurricane reach and has great influence on Da Nang and the proximity. Most of the time hurricane occurs on May to November yearly, especially on September, October, and November. Storming happen normally after 13 p.m in combination with gale above 10 m/s even above 20 m/s together with torrential rain and thunder storm. Sometimes hail stones happen but suddenly and unexpectedly with short time period. Hence it causes danger to vessels. Storming returns from April to September with 6-10 events each year (see Appendix 3, large hurricanes that impact on Da nang sea Table App 5.2) Sea water level Tide near Da Nang Sea is unequally semi-diurnal. In each month there is twice high water level and twice low water level. According to data from Son Tra station from 1978 to 1994 in combination with shortterm period observation shows that: 80
95 - Highest water level: +2.35m; Mean water level over years: +0.93m - Mean high water level over years: +1.28m; Mean low water level over years: +0.47m - Mean high water spring over months: +1.40m; Lowest water level: +0.07m P% H Tidal (cm) crest H Tidal trough (cm) H Tidal mean (cm) H Tidal hour mean (cm) Table Tidal water level (H) vs. Frequency (P) at Son Tra station Storm surge and current According to data of storm surge along the shoreline of Viet Nam Mechanical Institute, the highest storm surge in Da Nang is 1.4m and expected to be 1.6m in the future. According to observation data current speed and direction at Tien Sa basin and results of JICA model shows that the current speed is around m/s. + Maximum downstream current speed in flooding season in Han river is 2.28 m/s + Maximum upstream current speed is 0.5 m/s + When flood-tide current in Tien Sa basin is South East direction + When ebb-tide current is North West direction. + According to model analysis, in Da Nang Bay when flood tide occurs current direction at the basin entrance is East-West; current concentrates at the West of the Bay, along the coast near Hai Van mountain flow into Han river. When ebb tide current concentrates on Son Tra Cape; current direction is North East and flow out of the entrance Bay in East-North East direction Wave regime Waves and wind from North and North West directly impact to Tien Sa port, especially wave regime from Isabella Cape which has great influence on the operation time of cargoes at berth. According to observation of Da Nang and report from AIT the horizontal oscillation of vessels at berth once high waves penetrate is 2-3m, the downtime frequency due to high waves is, on average, days. When extremely high waves in hurricanes occur vessels and ships have to be at berth or waiting in the shelter area outside the basin. In winter at Da Nang Bay the prevailing wave directions is North East. In December waves keep their direction of North East and takes up % of the observation time. At the end of winter, waves turn their direction to East and their frequency of appearance is approximately the same as North East. 81
96 In summer, from May to August, South West is the dominant direction. At the end of July South West direction takes up to 61.7% of the observation time and then they turn to South direction and take up to 55.3% of the time. However, because Da Nang Bay is located in North West-South East direction when waves come into the Bay they refract and change their direction. Especially for waves from East and North East, when they come into the Bay opening, they reflect at Isabella Cape and interfere with the incident waves which make wave direction turn into North- West and flow into Tien Sa port. According to observation of Tien Sa station with the buoy measurement located in front of Tien Sa port from November 1978 to October 1979 and from to , waves from the North are m, waves from the North East are 2.75m with wind speed < 10m/s. According to observation at Son Tra station from 1977 to 1993: + In January wave direction is the North with wave height is 1-1.5m, frequency of appearance is 38.8% + In April and July the prevailing direction is the North with the average wave height is 1.0m and frequency of appearance is 45-60% + In October, prevailing wave direction is North West with average wave height is 2.0m; frequency of appearance is 44.3% + The maximum wave height according to observation is 6.0m in North West direction with wind speed is 22 m/s. + According to prediction of meteorology and oceanic weather forecast waves with return period of 50 years H 2% is 8m, waves with return period of 100 years is 9m. + According to JICA observation in Fritz hurricane on in Da Nang, H 1/3 is 5.7m, T 1/3 is 9.7s and H max is 9m; T p = 8.7s at 8a.m on ; waves is East-North East with wind speed of 24 m/s. + Hurricane Linda occurs on 1st, 2nd, 3rd November 1997 in the South area with H max =6.8m, T p = 8.8s on 8a.m on in the North East direction and H 1/3 = 4.1m; T 1/3 =9.8s at 2 p.m on in the East-North East direction. + According to AIT analysis, from September to February the next year, swell with wave height 2-3m happened at the Bay entrance, reflected waves at Isabella Cape in the North West direction is ( ) incoming wave height. + According to observation at the Bay entrance from 2002 to 2004, significant wave height corresponding with wind speed m/s is m. Hence in designing, chosen H max = 8.5m at the bay's entrance with monsoon wind speed of 20 m/s, return period of 20 years (JICA) and H max = 7.1m at the bay's entrance with wind speed 10 m/s (observation in ) to calculate diffraction after the breakwater Wave analysis in the designed phase of Tien Sa port The grade of Tien Sa Port's breakwater Tien Sa breakwater is ranked the 2 nd grade structure 82
97 The designed wind condition 1. Designed wind storming for breakwater stability According to JICA the wind speed at Da Nang with the return period of 50 years (2%) is 40 m/s and that should be used to check sabitility of Tien Sa breakwater. So that wind data are used in this Chapter. 2. Designed wind monsoon for serviceability Wind speed blows at port site annually is in range 10.5 m/s to 16.9 m/s (6 th and 7 th class); sometimes from 8 th to 9 th class of wind was recorded (17-25 m/s). In such condition of 7 th and 8 th class of wind marine time operation is in service. Hence wind speed of 10 m/s and 20 m/s is used for serviceability Designed water level 1. Designed water level for ultimate limit state (breakwater stability) H d = H 5% + H d = = 2.8 m H 5% - Mean high water spring over months H d - Storm surge level 2. Storm surge level in Ultimate Limit State For wind speed of 40 m/s the maximum storm surge level at Da Nang sea is 1.4m and expected to be 1.6m in the future. The storm surge of 1.4m is chosen as the designed storm surge level. 3. Surge level in Service Limit State for Design In monsoon seasons if the wind velocity < 20m/s then the wind surge is of 0.4 m Waves for Design a. Waves for Design in Ultimate Limit State The wave heights for Design in Ultimate Limit State with the wind probability 2% (return period of 50 years) and wind velocity 40 m/s in the following table: No Parameters The breakwater The head of body segment breakwater 1 Calculated Points (1) (2) (3) 2 Sea water level +2.8 m +2.8m +2.8m 3 Sea bed elevations -10m -11.0m -11.5m 4 Sea water Depth (h) 12.8m 13.8m 14.3m 5 Wave heights for Design (H D ) 8.7m 9.5m 9.7m 6 Significant wave heights (H 1/3 ) 6.2m 6.4m 6.5m 7 Wave period (T) 13.8 seconds Table The wave heights for Design (see the calculated points in the fig.5-26) 83
98 b. Waves for Design in Service Limit State According to the wave analysis for the years from 1961 to 1997 of JICA in the feasibility study phase the waves for Design in Service Limit State at the head of breakwater is equal 4.1m (return period of 2 years), equal 6.3m (return period of 5 years). However, the recorded FRITZ storm dated 25 September 1997 the wave height at the Mouth of Da Nang Bay H 1/3 = 5,7m, the wave period = 9.7 seconds, H max = 9,0m, the wave period = 8.7 seconds with the wind velocity of 24m/s. At Son Tra observational station, the recorded wave height 6.0m with the wind velocity of 22m/s [28] Determination of the breakwater's length In order to determine the reasonable breakwater's length, in the feasibility study phase the MIKE 21 EMS Model was setup for the alternatives of the lengths of breakwater 250m, 375m, 450m and 500m. 1. The near shore wave Model - NSW: The NSW (near shore waves) module of MIKE 21 software was applied for computing the wave heights and directions in Da Nang Bay. a- Input Data: - The topography of Da Nang Bay. - Input wave heights: + Wave probability 2%. The wind velocity 40m/s: H 2% = 9.7m; Ts = 13.8s + Wave probability 5%. The wind velocity 20m/s: H 5% = 8.5m; Ts = 12.0s + Waves in Service Limit State, the wind velocity 10m/s: H max = 7.1m; H 1/3 = 4.4m. Five main wind directions are taken accounts in the following table: No Waves North (N) North - North East (NNE) wave directions North East (NE) East - North East (ENE) Waves in Service 1 Limit State with the wind velocity 10m/s 2 Wave Height H 2% 3 Wave Height H 5% Table Five main wind directions in the NSW Module b- The computational results: East (E) The computational results of wave propagation from the bay's mouth to the head of Tien Sa breakwater as following: 84
99 No Points The co-ordinates X Y 1 Đ Đ Đ Đ Đ Đ Table 5. 5.The co-ordinates of computed points in Da Nang Bay No Points The wave heights in different directions (m) N NNE NE ENE E Table The wave heights at the head of breakwater in Service Limit State with the wind velocity 10m/s No Points The wave heights in different directions (m) N NNE NE ENE E 1 Đ Đ Đ Đ Đ Đ Table The wave heights at the head of breakwater with the wind probability 2% No Points The wave heights in different directions (m) N NNE NE ENE E 1 Đ Đ Đ Đ Đ Đ Table The wave heights at the head of breakwater with the wind probability 2% c- Remarks for the computed results: - The main wave direction is from the North to the South. - Waves coming from the other directions will be soon diffracted by Son Tra peninsula. 2. Wave diffraction Model EMS: Wave diffraction heights in the area of Tien Sa port after the breakwater were computed by using EMS Module (Elliptic Mild - Slope Wave) of MIKE 21 software. 85
100 a- Input data: - The topography of Da Nang Bay with the alternatives of the lengths of breakwater 250m, 375m, 450m and 500m. - The above computed results by NSW Model. Three wind velocities are taken accounts in the following table: No Parameters V = 10m/s V = 20m/s V = 40m/s 1 H 1% (m) H 1/3 (m) (m) Table Wind setups in front of the breakwater's head The wind directions in computations are firstly from the North to the South and secondly from the North-East to the South-West. Wind No Wind Velocities in Monsoon season Directions 1 From the wind velocity 10m/s 2 North (N) wind velocity 20m/s 3 From the wind velocity 10m/s North-East 4 wind velocity 20m/s (NNE) Table The wind directions and wind velocities in the computation EMS Model for the alternative of the breakwater length of 450 m b- The computational results of Wave diffraction Model EMS for the breakwater's length of 450 m No Points 1 S1 2 S2 3 S3 4 S4 Wind directions Wind velocities N 10m/s m/s 4.40 NNE 10m/s m/s 4.12 N 10m/s m/s 0.48 NNE 10m/s m/s 0.46 N 10m/s m/s 0.45 NNE 10m/s m/s 0.48 N 10m/s m/s 0.42 NNE 10m/s m/s 0.40 Wave diffraction heights for the breakwater's length of 450 m 86
101 5 S5 6 S6 7 S7 8 S8 N 10m/s m/s 0.40 NNE 10m/s m/s 0.25 N 10m/s m/s 0.09 NNE 10m/s m/s 0.24 N 10m/s m/s 0.07 NNE 10m/s m/s 0.08 N 10m/s m/s 0.02 NNE 10m/s m/s 0.12 Table The wave diffraction heights at the points c- Remarks for the computed results: Exceptionally at the S1 point (near by the head of breakwater) the wave height is larger than 2 m; at the all of other points the wave height are smaller than 0.5 m. The breakwater's length of 450 m satisfies with the wave diffraction heights of 0.5 m at the port yard 5, therefore this alternative is chosen Prediction of wave heights at Tien Sa site in SLR scenarios Background - The waves at the entrance of Da Nang Bay are in a deepwater area. - When coming to nearly Tien Sa breakwater, wave heights will reduce by the main factor of the water depth i.e. the reduced wave heights depend on mainly the water depth or the sea bed elevations of the calculated points. - Based on the computed results in the table 5.3, we find out that if the water depth in front of the breakwater increase then the wave height increase too. - With the same wind condition at the bay s entrance and the sea water level elevation of +2.8 m, the designed wave heights at the points (1), (2) and (3) were computed by JICA (see the table 5-3 and Fig Layout and longitudinal crosssection of Tien Sa breakwater) as following: + At the point (1): The sea bed elevation equal -10,00, the sea water depth (h) equal 12.8m, the wave height for design (H D ) and the significant wave height (H 1/3 ) respectively are equal 8.7m and 6.2m; + At the point (2): The sea bed elevation equal -11,00, the sea water depth (h) equal 13.8m, the wave height for design (H D ) and the significant wave height (H 1/3 ) respectively are equal 9.5m and 6.4m. 87
102 + At the point (3): The sea bed elevation equal -11,50, the sea water depth (h) equal 14.3m, the wave height for design (H D ) and the significant wave height (H 1/3 ) respectively are equal 9.7m and 6.5m. - Obviously that if sea level rises up due to climate changes then the sea water depths at the point (1), (2) and (3) will be increased correlatively. We can assume that with the same wind setup velocity of 40 m/s, the same sea bed elevations at the point (1), (2) and (3), when SLR scenarios due to climate changes take place the wave height (H) and the significant wave height (H 1/3 ) will increase correlatively with the increased sea water depth. Based on the table 5-4 and the above analysis we can extrapolate (predict) the wave heights of SLR scenarios for Tien Sa breakwater as follows Predicted wave heights in Ultimate Limit State of SLR Scenarios The predicted calculations of wave heights at the site points (1), (2) and (3) in front of Tien Sa breakwater are shown in the table A-1 of Appendix 3. The predicted results of wave heights at the site points (1), (2) and (3) for scenarios 1, 2 and 3 are shown in the tables 5-12, 5-13 and 5-14: a) Scenario 1: Sea level rise of 65 cm No Parameters The breakwater body segment The head of breakwater 1 Calculated Points (1) (2) (3) 2 Sea water level m m 3 Sea bed elevations -10 m -11,0 m -11,5 m 4 Sea water Depth (h) 13.45m 14.45m 14.95m 5 Wave heights for Design (H D ) 9.22 m 9.76 m 9.96 m 6 Significant wave heights (H 1/3 ) 6.33 m 6.53 m 6.63 m 7 Wave period (T) 13.8 seconds Table Wave height in SLR scenarios 1: Sea level rise 65 cm b) Scenario 2: Sea level rise of 75 cm No Parameters The breakwater body segment The head of breakwater 1 Calculated Points (1) (2) (3) 2 Sea water level m m 3 Sea bed elevations -10 m -11.0m m 4 Sea water Depth (h) 13.55m 14.55m m 5 Wave heights for Design (H D ) 9.3 m 9.8 m 10.0 m 88
103 6 Significant wave heights (H 1/3 ) 6.35m m 7 Wave period (T) 13.8 seconds Table Wave height in SLR scenarios 2: Sea level rise 75 cm c) Scenario 3: Sea level rise of 100 cm m No Parameters The breakwater body The head of segment breakwater 1 Calculated Points (1) (2) (3) 2 Sea water level +3.8 m +3.8 m 3 Sea bed elevations -10 m m m 4 Sea water Depth (h) 13.8m 14.8 m 15.3m 5 Wave heights for Design (H D ) 9.5 m 9.9 m 10.1 m 6 Significant wave heights (H 1/3 ) 6.4 m 6.5 m 6.6 m 7 Wave period (T) 13.8 seconds Table Wave height in SLR scenarios 3: 100 cm 5.5. Wave loads and stability of Tien Sa breakwater in SLR scenarios Background Stability of Tien Sa breakwater s caisson can be affected by the predicted wave heights and the above sea level rise scenarios due to climate changes. The loads caused by the waves, SLR and gravity of the structure s parts on the caisson and the problems of sliding, overturning and uplifting stabilities of the caisson are calculated for the designed case and the SLR scenario cases in this section Structure of Tien Sa breakwater s caisson Total Tien Sa breakwater s length is of 450 m, in which 250 m from the coast to be built in the first phase in 2004, the left 200 m segment was completed in the second phase in The caissons are designed by Japanese Consultant Company and MAUNSELL Group. The 160 m (of total 200 m) breakwater s length that consists of 8 caissons was completely installed in the second phase. The designed parameters of one caisson are shown in the table
104 No Parameters Unit Values 1 Width (b) m 18,0 2 Length (l) m 20,0 3 Height (h) m 10,5 4 Weight (Q) Ton Vertical ordinate of the centre (y c ) m Water depth of caisson (T) m Vertical ordinate of water depth centre (y w ) m Met centric height m Occupied water volume (V) m Caisson s crest elevation m Caisson bed elevation m Designed high tide water level m Designed low tide water level m Table The designed parameters of one caisson The concrete plate thickness of 0.5 m is on caisson s top. The concrete crest block s thickness is 3.2 m. The caisson s structures are shown in the Fig. 5-3, 5-4, 5-5, 5-6. Layout and Longitudinal Cross Section of Tien Sa Breakwater in the Fig H.W.L Bª t«ng x0.2 C t 0.2x x x : ASPHALT 1 : 2 Fig 5. 3.Cross Section of Tien Sa Caisson Breakwater 90

105 Fig Plan of Tien Sa Breakwater Caisson Fig Longitudinal section of Tien Sa Breakwater Caisson Fig Cross section of Tien Sa Breakwater Caisson 91
106 - The mass of Tien Sa caisson s parts are shown in the table No Caisson s parts Unit Mass 1 The concrete plate on caisson s top m Bed plate, walls of caisson m Concrete crest block of caisson m Filled sand in caisson m Input data Table The mass of Tien sa caisson s parts Fig The wave load distribution on Caisson The input data of the calculated cases, Sea water level, Sea bed elevations, Sea water depth (hs), Designed wave heights (H D ), Significant wave heights (H 1/3 ), Wave period (T), Wave length are shown in the tables 5-12 to Equations for Calculating Wave Loads and Stability of Caisson The Goda s formulae are used for calculating wave loads on Caisson [18], [29], [30], [31]. * cos H p p p p u cos cos cos H: incident wave height in front of the structure is H max = H D Wave Height for Design : Angle of incidence of the wave attack with respect to a line perpendicular = 0 : density of the water = 1025 kg/m 3 g: Acceleration of gravity = 9.81 m/s 2 p p gh * 2 gh 92
; L g T 2 2.")
107 1, 2, 3: Multiplication factors dependent on the geometry of the structure 1, 2, 3, 4: Multiplication factors dependent on the wave conditions and the water depth. h s : water depth in front of the structure; L: wave length (Dean and Dalrymple,1991); L g T tanh h L d: depth in front of the caisson dc: height over which the caisson protrudes in the rubble foundation * R c = m i n, * Bc denotes the width of the caisson bottom M Goda = M h Goda + M v Goda L h and l V : The lever arms of the wave forces with respect to the overturning point of the caisson. W 1 W 2 W 3 W 4 W 5 F h R c 1 * 1 F p p R p p d d F h; Goda c c p B 1 u; Goda 2 u c M Goda lh ; GodaFh; Goda lv; GodaFv; Goda Weight of concrete caisson bed and walls per one meter of length Weight of the concrete plate on caisson top per one meter of length Weight of the concrete block on caisson crest per one meter of length Weight of the saturated sand mass in caisson per one meter of length Hydraulic Static Uplift Force on caisson per one meter of length Total Horizontal Forces 93
108 F V M Goda M w1, w2, w3, w4 F S F o F UP Total Vertical Forces Total Goda Force Moments on caisson per one meter length Total weight Moments caused by gravity of caisson per one meter length Safety Factor of Sliding Safety Factor of Over turning Safety Factor of Uplifting Total Horizontal Forces: F h = W h Goda Total Vertical Forces: F V = W + W 2 + W 3 + W 4 - W 5 F U Goda Safety Factor of Sliding: F S = µ. F V / F h Safety Factor of Overturning: F o = M w1, w2, w3, w4 / M Goda Safety Factor of Uplifting: F UP = (W + W 2 + W 3 + W 4 ) / (W 5 + F U Goda ) The Results of Calculating Loads and Stability of Caisson at the breakwater s head a. Results of Calculations No Force Vectors Parameters Unit Designed case SLR Scenarios SLR = 0 SLR1 = 0.65 m SLR2 = 0.75 m SLR3 = 1.0 m I 1 INPUT DATA SWL ELEVATION m Elevation of Sea bed m The depth of water in front of caisson breakwater m : , 2, 3: H = H max = H D m =.g kn/m d m d c m R c m R c * m
109 12 η * m h s m T s L m Bc m Sinh(4П.h S / L) Cosh(2П.h S / L) ((1-d/h S )*(H/d) 2 )/ d/H α α α α II FORCES 25 P 1 kn/m P 3 kn/m P 4 kn/m P u kn/m F h,goda kn F U,Goda kn L h, Goda m L V, Goda m M Goda knm W 1 kn/m W 2 kn/m W 3 kn/m W 4 kn/m W 5 kn/m F h kn/m III THE SAFETY FACTOR OF SLIDING 40 F V kn/m µ F S
110 IV THE SAFETY FACTOR OF OVERTURNING 43 P h Goda (1) kn/m L h Goda (1) m P h Goda (2) kn/m L h Goda (2) m M Goda knm M w1, w2, w3, w4 knm F o V THE SAFETY FACTOR OF UPLIFTING 50 F up Table The Results of Calculating Loads and Stability of Caisson at the head of Breakwater having the sea bed elevation of m (the point (3)). Fig The wave Goda loads on Tien Sa breakwater's Caisson in Designed Case b. The Remarks for the calculated results Based on Viet Nam technical Standard 22 TCN 27-92, Japanese Consultant Company (JPC), General Company for Transport Consultant (TEDI) and Maunsell Group have taken the permissive stability safety factor [F] = 1.2 for sliding, overturning and uplifting stabilities of Tien Sa caissons. In the designed case, Fs (the calculated sliding stability safety factor) is equal 1.25 that is bigger than the value 1.2 of [Fs] (the permissible sliding stability safety factor as the designer selected). F o (the overturning stability safety factor), Fup (the uplifting stability safety factors) of the designed case and of the SLR scenarios due to climate 96
111 changes are bigger than the value 1.2 of [F o ] and [F up ] (the permissible overturning and uplifting stability safety factors). However, F s (the sliding stability safety factors) of SLR1, SLR2 and SLR3 scenarios the F s values (respectively 1.17, 1.16 and 1.13) are smaller than the value 1.2 of [F s ]. This is a typical example that points out the negative impacts of SLR due to climate changes for Tien Sa breakwater and the other similar coastal structures The assumption of repairing Tien Sa Breakwater Caissons in Sea Water Level Rise Scenarios The breakwater has been built and put in operation of Tien Sa port since In the SLR1, SLR2 and SLR3 scenarios, the sliding stability safety factors are respectively 1.17, 1.16 and They are smaller than the permissible stability safety factors [F] = 1.20 Assumption of that Tien Sa caissons need to be repaired to ensure safety in SLR scenarios. The selected solution to enhance stability of caissons is adding more the concrete block s thickness of 1.0 m on the caisson s top. a. Results of Calculations The calculations of loads and caisson's stability by adding more the concrete block s thickness of 1.0 m on the caisson s top (with the sea bed elevation of m, point 3) are shown in the table No Vector Parameters Unit I Designed case SLR = 0 INPUT DATA SLR1 = 0.65 m SLR Scenarios SLR2 = 0.75 m SLR3 = 1.0 m 1 SWL ELEVATION m Elevation of Sea bed m The depth of water in front of caisson breakwater m , 2, H = Hmax = H D m =.g KN/m d d c R c
112 11 * R c η * h s T L B c Sinh(4П.h S / L) Cosh(2П.h S / L) ((1-d/h S )*(H/d) 2 )/ d/H α α α α II FORCES 5 P 1 kn/m P 3 KN/m P 4 KN/m P u KN/m F h,goda kn F U,Goda kn L h, Goda m L V, Goda m M Goda knm W 1 KN/m W 2 KN/m W 3 KN/m W 4 kn/m W 5 kn/m F h kn/m
113 III THE SAFETY FACTOR OF SLIDING 40 F V KN/m µ F S IV THE SAFETY FACTOR OF OVERTURNING 43 P h Goda (1) KN/m L h Goda (1) m P h Goda (2) KN/m L h Goda (2) M Goda KNm M w1, w2, w3, w4 KNm F o V THE SAFETY FACTOR OF UPLIFTING 50 F up The added mass of concrete for one caisson Table The calculated results of caisson's stability by adding more the concrete block s thickness of 1.0 m on the caisson s top Fig Enhancing stability of caissons by adding more the concrete block s thickness of 1.0 m on the caisson s top in SLR 3 scenario 99
114 b. The Remarks for the calculated results In SL1, SL2 and SL3 scenarios due to climate changes, if repairing the caisson by adding 1.0 m of concrete block thickness on the caisson top, then Fs respectively are equal 1.29, 1.27 and All those Fs values are bigger than the value 1.2 of [Fs].. That repairing solution by adding 1.0 m of concrete block thickness on the caisson top will increase the weight of the caisson' mass; However it also increase the horizontal wave force on the caisson. The added concrete mass of the 10 m concrete thickness on one caisson is 360 cubic meters. This is an example that points out the solution to repair the caissons impacted by SLR due to climate changes for Tien Sa breakwater and the other similar coastal structures The assumption of newly designing Tien Sa Breakwater's Caissons in sea water level rise Scenarios In the SLR1, SLR2 and SLR3 scenarios, the sliding stability safety factors are respectively 1.17, 1.16 and They are smaller than the permissive stability safety factors [F] = 1.20 Assumption of that Tien Sa caissons in the new design phase that need to be designed for safety in SLR scenarios. The new caissons can be designed with their length and width larger than the designed case. If so, the concrete mass will be larger than the designed case too. In this study the selected solution to enhance stability of caisson is expanding more the bed width of caissons by two concrete plate s length of 1.2 m at each side of the caisson, the average concrete plate s thickness of 1 m. By this solution we can take advantages of the sea water weight on the caisson s bed to enhance the sliding stability safety for the caissons. Fig Expanding more the caisson's bed width by two concrete plates, the each plate's length of 1.2 m at each side of the caisson, the average concrete plate s thickness of 1 m. a. Results of Calculations 100
115 No Vector Parameters Unit I INPUT DATA Designed case SLR = 0 SLR1 = 0.65 m SLR Scenarios SLR2 = 0.75 m SLR3 = 1.0 m 1 SWL elevation m Elevation of sea bed m The depth of water in front of caisson breakwater m , 2, 3 : H = H max m =.g kn/m d m d c m R c m * R c m m h s m T s L m Bc m sinh(4п.h S / L) cosh(2п.h S / L) ((1-d/h S )*(H/d) 2 )/ d/H α α α α II FORCES 25 P 1 kn/m P 3 kn/m
116 27 P 4 kn/m P u kn/m F h,goda kn F U,Goda kn L h, Goda m L V, Goda m M Goda knm W 1 kn/m W 2 kn/m W 3 kn/m W 4 kn/m W 5 kn/m W 6 kn/m F h kn/m III THE SAFETY FACTOR OF SLIDING 41 F V kn/m µ F S IV THE SAFETY FACTOR OF OVERTURNING 44 P h Goda (1) kn/m L h Goda (1) m P h Goda (2) kn/m L h Goda (2) m M Goda knm M w1, w2, w3, w4 knm F o V THE SAFETY FACTOR OF UPLIFTING 51 F up V adding concrete for one caisson m Total V adding concrete for 450 m of length m Table The calculated results of stability of Tien Sa Caissons by adding two concrete plates, the each plate's length of 1.2m at each side of the caisson, the average concrete plate s thickness of 1 m. 102
117 The schema for calculating the wave Goda forces are shown in the Fig for the case of SLR3 Fig The wave Goda loads on Tien Sa breakwater Caisson in SLR3 Scenario (by expanding 2.4 m (2 x 1.2) length of the caisson bed width with the average thickness of 1,0 m) b. The Remarks for the calculated results If the caisson' bed width is expanded from 18 m to 20.4 m by adding the two concrete bed plates at the both sides of caisson (the width of each concrete plate is 1.2 m with the thickness from 0.8 m to 1.2 m), the Fs are equal 1.25, 1.24 and 1.21 respectively in SL1, SL2 and SL3 scenarios due to climate changes. All those Fs values are bigger than the value 1.2 of [Fs]. The concrete mass for expanding the caisson width of 2.4 m with the average concrete plate thickness of 1 m for one caisson of Tien Sa breakwater is 40 cubic meters of concrete. The weight of that concrete mass is 100 tons. The designed water depth of one caisson is 5.04 m; its height is 10.5 m. The new water depth of one caisson (after expanding the caisson's width of 2.4 m) is 5.55 m will increase of 0.51 m for one caisson. That will not cause failure the caisson during the caisson is pull-hauled to the erecting site. By that solution, although the vertical wave force on the caisson bed is increased, however the added concrete weight, the water weight on the caisson bed are also increased correlatively. Consequently the friction force is increased that increases the sliding stability safety factor. Obviously that solution of expanding the caisson's width is feasible. 103
118 5.6. Wave overtopping on Tien Sa breakwater Mean Wave Overtopping Discharge The mean overtopping discharge q is given in m 3 /s per m. H mo The incident significant wave height at the toe ò the structure a = 0,082 for plain vertical structures exposed to head on waves. b = 3 for plain vertical structures exposed to head on waves R c : Crest free board H s : Water depth at the toe of the structure Or: q a. g H. e R c ( b. ) 3 Hm 0 m 0 For composite vertical walls: the mean overtopping discharge is calculated by the formulae: d q g h 2 3 * S Valid for: * R ( d ) H 4 C 2.6 * mo RC 0.05 d 1.0 and h * < 0.3 H Maximum Wave Overtopping Volumes by one wave P v : The exceedance probability of an overtopping volume per wave V max : The maximum overtopping volume by only one wave N ow : The number of overtopping waves N w : The number of waves Storm duration t= 6 hours mo Wave Transmission by wave Overtopping For smooth sloping structures the following prediction formulae: 104
119 H mo,t : significant wave height of transmission H mo,i : Incident significant wave height [23], [24] Applications and results of calculations The calculated results for Mean Wave Overtopping Discharge, Maximum Wave Overtopping Volumes and Wave Transmission by wave Overtopping are shown in the table In which some conditions and assumptions for calculations are used as following. a. For calculations of Mean Wave Overtopping Discharge - The wave heights are calculated for three points (1), (2) and (3) as explained in the section (see Fig. 5-26). - The prediction of the wave heights for SLR scenarios at the another points)) could not be done in this study context (exception for the prediction can be done for the points (1), (2) and (3. - Some assumptions should be noted as following: + Using the wave height at the point (1) in calculations of mean wave overtopping discharge for the breakwater segment of 300 m from the root of breakwater at the coast. + Using the wave height at the point (2) in calculations of mean wave overtopping discharge for the breakwater segment of 100 m. + Using the wave height at the point (3) in calculations of mean wave overtopping discharge for the breakwater segment of 50 m of the head part of breakwater. - Tien Sa breakwater is the type of composite breakwater that consists of two segments (segment 1: roubble mound cross section with the crow wall crest of 5.5m; segment 2: roubble mound cross section with the caisson crest of 5.2m). - In order to predict the mean wave overtopping discharge the 5.2 m crest elevation is uniformly calculated for both segments of Tien Sa breakwater. b. For calculations of Maximum Wave Overtopping Volumes by one wave - The time of continuously flowing wind time in storm is 6 hours. - The number of waves put in accounts (Nw) is The number of overtopping waves put in accounts (Now).. - In order to predict the overtopping wave volumes by one wave the 5.2 m crest elevation is uniformly calculated for both segments of Tien Sa breakwater. c. For calculations of Wave Transmission by wave Overtopping Calculations of wave transmission by wave overtopping are in the condition of smooth sloping structures (dike, seawalls); rubble mound structures (breakwaters, rock slopes) 105
120 and vertical structures (caissons, sheets pile walls) that is likely Tien Sa breakwater [23]. - In order to predict the wave transmission by wave overtopping the 5.2 m crest elevation is uniformly calculated for both segments of Tien Sa breakwater. (see the cross sections of Tien Sa breakwater in the appendix 3 for Chapter 5) The Remarks for the calculated results - The value d* < 0.2 therefore wave impacts on the Tien Sa breakwater in impulsive conditions. - In the designed case the formula for calculating the Mean Wave Overtopping Discharge of Tien Sa composite breakwater is valid because of d * Rc/Hmo > 0,05. - In the SLR1, SLR2 and SLR3 the formula for calculating the Mean Wave Overtopping Discharge of Tien Sa composite breakwater is not valid because of d * Rc/Hmo < 0,05. - The mean wave overtopping discharge Q is m 3 /s in the designed case, m 3 /s in SLR1 scenario, m 3 /s in SLR2 scenario and m 3 /s in SLR3 scenario. - The maximum wave overtopping volumes by one wave are increased by the wave heights and the sea water levels. In the designed case the values of maximum wave overtopping volumes by one wave are 688 m 3, 762 m 3, 800 m 3 respectively the calculated points (1), (2) and (3). In the SLR1 scenario the values of maximum wave overtopping volumes by one wave are 1357 m 3, 1498 m 3, 1571 m 3 respectively the calculated points (1), (2) and (3). In the SLR2 scenario the values of maximum wave overtopping volumes by one wave are 1535 m 3, 1659 m 3, 1740 m 3 respectively the calculated points (1), (2) and (3). In the SLR3 scenario the values of maximum wave overtopping volumes by one wave are 2158 m 3, 2314 m 3, 2426 m 3 respectively the calculated points (1), (2) and (3). - The wave transmission by wave overtopping is increased by the wave heights and the sea water levels. In the designed case the values of the significant wave height of transmission are m, m, m respectively the calculated points (1), (2) and (3). In the SLR1 scenario the values of maximum wave overtopping volumes by one wave are m, m, m respectively the calculated points (1), (2) and (3). In the SLR2 scenario the values of maximum wave overtopping volumes by one wave are m, m, m respectively the calculated points (1), (2) and (3). In the SLR3 scenario the values of maximum wave overtopping volumes by one wave are 2.614m, m, m respectively the calculated points (1), (2) and (3). - Obviously that the mean wave overtopping discharges, the maximum overtopping volumes by one wave and the significant wave height of transmission are increased in accordance with the increase of SLR scenarios and the calculated points (1), (2) and (3). - The tolerable mean discharges damaging to property behind breakwaters show that if the mean overtopping discharge q (given in m 3 /s per m) is large than 50 l/s per m, the maximum wave overtopping volumes by one wave (Vmax) equal from 5 m 3 per m to 50 m 3 per m that will cause significant damages or sinking of large yachts. 106
121 - The mean overtopping discharges q (given in m 3 /s per m) in the designed case, SLR1, SLR2 and SLR3 scenairios of Tien Sa Breakwater from 326 l/s per m to 1502 l/s per m, the maximum wave overtopping volumes by one wave Vmax from 688 m 3 per m to 2426 m 3 per m. - In comparison with the limited noms of the mean overtopping discharge q (given in m 3 /s per m) large than 50 l/s per m, the maximum wave overtopping volumes by one wave (V max ) equal from 5 m 3 per m to 50 m 3 per m; Obviously that the wave overtopping on Tien Sa breakwater will cause significant damages or sinking of large yachts. 107
122 No I Paramet ers INPUT DATA Calculated points SWL Elevation Elevation of Sea Bed The depth of water in front of caisson breakwater (hs) Unit Designed case SLR Scenarios SRL = 0 SLR1 = 0.65 m SLR2 = 0.75 m SLR3 = 1.0 m (1) (2) (3) (1) (2) (3) (1) (2) (3) (1) (2) (3) m m m H 1/3 m H max m H mo =.g kn/m d m d* m d* < 0.2: impulsive d* < 0.2: impulsive d* < 0.2: impulsive d* < 0.2: impulsive 11 conditions conditions conditions conditions 12 Rc m * R c m m
123 15 h s m T s T m-1,0 s L (for H 1/3 ) m Bc m II THE MEAN OVERTOPPING DISCHARGE 20 d * R C /H mo h* Valid for Formulae 23 q m 3 /s/ m Valid Valid Valid Valid Valid Valid Valid Valid Valid Valid Valid Valid L (Segment of Breakwater) m II Q (Total for 450 m) m3/s THE MAXIMUM OVERTOPPING VOLUME BY ONE WAVE 26 t s a=0.84*q*t/now Nw
124 29 N ow Vmax (by one wave) m IV THE WAVE TRANSMISSION BY WAVE OVERTOPPING 31 ξ o.p β Kt V The Transmission significant wave height behind the breakwater 34 Hmo,t : m Table Results of Calculations of Mean Wave Overtopping Discharge, Maximum Wave Overtopping Volumes, Wave Transmission by wave Overtopping 110
125 5.7. Wave diffraction at Tien Sa port site Input Data Tien Sa breakwater is located in the direction from the East (Son Tra island coast) to the West (the sea of Da Nang Bay). The main storm direction is from the North to the South. In the structural designed phase of Tien Sa breakwater, the wave diffraction analysis were only carried out for the Service Limit State. In this study the wave diffraction analysis were carried out for the Ultimate Limit State with the wind velocity v = 40 m/s, the probability of 2%, the return period of 50 years and the main storm direction is from the North to the South. This section shows the calculations of wave diffraction in Ultimate Limit State of Tien sa Bay by using the diagrams of Goda (2000) [25]. Sea water level elevations, wave heights, wave length at the head of Tien Sa breakwater for calculating wave diffraction heights in Ultimate Limit State (those are used in the calculations of caisson s stabilities) as following: No Parameters Unit Designed case SLR Scenarios SLR1 = SLR2 = SLR3 = Calculated cases SRL = m 0.75 m 1.0 m 1 SWL elevation m H = H max m L m T s Table Input data for calculating wave diffraction heights in Ultimate Limit State of Tien Sa Bay The main wave direction from the North to the South is perpendicular with the centre line of breakwater, so the wave coming angle θ = 90 o. The directional concentration parameter S max is assumed to be 10 for widely spread wind waves, 25 for averagely spread wind waves and 75 for swell with a long decay distance in each calculating case.. In order to determine the wave diffraction heights and lengths in Ultimate Limit State of Tien Sa Port Bay the diffraction coefficients of wave heights and lengths are calculated by using the diagrams of Goda (2000) Calculated Results of Wave diffraction heights in Tien Sa Port Bay a. Assumption of widely spread wind waves to the bay (the wave direction from the North to the South, S max = 10) The results are shown in the Fig to


126 Point 1 Yard 5 Fig Designed Case - Wave Diffraction in Tien Sa Bay setup by the diagram of Goda with the wave direction from the North to the South, S max = 10 Point 1 Yard 5 Fig SLR1 Case - Wave Diffraction in Tien Sa Bay setup by the diagram of Goda with the wave direction from the North to the South, S max =


127 Point 1 Yard 5 Fig SLR2 Case - Wave Diffraction in Tien Sa Bay setup by the diagram of Goda with the wave direction from the North to the South, S max = 10 Point 1 Yard 5 Fig SLR3 Case - Wave Diffraction in Tien Sa Bay setup by the diagram of Goda with the wave direction from the North to the South, S max =


128 b. Assumption of averagely spread wind waves to the bay (the wave direction from the North to the South, S max = 25) The results are shown in the Fig to Point 1 Yard 5 Fig Designed Case - Wave Diffraction in Tien Sa Bay setup by the diagram of Goda with the wave direction from the North to the South, S max = 25 Ponit 1 Yard 5 Fig SRL1 Case - Wave Diffraction in Tien Sa Bay setup by the diagram of Goda with the wave direction from the North to the South, S max =


129 Point 1 Yard 5 Fig SRL2 Case - Wave Diffraction in Tien Sa Bay setup by the diagram of Goda with the wave direction from the North to the South, S max = 25 Point 1 Yard 5 Fig SRL3 Case - Wave Diffraction in Tien Sa Bay setup by the diagram of Goda with the wave direction from the North to the South, S max =


130 c. Assumption of swell to the bay with a long decay distance (the wave direction from the North to the South, S max = 75) The results are shown in the Fig to 5.23 Point 1 Yard 5 Fig Designed Case - Wave Diffraction in Tien Sa Bay setup by the diagram of Goda the wave direction from the North to the South, S max = 75 Point 1 Yard 5 Fig SLR1 Case - Wave Diffraction in Tien Sa Bay setup by the diagram of Goda with the wave direction from the North to the South, S max =


131 Point 1 Yard 5 Fig SRL2 Case - Wave Diffraction in Tien Sa Bay setup by the diagram of Goda with the wave direction from the North to the South, S max = 75 Point 1 Yard 5 Fig SRL3 Case - Wave Diffraction in Tien Sa Bay setup by the diagram of Goda with the wave direction from the North to the South, S max =
132 The Remarks for the calculated results a. The wave height requirements for ship s safety in Ultimate Limit State In the ultimate limit state in order to ensure the safety of ships and boats the wave height at Tien Sa port should be satisfied: H 2 m b. For the assumption of widely spread wind waves to the bay, = 90 o, Smax= 10 - The designed case: If the coming waves at the head of Tien Sa Breakwater H D = H = 9.7 m then the wave height at the head of Jetty number 1 and Jetty number 2 the reduced wave height is only 2.91 m; At the centre point of the Port Yard 5 the reduced wave height is only 2.67 m. - The SLR1 case: If the coming waves at the head of Tien Sa Breakwater H = 9.96 m then the wave height at point 1 between the head of Jetty number 1 and Jetty number 2 the reduced wave height is 2.97 m; At the centre point of the Port Yard 5 the reduced wave height is 2.7 m. - The SLR2 case: If the coming waves at the head of Tien Sa Breakwater H = 10.0 m then the wave height at point 1 the reduced wave height is only 3.1 m; At the centre point of the Port Yard 5 the reduced wave height is 2.8 m. - The SLR3 case: If the coming waves at the head of Tien Sa Breakwater H = 10.1 m then the wave height at point 1the reduced wave height is 3.2 m; At the centre point of the Port Yard 5 the reduced wave height is 2.9 m. - The condition of using diagrams of Goda for calculating wave diffraction heights is that overtopping on the Breakwater do not takes place. However, overtopping does on Tien Sa breakwater in all of the calculated cases. Therefore, the wave heights at the above calculated points will be higher than the above calculated values. c. For the assumption of averagely spread wind waves to the bay, = 90 o, S max = 25 - The designed case: If the coming waves at the head of Tien Sa Breakwater H D = H = 9.7 m then the wave height at point 1the reduced wave height is 2.41 m; At the centre point of the Port Yard 5 the reduced wave height is 2.1 m. - The SLR1 case: If the coming waves at the head of Tien Sa Breakwater H = 9.96 m then the wave height at the point 1the reduced wave height is 2.45 m; At the centre point of the Port Yard 5 the reduced wave height is 2.15 m. - The SLR2 case: If the coming waves at the head of Tien Sa Breakwater H = 10.0 m then the wave height at point 1the reduced wave height is 2.55 m; At the centre point of the Port Yard 5 the reduced wave height is 2.25 m. - The SLR3 case: If the coming waves at the head of Tien Sa Breakwater H = 10.1 m then the wave height at point 1the reduced wave height is 2.67 m; At the centre point of the Port Yard 5 the reduced wave height is 2.3 m. - The condition of using diagrams of Goda for calculating wave diffraction heights is that overtopping on the Breakwater do not takes place. However, overtopping does on Tien 118
133 Sa breakwater in all of the calculated cases. Therefore, the wave heights at the above calculated points will be higher than the above calculated values. d. For the assumption of swell to the bay with a long decay distance, = 90 o, Smax= 75 - The designed case: If the coming waves at the head of Tien Sa Breakwater HD = H = 9.7 m then the wave height at point 1the reduced wave height is 1.78 m; At the centre point of the Port Yard 5 the reduced wave height is 1.56 m. - The SLR1 case: If the coming waves at the head of Tien Sa Breakwater H = 9.96 m then the wave height at the point 1 the reduced wave height is 1.85 m; At the centre point of the Port Yard 5 the reduced wave height is 1.62 m. - The SLR2 case: If the coming waves at the head of Tien Sa Breakwater H = 10.0 m then the wave height at point 1 the reduced wave height is 1.9 m; At the centre point of the Port Yard 5 the reduced wave height is 1.67 m. - The SLR3 case: If the coming waves at the head of Tien Sa Breakwater H = 10.1 m then the wave height at point 1the reduced wave height is 1.96 m; At the centre point of the Port Yard 5 the reduced wave height is 1.7 m. - As mentioned above, the condition of using diagrams of Goda for calculating wave diffraction heights is that overtopping on the Breakwater do not takes place. However, overtopping does on Tien Sa breakwater in all of the calculated cases. Therefore, the wave heights at the above calculated points will be higher than the calculated values. 119

134 Fig General View of Da Nang Bay (Source: Google map)

135 Fig General View of Tien Sa Port and Breakwater (Source: Google map) 121

136 Fig Layout and Longitudinal Cross Section of Tien Sa Breakwater
137 Chapter 6: Conclusions and recommendation 6.1. Conclusions General impacts For Viet Nam, by the end 2100 sea level may rise up about 65 to 100 cm in comparison with the baseline period of For Ho Chi Minh City, the inundation area is 128 km 2 (6.3%) in the 65 cm SLR1 scenario; 204 km 2 (10%) in the 75 cm SLR2 scenario and 473 km 2 (23%) in the 100 cm SLR3 scenario. For Mekong River Delta, the inundation area is 5133 km 2 (12.8%) in the 65 cm SLR1 scenario; is 7580 km 2 (19%) in the 75 cm SLR2 scenario and is km 2 (37.8%) in the 100 cm SLR3 scenario. All of the built sea ports as well as their wharfs, storages, roads to the ports, jetties, breakwaters etc. in Viet Nam have been not taken into account SLR due to climate changes. If SLR3 scenario with 100 cm of SLR and a large storm surge take place simultaneously then all most sea ports of Ho Chi Minh City, Dong Nai, Ba Ria-Vung Tau, Con Dao Island and Mekong River Delta can be submerged under sea levels, and the ports of Bac Bo Delta as Hai Phong, Quang Ninh ports can be submerged significantly. In the Master Plan of Viet Nam sea ports (by 2020 and to be oriented by 2030) Ba Ria- Vung Tau port and Van Phong port will be the international integrated ports and Nam Du port will be the first deep sea port to act as an export hub for rice and seafood, two of South Vietnam's major export products. In the annual report on Climate change and sea level rise in Viet Nam MONRE has proposed 3 scenarios of sea level rise in the next 100 years viz. 60 cm (low emission scenario), 75 cm (medium emission scenario), 100 cm (high emission scenario). This study is implemented these 3 scenarios on 2 case studies of 2 sea ports: Nam Du deep sea port with researched structure is jetty structure and Tien Sa sea port with researched structure is breakwater. The thesis focuses on the impact of waves and sea level rise on these two types of structures. The 2 case study: Nam Du jetty structure and Tien Sa breakwater Nam Du jetty In the Master Plan of Nam Du Port, SLR of 30 cm (due to climate change) is taken account and the desk crest elevation of jetties is determined equal +10, 00 for design. The calculated results show that the extreme wave crest elevation of max does not touch the desk's underneath of jetties. Waves only attack to the piles and rakings of jetty. Even in the severest scenario (SLR 3) when sea level due to climate changes rises up 1 meter in comparison with the current mean sea level, the extreme wave crest elevation of a maximum individual wave has not reached the jetty deck. Nam Du jetty structure is designed based on the air gap approach. Hence, with the designed desk crest elevation at +10.0m has provided enough safety free board for the extreme waves not to touch the underneath of the deck, even in the SLR3 scenario if sea level can rise up 1 meter in the next 100 year. Tien Sa breakwater + Load and stability
138 By commenting that wave height will increase correspondingly with increasing water depth, an interpolation has been carried out to determine the designed wave height relative to the scenarios of rising sea level at 3 points of calculation. Tien Sa breakwater does not sustain its stability in ULS if the sea level rise 65cm, 75cm and 100cm by the end of 2100 (the sliding factor [F s ]<1.2). There are 2 solutions to be proposed: 1. The solution of ballasting the caisson to 1m high over the whole length and width of the caisson. This solution is applied for repairing the breakwater in SLR condition. 2. The solution of expanding wider caisson's bed width of 1.2m and the thickness of 1m averagely for each side (the bed width of caisson increase from 18m to 20.4m) for enhancing stability for caissons. This conceptual solution is applied when a newly designed breakwater is proposed with similar condition of wave and geometry. The advantage of this solution is utilizing the amount of water above the expanding bed width to increase the resistance force component against sliding. + Wave overtopping and transmission Tien Sa mean wave overtopping discharge Q is m 3 /s in the designed case, m 3 /s in SLR1 scenario, m 3 /s in SLR2 scenario and m 3 /s in SLR3 scenario. Obviously that the mean wave overtopping discharges, the maximum overtopping volumes by one wave and the significant wave height of transmission are increased in accordance with the increase of SLR scenarios and the calculated points (1), (2) and (3). + Wave diffraction In the ultimate limit state, in order to ensure the safety of ships and boats the wave height at Tien Sa port (behind the breakwater: point between quay wall 1 and 2, and yard 5) should be satisfied: H 2 m Wave diffraction behind the breakwater is concluded with 3 different cases respective to different directional wave spectrum: = 90 o, S max = 10; = 90 o, S max = 25 and = 90 o, S max = 75. For the assumption of widely spread wind waves to the bay, = 90 o, S max = 10, the wave diffraction in port bay (using the diagrams of Goda, 2000) behind the breakwater (at point 1 and centre of yard 5) is all much larger than 2m in all designed and SLR situation. Vessels are warned not allowed to operate in this USL condition. For the assumption of averagely spread wind waves to the bay, = 90 o, S max = 25, the wave diffraction in port bay (using the diagrams of Goda, 2000) behind Tien Sa breakwater is a bit larger than the permissible wave height 2m.Vessels are warned to limited access to the port, especially small vessels (boat, yacht) not to sail in this USL condition. For the assumption of swell to the bay with a long decay distance, = 90 o, Smax= 75, the wave diffraction in port bay (using the diagrams of Goda, 2000) behind Tien Sa breakwater is smaller than the permissible wave height: 2m. If Tien Sa directional wave spectra fall in this rang vessels are operated normally. 124
139 Above is only calculation with wave diffraction due to the simplified diagram of Goda. It has not included wave refraction, shoaling and wave transmission behind a breakwater. Hence, conclusion is only for reference and based on results from this report. For a more accurate conclusion, a numerical modeling should be applied to this case study Recommendations - It is necessary to take the SLR prediction in to planning, designing and repairing phases for Viet Nam sea ports, so the elevation of sea ports and their wharfs, jetties, breakwaters etc. should be heightened. - Wave conditions, wave loads, stability and structural strength of the built sea ports their protection structures impacted by waves and SLR due to climate changes should be taken account again. Based on that the repair or upgrade requirements for them can be necessary or not. The prediction of wave heights at the sites of Tien Sa breakwater and the calculations of repairing Tien Sa breakwater caissons in SLR scenarios of Viet Nam are a typical example. - The feasible solutions to enhance stability of caissons in design should be used. For example: Tien Sa caisson' bed width is expanded from 18 m to 20.4 m by adding the two concrete bed plates at the both sides of caisson (the width of each concrete plate is 1.2 m with the thickness from 0.8 m to 1.2 m). - The design and construction standards for sea ports and their protective structures should be adjusted in accordance with the conditions of SLR due to climate changes. - To adjust the Master Plan of Viet Nam sea ports and their protection structures (particularly for the sea ports in Ho Chi Minh City and Mekong River Delta) in which the inundation maps in SLR scenarios and impacts of waves and SLR prediction due to climate changes are paid attention. - The national study programs focused on sea ports risk and adaptation measures in SLR due to climate changes will be useful. The river ports, inland roads and infrastructure, storage houses, logistics services etc. that linked to the sea pots are very important, particularly in SLR due to climate changes. - In the SLR condition due to climate changes, an idea of mobile sea ports should be soon studied for the sea ports in Ho Chi Minh City and Mekong River Delta in Viet Nam. 125
140 References 1. Susmita Dasgupta and Craig Meisner; Climate Change and Sea Level Rise - A Review of the Scientific Evidence, The World Bank Environment Department, Paper number 118, May Susmita Dasgupta, Benoit Laplante, Siobhan Murray and David Wheeler; Climate Change and the Future Impacts of Storm-Surge Disasters in Developing Countries, Center for Global Development 1800 Massachusetts Ave., NW Washington, DC 20036, September IPCC Fourth Assessment Report: Climate Change 2007 (AR4), 4. Wikipedia - Global warming, 5. Bộ Tài nguyên và Môi trường, Kịch bản biến đổi khí hậu, nước biển dâng cho Việt Nam, Ministry of Natural Resources and Environment, Climate Change, Sea Level Rise Scenarios for Viet Nam, Hanoi, June Bộ Tài nguyên và Môi trường. Dự thảo Chiến lược quốc gia về biến đổi khí hậu, Mynistry of Natural Resources and Environment, National Strategy for Climate Changes in Draft, Hanoi, Quyết định của Thủ tướng Chính phủ Số 202/1999/QĐ-TTg ngày 12 tháng 10 năm 1999 Về việc phê duyệt Quy hoạch tổng thể phát triển hệ thống cảng biển Việt Nam đến năm Decision of the Prime Vietnamese Mynister No 202/1999/QĐ-TTg dated 12 October 1999 about the approval of Master Plan for Viet Nam Sea Port System until Quyết định của Thủ tướng Chính phủ Viet Nam Số 16/2008/QĐ-TTg ngày 28 tháng 01 năm 2008 Về việc công bố danh mục phân loại cảng biển Việt Nam. Decision of the Viet Nam Prime Vietnamese Mynister No 16/2008/QĐ-TTg dated 28 January 2008 about the classification of Viet Nam Sea Ports. 9. Quyết định Số: 2190/QĐ-TTg ngày 24 tháng 12 năm 2009 của Thủ tướng Chính phủ Việt Nam về việc phê duyệt Quy hoạch phát triển hệ thống cảng biển Việt Nam đến năm 2020, định hướng đến năm Decision of The Prime Vietnamese Mynister No 202/2009/QĐ-TTg dated 24 December 2009 about the approval of Master Plan for Viet Nam Sea Port System until 2020 and orientation until PGS.TSKH. Nguyễn Ngọc Huệ, Quy hoạch hệ thống cảng biển Việt Nam - Sự kế thừa và phát triển. GEMADEPT POWER 03/10/2011. Asoc. Prof. Dr. Nguyen Ngoc Hue, Master Plan for Viet Nam Sea Port System - Inheritance and Development. GEMADEPT POWER 03/10/ Viet Nam sea ports Assosiation Per Bruun; Port Engineering, Fourth Edition, Gulf Publishing Company, July Kirsty McConnell, William Allsop, Ian Cruickshank; Piers, Jetties and related structures exposed to wave: Guidelines for hydraulic Loadings, Ing. Jeroen Overbeek PMSE and Ir Martijn Klabbers (2001) Design of jetty decks for extreme vertical wave loads. 15. Bing Ren, Yongxue Wang (2005) Laboratory study of random wave slamming on piled wharf with different shore connecting structures. 126
141 16. X.Y.Zhang, C.F. Leung, F.H. Lee (2009) Centrifuge modeling of caisson breakwater subject to wave-breaking. 17. Oliver de Rooij, TU Delft final thesis (2001) Wave impact on horizontal platform 18. Manual Hydraulic Structure (CT 3330) prof.ir.drs. Vrijling and et al 19. K.J. McConnell, N.W.H. Allsop, G. Cuomo and I.C. Cruickshank; New Guidance for Wave Forces on Jetties in Exposed Locations; Copedec VI 2003, Colombo, Sri Lanka Paper No Luca Martinelli, Alberto Lamberti, Maria Gabriella Gaeta,Matteo Tirindelli, John Alderson, Stefan Schimmels: Wave Loads on Exposed Jetties: Description of Large Scale Experiments and Preliminary Results. 21. Marcello Ciampoli & Gianluca Gatto, Giovanni Cuomo, Giorgio Lupoi; Wave-loads fragility analysis of jetty structures. ICOSSAR 2005, G. Augusti, G.I. Schuëller, M. Ciampoli (eds) 2005 Millpress, Rotterdam, ISBN Oumeraci et al (2001): Prohabilistic Design of Vertical Breakwaters. Balkema, Amsterdam 316 p. 23. T. Pullen et al, EurOtop; Wave Overtopping of Sea Defence and Related Structure: Assessment Manual, August Robert Sorensen, Edward F. Thompson, Chapter 7 Harbor Hydrodynamics, EM dia/1/8/4/cem_part-ii_chap- 7.pdf+chapter7+of+harbor+dynamics&hl=vi&gl=vn&pid=bl&srcid=ADGEESi4bggXxoeJx xjaqhtivf- VvsCZNo_wxpWmVn2imKsvKrdK5oNTnqhJWKteM64nyPLKe8t4If2vBNX0nySE_evtNQ EyhEQSJJJJg5sfahVcB1mmis6jJI6aHSNm7u_-3rae_3wT&sig=AHIEtbQMOsNtyPlOKFjjtYLugW1N9fHKA 25. Phạm Văn Giáp, Nguyễn Ngọc Huệ, Đinh Đình Trường; Sóng biển đối với cảng biển; Nhà xuất bản Xây dựng, Pham Van Giap, Nguyen Ngoc Hue, Dinh Dinh Truong; Sea Waves for Ports, Building Publisher, Hanoi, Naomi P. Holliday, Margaret J. Yelland, Robin Pascal, Val R. Swail, Peter K. Taylor, Colin R. Griffiths, and Elizabeth Kent; Were extreme waves in the Rockall Trough the largest ever recorded? Geophysical Research Letters, Vol. 33, L05613, doi: /2005GL025238, 2006). Royal Haskoning, Nam Du Deep Sea Port Port Master Plan, Tư vấn Liên danh giữa Công ty Tư vấn cảng Nhật Bản (JPC) với Tổng công ty Tư vấn Thiết kế Giao thông vận tải (TEDI) và sự hợp tác của Tập đoàn Maunsell, Hồ sơ thiết kế kỹ thuật - bản vẽ thi công của Dự án mở rộng cảng Tiên Sa - Đà Nẵng, Co-operated Consultants between Japanese Port Consultant Company (JPC), General Consultant Company for Transport Design (TEDI) and Maunsell Group, Structural Design Dossier of Tien Sa - Da Nang Port Expansion Project, K.d' Angremond and F.C. van Roode; Breakwaters and closure dams, TU Delft, J.C. van der Lem, Breakwaters, Powerpoint, IHE, Feb
142 31. H.Oumeraci, Wave Loads on Breakwaters, Sea Walls and Other Marin Structures, Powerpoint. 32. Tải trọng và tác động (do sóng và do tàu) lên công trình thuỷ- Tiêu chuẩn thiết kế Việt Nam 22TCN ; Loads and Impacts (by Wind and Ship Waves) on Coastal Structures - Viet Nam Standard for Design 22TCN Tải trọng và tác động- Tiêu chuẩn thiết kế TCVN- 2737: 1995; Loads and Impacts - Viet Nam Standard for Design TCVN- 2737: Magchiel van Os, TU Delft final thesis (2002) Breaker model for coastal structure 35. Cảng biển di động triển vọng mới cho cảng biển Việt Nam; Mobile Sea Port The new prospect for Viet Nam sea ports. %E2%80%93-trien-vong-moi-cho-cang-bien-viet-nam-309.html 36.Video of Mobile Sea Port: The UNCTAD secretariat, United Nations Conference on Trade and Development, Ad Hoc Expert Meeting on Climate Change Impacts and Adaptation: A Challenge for Global Ports; Geneva, Palais des Nations, September Matteo Tirindelli, Giovanni Cuomo, William Allsop, Alberto Lamberti; Proceedings of The Thirteenth (2003) International Offshore and Polar Engineering Conference. 128


143 Appendix A1. Appendix 1 (of Chapter 1) Fig A. 1. View of Breakwater of Hon La Port in Quang Binh province Fig A. 2. View of Jetties of Chan may Port in Thua Thien - Hue province


144 Fig A. 3. View of Breakwater and Jetties of Dung Quat Port in Quang Ngai province Fig A. 4. Vung Ang Sea Port and Industrial Area in Ha Tinh province 130


145 Fig A. 5. Master Plan of Van Phong International Port in Khanh Hoa province Fig A. 6. The sea ports of Group 1- From Quang Ninh to Ninh Binh province in Master Plan 131

146 Fig A. 7. The sea ports of Group 2 - From Thanh Hoa to Ha Tinh province in Master Plan 132

147 Fig A. 8. The sea ports of Group 3 - From Quang Binh to Quang Ngai province in Master Plan 133

148 Fig A. 9. The sea ports of Group 4 - From Binh Dinh to Binh Thuan province in Master Plan 134


149 Fig A. 10. The sea ports of Group 5 - Ho Chi Minh City, Dong Nai and Ba Ria Vung Tau provinces in Master Plan Fig A. 11. The sea ports of Group 6 - Cuu Long River Delta in Master Plan 135


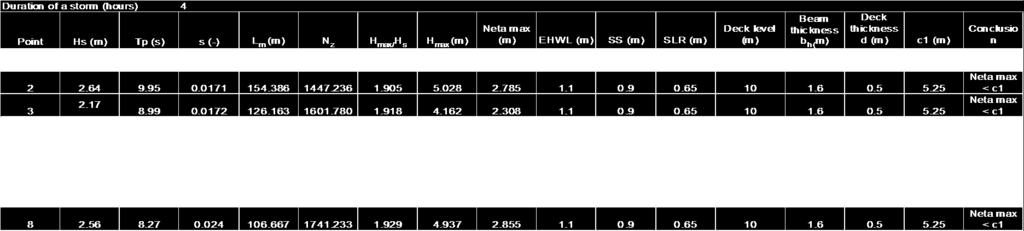
150 A2. Appendix 2 (of Chapter 4) Table A. 1. Calculating the free board between the expected maximum wave crest elevation and the jetty berm bed elevation for the designed case in Master Plan Table A. 2. Calculating the free board between the expected maximum wave crest elevation and the jetty berm bed elevation for the SLR1 Scenario 137
Tidal regime along Vietnam coast under impacts of sea level rise
 VNU Journal of Science, Earth Sciences 28 (2012) 133-139 Tidal regime along Vietnam coast under impacts of sea level rise Tran Thuc, Duong Hong Son* Vietnam Institute of Meteorology, Hydrology and Environment
ALEGOLF MEMBERS PREFERRED RATES TABLE
 Dear Valued Alegolf Member, Alegolf kindly informs you the preference rates valid from December 2017: ALEGOLF MEMBERS PREFERRED RATES TABLE No Name of Course Tee Time Weekday Weekend ((giá (s ALEGOLF Non-Alegolf
The Viet Nam Provincial Governance and Public Administration Performance Index (PAPI) Measuring Citizens Experiences
 Measuring Citizens Experiences") The Viet Nam Provincial Governance and Public Administration Performance Index (PAPI) 2011 Measuring Citizens Experiences Jairo Acuña Alfaro, Policy Advisor, UNDP jairo.acuna@undp.org Presentation prepared
The Viet Nam Provincial Governance and Public Administration Performance Index (PAPI) 2011 Measuring Citizens Experiences Jairo Acuña Alfaro, Policy Advisor, UNDP jairo.acuna@undp.org Presentation prepared
Flood damage modelling
 Flood damage modelling Laurens Bouwer (dept. of Flood Risk Management) with Dennis Wagenaar, Andreas Burzel, Kymo Slager, Karin de Bruijn, Marcel van der Doef, and many others Introduction Why model flood
Morphological change on Cua Dai Beach, Vietnam: Part I image analysis
 Morphological change on Cua Dai Beach, Vietnam: Part I image analysis Nguyen Trung Viet 1, Vo Cong Hoang 2,3 and Hitoshi Tanaka 4 Abstract Severe erosion has been occurred on Cua Dai Beach, Hoi An City,
List of delegates to Italy From June 2018
 List of delegates to Italy From 27 29 June 2018 No. Name Organization Title Notes Provincial authority delegation Ha Noi 1. Nguyễn Đức Chung Chairman of Ha Noi People s 2. Vũ Đăng Định Department of Foreign
Assessment of Salinization in the Main River Systems of Long An Province, Vietnam
 Journal of Environmental Science Engineering A 6 (2017) 381-387 doi:10.17265/2162-5298/2017.08.001 D DAVID PUBLISHING Assessment of Salinization in Main River Systems of Long An Province, Vietnam Can Thu
Wave Energy Atlas in Vietnam
 Wave Energy Atlas in Vietnam Nguyen Manh Hung, Duong Cong Dien 1 1 Institute of Mechanics, 264 Doi Can Str. Hanoi, Vietnam nmhungim@gmail.com; duongdienim@gmail.com Abstract Vietnam has achieved remarkable
SCIENTIFIC COMMITTEE NINTH REGULAR SESSION August 2013 Pohnpei, Federated States of Micronesia
 SCIENTIFIC COMMITTEE NINTH REGULAR SESSION 6-14 August 2013 Pohnpei, Federated States of Micronesia WPEA PROJECT PROGRESS REPORT WCPFC-SC9-2013/ RP-WPEA-06 VIET NAM WEST PACIFIC EAST ASIA STEERING COMMITTEE
Simulation of hydraulic regime and sediment transport in the Mekong delta coast
 Simulation of hydraulic regime and sediment transport in the Mekong delta coast 1. Introduction Coastal erosion in the Mekong Delta has been recorded in recent years and the erosion rate has been increasing
Climate Change Driven Variations in Future Longshore Sediment Transport Rates along the Coast of Vietnam
 Climate Change Driven Variations in Future Longshore Sediment Transport Rates along the Coast of Vietnam Rev.4 March 2014 Authors : Supott Thammasittirong (AIT) Sutat Weesakul (AIT) Ali Dastgheib (UESCO-IHE)
Preliminary estimation of the infrastructure change influence on flooding in 2001 in the lower Mekong river delta
 River Basin Management III 25 Preliminary estimation of the infrastructure change influence on flooding in 1 in the lower Mekong river delta L. T. V. Hoa 1, H. Shigeko 1, N. H. Nhan 2 & T. T. Cong 2 1
INTRODUCTION TO COASTAL ENGINEERING AND MANAGEMENT
 Advanced Series on Ocean Engineering Volume 16 INTRODUCTION TO COASTAL ENGINEERING AND MANAGEMENT J. William Kamphuis Queen's University, Canada World Scientific Singapore New Jersey London Hong Kong Contents
New Orleans Municipal Yacht Harbor
 New Orleans Municipal Yacht Harbor Marina Schematic Design Update 601 Poydras St., Suite 1860 New Orleans, LA, 70130 504-648-3560 Post-Katrina Municipal Yacht Harbor: Introduction The MYH was an approximate
30 Jan Daily Procurement News of Vietnam
 Daily Procurement News of Vietnam Search Dau-Thau Online Daily Procurement News of Vietnam Procurement items Equipment procurement 13 Vehicles, machinery, equipment 13 Automobile supply 13 Automobile supply
29 Jan Daily Procurement News of Vietnam
 Daily Procurement News of Vietnam Search Dau-Thau Online Daily Procurement News of Vietnam Procurement items Equipment procurement 9 Vehicles, machinery, equipment 9 Automobile supply 9 Production equipment,
Boothbay Harbor Rotary Club May 12, 2016
 Mapping Potential Sea Level Rise and Storm Surge in Boothbay Harbor, ME Boothbay Harbor Rotary Club May 12, 2016 Peter A. Slovinsky, Marine Geologist Maine Geological Survey S.M. Dickson, MGS Quickly,
EXISTING CONDITIONS OF AND SOLUTIONS FOR THE DEVELOPMENT OF SUSTAINABLE URBAN TRANSPORT IN SOME MAJOR CITIES OF
 EXISTING CONDITIONS OF AND SOLUTIONS FOR THE DEVELOPMENT OF SUSTAINABLE URBAN TRANSPORT IN SOME MAJOR CITIES OF PhD. Phạm Hoài Chung Transport Development & Strategy Institute - TDSI Ministry of Transport
STUDY ON TSUNAMI PROPAGATION INTO RIVERS
 ABSTRACT STUDY ON TSUNAMI PROPAGATION INTO RIVERS Min Roh 1, Xuan Tinh Nguyen 2, Hitoshi Tanaka 3 When tsunami wave propagation from the narrow river mouth, water surface is raised and fluctuated by long
A New Strategy for Harbor Planning and Design
 A New Strategy for Harbor Planning and Design Xiuying Xing, Ph.D Research Associate Sonny Astani Department of Civil and Environmental Engineering University of Southern California Los Angeles, CA 90089-2531
24 Jan Daily Procurement News of Vietnam
 Daily Procurement News of Vietnam Search Dau-Thau Online Daily Procurement News of Vietnam Procurement items Equipment procurement 14 Vehicles, machinery, equipment 14 Automobile supply 14 Automobile supply
SCIENTIFIC COMMITTEE ELEVENTH REGULAR SESSION. Pohnpei, Federated States of Micronesia 5-13 August 2015
 SCIENTIFIC COMMITTEE ELEVENTH REGULAR SESSION Pohnpei, Federated States of Micronesia 5-13 August 2015 ANNUAL REPORT TO THE COMMISSION PART 1: INFORMATION ON FISHERIES, RESEARCH, AND STATISTICS WCPFC-SC11-AR/CNM-36
Australian Coastal Councils Conference
 Australian Coastal Councils Conference Kiama March 2019 Where Has My Beach Gone? (and what can I do about it?) Dr Andrew McCowan Water Technology Where Has My Beach Gone? Where Has My Beach Gone? Where
BILLY BISHOP TORONTO CITY AIRPORT PRELIMINARY RUNWAY DESIGN COASTAL ENGINEERING STUDY
 Bâtiment Infrastructures municipales Transport Industriel Énergie Environnement BILLY BISHOP TORONTO CITY AIRPORT PRELIMINARY RUNWAY DESIGN COASTAL ENGINEERING STUDY N. Guillemette 1, C. Glodowski 1, P.
List of Participants
 List of Participants Key Challenges in the Process of Urbanization in Ho Chi Minh City: Governance, Socio-Economic, and Environmental Issues Workshop 16-18 September 2009 Ho Chi Minh City, 1. Dr. Nguyễn
Central Golf Tour Lang Co - Hoi An - Da Nang 5 Days 4 Nights
 2 Central Golf Tour Lang Co - Hoi An - Da Nang 5 Days 4 Nights Day 1: Arrival (D) Arrival to Da Nang Airport Transfer to Laguna Resort, check in the resort and dinner Day 2: Laguna Golf Club - Lang Co,
Ninh Chu Bay. MGT Management Consulting
 An Introduction to Ninh Chu Bay MGT Management Consulting INTRODUCTION Ninh Chu Bay is a rapidly growing tourism destination offering a tremendous opportunity for resort and entertainment investment. Tourism
Initial Environmental and Social Examination Report Annex D
 Initial Environmental and Social Examination Report Annex D Project Number: 51327-001 October 2018 Document Stage: Final Proposed Loan and Administration of Loans Da Nhim - Ham Thuan - Da Mi Hydro Power
ISSN: [Dung * et al., 6(8): August, 2017] Impact Factor: 4.116
![ISSN: [Dung * et al., 6(8): August, 2017] Impact Factor: 4.116](/thumbs/87/96890306.jpg "ISSN: [Dung * et al., 6(8): August, 2017] Impact Factor: 4.116") IJESRT INTERNATIONAL JOURNAL OF ENGINEERING SCIENCES & RESEARCH TECHNOLOGY RESEARCH ON FACTORS IMPACTING ON ROAD TRAFFIC CONGESTTION ISSUE IN HO CHI MINH CITY Truong Quang Dung* *PhD. in economics, Ho
IJESRT INTERNATIONAL JOURNAL OF ENGINEERING SCIENCES & RESEARCH TECHNOLOGY RESEARCH ON FACTORS IMPACTING ON ROAD TRAFFIC CONGESTTION ISSUE IN HO CHI MINH CITY Truong Quang Dung* *PhD. in economics, Ho
VENICE LOCAL COASTAL PROGRAM UPDATE: COASTAL HAZARDS WELCOME
 VENICE LOCAL COASTAL PROGRAM UPDATE: COASTAL HAZARDS WELCOME 1 Introducing the Team Hosted by the Department of City Planning and grant funded in part by the California Coastal Commission 2 Workshop Purpose
Hydrodynamic and hydrological modelling to support the operation and design of sea ports
 Hydrodynamic and hydrological modelling to support the operation and design of sea ports Data needs and examples Martijn de Jong (port/nautical requirements, waves, currents) Sofia Caires (mean and extreme
Breakwaters and closure dams CT 5308 Exercise 2011: Pointe Noire, Congo
 Breakwaters and closure dams CT 5308 Exercise 2011: Pointe Noire, Congo The town of Pointe Noire is the main port city in the Republic of the Congo and sits on the south-western African coast some 150
Adaptation of Transport Networks to Climate Change Alexandroupolis, Greece June Capt L.B Barbeau Port Master Mauritius Ports Authority
 Adaptation of Transport Networks to Climate Change Alexandroupolis, Greece 25-26 June 2012 Capt L.B Barbeau Port Master Mauritius Ports Authority Sensitivity of Port Louis Harbour 1. Strategically located
Assessment of flooding on low-elevation reef-lined coasts
 Assessment of flooding on low-elevation reef-lined coasts Ap van Dongeren, Deltares, Delft, The Netherlands With Curt Storlazzi, USGS, Santa Cruz, USA Impact on coral reef-lined islands and coasts Coral
City of Del Mar Local Coastal Plan (LCP) Amendment for Sea Level Rise and Coastal Flooding
 Amendment for Sea Level Rise and Coastal Flooding") City of Del Mar Local Coastal Plan (LCP) Amendment for Sea Level Rise and Coastal Flooding 6/22/17 Presentation to Sea Level Rise Stakeholder- Technical Advisory Committee (STAC) Nick Garrity, P.E. Lindsey
City of Del Mar Local Coastal Plan (LCP) Amendment for Sea Level Rise and Coastal Flooding 6/22/17 Presentation to Sea Level Rise Stakeholder- Technical Advisory Committee (STAC) Nick Garrity, P.E. Lindsey
TILAPIA 2015 KUALA LUMPUR VIETNAM TILAPIA 2015 : ACCELERATING START
 TILAPIA 2015 KUALA LUMPUR VIETNAM TILAPIA 2015 : ACCELERATING START Dr. Nguyen Huu Dzung Vice President Vietnam Association of Seafood Exporters and Producers (VASEP) Kuala Lumpur April 2-4, 2015 Vietnam
Available online at ScienceDirect. Procedia Engineering 116 (2015 )
") Available online at www.sciencedirect.com ScienceDirect Procedia Engineering 116 (2015 ) 320 325 8th International Conference on Asian and Pacific Coasts (APAC 2015) Department of Ocean Engineering, IIT
Available online at www.sciencedirect.com ScienceDirect Procedia Engineering 116 (2015 ) 320 325 8th International Conference on Asian and Pacific Coasts (APAC 2015) Department of Ocean Engineering, IIT
WAVE COMPUTATIONS AT REGIONAL SCALE AND LOCAL AREA OF GOCONG USING TELEMAC MODEL SUITE
 WAVE COMPUTATIOS AT REGIOAL SCALE AD LOCAL AREA OF GOCOG USIG TELEMAC MODEL SUITE TABLE OF COTETS 1. 2. 3. 4. 4.1. 4.2. ITRODUCTIO... 3 OBJECTIVES... 3 METHODOLOGY... 4 MODEL SETUP, DATA USED, CALIBRATIO
AIS data analysis for vessel behavior during strong currents and during encounters in the Botlek area in the Port of Rotterdam
 International Workshop on Next Generation Nautical Traffic Models 2013, Delft, The Netherlands AIS data analysis for vessel behavior during strong currents and during encounters in the Botlek area in the
LOCALLY CONCENTRATED SEVERE BEACH EROSION ON SEISHO COAST CAUSED BY TYPHOON T0709
 F-4 Fourth International Conference on Scour and Erosion 2008 LOCALLY CONCENTRATED SEVERE BEACH EROSION ON SEISHO COAST CAUSED BY TYPHOON T0709 Yoshimitsu TAJIMA 1 and Shinji SATO 2 1 Member of JSCE, Associate
(Refer Slide Time: 0:25)
") Port and Harbour Structures Prof. R. Sundaravadivelu Department of Ocean Engineering Indian Institute of Technology Madras Module 01 Lecture 04 Ships and Size of Ships So in this class we will continue
Port and Harbour Structures Prof. R. Sundaravadivelu Department of Ocean Engineering Indian Institute of Technology Madras Module 01 Lecture 04 Ships and Size of Ships So in this class we will continue
Influence of oceanographic processes on coastal erosion, morphology and inundation
 FACULTY OF ENGINEERING, COMPUTING AND MATHEMATICS Influence of oceanographic processes on coastal erosion, morphology and inundation Charitha Pattiaratchi School of Civil, Environmental and Mining Engineering
The development of the historical harbour of Paphos, Cyprus H.J. van Wijhe*, M. Meletiou^ Division, P.O. Box 152, 8300 AD Emmeloord, The Netherlands
 The development of the historical harbour of Paphos, Cyprus H.J. van Wijhe*, M. Meletiou^ Division, P.O. Box 152, 8300 AD Emmeloord, The Netherlands Abstract The harbour of Paphos originates from ancient
WIND SPEED LENGTH OF TIME WIND BLOWS (Duration) DISTANCE OVER WHICH IT BLOWS (Fetch)
 DISTANCE OVER WHICH IT BLOWS (Fetch)") WAVES Up and down movement of ocean surface Transportation of energy across the water over vast distances If not stopped by anything, waves can travel entire oceans Size and speed depend upon: WIND SPEED
WAVES Up and down movement of ocean surface Transportation of energy across the water over vast distances If not stopped by anything, waves can travel entire oceans Size and speed depend upon: WIND SPEED
MODELING OF CLIMATE CHANGE IMPACTS ON COASTAL STRUCTURES - CONTRIBUTION TO THEIR RE-DESIGN
 Proceedings of the 14 th International Conference on Environmental Science and Technology Rhodes, Greece, 3-5 September 2015 MODELING OF CLIMATE CHANGE IMPACTS ON COASTAL STRUCTURES - CONTRIBUTION TO THEIR
2. Water levels and wave conditions. 2.1 Introduction
 18 2. Water levels and wave conditions 2.1 Introduction This Overtopping Manual has a focus on the aspects of wave run-up and wave overtopping only. It is not a design manual, giving the whole design process
The Movement of Ocean Water. Currents
 The Movement of Ocean Water Currents Ocean Current movement of ocean water that follows a regular pattern influenced by: weather Earth s rotation position of continents Surface current horizontal movement
Telephone: +84 (0) , Fax. +84 (0)
 , Fax. +84 (0)") Analysis of Children Road Traffic Accidents and Proposed Measures for Children Safety Improvement in Ho Chi Minh City Paper Identification Number: AYRF2017-004 Anh Tuan VU 1, Dinh Vinh Man NGUYEN 2 1 Vietnamese-German
Analysis of Children Road Traffic Accidents and Proposed Measures for Children Safety Improvement in Ho Chi Minh City Paper Identification Number: AYRF2017-004 Anh Tuan VU 1, Dinh Vinh Man NGUYEN 2 1 Vietnamese-German
Sea Level Rise in South Florida: Causes, Consequences and Opportunities
 Sea Level Rise in South Florida: Causes, Consequences and Opportunities Dr. Todd A. Crowl Director, Institute of Water & the Environment Director, Southeast Environmental Research Center Co-Founder, Sea
Port of Zeebrugge: Upgrading the Brittannia Dock
 ABSTRACT Port of Zeebrugge: Upgrading the Brittannia Dock by L. Missinne 1 and L. Van Damme 2 The Flemish authority started with the upgrading of the Brittannia Dock in the port of Zeebrugge. The Brittannia
APPENDIX C. Fluvial and Tidal Hydraulics Report
 APPENDIX C Fluvial and Tidal Hydraulics Report BUENA VISTA LAGOON ENHANCEMENT PROJECT FLUVIAL AND TIDAL HYDRAULICS ANALYSES Prepared for: SANDAG 401 B Street, Suite 800 San Diego, California 92101 Contact:
THE WAVE CLIMATE IN THE BELGIAN COASTAL ZONE
 THE WAVE CLIMATE IN THE BELGIAN COASTAL ZONE Toon Verwaest, Flanders Hydraulics Research, toon.verwaest@mow.vlaanderen.be Sarah Doorme, IMDC, sarah.doorme@imdc.be Kristof Verelst, Flanders Hydraulics Research,
Fishing Activities of Trawlers and Gillnets in Kien Giang Province, Vietnam
 International Journal of Scientific and Research Publications, Volume 8, Issue 12, December 2018 452 Fishing Activities of Trawlers and Gillnets in Kien Giang Province, Vietnam Nguyen Thanh Long 1, Mai
Beach Profiles: Monitoring Sea Level Rise. Student Activity Sheet. Name Date Class
 Beach Profiles: Monitoring Sea Level Rise Student Activity Sheet Name Date Class A shoreline is the area where the water and land meet. This is where we find beach: areas where sediments (sand or other
CHAPTER 8 ASSESSMENT OF COASTAL VULNERABILITY INDEX
 124 CHAPTER 8 ASSESSMENT OF COASTAL VULNERABILITY INDEX 8.1 INTRODUCTION In order to assess the vulnerability of the shoreline considered under this study against the changing environmental conditions,
Sea-level rise: How are we tracking in Wellington region & how will it effect coastal flooding? Dr Rob Bell NIWA, Hamilton
 Sea-level rise: How are we tracking in Wellington region & how will it effect coastal flooding? Dr Rob Bell NIWA, Hamilton Coastal adaptation in NZ: Starting-block issues with sea-level rise Tell us what
consulting engineers and scientists
 consulting engineers and scientists Coastal Processes Presented by: January 9, 2015 Varoujan Hagopian, P.E. F.ASCE Senior Consultant, Waterfront Engineer Living Shoreline Workshop Lets Remember Why We
The Challenge of Wave Scouring Design for the Confederation Bridge
 13: Coastal and Ocean Engineering ENGI.8751 Undergraduate Student Forum Faculty of Engineering and Applied Science, Memorial University, St. John s, NL, Canada MARCH 2013 Paper Code. (13 - walsh) The Challenge
Gradebook Report. Student Assignment Progress Report. Course Name. Student NameLast NameFirst Name
 Student Assignment Progress Report Gradebook Report Course Name Student NameLast NameFirst NameEmail Days Number of Total Number of Cumulative Score/ Inactive Assignments Number of Assignments Percentage
Drought Situations and Management Policy in Vietnam
 Regional Workshop for Asia-Pacific Capacity Development to Support National Drought Management Policy Drought Situations and Management Policy in Vietnam Nguyen Van Tinh, Dang Thanh Mai Hanoi, May 2014
Underwater noise generated by merchants ships in coastal waters of the Gulf of Gdansk
 Underwater noise generated by merchants ships in coastal waters of the Gulf of Gdansk Karol LISTEWNIK 1 1 Polish Naval Academy, Poland ABSTRACT Currently, there has been a growing interest in monitoring
EXISTING AND PLANNED STRATEGIES AND ACTIONS CONNECTED WITH COASTAL PROTECTION IN ASPECT OF PREDICTED SEA LEVEL RISE
 EXISTING AND PLANNED STRATEGIES AND ACTIONS CONNECTED WITH COASTAL PROTECTION IN ASPECT OF PREDICTED SEA LEVEL RISE Andrzej Cieślak Long term coastal protection strategy In 2000 a new 1 Polish long term
INTRODUCTION TO COASTAL ENGINEERING
 The University of the West Indies Organization of American States PROFESSIONAL DEVELOPMENT PROGRAMME: COASTAL INFRASTRUCTURE DESIGN, CONSTRUCTION AND MAINTENANCE A COURSE IN COASTAL DEFENSE SYSTEMS I CHAPTER
Probabilistic Design Tools for Vertical Breakwaters
 Probabilistic Design Tools for Vertical Breakwaters HOCINE OUMERACI, ANDREAS KORTENHAUS Technical University of Braunschweig, Leichtweifi-Institut fur Wasserbau, Braunschweig, Germany WILLIAM ALLSOP HR
CMS Modeling of the North Coast of Puerto Rico
 CMS Modeling of the North Coast of Puerto Rico PRESENTED BY: Dr. Kelly Rankin Legault, Ph.D., P.E. 1 Dr. Alfredo Torruella, Ph.D. 2 1 USACE Jacksonville District 2 University of Puerto Rico October 2016
Redondo Beach Boat Launch Ramp Facility
 Redondo Beach Boat Launch Ramp Facility Feasibility Report for the California Department of Boating and Waterways 2015 Grant Cycle For the City of Redondo Beach Submitted by March 13, 2014 Table of Contents
Shorelines Earth - Chapter 20 Stan Hatfield Southwestern Illinois College
 Shorelines Earth - Chapter 20 Stan Hatfield Southwestern Illinois College The Shoreline A Dynamic Interface The shoreline is a dynamic interface (common boundary) among air, land, and the ocean. The shoreline
MONITORING SEDIMENT TRANSPORT PROCESSES AT MANAVGAT RIVER MOUTH, ANTALYA TURKEY
 COPEDEC VI, 2003 in Colombo, Sri Lanka MONITORING SEDIMENT TRANSPORT PROCESSES AT MANAVGAT RIVER MOUTH, ANTALYA TURKEY Isikhan GULER 1, Aysen ERGIN 2, Ahmet Cevdet YALCINER 3 ABSTRACT Manavgat River, where
HURRICANE SANDY LIMITED REEVALUATION REPORT UNION BEACH, NEW JERSEY DRAFT ENGINEERING APPENDIX SUB APPENDIX D SBEACH MODELING
 HURRICANE SANDY LIMITED REEVALUATION REPORT UNION BEACH, NEW JERSEY DRAFT ENGINEERING APPENDIX SUB APPENDIX D SBEACH MODELING Rev. 18 Feb 2015 1 SBEACH Modeling 1.0 Introduction Following the methodology
APPENDIX G WEATHER DATA SELECTED EXTRACTS FROM ENVIRONMENTAL DATA FOR BCFS VESSEL REPLACEMENT PROGRAM DRAFT REPORT
 APPENDIX G WEATHER DATA SELECTED EXTRACTS FROM ENVIRONMENTAL DATA FOR BCFS VESSEL REPLACEMENT PROGRAM DRAFT REPORT Prepared for: B.C. Ferries Services Inc. Prepared by: George Roddan, P.Eng. Roddan Engineering
SACO RIVER AND CAMP ELLIS BEACH SACO, MAINE SECTION 111 SHORE DAMAGE MITIGATION PROJECT APPENDIX F ECONOMIC ASSESSMENT
 SACO RIVER AND CAMP ELLIS BEACH SACO, MAINE SECTION 111 SHORE DAMAGE MITIGATION PROJECT APPENDIX F ECONOMIC ASSESSMENT Department of the Army New England District, Corps of Engineers 696 Virginia Road
Update: UNSW s Research Program for Extreme Waves on Fringing Reefs. Matt Blacka,Kristen Splinter, Ron Cox
 Update: UNSW s Research Program for Extreme Waves on Fringing Reefs Matt Blacka,Kristen Splinter, Ron Cox Overview Research Area 1: Extreme wave and water level processes for fringing reef coastlines Research
OECS Regional Engineering Workshop September 29 October 3, 2014
 B E A C H E S. M A R I N A S. D E S I G N. C O N S T R U C T I O N. OECS Regional Engineering Workshop September 29 October 3, 2014 Coastal Erosion and Sea Defense: Introduction to Coastal/Marine Structures
International Journal Of Scientific & Engineering Research, Volume 7, Issue 7, July-2016 ISSN
 ISSN 9-5518 1598 THE TIDAL OSCILLATIONS UNDER THE SEA LEVELRISE EFFECTS IN CENTRAL VIETNAM Nguyen Quoc Trinh 1*, Nguyen Minh Huan, Pham Van Tien 3, Nguyen Quang Vinh 4 1 National Centre for Hydro-Meteorological
WAVE LOAD ACTING ON HORIZONTAL PLATE DUE TO BORE
 Proceedings of the 6 th International Conference on the Application of Physical Modelling in Coastal and Port Engineering and Science (Coastlab16) Ottawa, Canada, May 10-13, 2016 Copyright : Creative Commons
BWS ONLINE FORECASTING BERTH OPERATING SAFETY. Matthew R. O Halloran, Daphne Choong
 BWS ONLINE FORECASTING BERTH OPERATING SAFETY Matthew R. O Halloran, Daphne Choong OMC International Pty Ltd, 2/2 Walmer St, Abbotsford, Vic 3067, Australia matthew@omc-international.com.au daphne@omc-international.com.au
4/20/17. #31 - Coastal Erosion. Coastal Erosion - Overview
 Writing Assignment Due Monday by 11:59 pm #31 - Coastal Erosion Beach front property! Great View! Buy now at a great price! See main class web pages for detailed instructions Essays will be submitted in
Directed Reading. Section: Ocean Currents. a(n). FACTORS THAT AFFECT SURFACE CURRENTS
. FACTORS THAT AFFECT SURFACE CURRENTS") Skills Worksheet Directed Reading Section: Ocean Currents 1. A horizontal movement of water in a well-defined pattern is called a(n). 2. What are two ways that oceanographers identify ocean currents? 3.
Skills Worksheet Directed Reading Section: Ocean Currents 1. A horizontal movement of water in a well-defined pattern is called a(n). 2. What are two ways that oceanographers identify ocean currents? 3.
3/9/2013. Build house on cliff for a view of the ocean - be one with said view Pearson Education, Inc. Shorelines: summary in haiku form
 Introduction to Environmental Geology, 5e Edward A. Keller Shorelines: summary in haiku form Chapter 11 Coastal Processes Lecture Presentation prepared by X. Mara Chen, Salisbury University Build house
WAVE OVERTOPPING SIMULATOR TESTS IN VIET NAM
 WAVE OVERTOPPING SIMULATOR TESTS IN VIET NAM Le Hai Trung 1, Jentsje van der Meer 2, Gerrit Jan Schiereck 3, Vu Minh Cat 4, Gerben van der Meer 5. Sea dikes in Viet Nam have been built up during a long
Development of TEU Type Mega Container Carrier
 Development of 8 700 TEU Type Mega Container Carrier SAKAGUCHI Katsunori : P. E. Jp, Manager, Ship & Offshore Basic Design Department, IHI Marine United Inc. TOYODA Masanobu : P. E, Jp, Ship & Offshore
Baird. Innovation, Excellence & Service Oceans, Lakes & Rivers
 Profile Capabilities Innovation, Excellence & Service Oceans, Lakes & Rivers Baird provides professional engineering and technical services related to the design of coastal structures and facilities that
SUSTAINABLE DEVELOPMENT: CIVIL ENGINEERING AND THE BUILT ENVIRONMENT. INTERNATIONAL CONFERENCE Malta 5 th May 2011
 SUSTAINABLE DEVELOPMENT: CIVIL ENGINEERING AND THE BUILT ENVIRONMENT Malta 5 th May 2011 Wave Forces: Tsunami And Sea Wind Driven in the Mediterranean: Malta s Scenario Tsunami wave hitting sea wall in
Project Incorporation of Sea Level Rise City of Newport Beach Approach for Balboa Islands, City of Newport Beach, California
 Project Incorporation of Sea Level Rise City of Newport Beach Approach for Balboa Islands, City of Newport Beach, California Ying Poon, Everest International Consultants, Inc. CMANC Annual Winter Meeting
Corporate. Report COUNCIL DATE: June 26, 2006 NO: C012 COUNCIL-IN-COMMITTEE. TO: Mayor & Council DATE: June 22, 2006
 Corporate NO: C012 Report COUNCIL DATE: June 26, 2006 COUNCIL-IN-COMMITTEE TO: Mayor & Council DATE: June 22, 2006 FROM: General Manager, Engineering FILE: 0410-20(MoT/Gate) SUBJECT: Surrey Response on
REPORT. Pangasius Sustainability Roundtable Discussion
 REPORT Pangasius Sustainability Roundtable Discussion Organized by the Sustainable Fisheries Partnership in Collaboration with the College of Aquaculture and Fisheries Can Tho University Can Tho City,
Mouth of the Columbia River Jetties Three-Phase Construction Plan
 Mouth of the Columbia River Jetties Three-Phase Construction Plan Project Overview October 9, 2012 US Army Corps of Engineers MCR Jetties Major Rehabilitation Sand Island pile dikes 1930-1935 Columbia
Chapter 12: Coasts (after a brief review of Tides)
") Chapter 12: Coasts (after a brief review of Tides) 1 Questions from previous classes: What happens when a wave meets a current? wave = people walking current = bus If wave goes with the current, the wave
Chapter 12: Coasts (after a brief review of Tides) 1 Questions from previous classes: What happens when a wave meets a current? wave = people walking current = bus If wave goes with the current, the wave
Taranaki Tsunami Inundation Analysis. Prepared for Taranaki Civil Defence Emergency Management Group. Final Version
 Taranaki Tsunami Inundation Analysis Prepared for Taranaki Civil Defence Emergency Management Group Final Version June 2012 AM 12/07 HBRC Plan Number 4362 Asset Management Group Technical Report Prepared
MIKE Release General product news for Marine software products, tools & features. Nov 2018
 MIKE Release 2019 General product news for Marine software products, tools & features Nov 2018 DHI 2012 MIKE 3 Wave FM New advanced phase-resolving 3D wave modelling product A MIKE 3 FM Wave model - why?
Abstract. 1 Introduction
 Risk assessment study of the mutual interactive influence of working procedures on terminals handling dangerous goods in port of Koper (Slovenia) L. Battelino Water Management Institute, Maritime Engineering
County of Santa Barbara Permit Option Analysis Goleta Beach JULY 13, 2017
 County of Santa Barbara Permit Option Analysis Goleta Beach JULY 13, 2017 Introduction 2 Goleta Beach Park welcomes 1.5 million visitors annually Amenities include: Picnic Areas and Group Areas w/bbqs
Wave Setup at River and Inlet Entrances Due to an Extreme Event
 Proceedings of International Conference on Violent Flows (VF-2007) Organized by RIAM, Kyushu University, Fukuoka, Japan Wave Setup at River and Inlet Entrances Due to an Extreme Event Xuan Tinh Nguyen
Chapter 10 Lecture Outline. The Restless Oceans
 Chapter 10 Lecture Outline The Restless Oceans Focus Question 10.1 How does the Coriolis effect influence ocean currents? The Ocean s Surface Circulation Ocean currents Masses of water that flow from one
TABLE OF CONTENTS CHAPTER TITLE PAGE LIST OF TABLES LIST OF FIGURES LIST OF ABBREVIATIONS LIST OF SYMBOLS LIST OF APPENDICES
 vii TABLE OF CONTENTS CHAPTER TITLE PAGE AUTHOR S DECLARATION DEDICATION ACKNOWLEDGEMENTS ABSTRACT ABSTRAK TABLE OF CONTENTS LIST OF TABLES LIST OF FIGURES LIST OF ABBREVIATIONS LIST OF SYMBOLS LIST OF
Request Number IR1-12: Flow Passage. Information Request
 Request Number IR1-12: Flow Passage Information Request Provide additional information about the 100 metre flow passage channel scenario between the Westshore Terminals and the proposed Project terminal
SURGE SUPPRESSION ACHIEVED BY DIFFERENT COASTAL SPINE (IKE DIKE) ALIGNMENTS. Bruce A. Ebersole, Thomas W. Richardson and Robert W.
 ALIGNMENTS. Bruce A. Ebersole, Thomas W. Richardson and Robert W.") SURGE SUPPRESSION ACHIEVED BY DIFFERENT COASTAL SPINE (IKE DIKE) ALIGNMENTS Abstract Bruce A. Ebersole, Thomas W. Richardson and Robert W. Whalin, Jackson State University, Jackson, Mississippi The primary
SURGE SUPPRESSION ACHIEVED BY DIFFERENT COASTAL SPINE (IKE DIKE) ALIGNMENTS Abstract Bruce A. Ebersole, Thomas W. Richardson and Robert W. Whalin, Jackson State University, Jackson, Mississippi The primary
The Islands. Barbados. A prefeasibility study. R. Drieman M. Hinborch M. Monden E.A.J. Vendrik
 The Islands Barbados A prefeasibility study R. Drieman M. Hinborch M. Monden E.A.J. Vendrik General notice to the reader: In the academic programme for Hydraulic Engineering we have in the 4th year (i.e.
MT - GEOGRAPHY - (73) - SEMI PRELIM - II : PAPER - 6
 - SEMI PRELIM - II : PAPER - 6") 208 00 MT MT - GEOGRAPHY - (7) - SEMI PRELIM - II : PAPER - 6 Time : 2 Hours (Model Answer Paper) Max. Marks : 0 A.. Fill in the blank choosing the correct alternative : (a) The Barren Island is the only
208 00 MT MT - GEOGRAPHY - (7) - SEMI PRELIM - II : PAPER - 6 Time : 2 Hours (Model Answer Paper) Max. Marks : 0 A.. Fill in the blank choosing the correct alternative : (a) The Barren Island is the only
CHAPTER 134 INTRODUCTION
 CHAPTER 134 NEW JETTIES FOR TUNG-KANG FISHING HARBOR, TAIWAN Chi-Fu Su Manager Engineering Department Taiwan Fisheries Consultants, Inc. Taipei, Taiwan INTRODUCTION Tung-Kang Fishing Harbor, which is about