Transportation Plan for the SACOG Region Including the counties of Sacramento, Yolo, Yuba, Sutter, El Dorado and Placer
|
|
|
- Cori Charles
- 5 years ago
- Views:
Transcription
1 SACOG Metropolitan Transportation Plan for the SACOG Region Including the counties of Sacramento, Yolo, Yuba, Sutter, El Dorado and Placer Adopted March 16, 2006 Sacramento Area Council of Governments 1415 L Street Suite 300 Sacramento, CA tel: fax:
2 CONTENTS 1. A Long-Range Transportation Plan for the Region Development of Metropolitan Transportation Plans Growth and Change Meeting the Plan s Goals Comparing Alternative Transportation Futures The Contents of the 2006 MTP Paying for the 2006 MTP Implementing the 2006 MTP...51 APPENDICES A. Public Outreach...57 B. The Community Design Funding Program...59 C. Intelligent Transportation System Strategies...75 D. Demographic/Land Use, Modeling, and Financial Assumptions...77 E. Listing of Projects and Programs...83 F. Inter-Regional Passenger Transportation G. Freight Transportation H. SACOG Regional Aviation System Plan I. SACOG Congestion Management System J. Transportation Models and Technical Analysis K. References L. IRR TIP Project M. SACOG Board of Directors Resolution of Support N. Key Excerpts from the 2006 MTP Air Quality Conformity Determination O. Environmental Justice Analysis from the MTP TABLES 1. Regional Growth Fastest-Growing Communities Comparative Growth, Metropolitan Transportation Plan Goals Key Performance Indicators for the 2006 MTP Plan Summary Connector Projects Revenue Estimates Summary by Year, Summary of Funding & Expenditures, MAPS (at end of document) 1. Sacramento Area 2. Federal Air Quality Planning Boundaries 3. Traffic Congestion in Traffic Congestion in 2025 with 2006 MTP Projects 5. Major Projects, 2006 MTP
3 1. A LONG-RANGE TRANSPORTATION PLAN FOR THE REGION This plan is called the 2006 Metropolitan Transportation Plan for the SACOG Region Including the Counties of Sacramento, Yolo, Yuba, Sutter, El Dorado, and Placer (also referred to as the 2006 MTP) covering the federal fiscal years 2006 through Map 1 shows the extent of this region 1. The 2006 MTP restores air-quality non-exempt projects 2 to the plan that have not been possible to include since October 2004 due to SACOG s inability to make air-quality conformity findings. In 2002, SACOG adopted the Metropolitan Transportation Plan for 2025 (MTP 2025), an MTP update that involved three years of public involvement, a new set of goals and guiding principles, and major initiatives including new regional funding programs, connector projects, and expansion of public transit. The MTP 2025 was to be updated three years later in July 2005, according to federal law. However, in October 2004 SACOG lost its ability to demonstrate conformity to the 1994 State Implementation Plan (SIP) for the Sacramento Air Basin, causing an air quality conformity lapse to occur for that part of the region. The lapse was caused because the 1994 State Implementation Plan (SIP) a plan based on older modeling and planning assumptions did not use the latest planning assumptions and the latest emissions model, as required by federal transportation conformity regulations. As a result, no new air quality conformity determinations could be made until a new SIP, including a new motor vehicle emissions budget, was approved by the Environmental Protection Agency. For the Yuba-Sutter Air Basin, there was no air-quality conformity lapse and the MTP 2025 remained in effect until July In October 2004, SACOG approved the Interim Metropolitan Transportation Plan 2004/05 (Interim MTP) that covered only the Sacramento Air Basin. This plan contained only air-quality exempt projects, such as bicycle and pedestrian projects. The Interim MTP was intended to be a plan with a short life, effective only until a new Rate-of-Progress SIP (ROP SIP) and a new MTP that restored the air-quality non-exempt projects originally shown in the MTP 2025 could be developed. As a consequence, the Interim MTP contained only 3 years of projects, reserving the balance of funding through 2027 as uncommitted funds. 1 This plan incorporates the regional transportation plans developed by the Placer County Transportation Planning Agency and the El Dorado County Transportation Commission. SACOG holds Memoranda of Understanding with these Regional Transportation Planning Agencies that meets federal requirements for coordination of transportation planning and funding. 2 Air-quality non-exempt is a term used in federal law meaning transportation projects that normally result in additional emissions that are subject to federal rules. 3 The Sacramento air basin is technically referred to as the Federal Sacramento Ozone Nonattainment Area, and includes Sacramento County, the southern third of Sutter County, Yolo County, El Dorado County, and Placer County, but excludes the Tahoe Basin. A piece of Solano County is also included in this air basin, but SACOG holds and agreement with the Metropolitan Transportation Commission giving transportation planning responsibilities to that agency. The Yuba/Sutter air basin was formerly referred to as the Federal Yuba/Sutter Ozone Nonattainment Area and includes Yuba County and the northern two-thirds of Sutter County. Under the new 8-hour standard, the Yuba/Sutter area is now in attainment and excludes the Sutter Buttes. See Map 2 for the boundaries of these federal air quality nonattainment areas. 1
4 In July 2005, SACOG approved another interim plan, called the Metropolitan Transportation Plan 2027 (MTP 2027) that unified all six counties in one plan. For the Sacramento Air Basin, the MTP 2027 simply incorporated the Interim MTP. Because the Yuba-Sutter Air Basin area had been covered by the MTP 2025, which was expiring in July 2005, the MTP 2027 update was needed so that projects could continue to be implemented. Again, this plan was developed to enable the region to continue to build and operate projects in the period during which a new ROP SIP was being developed, as well as an MTP usable as a base from which to restore the original vision of the MTP This 2006 MTP, which restores the MTP 2025 while extending the horizon year to 2027 and adding a few projects, has been developed by SACOG concurrently with the ROP SIP for the Sacramento Air Basin that has been developed by the local air districts. This SIP is expected to be approved by the U.S. Environmental Protection Agency by April 2006, as is the 2006 MTP that relies upon it for air quality conformity determinations. Two excerpts from related documents have been appended to this MTP for informational purposes. First, Appendix N includes excerpts from the Air Quality Conformity Determination on the 2006 MTP and the 2006/08 Metropolitan Transportation Improvement Program (MTIP) for the Sacramento Ozone (ROG and NOx) Nonattainment Area, Carbon Monoxide (CO) Maintenance Area, and Particulate Matter (PM-10) Moderate Nonattainment Area. Second, because this plan restores the MTP 2025, Appendix O includes the analysis of environmental justice issues from the Environmental Impact Report for the MTP WHAT ABOUT FUTURE MTPs? Looking forward to 2007, SACOG will be using the SACOG Board-adopted 2050 Blueprint Preferred Land-Use Alternative to develop a 2030 land use base for a next-generation MTP. The Blueprint project, which has been a major initiative at SACOG over the past several years, has educated the public and encouraged local jurisdictions commitment to the use of smart growth principles in their General Plans. This MTP will also incorporate a new 8-hour SIP for the Sacramento air basin and a new integrated transportation-land use travel demand model. WHAT WILL THE FUTURE BRING TO THE SACRAMENTO REGION? The six-county Sacramento region has changed dramatically in many ways since 1975, and can expect equally dramatic changes looking forward to Back in the mid-1970s, the region's population had reached about 1.1 million. The only major job center was found in downtown Sacramento. The regional transportation system, focused on radial access between suburbs and downtown Sacramento, consisted of freeways designed in the 1960s with twenty years of spare capacity. By the mid-1970s, the region s decision-makers had decided not to expand the freeway system further, and instead built two new radial light rail lines, completed by the mid- 1980s. Surrounding communities of that time -- Elk Grove, Davis, Woodland, Yuba City, Marysville, Roseville, and Folsom -- enjoyed easy access to and from Sacramento, even on twolane roads. Daily traffic congestion was essentially non-existent. 2
5 Today, the region has evolved in ways unforeseen even ten years ago. The population, 2.1 million in 2005, has spread out to bring Elk Grove, Roseville, Rocklin, and Folsom into the urban area. Rancho Cordova has emerged as a second major job center rivaling downtown Sacramento, and Roseville is not far behind. Two-worker households have become the norm, with extensive commuting from one community to another. Low-density suburban patterns mean people travel overwhelmingly by automobile: 47 percent of trips drive alone, 46 percent of trips go by auto with two or more occupants, 6 percent are bicycle or walk trips, and 1 percent of trips are by transit (with transit use reaching 3 percent into downtown Sacramento during commute hours). The radial transportation system no longer serves the region's needs well. The U.S. 50 freeway serves as the region's core corridor, carrying a full load of traffic in both directions both morning and afternoon, and increasingly at midday as well. Intermittent congestion is now widespread, since the spare capacity once built into the system has been consumed by growth, with little new capacity added since Looking forward to 2027, the State forecasts the region's population to reach 2.9 million, a 37 percent increase. With that comes a 53 percent increase in travel -- unless land development proceeds differently than it has in the past. The region by 2027 will have three major job centers: downtown Sacramento/West Sacramento, Rancho Cordova/Folsom, and Roseville/Rocklin. The urban edge will expand to encompass El Dorado Hills and Lincoln, as well as areas east and west of Elk Grove, south of Rancho Cordova, west of Roseville, Southport in West Sacramento, North Natomas, and perhaps South Sutter County. Present trends and zoning indicate that residential areas and office/industrial areas will continue to develop separately. More than a million people will live on each side of the American River. Looking to this future, the region needs a new transportation vision and plan. Many expectations during the past 25 years have not worked out. Sprawl around the edges continues to out-pace infill into existing communities, and businesses increasingly prefer suburban locations. Even though gasoline prices are at an all-time high, the total amount of driving has more than doubled since Even so, total smog emissions from motor vehicles are now half what they were in 1980, because technology has reduced auto emissions by 98 percent from 1980 models. Lack of road building and the resulting congestion have not encouraged many people to take transit instead of driving, even at the extreme congestion levels seen in big cities like Los Angeles. Instead, drivers move onto neighborhood streets, seeking to avoid heavy traffic. A 1999 Sacramento Regional Transit survey showed that half of those who commute on transit, and threequarters of those who ride transit for other reasons, do not have access to an auto. Furthermore, those percentages rose through the 1990s, so transit increasingly serves those who cannot otherwise choose to drive, despite a focus on luring drivers out of their autos. Shipping of goods by truck has ballooned, instead of shifting to railroads, with trucks serving as rolling warehouses feeding just-intime manufacturing, and stores with computerized inventories. Sacramento needs a realistic and creative new plan to manage recent trends heading into the future. The region does not want continuing suburban sprawl for a million new residents. Greater congestion, more compact development, an aging population, clean air goals, and energy conservation all point to a need to improve and expand transit service. The Sacramento region, with ideal climate and terrain, could see more travel by bicycling and walking, now discouraged in some 3
6 communities by heavy local auto traffic. With more than a million empty seats in autos, but fewer than 10,000 empty seats in buses every morning and afternoon, carpools clearly have a place in the picture. Regardless, a 53 percent increase in travel by 2027 means that, even if transit use could be increased tenfold and bicycle/walk trips tripled, the region still would face a 40 percent increase in travel by auto. At least in some places the road system must be expanded too. WHAT WAS NEW ABOUT THE MTP 2025? The 2006 MTP continues the direction of the MTP 2025, pursuing ten broad goals, only three of which deal directly with transportation, with the primary goal being to improve quality of life. Chapter Four discusses these ten goals in more detail. "Quality of life" may mean somewhat different things to different people, but it generally encompasses quiet and safe neighborhoods, affordable housing, job opportunities, good schools, limited environmental pollution, opportunities for recreational and activities, and adequate transportation to allow access to places where these activities occur. The 2006 MTP will use transportation funds for community design, to encourage people to walk, bicycle, or ride transit for local travel. Steps to reduce auto travel, by changing the way people travel or the places to which they go, will become imperative during the few decades. The predominance of low-density suburban development with jobs and shopping separated from residential areas cannot continue indefinitely. However, the existing suburban communities of today won't look much different by 2027, because around two-thirds of the region's housing in 2027 is already in place, and those houses can be expected to last 50 years or longer. The 2006 MTP supports changes in development patterns, through the on-going community design incentive program, both for new communities and redevelopment of older ones. At best the results can be expected to evolve slowly over time. The 2006 MTP gives first priority to expanding the transit system, more than doubling light rail mileage and the bus fleet, primarily in the Sacramento area. This plan supports current transportation operations but does not allow for any major expansion of the system. Money to pay for operations (drivers, mechanics, parts, fuel), however, limits the amount of transit service the region can offer. Fares pay only 30 percent of operating costs, with the other 70 percent coming from taxpayers. For the middle-class household, the 15 percent of income consumed for transportation typically reflects a personal choice for automobile travel, often including two or more vehicles. For those who are less affluent, the cost for auto transportation rises to percent of income, imposing a hardship for which a good transit choice would often be a relief. In addition, those who cannot drive or need another travel choice present different challenges for the transportation system and for transit service. The State forecasts the share of the population older than 75 years of age, with a lower propensity to drive, to increase by 30 percent. The 2006 MTP will allow little progress in expanding the transit system for these upcoming demands. The 2006 MTP also commits regional funds to bicycle and pedestrian projects. Except for recreational walking, circulation in downtown areas, and neighborhood social visiting, walking currently plays a limited role in the transportation system. Only about 3 percent of commute trips 4
7 are made by bicycle, but 15 percent of commuters travel no further than three miles to work. Few suburban children bicycle or walk today; instead, their parents drive them around by auto. Unless community design changes take hold, the share of trips made by bicycling and walking is not predicted to change significantly. Beyond transit, walking, and bicycling, the region faces a 40 to 50 percent increase in auto travel. Obviously it makes a difference whether those people will drive alone or ride in carpools, and where on the system they travel. The 2006 MTP includes funding for transportation demand management (TDM), including a rideshare program. The regional rideshare program is included in the current SIP as a Transportation Control Measure (TCM), and will remain a TCM in perpetuity as a SIP requirement. Like nearly all urban areas around the country, Sacramento is seeing a gradual shift from commuting by carpool and transit to driving alone. This trend reflects the separation of housing from jobs, the huge increase in two-worker households, and the predominantly suburban lifestyle with lots of widely separated activities and an increasing need for one or more errand stops on the way to or from work. TDM programs offer people information and incentives for alternatives to driving whenever this is feasible. Congestion generally will continue to worsen inside the urban area, because the system has little remaining spare road capacity and the region foresees neither the funding nor the community desire to increase road capacity by 40 percent or more. The 2006 MTP proposes some road improvements, to hold off some of the increase in congestion. While the region cannot reasonably be expected to build its way out of congestion, the investments listed in the 2006 MTP will make a difference, lessening congestion in some corridors, depending on where the region invests in more transit and road capacity or land use changes. The 2006 MTP foresees $27.5 billion to work with, on average almost $1.2 billion per year for 22 years, with $4.9 billion of that as federal funds coming to the region for regional-scale improvements. The federal funds have come to the region in past years, but the region before 2002 passed them to counties and cities for local projects. Of the $27.5 billion, the 2006 MTP shows that about a quarter goes to operate transit services - not enough to provide the level of transit service needed in a region of 2.9 million. Another quarter goes to maintain streets, roads, and highways - again, not enough to provide adequate maintenance especially in more rural areas of the region. Essentially, the remaining half must be used for improvements: First $2.8 billion goes to transit improvements, including light rail extensions, a 150 percent increase in bus service in urban Sacramento, and increases in bus service in the other counties. Second, $3.2 billion goes to state highway improvements, mainly to complete four-lane highways to connect the northern counties with the rest of the region and add carpool lanes to urban freeways. Third, $6 billion goes to local street and road improvements, such as intersection improvements, safety projects, signal timing, widening in growth areas, and new connections for local access. 5
8 Finally, this plan proposes to use $1.7 billion for other types of improvements important to achieving regional goals: bicycle and pedestrian improvements, community design incentives, travel demand management (including the regional rideshare program), clean air, open space, and enhancement programs. Analysis shows that even with $4.9 billion of federal funding available, the region can t by itself fund all regional-scale improvements needed and envisioned in the 2006 MTP. Regional-scale improvements put off to the future in the past 20 years are coming home to roost. The 2006 MTP anticipates supplemental funding -- from federal grants for light rail extensions, and from state interregional funds for state highway improvements, particularly in the region's five smaller counties, and local funding, from Sacramento's sales tax or development fees or other local sources -- to help complete some of the state highway and arterial improvements in urban Sacramento, where total cost exceeds regional funds. Locally, counties and cities also lack enough funding for street and road improvements to deal with growing local traffic. The 2006 MTP brings forth a regional view, a different perception of the region and its role from the plans of the 90 s. This view is not wholly new: most of the ideas were envisioned in SACOG's 1989 Metro Study, but few were implemented, partly because the system functioned adequately back then, and the easy choice was to avoid controversial projects and issues. Like the Metro Study, the MTP 2025 (the basis for this 2006 MTP) looked at the transportation system from the point of view of the traveler needing to use the whole system, not just each jurisdiction managing its piece of the system. It recognized that, if the region is to provide transportation for one million more people and control urban sprawl, transportation improvements inevitably must go by someone's front door or back yard. It proposed some locally controversial projects, and opened other issues where no regional consensus is yet possible. In this way, the MTP 2025 started in new directions, and this 2006 MTP continues with that vision. The MTP 2025 also put forth the challenge of implementation, to engage local and regional debate to reach agreement on how transportation is to be fitted into communities and neighborhoods. WHAT ISSUES CAN T THIS PLAN RESOLVE? Discussion during the development of the MTP 2025 spotlighted a number of tough issues fundamental for transportation, that still remain: How does the region want to handle one million new people by 2025: with continuing development around the urban edge or with infill development in existing communities at higher than prevailing densities? Do communities want jobs/housing balance, including housing affordable to all workers, to provide a better opportunity to live, work, and travel locally other than by auto, or continued separation of residential and office/industrial development, which implies continued community-to-community travel? Should transit's primary role be to serve those who cannot drive or for whom driving is a hardship, or should it provide another choice to those for whom driving is now the 6
9 easiest and best option? How is the 70 percent share of transit's operating costs now coming from public funds to be provided? Is encouraging people to use transit or carpools instead of driving alone important enough to warrant increasing the cost of driving, via road tolls, gasoline tax surcharges, or parking fees, and using the money to increase available transit service dramatically? Should main-road capacity in major travel corridors be increased to prevent the increasingly common and much-disparaged practice of drivers cutting through neighborhood streets to avoid traffic jams? To what extent should the region try to satisfy region-wide travel demand -- by building onto the system to reduce congestion, so that the opportunity to live where you want to, work anywhere in the region, and do business region wide is preserved? How should the region balance protection of the American River Parkway as a recreational and open space asset against the growing need for greater transportation access across the river? On these issues SACOG could find no consensus. The MTP 2025 aimed to engage debate on these larger issues, and the 2006 MTP, by its nature a plan that bridges the gap until the region prepares a next generation MTP in 2007, is not able to resolve them. We expect that this MTP 2030, to be completed in 2007, will make progress in finding answers and thus become more effective in using the region s limited resources. 7
10 2. DEVELOPMENT OF METROPOLITAN TRANSPORTATION PLANS WHY DOES SACOG PREPARE A METROPOLITAN TRANSPORTATION PLAN? Under federal law, SACOG is responsible for long-range transportation planning in a sixcounty area -- Sacramento, Yolo, Yuba, Sutter, El Dorado and Placer Counties (excluding the Tahoe Basin). 4 Most of this planning area is designated a "federal non-attainment area for ozone," meaning that for the region to be eligible to receive federal transportation funds, the region's transportation system must meet particular air quality standards. Transportation systems are best planned at a regional level because people don't confine their trips to a local area. Federal law established regional agencies for the purpose of area-wide transportation planning in the 1970s, so that planning for highways, roads, and public transit would be comprehensive and cooperative between local agencies. For this region, a long-range regional transportation plan is required to cover at least a 20-year planning horizon, and it must be updated every four years. This plan covers 22 years, federal fiscal years 2006 through The MTP provides the regional vision for surface transportation, within the constraints of funding that the region can reasonably expect to receive. If a city, county, or public agency in the region wants to use of federal or state transportation funding for projects or programs, the projects must be contained in, or be consistent with, this MTP. HOW WAS THE 2006 MTP CREATED AND WHO WAS INVOLVED? In late 1999, SACOG embarked on a major effort to revisit and rethink its Metropolitan Transportation Plan, using an unprecedented amount of public outreach and a citizen advisory group called the Transportation Roundtable. The result was the MTP 2025, adopted in July This 2006 MTP restores the full vision of the MTP 2025, after a period of interim plans that were made necessary when the State Implementation Plan for Air Quality, to which MTPs must conform for air quality, became out-of-date. The list of projects in this 2006 MTP was agreed to by SACOG s agency partners who serve on the Regional Planning Partnership and by the Board of Directors when the MTP 2025 was adopted in A small number of new projects has been added to this original MTP 2025 project list. The Draft 2006 MTP was circulated for a 30-day public review according to the Community Input Plan, along with an Addendum to the Environmental Impact Report for the MTP for 2025 (see Appendix A for the Community Input Plan). The Community Input Plan includes a public hearing, website and other methods of outreach to the public and stakeholders. 4 SACOG is designated as a Metropolitan Planning Organization (or MPO) under federal law, encompassing the six counties. 8
11 The SACOG Board of Directors, in its policy role overseeing long-range transportation planning in the region, is ultimately responsible for adopting MTPs. In the development of the MTP 2025, the Board was advised on the goals (shown in Table 4) and policies of the plan by the Transportation Roundtable, a group composed of 55 stakeholders from around the region. The Roundtable s key recommendation was to use as much as one-third of regional transportation funds to pursue community and environmental objectives, including community design projects to support smart growth, clean air, bicycle/pedestrian, and demand management programs. The Roundtable also recommended giving priority to public transit and expanding light rail, seeking to improve accessibility in congested locations or corridors, aiming transit service toward commuters and low-income, elderly, young, and disabled persons, providing alternative travel choices to driving, and using new technologies. Extensive public outreach provided ideas and feedback on the MTP Valley Vision, a regional organization of leaders primarily from the private sector, provided financial support for regional forums and made the MTP a top priority of its members. SACOG's technical committees and individual cities and counties made specific recommendations considered by the Board of Directors. SACOG staff provided the technical analysis for the MTP 2025, planned the Roundtable meetings with professional facilitators, met with other agencies, interest groups, and the public, and in the end drafted the MTP The staff also provided financial forecasts of amounts and types of funds expected to be available between 2002 and 2025 and information from the regional transportation model and other data sources. Finally, the MTP 2025 took into account the plans of other agencies and corridor investment strategies. WHAT FEDERAL AND STATE REQUIREMENTS MUST BE MET? Federal statutes require adherence to eight planning objectives in the development of regional transportation plans 5 : support economic vitality of the metropolitan area, especially by enabling global competitiveness, productivity, and efficiency; increase safety of the transportation system for motorized and nonmotorized users; increase the security of the transportation system for motorized and nonmotorized users; increase the accessibility and mobility options of people and for freight; protect and enhance the environment, promote energy conservation, improve the quality of life, and promote consistency between transportation improvements and State and local planned growth and economic development patterns; enhance the integration and connectivity of the transportation system, across and between modes, for people and freight; promote efficient system management and operation; and emphasize preservation of the existing transportation system All of these federal objectives coincide with the adopted goals in the MTP 2025 that are carried forward into this 2006 MTP, and were considered in defining the strategies and projects in the plan. The elements of the federally-required congestion management system in SACOG's planning and programming processes is included in Appendix H. 5 From the Safe Accountable Flexible Efficient Transportation Equity Act: A Legacy for Users (SAFETEA-LU), August
12 The 2006 MTP is consistent with the California Transportation Plan, a statewide document with policies that should be followed in all regional transportation plans. The 2006 MTP includes access to interregional passenger and freight transportation, such as Amtrak stations, freight railyards, airports, and the Port of Sacramento, but does not include planning for those systems, which are owned and operated by other entities. A discussion of interregional passenger and freight transportation is found in Appendices F and G. Appendix H provides detail on the Regional Aviation System. The 2006 MTP is a plan intended to continue the vision of the MTP 2025 and provide a bridge to the next generation update of the MTP to be adopted by July 2007 (the MTP 2030). It enables federal decisions and federal funding for near-term projects, keeping them on track during the period between March 2006 and mid
13 3. GROWTH AND CHANGE HOW MUCH GROWTH CAN THE SACRAMENTO REGION EXPECT? Growth continues to be the big story in the region. A recent Central Valley Survey, conducted by the Public Policy Institute of California and the Great Valley Center, found that 43 percent of those surveyed in the Sacramento Region rated growth and development as a big problem, and 56 percent rated traffic congestion as a big problem. Mark Baldassare, Survey Director of the Public Policy Institute, called the results "stunning," saying that "It's the pace of change and also the type of change that's occurring in the outlying regions of Sacramento right now. The changes are very noticeable and troubling to people." 6 The Sacramento region's economy is healthy and yet changing in fundamental ways. With the nearby Bay Area running out of land for development, the region has become attractive to coastal residents, new immigrants, employers and developers because of its lower cost of housing and its job opportunities. The number of jobs in electronics manufacturing, information services, health care, agriculture, food processing and tourism -- industries that are important to the economic transformation -- is rapidly approaching that provided by government, which has long been a cornerstone of the region's economy. These new jobs are also replacing the military- related jobs that have left the region due to military base closures. Within the next few years, these industries will likely, for the first time, employ more of the region's residents than the public sector, and will bring with them the potential for faster economic growth but also the potential for more volatility in the local economy. 7 Population in the region is expected to grow by 788,000 people, an increase of about 37 percent, from 2.15 million in 2005 to 2.94 million in Table 1 shows population, housing, and employment projections for the six counties of the region (excluding the Tahoe Basin). Table 2 highlights the areas (regional analysis districts, which are roughly equivalent to communities) expected to experience the largest absolute growth in population, housing and employment in the region between 2005 and Despite encouragement of infill development, most new housing continues to be located in areas beyond existing urban development. Ninety percent of new housing is expected to locate at or beyond today's urban edge, on what are referred to as "greenfields." Booming areas for population and housing growth include Rancho Cordova, El Dorado Hills, South Sacramento County, North Natomas, West Sacramento, and in Roseville, Rocklin, and Lincoln. Jobs are spreading out around the region. Forty percent of job growth between 2000 and 2025 comes in office and manufacturing jobs in suburban areas (Rancho Cordova, Roseville, North Natomas, Folsom, Rocklin, Elk Grove, Galt, Woodland, Davis, and El Dorado Hills). Only 10 percent of total job growth is expected to locate in downtown Sacramento. In total, employment in expected to grow by about 400,000, a 39 percent increase. 6 Sacramento Bee, Growth tops list of worries in the Valley, April 25, Valley Vision, California State University Sacramento, and SACOG, Sacramento Region Quality-of-Life Index January
14 TABLE 1. REGIONAL GROWTH, Counties Increase % Increase POPULATION El Dorado 147, ,227 56,182 38% Placer 301, , ,181 44% Sacramento 1,361,637 1,762, ,886 29% Sutter 87, ,626 55,284 63% Yolo 187, ,091 92,148 49% Yuba 65, ,801 48,849 74% Six-County Total 2,151,479 2,939, ,531 37% HOUSEHOLDS El Dorado 56,111 82,672 26,561 47% Placer 121, ,898 62,391 51% Sacramento 502, , ,263 44% Sutter 29,373 56,324 26,950 92% Yolo 66, ,276 46,037 70% Yuba 21,533 45,392 23, % Six-County Total 796,905 1,202, ,062 51% EMPLOYMENT El Dorado 51,644 71,205 19,561 38% Placer 156, ,067 81,829 52% Sacramento 657, , ,875 32% Sutter 33,506 49,433 15,927 48% Yolo 136, ,037 54,690 40% Yuba 22,988 47,294 24, % Six-County Total 1,057,823 1,467, ,188 39% Source: Sacramento Area Council of Governments, projections adopted by the Board of Directors Note: Placer and El Dorado County data exclude the Tahoe Basin. 12
15 TABLE 2. FASTEST-GROWING COMMUNITIES, Communities Increase % Increase POPULATION Cosumnes 6,496 59,474 52, % Rancho Cordova 117, ,093 51,911 44% Laguna 67, ,509 49,232 73% Vineyard 24,171 69,609 45, % West Sacramento 39,878 84,362 44, % HOUSEHOLDS Rancho Cordova 42,568 67,871 25,303 59% Laguna 22,378 46,658 24, % West Sacramento 14,453 35,688 21, % Cosumnes 2,193 22,684 20, % Yuba City 24,117 43,994 19,877 82% EMPLOYMENT West Sacramento 29,479 84,356 54, % Rancho Cordova 91, ,055 54,505 60% Roseville 66, ,095 50,805 77% Downtown Sacramento 113, ,479 46,058 41% East Sacramento 58,148 80,767 22,619 39% Source: Sacramento Area Council of Governments, projections adopted by the Board of Directors The distribution of growth is the most important issue for transportation. Travel patternsparticularly during commute periods - have become more complex because so much of the expected growth of both jobs and housing is located in suburban locations. Formerly uncongested roads are becoming clogged, especially major arterials in suburban areas. Many suburban job sites have little or no transit service, and transit service connecting suburban residential and employment areas is especially thin. Increasingly, commuters must rely on autos. WHY SHOULD SACRAMENTO EXPECT THIS MUCH GROWTH? In preparing the MTP 2025 in 2002, several people told SACOG that the projection of a million more people in Sacramento in 2025 would not be desirable. SACOG, however, cannot plan for the population level people may want; SACOG must plan for population growth likely to occur. In fact, it may be better to plan for growth on the high side than to fall short and have to catch up later. Past history and population forecasts indicate that 800,000 in population growth by 2027 is reasonable. SACOG in 1977 estimated that the region's population (then 1.12 million) would grow 13
16 to 1.76 million by In fact, the 2000 Census reported population of 1.89 million, so the 1977 estimate turned out to be a bit low. If Sacramento s growth rate stays the same as it has been since 1977 all the way out to 2027, the population will reach 3.25 million, one-third more growth than the MTP 2025 expected, which was 2.8 million. A look at other cities that in 1977 were about the size Sacramento is now also indicates 800,000 population growth by 2027 to be reasonable, with the greatest risk that it is on the low side (Table 3). Once population passes about 1 million in size, an urban economy becomes self-sustaining, not dependent on the economies of other urban areas nearby. A comparison to ten cities whose populations in the 1975 were close to the Sacramento region's 2000 population is quite revealing. TABLE 3. COMPARATIVE GROWTH, Population 2000 Population Change Atlanta 1.79 million 4.11 million +2.2 million Cleveland 1.97 million 2.95 million +1.0 million Denver 1.41 million 2.58 million +1.2 million Houston 2.23 million 4.67 million +2.4 million Miami 1.44 million 3.87 million +2.4 million Minneapolis 2.01 million 2.97 million +1.0 million Phoenix 1.22 million 3.25 million +2.0 million Pittsburgh 2.32 million 2.36 million +40,000 San Diego 1.59 million 2.81 million +1.2 million Seattle 1.41 million 3.55 million +2.1 million Among these ten urban areas, the only one that did not grow by a million or more was Pittsburgh, but Pittsburgh, along with Cleveland, are the two cities least like Sacramento. In fact, if the growth in these other cities from 1975 to 2000 is a good comparison, the forecast of 800,000 growth by 2027 for Sacramento might turn out to be too low. The State Department of Finance's growth forecast, used by SACOG, also meets two common sense tests. Sacramento's population in 2002 was just over 5 percent of the statewide total of 35 million. With 800,000 growth by 2027, Sacramento would get 7 percent of the 14 million people the state expects to add. It makes sense that Sacramento would grow faster than other parts of the state. Environmental constraints and the high cost of land and housing during the 1990s began to constrain growth along the coast and in the Bay Area, yielding a boom in the Central Valley. Employers seek access to urban services and labor markets, so cities like Sacramento and Fresno become the most attractive growth sites in Northern California. Furthermore, it makes sense that California's high population growth will continue. The number of people entering their twenties, the high childbearing years, will be greater in the upcoming decades than it was during the 1980s and 1990s, and people are living longer as well. The biggest share of growth, however, comes from in-migration to the state, and particularly foreign immigration. Foreign immigrants, accompanied by a traditionally high birthrate in immigrant families, are likely to keep coming to California more 14
17 than to other states, attracted by good climate, good job opportunities, Californians' acceptance of cultural diversity, and large communities of recent immigrants for support (especially for those coming from Latin America and Asia). In fact, 2000 Census data reveal that within California, Sacramento has become the most ethnically diverse region in the state. 15
18 4. MEETING THE PLAN S GOALS HOW THE 2006 MTP MEETS SACOG S TRANSPORTATION PLAN GOALS Based on an analysis of transportation and related issues in the region, the MTP 2025 Roundtable developed ten carefully worded goals that were adopted by the SACOG Board of Directors in October Table 4 lists the goals that guided development of the MTP Few would disagree with these goals, but each one entails some unanswered questions, policy issues, and trade-offs. A brief discussion of each goal, issues relating to it, and what the 2006 MTP does or does not do to meet the goal follows below. The MTP 2025 also used a set of performance indicators to measure progress toward these goals. Please refer to the MTP 2025 document for these indicators. The 2006 MTP uses these same performance indicators for two scenarios, the transportation system in 2005 and the transportation system in 2027 with projects included in this plan. These are shown in Table 6 and Maps 3 and 4 (in the next chapter), where they are explored in greater detail. 1. OVERARCHING GOAL: QUALITY OF LIFE: Develop a fully-integrated, multi-modal transportation system to serve as a catalyst to enhance the quality of life enjoyed by the current and future residents of the Sacramento region. "Quality of life" is defined in different ways, but people tend to know when it's getting better or getting worse for themselves. For most people, quality of life includes some consideration of housing, jobs, schools, neighborhood, environment, and lifestyle activities. SACOG heard testimony praising the vitality of urban communities and disparaging the blandness and isolation of suburban communities, but a California Poll in Spring 2002 found the greatest satisfaction with quality of life in the suburbs, with Roseville highest in the region. This overarching goal served as the anchor for development of the other goals of the MTP Questions and Trade-offs: Because quality of life means different things to different people, it becomes hard to measure. Some people, for whom flexibility is most important, want to be able to drive anywhere anytime. Others, for whom a clean environment matters more, want people to leave autos at home and ride transit or bicycle more often. The components of quality of life involve investment and policy trade-offs, affecting economic development, community services, land development, open space, and environmental programs. Consensus often proves elusive. What s in the Plan: The 2006 MTP is designed to meet regional travel needs for all types of purposes as far as financially feasible, over the long term. In the development of the MTP 2025, the Roundtable recognized that transportation is closely connected with many other issues such as health and safety, social equity, the environment, land use, and economic vitality and developed goals and actions in the MTP to address these issues. How the Plan Meets This Goal: The test of meeting this goal is the success of the plan in meeting all of its other goals. 16
19 TABLE 4. METROPOLITAN TRANSPORTATION PLAN GOALS 1. OVERARCHING GOAL: QUALITY OF LIFE. Develop a fully-integrated, multi-modal transportation system to serve as a catalyst to enhance the quality of life enjoyed by the current and future residents of the Sacramento region. 2. ACCESS AND MOBILITY. Improve access to goods, jobs, services, housing, and other destinations; provide mobility for people and goods throughout the region, in a safe, affordable, efficient and convenient manner. 3. AIR QUALITY. Develop a transportation system and related strategies that contribute to achieving healthy air in the region. 4. TRAVEL CHOICES. Provide affordable, convenient, safe, and integrated travel choices. 5. ECONOMIC VITALITY. Enhance the economic vitality of our region by efficiently and effectively connecting people to jobs, goods, and services, and by moving goods within our region and beyond with an integrated multi-modal freight system. 6. EQUITY. Pursue a transportation system that addresses the needs of all people in all parts of the region and assure that impacts of transportation projects don't adversely affect particular communities disproportionately. 7. TRANSPORTATION AND LAND USE. Influence land use policies to improve access to jobs, services and housing to everyone in the region by using market forces and the regulatory process. 8. FUNDING AND REVENUE. In order to adequately fund the MTP 2025, develop appropriate, innovative, equitable, and stable funding sources (both short- and long-term) and identify costreduction measures. 9. HEALTH AND SAFETY. Improve the health of our residents by developing systems that would encourage walking and biking, and improve the safety and security of people on all modes in all areas. 10. ENVIRONMENTAL SUSTAINABILITY. Develop the transportation system to promote and enhance environmental quality for present and future generations. 17
20 2. ACCESS AND MOBILITY: Improve access to goods, jobs, services, housing, and other destinations Provide mobility for people and goods throughout the region, in a safe, affordable, efficient and convenient manner. Access (the ability to get somewhere) and mobility (the ability to move easily and quickly to get there) are interrelated concepts for transportation. Land use becomes closely related: the way cities and towns are designed can minimize travel distances, which in turn can improve access and mobility. Congestion limits mobility and access, particularly during peak commute hours, which in turn affects housing and job choices. Questions and Trade-offs: With growth in population, the desire for continued high mobility and accessibility requires larger transportation facilities, which in turn can bring undesirable community impacts. Most people prefer to travel by auto, which provides the most mobility in a city the density of Sacramento, but transit yields fewer community impacts. The MTP 2025 faced investment trade-offs: between capacity improvements and maintenance, rehabilitation, and operations; among transit, road and bicycle improvements; among strategies such as street widenings, traffic signals, or carpool lanes; and among individual projects. What s in the Plan: The MTP proposes strategies to address both access and mobility and acknowledges that certain major corridors, including I-80 and U.S. 50, need major investments in all types of transportation to maintain and improve both access and mobility in face of the growth in travel that is expected. Significant expansions are planned for the public transit system, including commuter rail, light rail, bus service, circulator van service to serve neighborhoods, and bus rapid transit service on some busy commute corridors. Major new road projects are planned as well, notably connectors to link Roseville with Sacramento Airport (the Placer Parkway), Rancho Cordova with Roseville, and Elk Grove with Rancho Cordova and El Dorado County. Bicycle and pedestrian projects are included as a lump sum, with the regionally-funded projects selected from SACOG s Regional Bicycle, Pedestrian, and Trails Master Plan using the competitive Bicycle and Pedestrian grant program. Also, most road improvements should include features to improve bicycling and walking. Congestion-relief projects and programs include carpool lanes on the major freeways, highway bypasses around smaller cities, improvements to highways connecting our region with counties to the north, freeway-to-freeway connection improvements, high-tech information systems on local arterials and highways to smooth the flow of traffic, freeway patrols to clear off incidents quickly, and management programs such as rideshare and incentive programs for commuters to use alternative transportation. Local road improvements, including road widenings, intersection improvements, and roads serving new developments, were submitted to SACOG for inclusion in the MTP by local jurisdictions, with many of the projects to be funded wholly or in part by local developers or development fee programs. How the Plan Meets This Goal: Mobility, as measured by congestion levels, generally worsens over the 2006 MTP period because road and transit investment does not keep pace with growth. Congestion points vary depending on where growth is taking place and the capacity of the surrounding transportation system. Investments in the MTP, in both roads and transit, do make a positive difference in some of the worst congestion areas. Accessibility, as measured by the 18
21 ability to reach job centers in a reasonable period of time by auto and transit, generally diminishes in the MTP period, although transit accessibility to some job centers is increased. 3. AIR QUALITY: Develop a transportation system and related strategies that contribute to achieving healthy air in the region. The Sacramento region's ozone pollution is among the worst in the United States, in large part due to topography and meteorology, although transportation contributes more than 60 percent of emissions. Local surveys identify air pollution as a major health concern, causing asthma and other lung problems. The region is classified as a "severe air quality non-attainment" area by the federal Environmental Protection Agency. In July 2005 a new 8-hour federal air quality standards for ozone took effect and a new rate-of-progress air quality plan is being prepared on an interim basis. A major new air quality plan to meet the 8-hour federal standard will be ready by July If this new standard is not achieved by the 2007 plan s deadlines, the region will or face additional planning requirements and possibly financial sanctions that will inhibit the its ability to expand the transportation system. As the region grows in population, more driving causes more air pollution, and the greatest emissions occur at the start and end of trips. Fortunately, vehicle technology has progressed and continues to improve dramatically, and as newer vehicles replace older ones, air quality will gradually improve. An analysis of this MTP will show conformity to the region's rateof-progress clean air plan, which means the improvements it proposed will not undermine achievement of the standards. Questions and Trade-offs: Controversy still swirls about the best way to attain clean air. Reductions in auto trips clearly offer benefits, along with major social and economic consequences. Better transit service offers people a choice, but relatively few are choosing to ride. No transportation strategy promises an easy, economical, and effective result for clean air except better vehicle technology, and on that front many people have been choosing to buy large, more-polluting vehicles in increasing numbers in recent years although because of recent high gas prices there is now a counter-trend towards low-polluting hybrid gas-electric vehicles. No equitable and reasonable strategy has been found to deal with the small number of vehicles responsible for most emissions: heavy trucks and older, poorly maintained autos. No consensus exists about how to deal with weather as an overriding factor, and whether the region would be willing to restrict or increase the cost of driving to help attain clean air. How the Plan Meets This Goal: The 2006 MTP includes continued funding for incentives for using clean air technology in heavy duty vehicles (the SECAT program), travel reduction through a transportation demand management program and the Spare the Air program, and other effective air quality strategies toward the day when the region is considered an attainment area for air quality. The plan also funds alternative modes of transportation public transit operations, bicycle and pedestrian projects and community design projects that support smart growth development that will make cleaner forms of transportation more attractive. The plan continues funding for the regional rideshare program, which is the only adopted transportation control measure included in the State Implementation Plan. The 2006 MTP conforms to the 2005 Clean Air Act deadline for lowering ozone emissions, and now that the Yuba/Sutter air basin has been determined to 19
22 be in attainment of the 8-hour ozone standard, emissions levels are no longer an issue in that area. However, more emissions reductions will be necessary to keep the area in attainment indefinitely. 4. TRAVEL CHOICES: Provide affordable, convenient, safe, and integrated travel choices. The residents of this region overwhelmingly travel by auto: In 2005, 47% percent of all trips are taken driving alone, 46 percent travel two or more to a car, 6 percent travel by bicycle or walking, and less than 1 percent ride public transit (although transit carries 3 percent during commute periods). Providing choices will be a necessity in the most heavily traveled corridors in the region, where travel demand is rapidly increasing and where we will need as many ways as possible to travel. Questions and Trade-offs: The public supports increases in transit service, but when it comes time to travel, transit is "for the other guy." Transit operators have struggled to find a way to make transit both convenient enough and affordable, so that it becomes an attractive choice. Some believe encouraging carpools would be a better strategy and others seek to encourage bicycling and walking for short trips. The region has nowhere near enough funding to allow all other modes of travel to function comparably to the auto anytime soon, even with increasing congestion. The dayto-day cost of driving, even with recent gas price increases, is relatively low and its convenience so high that some believe pricing of peak period road use may be the only way to level the playing field among modes (the way telephone, electricity, and airline services are priced) an idea without widespread support. What s in the Plan: The 2006 MTP invests significant funding into offering travel choices to current and future residents. Major increases in rail, bus, bicycle, and pedestrian facilities are envisioned, along with promotion of telecommuting and ridesharing. In this plan, the public transit system of the region will become integrated through information technology and universal passes, bicycles will be accommodated on buses and trains and welcome on streets, pedestrians will feel more comfortable crossing arterials, and children will feel safer walking to school. How the Plan Meets This Goal: At the regional level, people are not expected to change their modes of travel significantly. However, transit can capture a much bigger share of travel in certain higher-density areas, and where there are higher costs for using autos. Community design changes and additional bikeways and pedestrian facilities can improve this situation to some degree for shorter trips. 5. ECONOMIC VITALITY: Enhance the economic vitality of our region by efficiently and effectively connecting people to jobs, goods, and services, and by moving goods within our region and beyond with an integrated multimodal freight system. 20
23 Employers and business owners cite access to jobs for employees and access to businesses for freight delivery, primarily by truck, as important issues for economic prosperity. They note the need for a comprehensive public transit system for commute trips (including a program for those who are transitioning from welfare to work), other alternatives to driving, congestion reduction on streets and highways (especially important for time-sensitive truck deliveries), a well-maintained road system, and good access to airports and the Port of Sacramento. If these access and mobility issues are ignored, businesses may choose to relocate elsewhere, either to the outer edges of the region where these issues are not yet severe, or to other regions. Questions and Trade-offs: All the needs noted would cost far more than the revenue reasonably expected to be available, even with the voter approval of Measure A in Sacramento County in A healthy economy raises issues about impacts from a burgeoning number of trucks on freeways and local streets. Good interregional highways are critical for commerce, but have subsequently enabled long-distance commuting too. The region has not found a way to ensure local jurisdictions will provide affordable housing for all incomes near jobs, in all parts of the region, to improve accessibility and shorten commuting. Some people believe worksite parking, free and readily available everywhere except downtown Sacramento, to be a major factor in commute choices, but the idea of pricing of workplace parking is not widely popular. What s in the Plan: The 2006 MTP includes new roads that connect areas around the periphery of the urban core, providing better access to the region s three major job centers downtown Sacramento, Rancho Cordova/Folsom, and South Placer County. It also includes significant new light rail and bus transit, carpool lanes for commuters, and a larger Transportation Demand Management program to help cut down on solo driving. The Downtown-Natomas-Airport rail line and road improvements in the airport vicinity will provide better access to Sacramento Airport, and other improvements do the same for Mather Airport and the Port of Sacramento. Finally, investment in road maintenance and rehabilitation, particularly a problem in rural areas where farm-to-market truck travel is important, is included in this plan. How the Plan Meets This Goal: In spite of the projects in this 2006 MTP, accessibility to job centers is shrinking due to congestion, particularly at bottleneck points such as the American River crossings. On the positive side, new connector roads will offer bypasses to downtown for commerce, connections to other regions will improve, and carpool lanes on the freeways will help clear up congestion that slows down trucks. 6. EQUITY: Pursue a transportation system that addresses the needs of all people in all parts of the region and assure that impacts of transportation projects don't adversely affect particular communities disproportionately. Equity involves four issues: whether all communities have reasonable and affordable transportation access, to what extent communities suffer impacts from transportation facilities that pass through them, whether those who cannot or choose not to drive have reasonable transportation options, and whether tax revenues get distributed fairly region-wide and provide benefits for all taxpayers. Major arterials and freeways pass through various communities, bringing traffic impacts from autos 21
24 and trucks coming from and going to communities beyond in both directions. With the MTP 2025, SACOG inserted a regional viewpoint into the political discussion that in recent years has been largely fragmented and localized. Questions and Trade-offs: All communities send residents traveling through their neighbors' streets, but transportation facilities are not evenly located and some communities complain about disproportionate impacts. Investment in regional-scale facilities cannot be divided piecemeal, but must be concentrated onto large projects of system-wide importance, regardless of location. The benefits, however, accrue to all who travel. All jurisdictions need funds for maintenance, rehabilitation, operations, and improvements, and look to a fair share of regional funding to help beleaguered budgets. The division of funding between transit and roads becomes an equity issue as well, because drivers paying gasoline taxes expect road improvements while the most effective investment for the system may be in transit. What s in the Plan: This 2006 MTP incorporates the priorities of local communities, with many of these local projects paid for from local funds. Major projects of regional concern are distributed throughout the region as well. The plan will provide alternative transportation public transit, bicycle, and pedestrian facilities for those who can t or don t drive. The plan includes Jobs Access Reverse Commute funding, which is intended to offer convenient transit for entry-level workers, particularly those transitioning from welfare to work. Community circulator van routes will supplement the mainline transit system, offering more convenient travel by transit from neighborhoods, particularly important for elderly and disabled persons. Finally, a large increase in paratransit service (door-to-door wheelchair-equipped van service called for in the Americans with Disabilities Act) is included for the expected increase in the elderly population over the plan period. The Environmental Impact Report that accompanies the MTP 2025 (and which is referred to in the EIR Addendum attached to this MTP) addresses impacts on low-income and minority communities. How the Plan Meets This Goal: The amount of funding reserved for public transit in this plan is consistent with the MTP 2025 and demonstrates the region s commitment to balancing the investment in the major modes of transportation roads and transit. Many of the transit projects intentionally benefit lower-income communities. Local priorities have been respected in the plan, but regional priorities have taken precedence for the first time with regional sources of funding. 7. TRANSPORTATION AND LAND USE: Influence land use policies to improve access to jobs, services and housing to everyone in the region by using market forces and the regulatory process. The region has come to understand that transportation plans must be more closely linked to both land use plans and the progress of land development if we are to rein in sprawling growth. Public agencies can use transportation funds to influence the course of development, by providing facilities to support developments and by offering incentives to shape the form of development. SACOG expects congestion to grow beyond the region's willingness and ability to afford relief, so changes in land development patterns that can reduce travel demand become ever more important 22
25 to the transportation system. Questions and Trade-offs: Until recently, no consensus existed in the region about how to accommodate the growth in population and jobs. SACOG s Blueprint Transportation and Land Use Study ended in December 2004 with Board of Directors consensus on a regional 2050 land use scenario that assumes smart growth strategies in most jurisdictions in the region. These strategies include mixed use and compact development, infill, a mixture of housing types, quality building design, and preservation of open space. Modeling shows that these land use strategies reduce the number and length of auto trips. SACOG, in collaboration with member jurisdictions, is currently developing a Blueprint-based 2030 land use map to use in the next generation MTP to be adopted in What s in the Plan: A Community Design incentive program, which can pay for planning grants to local governments and for transportation improvements that complement smart growth projects, would encourage people to make local trips, use public transit, walk, and bike. Appendix B describes this program. Also included in the plan is open space in the form of land easements accompanying regional connector roads. Investment in the transportation system near the urban edge offers opportunities to set aside open space and direct development to areas that can get good access How the Plan Meets This Goal: The $500 million investment in Community Design incentives in the MTP 2025, which is continued in this plan, inclusion of open space in conjunction with road projects, and the Transportation-Land Use Study cannot be evaluated for effectiveness yet, but they are all expected to influence the effectiveness of the transportation system. 8. FUNDING AND REVENUE: In order to adequately fund the MTP 2025, develop appropriate, innovative, equitable, and stable funding sources (both short- and long-term) and identify cost-reduction measures. Federal statutes require urban transportation plans to be constrained by revenues "reasonably expected to be available" to the region. On the other hand, a plan that ends up too constrained lacks vision for the regional future, and arguably undermines the rationale for seeking more funding. The MTP 2025 forecasted revenues about 50 percent higher than the previous 1999 MTP, using some expansive assumptions. Even so, revenues fell 20 percent short of being able to fund all transit service needs in urban Sacramento, 20 percent short of road maintenance needs in rural counties, and 30 percent short of some road improvements planned by cities and counties. Road maintenance has been under funded statewide at least since the 1970s, and deferred maintenance leads to pavement cracking, damage below, and eventually rehabilitation costs four to ten times higher than timely maintenance would have cost. Questions and Trade-offs: The MTP 2025 faced decisions about what to assume for renewal of Sacramento County's Measure A sales tax (renewed in 2004), continued flow of federal discretionary funds to the region, and future gasoline tax and transit fare levels, and whether to assume new taxes of any type. The sources of and restrictions on revenues in some cases allow choices and in other cases force trade-offs between capital investments and maintenance and 23
26 operations, and between transit and road expansion. In the long run, the gasoline tax declines while sales tax revenues increase, making transportation programs more dependent on a less stable revenue source. Capital programs in transportation have traditionally relied on pay-as-you-go funding, but the need for improvements faster than revenues become available points to consideration of bond financing. Road pricing lurks in the background, politically unattractive today but a revenue source with far-reaching implications and large revenue potential. What s in the Plan: The 2005 MTP projects that $27.5 billion in federal, state, local, and developer funds will become reasonably available in the next 22 years. This presents opportunities for the region to meet more of its transportation needs, some long overdue. The plan takes into consideration that Sacramento County voters approved a renewal of Measure A, the ½ percent sales tax for transportation that expires in The plan assumes that another measure will be approved in this life of this plan, providing the equivalent of a 2/3 percent sales tax. It also assumes that federal and state funding sources based on gas taxes will increase, although this source will ultimately decline as cars become more fuel efficient or more reliant on alternative fuels. It assumes that federal grants will continue. The plan proposes to double sales tax funds for public transit operations in Sacramento County, and reports a need for further operating funds to increase service. It also reports an estimated $1.5 billion shortfall for road maintenance in the rural counties, and recommends seeking new sources of local funds for that purpose. Many funding sources are restricted to capital uses only, and local funds represent the kind of flexible funding needed for maintenance and operations. To the extent that road maintenance backlogs are dealt with in this plan, road rehabilitation costs will be reduced. How the Plan Meets This Goal: The 2006 MTP has made expansive assumptions to accommodate a reasonably expansive vision and identifies shortfalls. 9. HEALTH AND SAFETY: Improve the health of our residents by developing systems that would encourage walking and biking, and improve the safety and security of people on all modes in all areas. Obesity has recently been declared an epidemic in this country, and the predominant use of the automobile has been blamed as at least part of the problem. Many cite obstacles to safe and comfortable walking and biking in cities and suburbs as a root cause. Some people feel insecure or threatened riding transit, and that acts as a deterrent to ridership. High speed rural roads, in particular two-lane state highways, have been known to foster higher fatal accident rates when daily traffic grows to 12,000 or higher, which cuts down passing opportunities, leading impatient drivers to resort to unsafe driving behavior. Questions and Trade-offs: Consensus on strategy and priorities for bicycles and pedestrian travel has somewhat improved recently, with the adoption of SACOG s Bicycle, Pedestrian, and Trails Master Plan. High-priority projects of regional significance in this plan can be funded with the competitive Bicycle and Pedestrian Funding Program. This will improve the climate for bicycling and walking, where needs far outstrip funds. Transit crime has not been a major problem, but insecurity when riding with passengers who behave in unfamiliar ways still deters people from 24
27 riding transit, with no obvious solution. The best solution for rural roads at high risk for fatal accidents usually involves adding capacity, an expensive solution with only modest payoff considering the amount of traffic, but so-called "blood alleys" often crowd to the front of priority lists. Preventive planning, aimed at adding capacity before problems develop, runs the risk of admitting liability by identifying the road as deficient, especially given the long lead time to design and build road improvements in rural environments. What s in the Plan: Pedestrian and bicycle plans and projects have received set-asides in the plan, both to develop local and regional systems, and improve conditions along existing roadways. This funding is supplemented by the amount allocated for the Community Design Program, which will include pedestrian and bicycle improvements associated with smart growth developments. Local road and state highway safety-related improvements are included, such as those slated for Routes 65, 70, and 99 in Placer, Yuba, and Sutter Counties. Freeway service patrols are also funded in this plan and SACOG in a separate program funds freeway call boxes. Freeway message signs are likewise a safety measure since they warn motorists of upcoming travel conditions such as fog or heavy traffic. Public transit security, both for passengers and their parked cars, is a priority because people will be much more likely to use transit if they feel safe doing so. Finally, the plan expects replacement of the Folsom Dam Road with a separate bridge downriver, to deal with a national security issue, with most of the funding expected to come from the Federal Bureau of Reclamation. How the Plan Meets This Goal: The plan envisions that current safety and security systems will continue and that bicycle, pedestrian, and highway capacity improvements will increase safety. 10. ENVIRONMENTAL SUSTAINABILITY: Develop the transportation system to promote and enhance environmental quality for present and future generations. Environmental sustainability has become a major issue of debate, so far focused mainly on global climate change, oil supplies, land consumption, and water. With the Sacramento region slated to add around 3/4 million in population between 2005 and 2027, open space, habitat protection and clean air and water command continuing attention. Sprawl development prevalent in recent years consumes land, energy, and other resources more than would be the case with more compact development. These patterns may be neither desirable nor sustainable in the long term, unless the region is willing to accept the kinds of community and natural impacts and constraints found in sprawled urban regions like Los Angeles. Questions and Trade-offs: It is by no means clear whether society can sustain our present level of mobility indefinitely, or how to do it. Likewise the specter of global climate change has become accepted but remains poorly understood, with agreement on what to do about it (in particular CO 2 emissions from motor vehicles) even less clear. Some believe energy prices will adequately regulate energy consumption, including gasoline use, while others worry that the shift to moreenergy-efficient vehicles will occur too slowly to avoid periodic crises that become challenging for transportation. The region needs to consider near-term economic sustainability with long-term environmental sustainability. Through the Blueprint project, the region began to develop a 25
28 consensus about the role of transportation in promoting sustainable growth and land development, and this consensus will be enacted through the revision of land use plans that is currently underway, and in the MTP to be adopted in What s in the Plan: The MTP 2025 included a number of projects and programs that mitigate environmental issues. The air quality program will help the region to attain air quality standards. Open space is attached to some of the regional connector projects in the form of conservation easements, intended to protect agricultural areas and other open space from development in areas that are not zoned for development. The open space acquired with transportation funds is intended as a seed, to spur preservation of nearby open space in a greenbelt. The MTP 2025 was accompanied by an Environmental Impact Report (and this plan is accompanied by an Addendum to that EIR) that evaluates the plan in terms of its likely environmental impacts as well. How the Plan Meets This Goal: The 2006 MTP provides more capacity to the transportation system to sustain economic health in the region, provides funding to preserve open space, encourages compact land development through the Community Design incentive program, and promotes air quality. 26
29 5. COMPARING ALTERNATIVE TRANSPORTATION FUTURES HOW DOES SACOG ANALYZE AND COMPARE ALTERNATIVE FUTURES? In developing an MTP, SACOG uses travel demand models to examine how the transportation system works, now and in the future, under alternative scenarios. Modeling is also used to project harmful air emissions for air quality conformity purposes. Transportation models run on a computer, making millions of calculations quickly. In simplest terms, the models add up the travel behavior of all of the people in the Sacramento region and explain how that affects the transportation system. Models can provide information about travel today, and forecast travel in the future, but do not make decisions. A brief summary of how SACOG's two models work can be found in the Appendix J. Modeling assumptions are found in Appendix D. SACOG also uses data, research, and mapping to look at the impacts of the transportation system on surrounding communities and the natural environment. A summary of the community and environmental impacts of the MTP 2025 is found below; those wanting more information on these impacts should refer to the Environmental Impact Report (EIR) accompanying the MTP 2025 and the Addendum to the EIR developed for this 2006 MTP. WHAT ALTERNATIVE FUTURES WERE CONSIDERED? In preparing the MTP 2025, the Roundtable developed study alternatives that separately emphasized transit, roads, and community design, comparing those to each other and to the existing 1999 MTP. The resulting preferred alternative was a hybrid that performed better on many measures than the 1999 MTP. In this plan, two alternative transportation futures were compared -- the MTP 2025 and the 2006 MTP. Here is how they are different: The timeframe for the MTP 2025 was and the timeframe for the 2006 MTP is The 2006 MTP project list is the same as the MTP 2025 project list except for projects that have been built since 2002, and therefore eliminated, and a few new projects that have been added. These new projects are largely developer-built serving areas that were indicated for development in the MTP 2025, where development has progressed to the point that actual roads are now designated. Some projects have changed in scope or cost since the MTP 2025 was completed, but the changes are minor. 27
30 WHAT KINDS OF INFORMATION DO THE TRANSPORTATION MODELS PRODUCE? SACOG's models analyze and report four general kinds of information: System performance -- how well different parts of the system handle the total travel demand, using measures such as vehicle miles traveled, traffic congestion levels on roadways, transit travel times, and hours of delay in traffic jams. The congestion index, a particularly interesting measure, describes the time spent driving in congested conditions on a peak hour trip (rather than degree of congestion at particular places on the system). Mode choice -- to what extent people choose to drive alone, ride in carpools, ride transit, bicycle, or walk. Accessibility -- how far a person can travel in a given time, and how many jobs and activities are available within that travel radius. The accessibility index describes how many of the region's ten largest job areas can be reached from each residential community, within 20 minutes driving time or 45 minutes riding transit. Air quality -- the amounts of four kinds of pollutants -- NOx (nitrogen oxides), hydrocarbons (combine with NOx to yield ozone, the unhealthy smog of summer afternoons), particulates (known as PM-10), and carbon dioxide (CO2) -- emitted by onroad motor vehicles, calculated by a separate air emissions model. Each of these kinds of information can be compared several ways: from one alternative to another, as a regional average, between one community and another, and from the present to future years. WHAT DID SACOG LEARN FROM MODELING FOR THE 2006 MTP? The $27.5 billion in projects in the 2006 MTP, given a 800,000 increase in the region's population between 2002 and 2027, will substantially improve transit service, substantially lessen the increase in congestion, and maintain better accessibility around the region than if the projects were not built. Individual travel behavior on the system with the travel conditions of 2027 will not change much. Certain projects might yield localized environmental impacts, but the overall impacts from $120 billion in land development and other infrastructure would be an order of magnitude greater. The transportation system's impacts on existing communities might be different after projects are built, but overall impacts resulting from the expected increase in travel without improvements would be comparable. IN LOOKING AT SYSTEM PERFORMANCE IN THE MTP 2025 SACOG LEARNED THAT: Vehicle Miles Traveled (VMT) per capita rises due to longer trips. In the period , total VMT increases by 58 percent, from 43.2 million daily today to 68.6 million daily in 2025, compared to a 49 percent population increase. Looked at another way, the average person drives 28
31 22.9 miles per day in 2000, which increases to 24.4 miles per day by With most growth at the edges of the metropolitan area, in suburbs with lower-than-average densities and little mixing of housing and jobs, trips lengthen, both for work and local errands. Limited transit service in these areas leaves the auto as the best choice for all but very short trips. More VMT means autos on the road longer, which in turn means more congestion and more air pollution. Congestion generally gets worse, because road and transit investment does not keep pace with growth. The MTP 2025 expanded the capacity of the transportation system by about 20 percent, while VMT grew by 58 percent. Today, on average, 15 percent of a driver's time on the road during commute hours is spent in congestion, but by 2025 that becomes 24 percent. That means congested travel becomes 60 percent slower, lengthier, or more widespread. Occasional congestion becomes more common, light congestion worsens, and heavy congestion during peak hours intensifies and spreads. These conclusions still hold true for the 2006 MTP, consistent with the MTP For the purpose of illustrating how the 2006 MTP projects will affect the region s travel patterns, Maps 3 and 4 offer a comparison. Map 3 shows congestion in 2005, and Map 4 shows congestion in 2027 with the capacity-increasing projects in the plan. Table 5 shows some key performance indicators under the two conditions that were modeled, 2005 conditions and 2027 conditions. On Maps 3 and 4, green represents either no congestion (the typical case in rural areas of the region), or typical urban travel conditions (periodic slowing, occasional stop and go traffic), yellow represents heavy congestion through peak hours each weekday (continuous slow or stop-and-go traffic, similar to heavy Sacramento congestion today), and red represents what most Sacramento drivers would consider near-gridlock: solid congestion (stop and go traffic, on the scale of the Bay Area or Los Angeles) for more than three hours every morning and afternoon. Table 5. Key Performance Indicators for the 2006 MTP (weekday) Indicators Year 2005 Year 2027 VMT per capita Vehicle trips per capita Daily mode shares Carpool 46.5% Transit 0.9% Bike/Ped 6.2% SOV 46.4% Peak period mode shares Carpool 9.8% Transit 2.6% Bike/Ped 5.4% SOV 82.2% Percent growth in vehicle trips, Percent growth in vehicle miles traveled, Carpool 46.9% Transit 1.1% Bike/Ped 6.1% SOV 45.9% Carpool 10.9% Transit 3.0% Bike/Ped 4.9% SOV 81.2% % % 29
32 The modeling shows that that congestion worsens unevenly around the region, but generally continues a twenty-year trend that has seen congestion shift outward toward suburban locations. Large increases in population or employment tend to increase congestion on connecting corridors. Some corridors have spare capacity to start with, and improvements add to capacity and lessen congestion, or in certain cases provide alternate routes that shift traffic and congestion from one area to another. A comparison of travel demand against capacity today shows a few wellknown bottlenecks where the system overloads: on both Watt Avenue and Sunrise Boulevard near the American River, demand exceeds capacity by 100 percent, on I-80 at the Capital City Freeway, demand exceeds capacity by 60 percent, along the Capital City Freeway, on Route 99 in south Sacramento, on U.S. 50 near Folsom and El Dorado Hills, on I-80 at Roseville, and at downtown Sacramento freeway interchanges, demand exceeds capacity by percent, and on I-80 through Natomas and along several arterials, such as Madison, Folsom, Power Inn, Calvine, and Douglas, in particular near freeway interchanges, demand reaches or slightly exceeds capacity. A rule of thumb says it takes an extra hour to drain away traffic congestion where demand exceeds capacity by 50 percent. A similar comparison for 2027 puts today's congestion in stark perspective, although the models say some people actually will choose to travel at different times or to different places to avoid congestion this bad. on much of Watt, Sunrise, and Hazel, particularly near the American River and U.S. 50, demand will exceed capacity by percent; on downtown Sacramento freeways and interchanges and across the Pioneer Bridge on U.S. 50 to West Sacramento, demand will exceed capacity by percent; on parts of five key arterials-madison, Folsom, Bradshaw, South Watt, and Power Inndemand will exceed capacity by percent,; on the Capital City Freeway, I-80 as far as Roseville, and Route 99 as far as Elk Grove demand will exceed capacity by percent; on U.S. 50 near Sacramento State University and between Folsom and El Dorado Hills, demand will exceed capacity by percent; and along most of I-5 in the urban area, on I-80 through Natomas and across the Yolo Causeway, on Route 65 through Roseville, and on major arterials such as Florin Road and Greenback Lane, demand will reach or slightly exceed capacity. Investments in highway, carpool, or transit capacity in a corridor are shown to reduce congestion. The congestion index, measuring very heavy congestion encountered during a peak hour trip, set at a regional average of 100 today, would rise to 175 region-wide by 2025 without the improvements in that were included in the MTP The congestion index today varies greatly around the region, ranging from 10 up to 250. Some areas clearly need added capacity more than others do. For example, the transportation system serving downtown 30
33 Sacramento has been built with high capacity historically, so congestion levels fall somewhat below the regional average, whereas many suburban areas fall well above the regional average resulting from growth with little transportation investment during the past 20 years. If all improvements in the MTP 2025 (and continued in the 2006 MTP) were to be completed, the congestion index region-wide in 2025 would only rise to 150. This still means the congestion index ends up 50 percent worse as a region-wide average compared to today. It worsens more in high growth areas such as Vineyard or Lincoln, or areas with relatively few improvements such as Antelope or Carmichael. Corridors with significant new investment in both roadways and transit, like the U.S. 50 corridor, show improvements even with high growth rates. Carpool lanes, which carry two to three times as many people as regular lanes, and added lanes on congested arterials, particularly help reduce congestion. Even so, so the congestion index increases almost everywhere: Davis and Woodland go to 100, Arden-Arcade to 150, South Sacramento to 170, Folsom to 190, Fair Oaks and Orangevale to 210, Citrus Heights to 230, Roseville and Elk Grove to 250. Only El Dorado Hills improves, and then only to a quite-congested 210. Heavy traffic appears in some less-urban parts of the region with little or no congestion today. These numbers show both the effect of overall growth in travel well outpacing road and transit investment, and the relative value of particular investments in specific areas. 8 IN LOOKING AT MODE CHOICE IN THE MTP 2025, SACOG LEARNED THAT: At the regional level, people do not change travel modes significantly. The MTP goals call for providing a range of travel choices, but people continue to prefer the auto for most travel. In 2000, 50 percent of all trips drive alone in autos, carpools comprise 43 percent, transit handles less than 1 percent (90,000 riders per day), and 6 percent bicycle or walk. Even with a plan that heavily emphasizes transit improvements, by 2025 total transit ridership barely doubles (180,000 riders per day), or 1.2 percent share of trips. Congestion at the levels found in Sacramento in 2025 or 2027 is nowhere near severe enough to entice many people to switch to transit. Indeed, in nearly every major urban area around the country, even those such as the Bay Area and Los Angeles with extreme congestion, people gradually shifted away from transit to driving during the 1990s. Thus even the small increase in transit use reverses a decade-long trend in the opposite direction. The typical response to heavy congestion involves finding a new route or cutting through neighborhoods to get out of the traffic jam, not switching to transit or bicycling. In our hectic urban world, few people are willing to forego the auto's advantages -- convenience, flexibility, and shorter travel time -- and choose transit, given the relatively low cost of driving and time lost to congestion typical of Sacramento in Unless community design changes prove successful, significant shifts from driving to bicycling or walking remain unlikely. SACOG's models were unable to examine definitively localized shifts to bicycling that might accompany community design changes, but at the regional level the share of bicycle and walk trips in 2025 stays at 6 percent. Intuitively, the incentives and improvements contained in community design should lead to more bicycling and walking. The major objective here would be to reduce VMT by shifting short local trips, not necessarily commuting and not necessarily during peak hours, although mixed-use developments might affect 8 The congestion index numbers were calculated for the MTP 2025, but not for the 2006 MTP. 31
34 commuting and community design might affect peak hour school trips to some extent. IN LOOKING AT ACCESSIBILITY IN THE MTP 2025, SACOG LEARNED THAT: Congestion reduces accessibility to job choices by auto. Accessibility represents the distance or number of opportunities that can be reached within a certain travel time. In Sacramento today, the average commute takes about 25 minutes, with most commute trips under 35 minutes. Going back 150 years, 35 minutes seems to represent a universal ceiling on average commute time, and nowhere in the country today does the average exceed that time. The spread of jobs to suburban locations slightly diminishes public transit accessibility to job choices. The accessibility index also measures the number of job centers reachable within a 45- minute period by transit. By 2025, accessibility to job centers by transit decreases by 10 percent region-wide. For transit, the average disguises a wide range of accessibility, from zero in areas without transit service, to as high as four in some areas with good Sacramento Regional Transit or Yolobus service. On a more specific level, transit accessibility improves in only a few areas, in suburbs of east and south Sacramento and Natomas, and along new Bus Rapid Transit routes. Other areas showed a slight decline that is generally due to congestion and spread-out destinations (requiring more bus stops), slowing down bus speeds. Lessened accessibility due to congestion hurts businesses by reducing potential customers, hampering truck deliveries, and shrinking their labor market. Both model data and SACOG's 1998 Suburban Travel Study show the accessible territory around business locations shrinking, particularly in certain directions. The American River as a barrier becomes prominent, because congestion at crossings becomes intermittent all day long. Even though between 2005 and 2027 jobs increase by around 40 percent or more in the three major job centers of downtown Sacramento/West Sacramento, Rancho Cordova/Folsom, and Roseville/Rocklin, the accessible labor market remains about the same in 2027 as it is now, increasing the competition for employees. Excessive congestion in San Jose became a factor in high tech businesses choosing to spread out to smaller cities such as Sacramento. Increasing congestion here could have a similar effect for our business base. IN LOOKING AT AIR QUALITY IN THE MTP 2025, SACOG LEARNED THAT: Technological advances in controlling auto and truck emissions that lead to ozone pollution overcome increases in vehicles and vehicle miles traveled over the 25-year period. The emissions that lead to ozone (NOx and hydrocarbons) decrease significantly due to auto technology improvements, some mandated by state law, and later by a gradual shift of the auto fleet to hybrid fuel and non-gasoline autos. Particulates (PM-10), mainly from diesel exhaust and stirred-up road dust, increase by 26 percent, but road travel contributes only about 15 percent of overall PM-10, so this increase amounts to a marginal 4 percent in the big picture. Carbon dioxide (CO 2 ) emissions, a natural product of the clean burning of gasoline and diesel fuel, increase by 49 percent, directly correlated to increased auto travel. The CO 2 increase comes out somewhat less than the 58 percent increase in VMT by 2025 because of a modest improvement in fuel efficiency for the entire fleet, at least partly due to hybrid and non-gasoline vehicles. CO 2 is a greenhouse gas linked in some manner to global warming, not a direct health risk. 32
35 Sacramento expects to attain federal clean air standards by about New, harder-to-meet federal standards (the 8-hour standards) have been approved effective June The region is now developing an interim Rate-of-Progress State Implementation Plan for Air Quality (ROP SIP) that will allow air quality conformity analysis and a finding for this plan. A new, full SIP for the region will be ready by mid The Yuba/Sutter air basin is now considered to be in attainment (except for the Sutter Buttes, which is considered a separate air basin). Late-model autos are 50 times less polluting than 20-year old models (and new hybrid fuel autos are better yet), so as older cars are retired to the junkyard, our air will get cleaner. A growing population slows down progress on air quality, by adding to VMT. Eventually, community design changes may lead to changes in travel patterns and lower VMT, but not in the short term. Other ways to cut pollution may be needed in the near term. FROM RESEARCH ABOUT ENVIRONMENTAL EFFECTS OF TRANSPORTATION PLANS, SACOG HAS LEARNED THAT: Natural environmental impacts would not be substantially greater from the projects in the plans, just different, and can be offset or mitigated for the most part. Impacts from development far outweigh those from the transportation accompanying it. For example, the projects in the MTP 2025 would lead to higher noise levels at 24 locations and lower noise levels at five, but overall road noise would increase anyway from a 58 percent increase in VMT region-wide. New bridges would affect riparian habitat along the rivers they cross, but so would increased traffic on existing bridges. Road projects nowadays usually skirt around sensitive sites, and routinely include mitigation where that is not feasible. Continuation of recent development trends would place 90 percent of new growth at the urban edge and consume at least another 100,000 acres for sprawl growth by Both the MTP 2025 and the 2006 MTP try to encourage different development patterns. Studies in Portland, Oregon, a region that has tried hard to control sprawl development, show that jobs move to the urban edge faster if access to the central business district is choked off by congestion. The 2006 MTP puts investment in a community design program primarily within the existing urban area. Community design programs show promising results in other cities. SACOG expects some success in reining in urban sprawl, but still expects at least 80 percent of growth to go around the urban edge. Community impacts can be significant, and impacts from a 58 percent increase in VMT region-wide would be substantial in any case. Rail lines and wider roads can divide communities, but also link those communities to jobs and activities. Widened roads carrying heavy traffic make impacts on the surrounding community and adjacent properties, but so does traffic cutting through neighborhoods to dodge congestion on an inadequate main road. The more sprawl development is reined in, the more traffic will need to use existing roads. The 2006 MTP offers minimal benefits for either lower-income communities or more affluent ones. Bus service and community circulator buses provide the most benefit in lower income areas. Community circulator buses could serve local trips to grocery stores, medical facilities, and other 33
36 public services to meet the basic needs of low-income populations, as well as improving connections to regular bus lines. The plan emphasizes investments inside existing urban areas, which would benefit those in low-income communities as much as or more than those in wealthier communities further out. The economies of Yuba City and Marysville have lagged somewhat compared to the rest of the region (and the State), with lack of freeway access a contributing factor. While the new expressways on Routes 65, 70, and 99 contained in the MTP 2027 would remove some low-cost housing, low-cost housing is plentiful in that area and the general economic boost for the whole area from better accessibility should be an overall benefit. HOW DO TRANSPORTATION MODELS WORK? SACOG S models contain several equations that tie together information about how people choose where, when, and how to travel, based on trip purpose, minimum time, and affordable cost. SACOG loads its models with five kinds of information: a map of the transportation system (both roads and transit routes); description of the performance of the system (speeds of travel on each link, the amount by which speed decreases as traffic increases, and the cost of travel); a map of land uses showing where people live, work, and do other activities; data from the Census about who lives where; and a description of people s daily travel behavior (where, how, and why people travel) learned from SACOG s regional travel survey. The models first calculate what would happen on the transportation system if everyone traveled where, when, and how they wanted to, based on known behavior, travel time, and cost. The models then make adjustments to account for traffic congestion, which causes some people to change where, when or how they travel based on saving time or cost. The adjustments may be calculated several times, and compared to actual counts of traffic and transit ridership. When models accurately represent today s known conditions, they are ready to estimate future conditions. SACOG then loads more information: a map of an expanded future transportation system (or several maps with different alternative future systems); some new information about future performance of the system; and a map of future land uses, making assumptions about the size of the population, the size of the employment base, and the places where new housing and businesses will be built by a certain future year. The models assume basic travel behavior will remain unchanged, that people will still travel for the same reasons in the future as they do now. The models then calculate, make adjustments until no significant change occurs from one adjustment to the next, and present the forecasted information. COULD MODELS GIVE INACCURATE INFORMATION? A model can give inaccurate forecasts if the information about current conditions or assumptions about future conditions or behavior are inaccurate. SACOG has high confidence about its models description of current conditions. Because those conditions can be checked against actual traffic and transit ridership counts. The model does not replicate unpredictable or unusual conditions, such as traffic accidents, road maintenance, or holiday travel patterns. Our understanding about how people make their travel choices is less precise, because it 34
37 is based on a survey, rather than comprehensive information collected and checked continuously. It remains possible but unlikely that the models show today s travel accurately, but for the wrong reasons. SACOG s model must overcome more uncertainties in forecasting future conditions, as would be the case for any kind of prediction about the future. The model is sophisticated enough to take into account, on a region-wide average, travel changes as a household evolves from a young family with working parents and children to a family with teenage drivers and eventually to a family of retirees, and other young families come along behind. In fact, the models can take into account many kinds of changes, but must specifically be told to do so. For example, travel cost may change due to higher gasoline prices, parking fees, or transit fares. New technologies could affect performance of the system; for example, connected traffic signal systems or autos with radar that can travel safely closer together. The reasons and ways people travel might change; for example, due to Internet shopping, telecommuting, or broader use of small, slow motorized vehicles like golf carts or scooters. Clearly, things could evolve in different ways by Changes such as these require SACOG to envision future conditions based on the way things look now, and tell its models what to assume. A model s calculations will be no better than the vision and instructions it is given. Future land use patterns generated the most contention. SACOG estimated future land uses based on policies of current local General Plans, but development could unfold differently. SACOG tried to develop a more sophisticated transportation model that not only would adjust travel patterns away from highly congested areas, but was unable to get it ready to use in time for this plan. Alternatively, SACOG could have developed one or more arbitrary different future land use patterns and loaded them into its models, but chose not to do so because the work would have been labor-intensive and costly with no up-front consensus as to what alternative patterns to use. Historically, General Plans have not reflected future development patterns very accurately, so the model s forecasts do carry some risk of inaccuracy here, but still remain the best information available. 35
38 6. THE CONTENTS OF THE 2006 MTP WHAT IS THE RATIONALE FOR THE 2006 MTP PRIORITIES? The 2006 MTP prioritizes improvements both for transportation deficiencies evident in 2002 and those expected to emerge through The following discussion lays out the need and the purpose for the regional-scale improvements contained in this plan. The amount and variety of travel in the major urban corridors shows the need for a combination of investments in better public transit (both local and express), road capacity (for carpools on the freeways and for all autos on arterials), new technology, bicycle and pedestrian facilities, and improved community design. Inside the urban area, the plan proposes giving priority to the worst congestion points first. Beyond the urban area, the plan proposes to complete good state highway connections in all directions, incrementally by For the MTP 2025, SACOG examined the region's future with its travel model, to help inform decisions about where and when to invest in improvements. The model provided new understanding about travel patterns, particularly about where people want to go during peak periods when the transportation system becomes congested. The analysis found: Growing suburb-to-suburb travel, between residential areas in southern and northeastern Sacramento and new job centers in Rancho Cordova and Roseville; Continuing growth in commuting into downtown Sacramento and West Sacramento, driven by continuing office and industrial growth; Increasing economic activity back and forth on the region's core corridor along U.S. 50, all day long; Emerging commute patterns from rural and far suburban areas to new job centers near the urban edge, in Rancho Cordova, Roseville, Natomas, and West Sacramento; Overlapping traffic patterns on all major corridors, with non-stop through traffic intermingled with traffic stopping at a local destination along the way; and Burgeoning problems at certain key bottlenecks, principally river crossings and major arterials lined with commercial development near freeway interchanges. WHAT ARE THE SPECIFIC NEEDS AND THE KEY PROJECTS DESIGNED TO MEET THEM? The funding in this plan supports an extensive lineup of improvement projects, both regional and local, and other programs to maintain and operate roads and transit services, bring new technologies on line, change community design, and attain clean air. A list summarizing the 36
39 projects and programs of the Plan is found in Table 6, and a complete listing of the details is found in Appendix E. From a regional viewpoint, the need for new connections along two major travel corridors, now carrying traffic typical of a freeway corridor but on arterial roads only, stand out: 1. The first will connect the business centers in Rancho Cordova and Roseville, and the residential communities in between. This corridor is now served by Watt Avenue, Sunrise Boulevard, and Hazel Avenue/Sierra College Boulevard, all notable for congestion and lack of adequate transit service. 2. The second will connect residential and business areas along an Elk Grove/Rancho Cordova/El Dorado Hills corridor. This corridor is now served by several mostly two-lane roads: Bond, Sheldon, Calvine, Grant Line, Bradshaw, Sunrise, and White Rock Roads, all becoming congested in recent years and served by no direct transit operations at all. (See Table 7 for a listing of projects that comprise the connectors.) To a significant degree, congestion on two freeways Route 99 and Capital City Freeway stems from a combination of traffic bound for Rancho Cordova by way of U.S. 50, using the freeways to avoid congestion on more direct arterial roads, and traffic bound for downtown Sacramento. Communities along corridors in eastern and southern Sacramento County have in the past rejected a freeway or beltway, so this plan proposes a high-capacity expressway/arterial roadway, such as the existing Madison Avenue or 65 th Street, but including preservation of open space at strategic locations to avoid drawing growth into areas not zoned for growth. It also would add Bus Rapid Transit in the corridors, along Watt Avenue, Grant Line Road, and Sunrise Boulevard. The computer model shows five other economic and commute corridors in urban Sacramento needing more capacity: along U.S. 50 between Yolo and El Dorado Counties; into downtown Sacramento, particularly from the north; between Roseville and Sacramento/Natomas; between the South area and downtown Sacramento; and across the American River. Major regional-scale corridors need capacity for all forms of travel (light rail, commuter rail, express bus, local bus, carpools, autos, and bicycles) complementing each other, since different forms are better suited for particular kinds of trips. This plan includes major improvements to four of these corridors: Along U.S. 50, by extending rail westward to West Sacramento, putting in commuter rail service between Davis and Sacramento, adding carpool lanes from Davis to West Sacramento and from downtown Sacramento to Shingle Springs in El Dorado County, improving arterial street access onto the corridor (particularly near Sacramento State University), and expanding ramps on the freeway interchanges at I-5 and the Capital City Freeway; 37
40 Table 6. Plan Summary Total Cost: $27.4 Billion The plan is constrained by reasonably expected revenues. It has been found to conform to air quality laws. Regional Programs: $1.3 Billion Clean Air ($200 million + $69 million from existing SECAT program) Bicycle and Pedestrian projects that are regional priorities ($390 million) Community Design plans and projects to support smart growth ($560 million) Transportation demand management ($50 million) Landscaping and other enhancements ($22 million) Public Transit: $9.1 Billion Continued expansion of the Capitol Corridor train service to 16 daily trains to the Bay Area. Commuter rail service between Davis/Dixon and Auburn using the UP/Amtrak facilities. Light rail extended to Natomas Town Center and Sacramento International Airport, from Meadowview to Cosumnes River College and Elk Grove, from Watt to Antelope, and a streetcar line from Downtown Sacramento to West Sacramento. Bus service significantly increased in Sacramento County to 400 buses in service compared to 190 today. Bus rapid transit in three commute corridors, including Stockton, Watt, and Sunrise. Expansion of bus and van service region-wide, including a large increase in service for elderly and disabled persons. Roads, Highways and Bridges: $9.3 Billion A Rancho Cordova to South Placer Multi-Modal Connector. A Placer Parkway connecting Roseville at Route 65 to Routes 99/70 near Sacramento International Airport, incorporating conservation easements. Multi-modal connectors between El Dorado County, Rancho Cordova and Elk Grove, with protected open space components. A replacement bridge over the American River for the Folsom Dam Road. A third Feather River Bridge near Marysville/Yuba City. Highway projects as detailed on the project list, including bypasses, interchanges, carpool lanes on I-5, I-80, and U.S. 50, and improvements on Routes 99 and 70. Intelligent transportation systems projects including smart corridors on Arden Way, Watt Avenue, and Greenback/Sunrise Boulevard. Local road projects as detailed in the project list, including developer-paid projects. Road Maintenance: $6.2 Billion Catch up on local road maintenance in Sacramento County, but $860 million in maintenance and rehabilitation needs remain in all other counties. State highway maintenance keeps up with need. Local Bicycle and Pedestrian: $281 Million Projects or programs, or can be used to match the regional program. Undefined Projects: $220 Million $80 million of flexible funding for access across the American River between Howe and Hazel. $140 million from federal discretionary programs. 38
41 TABLE 7 CONNECTOR PROJECTS PLACER PARKWAY Placer Parkway Study a new transportation facility between Route 65 to Route 99; $4,700,000; 2005 (PLA20720) Placer Parkway Phase 1 In Placer County, construct new two-lane roadway between Route 65 and Route 99; $370,000,000; 2027 (PLA20721). This project includes Route 99, new interchange Sutter County, north of Sacramento; along Route 99 between Riego Road and Sankey Road, construct new interchange. The Placer County portion of the entire project is $238,000,000; the Sutter County portion is $132,000,000. Placer Parkway Protect open space to north and south of Placer Parkway, in western Placer County; $30,000,000; 2016 (PLA20723)* Total: $404,700,000 RANCHO CORDOVA SOUTH PLACER CONNECTION I-80 Widen existing Sierra College Boulevard Interchange from two to four lanes, including the on- and offramps and loops; $28,548,000; 2007 (PLA19490) Sierra College Boulevard In Rockin, Sierra College Boulevard from El Don to Nightwatch; widen from two to four lanes; $950,000; 2010 (PLA20460) Sierra College Boulevard Widen Sierra College Boulevard from two to four lanes from I-80 interchange to Rocklin Road; $1,800,000; 2007 (PLA20470) Sierra College Boulevard Widen Sierra College Boulevard from four to six lanes from Aguilar Tributary- Nightwatch; $2,170,000; 2008 (PLA20500) Eureka Boulevard Widen from two to four lanes, from Sierra College to city limits; $500,000; 2012 (PLA15720) Roseville Parkway Extend Roseville Parkway over Union Pacific Railroad tracks; $4,900,000; 2010 (PLA20970) Sierra College Boulevard Widen Sierra College Boulevard from Olympus Drive to north city limits from two to four lanes; $3,700,000; 2006 (PLA20250). Sunrise Avenue Widen from four to six lanes from Sacramento County line to Madden lane; $5,000,000; 2015 (PLA15890) Sierra College Boulevard South Rocklin city limits to Douglas; widen road from two to four lanes; $3,700,000; 2006 (PLA15600) Sierra College Boulevard Widen from four to six lanes from N. of Douglas to Sacramento County line; $5,000,000; 2020 (PLA20710) Sierra College Boulevard Widen to six lanes from the Interstate to Aguilar Tributary; $2,000,000; 2007 (PLA15400) 39
42 Sunrise Boulevard Widen Sunrise Boulevard from four to six lanes including a raised median from Antelope Road to Placer County; $6,200,000; 2022 (SAC16910) Sunrise Boulevard Widen from four to six lanes including raised median from Oak Avenue to Antelope Road; $7,634,906; 2016 (SAC16920) Sunrise Boulevard Widen from four to six lanes, Arcada Drive to Oak Avenue including bike lanes, landscaping, and pedestrian facilities; $8,750,000; 2019 (SAC22440) Greenback and Hazel Build tunnels to underground the intersection of Greenback and Hazel; $20,000,000; 2025 (SAC23300) Hazel Avenue Widen American River Bridge and approaches from four to six lanes and widen Hazel from American River Bridge to Madison from four to six lanes with bike lanes and signals; $85,000,000; 2010 (SAC21500) Hazel Avenue Widen from four to six lanes from Madison to Sacramento/Placer County line; $77,500,000; 2017 (SAC23080) Sunrise Boulevard Bus Rapid Transit Implement Bus Rapid Transit on the Sunrise Boulevard corridor; $30,000,000; 2013 (REG17430) Hazel Avenue Add carpool and transit capacity between Madison Avenue and U.S. 50; $30,000,000; 2019 (SAC15370)* Hazel Avenue Add grade separation, ramps, and frontage connections at Gold River Road; $20,000,000; 2018 (SAC15380)* Hazel Avenue Add undercrossing, turn ramps, and community enhancements at Greenback Lane; $20,000,000; 2021 (SAC15390)* Hazel Avenue Improve Madison Avenue intersection; $20,000,000; 2017 (SAC15400) Sierra College Boulevard Improve Douglas Boulevard intersection; $10,000,000; 2023 (PLA15590)* Sierra College Boulevard Improve Roseville Parkway intersection; $10,000,000; 2019 (PLA15610)* Total: $403,352,906 ELK GROVE RANCHO CORDOVA EL DORADO CONNECTOR White Rock Road Realignment In El Dorado County, White Rock Road from Manchester Drive to Latrobe Road; realign and construct improved two-lane roadway; $2,226,356; 2006 (ELD10100) White Rock Road Widen White Rock Road from the Sacramento/El Dorado County line to Latrobe Road from two to four lanes; $1,708,000; 2006 (ELD10090) Route 99 Reconstruct the Grant Line Road/Route 99 interchange; $57,680,000; 2007 (CAL20520) Alta Sunrise Boulevard Construct a six-lane roadway from U.S. 50 to International Drive extension. This includes a south-only interchange with U.S. 50 and pedestrian and bicycle facilities; $45,000,000; 2015 (SAC22980) Grant Line Road Widen from Bond Road to Sloughhouse Road from two to four lanes; $11,000,000; 2010 (SAC19670) 40
43 Grant Line Road Widen from Sloughhouse Road to Sunrise Boulevard from two to four lanes; $4,000,000; 2011 (SAC19660) Sunrise Boulevard Widen from north of Douglas Road to Grant Line Road from two to four lanes; $7,000,000; 2009 (SAC19710) Sunrise Boulevard Widen from Route 16 to north of Douglas Road from two to four lanes; $15,000,000; 2016 (SAC19711) Grant Line Road Add frontage roads to connect various local access roads that intersect Grant Line Road between Elk Grove Boulevard and Sloughhouse Road; $25,000,000; 2014 (SAC20510)* Grant Line Road Widen from two to four lanes, Route 99 to Bond Road; $12,000,000; 2012 (SAC20530)* Sunrise Boulevard Add overcrossing and ramps at Route 16; $20,000,000; 2014 (SAC19720)* White Rock Road Realign and widen with shoulders form Sunrise Park Drive to El Dorado County Line; $20,000,000; 2017 (SAC23220)* Kammerer Road Construct a four-lane roadway from Grant Line/Route 99 interchange to I-5 at Hood Franklin Boulevard. Can be changed to widening of existing streets; $18,443,980; 2016 (SAC29905) Four-lane parkway connecting I-5 and Route 99 (upgrade of Kammerer Road project); $31,556,020; 2021 (SAC29905)* New Road Construct a new four-lane limited access road from Grant Line Road/White Rock Road through Aerojet s property to U.S. 50 near Hazel Avenue; $9,335,000; 2015 (SAC23160)* Open space acquisition - $15,000,000; 2010 (SAC23175)* Total: $294,949,356 *Please note: For the purpose of modeling and costing, placeholder projects without sponsoring agencies have been created. Studies will determine the final projects. 41
44 Into downtown Sacramento from the north, by extending light rail north to Natomas and Sacramento International Airport, adding carpool lanes to I-5, and improving arterials into and through the downtown rail yards via Northgate Boulevard and Route 160; Between Roseville and Sacramento, by extending light rail northeast to Antelope Road and double-tracking for express service, putting in commuter rail service between Sacramento and Roseville (extending to Auburn), adding carpool lanes on I-80, expanding ramps on the freeway interchange at I-80/I-5, and constructing the Placer Parkway to offer an alternate route to relieve traffic on I-80; and Into downtown Sacramento from the south, by extending light rail south to Cosumnes River College and Elk Grove, adding carpool lanes on I-5, and building a direct route for traffic from the south area to Rancho Cordova to relieve traffic on Route 99. The plan also accounts for local funding with which local agencies would improve parallel arterials and bus service, including both local buses and express bus service using freeway carpool lanes, in each of these corridors. The 2006 MTP also recognizes the need to continue good access among all parts of the regiongreater urban Sacramento, Davis, Woodland, Yuba City, Marysville, Lincoln, Auburn, Placerville, and smaller communities-to support economic activity and development, as these areas and traffic levels grow. The biggest challenge involves extending four-lane state highway connections northward, via Routes 70, 99, and 65. The MTP 2025 includes building four-lane expressways in all three corridors: On Route 70, bypassing East Nicolaus and later Marysville, extending north to Butte County and Oroville, On Route 65, bypassing Lincoln and later Wheatland, and extending to Yuba City via a new third bridge across the Feather River, and On Route 99, from Route 70 north to Yuba City. The 2006 MTP funds local street and road improvements, such as intersection improvements, safety projects, signal timing, widening in growth areas, and new connections for local access. Local road improvements, including road widenings, intersection improvements, and roads serving new developments, have been included in the plan by local jurisdictions. Some of these projects may be funded using state or federal funds, but many are funded wholly or in part by local developers or development fee programs. The 2006 MTP proposes further study of access needs across the American River, and sets aside $80 million of flexible funding for future unspecified improvements. The American River Parkway is both a marvelous open space and recreational asset and a huge barrier to transportation. All alternatives to improve access across the American River, from the Capital City Freeway east to Hazel Avenue, where all bridges are congested today, proved too controversial in surrounding 42
45 neighborhoods and communities for the MTP 2025 or this plan to propose any specific improvements. The challenges for the transportation system posed by the American River will not go away, but solutions require more study and planning, and possibly more pressure from worsening traffic conditions. Sacramento County is currently working on these further studies. The 2006 MTP includes projects that will help manage the flow of traffic on the highways and arterials, using new technologies. Intelligent Transportation Systems (or ITS) projects -- "smart corridors" -- can smooth the flow of traffic on Watt Avenue, Greenback/Sunrise, and Arden Way. Signal preemption systems will be installed for transit and emergency vehicles, as well as freeway ramp meters, message signs, and cameras. Freeway service patrols will continue to clear accidents and vehicle breakdowns quickly off of the freeways. Appendix C includes more information about ITS plans and projects. Caltrans is expected to spend $2.8 billion through 2027 maintaining and rehabilitating the highway system and the 2006 MTP reserves $5.1 billion (in mostly local funds) for local road and bridge maintenance and rehabilitation. Even so, more than $2.5 billion in local road maintenance and rehabilitation will be deferred due to inadequate state gas tax funding. The region supports efforts to provide additional funding from source(s) not yet determined to overcome this shortfall during the upcoming 25 years. The 2006 MTP reserves regional funds for programs that are important to achieving regional goals: bicycle and pedestrian improvements, community design incentives, open space, travel demand management, clean air, and enhancement programs. Bicycle and pedestrian access improvements in the 2006 MTP are not specified, pending the results of applications to the Bicycle and Pedestrian Funding Program. The plan includes $350 million in regional funds for projects that are prioritized in SACOG s Bicycle, Pedestrian and Trails Master Plan, adopted in In addition, around $200 million in local funds is included for bicycle and pedestrian projects and it is expected that most or all road improvements will include provisions for better bicycle and pedestrian use. The Community Design grant program, which pays for capital and planning grants to local governments and for bicycle, pedestrian, and streetscape improvements that accompany "smart growth" projects, will encourage local trips and the use of alternative modes of transportation. Appendix B is an excerpt from the Community Design program guidelines and shows a list of projects that have been approved by the SACOG Board of Directors for the first round of funding. These projects are included in the 2006 MTP project list, unless already completed. SACOG intends to protect open space in this plan in the form of land easements accompanying regional connector roads. Investment in the transportation system near the urban edge offers opportunities to set aside open space and direct development to areas that designated for good access. 43
46 Transportation demand management programs such as the regional rideshare program, marketing of alternative modes of transportation, and incentive programs for carpooling, vanpooling, bicycling, walking, telecommuting, and using public transit will encourage people to use alternative forms of travel and cut down on driving. These programs are included in the 2006 MTP. The regional rideshare program is a continuing transportation control measure (TCM) first adopted in the 1982 State Implementation Plan. The 2006 MTP includes a regional air quality program that provides incentives for implementing clean air technology, travel reduction, and other effective air quality strategies, until the region reaches a clean air status. These programs can include continuation of the annual "Spare the Air" campaign conducted by the Air Districts as well as the SECAT program for installing cleaner operating engines in heavy-duty diesel truck. Most of the improvements proposed in this plan are needed now, or at least in the next few years. The funding, however, is spread across all 22 years, and gradually ramps up from $925 million in the earlier years to $1.4 billion in later years. Thus some improvements must await funding. The region intends to proceed with environmental studies and engineering for many of the major improvements proposed in this plan. Once consensus has been reached to proceed with construction, the region intends to examine financing opportunities that could allow funds to be advanced and needed projects built sooner. Sacramento County s new Measure A sales tax extension, for 2009 to 2039, will be a source for financing early project construction, but the projects and schedule for bonding have not yet been identified as of early
47 7. PAYING FOR THE 2006 MTP WHERE DOES $27.5 BILLION COME FROM? The MTP 2025, upon which this 2006 MTP is based, projected $22.5 billion of funding available to pay for its list of projects. For a full discussion of these revenue projections, please refer to the MTP 2025 document. An updated revenue projection has been developed for the 2006 MTP, as explained below. The funding to support the 2006 MTP is complex to explain and understand, and comes from many sources-federal, state, and local-each with specific purposes and restrictions, totaling $27.5 billion during the 23 years, The region expects the following transportation funding and investments: Federal funds totaling $5.8 billion, with $5.4 billion (93 percent) coming from the Federal Highway Trust Fund (backed by an 18.3 cent per gallon federal gas tax) and $400 million (8 percent) from federal general funds. Of these federal funds, $1.6 billion must be used for roads and $1.6 billion can only be used for transit, with the remaining $2.6 billion usable for either. Congress has set up most federal programs to build projects-less than 10 percent of federal funds can be used to pay for maintaining roads or operating transit services. State funds totaling $4.7 billion, with $4.2 billion (89 percent) coming from the State Highway Account (backed by an 18 cent per gallon state gas tax) and Proposition 42 (sales tax on gasoline) and $530 million (9 percent) from various other funds. Of these state funds, $2.2 billion must be used for state highways and $700 million can only be used for transit, with the remaining $1.8 million usable for either. The state Legislature, like Congress, uses most state programs to build projects, but Caltrans ends up using about one-third of the state funds for state highway maintenance. In addition, about one-quarter of the state transit funds can be used for operating costs. The rest must be used for construction projects. Local funds totaling $12.9 billion, from the local share of gas taxes, local sales taxes, transit fares, general funds, and fees from development. Of these local funds, approximately $6.4 billion must be used for roads, $5.7 billion must go to transit, and the remaining $800 million can nominally be used for either purpose. Voter-approved sales tax programs, in fact, specify how funds may be used. Most local funds can be used for operations and maintenance, and in fact, must be used for those purposes, because most other federal and state funds cannot be. Developer-built major roads worth $4.1 billion, with the developer doing the construction. These roads are built or improved specifically as part of new developments and include an estimated $1.7 billion for arterial streets and $2.4 billion for new local residential streets inside developments. 45
48 The MTP 2025 assumed, and the 2006 MTP continues to assume, some revenue increases in line with historical trends. Five times in the past 23 years, Congress or the Legislature increased federal or state gas taxes, so the 2006 MTP assumes similar increases during the next 21 years. Likewise, Sacramento Regional Transit increased transit fares periodically, and the 2006 MTP assumes that will happen in the future also. The current 1/2 percent sales tax for transportation in Sacramento County (Measure A) was renewed in the fall of 2004, and at 1/2 percent through 2039, and the MTP assumes an additional Measure B at a level of 1/4 percent, starting in 2016, which would yield the same overall revenue through 2027 as the previous assumptions. No decisions have yet been made that indicate 2016 would be a preferred target date to implement a Measure B, and, unlike in 2002, both Yolo and Placer Counties are now considering local sales taxes of their own, though implementation remains undecided there too. The 2006 MTP also presumes that the region will continue to receive funds from federal discretionary programs (not guaranteed to this region) at a rate comparable to recent years. Table 7 lays out revenue forecasts year by year. Those wanting more detail about revenue assumptions should refer to Appendix D. The MTP 2025 also contemplated more speculative revenue increases, with no historical precedent, because additional funding is needed, however these are not included in the 2006 MTP. These included transportation sales taxes in the five counties beyond Sacramento, which do not have them now, plus a region-wide gas tax, for which SACOG presently has no statutory authority, which could bring in additional revenues. WHAT RESTRICTIONS COME WITH THESE FUNDS? As noted above, Congress, the Legislature, voters, and various laws restrict the uses of most transportation funds to specific purposes. The region and local agencies cannot always satisfy their most critical needs or highest priorities because of these restrictions. For example, $16.3 billion can only be used for roads and $8.0 billion can only be used for transit. That still leaves $3.3 billion usable either way. The most critical restrictions force the region, local agencies, and Caltrans to use at least $14.9 billion for construction projects. That leaves only $12.6 billion available to pay for road maintenance and transit operations. SACOG heard different views around the region as to whether $14 billion is enough for construction, but the amount remaining and the way it gets distributed around the region put a squeeze on both road maintenance and transit service. One critical funding squeeze falls on road maintenance in El Dorado, Placer, Sutter, Yolo, and Yuba Counties. Caltrans and the region's six counties and twenty cities report significant road and highway maintenance and rehabilitation needs out to 2027, including an $800 million backlog of deferred maintenance as of Caltrans expects to get enough funding to take care of state highway maintenance, and Sacramento County jurisdictions need to defer less road maintenance with continuation of the current 1/2 percent sales tax for transportation beyond The other five counties, however, face an estimated $2.7 billion in road maintenance and rehabilitation needs, including a $475 million backlog of deferred maintenance as of 2002, with only about $1.2 billion in local funds available. The region confronts a difficult choice: use regional capital funds for road rehabilitation and forego improvements to support regional economic vitality and development, or 46
49 seek more local funding to take care of the road rehabilitation need, in small counties with limited tax bases. Another critical funding squeeze effectively puts a cap on transit service in Sacramento County. Sacramento Regional Transit (RT) forecasts a need for more than $3 billion to continue operating the bus and light rail system it has now through Fare revenues will provide only 30 percent of this amount, and another 30 percent currently comes from Sacramento County's 1/2 percent sales tax for transportation (one-third of which supports RT operations). Even with the renewal of Measure A at 1/2 percent through 2039, RT may only be able to afford to build and operate two light rail extensions and expand its bus service by about 50 percent by This falls far short of RT's 20-Year Vision in the MTP 2025, under which RT's 23-year operating cost would rise to nearly $5 billion. The region again confronts a difficult choice: if it wants more transit service in urban Sacramento, voters must agree to increase the sales tax by another 1/4 percent, with all of that going to transit, or find about $40 million per year from some other source. The 2006 MTP assumes that the voters who approved a continuation of the 1/2 percent sales tax for transportation in Sacramento County in 2004 will agree to an additional 1/4 percent increase by This discussion points out an important trend: looking ahead to 2027, sales taxes become the key source of transportation funding, instead of gasoline taxes. Sales tax revenues increase with both economic growth and inflation. On the other hand, gasoline taxes are pegged in cents per gallon, and will inevitably decline, as autos generally become more fuel efficient, and hybrid and alternate fuel cars become more common. In urban counties at least, voters have historically proven willing to approve sales taxes for transportation, while the Legislature has proven unwilling, for at least the past thirty years, to raise the local share of gas taxes to keep up with road maintenance and rehabilitation costs. Sales taxes already play a leading role in supporting the region's two most critical needs, covering more than half the cost of transit operations in this region, and rivaling the gas tax as a funding source for road maintenance. WHO DECIDES HOW TO SPEND THE $27.5 BILLION? Of the $27.5 billion, roughly 18 percent comes to the region, 21 percent belongs to Caltrans, and the remaining 61 percent is available to local agencies (counties, cities, and transit districts). Federal law (both TEA-21 in 2002 and now SAFETEA-LU) requires urban transportation plans to be financially constrained, which limited what the MTP 2025 could include to revenues reasonably expected to be available. The 2006 MTP again commits the projected revenues to a proposed list of projects, essentially the same list as in the MTP 2025 except for projects completed during the years Most regional funds come to SACOG, but a portion goes to two other regional agencies: Placer County Transportation Planning Agency and El Dorado County Transportation Commission. Table 7 shows revenues by year and Table 8 estimates how the region would use the funds. 47
50 Table 8: REVENUE ESTIMATES - SUMMARY BY YEAR - MTP for (millions of current dollars de-escalated to 2005) GRAND TOTAL Funds to the Region STIP:RTIP share - state to region $1,860.4 CMAQ - federal to region $484.4 Regional STP - federal to region $488.7 FTA 5307 transit formula - federal to region $539.5 FTA 5309 rail formula - federal to region $97.3 FTA 5309 bus - federal to region $80.0 FTA 5309 New Rail Starts-federal to region $682.7 FTA 5310 E&H transit - federal to region $11.1 FTA 5311b rural transit - federal to region $16.4 State Transit Asst. (STA) - state to region $189.3 Federal discretionary pgms. - to region $417.2 SUB-TOTAL $4,866.9 Funds to the State (Caltrans) STIP: ITIP share - state $1,253.2 Intercity Rail - state $284.5 Traffic Congestion Relief Pgm - to local $116.0 SHOPP - state $2,750.0 St.Hwy. maintenance - state $1,218.0 SUB-TOTAL $5,621.7 Funds to Local Agencies STP (for FAS) - federal to region to local $40.7 Transport'n Development Act(TDA) - local $2,396.3 Gas tax subventions - state to local $2,242.6 Sales tax (Measure A) at 1/2% - local $3,024.7 Sales tax (Measure B) at 1/4% - local $929.2 Transit fares - local $1,349.9 Impact fees from development - local $1,631.5 Private developer in-kind projects - local $4,064.6 Special district funds - local $299.2 General funds and other (roads) - local $396.0 General funds and other (transit) - local $176.0 Caltrans Discretionary to Local Agencies $409.0 SUB-TOTAL $16,959.7 TOTAL - All funds 1, , , , , , , , , , , , , , , , , , ,485.9 $27,448.2
51 Table 9: Summary of Funding and Expenditures TOTAL State Highway Capital $2,049,000,000 Local Road Capital $6,094,000,000 Transit Capital $2,940,000,000 State Highway Rehabilitation and Maintenance $2,750,000,000 Local Road Rehabilitation/Maintenance $5,835,000,000 Transit Operations/Maintenance $6,222,000,000 Other** $1,558,200,000 Sub-total of Committed Funds $27,448,200,000 Total Funding Available $27,448,200,000 ** Other includes community design, clean air, bicycle/pedestrian, demand management/carpool match, and undefined projects. The region expects to receive $3.5 billion in federal and state funding for projects, plus another $1.4 billion in federal transit funds to be passed through to local transit agencies. SACOG intends that funds coming to the region be used for regional-scale projects, either in the 2006 MTP or in future MTPs: to fund clean air programs, community design initiatives, connections serving downtown Sacramento and suburban job centers, more capacity in highdemand corridors, light-rail system extensions, ramp improvements at congested freeway interchanges, improvements to promote bicycle travel, and use of new technologies for better system operations. The region has made few improvements to the capacity of the regional-scale system-freeways, light rail, and major arterials-in the past twenty years, during which time most extra capacity built into the system in the 1960s and 1970s has been consumed by growth in travel and traffic. The MTP 2025 presented an opportunity to begin those long-overdue investments. The 2006 MTP forecasts that Caltrans will receive $5.6 billion during the next 23 years for state highways and intercity rail service. Of this amount, $4.1 billion will go for state highway maintenance and rehabilitation, from Caltrans' annual budgets. Another $321 million will pay for intercity rail service, mainly the Capitol Corridor trains, with 85 percent of it going to operating costs. SACOG expects Caltrans to invest $1.2 billion into state highway improvements in this region, from its program that funds interregional highway improvements statewide. That amount is based on an estimate of this region's share of the larger program, not on what improvements are needed. Indeed, SACOG expects to have to invest an additional $1.1 billion into state highway improvements using regional funds, representing one-quarter of the regional program. Local agencies control the remaining $17.0 billion, with which they must maintain local streets and roads, operate transit services, and fund local improvements. The MTP
52 identified street and road maintenance and operation of transit services as primarily local responsibilities, with limited regional support, so that regional funds could be used for regional needs. The 2006 MTP shows $3.8 billion available to local agencies for street and road maintenance and rehabilitation. The 2006 MTP shows $4.6 billion in locally controlled funds available for operation of transit services region-wide. The remaining $4.6 billion comes from funds restricted to construction projects, which local agencies can use for improvements such as traffic signals, turn lanes, street and road widenings, highway interchanges, bike lanes, sidewalks, bus stops, and new buses. In the MTP 2025, SACOG expected to supplement local investment with regional funds: $1.8 billion for rail transit expansion and new and replacement buses, $600 million for road improvements, $500 million for community design, and $600 million for bicycle, pedestrian, and clean air programs. IS THIS FUNDING ENOUGH? $22.5 billion was not enough to fund the needs identified in the MTP 2025, but $27.5 billion is still inadequate for the needs of the 2006 MTP. In the MTP 2025, local agencies would be short an estimated $2.5 billion for road maintenance and rehabilitation, especially in the rural counties. The $2.5 billion represents 30 percent of the total need region-wide, but 50 percent of the overall need in the five rural counties. Sacramento would not have enough money to operate the amount of transit service needed in an urban region of 2.8 million people. The $4.3 billion projected to be available fell 19 percent short of covering Sacramento Regional Transit's 20-year Vision Plan. Even though about $7.6 billion would be available for highway and road improvements in the MTP 2025, this fell short by at least 30 percent in trying to keep up with an expected 40 to 50 percent increase in traffic, so congestion would worsen. The MTP 2025 anticipates $500 million in bicycle and pedestrian improvements, but SACOG has a list totaling $750 million now and has completed a regional bicycle and pedestrian master plan that will add to this amount. SACOG expects $500 million for community design to show the way to new development patterns different from suburban sprawl. To achieve meaningful success on a regional scale, private developers and local redevelopment agencies must decide to invest seriously in community design as well. As of now, SACOG can see no other sources of funds likely to be dedicated to transportation to deal with these shortfalls. 50
53 8. IMPLEMENTING THE 2006 MTP HOW DOES THIS 2006 MTP LEAD TO PROJECTS GETTING BUILT? The MTP 2025 provided a long-range vision for short-term transportation funding decisions, and the 2006 MTP continues this vision into implementation. SACOG assigns federal and state funds to carry out projects from the long-range plan, through a series of documents called Transportation Improvement Programs, or TIPs. Any agency using federal or state funds for projects must deal with as many as four different kinds of TIPs: Regional Transportation Improvement Program or RTIP -- SACOG specifies projects to receive federal and state funds made available by the California Transportation Commission, going out five years into the future. The RTIP serves as an application to use the federal and state funds for the projects specified. State Transportation Improvement Program or STIP -- the California Transportation Commission brings together RTIPs from all over the state into the STIP, which extends five years into the future. The Commission authorizes the use of state funds for all the projects included as well as a federal program, Transportation Enhancements Activity (TEA). Metropolitan Transportation Improvement Program or MTIP -- SACOG specifies projects to receive three types of federal funds granted directly to the region: Regional Surface Transportation Program (RSTP), Congestion Mitigation and Air Quality (CMAQ), and various Federal Transit Administration funds, going out three years into the future. SACOG sends the MTIP to Caltrans, including both projects funded directly and projects contained in the STIP, and it serves as an application for all projects to receive federal funding of any type. This MTP will be accompanied by a new MTIP. Federal Transportation Improvement Program or FTIP -- Caltrans packages MTIPs from all over the state into the FTIP, which covers three years into the future, and sends it to the Federal Highway Administration and Federal Transit Administration. The federal agencies currently approve the FTIP by October of even-numbered years, and authorize the use of federal funds and consideration of federal permits for the projects specified. The process to prepare and approve the series of four TIPs takes a year, with public review and approval at the local, regional, state, and federal levels in sequence. This process involves counties, cities, and transit districts seeking federal funds for their projects, SACOG selecting which projects to fund, and two state agencies and two federal agencies reviewing and approving the projects, funding amounts, and schedules for work. From time to time, SACOG may amend the TIPs, with approval by the other agencies involved when projects or costs or schedules change, a process that takes up to three months. The TIPs must satisfy three federal and state requirements: 51
54 1. Implementation of the MTPs -- By law, TIPs are used to implement the regional transportation plan (called the MTP in the SACOG region), so all projects in upcoming SACOG TIPs must come from or be consistent with the current MTP, with the priorities expressed in the MTP as a guide as to which projects to fund next. 2. Financial Constraint -- All projects must have enough funding assigned to them to complete work, and the total cost of projects in the TIP cannot exceed an estimate of the total amount of funding expected to be available. 3. Air Quality Conformity -- SACOG must analyze the projects in the TIP, using a prescribed computer model and process, and find that those projects, if completed, would not contribute to air pollution that exceeds an amount specified in the region s clean air plan, which in turn is based on requirements or standards in federal air quality law. These same three requirements also apply to TIP amendments, whether projects are being added, modified significantly, or taken out. For a project to move forward to construction, it must be included first in the MTP and the most recent TIP, but those steps are more the beginning than the end of the story. The TIPs authorize SACOG and state and federal agencies to provide funding for four phases of actual project work: environmental studies, engineering and design, acquisition of rights of way, and construction. Once the agency doing the work is ready to start a project or continue to the next phase, it must ask the appropriate agencies to allocate funds from the TIP to the project, a process that can take a couple of months. This 2006 MTP guides investment of transportation funds 22 years into the future, between 2006 and 2027, by laying out a general sequence of improvements and projects. MTPs must be reexamined and updated at least every four years, but this 2006 MTP will be updated in 2007 (it will be called the MTP 2030), when a new 8-Hour State Implementation Plan for Air Quality has been completed and the Blueprint-based 2030 land use allocations can be used as a basis for the transportation system. The process of developing the MTP 2030 has already been started with a major public outreach effort. Agencies may proceed with project work once programmed funds have been allocated from the TIP to the specific project. Planning and programming thus follow a cycle, normally repeating every two or three years, closely linked. The newest federal transportation legislation, SAFETEA-LU, specifies a four-year cycle for regional transportation plans, and SACOG will modify its MTP- MTIP cycle accordingly. WHAT PROJECTS GET BUILT FROM THE 2006 MTP DURING THE NEXT THREE TO FIVE YEARS? The 2006 MTP anticipates further progress and completion of projects started in past TIPs and currently underway, and directs the start of some new projects. Each project moves from environmental studies to engineering/design to right-of-way acquisition to construction at its own pace, depending on complexity, external pressures and approvals, and funding. Some projects may 52
55 be started and completed in as little as two years; others will take ten years or longer. Projects may no be started or completed in priority order; some may be started earlier to allow for a longer timeline, and others may be completed earlier because progress moved ahead expeditiously. The 2006 MTP gives first priority to transit improvements in major urban corridors. Since the completion of the MTP 2025, three major transit projects have been completed the new light rail South Line to Meadowview, the extension of light rail East Line to Folsom, and the addition of tracks to the Union Pacific main rail line across the Yolo Bypass and between Sacramento and Roseville for both Capitol trains to the Bay Area and regional commuter rail. This 2006 MTP calls for the following sequence of projects to expand the rail transit system, all needing additional funding during the next five years: 1. Finish double-tracking all existing light rail lines for express service, starting construction in 2007 and completing by 2009, with express service running by 2010, partly funded and currently in environmental studies. 2. Extend the light rail South Line to the vicinity of Cosumnes River College/Calvine and Auberry, with a completion by 2009, partly funded and currently in environmental studies. 3. Begin commuter rail service between Roseville/Auburn, downtown Sacramento, and Davis/Dixon, with intent to lease train equipment scheduled no later than 2008, not yet funded and currently undergoing feasibility studies. 4. Build the new light rail Downtown-Natomas-Airport (DNA) Line, starting construction in 2009 and complete by , partly funded and currently in environmental studies. These transit projects are expected to need about $300 million in additional funding during the next five years, with another $800 million in future years. The region will not be able to complete these projects with regional funds alone, so the financial element of this plan assumes that additional federal and local funding will be used to supplement them. In addition, during the next five years the plan calls for 150 full-size and 150 van-size replacement bus coaches; 30 new full-size and 50 new van-size bus coaches; new Bus Rapid Transit services along Watt Avenue and Sunrise Boulevard (in addition to the BRT along Stockton that has already started); 25 more light rail vehicles; track, signal, and vehicle rehabilitation on the existing light rail system; a new Sacramento bus maintenance yard; a new light rail maintenance facility; and assorted other transit equipment and facilities such as bus stop improvements, technology upgrades, building improvements, and park-and-ride lots. The 2006 MTP also calls for work on 30 highway improvement projects in major regional corridors, all needing additional funding during the next three to five years: Continue a series of traffic improvements, most importantly signal timing on county roads and city streets in Sacramento, currently partly funded but ready for construction. 53
56 Continue corridor studies to define a series of projects on high capacity suburban connectors eventually running from I-5 via Elk Grove-Rancho Cordova-Roseville to Route 99 near Sacramento International Airport; Continue development of the new suburban connectors, by completing projects along Hazel Avenue and Sierra College Boulevard by 2009, some funded and some not yet funded, and then with further projects as defined in corridor studies (to include open space preservation), for full completion by ; Add carpool lanes on U.S. 50 between downtown Sacramento and Rancho Cordova, and between El Dorado Hills and Shingle Springs, to be completed by 2010, partly funded and currently in environmental studies; Extend carpool lanes on I-80 eastward through Roseville, to be completed by 2007, substantially funded and currently in environmental studies; Install express signals for transit and other new technology equipment along Watt Avenue and complete improvements at the Watt Avenue/U.S. 50 interchange and Folsom Boulevard, to be completed by 2009, partly funded and currently in environmental studies. Improve access into downtown Sacramento via Northgate Boulevard/Route 160/Richards Boulevard/Gateway Boulevard/7 th Street through the Union Pacific railyards, with a series of projects to be completed by 2012, partly funded with some parts currently under construction, others currently in engineering/design or environmental studies, and some not yet ready to start. Build a new American River bridge in Folsom to replace the Folsom Dam Road, funded with federal water and energy funds and expected to be built in 2007; Improve access and connections along U.S. 50 near Sacramento State University and Howe Avenue/Power Inn Road, with a series of projects to be completed by 2010, partly funded with some parts currently in environmental studies; Improve access and connections along U.S. 50 through West Sacramento, by completing Harbor Boulevard interchange improvements by 2008 and road/bridge improvements further south by 2010, partly funded with engineering, design, and right-of-way purchase now underway; Add ramps at the I-5/Route 113 interchange in Woodland, to be completed in stages by 2015, partly funded and currently in environmental studies; Improve interchange access to Route 99 in Galt, at Sheldon Road, and at Riego Road, to I-5 at Cosumnes River Boulevard, to Route 70 at Algodon Road, and to U.S. 50 at Missouri Flat Road, with projects to be completed by 2010, partly funded and currently in environmental studies and engineering/design. 54
57 Depending on progress of environmental studies, these road projects may need $ million in additional funding during the next five years, with another $ million in future years, but it is likely that some will encounter project delivery delays not yet foreseen and fall behind schedule. The region will not be able to complete these projects with regional funds alone, so the financial element of this plan assumes additional federal, state, or local funding will be used to supplement these projects. In addition, the 2006 MTP calls for continuing road and bridge rehabilitation work and road improvements of a more local scale, around the region, slated for about $60 million from regional funds but predominantly funded from local sources. The 2006 MTP continues ongoing work to complete interregional state highway routes as four-lane expressways in six areas. The plan calls for the following sequence of interregional state highway projects, all except the first three needing additional funding during the next five years. Complete the route 70 Expressway through southern Sutter County, complete by 2007, fully funded for construction and currently in engineering/design; Complete the Route 65 Lincoln Bypass, starting construction in 2008 and complete by 2010, fully funded for construction and currently in engineering/design, with right-of-way purchase starting in 2006; Complete the Route 99 Expressway south of Yuba City, to be complete except across the Feather River by 2007, fully funded with some parts currently under construction and others in engineering/design; Complete initial improvements to U.S. 50 at Placerville, by 2008, partly funded for construction; Improve bridge access across the Feather River near Yuba City, complete by 2016 or earlier, with feasibility studies underway to compare building a new bridge south of Yuba City against replacing and widening the existing 5 th Street bridge between Yuba City and Marysville; Improve Route 70 around or through Marysville and north to Butte County, complete by 2015, with feasibility studies of several options currently underway. Depending on progress of environmental studies, these projects may need up to $50 million in additional funding during the next five years, with another $ million in future years, with a major share (but not all) coming from the State. Caltrans also may make more localized improvements on its state highways, and intends to continue with a series of projects to reconstruct 45-year-old I-80 through Placer County during the next five years. Finally, this 2006 MTP calls for investments in community design, clean air programs, and bicycle and pedestrian improvements, totaling $1.1 billion over 22 years. SACOG has started implementation of these programs, and has attracted other funds, from sources such as local 55
58 redevelopment programs, private development partnerships, and environmental programs, to broaden and extend community design and clean air programs. The financial element of the 2006 MTP estimates the region will receive, on average, $125 million per year in federal funds during the upcoming five years -- enough to fund the expected delivery of the projects described above. The region, however, through past programming, committed a portion of its regional funds for 2006 and 2007 to other, localized projects. To offset that, SACOG expects to seek and acquire additional federal discretionary funds at a level commensurate with recent years, plus state funding shares for Caltrans interregional highway projects. If the additional funding cannot be found, or project delivery brings forward more projects ready for construction sooner than expected, the region anticipates financing plan implementation by borrowing against future revenues (such as from the sales tax program in Sacramento County). Progress implementing this 2006 MTP during the next three to five years depends not only on ability to program and fund projects and on air quality conformity, but also on project delivery. In the last twenty years or more, most large complex projects have taken six to ten years or longer for delivery, most often due to environmental approvals and community controversies, and few have been delivered anywhere near as quickly as originally expected. About half of the regional-scale projects scheduled during the next five years are currently in, or about to start, environmental studies, where delivery delays are most often encountered. Where large projects are held back during environmental studies, the amount of funding needed during the next five years will be reduced. If many or most large projects move as noted above, the region intends to consider financing its programs to advance funds and move forward with construction of projects that are ready to go. 56
59 APPENDIX A PUBLIC OUTREACH A description of the extensive public outreach performed for the MTP 2025, including the establishment of the Transportation Roundtable, is found in the MTP 2025 document called A Bold First Step issued in For the 2006 MTP and Addendum to the 2002 Environmental Impact Report, staff has developed and followed the following Community Input Plan: Purpose for Community Input Plan This input plan concerns the adoption of a 2006 Metropolitan Transportation Plan (2006 MTP) and its accompanying Addendum to the Final Environmental Impact Report (EIR) for the MTP for These documents have been created to bridge the gap between the MTP 2025 and its EIR (adopted in July 2002) and the adoption of the next regular 6-county MTP update in mid-2007, which will have a new EIR. Since this is a technical update of an existing plan and EIR with minimal content change, the purpose of the Community Input Plan is primarily to inform public officials and agency staff of the need for the 2006 MTP and EIR Addendum and how they have been prepared. Audience The audience for draft documents is primarily SACOG s planning partners, although they will be available for review by the general public as well. Comment Period The Draft 2006 MTP and EIR Addendum will be made available to SACOG committees and the public for a period of 30 days of public comment. The Board of Directors will hold a public hearing on the plan, the Metropolitan Transportation Improvement Program (the MTIP, which is the document that assigns funding to near-term projects), and the EIR Addendum. On the date of plan adoption, the Board will receive the written public comments and staff responses, hold a second public hearing, and adopt the final 2006 MTP, MTIP, EIR Addendum, and air quality conformity finding. Outreach Methods The following methods will be used for eliciting comment on the draft documents: SACOG Board of Directors The Board will be mailed the draft 2006 MTP and EIR Addendum, along with a staff report, in the agenda. Posted Agendas The agendas for SACOG s Transportation and Air Quality Committee and Board of Directors meetings, where these draft documents are considered, will be posted at the SACOG offices and on the SACOG webpage. notifications of committee and Board agendas are now available upon request. 57
60 ADA Requirements All ADA requirements will be met in this process. Public Hearings There will be a public hearing on the documents held by the Board of Directors. The meeting will be at the SACOG offices, 1415 L Street, 3 rd Floor, Sacramento, CA A second hearing will be held just before the adoption of the MTP, EIR Addendum, MTIP, and air quality conformity finding, in the same location and at the same time. Outreach to Native American Tribes Notification of the availability of the documents will be sent via to the four Tribal governments that own land in the SACOG region.. SACOG Webpage The documents and the opportunity to comment on them will be highlighted on the homepage at Legal Notices A legal notice regarding the documents, the comment period, and the public hearings will be placed in the Sacramento Bee. This will appear at least 15 days before the public hearings. SACOG Advisory Committee Mailing List An regarding the availability for comment of the documents will be sent to members of the: Regional Planning Partnership, which includes all of SACOG s public agency partners Public Works Coordinating Group Transit Coordinating Committee Sacramento Region ITS Partnership Transportation Demand Management Task Force Bicycle and Pedestrian Advisory Committee Response to Public Input SACOG staff will respond to comments on the documents through letters to individual commenters or through a consolidated feedback report that will be made at the second Board hearing. Final Documents Final documents will be distributed to affected agencies (including tribal governments) and those individuals and organizations that provided comments during the public input process. Members of the public will be able to obtain copies of the final documents from SACOG as well, and they will be available on the SACOG website, and in the SACOG library. 58
61 APPENDIX B THE COMMUNITY DESIGN FUNDING PROGRAM (This is an excerpt from The Community Design Funding Program Guidelines that were adopted by the SACOG Board of Directors in September It omits the appendices and the application). This document contains information regarding the Sacramento Area Council of Government s Community Design Program for The program provides grants to local government agencies and their partners to promote plans and physical development that supports SACOG s Blueprint Project. Grants are awarded every two years. A. INTRODUCTION Four Funding Programs In July 2002, the Sacramento Area Council of Governments (SACOG) adopted the Metropolitan Transportation Plan for 2025 (the MTP for 2025). This 23-year, $22 billion plan for the region included four federally-funded programs to be used for regional transportation and related priorities that implement the goals of the Plan (Appendix A). The four programs, with 23-year funding amounts are: Air Quality Funding Program $180 million Bicycle and Pedestrian Funding Program $350 million Transportation Demand Management $ 44 million Community Design Funding Program $500 million When the MTP for 2025 was adopted, it was the intent of SACOG to continue these four regional funding programs into the foreseeable future in each successive MTP. Since the adoption of the MTP for 2025, SACOG has adopted several other MTPs, and the funding programs have been continued. Currently, the MTP 2027 is the plan that is operable in the SACOG Region. The guidelines found in Section 2 of this document pertain only to the Community Design Funding Program. The other three programs each have a separate set of guidelines that are consistent with these, and the intent is to coordinate the selection of projects in all four programs with one advisory committee, called the Grant Programs Overview Committee. That committee will review the grant award recommendations by each program s Working Group, and review for regional balance, project type balance and overall direction. For each program, a joint recommendation for funding presented to the SACOG Board of Directors. Public agencies will periodically be given the opportunity to apply for programs on a schedule that will be published before each funding round. The timing of funding rounds is dependent on the availability of the federal funding, and can t always be predicted far in advance. SACOG is committed to using this funding for projects and programs in all parts of the region. For the Community Design Funding Program, a fair and equitable share of the funding for these 59
62 programs combined with other SACOG-controlled regional funds, will be the goal for each public jurisdiction over the long term. Environmental Justice SACOG is also committed to following federal guidance on environmental justice. The goal of environmental justice to ensure that when transportation decisions are made, low-income and minority communities have a full opportunity to participate in the decision-making, and that they receive an equitable distribution of benefits and not a disproportionate share of burdens. Each project or service seeking funds from SACOG's regional funding programs will be evaluated for environmental justice. The grant application process may include explicit questions on environmental justice for project applicants to answer. B. FOUR SACOG FUNDING PROGRAMS Financial support for these programs will come primarily from Federal funding sources expected to be available to the region. The SACOG Board of Directors will approve the amounts allocated to each program before the start of the project selection process, according to long-term Metropolitan Transportation Plan and the agency s more immediate priorities. Most of the projects selected for these programs must qualify for the three federal funding sources available to SACOG. 9 In most cases, a local funding match requirement of 11.47% of the total project cost applies. Federal funding requirements from the TEA-21 are found in Appendix C, and the recently-approved reauthorization is expected to use the same or similar requirements. When SACOG is able to obtain other sources of funding for the programs, different requirements may apply. In most cases, the minimum project size SACOG will consider is $150,000; the Community Design Funding Program will fund planning-related projects for a minimum of $100,000. C. GENERAL APPLICATION PROCESS Every grant cycle, SACOG will issue a request for applications when federal funding opportunities arise, typically once every two years. Public agencies (cities, counties, and other public agencies) are the eligible applicants for these federal funds. Each time funds are made available, the request for applications will be made through SACOG s newsletter, webpage, advisory committee meetings, and letters to public works and planning departments, transportation agencies, transit agencies, transportation management associations, and other organizations. Section 3 of this document serves as the Request for Applications for the Community Design Funding Program for Specific details and requirements for applying for grants are found in that section. 9 These sources are currently the Surface Transportation Program (STP), the Congestion Management and Air Quality Program (CMAQ), and Transportation Enhancements (TE). 60
63 D. PROJECT SELECTION PROCESS: Sacramento, Sutter, Yolo and Yuba Counties Applications Community Design grants in Sacramento and Yolo Counties must be endorsed by the countywide transportation agency in those counties. Because there are no countywide transportation agencies in Yuba and Sutter Counties, this step is not necessary. The Community Design Working Group and the Grant Programs Overview Committee, formed with members from existing SACOG committees and staffed by SACOG, will make recommendations to the Board of Directors, through the appropriate Board Committee, on project selection. After SACOG staff screen project applications for eligibility, Working Group and Grant Overview Committee members will be responsible for reading proposals and making recommendations for projects to be funded. The process and the membership of these committees are described in Section 2. SACOG reserves the right to fund less than the amount reserved for each funding program in a given funding cycle, as well as to fund projects in a program other than the one for which it was submitted. E. PROJECT SELECTION PROCESS: Placer and El Dorado Counties For Placer and El Dorado Counties, a different situation applies, due to Memoranda of Understanding between the Placer County Transportation Planning Agency and SACOG and the El Dorado Transportation Commission and SACOG that govern the use of federal funds in those counties. Please refer to Section 2 for summary description or Appendix B for a detailed explanation of how federally-funded projects are approved in those counties. F. GENERAL AWARD REQUIREMENTS After SACOG has made an award through any of the four funding programs, project sponsors will be asked to follow or be aware of these requirements: Follow all federal funding requirements listed in Appendix C. Agree to the terms of the draft Letter of Understanding shown in Appendix E Follow all federal environmental justice directives. Assure SACOG that the projects meet the requirements of the Americans with Disabilities Act. Follow SACOG s Use It or Lose It policy for obligating and spending the grant funds. The policy requires project sponsors to schedule fund obligation and project implementation in the Metropolitan Transportation Improvement Program and to honor that schedule. A local non-federal match of at least 11.47% of the total cost of a project is required for projects receiving federal funding in the Sacramento region, with a few exceptions that are 61
64 detailed under the individual program guidelines. This does not include in kind match, but must be funding that is dedicated to eligible features within the project and included in its overall cost. For capital projects, federal funds may be used for Preliminary Engineering (which includes environmental work and design) as well as for right-of-way and construction. When a project is ready for implementation, the project sponsor requests an authorization from Caltrans. When the project is authorized, the sponsor can incur expenses that will then be reimbursed from the grant. A project sponsor submits invoices for the entire cost incurred, and will be reimbursed at 88.53% (the total cost minus local match). SACOG encourages project sponsors to seek other sources of funding that may be available, including Community Development Block Grants or other federal HUD funds (although for the most part, federal funds from other programs cannot be used as match). G. PROGRAM BACKGROUND The overall purpose of the Community Design Program is to provide support for planning and capital development projects that promote the Blueprint Project Principles. The Community Design Program supports implementation of the Blueprint Project with financial incentives to local governments. Grants are awarded to projects sponsored by qualified public agencies in the SACOG region. These projects must support specific development or planning projects that conform to the seven Blueprint Principles (which are discussed in detail on the SACOG website: ): transportation choices; housing diversity; compact development; mixed land uses; use of existing assets; natural resource protection; and quality design. The Metropolitan Transportation Plan for 2025 authorized the program through The MTP included $500 million dedicated to directly fund public agencies (possibly in partnership with private developers and community organizations) for projects that support the goals of the Plan. The intent of the Community Design Program is to use regional transportation funding to promote the construction of land use developments (or land use and projects) that lead to fewer vehicles miles traveled and more walking, biking, and transit usage. The program results from the recognition that land use influences travel behavior and can be a powerful tool to improve the efficiency and effectiveness of the regional transportation system. If it is convenient for people to travel to common destinations by walking, biking, or public transit, we can reap air quality and congestion-relief benefits at the local and regional scale. Near-term goals and objectives for the program are expanded upon below. Community Design proposals, which must be submitted by public agencies, will be evaluated for how well they promote the Blueprint Principles and the level 62
65 of project maturity and commitment to actual physical construction. H. BLUEPRINT PROJECT The six-county Sacramento metropolitan area presently faces a golden opportunity to promote construction of projects that will lead to more livable communities. The convergence of rapid growth, market conditions and new-found attitude towards regionalism offers the opportunity to reverse the trend of urban sprawl that communities in the Sacramento region and all across America have allowed. The timing is right since this region is projected to approximately double its population to 3.8 million by SACOG s Blueprint Project has laid the groundwork for a better managed, more compact urban form. The project started in the year 2000 when SACOG was developing the Metropolitan Transportation Plan (MTP) for The modeling for the MTP showed that despite spending an estimated $23 billion through the year 2025 for transportation projects throughout the six-county region, the Sacramento metropolitan area vehicular congestion would increase by 50% and vehicle miles traveled per household would increase by 20%. In addition, based on the sprawl-like development patterns of the late 1990s, the region would urbanize 661 additional square miles by 2050 under the base case scenario. With the region expecting to add more than 1 million jobs, 840,000 new dwelling units will need to be created to house the related doubling of the population to 3.8 million. The Blueprint Project has given this region a long-range vision for land use to better manage the growth pressures of this region. The Blueprint Project has been on the cutting edge of regional growth management in four areas: (1) innovative use of geographic information system software, (2) extensive community outreach, (3) broad-based participatory techniques and (4) on-the-ground economic reality checks. Using interactive computer software, the average citizen can see the relationship between transportation performance and land use patterns, and what impacts land use has on quality of life indicators. More than 5,000 area residents have participated in 37 Blueprint half or full-day public workshops. After developing different growth pattern scenarios at neighborhood, county and regional levels and being able to compare development results, 99% of all participants have concluded that implementation of the seven Blueprint Principles are needed if this region is going to maintain its livability, protect open space and agriculture lands, provide housing that is attainable to all economic segments, and manage transportation impacts. Public opinion polling commissioned by SACOG yields similar public sentiments. As a result, the SACOG Board of Directors adopted a Blueprint Project Preferred Scenario in December, The Preferred Scenario serves only as a concept-level illustration of the growth principles. It was developed with parcel-level data and analysis to help ensure that the growth concepts were being applied in a realistic manner; however, the Preferred Scenario is not for literal, parcel-level interpretation. SACOG is working with local jurisdictions to implement the concepts of the Preferred Scenario. The Community Design Funding Program is designed for the planning and construction of projects that meet the Blueprint Principles. 63
66 I. PROGRAM GOALS AND OBJECTIVES The Community Design Funding Program s stated goals and objectives are: Goals The Community Design Funding Program is a transportation funding program that provides a means to: A. encourage patterns of land development in new areas, following Blueprint Principles, that foster walking, biking and use of public transit instead of driving. B. improve walkability, bikability, and transit use in existing communities where there is the potential for infill and redevelopment that follows the Principles. C. improve a community s sense of identity and place as well as its quality of life through integrated transportation and land use development or redevelopment projects. Near-term program objectives The following near-term objectives pertain to the next two years of the program, fiscal years and Provide transportation infrastructure for specific land development projects that conform to the Blueprint Principles. 2. Provide transportation infrastructure for areas with a plan or policies adopted by a policy board that conform to the Principles. 3. Provide transportation infrastructure for developed areas where the built environment already conforms to the Principles, but where key features such as sidewalks and bike lanes are missing. 4. Provide planning assistance to modify plans and development projects to follow the Principles. 5. Provide incentives for new land development or redevelopment proposals that, if it were not for the Community Design Program, would be built according to standard development practices or not built at all. 6. Provide leverage for other public and private funding or enhance another transportation project. 7. Provide prototype examples of Community Design Principles throughout the region in different land use settings, including urban, suburban, and rural. 64
67 Future program objectives SACOG envisions a broader array of objectives in future funding rounds, including public education on the strong link between land use and transportation, a housing incentive program, and an infrastructure bank loan program. J. PROGRAM FUNDING AND GRANT TYPES In fiscal years and , SACOG staff has preliminarily recommended that $12 million be funded for Community Design Grants. This figure may change depending the quality of the grant applications. Ultimately, the SACOG Board of Directors will make the determination on the final program amount for after it reviews the award recommendations. Please note that the staff s recommended figure is for only for grants within Sacramento, Sutter, Yolo and Yuba Counties; funding for El Dorado and Placer County projects will be according to their respective agreements with SACOG, as summarized in sub-section L and detailed in Appendix B. There are three types of grants within the Community Design Funding Program for , of which the first two may be applied for through the Request for Applications in Section 3. Capital grants are available to public agencies (with or without private or non-profit partners) for transportation infrastructure projects. These infrastructure projects must either (1) connect directly to a site, corridor, or neighborhood development or redevelopment project that incorporates Blueprint Principles, or (2) supports a land use plan for development or redevelopment that incorporates the Principles, or (3) support an existing community that conforms to the Principles but lacks transportation infrastructure for alternative modes. Planning grants are available to local governments for updating local general plans, specific plans, other kinds of relevant plans, zoning ordinances, or other guidance documents to incorporate the Principles. Quick Response Planning Grants will be available starting in 2006 to local government agencies seeking planning assistance to improve specific development projects to conform to the Blueprint Principles. SACOG will select a limited number of pre-qualified planners, architects and other consultants through an RFQ process to provide on-going assistance that will be used to significantly improve specific development or redevelopment projects through incorporation of the Principles. Local governments will apply for technical assistance, and SACOG staff will make a determination whether to provide the assistance through consultant services. Projects may be submitted on an on-going basis throughout the fiscal years once the program has commenced. SACOG staff will review applications about every two months. This program will be available in 2006 and SACOG will issue a separate request for applications. 65
68 K. PROJECT SPONSORSHIP Public agencies, 10 either with or without partnership with land developers or community groups, are eligible to sponsor Community Design projects. Public/private collaborations are encouraged, and all proposals will be expected to include a community outreach component. Community groups and developers who may wish to apply for these funds with a public agency are strongly encouraged to contact the agency early in the application process for its support and coordination. Non-city/county qualified public agencies that choose to serve as the lead sponsor are also strongly recommended to seek support from the local government in which the project site is located, preferably with coordination early in the application process. Lack of documented support or coordination will leave the impression that the project is not endorsed by the SACOG member agency and would considerably weaken the project s chances for program funding. Also please note that if the awarded government agency intends to hire consulting or construction services with the grant funds, public bidding laws will take affect regarding the selection of contractors. L. PLACER AND EL DORADO COUNTIES For Placer and El Dorado Counties, a different situation applies, due to Memoranda of Understanding between the Placer County Transportation Planning Agency and SACOG and the El Dorado Transportation Commission and SACOG that govern the use of federal funds in those counties. Please refer to Appendix B for a detailed explanation of how federally-funded projects are approved in those counties. In summary, the Regional Transportation Planning Agencies (RTPA) for Placer and El Dorado Counties each hold a written agreement with SACOG that allows them to select projects with a fair share of federal funds. Local governments in these two counties will submit their grant applications to their RTPA. The RTPA will forward its selected projects to SACOG for funding. SACOG staff will review these projects and make a determination if they are qualified for the Community Design Funding Program, and, if so, they will be designated as receiving funding through this program and will be recognized as such. If not, they will be funded without being so designated. M. ELIGIBLE PROJECTS All projects awarded through the Community Design Funding Program must conform to federal transportation funding requirements. Potential applicants are encouraged to directly contact the SACOG Program Manager listed in sub-section P early in the application process for eligibility review. Summary descriptions of projects that received Community Design Funding Program funding in may be viewed in Appendix D. In addition, SACOG will provide a letter of understanding to the award recipient regarding SACOG s requirements and expectations regarding 10 Public agencies are those organizations qualified to enter into a Cooperative Agreement with the California Department of Transportation to receive and use Federal transportation funds. 66
69 the grant. The draft model letter is found in Appendix E. The following lists show the broad range of possible projects that are likely to be eligible for Community Design Funding Program funding: Capital Grants infrastructure directly connected to a land development project, land use plan, or in an existing Blueprint friendly community Bicycle and pedestrian paths, tunnels, and bridges On-street bike lanes Pedestrian plazas Pedestrian street crossings Streetscaping such as median landscaping, street trees, lighting, and furniture Traffic calming (but not interfering with public transit, bicycling or walking) Transit buses and services that serve the site (operations limited to 3 years) Transit stop amenities such as shelters, restrooms, and benches Transit transfer centers Shared parking systems and parking garages Electric vehicle charging stations and other support infrastructure 11 Intelligent Transportation Systems (ITS) associated with the site, such as smart parking or public Transit real-time information signs Outreach to the neighborhood and stakeholders Planning Updates to general plans, specific plans, transportation plans, zoning codes, or other planning guidance, to conform them to the Blueprint Principles. N. PROJECT SELECTION PROCESS Two committees will review and recommend grant applications for awards before they are submitted to the SACOG Board of Directors for review and action. The first committee, the Community Design Working Group, will review each application in detail. It will meet four times over a one month period to make recommendations awards and amounts purely on the basis of the technical merit of each project as described on the next sub-section. This second committee, the Grant Programs Overview Committee, will review recommended applications from the Working Group for regional balance and relative equity amongst the different communities in the region relative to the strength of their applications. The Committee will also review recommended projects within the context of SACOG s other three funding programs: Air Quality, Transportation Demand Management and Bicycle/Pedestrian. This committee will meet no more than two times specifically for the Community Design Program. (It will also meet to 11 Electric vehicles themselves, which are privately owned, may not be paid for with Federal funds. 67
70 review the recommendations from the other three SACOG grant programs Air Quality, Bicycle/Pedestrian and Transportation Demand Management.) If the recommendations from both committees are the same, then they will be forwarded to the SACOG Board for review and action. If there are differences between the two committees recommendations, SACOG staff will try to rectify any differences and submit a compromised set of recommendations based in the spirit of the discussions by the two committees to the Board. Members for both of these committees will be selected from the Regional Planning Partnership, the Bicycle and Pedestrian Advisory Committee, the Transit Coordinating Committee, the Transportation Demand Management Task Force and the Planners Committee as shown below: Community Design Working Group Expertise Appointment By: Working Group Positions Planners Planners Committee 5 Project Engineers Regional Planning Partnership 3 Urban Designer Regional Planning Partnership 1 Bike/Ped Bike/Ped Advisory Committee 1 Air Quality Air Districts 1 TDM TDM Task Force 1 Transit Transit Coordinating Committee 2 Community Groups Regional Planning Partnership 1 TOTAL 15 Grant Programs Overview Committee Appointment By: Number of Positions Planners Committee 3 Regional Planning Partnership 4 Bike/Pedestrian Advisory Committee 2 TDM Task Force 2 Transit Coordinating Committee 2 Air Districts 2 TOTAL 15 O. EVALUATION CRITERIA The evaluation criteria described in this subsection are based on the Working Group discussions from the selection process of the Community Design Grant Program. Essentially, the Working Group narrowed several stated criteria down to the overall impression each application made on two characteristics. These two characteristics will serve as the evaluation criteria for this cycle s selection process. They are not formally written agreed-upon language, but rather summarize the practical implications that will be considered. 68
71 Criterion #1: How well does the proposed project promote the Blueprint Project Principles? Practical considerations: This is the most fundamental question each project will be judged against. Based on the selection of projects, the Working Group identified projects that best exemplified the Blueprint Principles. Projects that failed to make a compelling argument that they support the principles were immediately eliminated from further consideration. Some applicants tried to rationalize how a public project that was in high demand was therefore a Blueprint-friendly project, when it was not. Projects that were considered not detrimental to the Blueprint Project did not necessarily mean that they were considered Blueprint friendly. This program is intended to support the region s best examples of Blueprint implementation and not necessarily to provide a funding source for public works projects. Applicants seeking to understand how competitive their projects might be, may wish to compare their idea against the 15 projects that were funded in These applications may also give prospective applicants an idea of what application contents were successfully used. The.PDF files of grant applications of each of those projects may be found at The single most common concern the Working Group had in reviewing applications was that the lack of clarity. Some applications lacked why their project was Blueprint-supportive, while others tried unsuccessfully to rationalize why a project followed the Blueprint principles. Some applicants also lacked a clear explanation of why the project was needed to support Blueprint. Other applicants failed to clearly describe how they would use the grant funding in a way that would lead to Blueprint-friendly development. Criterion #2: How real is the project? What is the likelihood that the project will be implemented as the application implies? Of the applications that showed a strong tie with the Blueprint Principles, the Working Group spent a considerable amount of time deliberating about how realistic these proposals were. Successful applicants were able to provide evidence that the project had been well-thought through and that the project was likely be implemented immediately. Commonly asked questions by the Working Group used to evaluate applications were: Has the governing body with the most legal standing endorsed or approved this project? Is there an existing adopted plan in which this project is identified? Has the surrounding neighborhood been involved in the project s development and has the affected neighborhood or the appropriate neighborhood association endorsed the grant project? Is there support from adjacent and nearby property owners who is proposing development on their property? For capital projects, where is this project in the development review process? For planning projects, what is the project s potential to meet the Blueprint Principles in the plans, zoning ordinances or other development guidance? 69
72 Are there leveraged, private development funds being invested in or near the subject area? If so, how much, and is the private development considered Blueprint-friendly? What documentation is there on how much funding has been invested in the study area? Are there letters or other documentation from property owners in the application stating support for the project or stating what they are intending to do with their property that is Blueprint-friendly? Is this a lynchpin project does its implementation and success mean other Blueprint-supportive projects will also be built? If this project is not funded, will other Blueprint-supportive projects not be built as a result? Has the project been carefully thought-through, or are there significant obstacles that the applicant has not addressed in the application? Does this project serve as a good example of the Blueprint Principles for the region? What is the likelihood that this project will be built as it is described in the application? And how soon will it get built or implemented? Are there major outstanding issues that are not resolved? Does this project need to be awarded in this funding cycle, or can it wait until future cycles after the applicant has addressed all critical issues? What are the number of units of housing, commercial space, jobs and other important indicators within a quarter mile of this site? Within one mile? How do residential densities compare with other comparable subject areas? How did the project perform using PLACE 3 S or in comparison with the Desired Land Development Profiles Matrix? What is the track record of the applicant in Blueprint implementation? (Expected questions in ): What is the track record of the jurisdiction if it received a Community Design Grant in ? Has the applicant been accountable to SACOG for how it has utilized its grant? Has the project been implemented in the spirit it was stated in the grant application? Practical Considerations: Applications that adequately addressed the issues raised in these questions were more likely to have been successful in , and this will likely hold true for the funding cycle as well. Some of the tools that successful applicants included in their applications included: A context map of the site: where is the subject area in relation to the commonly known landmarks within the region. An aerial map showing the project or subject area. The maps showed what exist currently, what projects are in place, and how and where grant funds were going to be used. A list of major capital improvements within, adjacent to, or near the subject site. This list could show infrastructure improvements, private development investment made or committed, and long-term public works projects likely to be built according to an adopted plan. PLACE 3 S maps and analysis showing different land use configurations, and the preferred scenario on that conforms well with the Blueprint Principles. 70
73 Photographs of the site or subject area as they currently exist. Renderings or drawings of what the subject site or area will look like as a result of grant funding. Renderings, graphics or photographs of projects that have recently been built or are going through development review for construction in or near the project subject area. Letters of support from key organizations (neighborhood association, adjacent property owners, private developers directly affected by the subject project). Written information that addresses as many of the questions mentioned above. The level of detail that is provided should be enough to provide the Working Group a clear, overall picture of what activities, investments, etc. are taking place without providing extraneous information. DESCRIPTIONS OF AWARDED COMMUNITY DESIGN APPLICATION PROJECTS This appendix briefly describes grant applications that were funded in the Community Design Grant Program. The awarded grant applications may be viewed in their entirety at Awarded Capital Projects Sacramento Housing and Redevelopment Agency: Broadway/Martin Luther King, Jr. Intersection Enhancement Project ($600,930 grant, total project $685,000). The project proposes to improve safety for pedestrians and bicyclists on Broadway at Martin Luther King, Jr. Boulevard. The project would replace the existing deteriorated curb, gutter, and sidewalks, construct high-visibility crosswalks, provide accessible ramps, replace signal heads and lenses, provide countdown signals for pedestrians, and design and implement feasible improvements to reduce vehicular speed. The Agency is currently taking bids on a mixed-use development at this intersection. City of Sacramento/Sacramento Regional Transit/Capitol Area Development Authority: 13 th and 16 th Street Light Rail Station Connectivity Improvements ($1,683,000 grant, total project $2,420,000). The proposed project will provide critical safety and accessibility improvements to the 13 th and 16 th Street Light Rail Station and environs in the central business district. 16 th Street is now the main transfer station for light rail service in the region yet there are no pedestrian improvements, signage or amenities to support increased ridership and connect the station with high-density employment centers and new mixed-use housing projects planned for the Capitol Area. Similarly, the 13 th Street Station serves the R Street redevelopment area but is not accessible to new mixed-use developments on R Street. City of Rancho Cordova: Cordova City Center ($1,691,910 grant, total project $2,190,621). As part of a new Transit Oriented District, two components Folsom Boulevard and Plaza Improvements: replace the street frontage along the Folsom Boulevard, and La Loma Drive including a café sidewalk, added on-street parallel parking inset between street trees. The project includes a decorative plaza with a central fountain that connects the residential townhouses to the commercial uses and the Mather Field/Mills Station across the street, and 2. Public Parking 71
74 Structure: Build a two-level parking structure for approximately 200 auto spaces to be used for shared parking within a new high-density residential and commercial district directly across the street from the station. The parking structure will be used for residents, mixed commercial uses and light-rail riders and is a critical component for creating the necessary density and that will boost light-rail ridership. Funds will cover 75% of the parking structure construction, meaning 151 of the 201 parking spaces. City of Yuba City: Cinema 14 and Mixed-Use Retail Complex Transportation Improvements, ($613,800 grant, total project $700,000). The Yuba City Downtown Cinema 14 and Mixed-Use Retail Complex is a proposed mixed-use development for the six-acre parcel bordered by Bridge Street on the north, Shasta Street on the west, Boyd Street on the east, and B Street on the south. The Redevelopment Agency purchased the site to redevelop as part of the Downtown Revitalization Strategy. The project will include a 14-screen movie theater anchor with approximately 12,000 square feet of retail space adjacent to the cinema, and 500 parking spaces to the rear of the cinema and 33 in front. It is intended that the parking lot will remain publicly owned and serve both theater goers and shoppers, and that people drawn to the entertainment complex will be able to access the restaurants, stores, cultural attractions, and businesses in the Plumas Main Street District through a series of multi-modal facilities and connections. The transportation improvements include signal phasing modifications, pedestrian-scale street lighting, sidewalks, restriping for intersection pedestrian crossings and safety, and minor roadway rehabilitation. These improvements will enhance walkability near the cinema and mixed-use complex by improving safety, accessibility, connectivity and circulation. City of Marysville: Downtown Marysville Renaissance Square ($1,980,000 grant, total project $8,500,000). This is a mixed-use project incorporating the reuse and renovation of the historic Marysville Hotel to infill housing units, pedestrian-oriented retail uses, and adjacent structured parking to serve residents and customers of the project, tenants and employees at the Hart Office Building and customers of the D Street commercial core area. The grant funding would be used for the parking structure element. County of Sacramento: Freedom Park Drive ($1,089,000 grant, total project $1,500,000). Construct pedestrian and streetscape improvements along Freedom Park Drive between 32 nd to 34 th Street and 34 th Street to Watt Avenue, to support infill development and redevelopment activities that will create a mixed-use Main Street corridor in North Highlands. City of West Sacramento: Tower Bridge Gateway/Garden Street Intersection ($2,970,000 grant, total project $5,000,000). Construction of at-grade 4-way intersection replacing an existing flyover. Intersection will provide pedestrian, bicycle and direct vehicle access, connecting with planned Transit Center and transit lines. Smart growth development projects are being permitted/planned in the immediate area. City of Roseville: Historic District Revitalization Project ($630,630 grant, total project $5.6 million). Streetscaping, pedestrian street crossings, outreach to neighborhood and stakeholders, and design/engineering for the Roseville Multi-modal Center Expansion. The project helps to revitalize Roseville s original commercial district, with period buildings from the late 1800s to the 72
75 early 1900 s. The project area includes Main, Church, Pacific and Lincoln Streets east of Washington Boulevard and west of the railroad tracks. City of Roseville: Riverside Avenue Revitalization Project ($247,500 grant, total project $6 million). Streetscaping and pedestrian street crossings to support the revitalization of this corridor between Douglas Boulevard and Darling Way. Placer County, Highway 49 Streetscape Project ($100,000 grant; $647,854 total project) This project is one of the recommended actions from the North Auburn Community Development Strategy for the redevelopment of Highway 49 corridor in unincorporated Placer County. The streetscape project consists of planting of trees, shrubs and groundcover in five new landscaped medians. Awarded Planning Projects City of Sacramento/Sacramento Housing and Redevelopment Agency, Sacramento Regional Transit: Swanston Station Transit Village Planning ($222,750 grant, total project $665,000). This project includes a Transit Village (TOD) Plan and supportive traffic study, urban design plan, and transportation-related infrastructure plan. Downtown Development Group/City of Sacramento: The Docks Area Redevelopment Project ($377,190 grant, total project $680,000). This project includes a specific plan and the related environmental review as well as the infrastructure assessment and financing plan for the Docks Area Redevelopment Project. Yolo County: Growing Space: Updating the Yolo County General Plan to Support Smart Growth in Rural Communities ($218,790 grant, total project $772,086). Yolo County proposes to reinforce existing policies and integrate new smart growth principles into the Circulation and Land Use elements of the General Plan, with particular emphasis on the unique challenges of creating higher density mixed-use development within pedestrian- and bicycle-oriented neighborhoods in rural small towns. Through this process, Yolo County intends to reduce future vehicle demand and protect valuable agricultural and habitat resources. City of Folsom: Glenn Drive Light Rail Station (LRT) Transit Oriented Development (TOD) Master Plan ($144,540 grant, total project $165,000). The Folsom Light Rail Extension Project is currently under construction in the City of Folsom, with approved stations -- Iron Point, Historic Folsom, and Glenn Drive (previously known as Silverbrook). The Glenn Drive LRT station will include a park-and-ride lot. It is planned on a 2.9 acre site with 184 parking spaces. Since this design was completed, the site has been considered for transit oriented development (TOD) by both Sacramento Regional Transit District (RT) and the City of Folsom. The City and RT support changes to the station parking lot to be TOD-friendly in the future. This grant will be used to complete strategic planning for the TOD with the goal of implementation at the conclusion of the study, including the development of a conceptual master plan integrating the various transportation and development linkages necessary to support TOD development, and a marketing/implementation plan for coordination activities, public outreach activities, partnering opportunities, and financial incentives important to development of a TOD. 73
76 County of Sacramento with numerous public and private partners, Hurley Way Revitalization, Phase I ($139,590 grant for Phase I, total Phase I cost $160,000). The project is a revitalization of a 2-mile portion of Hurley Way, bounded by Watt Avenue to the East and Ethan Way and American River Parkway to the West. Phase I includes roadway analysis, design and planning and initiation of an infill development project. Additional phases will install the capital improvements. A public outreach component would be an integral element of Phase I. 74
77 APPENDIX C INTELLIGENT TRANSPORTATION SYSTEMS STRATEGIES Intelligent Transportation Systems (ITS) encompass information and communications technologies that are increasingly being used by traffic and transit managers to improve the operating efficiency of their systems. In an era of funding and environmental constraints for roadway expansion, ITS have been embraced as a means to deal with the increased demands on the region's transportation system resulting from strong population and business growth. ITS are the technologies that will enable a fully integrated, multi-modal transportation system that gives operators the ability to enhance and integrate transit services, smooth traffic flow, improve safety, enhance emergency services, and provide traveler information. The Federal Highway Administration places greater emphasis on the deployment of ITS as an integrated system linking multiple jurisdictions. This approach will enable the sharing of traffic and transit data, as well as systems operations where applicable. As part of the requirements for ITS deployment, an Architecture depicting how agencies are interconnected is needed. As well, ITS must be mainstreamed into the planning and funding process via the MTP. PLANNING AND DEVELOPMENT ACTIVITIES The Sacramento region is making good progress in planning for the deployment of ITS. In addition to the deployment project listed below, two important studies will help prioritize and set the stage for future projects that will be included in subsequent updates of the MTP. Those studies include: A Strategic Deployment Plan (SDP) has recently been completed that identifies ITS technologies and projects to meet regional goals and objectives. This study prioritizes project selection and funding to meet those objectives. The SDP replaces a deployment plan crafted in 1996, which has become obsolete as technologies and regional priorities have evolved. A Systems Engineering study to begin in January 2006 will develop a regional ITS communication system that links traffic and transit operations centers in the region. In early 1999, a conceptual report on the Sacramento Transportation Area-wide Network (STARNET) was completed. A Needs Assessment study completed in late 2001, identified system improvements needed at each operation center in order link them via STARNET. Systems Engineering will identify system needs and operational specifics to implement STARNET. ITS PROJECTS IN THE 2006 MTP SACRAMENTO COUNTY PROJECTS SAC22890 ITS on Arden Way Smart Corridor on Arden Way from Del Paso to Watt Ave. 75
78 SAC24071 Elk Grove ITS Phase 1 Implementation of Phase 1 of Elk Grove's ITS, including development of a Traffic Management Center at the City Corporation Yard and associated communication infrastructure, along with signal controller replacement and signal interconnect installation in the southwest quadrant of the City. REGIONWIDE PROJECTS VAR11000 Regionwide STARNET Integration In SACOG region, implement regionwide STARNET integration and related ITS projects. 76
79 APPENDIX D DEMOGRAPHIC/LAND USE, MODELING, AND FINANCIAL ASSUMPTIONS DEMOGRAPHIC PROJECTIONS AND LAND USE ASSUMPTIONS USED IN THE MTP 2025 AND THE 2006 MTP SACOG used population, housing and employment projections through the year 2027 in the travel demand forecasts made for the 2006 MTP. These projections are adapted from the 2025 projections made for the previous update of the MTP. The major assumption behind the 2025 projections is that adopted general and specific plans from area jurisdictions provide an accurate depiction of future growth 12. In these plans residential land is almost completely consumed by The supply of commercial land, on the other hand, is much larger than demand over this time period. Therefore the projections are but one interpretation of how the demand is allocated throughout the region. This interpretation is, however, based on the numerous discussions between SACOG staff and the various planning departments. These 2025 projections were extended to the MTP horizon year of The methodology for these projections incorporates regional growth targets provided by the Center for the Continuing Study of the California Economy (CCSCE). The goal of the modifications is make the minimum changes to the previous projection set while adjusting the projections to current growth data and region-level near-term projections that have been published recently. The new projections are informed by data from the following sources: The U.S. Census Bureau s 2000 census of population and housing Annual housing and population estimates for years from the California State Department of Finance (DOF), Demographic Research Unit (DRU) InfoUSA 2004 employment data Projections of employment, population, and households to 2012, from the 2004 annual report of the Center for the Continuing Study of the California Economy (CCSCE) Current General Plan data used in the Sacramento Region Blueprint Project Year 2005 is the new socio-economic baseline, which represents the most important departure from the previous projection set in methodology and results. The previous projections were made in 1999 using data from SACOG s housing inventory, and from the 1990 Census. On the population and household side, the new baseline starts with household characteristics, the number of persons, and their spatial location as recorded in the 2000 Census. In consultation with the planning staff of SACOG s member jurisdictions, staff endeavored to use all available official planning documents to estimate the location and amount of growth through For employment, the 2004 estimates from InfoUSA were the primary source. Future allocations of population, households, and employments are based on the relative shares established in the 2005 baseline. Using sub-regions named Regional Analysis Districts (RAD) and 12 SACOG is currently developing a new 2030 land use base for the region that will be used in the MTP to be adopted in
80 consistent with regional targets for the given year, linearly projected relative shares of growth were applied. General plans and specific plans provide valuable guidance, but these documents do have important limitations. For example, the supply of residential land is inadequate to satisfy the projected population growth, and the supply of commercial land exceeds the expected employment demand. The household characteristics found in Census 2000 are necessarily fixed through the year The 2025 data were not changed unless the changes made for all other projection years are higher than the 2025 numbers. The 2027 data are calculated by increasing the 2025 numbers using the annual growth rates by jurisdiction. As noted above, there have been important changes in methodology that are evidenced in comparisons with the previous projection set. Some important differences are: Persons per household (PPH) are down considerably. Census 2000 shows a continued decline in household size due to a variety of social and economic factors. The PPH is not geographically homogenous since it includes housing type and other important socioeconomic variables. The previous projections underestimated the amount of growth in the Natomas Basin, Southwest Placer County, and El Dorado Hills. The previous projections overestimated the growth in South Sutter County and Yuba County, and to lesser extent Yolo County. The consistently large difference in employment totals reflects the change in source data. SACOG has greater confidence in the new employment projections developed by CCSCE. TRAVEL MODELING ASSUMPTIONS FOR THE 2006 MTP The household travel survey SACOG conducted in 2000 is a major source of travel behavior data that was used in the travel demand model employed in the 2006 MTP. The travel data and related demographic data from the survey are used in the estimation of the model components. Modification of the survey data is made in the estimation process to match the model to known travel characteristics, such as traffic counts and transit boardings. Commercial vehicle demand is estimated as a separate sub-model and incorporated into the overall model. Similarly, external travel (both passenger vehicle and commercial vehicles) that passes through the region is also estimated and incorporated into the model. The travel demand model contains the following elements that are used to produce forecasts of person and vehicle trips, traffic demand and congestion, and transit demand: Trip Purposes-Home based Work, Home based Shop, Home based School, Home based Other, Work based Other, Other based Other, Commercial Vehicles, External to External Vehicles. Travel modes-drive alone, Shared ride-two persons, Shared ride-three or more persons, Transitwalk access, Transit- drive access, Walk, Bicycle 78
81 Time of day-morning Peak (7 a.m. to 10 a.m.), mid-day (10 a.m. to 3 p.m.), Afternoon Peak (3 p.m. to 6 p.m.), evening (6 p.m. to 7 a.m.) MAJOR DATA SOURCES: SACOG Household Travel Survey, 2000 Commercial Vehicle Survey and Model Development, 1998 Traffic counts from Caltrans, cities and counties Transit ridership counts from Regional Transit and other operators REFERENCE DOCUMENTS: SACMET01 Model Update and Validation Report, March 2002 Pre-Census Travel Behavior Report: Analysis of the 2000 SACOG Household Travel Survey, July 2001 FINANCIAL ASSUMPTIONS FEDERAL AND STATE PROGRAM STRUCTURE Federal program structure and basic formulas from Transportation Equity Act for the 21st Century (TEA-21 and now SAFETEA-LU), and State basic program structure and formulas from SB 45, remain in place through FEDERAL FUNDING LEVEL History: Congress increased federal gasoline tax by five cents (+125 percent) in 1982, by five cents (+55 percent) in 1990, by 4.3 cents for general fund in 1993, and then 4.2 cents transferred from general purposes to transportation (+30 percent) in Current level is 18.2 cents. Congress has increased gas tax rate for policy purposes to support transportation investment. Congress has also increased federal transit program funding by an average of 5 percent per year since the Intermodal Surface Transportation Equity Act (ISTEA) in Assumption: Escalate federal highway program funding levels by 2% annually with 20% increases in re-authorization years (2005, 2010, 2016, and 2022). Also increase for a greater regional share of statewide population following the 2010 and 2020 census. De-escalate for inflation as well as air quality improvements and fleet fuel efficiencies, where appropriate. Congress approved a 30% increase through SAFETEA-LU in 2005; the 2006 MTP dedicates the additional federal funding to Caltrans for state highway rehabilitation. FEDERAL TRANSIT ADMINISTRATION PROGRAM GRANTS History: Sacramento has consistently worked with 50 percent-match federal funding for light rail construction and extensions, one project at a time, since Through the 1990s it has received an average 0.3 percent of rail modernization funds nationwide, and has received an average of 0.4 percent of bus replacement funds nationwide over a 20-year time frame. Assumption: Escalate federal transit program funding levels by 5 percent per year through For new rail starts, continue to receive 50 percent-match federal funding for one rail extension at a time through 2027, 0.3 percent of nationwide rail modernization funds, and 0.4 percent of 79
82 nationwide bus replacement funds. This matches closely to what Congress approved for SAFETEA-LU in FEDERAL TRANSIT ADMINISTRATION FORMULA GRANTS History: Congress has provided transit formula grants since 1965, from general funds, decreasing amounts intermittently from 1982 to 1991, then increasing amounts in ISTEA and TEA-21 but with restrictions against use for operating subsidy for urban operators. Assumption: Continue to get population-based formula grants, with funding level escalated by 5 percent per year through De-escalate totals for inflation. This matches closely what Congress approved in SAFETEA-LU in STATE FUNDING LEVEL History: Legislature increased state gasoline tax by two cents (29 percent) in 1982, by five cents (55 percent) in 1990, by one cent per year for (total 29 percent). Current level is 18 cents. Legislature has increased gas tax rate in arrears in response to loss of purchasing power. Assumption: Escalate state funding level by five cents (28 percent) in 2011 and five cents (22 percent) in De-escalate totals for inflation. STATE TRANSIT ASSISTANCE (STA) History: STA is currently funded with 50 percent of state Public Transit Account revenues, which come from sales tax on gasoline via two formulas (one directly per Proposition 42 of 2002 and one indirectly from a spillover formula dating from the 1970s). These revenue streams tend to be very volatile with marginal gas price changes, but gasoline prices have increased irregularly over time at 4 percent above Consumer Price Index with additional temporary windfalls from spikes in gas prices about every eight years. Assumption: Escalate by 4% per year for increase in gasoline price; add half of Prop. 42 PTA funds after 2009; escalate by 2.2% for VMT growth and 4% for gasoline price inflation; escalate for windfall price spikes in and ; de-escalate totals for inflation and fleet fuel efficiency gains. CALTRANS' STATE HIGHWAY MAINTENANCE AND REHABILITATION History: The California Transportation Commission funds both Caltrans' highway maintenance program and highway rehabilitation through the State Highway Operation Protection Plan (SHOPP), off the top in the fund estimate, currently at about $1 billion per year for maintenance and $2 billion for SHOPP, a level adequate to keep the state highways in acceptable shape. Assumption: Continue funding at the current level in real terms, about $125 million per year reported by the state to be adequate, with a 2.2 percent annual increase in state highway maintenance program funding to match growth in traffic and lane miles, this level of funding allows for two very-high-cost rehabilitation projects: Placer I-80 and downtown Sacramento Route I-5. The gradual increases in maintenance and SHOPP funding cut into funding available for the region's share of the STIP. De-escalate totals for inflation. CALTRANS' ITIP History: The Interregional Transportation Improvement Program (ITIP) receives 25 percent of STIP funds, usable statewide without geographic restriction. The Sacramento region has been getting about 5 percent of the statewide total, and in fact has a greater-than-average 80
83 number of high-cost projects in the project delivery pipeline to be built in the time frame Assumption: Continue the flow of ITIP funding at 5 percent of the statewide total, to specific large projects already in the pipeline, plus smaller projects not yet defined (such as auxiliary lanes, ramp meters, traffic improvements), generally at a 50 percent RTIP/50 percent ITIP rate. De-escalate totals for inflation. SALES TAX FOR TRANSIT (TRANSPORTATION DEVELOPMENT ACT-TDA) History: Sales tax revenues in Sacramento County, a high-growth county, increased by 8 percent per year compounded from 1975 through 2000, with the rate gradually declining (in line with California's average sustained Gross Domestic Product growth rate of 7.2 percent per year since 1980); the rate of increase has been 4-5 percent in smaller, less urban counties and in fully urbanized counties. Assumption: Escalate sales tax revenues by 8 percent per year in Placer County (which is entering a high-growth period), by 6 percent per year in Sacramento County (with continuing above-average population growth), and by 5 percent per year in the four other counties. De-escalate totals for inflation. COUNTY SALES TAXES FOR TRANSPORTATION History: California's 11 largest counties (including Sacramento) all have transportation sales taxes, with six at a rate of 1 percent (with 1/2 percent of that for transit only) and the other five (including Sacramento) at a rate of 1/2 percent. All six with a 1 percent rate enacted two separate measures anywhere from 4 to 25 years apart. Only 3 of 28 rural counties now have transportation sales taxes. State law now requires 2/3 voter approval to enact or extend a transportation sales tax. Assumptions: The MTP 2025 assumed an extension of Sacramento County s Measure A at 2/3 percent. The agency responsible for the sales tax in Sacramento County is Sacramento Transportation Authority (STA). STA in 2002 stated its intent to seek an extension of the existing sales tax which expires in 2009, at such time when the political outlook looked favorable for 67 percent voter approval; the target time initially was aimed for STA noted the need for a higher sales tax than the existing ½ percent, to provide additional transit operating funds. STA in early 2004 decided the time would be right to go for a ballot measure to extend the sales tax in November 2004, and decided for political reasons to seek extension at the existing ½ percent rate but increase the portion going to transit operations from 30 percent to 38 percent, and clearly noted the need to increase the total tax rate to provide more transit funds at a later date. STA s political judgment proved to be wise, as the voters approved the extension by a 75 percent vote. Following the election, STA again reiterated its intent to seek an additional sales tax measure for transit operations, at a future time when the political outlook again looked favorable. SACOG cannot determine when that may occur, but believes that to be reasonably expectable by 2016 for four reasons: historically favorable public opinion towards funding has moved up and down in about seven year cycles in this state, so a favorable climate should occur at least once by 2016; if an increase were to be considered at some undetermined time after the current extension takes effect in 2009 and some of its projects have been completed to show success, that allows time for three ballot tries in 2012, 2014, and 2016, and no urban county in California has failed to enact a sales tax measure given three tries; six large urban Democratic-leaning counties in California (comparable to Sacramento) have enacted two sales tax measures, one entirely for transit, and Sacramento County offers similar demographics and prospects to these six counties; and a measure 81
84 at ¼ percent from 2016 to 2027 yields about an equivalent amount to the revenue assumed in the MTP 2025, thus holding constant the results from assumptions from that MTP. For these reasons SACOG believes it reasonable and conservative to assume STA will act on its stated intent at an upcoming favorable opportunity and succeed in establishing a second sales tax measure of at least ¼ percent (or perhaps ½ percent) dedicated to transit by no later than a ten-year horizon. For the MTP 2025, the five remaining SACOG counties asked that the MTP not contain a transportation sales tax in the revenue projections, and that assumption has been retained in the 2006 MTP. TRANSIT FARES History: Transit operators in the Sacramento region have increased fares periodically over the years, generally in response to inflation in operating costs. Assumption: Escalate revenues by anticipated ridership growth for all operators. For Sacramento RT, additional revenues provided from sales tax measures, ridership boosts from major LRT/BRT lines and fare increases in 2010, 2015, 2020, and De-escalate all totals for inflation. LOCAL GENERAL FUNDS History: Use of local general funds for transportation has declined gradually since Proposition 13 in 1978, with differences due to individual jurisdiction policy. Assumption: Hold estimated 2005 general funding levels for roads and transit amount constant in real terms through 2027, jurisdiction by jurisdiction. IMPACT FEES History: Counties and cities have imposed areawide fees per housing unit, now typically in the range $ ,000 per house, and collect environmental impact fees for specific large developments (both commercial and residential). Assumption: Apply present fee levels to the number of housing units projected to meet population growth targets, and include a modest additional amount for jurisdictions expecting above-average office, commercial, and industrial growth. In totaling, reduce El Dorado, Sutter, and Yolo fees by 33%, and Sacramento fees by 10%, in order to account for fee offsets granted to major developments to compensate for arterials built within the development. Regional impact fees in Sacramento County will be leveraged as part of Measure A at $1,000 per unit after DIRECT DEVELOPER CONSTRUCTION History: Developer-constructed roads are added to the public stock in an amount directly proportional to housing and office/manufacturing development. Assumption: Multiply projected new housing units by unit costs to estimate the total value of arterials and streets built with developer in-kind funding. INFLATION History: Consumer Price Index (CPI) has increased by 86 percent (about 3.1 percent per year), and Construction Cost Index (CCI) has increased by 93 percent (about 3.4 percent per year) since Assumption: As noted for relevant funding categories, the revenue projections de-escalate revenues to current (2004) values (so projects can be shifted among years without escalating and de-escalating cost), using deflation rates of 2.7 percent for revenues used for road maintenance (public employee labor cost), 2.9 percent for revenues used for transit equipment (same as current 82
85 CPI forecast), 3.4 percent for revenues used for construction (CCI), and 3.5 percent for revenues used for transit operations (transit labor cost with strike-avoidance policy). ALTERNATIVE FUEL VEHICLES History: Alternative fuels are partly or wholly tax-exempt, but the number of vehicles using them is insignificant to date. Assumption: Reduce gasoline tax revenues to account for significant numbers of alternate fuel vehicles entering and comprising an increasing portion of the fleet after 2009, proportional to Air Resources Board projections for alternative fuel vehicle fleet penetration, which by 2027 results in a nearly 40 percent reduction in expected gasoline tax revenues. 83
86 APPENDIX E LISTING OF PROJECTS AND PROGRAMS. The project list itemizes all major capital projects, and lists "lump sums" under Various County Projects. THE METROPOLITAN TRANSPORTATION SYSTEM Bicycle and pedestrian ways Community connectors-these are roads or transit services that serve as the primary connections between communities. They are critical to the region's economy and mobility Freight distribution routes-in addition to roadways already covered, this category includes the Port of Sacramento's Deep Water Channel into the Sacramento River and the freight rail network. Ports and airports-these intermodal facilities are a critical element in the movement of freight and long-distance passenger travel. Public-transit routes, including bus, light rail, heavy rail passenger lines, and associated facilities such as stations or terminals and their grounds-public transit is an important element in mobility, air-quality and congestion-relief strategies. River crossings and approaches-river crossings are vital links across natural barriers. Since the number of available river crossings is limited, these facilities often are congested. Roads with projected traffic volumes over 25,000 vehicles per day by the year This criterion was developed to address that portion of the road system that accommodates the greatest travel demand. Six-lane roadways -Same as the previous criterion. State highways, and interchanges-state routes and interchanges play a major role in the transportation system and are required as part of the system by federal and state legislation. Transportation management facilities and services, including demand-, system-, and operationsmanagement-this category includes park-and-ride lots, ramp meters, ridesharing services, and other strategies aimed at improving the efficiency of the transportation system, or increasing the use of alternative modes of travel. By improving efficiency, these facilities and services contribute to the overall performance of the system. 84
87 Appendix E Project List ID Project Title Project Description Total Cost El Dorado County Caltrans District 3 Completion Year CAL16161 CAL17690 U.S. 50 CAL18110 Operational Improvements on U.S. 50 Hangtown Creek Beautification at U.S. 50 CAL18190 US 50 Camino Project SR 49 in Coloma, from the South Fork American River CAL18740 Bridge #25-21 to Marshall Road. CAL18741 West Placerville Dr. to Bedford: construct EB aux. ln., 2 ln. connection from Placerville Dr. to Main St., modify traffic signals at Canal, SR 49 & Bedford; lengthen existing left turn pockets and close existing EB off-ramp to Main St. $32,973, Add HOV lanes from El Dorado Hills Blvd. to S. Shingle Springs/Ponderosa Rd. $47,937, Remove abandoned eastbound off-ramp at Main St and re-establish riparian vegetation $405, In El Dorado County, US 50 through Camino: preliminary planning, engineering and environmental analysis for conversion of expressway to freeway and future construction of a new interchange. $2,000, Construction of a 2-way left turn lane, install stop sign and associated bicycle and pedestrian facilities $1,300, SR-49 Near El Dorado - Widen Shoulders Near El Dorado - Near Ore Court Road to China Hill Road - widen shoulders $11,364, City of Placerville Dept of Public Works ELD12100 Placerville Road Rehabilitation In Placerville, various locations: rehabilitate roads -arterials, collectors and transit routes. $1,076, ELD14090 ELD15890 ELD15900 ELD16060 ELD19100 ELD15610 Clay Street at Cedar Ravine Main Street Washington Street US 50 Western Placerville Interchanges Point View Drive US 50 Silva Valley Rd Interchange In Placerville, Clay Street at Main/Cedar Ravine: realign to a four-way intersection, reconstruct Clay Street Bridge and Ivy House parking lot. $1,500, Realign Main St. to provide two one-way roadways from Washington ST. to Broadway at U.S. 50 WB off ramp. $2,400, Widen and realign Washington Street to Turner Street from Cedar Ravine Road to Main Street. At a minimum, add curb, gutter, bike lanes, turn pockets, and a widened travel way. $1,300, US 50 Western Placerville Interchanges Project. Widen Forni Road and ramps and new auxilary lane $29,300, In the City of Placerville, Point View Drive from Broadway to Smith Flat Road: extend two-lane road. $1,300, El Dorado County Dept of Transportation In El Dorado County, US 50 at Silva Valley Road: construct new interchange with overcrossing and ramps. Add aux lanes halfway to next interchange westbound to EDH and aux lane eastbound connecting to existing truck climbing lane. $46,200, ELD10080 Silva Valley Pkwy. Widen from 2 to 4 lanes from Harvard Wy. to Green Valley Rd. ELD10090 ELD12000 ELD15010 White Rock Road Widening El Dorado County Road Rehabilitation Cameron Park Drive Widen White Rock Rd from the Sacramento/El Dorado County line to Latrobe Rd from 2 to 4 lanes. $8,000, $1,708, In El Dorado County, various locations, rehabilitate roads: arterials, collectors and transit routes. $1,560, In El Dorado County, Cameron Park Drive, Palmer Drive to Green Valley Road: conduct operational and safety analysis to identify and prioritize needed improvements. $840, ELD15040 Cameron Park Drive Widen from 2 to 4 lanes, Meder Rd. to Green Valley Rd. (4 segments) ELD15050 Cameron Park Drive Widening Widen Cameron Park Dr from Palmer Dr to Meder Rd from 2 to 4 lanes (Phase 1). ELD15080 Durock Road Widen 2 to 4 lanes, Shingle Lime Rd. to Rodeo Rd. ELD15130 El Dorado Hills Blvd. Widen from 2 to 4 lanes from Green Valley Rd to Harvard Wy. ELD15160 Green Valley Rd. Widen from 2 to 4 lanes from Francisco Dr. to Salmon Falls Rd. $9,700, $14,335, $5,500, $10,000, $1,900, ELD15170 Green Valley Rd. Widen from 2 to 4 lanes from Salmon Falls Rd. to Silva Valley Rd. $1,100, Widen Latrobe Rd from Golden Foothill Parkway to the southern entrance to ELD15230 Latrobe Road Widening Valley View from 2 to 4 lanes. $11,400, Page 1 of 23 4/4/2006
88 Appendix E Project List ID Project Title Project Description Total Cost Completion Year ELD15250 Missouri Flat Rd. Widen from 2 to 4 lanes from Headington Rd. to Prospector Plaza Drive. ELD15260 Mother Lode Dr. Widen from 2 to 4 lanes from French Creek Rd. to Pleasant Valley Rd. ELD15270 Mother Lode Dr. Widen from 2 to 4 lanes from South Shingle Rd. to French Creek Rd. ELD15370 White Rock Rd. Widen from 2 to 4 lanes Latrobe Rd. to U.S. 50. ELD15540 Cambridge Road Widening Widen Cambridge Rd from U.S. 50 to Country Club Rd from 2 to 4 lanes. ELD15560 South Shingle Rd. Widen from 2 to 4 lanes from U.S. 50 to Durock Rd. ELD15570 Palmer Drive Construct new two-lane road between Wild Chaparral Dr. and Palmer Dr. $2,400, $20,100, $3,000, $12,400, $1,488, $1,800, $9,700, ELD15580 Serrano Parkway Construct new two-lane road from Greenview Drive to Bass Lake Road. $2,400, ELD15630 US 50 at El Dorado Hills Blvd. In El Dorado County, US 50 at El Dorado Hills Blvd: Phase 1.3 and Phase 2 ultimate. Includes aux lanes halfway to east Silva Valley Rd interchange and aux lane westbound to county line. $49,700, ELD15680 Pleasant Valley Rd. Intersection improvements at Buck's Bar Rd. ELD15690 ELD15930 ELD15940 ELD15950 ELD15960 ELD15970 ELD15990 ELD16000 ELD16010 ELD16150 ELD19165 ELD19182 US 50 Missouri Flat Road Interchange Cameron Park Drive Country Club Drive Country Club Drive El Dorado Hills Blvd. Green Valley Road Missouri Flat Rd. / Pleasant Valley Rd. Pleasant Valley Rd. Saratoga Way Extension Green Valley Road Bridge Replacement El Dorado Hills Blvd Interchange Phase 1.2B: Enhancements US 50 Bass Lake Rd Interchange In El Dorado County, US 50 at Missouri Flat Road: Phase 1. Modify existing interchange to tight diamond configuration. Widen Cameron Park to provide a consistent 4 lane divided road from Robin Lane to Palmer Dr. and a 4 lane undivided road to Oxford Road. Construct a new two lane road from Bass Lake Rd. to Merrychase Dr. to replace an existing 2-lane road located parallel to U.S. 50 Construct a new 2 lane road parallel to U.S. 50. from Bass Lake Road to Silva Valley Parkway Widen El Dorado Hills Blvd. from Park Avenue to Serrano Parkway from 5 to 6 lanes and provide a bicycle/pedestrian pathway $5,900, $41,800, $3,000, $4,300, $5,800, $1,800, Widen Green Valley Road from 2 to 4 lanes from Silva Valley Parkway and Deer Valley Road (west) $12,600, Construct a new 2 lane divided roadway from Missouri Flat, north of China Garden, to Pleasant Valley Road / Route 49 at Fowler Lane. Involves realignment of Missouri Flat and Route 49 north of Pleasant Valley Road. $17,800, Widen Pleasant Valley Rd. from El Dorado Rd. to Route 49 (south) to provide a divided roadway. No additional travel lanes. Construct a new 4 lane undivided road from the County line to Arrowhead Dr. Includes a Class 1 bicycle/ pedestrian pathway. In El Dorado County, Green Valley Road at Tennessee Creek: replace existing bridge. $1,800, $6,200, $1,970, US 50 at El Dorado Hills Boulevard: construct channelization improvements to the westbound on and off ramps and improvements to El Dorado Hills Boulevard underneath US 50. This project is one piece of the overall interchange project listed under ELD $1,808, In El Dorado County, US 50 at Bass Lake Rd: modify existing interchange by widening off-ramps to provide turn lanes, widen on-ramps for ramp metering and HOV bypass lanes, install traffic signals add aux lanes halfway to next interchange eastbound, lengthen bridges. $28,000, ELD19181 US 50 Cambridge Rd Interchange In El Dorado County, US 50 at Cambridge Rd: modify existing interchange by installing traffic signals, contruct w/b slip on-ramp, widen off-ramps to provide turn lanes, widen on-ramps for ramp metering and HOV bypass lane, add aux lanes halfway to next interchange east and west, widen bridge. $35,500, Page 2 of 23 4/4/2006
89 Appendix E Project List ID Project Title Project Description Total Cost Completion Year ELD15150 Green Valley Road In El Dorado County, Green Valley Road from Francisco Drive to 780 feet E: widen from 2 to 4 lanes. $700, ELD19187 Green Valley Road ELD15230 Latrobe Road Phase 2 ELD15230 Latrobe Road Phase 1 In El Dorado County, Green Valley Road from County Line to Francisco Drive: widen from 2 to 4 lanes. $5,700, In El Dorado County, Latrobe Road from Golden Foothill Parkway (s) to Carson Creek (Suncast Lane): widen from 2 to 4 lanes and construct intersection improvements and signalization at Golden Foothill Parkway. $12,200, In El Dorado County, Latrobe Road from White Rock Road to US 50: widen to 3 NB and 3 SB lanes. $4,800, ELD19179 Sophia Parkway In El Dorado County, Sophia Parkway from Green Valley Road to Alexandria Road: widen from 2 to 4 lanes. $800, ELD15370 White Rock Road In El Dorado County, White Rock Road from Latrobe Road to Silva Valley Parkway/US 50 Interchange: widen from 2 to 4 lanes. $12,200, ELD19178 US 50 El Dorado Rd Interchange El Dorado Rd/US50 Intrchg (Includes Study for El Dorado Rd improvements GP136) (Environmental & P.E. only) $6,880, ELD19177 US 50 Cameron Park Dr Interchange Cameron Park Dr I/C (Environmental & P.E. only) $31,918, ELD19180 US 50 Ponderosa Rd Interchange North Shingle Rd/Ponderosa Rd Intchg (Environmental & P.E. only) $43,460, El Dorado County Transit ELD15650 FTA 5309 Commuter Bus El Dorado Transit - Purchase Replacement and New Service commuter buses Acquisition $1,285, ELD15740 Diamond Springs Construction of Central Park and Ride Facility. $471, ELD16080 El Dorado County Transit Purchase an additional 40 buses (10 buses every 4 years) to provide commuter services. Cost estimate includes Capital and Operational costs. $20,300, ELD16090 Park and Ride lots Acquisition and build-out of pubic park and ride facilities adjacent to U.S. 50 $4,000, ELD16100 Commuter Bus Service to light Purchase an additional 12 commuter buses (4 every 3 years) and replace rail after 10 years. Cost includes operational costs. $6,500, ELD19155 Operating Assistance - FTA Operating assistance grant - FTA 5311 (rural program) 5311 (Grant Cycle 23) $236, ELD19156 Operating Assistance - FTA Operating assistance - FTA 5311 (rural program) 5311 (Cycle 22) $236, ELD19157 FTA 5310 Transit Vehicle Replacement of four (4) transit buses and purchase of two (2) mini-vans for Replacement minor service expansion. $322, ELD19160 FTA 5307 Preventive Bus acquisition and Preventive Maintenance maintenance. $364, ELD19161 FTA 5307 Bus Acquisition and Bus Acquisition and Preventive maintenance Preventive Maintenance $80, ELD19164 FTA 5307 Bus Acquisition and Bus acquisition and Preventive maintenance Preventive Maintenance $364, El Dorado County Transportation Commission ELD15710 El Dorado County PPM Plan, program and monitor $531, IRR TIP Projects El Dorado County Shingle Springs Rancheria Project on US Route 50, (IRR TIP Project ID IRR38300 Shingle Springs Interchange , Route No. 0315) connecting the Rancheria to US Route 50. See Hwy 50 Appendix L. $23,000, Placer County Caltrans District 3 CAL16390 I-80 Ramp metering at all interchanges from Foresthill Road to Sacramento County Line. $4,210, CAL16400 I-80 Bridge modifications at King Rd., Penryn Rd., Gillard Rd., Newcastle OC. $10,000, CAL16410 I-80 Bridge modifications at Brace Rd., Horseshoe Bar Rd. $10,000, CAL16460 Route 193 Rehabilitate roadway from Sierra College to Newcastle. $5,000, CAL16470 Route 49 Improvements Auburn - Route 80 to Dry Creek Road - operational improvements $11,105, CAL16750 I-80 Raise overcrossings at 7 interchanges. $25,000, Near Lincoln - Industrial Boulevard to south of Yuba County line - construct CAL17240 Route 65 Lincoln Bypass new 4 lane expressway/freeway on new alignment. $262,533, CAL from SR 193 to SR 174 Near Auburn, 1-80 from SR 193 to Auburn Ravine; and.5 miles west of Auburn Ravine to SR 174; road and bridge rehabilitation $64,300, CAL17510 I-80, Colfax Narrows Project In and near Colfax, from Route 174 to Magra Overhead - Preliminary Engineering for roadway rehabilitation, construction of truck-climbing lanes, and adding ITS improvements. $276, CAL18200 I-80 In Placer County, I-80 from east of SR 65 to west of the Sacramento County line: construct HOV lanes. $160,000, Page 3 of 23 4/4/2006
90 Appendix E Project List ID Project Title Project Description Total Cost Completion Year CAL18260 I-80 Construct a truck climbing lane on eastbound I-80 between the Southern Pacific railroad trestle (just north of Colfax) and the Alpine interchange. $30,000, CAL18731 I-80 Blue Canyon Road Rehabilitation Near Blue Canyon - Nyack to Carpenter Flat - Rehabilitate roadway $24,690, CAL18732 I-80 Drainage Improvements Near Blue Canyon Near Blue Canyon and Cisco Grove - Nyack to Rainbow - Drainage Improvements $3,439, CAL18733 I-80 Gold Run Safety Roadside Rest Area Near Gold Run - Rehabilitate Gold Run Safety Roadside Rest Area $6,893, CAL18734 I-80 Rainbow to Kingvale Road Rehab In Placer County - Rainbow to Kingvale - rehabilitate roadway $28,355, CAL18735 I-80 Roseville Planting & Irrigation Rehabilitation In Roseville - Sacramento County Line to 0.2 mile west of Douglas Blvd - planting and irrigation rehabilitation $2,559, New SR 267 Truck climbing lane south of Northstar $2,000, PLA18960 G Street Widen from 2 to 4 lanes with left-turn pockets from Westlake Blvd. to Industrial Blvd. $3,100, PLA18965 G Street In Lincoln, G Street, Westlake Blvd. to Industrial Blvd.: widen from 4 to 6 lanes. $3,100, PLA18980 Route 65 Widen from 2 to 4 lanes from Gladding to Westlake Blvd. $1,000, PLA19610 Route 65 Construct interchange at Whitney Blvd. $9,200, PLA20090 Placer County In eastern Placer County, SR 267 from Nevada County line to Northstar: widen from 2 to 4 lanes. $10,000, PLA20840 I-80 at Route 174, Interchange In Placer County, near City of Colfax: along I-80 at Route 174, construct new interchange $30,000, City of Auburn Dept of Public Works PLA20200 Auburn Transit Operations Operate Auburn Transit $741, City of Colfax Dept of Public Works New Railroad Avenue Construct North South connector road on Railroad Ave with pedestrian and bicycle improvements $2,000, Colfax Depot Restoration - PLA20361 In Colfax, complete interior restoration of the Colfax multimodal station project. Interior $500, Construct pedestrian and bicycle paths, sidewalks, park and ride lots, an Colfax Downtown Gateway PLA20390 "open air" railroad museum, and landscaping near the Historic Freight Depot project building. $500, PLA20420 Canyon Way / I-80 Overpass Intersection improvements at Canyon Way and I-80 Overpass. $350, PLA20430 Rising Sun Road Reconstruct Rising Sun Road and improve intersection at Ben Taylor Road and Church St. $300, PLA20450 Colfax Bicycle Path Network Develop a network of bicycle paths throughout Colfax, connecting to major transportation centers $1,000, PLA25024 Bike lanes on South Auburn Street Add bike lanes on both sides of street $112, PLA25158 Downtown Colfax Bike Lane Extension From Downtown Multi-modal station, construct bike path extension to the intersection of Main Street and SR 174. $90, City of Lincoln Dept of Public Works New Ferrari Ranch Road Widen from 4 to 6 lanes from SR 65 Bypass to Lincoln Pkwy. New Ferrari Ranch Road Widen from 2 to 4 lanes from E. Caledon Cir. To City limits New Ferrari Ranch Road Widen from 2 to 4 lanes from SR 65 to SR 193, including intersection improvements. $488, $502, $2,252, New Joiner Parkway Construct new 4-lane road from Lakeside Dr. to Nicolaus Rd. $600, New Lincoln Parkway Widen from 2 to 4 lanes from Ferrari Ranch Rd. to Sterling Pkwy., including SR 65/UPRR overcrossing. $415, PLA15970 Nicholaus Rd. Widen from 2 to 4 lanes from Airport Rd. to Aviation Blvd. $2,000, PLA18630 Aviation Blvd. Construct new 4 lane road from terminus 0.5 miles north of Venture Dr. to Wise Rd. $750, PLA18650 Aviation Blvd. Widen from 2 to 4 lanes from Venture Dr. to terminus 0.5 miles north of Venture Dr. $300, PLA18710 Industrial Blvd. Widen from 2 to 4 lanes from Route 65 to 12 Bridges Dr. $947, PLA18720 Industrial Blvd. Widen from 2 to 4 lanes from 12 Bridges Dr. to Athens Blvd. $758, PLA18730 Lakeside Dr. Widen from 2 to 4 lanes from Nicolaus Rd. to Venture Dr. $307, PLA18760 Lincoln Pkwy. Widen from 4 to 6 lanes from Ferrari Ranch Rd. to Sterling Pkwy., including SR65/UPRR overcrossing. $400, PLA18770 Lincoln Pkwy. Widen from 2 to 4 lanes from Sterling Pkwy. To Del Webb Blvd. $174, PLA18790 Lincoln Pkwy. Widen from 2 to 4 lanes from Del Webb Blvd. to Twelve Bridges. $260, PLA18810 Lincoln Pkwy. Widen from 2 to 4 lanes from 12 Bridges Dr. to Rocklin city limits. $450, PLA18950 Route 193 Widen from 2 to 4 lanes from Ferrari Ranch Rd. to Sierra College Blvd $190, PLA19020 West 12 Bridges Dr. Widen from 2 to 4 lanes from Industrial Blvd. to SR 65 including interchange improvements. $209, Page 4 of 23 4/4/2006
91 Appendix E Project List ID Project Title Project Description Total Cost Completion Year Ferrari Ranch Road at SR 65 PLA19070 SR 65 Lincoln Bypass at Ferrari Ranch Rd.: construct interchange Bypass $12,000, PLA20210 Lincoln Transit Buses In Lincoln, purchase 8 replacement transit buses. $1,900, PLA20230 Lincoln Transit Operating Assistance Operating funds for Lincoln Transit $3,500, PLA20740 Airport Road PLA20750 Airport Road Construct 2-lane road from Weco Access Rd. to Wise Rd. (appx. 1 mile). Reconstruct 1 mile of an existing 2-lane road from Nicolaus Rd. to Weco Access Rd.. $1,928, $643, PLA20760 Venture Drive PLA20780 Gladding Parkway PLA20790 Nicolaus Road PLA20810 East Avenue PLA25022 PLA25023 PLA25032 Auburn Ravine Bridge NEV Transportation Project State Route 65 Signal Coordination Project PLA25151 West Oaks Blvd Widen from 2 to 4 lanes from Aviation Blvd. to Lakeside Dr. $900, Construct a new 2 lane roadway from Nicolaus Rd. near K St. to East Ave. near 9th St. including overpass over UPRR and SR 65 and connections to 12th St. $4,400, Reconstruct existing 2-lane roadway with drainage improvements from Aviation Blvd. to Airport Rd.. Reconstruct and restripe existing 2-lane roadway from East 9th St. to Route 193. $1,200, $1,900, Preliminary Engineering, Environmental Documentation, Permitting, and Construction of Neighborhood Electric Vehicle (NEV) and pedestrian bridge crossing Auburn Ravine. Preliminary Engineering, Environmental Documentation, and Permitting for future vehicle bridge at same location. $1,300, Preliminary Engineering, Environmental Document, Permitting, and Construction of Class I,II,& III NEV Routes on various streets within the City of Lincoln. $278, Analysis, design, and construction of traffic signal modifications, signage, and striping improvements along State Route 65 from Ferrari Ranch Road to 7th Street to relieve traffic congestion within downtown Lincoln. $315, City of Rocklin Division of Engineering Construct new 4-lane extension from terminus to 4-lane portion to Whitney Ranch Pkwy $2,100, PLA19330 Sierra College Boulevard PLA25156 Sunset Blvd Widen to 4 lanes from north Loomis town limits to Clover Valley intersection Widen to 6 lanes from NB SR65 ramp to West Stanford Ranch Rd. $210, $680, PLA15400 Sierra College Boulevard Widen to 6 lanes from Interstate I-80 to Aguilar Tributary $2,000, PLA15530 Pacific St. Widen to 4 lanes from Sierra Meadows to Loomis Town Limits. $4,000, PLA15620 Sunset Blvd. Widen from 4 to 6 lanes, from Topaz to S. Whitney Blvd. $600, PLA17910 Sunset Blvd. Widen bridge at SPRR from 4 to 6 lanes from South Whitney Blvd. to Pacific St. $1,650, PLA19230 Argonaut Avenue Construct 2 lanes from Yankee Hill Rd to Del Mar Ave $4,000, PLA19250 Clover Valley Parkway Construct 2 lanes from Park Drive to Sierra College Blvd. $9,500, PLA19260 Dominguez Road In Rocklin, Dominguez Road: extend with 2 lanes from Granite Drive to Sierra College Boulevard. $3,200, PLA19270 Lone Tree Blvd. Widen from 3 to 4 lanes from Sandhill Dr. to West Oaks Blvd. $825, In Rocklin, construct new 4-lane facility from east of Liberty Pkwy to Park PLA19290 Whitney Ranch Parkway Drive. $8,995, PLA19310 Park Dr. Widen Park Dr. from 4 to 6 lanes from Sunset Blvd. to Farrier. $1,300, PLA19320 Park Drive PLA19330 Sierra College Boulevard PLA19400 Rocklin Road PLA19401 Rocklin Road PLA19490 I-80 Widen from 4 to 6 lanes from Roseville City Limits to Sunset Blvd. $1,000, In Rocklin, Sierra College Boulevard: widen to 4 lanes from intersection with Clover Valley Parkway to Loomis town limits. $1,270, In Rocklin, Rocklin Road: widen to 6 lanes from Granite Drive to westbound I- 80 ramps. $200, In Rocklin, Rocklin Rd. from Eastbound I-80 on-ramps to Sierra College Blvd: widen from 4 to 6 lanes. $1,350, Widen existing Sierra College Blvd IC from 2 to 5 lanes, including the on- and off-ramps and loops. $28,548, Page 5 of 23 4/4/2006
92 Appendix E Project List ID Project Title Project Description Total Cost PLA20460 Sierra College Boulevard PLA20470 Sierra College Blvd. PLA20480 China Garden Bike Lane Completion Year In Rocklin, Sierra College Blvd from Aguilar Tributary to Nightwatch: widen from 2 to 4 lanes. $950, Widen Sierra College Blvd. from 2 to 4 lanes from I-80 interchange to Aguilar Tributary. $1,800, Construct Class I bike facilities along Secret Ravine from Roseville city limits to Monument Springs Rd. and Class II bike facilities from Aguilar St. to Vista Oaks $1,500, PLA20490 Pacific Street Construct Class II bicycle facilities on Pacific St. from Dominguez Rd. to Loomis city limits. $400, PLA20500 Sierra College Blvd. Widen Sierra College Blvd. from 4 to 6 lanes from Aguilar Tributary to Nightwatch Drive. $2,170, PLA25025 Whitney Ranch Parkway Construction In Rocklin, construct new 4-lane facility from SR 65 to east of Sioux Street. $2,300, PLA25119 Sierra College Boulevard Widen to 6 lanes from Granite Drive to RR tracks. $700, City of Roseville PLA15600 Sierra College Boulevard South Rocklin City Limits to Olympus Drive, widen road from 2 to 4 lanes. $3,700, Roseville Transit Operating PCT10190 Assistance Operating Assistance for Roseville Transit $16,254, Roseville Transit Computer PCT10420 Roseville Transit: purchase AVL and computer assisted software. Purchases $750, PLA15660 Baseline Rd. Widen from 2 to 4 lanes, from City Limits to west of Foothills Blvd. $5,000, PLA15690 Cirby Way Widen from 4-6 lanes from Regency St. to Oak Ridge Dr. $2,000, PLA15710 I-80 Eureka Road On-Ramp Improvements In Roseville, Eureka Rd. at I-80: add 4th WB thru lane from 500' E of N. Sunrise to EB I-80 on-ramp and change existing #1 NB and SB thru lanes at Sunrise/Eureka to left turn lanes. $3,000, PLA15720 Eureka Blvd. Widen from 2 to 4 lanes, from Sierra College to City Limits. $500, PLA15730 Foothills Blvd. Widen from 4 to 5 lanes, from Cirby to Atkinson. $750, PLA15740 Galleria Blvd. Widen from 4 to 6 lanes, from Berry to Roseville Pkwy. $1,500, PLA15760 Pleasant Grove Boulevard Widening Pleasant Grove Boulevard Widening Widen Pleasant Grove Blvd from Foothills Blvd to Wood Creek Oaks from 4 to 6 lanes Widen Pleasant Grove Blvd from Woodcreek Oaks Blvd to Sun City Blvd from 2 to 4 lanes $1,500, PLA15790 $1,700, PLA15810 Roseville Pkwy. Construct 4 lane segment from Washington Blvd. to Foothills Blvd. $8,000, PLA15830 Roseville Pkwy. Widen from 2 to 4 lanes from City Limits to Sierra College Blvd. $850, PLA15890 Sunrise Ave. Widen from 4 to 6 lanes, from Sacramento County line to Madden Ln. $5,000, PLA15910 Taylor Rd. Widen from 2 to 4 lanes from Roseville Pkwy to I-80 $500, PLA15911 Taylor Rd. Widen from 2 to 4 lanes, I-80 to City Limits. $4,000, PLA15920 Washington Blvd. Widen from 2 to 4 lanes, from Sawtell to Blue Oaks, including Andora undercrossing. $12,000, PLA16080 Roseville Park and Ride Facilities In Roseville, design and construct park and ride facilities. $2,550, PLA17950 Cirby Way Widen from 4 to 5 lanes, from Riverside Ave. to Regency Way. $500, PLA19470 Woodcreek Oaks Widen from 2-4 lanes from Canavari Dr to North Branch of Pleasant Grove Creek. $5,000, In Roseville, Fairway Drive from Highland Park Dr. to Blue Oaks Blvd.: widen PLA19590 Fairway Drive from 2 to 4 lanes. $500, PLA19810 Atkinson Street/PFE Road Widen to four lanes from Foothills Blvd to city limits $8,000, PLA19841 PLA19860 PLA19900 PLA19960 Roseville Maintenance Facility Upgrades Upgrade existing Vehicle Maintenance facility, at City of Roseville Corporation Yard (2005 Hilltop Circle). Upgrade to allow for work on CNG buses. $1,842, Roseville Bikeway Master Plan Implementation In Roseville, provide signs and striping for new class 2 and 3 bikeways. $105, Construct Class 1 bikeway from Dry Creek to Champions Oaks Blvd. (Linda Linda Creek Creek Class 1 Bikeway) $2,500, Roseville, Harding Dry Creek, I-80 to Royer Park: construct class 1 I-80 to Royer Park Bikeway bikeway in 2 phases. $3,140, PLA19980 Roseville PLA20220 PLA20250 Atkinson Street Bridge Replacement Sierra College Boulevard Widening Construct pedestrian/bicycle bridge to span the Union Pacific Railyard. Replace existing 2 lane Atkinson St Bridge at Dry Creek with a 4-lane bridge Widen Sierra College Blvd from Olympus Dr to north city limits from 2 to 4 lanes $190, $4,100, $3,700, PLA20291 Roseville Multitransit Center In Central Roseville, construct parking facilities for multi-modal transit center $2,600, Page 6 of 23 4/4/2006
93 Appendix E Project List ID Project Title Project Description Total Cost PLA20870 PLA25027 PLA25028 Downtown Roseville Revitalization Historic District Revitalization Project Riverside Avenue Revitalization Project In Roseville, revitalization of downtown historical district. Completion Year $585, In Roseville Historic District on Main, Church, Lincoln and Pacific Streets; Add streetscape improvements including landscaping, lighting, street furniture and specialty pavement; infrastructure improvements including water, sewer, storm drain, curb, gutter, sidewalk and pavement rehabilitation. $5,600, Riverside Ave. from Douglas Blvd. to Darling Way; develop project area specific plan, add streetscape improvements including landscape, lighting, signage, street furniture, and specialty pavement; and rehabilitate water, sewer, curb, gutter, sidewalk and pavement. $9,000, PLA25029 Roseville Roadway Resurfacing Asphalt resurfacing of various roadways in Roseville. $1,600, Roseville Transit Preventive PLA25120 Maintenance In Roseville, perform preventive maintenance for Roseville Transit. $1,690, Placer County Dept of Public Works PLA15070 I-80 Widen the Auburn Ravine Rd. overcrossing from 2 to 4 lanes. $5,000, PLA15080 Auburn-Folsom Rd Widening Widen Auburn-Folsom Rd from Sacramento County line to Douglas Bl. from 2 to 4 lanes (three phases) $21,300, PLA15100 Baseline Road In Placer County, Baseline Rd. from Fiddyment Rd. to Watt Ave.: widen from 2 to 4 lanes. $4,500, PLA15105 Baseline Road Widen from 2 to 4 lanes from Watt Avenue to Sutter County line. $5,698, PLA15120 Bill Francis Dr. Contruct 2-lane road from new Airport Rd. to old Airport Rd. $1,000, PLA15130 I-80 Bowman Undercrossing Road Widen from 2 to 4 lanes from Bowman Rd to Lincoln Way. $560, PLA15270 North Antelope Rd. Widen from 2 to 4 lanes from Sacramento County line to PFE Rd. $209, PLA15300 Parallel Road. Construct as a 2 lane road from Dry Creek Rd. to Quartz Rd., east of Route 49, including a connector to Locksley Lane and Quartz Drive. $3,500, PLA15330 Quartz Dr. Construct as a 2 lane road from Route 49 southeast to Bell Rd. $404, PLA15390 Sierra College Blvd. Widen from 2 to 4 lanes from Route 193 to Loomis Town Limits. $4,400, PLA15410 Sunset Blvd. Construct a 4-lane road extension from Cincinnati Ave to Fiddyment Rd. $1,168, PLA15420 Walerga Road. PLA16840 Douglas Road Widen and realign from 2 to 4 lanes from Baseline Rd. to Sacramento Co. line. $7,400, In Placer County, Douglas Road: widen from 4 to 6 lanes from Cavitt Stallman Road south to Sierra College Boulevard. $500, PLA th Street Phased construction of a 4 lane road from Baseline Rd. to Sacramento County line. $244, Extend road west/north to Baseline Rd. at Brewer Rd. and east/north to PLA18390 Dyer Lane Baseline Rd. (west of Fiddyment Rd.) and widen to 4 lanes in accordance with the Placer Vineyards Specific Plan. $16,000, PLA18420 Foothills Blvd. Construct as 2 lane road from Athens Rd. to the City of Lincoln. $6,800, PLA18450 Indian Hill Rd. Widen from 2 to 4 lanes from Auburn City Limits to Newcastle. $8,000, PLA18460 Industrial Avenue Widen from 2 to 4 lanes, from Sunset Blvd. to Athens Rd. $1,500, PLA18490 PFE Road. Widen from 2 to 4 lanes and realign from Watt Ave. to Walerga Rd. $2,000, PLA19510 Route 65 Construct Sunset Blvd. interchange. $16,800, PLA20350 Local Roads in Auburn In and near Auburn - adjacent to SR 49 between I-80 and Dry Creek Rd., construct new local connector road. State and local funding only. $2,000, PLA20560 Bell Road Widen from 3 to 4 lanes (additional eastbound lane) from Professional Drive to Richardson Drive $2,000, PLA20570 Placer Hills Road Widen from 2 to 3 lanes to accomodate truck climbing lane from.25 mile north of Sugar Pine Rd. to Combie Rd. Also add left turn pockets at appropriate intersections. $3,360, PLA20620 Foothills Boulevard Extension Phased construction of a 4 lane road extension from Sunset Blvd to Athens Ave.. $3,300, PLA20650 Lincoln Way Widen from 2 to 4 lanes from Russell Road to Ferguson Road. $370, PLA20660 New Road Construct a new 2-lane road between Kemper Rd. and Mt. Vernon Rd. $1,300, PLA20670 Route 49 Bypass Construct a 4 lane limited access roadway to provide bypass to Route 49 through Auburn from Bell Rd. (East of New Airport Rd.) to I-80 (Bowman Interchange). $60,000, PLA20680 Baseline Road Widen From 4 to 6 lanes from Watt Avenue to Fiddyment Road. $1,100, PLA20690 PFE Road Widen from 2 to 4 lanes from North Antelope Rd. to Roseville City Limits. $410, PLA20700 Watt Avenue Widen from 2 to 4 lanes from Baseline Rd. to Sacramento County Line. $4,745, PLA20710 Sierra College Blvd. Widen from 4 to 6 lanes from north of Douglas Blvd. to Sacramento County Line. $5,000, Page 7 of 23 4/4/2006
94 Appendix E Project List ID Project Title Project Description Total Cost Completion Year PLA20730 Nelson Road Widen from 2 to 4 lanes from Future Route 65 Bypass interchange to Nicolaus Road. $1,100, PLA20880 Walerga Road Bridge Widening In Placer County, Walerga Road at Dry Creek: replace bridge and widen from 2 to 4 lanes. $6,500, PLA25006 TART CNG Facility Phase 2 Cabin Creek, construct improvements to the TART CNG Fueling Facility (phase 2). $300, PLA25026 Fleet Air Quality Upgrade DPW Fleet Air Quality Upgrade - Replace 11 diesel powered vehicles used for road maintenance activities in the unincorporated area of Placer County. $1,063, North of Auburn, SR 49: plant trees, shrubs and groundcover in five PLA25121 Highway 49 Streetscape Project landscaped medians along Highway 49 just north of Auburn. $647, Construct new 2 to 4 lane road from Watt Avenue extension to De La Salle PLA25128 DE LA SALLE ACCESS RD. University $6,000, PLA25130 FIDDYMENT RD. WIDENING Widen Fiddyment Road from 2 lanes to 4 lanes from Roseville City Limits to Athens Road $4,000, PLA25133 Widening of Foothills Boulevard from the Roseville City Limits north to Sunset FOOTHILLS BLVD. WIDENING Boulevard $7,000, Construct a new 4 lane road extension of Watt Avenue from Baseline Road PLA25135 WATT AVENUE EXTENSION north to Blue Oaks Blvd. extension. $6,000, Placer County Transit Placer County Transit Preventive Maintenance & ADA Placer County Transit: perform preventive maintenance on the Placer County PCT10458 Service Transit fleet ($245,000 FTA)and provide ADA transit service($180,000 FTA). $682, Placer County Transit Preventive Maintenance & ADA Placer County Transit: Perform preventive maintenance on the Placer County PCT10469 Service Transit fleet ($250,000 FTA)& provide ADA transit service ($185,000 FTA). $716, Placer County Transit Preventive Maintenance & ADA Placer County Transit: Perform preventive maintenance on the Placer County PCT10470 Service Transit fleet ($255,000 FTA) & provide ADA transit service ($190,000 FTA). $752, PCT10473 Placer County - Transit Operating Assistance FY 05/06 Operation of transit services in non-urbanized areas of Placer County $287, PCT10474 Placer County -Transit Operating Assistance FY 06/07 Operation of transit services in non-urbanized areas of Placer County $312, PCT10475 Tahoe Truckee Jobs Access Reverse Commute Program In Placer County, Provide JARC operating assistance to Tahoe Area Regional Transit. $1,320, Placer County Transportation Planning Agency PCT10000 Commuter rail stations Commuter rail stations improvements and maintenance facility $8,000, PCT10020 Commuter rail O&M Annual operating and maintenance cost for regional rail for twoyears; stops in Placer and Sacramento counties $4,000, PCT10230 Placer County Annual operating and maintenance cost for regional rail for seven years ( ) $14,000, PLA19080 I-80 Corridor Commuter Rail I-80 corridor regional rail rolling stock purchase. $5,000, PLA19150 I-80 Corridor Commuter Rail I-80 corridor regional rail track improvements. $4,000, PLA19780 Placer County PPM Plan, program, monitor $490, South Placer Regional Transportation Authority PLA20721, PLA20723 Placer Parkway In Placer County, construct new 2 lane roadway between SR 65 and SR 99, with an extension to Sacramento International Airport and including open space buffer. $400,000, PLA20722 Placer Parkway Phase 2 In Placer County, Placer Parkway from SR 65 to SR 99: widen from 2 to 4 lanes. $118,000, Town of Loomis Dept of Public Works PLA15250 King Road In Loomis, King Road: add turn lane from Sierra College Boulevard to Boyington Road. $809, PLA15260 Swetzer Road In Loomis, Swetzer Road: extend 3 lanes from King Road to Sierra College Boulevard. $3,500, PLA15290 Boyington Road In Loomis, Boyington Road: extend 3 lanes from Horseshoe Bar Road to King Road. $650, PLA15350 Rocklin Road In Loomis, Rocklin Road from Barton Road to west town limits: widen from 2 to 4 lanes. $1,200, PLA15940 Taylor Rd. Widen from 2 to 4 lanes from Horseshoe Bar Rd. to King Rd. $400, PLA16350 Horseshoe Bar I-80 Widen overcrossing 2 to 4 lanes and improve ramps. $15,000, PLA20510 UPRR Crossing at Sierra College Blvd. Build over/undercrossing at Sierra College Blvd. at UPRR $30,000, PLA20890 Sierra College Boulevard In Loomis, Sierra College Blvd. from Granite Dr. to north town limits, widen from 2 to 4 lanes. $3,700, Page 8 of 23 4/4/2006
95 Appendix E Project List ID Project Title Project Description Total Cost Completion Year PLA20900 PLA20910 Taylor Road Improvements Taylor Road PLA20920 Horseshoe Bar Road Sacramento County SAC21431 Arcade Creek Trail Improvement Project In Loomis, Taylor Road from south town limits to King Road: add signals at three intersections, 2500 feet of two-way left turn lanes, bike lanes, sidewalk, curb, gutter and underground drainage system. See note below. $1,600, In Loomis, Taylor Road from King Road to north town limits: add turn lane and bike lanes. $690, In Loomis, Horseshoe Bar Road from Walnut Extension to Taylor Road: add 1,000 feet of two-way left turn lane (for safety) and bike lanes. See note below. $700, Arcade Park District In Sacramento County, along Arcade Creek and Verde Cruz Creek: install approx linear feet of trail, construct low flow bridge and habitat interpretive signage. $113, Caltrans District 3 CAL16900 Route 99 Add a lane in each direction from I-5 to 70/99 split. $100,000, SAC20670 I-5 / I-80 Reconstruct ramp from eastbound to northbound traffic. $18,000, Construct HOV lanes and community enhancements on U.S. 50 from CAL16790 U.S. 50 Downtown Sacramento to Sunrise Boulevard. $195,000, CAL17150 SR 99 Landscaping & Irrigation In Sacramento, SR 99 from 0.2 miles south to 0.2 miles north of Florin Road: replace plants and upgrade irrigation. $1,631, CAL17600 SR 160 Bridge Projects Near Isleton, SR 160 at Sac. River Bridge, Steamboat Slough and Paintersville Bridge: construct new control house and walkway. $5,988, CAL17800 U.S. 50 at I-5 Construct TOS (Jct. 50 to I-5) $3,000, CAL17845 I-5 HOV Lanes In Sacramento County, I-5 from Florin Rd to Downtown: construct HOV lanes. $40,000, CAL17850 I-5 Add HOV lanes from downtown Sacramento to I-80 $37,500, CAL17850 I-5 Add HOV lanes from I-80 to Sacramento International Airport $112,500, CAL17860 I-5 Construct auxiliary lanes on I-5 from Richards Blvd to Garden Hwy $10,000, CAL18220 I-80/I-5 Revise existing interchange between I-80 and I-5. $150,000, CAL18390 I-5 and U.S. 50 Add High Occupancy Vehicle lane connectors between I-5 and U.S. 50. $50,000, CAL18400 Route 99 and U.S. 50 Add High Occupancy Vehicle lane connectors between Route 99 and U.S.50. $50,000, CAL18450 I-80 HOV lanes Construct HOV lanes from Longview Drive to I-5. $75,000, CAL18737 SR 51, Upgrade Median Barrier In Sacramento - H Street to Route 160; also on Route 5 (PM 22.4/24.6) - upgrade median barrier $13,000, CAL18738 I-5, Downtown Sac Rehab In Sacramento - Route 50 to J Street (Boat Section # M)rehabilitate structure $60,000, CAL18739 I-5, SR-160 to Richards Blvd - Rehabilitate Pavement In Sacramento - State Route 160 to Richards Blvd - rehabilitate pavement. $16,951, SR-51, Howe Ave. to north of Watt Ave. - replace planting and In Sacramento - Howe Avenue to north of Watt Avenue - replace planting and CAL18744 upgrade irrigation upgrade irrigation $2,700, In Elk Grove, San Joaquin Rail Corridor, construct platform, shelter, SAC20370 Elk Grove Intercity Rail Station landscaping and parking for intercity passenger rail station. $800, City of Citrus Heights SAC15030 Antelope Road Widening Widen Antelope Rd from Roseville Rd to I-80 from 4 to 6 lanes $8,820, SAC15300 Greenback Lane Widening Widen Greenback Lane from Auburn Blvd to Dewey Dr from 4 to 6 lanes $11,780, SAC16880 Old Auburn Road Widening Widen Old Auburn Rd from Fair Oak Blvd. to northern City Limits from 2 to 3 lanes with class 1 bikelane $8,730, SAC16910 Sunrise Blvd. Widen Sunrise Blvd. from 4 to 6 lanes including a raised median from Antelope Rd. to Placer County. $8,830, SAC16920 Sunrise Blvd. Widen Sunrise Blvd. from 4 to 6 lanes including raised median from Oak Ave. to Antelope Rd. $11,710, SAC19000 Antelope Road Enhancements In Citrus Heights, Antelope Rd from I-80 to Auburn Blvd: construction of sidewalks, Class 2 Bike lanes, sound walls, landscaping and installation of new traffic signals. $8,880, SAC22440 Sunrise Boulevard Widen Sunrise Blvd. from 4 to 6 lanes, Arcada Dr. to Oak Ave., including bike lanes, landscaping, and pedestrian facilities. $11,492, SAC22470 Auburn Blvd Enhancements From Sylvan Rd. to Antelope Rd.construct Class II Bikeways, sidewalks and landscaping. $6,485, City of Elk Grove SAC15660 Sheldon Road Widening In Elk Grove, Sheldon Road from Bruceville Rd. to SR 99 and from East Stockton Blvd. to Elk Grove-Florin Rd.: widen from 2 to 4 lanes. $12,158, SAC19010 Bruceville Road Widening In Elk Grove, Bruceville Road from Whitelock Parkway to Bilby Road: widen from 2 to 4 lanes. $3,700, SAC19020 Bond Road Widening In Elk Grove, Bond Road from Waterman Road to Bradshaw Road: widen from 2 to 4 lanes. $6,129, SAC19100 Bruceville Road Widening In Elk Grove, Bruceville Road from Poppy Ridge Road to Elk Grove Boulevard: widen from 2 to 4 lanes. $5,379, SAC19160 Sheldon Road Widening In Elk Grove, Sheldon Road from Elk Grove-Florin Road to Waterman Road: widen from 2 to 4 lanes. $8,240, Sheldon Road at State Route SAC Reconstruct Sheldon Road interchange on State Route 99. $52,623, Page 9 of 23 4/4/2006
96 Appendix E Project List ID Project Title Project Description Total Cost Completion Year SAC19780 East Stockton Blvd Bike/Ped Improvements In Elk Grove, East Stockton Blvd. from Calvine Rd. to Elk Grove-Florin Rd.: construct class 1 & 2 bikeways, sidewalks, and pedestrian traffic signals. $698, SAC20250 West Stockton Blvd./Laguna Creek Bridge In Elk Grove, West Stockton at Laguna Creek, west of SR 99 between Sheldon Rd. and Laguna Blvd.: replace existing bridge with a new structure to provide 2 traffic lanes, an access lane, shoulders and a raised sidewalk on west side of bridge $3,348, In Elk Grove, Big Horn Boulevard from Whitelock Parkway to Elk Grove SAC20280 Big Horn Boulevard Extension Boulevard: construct new four lane roadway. $7,050, SAC20290 Franklin Boulevard Widening In Elk Grove, Franklin Boulevard from Poppy Ridge Road to Elk Grove Boulevard: widen from 2 to 6 lanes. $5,055, SAC20320 Whitelock Parkway Extension In Elk Grove, construct new four lane roadway from Bruceville Road to West Stockton Blvd. $10,118, SAC20340 Willard Parkway Extension In Elk Grove, Willard Parkway from Bilby Road to Kammerer Road: construct new four lane roadway. $15,000, SAC20520 SR 99 at Grantline Road In Elk Grove, SR 99 at Grantline Road: reconstruct interchange. $57,680, Elk Grove Transit Preventive SAC24060 Maintenance In Elk Grove, preventive maintenance for Elk Grove transit operations. $375, In Elk Grove, Bradshaw Road from Sheldon Road to Calvine Road: widen SAC24073 Bradshaw Road Widening from 2 to 4 lanes. $3,500, SAC24077 Bruceville Road Widening In Elk Grove, Bruceville Road from Sheldon Road to Big Horn Blvd: widen from 4 to 6 lanes. $740, SAC24087 Willard Parkway Widening In Elk Grove, Willard Parkway from Poppy Ridge Road to Bilby Road: widen from 4 to 6 lanes. $4,100, SAC24090 Grant Line Road Widening In Elk Grove, Grant Line Road from Bradshaw Road to Bond Road: widen form 2 to 4 lanes. $8,000, SAC24092 Kammerer Road Widening In Elk Grove, Kammerer Road from SR 99 to 6000' west of SR 99: widen from 6 to 8 lanes. $4,400, SAC24094 Kammerer Road Extension SAC24097 Waterman Road Widening SAC24099 Big Horn Boulevard Extension SAC24101 Bond Road Widening SAC24102 Bradshaw Road Widening SAC24103 Bradshaw Road Widening SAC24104 Bruceville Road Widening SAC24105 Bruceville Road Widening SAC24106 Elk Grove Blvd Widening SAC24108 Laguna Springs Drive Extension SAC24109 Lotz Parkway SAC24110 Lotz Parkway SAC24111 Lotz Parkway SAC24112 Waterman Road Widening SAC24113 Kammerer Road Widening SAC24114 Kammerer Road Widening SAC24116 SR 99 at Elk Grove Blvd N- bound On-Ramp SAC24117 West Stockton Blvd Widening In Elk Grove, from Bruceville Road to I-5 (at Hood Franklin Road): construct new 4 lane roadway, modifying the I-5/Hood Franklin Road interchange, and construction of a railroad overcrossing at UP railroad tracks. $35,617, In Elk Grove, Waterman Road from Bond Road to Elk Grove Blvd: widen from 2 to 4 lanes. $6,600, In Elk Grove, construct new four lane roadway from Whitelock Parkway to Kammerer Road. $9,850, In Elk Grove, Bond Road from Bradshaw Road to Grant Line Road: widen from 2 to 4 lanes. $10,191, In Elk Grove, Bradshaw Road from Bond Road to Sheldon Road: widen from 2 to 4 lanes. $3,052, In Elk Grove, Bradshaw Road from Grant Line Road to Bond Road: widen from 2 to 4 lanes. $10,491, In Elk Grove, Bruceville Road from Laguna Blvd to Elk Grove Blvd: widen from 4 to 6 lanes. $475, In Elk Grove, Bruceville Road from Bilby Road to Kammerer Road: widen from 2 to 4 lanes. $3,750, In Elk Grove, Elk Grove Blvd from UPRR to Franklin Blvd: widen from 5 to 6 lanes. $505, In Elk Grove, Laguna Springs Drive from Elk Grove Blvd to Lotz Parkway: construct new 4 lane roadway. $3,100, In Elk Grove, construct new four lane roadway from Big Horn Blvd to Laguna Springs Drive. $1,850, In Elk Grove, construct new four lane roadway from Laguna Springs Drive to Whitelock Parkway $3,700, In Elk Grove, construct new four lane roadway from Whitelock Parkway to Kammerer Road. $12,000, In Elk Grove, Waterman Road from Elk Grove Blvd to Grant Line Road: widen from 2 to 4 lanes. $11,600, In Elk Grove, Kammerer Road from SR 99 to 6000' west of SR 99: widen from 2 to 6 lanes. $7,500, In Elk Grove, Kammerer Road from 6000' west of SR 99 to Bruceville Road: widen from 2 to 4 lanes. $7,000, In Elk Grove, SR 99 at Elk Grove Blvd: add northbound loop on-ramp, remove traffic signal at existing northbound on-ramp and add second westbound left turn lane to existing southbound on-ramp. $5,000, In Elk Grove, West Stockton Blvd from Kammerer road to 6000' north: widen from 2 to 6 lanes. $9,600, SAC24118 Grant Line Road Widening SAC24119 Grant Line Road Widening SAC24120 Sheldon Road Widening In Elk Grove, Grant Line Road from East Stockton Blvd to Waterman Road: widen from 2 to 6 lanes, including grade separation over the UPRR tracks. $15,200, In Elk Grove, Grant Line Road from Waterman Road to Bradshaw Road: widen from 2 to 4 lanes. $10,300, In Elk Grove, Sheldon Road from Waterman to Bradshaw: widen from 2 to 4 lanes $8,240, City of Folsom Dept of Public Works Page 10 of 23 4/4/2006
97 Appendix E Project List ID Project Title Project Description Total Cost Completion Year SAC18400 East Bidwell Street In Folsom, East Bidwell Street from Oak Avenue Parkway to Blue Ravine Road: widen to six lanes. $1,100, SAC19880 U.S. 50 at Oak Ave. Construct 4 lane interchange for newly extended Oak Av. $20,000, SAC19890 US 50 at Empire Ranch Road Construct 4 lane interchange with US 50 at extension of Empire Ranch Road (formerly Russell Ranch Rd.). $23,701, Folsom Historic District Park n SAC20220 Ride Lot In Folsom historic district, construct park and ride lot. $555, In Historic Folsom, NW corner of the Railroad Block redevelopment propoerty at the Leidesdorf Street and proposed Reading Street: development of a multimodal transit center to serve Sacramento Regional Transit District's Historic SAC20570 Folsom Railroad Block District light rail station. $5,661, SAC21210 Iron Point Road In Folsom, Iron Point Road from Black Diamond Drive to East Bidwell Street: widen to six lanes. $8,000, SAC21250 Blue Ravine Rd. Widen WB approach to Folsom Blvd. to provide dual left-turn lanes and exclusive through and right-turn lanes. $1,200, SAC21270 Sibley Street In Folsom, Sibley Street from Glenn Drive to Blue Ravine Road: widen to 4 lanes. $1,500, SAC21280 Green Valley Road In Folsom, Green Valley Road from East Natoma to Sacramento/El Dorado County line: widen from 2 to 4 lanes. $3,000, SAC22280 Oak Avenue Parkway In Folsom, Oak Avenue Parkway from Folsom-Auburn Road to Baldwin Dam Road: widen to 4/6 lanes. $3,300, SAC22340 American River Bridge In Folsom, construct crossing of the American River below Folsom Dam with approach. $110,000, Folsom Transit Preventive SAC24061 Maintenance In Folsom, perform preventive maintenance for Folsom Stage Lines. $856, In Folsom, construct Intelligent Transportation Systems infrastructure at SAC24063 Folsom ITS Project various loactions within the City. $4,200, Glenn Drive Light Rail Station Transit Oriented Development In Folsom, Glenn Drive Light Rail Station: conduct strategic planning to develop light rail station into a transit-oriented development, including a marketing/implementation plan for coordination activities, public outreach and SAC24067 Master Plan partnership opportunities. $165, In Folsom, East Natoma Street from Fargo Street to Blue Ravine Road: widen SAC22060 East Natoma Street to 4 lanes. $2,120, City of Galt Dept of Public Works SAC17180 Carillion Boulevard Extension In Galt, Carillion Boulevard from Simmerhorn Road to Crystal Way: construct new road. $2,500, SAC17190 Elm/Amador Intersection In Galt, intersection of Elm and Amador Avenues: reconstruct and realign intersection to eliminate hazard. $800, SAC17200 Simmerhorn Road Extension In Galt, Simmerhorn Road: construct new road to extend from existing terminus to Carol Drive and Amador Avenue. $2,800, SAC17210 F Street/New Hope Connector In Galt: F Street and New Hope Road: realign intersection of roadways to connect major east-west arterial. $1,100, SAC19750 Lincoln Way Reconstruct Lincoln Way from Southdale to South Sacramento County line. $3,000, SAC20580 Central Galt Interchange In Galt, A & C Streets, Boessow Road at SR 99: replace/reconstruct interchange and widen overpass to 4 lanes with bike lanes. $26,420, SAC20590 Twin Cities Road In Galt, SR 99 at Twin Cities Road, widen Twin Cities Road overpass to 4 lanes with addition of bikelanes. $10,000, City of Rancho Cordova Folsom Boulevard Project development to Install landscaping and streetscaping on Folsom Blvd. SAC21470 Enhancements between Rod Beaudry Dr. and Sunrise Blvd. $3,405, In Sacramento County, Folsom Boulevard from Mather Field Road to Coloma SAC15250 Folsom Boulevard Widening Road: widen from 4 to 6 lanes. $5,000, SAC22420 Douglas Road Widening In Sacramento County, Douglas Road from Sunrise Boulevard to Grant Line Road, widen from 2 to 4 lanes. $6,320, US 50 at Mather Field Rd Design, install, and maintain landscape improvements within the existing freeway interchange of US 50 at Mather Field Road. Includes streetscape, lighting, and other enhancements on Mather Field Rd between Folsom and SAC22180 Interchange Mather Commerce Center. $1,600, In Rancho Cordova, Folsom Boulevard at La Loma Drive: develop a "city center" across the street from existing light rail station. Replace street frontage to include a cafe sidewalk and parallel street parking and construct a SAC24064 Rancho Cordova City Center two-level parking garage. $2,190, City of Sacramento Dept. of Transportation CAL16900 Route 99 Add a lane in each direction from I-5 to Elkhorn Blvd. $1,733, SAC th St. Extension Extend 5th Street from H Street to Gateway Blvd. $30,000, SAC24155 West Side Access Extend 3rd Street from I Street to Depot. $8,000, SAC15930 Cosumnes River Blvd. Widen Cosumnes River Blvd. to 4 lanes from Franklin Blvd. to Center Pkwy. $10,000, SAC16000 Exposition Blvd. Construct split-diamond interchange at Route 160 $35,000, SAC16010 Florin-Perkins Rd. Widen Florin-Perkins Rd. to 6 lanes from Folsom Blvd. to Fruitridge Rd. $12,000, SAC16040 Route 16 Realign Jackson Rd. as a 4 lane roadway from Power Inn Road to South Watt Avenue. $18,000, Page 11 of 23 4/4/2006
98 Appendix E Project List ID Project Title Project Description Total Cost Completion Year SAC16060 Northgate Blvd. In Sacramento, construct operational improvements at the Arden Garden / Northgate Blvd. inersection. $5,000, SAC16070 Power Inn Rd. Widen Power Inn Rd. to 6 lanes from Fruitridge Rd. to 14th. $25,000, SAC16092 Richards Boulevard Widening Widen Richards Blvd from north 7th St to North 12th St from 2 to 5 lanes with bikelanes $3,630, SAC16130 West El Camino Widening In Sacramento, West El Camino Avenue, I-80 to Natomas Main Drainage Canal: widen from 4 to 6 lanes and add bike lanes. $6,000, West El Camino Bridge In Sacramento, West El Camino Avenue between American Avenue and SAC16140 Replacement Western Avenue: replace existing structurally deficient bridge. $7,680, In Sacramento, Bruceville Road from Sheldon Road. to Cosumnes River Blvd: SAC17590 Bruceville Road widen from 2 to 4 lanes. $10,000, SAC17620 Garden Highway Widen to 4 lanes from the western terminus of the Arden Garden Connector to 300 feet east of I-5 ramps. $35,000, th and 16th Street Light Rail Station Connectivity Construct improved pedestrian access, lighting and signage around the 13th SAC17784 Improvements and 16th Street light rail stations. $885, SAC17785 Swanston Station Transit Village Planning Tower Bridge Sidewalk SAC17990 Widening R Street Bicycle/Pedestrian SAC18000 Bridge SAC18170 Richards Blvd interchange In Sacramento, Swanston Light Rail Station: perform pre-development planning to identify circulation, drainage and utility infrastructure improvements necessary to support transit-oriented development in the area. $665, In Sacramento, Tower Bridge: construct a wider pedestrian and bike path across the Sacramento River. City of Sacramento and City of West Sacramento joint project. $9,400, In Sacramento, R Street Bridge at I-5: convert former railroad bridge to bicycle and pedestrian use. $496, Widen Richards Blvd from 5 to 8 lanes and improve I-5 ramps through the interchange; reconstruct the intersections at Jibboom St. and Bercut Dr. to improve capacity $45,000, In Sacramento, project definition, feasibility & pre-environmental studies for I- 5/Richards I/C, Railyards Access Rd., 7th St. Widening, Gateway Blvd. Ext. to SR 160, Richards Blvd. widening, 6th St. Ext., SR 160/ Richards I/C, and 12th/16th NB Intersection. $5,916, SAC18250 North CBD Access Study SAC th St. Widen 7th St. from 2 to 4 lanes from Richards to Vine St. $4,600, Extend Consumnes River Boulevard from Franklin to Freeport with an SAC18380 I-5 at Cosumnes River Blvd. interchange at I-5 $80,000, Extend East Commerce Way from planned Club Center Dr. to Elkhorn Blvd. SAC18440 East Commerce Way as a 4 lane road. $3,000, In Sacramento, East Commerce Way from planned Club Center Drive to Del SAC18460 East Commerce Way Paso Rd: extend as a 6-lane facility. $3,831, SAC18470 East Commerce Way In Sacramento, East Commerce Way, from Del Paso to Arena: widen 4 to 6 lan $4,000, Widen Elkhorn Blvd. to 4 lanes from Route 99 east to the City limits (related SAC18500 Elkhorn Blvd. interchange widening listed under Route 99) $11,367, In Sacramento, Elkhorn Boulevard from SR 99 to east city limits: widen from 4 SAC18510 Elkhorn Boulevard to 6 lanes. $7,000, SAC18540 Gateway Park Drive Widen Gateway Park Dr. to 4 lanes from Del Paso Rd. to Arena Blvd. $3,000, Build new Natomas Crossing Drive as 4 lane road from I-5 westward to El SAC18560 Natomas Crossing Drive Centro Rd. $3,646, Extend East Commerce Way from Arena Blvd. to the planned Natomas SAC18570 East Commerce Way Crossing Drive as a 6 lane road. $3,217, Extend East Commerce Way from planned Natomas Crossing Drive to San SAC18580 East Commerce Way Juan Rd. as a 4 lane road. $1,890, Construct Snowey Egret Way south of Del Paso Rd. from El Centro Rd. to SAC18600 Snowey Egret Way Commerce Way as a 4 lane road $2,237, SAC18610 El Centro Rd. Widen El Centro Rd. from 2 to 4 lanes from Del Paso Rd. to Arena Blvd. $3,390, West El Camino SAC18650 Interchange Expand the West El Camino interchange on I-80 to 4 lanes and modify ramps. $20,000, Sacramento, I-5 between Del Paso Rd. to Route 99; add a northbound SAC18660 I-5 road widening auxilary lane $714, Add a second SB on-ramp lane from Route 99 to I-5 at the I-5/Route 99 SAC18670 Route 99 Interchange interchane. $216, SR 99 Elkhorn Boulevard Expand the Elkhorn Blvd. interchange on Route 99 to accommodate the SAC18690 Interchange widening of Elkhorn Blvd. from 2 to 6 lanes $2,762, Extend the existing westbound off-ramp onto Northgate Blvd. for safety SAC18700 Northgate Blvd. reasons, add auxiliary lane to westbound on-ramp. $10,000, Construct Snowey Egret Way overcrossing of I-5 for the planned Snowey Egret Way that will run east-west from El Centro Rd. to Commerce Way SAC18710 Snowey Egret Way at I-5 crossing over I-5. $2,580, SAC18720 Natomas Crossing Drive Construct Natomas Crossing Drive overcrossing of I-5. $1,597, SAC18740 El Centro Rd. Extend El Centro Rd. northeasterly over I-5 and east to East Commerce Way. $2,167, CSUS Bike/Pedestrian Access SAC19250 Project Sacramento - Provide improved bicycle and pedestrian access near CSUS $3,724, SAC19550 Raley Blvd. Widen Raley Blvd. to 4 lanes from Santa Ana Ave to Ascot Ave. $25,000, Arden Way/SR 51 Interchange Arden Way underpass improvements to remove restriction caused by columns SAC19560 Improvements and widen to 6 lanes. $19,500, Page 12 of 23 4/4/2006
99 Appendix E Project List ID Project Title Project Description Total Cost Completion Year SAC20000 Route Exposition Blvd. Add EB on-ramps at Exposition Blvd. $15,000, Sacramento Intermodal In Sacramento, develop intermodal transportation terminal for heavy rail, light SAC20350 Terminal rail and bus service. $225,000, SAC20720 Ueda Parkway Bikeway SAC20761 Traffic Operations Center SAC20762 Traffic Operation Center SAC20763 Traffic Operation Center SAC20764 Traffic Operation Center SAC20780 Ramona Ave SAC20820 Power Inn Road Widening SAC21540 SR 160 at Northgate Construct bike trail on the west side of the levee of the Natomas East Main Drain from Arden Garden to Elkhorn, Arcade Creek and Dry Creek trails. $2,595, In Sacramento, connect 100 traffic signals, including ITS technology that are located outside of the Central City to the City's existing TOC. $8,500, Connect 100 traffic signals, including ITS technology, that are located outside of the Central City to the City's existing TOC. $9,900, Connect 100 traffic signals, including ITS technology, that are located outside of the Central City to the City's existing TOC. $11,100, Connect 100 traffic signals, including ITS technology, that are located outside of the Central City to the City's existing TOC. $10,000, Extends two-lane roadway and center turn lane from to Folsom Blvd with bike lanes. $7,000, Widen Power Inn Rd from Folsom Blvd to 14th Ave from 4 to 6 lanes with expanded intersection along Power Inn Rd from Folsom Blvd to 14th Ave $6,635, In Sacramento, SR 160 at Northgate Interchange: add an eastbound on-ramp and a westbound off-ramp. $22,000, SAC22080 Gateway Park Boulevard Widen Gateway Park Blvd from Truxel Road to Arena Blvd. from 2 to 4 lanes $1,800, SAC22170 North B St Reconstruction In Sacramento, North B Street from North 7th to North 12th: reconstruct street including curb, gutter, sidewalk and associated drainage work. $3,300, Bridge Road Bridge SAC22210 Replacement Replace Bridge Road bridge over Arcade Creek $1,330, SAC22220 Main Avenue Bridge Replacement In Sacramento, Main Ave. Bridge over Natomas east Main Drain: replace existing 2-lane bridge with a 4-lane bridge. $24,000, SAC22460 Pavement Rehabilitation In Sacramento, various streets: rehabilitate pavement. $2,106, SAC22530 Bridging I-5 Construct connection over I-5 between river esplanade and Crocker District, Capitol Ave. to "O" St. $250,000, SAC22580 Arden Way Improve Arden Fair Mall roadways, including realigning access road, intersections and signals. $4,100, SAC22610 Folsom Boulevard Widen Folsom Blvd. to 4 lanes, Hornet Dr. to 65th St. $39,000, SAC22620 I-80 Bike/Ped Bridge Construct bike/pedestrian bridge across I-80 at the West Canal, as well as across the West Canal. $850, SAC th Street Improvements In Sacramento, east side of 65th Street from Lemon Hill to Fruitridge: construct sidewalk, curb, gutter and bike lanes. $1,505, In Sacramento, 65th Street from 14th Ave. to south city limits: construct sidewalks, curb, gutter, planter strips, street lights and storm drain SAC th Street Pedestrian Facilities modifications. $13,000, In Sacramento, realign Sutterville Bypass/23rd St.and Sutterville Rd. and SAC22650 Sutterville Road and 23rd Street install new traffic signal. $2,000, SAC22660 SR 160 at Richards In Sacramento, SR 160 at Richards Boulevard: install signalized intersection. $3,200, th St. Bike and Pedestrian Feasibility study to investigate providing bike and pedestrian improvements SAC22680 Improvements through the Highway 50 and 65th Street Interchange. $165, SAC th Avenue Extend 4th Ave. from 65th St. to Ramona Ave. $25,000, SAC th Street Extension Extend 6th St. between Richards Blvd. and H St. $47,000, SAC th Street Widen 7th St. to 4 lanes from E St. to Richards Blvd. $25,000, SAC22840 Bell Ave. Widen Bell Ave. from 2 to 4 lanes from Norwood Ave. to Raley Blvd. $20,000, SAC22850 Bell Avenue Widen Bell Ave. from 2 to 4 lanes from Raley Blvd. to Winters St. $12,000, SAC22870 Del Paso Road Widen Del Paso Road overcrossing of I-5 to 6 lanes. $1,700, SAC22880 Del Paso Road Widen Del Paso Road from 4 to 6 lanes from El Centro to I-5. $400, SAC22890 ITS on Arden Way Smart Corridor on Arden Way from Del Paso to Watt Ave. $2,418, SAC22891 ITS on Arden Way Operating and Maintenance for Arden Way Smart Corridor from 2010 to $2,100, SAC23320 Del Paso Road Widen Del Paso Road from 4 to 6 lanes from Truxel Rd. to east city limits. $3,361, SAC23330 El Centro Road Widen to 4 lanes from Arena Blvd.to San Juan Road $4,200, SAC23370 Fruitridge Road Widen Fruitridge Rd. to 6 lanes from Forin Perkins Rd. to S. Watt Ave. $8,000, SAC23380 G St. Extension Extend G St. from 7th to 5 th St. (2 lanes) $1,000, SAC23390 Gateway Blvd. Construct a new road from the Railyards Access Road to N. 12th St.; intersection improvements at 12th and North B St. and connection to 12th and 16th Streets. $30,000, SAC23400 West El Camino Construct a northbound entrance ramp and southbound exit ramp at W. El Camino Ave./I-5 interchange. Modify the NB I-5 to I-80 ramp to accommodate the proposed interchange ramps $25,000, SAC23410 Kiefer Boulevard Widen Kiefer from 2 to 4 lanes between Florin-Perkins Rd. to S. Watt Ave. $4,000, SAC23430 Main Avenue Widen Main Ave. from 2 to 4 lanes from Norwood Ave. to Rio Linda Blvd. $7,000, SAC23440 Mangan Park Bike trail south of Mangan Park in Executive Airport right-of-way from 24th Street to Freeport Blvd mile $300, SAC23460 Natomas Boulevard Widen Natomas Blvd. To 6 lanes from North Park Drive to Del Paso Road $2,060, SAC23470 Natomas Boulevard Widen Natomas Blvd. From 2 to 6 lanes from Club Center Dr. to North Park Dri $1,099, Page 13 of 23 4/4/2006
100 Appendix E Project List ID Project Title Project Description Total Cost Completion Year SAC23480 Natomas Boulevard Widen Natomas Blvd. From 2 to 4 lanes from Elkhorn Blvd. To Club Center Dr. $2,805, SAC23520 Railyards Access Road Jibboom St. improvements between Richards Blvd. and the railyards site to provide access to the site from the north. $15,000, SAC23530 Roseville Road Widen Roseville Rd. from 2 to 4 lanes from Connie Dr. to Sacramento City limits $4,000, SAC23540 S. Watt Widening Widen S. Watt Ave. to 6 lanes between Elder Creek Road and Fruitridge Rd. $20,000, SAC23560 Silver Eagle Road Widen Silver Eagle Rd. to 3 lanes between Norwood Ave. and Mabel Ave. $2,000, SAC th St. Widening In Sacramento, 65th St. from Hwy. 50 to Broadway: widen to 6 lanes. $4,000, SAC23650 Bruceville Rd. Widening In Sacramento, on Bruceville Road: Between Sheldon Road and Consumnes River Blvd; widen to 6 lanes $8,000, SAC23680 Elder Creek Rd widening In Sacramento on Elder Creek Rd.: between Florin Perkins to South Watt Ave.; widen to four lanes $7,000, SAC23690 Elder Creek Rd. widening In Sacramento, Elder Creek Rd. between Power Inn and Florin Perkins Rd; widen to 4 lanes $6,000, SAC23770 I-5 Natomas Bike Trails North Natomas, on both sides of I-5; bike trail system miles $1,500, SR 99 Meister Way Sacramento, at Hwy 99, south of Elkhorn Blvd: Meister Way freeway SAC23810 overcrossing overcrossing $1,006, Sacramento, on Northgate Blvd.: from Route 160 to Garden Highway; widen SAC23820 Northgate Boulevard Widening to 4 lanes $12,000, SAC23840 Richards Boulevard Widening Sacramento, Richards Blvd.: from SR 160 to Bercut Drive; widen to 6 lanes. $20,000, SAC23850 South Watt Avenue Widening Sacramento, South Watt Ave.: from Jackson Rd. to Elder Creek; Widen to 4 lanes $10,000, SAC23860 South Watt Avenue Widening Sacramento, South Watt Ave.: from Fruitridge Rd. to Folsom Blvd.; widen to 6 lanes $10,000, SAC23890 Sutter Landing Bridge Sacramento, Sutter Landing Bridge, between American River Parkway and Sutter Landing Park; bike/ped bridge over American River $5,000, SAC24065 Broadway/Martin Luther King Jr. In Sacramento, Broadway at Martin Luther King Jr. Boulevard: construct Intersection Enhancement Project improved curb, gutters and sidewalk, higher visibility crosswalks, accessibility ramps, replace signals and implement traffic calming measures. $685, SAC24068 Docks Area Redevelopment Project SAC18660 I-5 road widening SAC18670 Route 99 Interchange SAC18690 SR 99 Elkhorn Boulevard Interchange SAC18700 Northgate Blvd. SAC18710 Snowey Egret Way at I-5 In Sacramento, north of Broadway along the Sacramento River: perform planning for the redevelopment of the Docks Area, including circulation plan, infrastructure assessment, financing plan, and related environmental review. $680, Sacramento, I-5 between Del Paso Rd. to Route 99; add a northbound auxilary lane $714, Add a second SB on-ramp lane from Route 99 to I-5 at the I-5/Route 99 interchane. $216, Expand the Elkhorn Blvd. interchange on Route 99 to accommodate the widening of Elkhorn Blvd. from 2 to 6 lanes $2,762, Extend the existing westbound off-ramp onto Northgate Blvd. for safety reasons, add auxiliary lane to westbound on-ramp. $10,000, Construct Snowey Egret Way overcrossing of I-5 for the planned Snowey Egret Way that will run east-west from El Centro Rd. to Commerce Way crossing over I-5. $2,580, SAC20000 Route Exposition Blvd. Add EB on-ramps at Exposition Blvd. $15,000, SAC20670 I-5 / I-80 Reconstruct ramp from eastbound to northbound traffic. $18,000, SAC21540 SR 160 at Northgate SAC20811 Jed Smith CAL18748 Bloom Ranch Entrance Road and Parking Lot Pavement Rehab In Sacramento, SR 160 at Northgate Interchange: add an eastbound on-ramp and a westbound off-ramp. $22,000, CSUS Realign and extend Jed Smith as a 2-lane connection between CSUS and Folsom Blvd. $4,000, Federal Highway Administration In Sacramento County, Bloom Ranch Entrance Road and Parking Lots: rehabilitate pavement. $385, Sacramento County Dept of Transportation Widen from South Watt Ave. to Excelsior Rd. from 2 to 4 lanes and add continuous left turn lane. $6,000, CAL15410 Route 16 SR 99 Elverta Road CAL15510 Interchange Elverta Rd. Interchange $17,800, Elk Grove-Florin Road In Sacramento County, Elk Grove-Florin Road from Gerber Road to Florin SAC15170 Widening Road: widen from 2 to 4 lanes. $6,372, Page 14 of 23 4/4/2006
101 Appendix E Project List ID Project Title Project Description Total Cost SAC15180 Elkhorn Boulevard Widening Left-Turn Lanes - Various SAC15200 Locations SAC15230 Elkhorn Blvd. Widening SAC15370 Hazel Avenue SAC15380 Hazel Avenue SAC15390 Hazel Avenue Completion Year In Sacramento County, Elkhorn Boulevard from Rio Linda Boulevard to SR 99: widen from 2 to 4 lanes, including bridge over Natomas east main drain, landscaping, new RR crossing and bike/ped facilities. $14,000, In Sacramento County, various locations, installation of left turn lanes in accordance with the county DOT's Project Priority List. $705, In Sacramento County, Elkhorn Blvd. from Watt Ave. to Don Julio Blvd.: widen from 4 to 6 lanes. $9,363, In Sacramento County, Hazel Avenue from Madison Avenue to US 50: add carpool and transit capacity. $30,000, In Sacramento County, Hazel Avenue at Gold River Road: add grade separation, ramps and frontage connections. $20,000, In Sacramento County, Hazel Avenue at Greenback Lane: add undercrossing, turn ramps and community enhancements. $20,000, In Sacramento County, Hazel Avenue at Madison Avenue: improve intersection. $20,000, SAC15400 Hazel Avenue SAC15720 Watt Avenue Widening Widen Watt Ave from Elkhorn Blvd to Antelope Rd from 4 to 6 lanes $1,610, SAC15750 Watt Ave. Widen from Don Julio Blvd. to Elkhorn Blvd. from 4 to 6 lanes. $2,674, SAC16500 Madison Avenue Widening Widen Madison Avenue from Sunrise Blvd. to Hazel Ave. from 4 to 6 lanes $17,000, SAC16510 Madison Avenue Widening In Sacramento County, Madison Avenue from Hazel Avenue to Greenback Lane: widen from 4 to 6 lanes. $17,800, SAC16800 Fair Oaks Boulevard Widening Widen Fair Oaks Blvd from Marconi Ave. to Engle Rd. from 4 to 6 lanes including signal modifications at Marconi, Stanley, Grant, and Engle Rd. $9,800, Metro Air Parkway Interchange Construct new interchange on I-5 at Metro Air Parkway near Sacramento SAC18150 at I-5 International Airport $10,883, In Sacramento County, Metro Air Parkway from I-5 to Elverta Road: construct SAC18160 Metro Air Parkway new road to 4 lanes. $6,500, SAC19040 Calvine Road Widening In Sacramento County, Calvine Road from 1000 feet east of Kingsbridge Drive to Vineyard Road, widen from 2 to 4 lanes. $14,218, SAC19060 Don Julio Blvd. Widen from Antelope Rd. to North Loop Blvd. from 2 to 4 lanes $759, SAC19090 Greenback Lane Widening Widen Greenback Lane from Sunrise to Hazel Ave from 4 to 6 lanes $25,140, SAC19170 South Watt Avenue Widening Widen South Watt Avenue from Alderson Ave to Route 16 from 2 to 4 lanes with left turn lanes $3,975, SAC19290 South Watt Avenue Widening Widen South Watt Avenue from Florin Rd. to Route 16 from 2 to 4 lanes $10,451, SAC19310 Bradshaw Rd. Widen from Calvine Rd. to Florin Rd. from 2 lanes to 4 lanes $15,338, SAC19320 Bradshaw Road Widening Widen Bradshaw Rd from Florin to Morrison Creek from 2 to 4 lanes $13,830, SAC19340 Grantline Rd. / White Rock Rd. Realign and reconstruct Grantline Rd. from Douglas Blvd. through White Rock Rd. west of Prairie City Rd. $2,600, Watt/Folsom Interchange SAC19350 Modification Modify the freeway interchange at U.S. 50 and Watt Ave/Folsom Blvd $26,800, SAC19590 Various Locations Provide turning movements, improve intersections, and install traffic signals. $10,000, SAC19610 Cypress Ave. Widen from Walnut Ave. to Mazanita from 2 to 4 lanes $1,600, SAC19620 Elverta Road Widening Widen Elverta Rd. from Dutch Haven Blvd. to Watt Ave. from 2 to 4 lanes including Dry Creek Bridge to 6 lanes capacity (striped for 4). $10,100, SAC19621 Elverta Road Widening Widen Elverta Rd. from Rio Linda Blvd. to Dutch Haven Blvd. from 2 to 4 lanes including landscaped median, ADA improvements, transit access and bike/pedestrian facilities. $7,356, SAC19630 Fair Oaks Boulevard Widening In Sacramento County, Fair Oaks Boulevard from Greenback Lane to Old Auburn Road: widen from 2 to 4 lanes. $1,088, SAC19640 Franklin Blvd. Widen from Martin Luther King, Jr Blvd. to Florin Rd. from 4 to 6 lanes $4,000, SAC19650 Garfield Ave. Widen from Auburn Blvd. to Greenback Lane from 4 to 6 lanes $1,285, SAC19660 Grantline Rd. Widen from Sloughouse Rd. to Sunrise Blvd. from 2 to 4 lanes $4,000, SAC19670 Grantline Rd. Widen from Bond Rd. to Sloughouse Rd. from 2 to 4 lanes $11,000, SAC19680 Roseville Rd. Widen from Watt Ave. to Antelope Road from 2 to 4 lanes. $3,000, SAC19690 Gerber Road Widening In Sacramento County, Gerber Road from Bradshaw Road to Vineyard Road: widen from 2 to 4 lanes. $6,688, SAC19700 Stockton Blvd. Widen from Elsie to Florin Rd. from 4 to 6 lanes $3,464, SAC19710 Sunrise Blvd. Widen from SR 16 to Grantline Rd. from 2 to 4 lanes $7,000, SAC19711 Sunrise Boulevard Widening In Sacramento County, Sunrise Boulevard from SR 16 to north of Douglas Road: widen from2 to 4 lanes. $15,000, SAC19720 Sunrise Boulevard In Sacramento County, Sunrise Boulevard at SR 16: add overcrossing and ramps. $20,000, SAC19790 Antelope Road Widening In Sacramento County, Antelope Road from Don Julio Boulevard to Roseville Road, widen from4 to 6 lanes. $735, SAC20240 Zinfandel Road Extension In Sacramento County, Zinfandel Road from Douglas Road to south terminus: construct new road to 6 lanes. $4,790, McClellan Commuter Rail In Sacramento County, former McClellan Air Force Base: construct a rail SAC20360 Station station. $5,000, In Sacramento County, Grantline Road from Elk Grove Boulevard to Sloughouse Road: add frontage roads to connect various local access roads SAC20510 Grantline Road intersecting Grantline. $25,000, SAC20530 Grantline Road In Sacramento County, Grantline Road from SR 99 to Bond Road: widen from 2 to 4 lanes. $12,000, SAC20840 Various Locations Traffic Operations System Center - Stage II $16,000, Page 15 of 23 4/4/2006
102 Appendix E Project List ID Project Title Project Description Total Cost SAC21480 Franklin Boulevard Streetscaping SAC21500 Hazel Ave. SAC22020 Antelope North Road Widening SAC22070 Watt Ave. Phase 3 ITS Project Watt Avenue Enhancements SAC22200 Phase 2 I-80 Bicycle / Pedestrian SAC22290 Crossing SAC22300 Elverta Road Widening SAC22320 Kiefer Boulevard American River Access SAC22330 Improvements SAC22370 Bikeway Master Plan Construction Phase 2 SAC22410 Douglas Road Widening SAC22430 Eagles Nest Road Widening SAC22690 Florin Road Enhancements SAC22710 Fulton Ave. Enhancements Phase 2 Completion Year Project development to provide landscaping and streetscaping on Franklin Blvd. between Turnbridge Road and 38th Ave., and along 47th Ave., Franklin Blvd to Light Rail Tracks. $3,475, Widen American.River bridge and approaches from 4 to 6 lanes and widen Hazel from A.R. bridge to Madison from 4 to 6 lanes with bike lanes and signals and parkway features $85,190, In Sacramento County, Antelope North Road from Poker Lane to Olive Avenue, widen from 2 to 4 lanes. $3,020, In Sacramento County, Watt Avenue Corridor, implement phase 3 priority and mobility enhancement demonstration project. $2,725, In Sacramento County, Watt Avenue from Capital City Freeway (SR51) to Jackson Hwy. (SR16): construct curb, gutter, sidewalks, bikeways, lighting, transit shelters and landscaped medians. $8,517, In Sacramento County, conduct studies, and environmental work for a bicycle/ped crossing of I-80 W of Madison Avenue. $550, Widen from 2 to 4 lanes from Rio Linda Boulevard to connection to SR 99. Includes biycle and pedestrian facilities. $26,000, Construct a 4-lane roadway from Bradshaw Road to Sunrise Boulevard. Includes bicycle and pedestrian facilities. $10,000, Reserve funds for improved access across the American River between Howe Avenue and Hazel Avenue. $80,000, In Sacramento County, various locations throughout county construct onstreet bikeways, including shoulder widenings to provide shoulders for the bike lanes. $2,040, In Sacramento County, Douglas Road from Excelsior Road to Sunrise Boulevard, widen from 2 to 4 lanes. $11,067, In Sacramento County, Eagles Nest Road from Kiefer Boulevard to Douglas Road, widen from 2 to 4 lanes. $4,630, In Sacramento County, Florin Road from Stockton Blvd. to Elk Grove-Florin Road: construct sidewalks, bikeways, medians, lighting, landscaping and streetscaping. $3,103, In Sacramento County, Fulton Ave. from Arden Wy. to Auburn Blvd: construct landscaped medians, streetscaping, sidewalks, bikeways, lighting, transit shelters and landscaped medians. $6,139, In Sacramento County, Watt Ave. from Antelope Rd. to Capital City Freeway (SR51): install landscaping, streetscape, ADA frontage improvements, sidewalks, lighting and bike facilities. $3,210, SAC22720 Watt Avenue Enhancements ITS on Greenback/ Sunrise SAC22770 Blvd. Smart Corridor on Greenback/Sunrise Blvd. $7,600, Construct 5-mile Class I multi-use trail on Dry Creek Pkwy, Cherry Island SAC22780 Dry Creek Parkway Trail Soccer Complex to Dry Creek Rd. $1,701, Construct a 4 lane roadway from Grantline/ Route 99 interchange to I-5 at Hood Franklin Blvd. Can be changed to widening of existing streets. (part of SAC22900 Kammerer Road the parkway package) $18,443, SAC22905 Kammerer Road In Elk Grove and Sacramento County: Kammerer Road from I-5 to SR 99: enhance as a 4 lane parkway. $31,556, SAC22940 Elkhorn Boulevard Widening Construct a two lane roadway with the following alignment: Power Line Road, along the north side of I-5 and loop into the airport, merging with Airport Blvd/Crossfield Dr. with landscaped medians. $15,000, In Sacramento County, Power Line Road to Lone Tree Road, realign and NEW Elkhorn Boulevard Widening construct new road to 2 lanes and median with landscaping. $5,000, Construct a 6-lane roadway from Route 50 to International Drive extension. This includes a south only interchange with Route 50 and pedestrian and SAC22980 Alta Sunrise Boulevard bicycle facilities. $45,000, SAC22990 International Drive Construct a 6 lane roadway from current terminus to Alta Sunrise Boulevard. Includes bicycle and pedestrian faciliites. $6,000, SAC23080 Hazel Avenue Widen from 4 to 6 lanes from Madison to Sacramento/Placer County line. $77,500, SAC23160 New Road Construct a new 4 lane limited access road from Grant Line Road/ White Rock Road through Aerojet's property to U. S. 50 near Hazel Ave. $9,335, SAC23220 White Rock Road In Sacramento County, White Rock Road from Sunrise Park Drive to El Dorado County line: realign and widen with shoulders. $20,000, South County Transit South Sacramento County to north San Joaquin County: provide hourly jobs access transit service between Lodi, Galt, Elk Grove and south Sacramento SAC23270 Operations County $2,103, SAC23980 Pedestrian Master Plan Implementation Project Construct pedestrian facilities and improvements in various locations throughout Sacramento County in accordance with the adopted Sacramento County Pedestrian Master Plan. The project includes improvements to existing corridors to enhance pedestrian safety and mobility, including sidewalk and walkway construction, pedestrian signal installation, improvements to existing signalized and non-signalized intersections and pedestrian crossings, and other improvements to benefit pedestrian access and safety. All improvements will be constructed in compliance with pedestrian facility improvement standards set forth in the adopted Master Plan. $1,447, Page 16 of 23 4/4/2006
103 Appendix E Project List ID Project Title Project Description Total Cost SAC24035 Gerber Road Widening Project SAC24036 Vineyard Road Improvement, Calvine Road to Gerber Road Completion Year The project proposes to widen Gerber Road between Elk Grove-Florin Road and Bradshaw Road 2 to 4 lanes. $3,854, In Sacramento County, widen from 2 to 4 lanes, replace two existing bridges on Vineyard Road, install two new traffic signals, widen pavement to an arterial roadway width, and construct landscaped median. The bridges are located at Laguna Creek and a tributary of Elder Creek. $4,207, This project provides for the development and implementation of audible signals and other ADA compliant upgrades at various locations throughout the County of Sacramento. The audible signals will be installed in accordance with the latest County Standards and current ADA requirements. The locations are based on citizen's requests and recommended by the County's Physical Access Subcommittee (PASC) of the Disability Advisory Committee. The locations are: 1)Alta Arden Morse Ave; 2)Arden Watt Ave.; 3) Auburn Hemlock St.; 4)Arden Professional Dr.; 5)El Camino Yorktown Ave.; 6)Auburn Palm Ave.; 7)Auburn Garfield Ave.; 8)Fair Oaks Sunrise Blvd.; 9)San Juan Sunset Ave.; 10) Cottage Bell St.; 11)Howe Hurley Way; 12)Fulton Hurley Way; 13)Watt Kings Way/Chenu Ave.; SAC24037 Intersection Improvements, Disabled Access 04/05 14)Mather Field Mills Station Rd. Locations may be added or deleted based on the PASC's subsequent recommendations. $948, SAC24062 Galt / South Sacramento County Transit Preventive Maintenance In Galt and south Sacramento County, perform preventive maintenance for South County Transit. $1,539, In Sacramento County, Freedom Park Drive: construct pedestrian and streetscape improvements to serve as a gateway into adjacent McClellan SAC24066 Freedom Park Drive Park. $1,500, Sacramento Regional Transit District Amtrak / Folsom Corridor Light Folsom Corridor - Downtown Sacramento Folsom - light rail extension REG15040 Rail Project (including vehicle purchase) $256,000, South Sacramento Light Rail Construct a light rail extension from Meadowview Road to Cosumnes River REG15053 Project-Phase 2 Extension College $202,529, REG15304 CNG Bus Fleet Expansion Purchase 60 CNG buses for fleet expansion from 2005 through 2025 $33,750, Light Rail Vehicle Rehabilitation REG15880 Complete a mid-life rehabilitation of the light rail vehicle fleet Program $118,482, Double track all existing single track sections of Northeast Corridor LRT and Northeast Corridor REG16470 make various improvements to implement exprress service from Watt/I-80 to Enhancements Project Downtown Sacramento $25,000, REG16670 SRTD Operating Assistance Sacramento Regional Transit District: operation of transit service. $3,775,579, REG16680 RT Preventive Maintenance Sacramento Regional Transit District: provide for scheduled and unscheduled maintenance for bus and light rail revenue vehicles and facilities. $1,085,552, South Sacramento Light Rail REG17190 Construct a light rail extension from Cosumnes River College to Elk Grove Project-Phase 3 Extension $182,000, REG17221 Antelope Light Rail Extension Construct an extension of light rail line from I-80/Watt Avenue to Antelope Road $290,000, Laguna West Light Rail Construct a light rail extension from Meadowview to the Laguna West area of REG17230 Extension Elk Grove $91,740, Satellite Bus Maintenance REG17300 In Sacramento, site and build satellite bus maintenance facility. Facility $23,000, REG17320 Downtown-Natomas-Airport Light rail extension from Downtown Sacramento to Sacramento International Light Rail Extension Airport $623,500, REG17330 Watt Avenue Bus Rapid Transit Develop a bus rapid transit corridor on Watt Avenue between Folsom Blvd and McClellan Business Park $30,000, Sunrise Boulevard Bus Rapid Develop a bus rapid transit corridor on Sunrise Blvd between Douglas Blvd REG17430 Transit and the Placer County line $30,000, Paratransit Vehicle Fleet REG17781 Purchase 314 paratransit vehicles for fleet replacement Replacement $26,690, REG17782 CNG Bus Fleet Replacement Purchase 135 CNG buses for fleet replacement from 2005 through 2009 $50,625, Sutter County Caltrans District 3 In Sutter County, SR 20 from Sacramento River Bridge to Hagerman Road, CAL10690 SR 20 Road Rehabilitation rehabilitate roadway. $4,893, CAL10700 SR 99 Planting & Irrigation In Yuba City, SR 99 from SR 20 to north of Queens Avenue - replace planting and upgrade irrigation. $2,616, CAL15722 Sutter/Yuba Route 70 Corridor Project Near East Nicolaus - Route 99 to Cornelius Road - construct 4-lane expressway $58,900, CAL15770 Route 20 Widen from 4 to 6 lanes from Walton Rd to Rocca Way $2,000, CAL15780 Route 20 Construct urban interchange at Route 99 and Route 20 $16,322, CAL17270 SR 99 Garden Hwy - SR 70 Near Yuba City, SR 99, Route 70 junction to Garden Highway - widen to 4 lanes with a continuous left-trun lane. $16,076, CAL17350 Route 70 Expressway Construction Near Rio Oso - Cornelius Avenue to Bear River Bridge (Yuba County) - construct 4-lane expressway $75,900, CAL17660 SR 99 Garden Hwy - Sacramento Ave Near Yuba City, from Garden Hwy. to Sacramento Ave, widen from 2 to 4 lanes, with a median left-turn lane, new bridge and an undercrossing. $47,170, Page 17 of 23 4/4/2006
104 Appendix E Project List ID Project Title Project Description Total Cost Completion Year CAL18160 Route 99 Widen Route 99 from 2 to 4 lanes from five miles south of Live Oak to the northern-most city limits. $37,500, CAL18350 SR 99 Central - O'Banion Near Yuba City, SR 99, Central Ave. to O'Banion Rd.; widen to 4 lanes with a median. $59,103, CAL18590 Route 99, New interchange Sutter County, north of Sacramento: along Route 99 between Riego Road and Sankey Road, construct new interchange $22,000, CAL18742 SR-99, Yuba City - Rehabilitate Roadway In Yuba City - Lincoln Road to Butte House Road - rehabilitate roadway $16,132, CAL18746 SR-20 Feather River Bridge - upgrade bridge rail In Yuba City - Feather River Bridge # upgrade bridge rail $8,279, City of Live Oak SUT10781 SR 99 In Live Oak, SR 99 at Elm Street, install signal $250, SUT10795 Pennington Road Phase 1 In Live Oak, Pennington Road from SR99 to 50' w of Connecticut Ave.: reconstruct and widen from 2 to 4 lanes; reconstruct RR crossing. $1,287, Sutter County Dept of Public Works CAL16950 SR 99 Riego Rd. Interchange In Sutter County, SR 99 at Riego Road, construct new five-lane interchange. $28,510, SUT10270 Pleasant Grove Road Realign South - Howsley Road / Widen to 4 lanes Howsley Rd to Riego Rd. $984, SUT10310 Pleasant Grove Rd. Widen to 4 lanes, Bear River Dr. to Yuba County $1,070, SUT10330 Riego Road In Sutter County, Riego Road from SR 99 to Power Line Road: widen from 2 to 4 lanes. $9,356, SUT10340 Riego Rd Widen to 4 or 6 lanes, Route 99 to Placer Co. $3,142, SUT10350 Riego Road In Sutter County, Riego Road from SR 99 to Pacific Avenue: widen from 2 to 6 lanes. $5,825, SUT10360 Riego Road In Sutter County, Riego Road from Pacific Avenue to Road F: widen from 2 to 6 lanes. $7,698, SUT10370 Lincoln Rd. Widen to 2 lanes with a center lane from Jones Rd. to Walton Rd. $688, SUT10390 Butte House Rd. Upgrade to 2 lane urban standard, Acacia Ave. to Humphrey Rd. $445, SUT10400 Riego Road In Sutter County, Riego Road from Road F to Pleasant Grove Road: widen from 2 to 6 lanes including grade separation at RR xing. $13,927, SUT10480 Route 99/70 Construct a 4 lane interchange on Route 99/70 at Sankey Road $20,000, SUT10490 Riego Road Widen from 2 to 4 lanes from Route 99/70 to 2 miles westward. $2,000, SUT10500 Sankey Road Widen from 2 to 4 lanes from Pleasant Grove Blvd. to Route 99/70. $2,500, SUT10510 Pacific Avenue Widen from 2 to 4 lanes from Sankey Road to Riego Road. $1,500, SUT10710 Road A In Sutter County, Road A 1 mile west of SR 99 from Riego Road to one half mile south: construct new 4 lane road. $2,578, SUT10720 Road B In Sutter County, one half mile west of SR 99, from Riego Road to one half mile south: construct new 4 lane road. $2,693, SUT10730 Road C In Sutter County, one half mile south of Riego Road, from Road A to Road B: construct new 4 lane road. $3,624, SUT10740 Road D In Sutter County, one half mile east of SR 99, from Riego Road to one half mile south: construct new 4 lane road. $2,693, SUT10750 Road E In Sutter County, one half mile south of Riego Road between Road D and Road F: construct new 4 lane road. $7,421, SUT10760 Road F In Sutter County, one mile east of Pacific Avenue from Riego Road to Road E: construct new 4 lane road. $3,515, SUT10788 Township Road conform grind,level course,fabric,overlay,shoulders $500, SUT10789 George Washington Road conform grind,level course,fabric,overlay,shoulders $150, SUT10790 George Washington Road conform grind,levelcourse,fabric,overlay,shoulders $150, SUT10792 Pleasant Grove Road In Sutter County, Pleasant Grove Road from Betz Road to Kempton Road and from Marcum Road to Auburn Ravine: conform grind,level course,fabric,overlay,shoulders $450, SUT th Street Bridge Replace 2 lane Seismic Deficient bridge with 4 lane structure $36,250, SUT10827 RR Bridge Conversion Convert Railroad Bridge to 2 lane vehicular crossing $14,000, Yuba City Dept of Public Works SUT10241 Walton Avenue Widening Widen Walton Ave from Franklin to Lincoln from 2-3 lanes to 5 lanes including upgrades to bike lanes, sidewalks, curbs, gutters, and drainage $909, SUT10250 Bridge Street Widening In Yuba City, Bridge Street from Cooper Street to Gray Avenue: widen to 4 lanes. $1,150, SUT10260 Harter Road In Yuba City, construct 4 lane Harter Road between SR 20 and Bridge Street, construct streetscaping improvements on Harter from Butte House Rd to SR 20, install signal at Harter and Butte House and modify signal at Harter and SR 20. $7,500, SUT10280 Bridge Street at 2nd St. Realignment In Yuba City, Bridge Street at Second Street: realign Second Street north of the 5th Street Bridge and install traffic signal. $672, SUT10430 Plumas Street Extension of Plumas Street from Franklin Avenue to a connection with Percy Avenue, including lighting and landscaping. $848, SUT10460 Plumas Street In Yuba City, Plumas Street from B Street to bridge: relocate curbs and sidewalks, modify signals, and remove RR track. $1,315, SUT10530 Franklin Avenue Widen 2 to 4 lanes from Route 99 to Clark Avenue $950, SUT10540 Garden Highway Widen from Franklin Avenue to Second St. to provide bicycle facilities and onstreet improvements. $500, SUT10550 Garden Highway Widen from 2 to 4 lanes from Epley Drive to Winship Road. $500, Page 18 of 23 4/4/2006
105 Appendix E Project List ID Project Title Project Description Total Cost Completion Year SUT10620 SR 99 In Yuba City, SR 99: add signalized intersection north of Bridge Street. $1,500, SUT10794 Cinema 14 and Mixed-Use Retail Complex Transportation Improvements In Yuba City, construct signal-phasing modifications, pedestrian-scale street lighting, sidewalks and new pedestrian crossings as part of the city's downtown revitalization strategy. $700, Various Counties Caltrans District 3 CAL16800 Various Locations Caltrans District 3 TOS projects. Includes ramp meters, HOV on-ramp lanes, traffic monitoring stations, closed circuit television cameras, changeable message signs, highway advisory radio, weather monitoring systems, loop detectors, etc. $70,000, CAL17250 Feather River Bridge on Route 65 Construct 2-lane Third Feather River Bridge, with right-of-way for ultimate 4 lanes, from Route 70 in Yuba County to Route 99 in Sutter County. $232,500, CAL17260 Marysville Bypass In Yuba and Butte Counties, SR 70 from SR 65 to Ophir Road in Butte County, construct four-lane freeway on new alignment. Butte County is contributing an additional $3 million in RIP funds. $3,000, CAL17380 SACOG Region Emergency Repair Program Lump Sum - Emergency Repair with non-er funds (non-capacity increasing projects only) $300, CAL17900 U.S. 50 Construct Traffic Operations System (TOS) on U.S. 50 from Scott Rd. to Cameron Park $5,000, CAL18280 Wheatland Bypass Construct a new 4 lane expressway from the future north end of Route 65 Lincoln Bypass to the existing Route 65, near South Beale Road, with access control. $184,000, CAL18330 Roseville Third Track Construct third track on the UP mainline between Elvas Tower in Sac County and Roseville Station in Placer County. $19,000, CAL18736 Metal Beam Guard Rail In Sacramento, Placer, Yuba, and Yolo Counties - on various routes - upgrade metal beam guard rail end treatments $2,966, CAL18750 State Minor Funded Program Lump Sum - State Minor Funded Program (Non-Capacity Increasing Projects Only).Previously programmed as CAL17370 in 2002 MTIP. $1,500, Lump Sum - Local Hazard Elimination and Safety projects, non-capacity VAR10060 SACOG Area HES Program increasing only $528, Capital Corridor Joint Powers Board CAL18320 Sacramento/Placer Counties Sacramento to Roseville track and signal improvements $7,280, CAL18290 Intercity Rail Add three modern trainsets with a locomotive to the Capitol Corridor passenger rail service with the proposed increased service frequencies $48,000, Sac. Metro Air Quality Management District Conduct the Spare the Air Education Program jointly funded by the Sacramento Metro AQMD, Yolo-Solano AQMD and the Placer County Air SAC21080 Spare the Air Program Quality Control District $3,089, SACOG Sacramento Metropolitan Area Provide ride-matching services for the Sacramento metropolitan area; SAC20400 Rideshare Program cooperate with local agencies in Highway 50 outreach effort. (TDM) $1,589, In SACOG Region, perform administrative work to implement regional funding programs (community design, air quality, transportation demand management SAC20410 SACOG Regional Programs and bicycle/pedestrian). $192, SAC22090 SECAT Program Heavy-Duty NOx control strategies; SECAT program; GIS Transit program (includes bus stop and centralized regional transit information system, and trip planning) $69,402, Rancho Cordova-Placer In Sacramento and Placer Counties: study a multi-modal connector between VAR10350 Connector Rancho Cordova and Placer County. $1,250, VAR10460 Transportation Demand Management SACOG region: implement transportation demand management. Annual program includes SACOG rideshare program, marketing and other strategies to reduce travel demand. $9,754, VAR11000 Regionwide STARNET Integration In SACOG region, implement regionwide STARNET integration and related ITS projects. $2,000, VAR22100 Clean Air Investments and Improvements Lump Sum of clean air investments and improvements $201,914, VAR22200 Other Road Improvements Lump Sum of other road improvements $2,176,193, Transportation Demand VAR23500 Management Lump Sum of transportation demand management $49,630, VAR24000 Soundwalls Lump Sum of soundwalls $16,826, VAR24200 Road and Bridge Maintenenace and Rehabilitation Lump Sum of road and bridge maintenance and rehabilitation $7,662,491, VAR24300 Landscaping and Street Enhancements Lump Sum of landscaping and street enhancements $26,921, VAR24900 Other Transit Capital Improvements Lump Sum of other transit capital improvements $291,654, VAR27000 Community Design Lump Sum of community design $560,874, Bicycle and Pedestrian VAR30000 Improvements Lump Sum of bicycle and pedestrian improvements $392,612, VAR56001 State Implementation Plan for Air Quality - SACOG Region In SACOG region, perform modeling, control measure evaluations, public outreach and environmental documents for new SIP based on 8-hour ozone requirements. $1,000, Page 19 of 23 4/4/2006
106 Appendix E Project List ID Project Title Project Description Total Cost Completion Year VAR56002 SACOG Blueprint Project In the SACOG Region, develop a comprehensive regional process that integrates land use and transportation, air quality and other regional concerns. The Blueprint project utilizes extensive public outreach and modeling tools to estimate the transportation, air quality, economic and other effects of current land use patterns and develop alternatives to those patterns. $265, Sacramento Regional Transit District REG17200 West Sacramento Rail Transit Extend rail transit from Downtown Sacramento to West Sacramento. $90,250, Various Agencies REG17710 Regional Commuter Rail Auburn to Dixon on UPRR ROW: operate start-up commuter rail during peak periods with leased rolling stock for three years. Minimum of six round trips daily. $22,700, REG17720 Regional Commuter Rail Operations Sacramento Metropolitan Area: operating and maintenance costs for commuter rail between Davis and Auburn. $170,800, Yuba Sutter Transit YST10170 Fixed Route Fleet Replacement Purchase ten fixed route buses for fleet replacement & minor expansion $2,750, Demand Response Vehicle YST10190 Replacement Purchase ten demand response/rural route vehicles for fleet replacement $600, YST10200 Fixed Route Vehicle Acquisition Purchase eight fixed route buses for fleet replacement & minor expansion $2,200, Demand Response Vehicle YST10210 Acquisition Purchase ten demand response/rural route vehicles for fleet replacement $600, YST10220 Commuter Bus Acquisition Purchase six commuter buses for fleet replacement & minor expansion $1,650, YST10230 Fixed Route Vehicle Acquisition Purchase twelve fixed route buses for fleet replacement & minor expansion $3,300, Purchase four commuter buses for fleet replacement and minor fleet YST10240 Commuter Bus Acquisition expansion $1,100, YST10260 Commuter Bus Purchase Purchase six commuter buses for fleet replacement and minor fleet expansion $1,692, YST10340 Commuter Bus Acquisition Purchase five commuter buses for fleet replacement & minor expansion $1,375, YST10350 Demand Response Vehicle Acquisition Purchase ten demand response/rural route vehicles for fleet replacement $600, YST10360 Commuter Bus Acquisition Ppurchase five commuter buses for fleet replacement $1,375, YST10370 Fixed Route Vehicle Acquisition Purchase ten fixed route buses for fleet replacement & minor expansion $2,750, YST10390 Demand Response Vehicle Acquisition Purchase seven demand response/rural route vehicles for fleet replacement & minor expansion $420, YST10400 Demand Response Vehicle Acquisition Purchase nine demand response/rural route vehicles for fleet replacement & minor expansion $540, YST10410 Facility Expansion Expand the capacity of the existing maintenance, operations and administration facility $750, YST10412 Operating Assistance FY 2006 Operating Assistance for FY 2006 $3,640, YST10416 Operating Assistance for FY 2007 Operating Assistance for FY 2007 $3,835, YST10417 Commuter Bus Purchase Purchase three commuter buses for fleet expansion & minor expansion $825, Yolo County Caltrans District 3 CAL10530 U.S. 50 From I-80 to Sacramento County line--install traffic operations system (message signs, ramp metering, cctv) $600, CAL10730 SR 275 Tower Bridge Rehabilitation In West Sacramento, SR 275 Tower Bridge: rehabilitate deck. $2,647, CAL15882 I-5/SR113 Interchange (Ph.3) Phase 3 Construct northbound SR113 to southbound I-5 freeway to freeway connection. $30,200, CAL16330 I-80 / U.S. 50 Carpool lane from Richards Blvd. in Davis to Sacramento County line on I-80 / U.S. 50. $110,000, CAL16370 SR 84 (Jefferson Blvd.) Relinquishment In West Sacramento, from south West Sacramento urban limits to I-80: relinquishment from Caltrans to the City of West Sacramento. $6,199, CAL16880 Route 50, various locations Yolo County portion of U.S. 50 traffic operations system and ramp metering at various locations. $4,800, CAL18743 SR-16 Widen Shoulder and Other Improvements Near Brooks - east of Mossy Creek Bridge to west of Route widen shoulder and construct left turn lane and right turn pockets $54,487, CAL18747 U.S. 50 in West Sacramento - Rehabilitate Pavement In West Sacramento - Route 80 to Sacramento County Line; also in Sacramento County from Yolo County Line to 65th Street - rehabilitate pavement $10,684, YOL15880 US 50 Harbor Blvd Interchange In West Sacramento, US 50, Harbor Blvd Interchange: widen to 6 lanes,revise ramps and add auxiliary lanes. $36,700, CAL15881 I-5/SR113 Interchange Phase 2 - Construct northbound I-5 to southbound SR113 freeway to freeway connection- I-5 NB to 113 SB $52,450, City of Davis Dept of Public Works YOL16400 Hutchison Drive Bike Lanes & Old Davis Road Landscaping UC Davis Campus, Hutchison Drive, CR 98 - SR 113: widen to accommodate bike lanes; Old Davis Road, from I-80 to California Avenue: add sustainable landscaping and water-conserving irrigation. $1,424, Page 20 of 23 4/4/2006
107 Appendix E Project List ID Project Title Project Description Total Cost Completion Year YOL17130 Route 113/Covell Blvd. Construct additional width on Covell Blvd. including the overcrossing structure Interchange to install adequate turn lanes for accesss-egress to Route 113. $15,000, YOL17140 I-80 Reconstruct the north side of Richards Blvd. interchange to remove the loop on and off ramps and replace with new ramp in diamond configuration. Includes traffic signal installation. $10,000, YOL17150 Chiles Road Widen Chiles Road from 2 to 4 lanes from the I-80 eastbound ramp and Ensenada Dr. Includes bike lanes. $1,600, YOL17160 Lake Blvd. / Covell Blvd. Install a traffic signal at Lake Blvd. and Covell Blvd. $160, YOL17170 Mace curve Widen Mace from Alhambra Dr. to Alhambra Dr. (Mace curve) from 2 to 4 lanes, provide bike lanes, a landscaped median, and turn lanes. $2,200, YOL17180 Covell Blvd. Widen Covell Blvd. from 2 to 4 lanes from Shasta Dr. and Denali Dr. and provide bike lanes and a center median. $1,600, YOL19210 Downtown Multimodal Parking Structure In Davis, construct multistory parking structure to serve multimodal transportation center (Amtrak, Unitrans, Davis Community Transit, commercial shuttles and bike/ped) and the downtown Davis business district. $17,100, City of West Sacramento Dept of Public Works YOL15130 Harbor Blvd. West Capitol Ave. to Industrial, 4 to 6 lanes $6,000, YOL15160 Industrial Boulevard Widening In West Sacramento, Industrial Boulevard from the Palamidessi Bridge at the Barge Canal to Harbor Boulevard: widen from 4 to 6 lanes. $4,000, YOL15180 South River Rd. Reconstruct and widen South River Road to 4 lanes including new 4-lane bridge over barge canal $16,300, YOL15670 I-80/Reed Ave. Interchange Windening of ramps at the intersection with Reed Ave., widening of Reed Ave., and some limitation of local street access. Ramp metering would be added to the on-ramps. $11,250, YOL15680 U.S. 50/South River Road Interchange Install ramp meters and modify ramp design at South River Rd interchange. $10,660, YOL15891 I-80 Enterprise Boulevard In West Sacramento, I-80 at Enterprise Boulevard: construct eastbound onramp. $3,000, YOL15900 U.S. 50/Jefferson Blvd. Interchange Modify and expand the ramps and signals at the Jefferson Blvd. interchange, add ramp metering and turn lanes, and modification and/or access control of streets adjacent to the interchange. $26,450, Widen from 2 to 6 lanes from Jefferson Blvd. to the new Palamidessi Bridge at the barge canal. $4,000, YOL15940 Lake Washington Blvd. YOL15950 Lake Washington Blvd. Widen the Palamidessi Bridge over the barge canal from 4 to 6 lanes. $4,000, In West Sacramento, Tower Bridge Gateway from UPRR underpass, east to Tower Bridge Gateway the Tower Bridge: reconfigure from a controlled access expressway to an Modification/3rd & 5th Streets arterial roadway with signalized at-grade intersection at 3rd Street and 5th YOL16492 Intersections (Phase 2) Street. $7,000, YOL19211 YOL16550 Tower Bridge Gateway/Garden Street Intersection Grant Ave. - Winters In West Sacramento, Tower Bridge (former Highway 275) at Garden Street: lower existing roadway to become an at-grade boulevard at the Tower Bridge Gateway. $5,000, City of Winters Dept of Public Works In Winters, intersection of Grant Ave. (SR 128) and Railroad Ave, install traffic signal. $1,082, In Winters, Railroad Avenue from Grant Avenue to north city limits: install class 2 bike lanes. $1,500, YOL16620 Railroad Avenue Bike Lanes YOL16670 Grant Ave./I-505 Overcrossing In Winters, Grant Avenue at I-505: widen Grant Avenue overcrossing. $3,750, Putah Creek Bridge YOL19213 Replacement City of Winters; Railroad Avenue over Putah Creek, from Wolfskill Street and Putah Creek Road: replace historic Putah Creek Bridge. $2,000, City of Woodland Dept of Public Works YOL17270 Pioneer Avenue Widen from 2 to 4 lanes between Gibson Road and Parkway Drive. $3,338, YOL17280 Matmor Road Extend from Tyler Drive to County Road 24C as a 2 lane road. $1,933, YOL17290 Kentucky Avenue Widen from 2 to 4 lanes from College St. to West St. $3,537, YOL17300 I-5 / CR 102 Reconstruct interchange on I-5 at County Road 102 including overcrossing of I- 5. $19,984, YOL17310 County Road 102 Widen from 2 to 4 lanes from Beamer Street to East Main Street. $2,896, YOL17330 County Road 102 Widen from 2 to 4 lanes between Kentucky Avenue to Beamer Street. $2,896, YOL17340 County Road 25A Construct a 2 lane minor arterial from Route 113 interchange to CR 102. $3,893, YOL17350 Parkway Drive Construct a 2 lane arterial from East Street to College Street. $3,359, YOL17360 Parkway Drive Construct a 4 lane arterial from Pioneer Ave. to East Street. $9,044, YOL17370 Parkway Drive Construct a 2-lane arterial from County Road 102 to Pioneer Avenue. $5,087, YOL17380 Coloma Way Construct a 2 lane collector from County Road 24A to County Road 24C. $619, YOL17390 College Street Construct a 2 lane collector frokm County Road 24 A to County Road 24C $619, YOL17400 Kentucky Avenue Widen from 2 to 4 lanes from East Street to College Street $6,524, YOL17420 Main Street Construct South side from Ashley Avenue to Cottonwood Street. $360, YOL17450 Thomas Street Extend from Main Street to Armfield Avenue. $655, YOL17540 Pioneer Avenue In Woodland: construct new 2-lane major arterial between County Road 24C and County Road 25A. $8,188, YOL17550 County Road 102 In Woodland, County Road 102 from Gibson Road to County Road 25A: widen from 2 to 4 lanes. $11,227, YOL17560 East Street Widening In Woodland, East Street from County Road 24A to south city limits: widen from 2 to 4 lanes. $5,750, Page 21 of 23 4/4/2006
108 Appendix E Project List ID Project Title Project Description Total Cost Completion Year YOL17575 Lemen Realignment Phase 2 In Woodland, Lemen Avenue realignment at Cannery Road (Phase 2). $1,376, University Transport System UNI10210 Unitrans Capital Assistance purchase 25 new buses for expansion $10,000, UNI10320 Unitrans Operating Assistance In Davis, operating Assistance for Unitrans. $11,407, UNI10330 Unitrans Capital Assistance Capital Assistance - vehicle replacement/minor fleet expansion/bus rehabilitation $30,015, UNI10331 UCD Hydrogen Bus Project In Davis, Unitrans: implement UC Davis Hydrogen Bus Technology Validation Project Phases 3 and 4 (Phases 1 & 2 included in UNI10330); later phases include enhancements and support for two HCNG converted buses and additional HCNG conversions. $1,987, UNI10340 Unitrans Capital Assistance Capital Assistance - Unitrans Maintenance Facility Expansion $4,000, UNI10360 Unitrans Capital Assistance Capital Assistance - Transit Corridor Terminal Improvements $1,575, UNI10380 Unitrans Capital Assistance Capital Assistance - Office, shop, operating equipment, and non-revenue vehicles for existing facilities $2,569, UNI10440 Unitrans Capital Assistance Unitrans bus stop improvements, accessibility, and passenger amenities $3,190, Yolo County Dept of Public Works YOL15440 CR 99, CR 29 & CR 99D Bikeways In Yolo County, CR 99 from CR 27 to CR 29 and CR 29 from CR 99 to SR 113 and CR 99D from CR 29 to Davis City limits: construct class II bikeways by adding four foot shoulders and rehabilitating existing roadway. $1,625, In Yolo County on CR 32A, from CR 105 to Mace Blvd.: rehabilitate roadway and add four foot bike lanes. $1,157, In Yolo County, CR 98 from CR 29 (Davis) to Woodland, add shoulders and bike lanes to roadway and two existing bridges and rehab roadway. $272, SR 16, Brooks to Rumsey: construct roadside rests with scenic and/or historic interpretive signs. $33, YOL15520 County Road 32A Bike Lane County Road Bike YOL16280 Improvements SR 16 Capay Valley Roadside YOL17520 Rests YOL17610 CR 102 from 17 to 18C Pavement Rehabilitation $530, In Yolo County, perform circulation planning activities to integrate smart growth principles into the Yolo County General Plan, and foster higher density Growing Space: Updating the mixed-use development with pedestrian and bicycle-oriented neighborhoods General Plan to Support Smart in rural small towns, to reduce future vehicle demand and protect valuable YOL19212 Growth in Rural Communities agricultural and habitat resources. $772, Yolo County Transportation District YCT10250 YCTD Purchase 27 new buses for replacement and expanded service countywide. $10,260, YCT10980 West Sacramento Rail Station In West Sacramento, construct station for regional rail service. $1,129, YCT18062 Rural formula operating assistance Rural formula FTA Section 5311 opearting assistance $695, YCT18063 YCTD Rural formula operating assistance Rural formula FTA Section 5311 operating assistance $709, YCT18065 YCTD Spare the Air Project Spare the Air project, free fares on Yolobus on spare the air event days; Project YCT 11020, MTIP amendment $70, YCT18066 Preventive Maintenance Yolobus fleet preventive maintenance $1,281, YCT18067 Road supervisors' vehicles Purchase non-revenue vehicles for road supervisors $75, YCT18068 ADA paratransit operating assistance Operating assistance for ADA paratransit service $162, YCT18069 Transit planning Transit service and operations planning and development review $81, YCT18070 ADA vehicles Purchase revenue vehicles for ADA service $160, YCT18071 Office equipment Purchase office equipment including computers, printers, copier $115, YCT18072 Bus stop improvements Improvements to various bus stops in Yolobus system $81, YCT18073 Safety and Security Safety and security improvements to bus stops and facilities $75, YCT18074 Yolobus Administration and Maintenance Facility Improvements Improvements to the administration and maintenance facility for Yolobus located in Woodland, including the CNG fueling station $3,125, YCT18075 Preventive Maintenance Yolobus fleet preventive maintenance $1,141, YCT18076 ADA paratransit operations Operating assistance for ADA paratransit service $187, YCT18077 transit planning Transit service and operations planning and development review $85, YCT18078 ADAvehicles Purchase revenue vehicles for ADA paratransit service $85, YCT18079 Facility Equipment Purchase equipment for maintenance facility $12, YCT18080 Safety and Security Safety and security improvements for bus stops and facilities $100, YCT18081 Preventive Maintenance Yolobus fleet preventive maintenance $1,376, YCT18082 ADA Paratransit Operations Operating assistance for ADA paratransit service $187, YCT18083 Transit planning Transit service and operations planning and development review $87, YCT18084 YCTD Jobs Access & Reverse Commute Program In Yolo County, provide JARC operations for Yolo County Transportation District. $1,507, YCT18085 EDO CNG Tank replacement Replace 60 EDO CNG tanks and related hardware in six buses $282, Yuba County Caltrans District 3 CAL18240 Marysville Bypass (phase 2) Construct a new 2 or 4 lane expressway (Marysville Bypass phase 2) from Route 65/70 split to Route 20, with access control. $158,000, CAL18250 Marysville Bypass (Phase 3) Construct a new 2 or 4 lane expressway (Marysville Bypass phase 3) from Route 20 to Butte County line, with access control. $70,000, Page 22 of 23 4/4/2006
109 Appendix E Project List Completion Year Near Marysville - Noble Road to Woodruff Lane - add shoulder and two-way left turn lane $3,724, City of Marysville Dept of Public Works ID Project Title Project Description Total Cost CAL18745 SR 70 Near Marysville - Safety Improvements CAL15960 Route 70 Widen from 4 to 6 lanes from First St to Ninth St, and widen the approaches to the Tenth St Bridge $3,000, YUB15350 Route 70 Widen B St railroad underpass to safety standards $7,000, Pavement Rehabilitation YUB15690 Project Phase 1 In Marysville, various roads, Phase 1 pavement rehabilitation. $755, YUB Pavement Rehabilitation Project Phase 2 In Marysville, various roads, phase 2 pavement rehabilitation. $425, YUB15850 Marysville Hotel Parking Structure In Marysville, Downtown Marysville Renaissance Square: construct downtown public parking garage as part of redevelopment project. $2,980, City of Wheatland In Wheatland, SR 65, N. of 1st St. to S. of Main St.; construct signals and YUB15710 SR 65 Wheatland Signals pedestrian improvements. $1,200, SACOG YUB15630 Yuba County PPM Plan, program and monitor $63, Yuba County Dept of Public Works McGowan Parkway Interchange YUB15858 at SR 70 Modify existing Interchange $5,000, YUB15360 Route 70 at Feather River Blvd. Construct interchange as part of the Plumas Lake Specific Plan. $22,333, YUB15370 SR 70 Algodon Road Interchange Near Marysville - south of Algodon Road at Motorplex Parkway and Route 70 - construct new interchange (Phase 1). $21,000, YUB15375 SR 70 Algodon Road Interchange (Phase 2) Near Marysville - south of Algodon Road at Motorplex Parkway and Route 70 - construct bridge for new interchange. $20,000, YUB15420 River Oaks Blvd. Construct new north Arterial from Algodon Rd. to Plumas Arboga $6,500, SR 65 Interchange at Forty Mile South of Marysville, SR 65 at Forty Mile Road Interchange: modify interchange YUB15580 Road ramps to accommodate traffic from the Yuba County Motorplex. $1,000, YUB15600 Honcut Road Bridge Replacement In Yuba County, Community of Loma Rica, replace Honcut Road Bridge over Honcut Creek. $2,000, YUB15680 Willow Glen Road Pavement Rehabilitation In Yuba County, Willow Glen Road from Marysville Road to Frenchtown Road: rehabilitate roadway. $1,000, YUB15720 North Beale Road Pavement Rehabilitation In Yuba County, Community of Linda, North Beale Road from Shad Road to Griffith Avenue, rehabilitate pavement $1,240, YUB15848 La Porte Road Pavement Rehabilitation In Yuba County, Community of Brownsville, La Porte Road from Willow Glen Road to Oregon Hill Road: pavement rehabilitation. $750, YUB15849 New York Creek Bridge Replacement In Yuba County, near Brownsville, La Porte Road at New York Creek crossing: replace bridge. $750, TOTAL $27,430,779,065 Page 23 of 23 4/4/2006
110 APPENDIX F INTER-REGIONAL PASSENGER TRANSPORTATION Capitol Corridor Rail Service Funded by the State and passenger fares, administered by the Capitol Corridor Joint Powers Authority (CCJPA), and operated by Amtrak on Union Pacific Railroad tracks, this rail service is currently operating 12 round trips between Sacramento and Oakland. Stops in the SACOG region are at Auburn, Rocklin, Roseville, Sacramento, and Davis, with connecting Amtrak bus service to Grass Valley, Reno, South Lake Tahoe, and many more locations. The focus of the CCJPA is to deliver safe, reliable, frequent, high-quality passenger rail service that is a viable transportation alternative to the congested I-80 highway corridor. The most recent business plan update calls for a continuation of the current 12 round trip trains between Sacramento and Oakland until October 2006, by which time, it is hoped, the State financial crunch will have eased and more trains can be added. Operating funds are available to expand train service to San Jose (up to 7 daily round trips) once the current Oakland-San Jose track construction project is complete in Fall The ultimate expansion goal is 16 San Jose- Sacramento round trip trains per day by Since the CCJPA assumed management for the service in October 1998, ridership has increased 172% over the past seven years, catapulting the Capitol Corridor to the third busiest intercity passenger rail route in the U.S. For federal fiscal year (FFY) 2005/2006, ridership is expected to be 1.3 million passengers (1.4 million projected for FY 2006/2007). Over 40% of the cost is covered by fares, compared to 30% prior to the CCJPA management of the service. The CCJPA has many near-term and future plans for capital projects to upgrade the tracks, reduce travel times, improve schedule reliability, and upgrade stations and parking. In addition, the CCJPA working with local transportation agencies in the corridor is evaluating the addition of commuter rail service between Auburn and Oakland that will be integrated with the Capitol Corridor intercity trains. This would provide a greater level of service to business travelers who live and work in this corridor". High-Speed Rail The California High-Speed Rail Authority has completed a Program Environmental Impact Report (EIR) for a high-speed link between the San Francisco Bay Area and Los Angeles with a spur lines to San Diego and Sacramento. The purpose of such a rail line is to serve increasing intercity travel in California and link all of the major metropolitan centers in the State. The more than 700-mile system would use a fully-grade-separated, electrified, dedicated double-track rail line with trains capable of speeds in excess of 200 m.p.h. The travel time between Sacramento and Los Angeles would be a little over two hours, for an approximate fare of $41. The system is estimated to cost $33 to $37 billion to build and as of now has no identified funding source. If financing is identified it could be open by The Authority states that 68 million of the estimated 253 million trips made in the corridor (or 27%) could be on this rail system by In 1997, 1 percent of trips were made by rail (Amtrak), 36 percent by air, and 63 percent by auto. In our region, the only stop would 109
111 be in Sacramento, at the existing Amtrak depot in downtown Sacramento. The Sacramento Valley Station, as it has been renamed, could link the high speed trains with light rail, conventional heavy rail, and local and intercity bus systems. The Program EIR, adopted at the Authority s September 2005 meeting, holds open both the UPRR alignment and the California Traction alignment as possible routes between Stockton and Sacramento. Legislation enacted by the State Legislature in 2005 calls for further study by the Metropolitan Transportation Commission (MTC) of the preferred corridor in the San Francisco Bay Area. 110
112 APPENDIX G FREIGHT TRANSPORTATION This 2006 MTP is long-range strategy for the six-county region that addresses future transportation needs through a set of policies, funding priorities and projects. Addressing the movement of freight in the region has become an important priority, given the importance of moving goods to support the regional economy and the traffic, air quality and noise impacts that can result. Many of the transportation projects listed in this MTP help to meet the needs of freight movement, as well as assisting with mobility and access needs in general. The SACOG region is home to a wide range of freight transportation facilities. These include: Highways: These are the primary routes for connecting major activity centers in the region to each other, as well as to other areas in the state or the US. Highways include I-5, I-80, US 50, SR 16, SR 70, SR 99 and SR 160. Connectors: These are federally designated roads, such as Harbor Boulevard, that connect freight facilities to major roadways. Main Line Railroads: Main line or Class I railroad lines in the SACOG region include the Union Pacific and Burlington Northern Santa Fe. These are the primary rail routes into, out of and through the region. Branch Line Railroads: These smaller shortline railroads, such as the California Northern and the Sierra Northern (Yolo Shortline) in Yolo County serve smaller areas and feed into the Class I railroads. Marine Transportation Facilities: The SACOG area includes one marine facility, the Port of Sacramento. Air Cargo Facilities: There are currently two air cargo facilities in the SACOG region: Sacramento International Airport and Mather Field. Although Mather is Sacramento County s designated air cargo facility, the industry practice of sending air freight in the cargo holds of passenger jets means that Sacramento International continues to see a significant amount of freight traffic. Intermodal Facilities: These are facilities that connect rail and truck transportation through the transfer of containers to or from trucks to trains. The region s only intermodal facility at the Union Pacific s Roseville railyard has been closed and moved to a new facility near Stockton. Challenges and Opportunities for the Region There are a variety of challenges and opportunities facing freight transportation in the SACOG region. Listed below is an overview of some of the more significant ones. 111
113 Trucks: Interstate 5 is considered the backbone of the state s highway system, providing a link between the Central Valley and the nation s largest international gateway to trade the ports of Los Angeles and Long Beach. It is also the west coast s only north-south thoroughfare, linking Seattle with Los Angeles. Interstate 80 provides the main corridor for goods movement between the Bay Area, Sacramento and the areas east of the Sierra. This region s highways were primarily constructed in a radial pattern to connect the central city to the suburbs. In the absence of a network of inter-suburban highways, more and more truck traffic is being moved onto arterials. This has become even more pronounced as manufacturing, warehousing and distribution centers move to the suburbs, and as new developments appear in areas with limited highway or freeway access and no rail access. With the passage of TEA-21 in 1997, Congress authorized a 10% increase in allowable truck weights (from 72,000 to 80,000 pounds), which has led to a 25% increase in road wear by those trucks. Unfortunately, however, there was no corresponding increase in funding for road maintenance. While most state highways have been able to hold up to the increased truck weights, many rural roads and suburban arterials especially those built to older standards - have significantly deteriorated. Railroads: While there are ample economic and environmental incentives for shifting more freight from trucks to trains, there are several factors that will act against this: Much as vehicle miles traveled have increased dramatically while the number of highway lane miles has remained about the same, freight train miles have also increased significantly while track miles have stayed about the same. Freight train miles are forecast to double by 2020 and double again by Railroads are now faced with three choices: Lay more track Change operating practices and schedules Drop the least profitable business Capital expenditures for railroads make up a larger percentage of revenues than virtually any other business (currently about 17%). It costs about $3.5 million to construct one mile of main line railroad track and about $466,000 annually to maintain it. On the other hand, if fuel costs continue to rise, rail transportation may become more economically advantageous. Port: The port of Sacramento serves a relatively small niche market for bulk (i.e. noncontainerized) cargos, faces strong competition from the port of Stockton and will require significant investments to its infrastructure to compete. A proposal by the Port of Oakland to operate the port here would likely generate new business and provide additional expertise to its management. Key investments that will be required to ensure that the port remains economically viable include: Dredging of the shipping channel from a depth of 30 to 35 feet - $50-70,000,000 Improvements to Harbor Boulevard - $33,000,000 (approximately $13 million funded) Rail relocation - $27-41,000,000 Marine terminal facilities - $20,000,
114 Approximate Total - $ ,000,000 Other nearby ports (with the exception of Redwood City) all have greater channel depths (35 38 feet). Strengths: The port is in close proximity to the greater Sacramento Valley cargo market It has a strategic location near I-5 and I-80. It is served by the Union Pacific Railroad and the Sierra Northern (Yolo Short Line) Railway. It has an inland location outside the Bay Area s congestion. Weaknesses: This area comprises a relatively small local market for heavy bulk goods. There are multiple nearby competitors. The port is in an upriver navigation location with a shallow channel. The port faces significant financial issues and has a lack of business diversity. A major threat to the port is the encroaching residential development. Airports: Air cargo has been forecast to increase 5.4% a year through 2020, compared to 4.1% a year for air passenger traffic. By 2025, the volume of international air cargo is expected to double or even triple statewide. In 2004, 98.8% of the state s airborne imports and 93.2% of the airborne exports went through Los Angeles International Airport or San Francisco International Airport. Both of these airports are served by extremely congested highway networks and both are seriously constrained in their ability to expand further. Taken together, these factors would tend to favor moving air cargo operations to less congested areas, such as Sacramento. Airport officials here have designated Mather Field as the region s air cargo hub. This move has not been entirely successful in shifting the focus of the region s air cargo operations primarily to Mather, as a great deal of air cargo still moves in and out of Sacramento International Airport, and Federal Express has refused to move to Mather. This is not entirely unusual, since a large volume of international air cargo is moved in the cargo holds of passenger jets. However, upcoming changes in security regulations could restrict this practice. Sacramento International Airport is currently the only airport in the Central Valley that offers international flights and is the only one likely to see a significant increase in the number of them offered. Studies have shown that there is already sufficient demand to offer daily non-stop service to London, five day a week service to Frankfurt, and at least weekly service to Asia. McClellan Airport, another former military air base, is owned but not operated by Sacramento County. It is conceptually planned to support aircraft maintenance and U.S. Coast Guard operations. Through economic development agencies, McClellan has been attracting a variety of private businesses to its facilities. These businesses replace the military activities that formerly took place at McClellan and have not created a larger trip attraction than was previously the case. 113
115 There are a number other general aviation airports in the SACOG region; however, none qualify as major attractors. The 2006 MTP includes light rail projects connecting downtown Sacramento to Natomas, and Natomas to the Sacramento International Airport. The Airport Loop Road project calls for construction of a two lane, three-mile roadway with the following alignment: Elkhorn Boulevard at Lone Tree Road, Elkhorn southwest towards Power Line Road, along the north side of I-5, and loop into the airport, merging with Airport Boulevard. The Placer Parkway, another project in this 2006 MTP, will also indirectly help to provide more direct access to the airport to South Placer County residents. Transit and Rail Connections: A key ground access issue prior to 1997 was the lack of any public transportation to Sacramento International Airport. YOLOBUS initiated public transit service between downtown Sacramento, West Sacramento, Davis, Woodland, and the airport in July Buses currently leave the airport twice each hour, once in each direction, making 13-stop loops through the above communities. The service operates weekdays and Saturdays from 5 a.m. to 10 p.m., with a reduced Sunday and holiday schedule. In addition to YOLOBUS service, private carriers such as shuttle services and taxicabs provide airport access within the region. Scheduled commercial van service also provides airport service from outlying communities as far away as Chico and the Lake Tahoe Area. The vans stop at commuter rail stations and provide commuter rail passengers with continuing service to the airport. Blueprint and Land Use Considerations: Freight transportation activities have the potential to both help and hinder the goals of the Blueprint process. The Blueprint seeks to mix residential and commercial land uses and provide a better jobs/housing balance. However, industrial and freight transportation-related land uses do not always adapt well to mixed-use development. Residents living near freight facilities naturally tend to complain about the traffic, noise and pollution generated there, especially if operations extend to off-peak hours. This is where goals of shifting freight operations to off-peak hours (to reduce traffic congestion) may come into conflict with policies that seek to provide a better mix of residential and employment-related land uses. Also, mixed-use development means that more delivery trucks will be operating in closer proximity to residences than would be the case in typical suburban neighborhoods. Rising real estate values, as well as the current emphasis on infill development and a desire to redevelop older industrial sites (aided by increasingly severe traffic congestion in central cities) have encouraged many older freight facilities to sell out in favor of more profitable land uses and relocate to outlying areas - typically with no rail access. This may have the effect of making available large parcels of centrally-located land for redevelopment another objective of the Blueprint. This may also make good business sense to move freight activities to remote locations where land values are lower and road access is less congested. While this has the advantage of freeing up land for more valuable types of infill development, the lack of rail access and more 114
116 remote locations could also result in more vehicle miles traveled by trucks overall, more emissions and more congestion in the region. Environmental Considerations and Impacts: The biggest freight-related concern to the citizens of this region is the impacts of trucks on roads. There is a concern that there are more trucks on the roads overall and an increasing number of trucks on local streets and arterials. From a citizen/resident perspective, this increase in trucks on roads brings with it concerns about traffic, safety, noise and air pollution. The Sacramento region may have an economic opportunity to be a freight terminal center, but that comes with the tradeoff of environmental and traffic impacts Air Quality: The emissions from freight movement have been shown to make up 49% of the nitrogen oxides (NOx) and 36% of the particulate matter (PM) from all mobile sources. Of these, trucks make up by far the largest contributor, accounting for almost 2/3 of the total freight-related emissions. Many parked trucks also idle their engines to run air conditioners in hot weather, or refrigeration units for the load, which adds to these emissions. Noise: As freight traffic has increased, so has the associated noise level. As the region s roadways become more congested, more trucks are moving at off-peak hours (night-time), worsening the effects of noise. Also of significant concern is the number of nighttime air cargo flights to Mather Field. An increasing number of studies have linked high levels of noise with a variety of health problems. Traffic: Even while total traffic volumes have been increasing, truck traffic has also seen a considerable increase. As mentioned earlier, all modes of freight transportation have seen significant growth and are forecast for even more. Safety and Security: While safety has always been of primary importance in freight operations, given the magnitude of potential impacts from truck or rail accidents, security has become even more important since 9/11/2001. New funding through the Department of Homeland Security has now become available to address this topic, and the California Department of Transportation has a variety of funding programs to address safety deficiencies. Truck Parking: In recent years, trucks parking at various and sundry locations has become a problem. In spite of being at the crossroads of two primary interstates, the Sacramento area is home to only one private truck stop. 115
117 APPENDIX H SACOG REGIONAL AVIATION SYSTEM PLAN SACOG is involved in aviation planning in three ways. The first involves land use planning for the areas around public-use airports. In this function, SACOG is known as the Airport Land Use Commission (ALUC). The second type of involvement is in regional aviation system planning activities which result in a Regional Aviation System Plan. The third activity involves working with the airports throughout the region to develop a program of airport improvement projects. The result is the Regional Airport Capital Improvement Program (CIP), which is submitted to the Caltrans Aeronautics Program for use in developing its airport project funding proposals. SACOG is responsible for aviation planning for Sacramento, Sutter, Yolo and Yuba Counties. Within these counties, there exist one commercial passenger airport, one air force base and thirteen general aviation airports as follows: SACRAMENTO COUNTY AIRPORTS Franklin Field Airport Mather Airport McClellan Field Rancho Murieta Airport Rio Linda Airport Sacramento Executive Airport Sacramento International Airport Sunset Skyranch Airport SUTTER COUNTY AIRPORTS Sutter County Airport YOLO COUNTY AIRPORTS Borges-Clarksburg Airport University Airport (Davis) Watts-Woodland Airport Yolo County Airport YUBA COUNTY AIRPORTS Beale Air Force Base Brownsville AeroPines Airport Airport Land Use Planning: In its role as the Airport Land Use Commission (ALUC) for Sacramento, Sutter, Yolo, and Yuba Counties, SACOG has two primary functions. The first is the protection of public health, safety, and welfare through the adoption of land use standards that minimize the public's exposure to safety hazards and excessive noise from nearby airports. The second function is to prevent the encroachment of incompatible land uses around airports, thereby preserving the utility of these airports in the future. 116
118 To carry out these functions, the ALUC develops Airport Land Use Compatibility Plans (CLUPs), which establish planning boundaries around airports for safe building heights, noise levels, and safety. Land use compatibility standards are also adopted, establishing the compatibility of individual land uses within each planning boundary. The ALUC works with local city and county governments to assure compatibility between local plans and the CLUPs for airport areas. Individual CLUPs have been adopted for all of the airports located within the region including Beale Air Force Base, with the exception of the Rancho Murieta and University airports. Planning boundaries and land use compatibility standards for these two airports are established by the Airport Land Use Commission Policy Plan. Under the provisions of ALUC law, CLUPs are required to be based upon airport master plans, or, in the absence of a master plan, an airport layout plan. Sacramento County updated its Master Plans for the Sacramento International Airport and Mather Airport in February Adoption of these two master plans by Sacramento County triggers ALUC updates of the CLUPs currently adopted for these two airports. Any significant airport changes, such as plans for new runways, runway extensions or changes in planned instrumentation of existing runways, could result in significant changes to the airport planning boundaries established by the existing CLUPs for these airports. Regional Aviation System Plan: The Regional Aviation System Plan provides a comprehensive look at the region's aviation system. It includes a description of individual public-use and military airports, discusses the major issues affecting aviation, examines the status of aviation funding programs, reviews future forecasts of aviation activity at individual airports, and analyzes the capability of the region's airports to accommodate the forecast future demand. The Plan also includes a series of goals, objectives and policies that are intended to help guide the ALUC in its ongoing aviation activities. The Executive Summary of this Plan is included at the end of this appendix. SACOG periodically updates this Plan, working both with local airports in the region and the Caltrans Division of Aeronautics. The most recent update was adopted in May of Information from SACOG's Regional Aviation System Plan is also incorporated by the Division of Aeronautics into the California Aviation System Plan. Regional Airport Capital Improvement Program: SACOG is responsible for updating the Regional Airport Capital Improvement Program (CIP) every other year. The Regional Airport CIP consists of a comprehensive list of the capital needs of the region's public-use airports. Projects typically included in the CIP are such things as runway repair, construction of airport maintenance facilities, hangars, terminal areas, lighting improvements, fencing and signage. SACOG works with the airports to develop the Regional Airport CIP, which is then submitted to the Caltrans Division of Aeronautics for incorporation into the biennial update of the Capital Improvement Program Element of the California Aviation System Plan. The State's CIP Element serves as a guide for current and future airport development in the state, 117
119 and provides the basis for the development of the Aeronautics Capital Program adopted by the California Transportation Commission (CTC). SACOG generally initiates updates to the Regional Aviation CIP beginning in the fall of even-numbered years. The State CIP Element became a required element of the California Aviation System Plan (CASP) following enaction of Public Utilities Code Section (SB 707) in 1990, and consists of a ten-year list of aviation projects by region divided into two five-year phases. Projects in the first five-year phase of the CIP identify sources of funding (State, Federal or both) and the requested funding year. The second five-year phase is a compilation of projects, without funding source having to be identified. The CIP process was first implemented in 1993, with the first biennial update occurring in Updates have occurred biennially since 1995, with the 2001 update being the most recent. Projects not included in the adopted State CIP will not be eligible for funding from the State Aeronautics Account, including the State portion of the local match for Federal Aviation Administration (FAA) Airport Improvement Program (AIP) funding. The CIP is intended to identify projects eligible for two sources of State funding, the Acquisition and Development Program and the AIP Matching Grant Program. The AIP Matching Grant Program assists airports in meeting the local match requirement for AIP grants from the FAA, providing up to a 5 percent match. AIP Matching Grant funds cannot be allocated by the State until an AIP grant has been offered by the FAA and accepted by the airport. Airport Ground Access Program: The region's major airport is the Sacramento International Airport, located in Sacramento County north of I-5 and west of Route 70/99. Road access to the airport is provided by state highways (I-5 and Routes 70/99), and by the internal circulation system within the airport. The planning, funding, and construction of internal improvements is undertaken by the airport, outside of SACOG's planning process. Outside access via I-5 and Routes 70/99 may become more difficult over time as congestion grows in that part of the region. [This following reprints the Executive Summary of SACOG's Regional Aviation System Plan]. 1. BACKGROUND AND INTRODUCTION ELEMENT The Background and Introduction Element is comprised of four major sections: a Regional Setting; Aviation Issues; Inventory; and Goals, Objectives and Policies. REGIONAL SETTING The Regional Setting establishes the context for subsequent portions of the Plan by providing an overview of the geographic, physical and socioeconomic characteristics of the region in which the airports are located. Existing and projected population and employment characteristics of the region are discussed. This section also highlights regional land use characteristics and provides a broad overview of the regional transportation system. 118
120 AVIATION ISSUES The Aviation Issues section looks at the significant issues affecting aviation at the federal, state and local level, and categorizes these issues under the following subsections: Environmental: The discussion of environmental issues looks at airport noise problems and the federal, state and local programs that have been established to address them. The water quality and air quality impact of airports, and the programs established to address these issues, are also discussed. Safety, Navigation and New Technology: The discussion of safety, navigation and new technology looks at the federal, state and local programs which regulate the safety of the aviation system. The use of airspace and the existing airspace control system are examined, as is the status of navigational aids used by the aviation industry. Current aviation research and development programs are also highlighted. Air Access to the Region: The discussion of air access highlights commercial and general aviation service in the region, and examines the rapid growth in regional air cargo volumes. Issues related to helicopter use are looked at, as are federal, state and local programs to regulate helicopter use. The missions of the two Air Force bases located within the region, Beale Air Force Base and McClellan Air Force Base, are discussed, as is the decision to close McClellan Air Force Base and convert it to civilian use. Aviation System Requirements: This subsection examines the capacity and expansion capabilities of airports located within the region, and also discusses the State Capital Improvement Program process as it relates to the airports. Planning: The discussion of planning starts with an overview of the regional transportation planning process in general, and goes on to specifically highlight the aviation system planning process. This subsection also examines airport ground access issues and transportation system management measures established for Sacramento International Airport. The airport comprehensive land use planning process is discussed, as is SACOG's role as the designated Airport Land Use Commission for the region. Economics: This subsection examines the considerable economic role airports play as a stimulus to both the State and local economies. Airport funding programs at the federal, state and local levels are explored, and the issue of financing ground access to airports is also discussed. Partnerships: The partnerships discussion looks at the relationship of the varied local, regional, state and federal entities that participate in the aviation planning process. Also addressed are the opportunities for public participation in the planning process, existing aviation awareness and education programs, and programs in place to provide local assistance. INVENTORY This section provides information about each of the region's public use airports, military airports and heliports. Airport-specific information includes the facilities and services available 119
121 at each airport, based aircraft and annual operation estimates, and landing and navigational aids. Information regarding the location of private heliports is included, as is the number of helicopters based at public use airports. The recent reclassification of the airspace system is discussed, along with how the region's airports fit into the new system. The rapid growth in air regional cargo volumes is highlighted, with air cargo tonnages presented for both Sacramento International and Mather Airports. The status of existing airport land use plans and airport planning documents is discussed, and the section ends with series of maps showing the adopted city and county general plan land use designations surrounding each public use airport. GOALS, OBJECTIVES AND POLICIES The Element concludes with a series of goals, objectives and policies that are intended to guide SACOG in its ongoing aviation system planning process. These goals, objectives and policies are grouped into the following categories: aviation safety, aviation noise, aviation system planning, aviation facilities, airport access and mobility, air quality, military airport conversion, aviation funding, and public participation. 2. FINANCIAL ELEMENT The Financial Element describes the history and current status of Federal and State funding programs, and identifies funding support from these programs that airports within the Region have received in the past. Also identified are future aviation projects submitted by the airports for inclusion in the State Capital Improvement Program. The Financial Element examines the various local funding programs used to fund services and projects at the Region's airports. Some of the more innovative approaches to airport financing through private and nontraditional sources are also discussed. The Element ends with an analysis of future airport needs, as identified in the State Capital Improvement Program, compared to future Federal and State funding resources assumed to be available to meet these needs. A major conclusion of the Element is that Federal and State funding programs do not have sufficient resources to meet the future funding needs of the Region's public-use airports. While federal AIP funding appropriations for aviation projects have increased over the past two years, after experiencing a declining trend for the preceding five years, this increase will likely result in only marginal increases in the AIP funding levels which have gone to the region's airports in the past. At the State level, expenditures for State aviation funding programs have averaged approximately $6.2 million per year during the period between fiscal years 1990/91 and 1996/97. In recent years the State has been unable to balance the budget with existing revenues and the legislature has borrowed funds from non-general Fund sources such as the State Highway and Aeronautics accounts in order to make up the difference. Given the current nature of the State economy, it is unlikely that significant aviation funding level increases will occur. Given the gap between Federal and State funding resources and the funding needs of airports, many airports will have to become increasingly self-sufficient in order to continue operating successfully. This could result in such actions as increasing airport user fees and lease fees, 120
122 provided such increases do not put an individual airport at a disadvantage compared to fees charged at other airports within the local aviation market. Public-private partnership arrangements may also offer opportunities for providing funds for the development and operation of airport facilities. In addition, an increasing trend which some airports may want to investigate is the privatization of various functions at publicly-owned airports, in which public authorities and private contractors enter into agreements for the operation of airport services and concessions. Airports will need to explore a broader range of innovative and nontraditional funding opportunities than in the past as traditional funding sources diminish. The next few years are likely to prove challenging for Federal and State aviation programs, airport operators, and aviation users alike in the effort to maintain airports as effective and efficient components of the nation's transportation network. 3. FORECAST ELEMENT The Forecast Element discusses aviation forecasts through the year 2020 for the region's publicuse airports. Included are forecasts for based aircraft, aircraft operations, pilots, registered aircraft, and hours flown at general aviation airports. Passenger enplanement and operations forecasts are also presented for Sacramento International Airport, the region's air carrier airport. Forecasts of regional air cargo tonnage are also included. The aviation forecasts contained in the Forecast Element were developed by the consulting firm of ICF Kaiser. The Caltrans Division of Aeronautics contracted with ICF Kaiser to develop forecasts for all public-use airports within the State. Two reports were prepared as a result of the consultants' work: the Central California Aviation System Plan: Interim Forecasts, Caltrans Division of Aeronautics, October 1996; and the California Aviation System Plan: Interim Statewide Forecasts, Caltrans Division of Aeronautics, October The first report focuses on the CCASP area, and is the source of the data used in the Forecast Element. The region, as a whole, is forecasted to experience a gradual increase in based aircraft, for a 31 percent increase between 1995 and the year Total annual operations within the region are also forecasted to increase between 1995 and the year 2020 by some 36 percent. While the number of operations at the county level is forecasted to increase during each five-year increment between 1995 and 2020, some fluctuations in this trend are forecasted for individual airports. Forecasts for student and private pilots show that this group comprised the largest pilot segment in 1995, being nearly three times as large as the commercial pilot segment. This pilot group, however, shows very little growth over time. By the year 2020, student and private pilots are forecasted to increase by only 8 percent over 1995 levels. The commercial pilot group, on the other hand, is forecasted to grow significantly, for a 156 percent increase by By 2020, commercial pilots will comprise 45 percent of total pilots, compared to only 25 percent in Much of this increase will likely be due to increased commercial operations at Sacramento International Airport, as well as increased air cargo and corporate operations at Mather Airport. 121
123 Annual air carrier passenger enplanements were forecasted for Sacramento International Airport. Both a low and a high enplanement forecast were developed, with the high forecast reflecting a significant hubbing operation at Sacramento International. The forecasts range from 3,250,000 enplanements in 1995 to 10,898,100 by the year 2020 under the low forecast and 15,908,100 under the high forecast. This amounts to a 235 and a 389 percent increase, respectively. Subsequent to the preparation of the consultants' forecasts, Sacramento International Airport prepared an update to their own forecasts. The airports forecasts go only as far as the year The airports forecasts do, however, assume a much slower rate of growth than even the consultant's low forecast figures during the same period of time. Commercial airline operations, consisting of both air carrier and commuter operations, were also forecasted for Sacramento International Airport. As with enplanements, both a low and a high operations forecast was developed. Starting with a 1995 level of 116,568 operations, the low forecast for 2020 is 306,268 annual operations, while the high forecast is for 447,080 operations. This represents an increase of 163 percent for the low forecast and 284 percent for the high forecast. Since the operations forecasts were based primarily upon the passenger enplanement forecasts, they may be on the high side in light of the airport's more recent enplanement forecasts. Forecasts were also made for air cargo. In 1995, air cargo amounted to 57,600 tons. By the year 2020 cargo is forecasted to be at a level of 149,523 tons, representing a growth in air cargo of 160 percent during the forecast period. It should be noted that the forecasts assumed that all future air cargo operations would occur at Sacramento International Airport, and do not take into account the fact that a significant number of air cargo companies now operate out of Mather Airport. 4. SYSTEMS REQUIREMENTS ELEMENT The purpose of the Systems Requirements Element is to determine the capability of the region's public-use airports to accommodate the future forecast aviation demand identified in the Forecast Element. Included is an examination of existing aircraft operational capacity compared to future operational levels forecast at each airport. Forecast based aircraft are also compared to the existing and planned aircraft parking capacity of each airport. The ability of the region's air cargo facilities to accommodate future forecast levels of air cargo is examined. Potential constraints impacting the future operational and aircraft parking capacities of airports are also discussed. The analysis of the capability of airports to accommodate forecast aircraft operations was performed by comparing the current estimated annual operational capacity of each airport to the year 2020 operations forecasts. Where the existing operational capacity of an airport exceeded forecast operations levels at an airport, a capacity surplus was assumed. Conversely, where year 2020 operations forecasts exceeded existing airport operational capacities, a capacity shortfall was noted. 122
124 Based upon the level of operations forecast at the region's general aviation airports by the year 2020, it is not anticipated that the operational capacity limit of any airport will be reached. Moreover, the region's airports are expected to have significant excess capacity, as evidenced by the fact that the most any single airport's individual capacity used was 58 percent, with most airports expected to be operating at less than 40 percent of capacity. With respect to aircraft parking capacity, the majority of the airports are expected to be able to accommodate the forecasted levels of based aircraft. While it was assumed that Sacramento International Airport would be operating at below capacity under the low operations forecast, under the high forecast scenario its existing capacity would be exceeded. Also, according to the consultants' passenger forecasts for Sacramento International, the airport's passenger capacity may be reached well before the year Fortunately, the airport has a much greater ability than do the general aviation airports to secure funding necessary for the construction of capacity enhancing facilities. The difficulty general aviation airports have in being able to secure the funding necessary to maintain existing facilities, and to construct additional facilities necessary to increase parking capacity, was the single most significant constraint identified. In addition, land use incompatibilities were also identified as having the potential to constrain airport capacity. 5. ACTION PLAN The intent of the Action Plan is to identify actions both SACOG and individual airports should undertake to both maintain and enhance the existing regional aviation system. The Action Plan is comprised of two sections. The first section consists of those actions that SACOG can undertake in fulfilling its role as both Airport Land Use Commission and Regional Transportation Planning Agency for the Counties of Sacramento, Sutter, Yolo and Yuba. These SACOG actions are derived from the goals, objectives and policies contained in the earlier Introduction and Background Element. The second section of the Action Plan is comprised of specific actions recommended for implementation by the region's public use airports. 123
125 APPENDIX I SACOG CONGESTION MANAGEMENT SYSTEM The Congestion Management System (CMS) is an important component of the regional transportation planning process. The first section reviews the federal requirements under the federal legislative mandate of TEA-21 as it applies to Transportation Management Areas (TMA). The second section discusses how the SACOG CMS is implemented in the context of the six required elements identified in federal guidance. These elements are successfully implemented throughout the SACOG planning process. The third section itemizes SACOG strategies to further improve the effectiveness of its CMS. REQUIREMENTS A CMS is defined as a systematic process for managing congestion that provides information on transportation system performance and on alternative strategies for alleviating congestion. All reasonable alternatives to expanding capacity for single occupant vehicles (SOV) must be considered. For TMAs, the CMS shall include the following elements: 1. Process develop a set of methods to monitor and evaluate system performance, identify causes of congestion, identify and evaluate alternative strategies, support the implementation of strategies with data, and evaluate the effectiveness of these strategies. 2. Performance Measures define parameters to measure the extent, severity, and duration of congestion and support the evaluation of congestion reduction strategies. 3. System Performance Monitoring establish program of systematic data collection and analysis to define the extent, severity, and duration of congestion. 4. Congestion Management Strategies identify appropriate traditional and non-traditional congestion management strategies, including additional system capacity only where necessary. 5. Implementation establish implementation schedule, implementation responsibilities, and identify funding sources. 6. Assessment implement process to assess effectiveness of implemented strategies in terms of the established performance measures. FHWA mandates no specific program structure, giving regional planning agencies wide latitude in implementing this planning requirement. The SACOG CMS is decentralized and closely integrated into the transportation planning process, as described in detail in the following section. CMS DESCRIPTION SACOG has a superior record of implementing the planning principles embodied in TEA-21, including those specific to CMS. This region s CMS is closely integrated into the transportation planning processes. Through these processes, SACOG routinely collects available congestion data, analyzes those data, and applies these analyses to project evaluation. 124
126 CONGESTION MONITORING AND PERFORMANCE MEASURES The CMS closely monitors congestion by collecting data from CALTRANS, other regional transportation authorities, and local jurisdictions. The most common and useful data are roadway traffic volumes. Collected by various agencies and local consultants, traffic volumes are readily converted into performance measures. Other data collected are travel times, turning movements, and modeled outputs from traffic operations studies. These data are used prominently in the regional travel model, the preferred tool for evaluating congestion management strategies. Performance measures used by SACOG include roadway v/c ratio and corresponding level of service (LOS), and the Congestion Index. LOS is a generally accepted performance measure in transportation planning. The Congestion Index is a SACOG innovation that measures the amount of peak period congestion experienced by the region s travelers. It measures travel conditions for an entire trip rather than congestion of any specific facility. The Congestion Index is used to measure system-wide effects and help evaluate plan alternatives. In cooperation with many local jurisdictions, SACOG is developing a comprehensive framework for data management with geographic information systems (GIS). This framework includes road centerlines, parcel level land uses, and demographics. The GIS will be able to manage congestion data like traffic volumes, giving improved utility for applications. This cutting edge system will help tie together the disparate parts of CMS into a powerful, unified data source and analysis tool. A development within the last fiscal year that will assist SACOG with its congestion monitoring efforts is the County of Sacramento s Mobility Study. With SACOG s support and collaboration, the Mobility Study has made an exhaustive evaluation of present and future congestion on several vital corridors within the county. Also, Caltrans has agreed to provide periodic and detailed operations level congestion data for the region s highway system. Highway interchanges are key facilities for congestion management. These new data sources will strengthen an already robust regional CMS. CONGESTION MANAGEMENT STRATEGIES SACOG vigorously applies analyses of congestion management strategies to the transportation planning process. In pursuit of the core principle of CMS, finding alternatives to expanding single occupant vehicle (SOV) road capacity, this region has an excellent record. In both the 20-year and 5-year planning cycles, aggressive analyses of alternative strategies to SOV travel are consistently applied. In addition, planning initiatives like the Blueprint Project and the Community Design Program reinforce the already strong institutional commitment to progressive transportation solutions that reduce congestion and its negative societal consequences. The MTP 2025 embodies the SACOG commitment to an active and effective CMS. Federal guidance notes that a CMS should be integral to the long-range plan and ultimately serve that process. The MTP 2025 embodies that principle in every way. The ten stated goals of the MTP encompass those outlined by TEA-21 for a model CMS, thoroughly and inclusively. While testing plan alternatives, proposed project lists were subjected to rigorous analyses that compared congestion relief strategies, and alternatives were compared for system-wide congestion effects. Potential SOV capacity expansion projects were given the highest scrutiny possible with every alternative mode and other reasonable strategy considered. These planning principles are followed consistently through plan implementation. 125
127 Along with monitoring, the Metropolitan Transportation Improvement Plan (MTIP) represents the short-term facet of the CMS. All proposed MTIP projects must already be in the approved MTP, and relevant technical analyses are brought forth for further consideration. Therefore, congestion relief strategies are fully considered in project implementation. The MTIP development process is coordinated with and flows from the MTP. Also, the region is known for innovative TCM projects like the diesel engine exchange program. The Community Design Program provides a new and creative method for considering congestion management strategies. The MTP 2025 set aside $500 million for this program, which has undergone one funding cycle so far. Projects that further the principles of smart growth are eligible, including innovative transportation projects that give alternatives to single-occupant vehicle travel. SACOG and its CMS have backed up goals and principles with concrete and fully committed resources. The Blueprint Project is another example of innovation as SACOG strives to meet and exceed the planning requirements of TEA-21 and its CMS component. Blueprint is an unprecedented effort to make the land use/transportation connection relevant to regional transportation planning. This enormous planning effort includes the use of cutting edge technologies and modeling tools. These tools help divine how land development affects congestion management strategies, thus greatly informing future choices in how we reduce congestion. The CMS is greatly aided by the practical testing of the new analysis techniques pioneered in Blueprint. IMPLEMENTATION AND ASSESSMENT The MTIP and MTP, with its CMS component, provide a unified and continuous link between planning, project development, funding, and implementation. SACOG has a proven record of delivering projects that effectively mitigate congestion in this region, meeting or exceeding agency goals for programming available resources for many consecutive years. Where planning horizons overlap, the MTP projects are the MTIP projects, and so the detailed analyses conducted for the MTP hold true for the MTIP cycle. Programmed improvements are always taken into account, usually as a base condition, when conducting system-wide congestion analysis or comparisons of plan alternatives. FUTURE IMPROVEMENTS SACOG strives to improve all aspects of the planning process, including the CMS. Starting in 2004/2005, this agency will produce an Annual Congestion Report to the Regional Planning Partnership (RPP). SACOG staff will collect all available congestion data in the region, subject these data to thorough analyses, and publish results for general dissemination. The report will enhance the CMS in the following ways: Through the RPP, better inform our local policy makers on current trends in system congestion and allow this information to quickly inform other analyses Give SACOG members a conduit for making suggestions on how to improve the CMS in a timely and efficient manner 126
128 Enhance congestion monitoring by creating central databases for congestion information and providing greater consistency and continuity in these efforts SACOG intends to make an early amendment to the OWP for inclusion of this program item. SUMMARY The CMS is an important and valued facet of SACOG s regional planning program. Consistent with federal guidance, SACOG has chosen a more decentralized model where the CMS is closely integrated into the MTIP and MTP. The MTIP and MTP, with its CMS component, provide a unified and continuous link between planning, project development, funding, and implementation. All required elements of a CMS for a TMA are clearly evident in this agency s planning programs. Data from congestion monitoring are used to evaluate congestion management strategies for projects and plan alternatives. New planning programs like Blueprint and Community Design further demonstrate SACOG s strong commitment to the letter and intent of TEA-21. With the Congestion Report as an example, SACOG will always strive to improve the CMS and better inform the planning process. 127
129 APPENDIX J TRANSPORTATION MODELS AND TECHNICAL ANALYSIS [Please note: This appendix was originally prepared for the MTP 2025 and has been updated to reflect a few changes in the travel model and a significant change in the emissions model used in the air quality conformity analysis. The 2006 MTP project list relies upon the modeling and technical analysis from the MTP For the 2006 MTP, the same model runs were reproduced in the updated model set.] The technical analysis relies on travel demand forecasting models to project the travel conditions and system performance of the various options. The SACMET model covers the entire 6-county SACOG area, including both air quality areas. This model is a mathematical tool that estimates the general travel choices people will make, based on the primary social, demographic and physical conditions that affect such choices. To develop the forecasting model, information on the characteristics of the transportation system is collected. Roadway and public-transit systems were studied to collect accurate technical descriptions of how these systems operate, and the conditions in which they operate. Data also were collected by conducting surveys of the region's residents, to determine the types of trips being made and the factors that affect those trips-demographic characteristics and the constraints of the transportation system, for example. Using all this information, a mathematical model of travel behavior was developed, relating to the types of trips made, frequency of trips, length of trips, time of day that trips are made, and the mode of travel used for the trip. When these relationships are applied to the entire region, traffic volumes and public-transit ridership can be estimated for a base year, meaning the current year or a very recent year. Estimates are compared to actual data that are prepared from the base year, to determine the accuracy of the model. When the model is judged to be accurate within acceptable standards, it then can be used to forecast travel patterns for a future year, given some assumptions about the size of the population in that future year, the places where new housing and businesses are built, the size of the employment base in that year, and the transportation improvements we expect to take place by that year. LIMITS OF FORECASTING MODELS The forecasting model is developed within the limits of available data and within the limits of our understanding about how people make their travel choices. All of the various choices that people make every day cannot be replicated or forecasted with exact precision. We attempt to understand the major travel choices, and the primary factors that affect these choices. Also, we cannot replicate all the travel conditions that occur on the roadways and on the publictransit system. We limit our analysis and forecasts to the average weekday, including peak and offpeak travel periods. Traditionally, roadway design decisions are made to accommodate average conditions, not to accommodate extreme traffic loads like Friday afternoon traffic before Christmas near a shopping mall. Another reason we limit the process to average conditions is that it is more difficult, time-consuming, and costly to collect the necessary data for unusual or peak conditions. Another limitation of the model is that it assumes no traffic accidents, breakdowns, spilled loads, lanes closed for maintenance, or other temporary bottlenecks. The timing, severity, duration, and 128
130 location of these incidents makes them too difficult to analyze within the constraints of a largescale regional model, but we do know that as traffic levels near roadway capacity, incidents become far more disruptive for longer periods of time. Many researchers and practitioners contend that increases in the roadway system cause, or induce, additional vehicle travel. Our analysis shows that more road capacity may change travel patterns and increase overall vehicle miles of travel, but do not necessarily "induce" people to make extra trips just because driving is easier. Our analysis does address many of the relationships of vehicle travel demand. However, the effect of transportation improvements on the amount and location of residential and commercial development is not included because the future land uses are assumed to remain constant across all options. PERFORMANCE MEASURES For the 2006 MTP, the same performance measure that were used in the MTP 2025 were again utilized. Listed below are the characteristics of these measures. Roadway measures relate to travel in vehicles on the roadway system. These measures include the number of vehicle trips made on a typical weekday, vehicle miles of travel (VMT), and vehicles hours of travel (VHT). Both the total amount of VMT and VHT are reported as well as travel under highly congested conditions. Levels of service (or LOS), a widely used measure, is designated "A" through "F". LOS A is uncongested, free-flow conditions and F is the most congested conditions. Roadways at LOS F means roadways are forecasted to have traffic volumes at or above their capacity. The use of this performance measure is a way of indicating how much travel will occur in congested conditions. A second category of congested travel is reported. The Congestion Index is measure of the amount of peak period roadway travel under LOS E or F conditions experienced by the region's residents. The difference from roadway measures is that the Congestion Index measures a person's travel conditions on their entire trip rather than the conditions on any particular road or street. The Index is scaled so that the year 2000 peak period regional average is 100. The Index is calculated for the various communities throughout the region in the present and future forecasts. Each community can be evaluated in several ways: a) against the regional average, b) against other communities, and c) from the present to the future years. Mode choice measures relate to the mode of travel chosen for a trip. Travel modes include solo driving, ridesharing, public transit, and non-motorized modes (bicycling and walking). Emissions measures are estimates of the total regional emissions from on-road mobile sources. Emissions estimates are provided for four pollutants-oxides of nitrogen (NOx), reactive organic gases (ROG), particulate matter (PM-10), and carbon dioxide (CO2). Ozone is formed from NOx and ROG, PM-10 is small dust particles that can have respiratory effects, and CO2 is a major greenhouse gas related to global warming. The Air Resources Board's emission model EMFAC2002 was used to calculate the emissions, using SACOG's travel forecasts. EMFAC2002 is the newest on-road emissions model from the Air Resources Board, and includes the latest available data on a range of factors such the trends in 129
131 vehicle ownership. It also includes the latest research on the technological and climatic impacts on emissions. The plan meets both federal and state air quality mandates. The federal requirements-through air quality conformity analysis-have to do with keeping projected emissions within certain allowable levels in specific future years. Because there are so many forecasts required in this analysis, it is published in a separate report. The analysis, available from SACOG, shows that the plan meets federal conformity requirements, with emissions within the allowable levels in each of the future milestone years. The California Clean Air Act calls for reducing the rate of growth in vehicle trips and vehicle miles traveled (VMT), particularly in comparison with the projected population growth rate. The following shows how the 2006 MTP performs in meeting the standards of the California Clean Air Act. PERFORMANCE OF THE 2006 MTP RELATING TO THE CALIFORNIA CLEAN AIR ACT REQUIREMENTS Growth in daily vehicle trips, % Growth in daily vehicle miles of travel, % Growth in population, % The 2006 MTP succeeds in keeping growth in vehicle trips (33.5 percent ) and growth in VMT (33.3 percent) to a lower rate than the population growth (37 percent) during the 22-year planning period. 130
132 APPENDIX K REFERENCES (in chronological order) California Air Resources Board and five local air districts, 1994 State Implementation Plan, November 15, Sacramento Area Council of Governments. Intelligent Transportation Systems Early Deployment Planning Study. June "Fifty Years of Growth: Fifty Years of Choices" video produced for SACOG by JHME Associates, October Sacramento Area Council of Governments, TRAVELING INTO OUR FUTURE; a Report on the Regional Transportation Forum held November 5, 1999, at the Sacramento Convention Center on November 5, Accord Associates, 2025 Metropolitan Transportation Plan Update: Report on the Town Hall Meetings Held January 24-February 2, Sacramento Area Council of Governments. Innovative Transportation Strategies: A Resource Guide. September 21, Sacramento Area Council of Governments. Metropolitan Transportation Plan for 2025: Community Input Plan. November Sacramento Area Council of Governments. Metropolitan Transportation Plan for 2025: Analysis of Study Alternatives. September Sacramento Area Council of Governments. Metropolitan Transportation Plan for 2025: Preliminary Draft. January "Metropolitan Transportation Plan for 2025" video, produced for SACOG by Chris Cochran Productions, January Valley Vision, California State University Sacramento, and Sacramento Area Council of Governments, Sacramento Region Quality-of-Life Index January Godbe Research & Analysis, Survey of Residents Conducted for Sacramento Area Council of Governments. March 14, Sacramento Area Council of Governments. Public Comments Regarding the Metropolitan Transportation Plan for As of April 10,
133 Sacramento Area Council of Governments. Public Comments Regarding the Metropolitan Transportation Plan for From April 11, 2002 through April 17, Sacramento Area Council of Governments. Metropolitan Transportation Plan for Adopted July 18, Sacramento Area Council of Governments. Final Environmental Impact Report on the Final Draft Metropolitan Transportation Plan for Adopted July 18, Sacramento Area Council of Governments. Air Quality Conformity Determination. Adopted July 18, Sacramento Area Council of Governments. Community Input Plan for the Interim Metropolitan Transportation Plan. September Sacramento Area Council of Governments. Final Interim Metropolitan Transportation Plan, 2004/05. Adopted October 21, Sacramento Area Council of Governments. Metropolitan Transportation Plan 2027 for the SACOG Region Including an Interim Plan for the Counties in the Sacramento Air Basin. Adopted July 21, Sacramento Metropolitan Air Quality Management District, et al. Federal 8-Hour Ozone Rate-of Progress Plan for the Sacramento Region (Draft Report), September
134 APPENDIX L IRR TIP PROJECT Projects that are listed in the Indian Reservation Road Transportation Program ( IRR TIP ) are included in the applicable MTP and the MTIP without further action. The Federal Highway Administration, Indian Reservation Roads Program, Chapter 6 ( states: The IRR TIP is included in the Statewide Transportation Program (STIP) developed by each State Transportation Agency without further action. If an IRR project lies within a metropolitan area, it must be included in the metropolitan area TIP without further action. Title 23, United States Code section 204(a) provides that (1) In general. Recognizing the need for all Federal roads that are public roads to be treated under uniform policies similar to the policies that apply to Federal-aid highways, there is established a coordinated Federal lands highways program that shall apply to public lands highways, park roads and parkways, refuge roads, and Indian reservation roads and bridges. (5) Inclusion in state programs. The approved Federal lands highways program transportation improvement program shall be included in appropriate State and metropolitan planning organization plans and programs without further action on the transportation improvement program. BIA, by its Deputy Bureau Director for Tribal Services, has stated by letter dated December 16, 2005 to Nicolas H. Fonseca, Chairman, Shingle Springs Rancheria, that the Shingle Springs Rancheria Interchange is in the IRR TIP. As stated above, projects in the IRR TIP are in the MTP and MTIP without further action by SACOG. This project has been included in the ROP SIP analysis and in the conformity analysis. No federal, state or local government funds will be used to construct the Shingle Springs Interchange.
135
136 APPENDIX M SACOG BOARD OF DIRECTORS RESOLUTION OF SUPPORT 135
137
138
139 APPENDIX N KEY EXCERPTS FROM THE 2006 MTP AIR QUALITY CONFORMITY DETERMINATION 137

140 Sacramento Area Council of Governments 1415 L Street, Suite 300 Sacramento, CA tel: fax: tdd: March 27, 2006 Mr. Gene K. Fong, Division Administrator U.S. Federal Highway Administration 980 Ninth Street, Suite 400 Sacramento, CA Mr. Leslie Rogers, Regional Administrator Federal Transit Administration, Region IX 201 Mission St, Suite 2210 San Francisco, CA Ms. Lisa Hans, Chief Mobile Sources Section U.S. Environmental Protection Agency 75 Hawthorne Street San Francisco, CA Ms. Jody Jones, District Director Caltrans District 03 P.O. Box 911 Marysville, CA Re: Transmittal of the Air Quality Conformity Determinations on the 2006 Metropolitan Transportation Plan (MTP) and 2006/08 Metropolitan Transportation Improvement Program (MTIP) for the Sacramento Ozone (ROG and NOx) Nonattainment Area, Carbon Monoxide (CO) Maintenance Area, and Particulate Matter (PM-10) Moderate Nonattainment Area. Dear Messrs. Fong and Rogers and Mses. Hans and Jones: The following air quality conformity determinations on the 2006 MTP (Attachment A), and the 2006/08 MTIP (Attachment B) for the Sacramento Ozone (ROG and NOx) Nonattainment Area, Carbon Monoxide (CO) Maintenance Area, and Particulate Matter (PM-10) Moderate Nonattainment Area are hereby transmitted to you for your review and approval. The SACOG Board of Directors approved the attached conformity determinations at its March 16, 2006, meeting. The attached air quality conformity determinations have been prepared in accordance with the conformity requirements as published in the federal register on August 15, 1997, and in accordance with USDOT s January 2, 2002, guidance, Revised Guidance for Implementing the March 1999 Circuit Court Decision Affecting Transportation Conformity (93.109).
141 nto Area f ents 1415 L Street, Suite 300 Sacramento, CA tel: fax: tdd: Conformity Approach The last conformity determination for the Sacramento ozone nonattainment area, CO attainment area and PM-10 moderate nonattainment area was adopted by the SACOG Board of Directors on November 20, 2002 (93.114). The conformity test for the Sacramento ozone nonattainment, CO attainment, and PM-10 moderate nonattainment area will consist of a quantitative emissions analysis (budget test for ozone and CO and a build vs. no-build test for PM-10), as shown in Attachment C. Plan and MTIP Status The SACOG Board of Directors is scheduled to adopt the 2006 MTP and the 2006/08 MTIP at its March 16, 2006, meeting (93.104). Financial Constraint The 2006 MTP and the 2006/08 MTIP are fiscally constrained consistent with 23 CFR 450 (93.108). Inclusion of All Federal and Non-Federal Regionally Significant Projects The 2006 MTP for 2025 and the 2006/08 MTIP include all federal and non-federal regionally significant projects expected to occur in the Sacramento nonattainment (ozone), maintenance (CO) and moderate (PM-10) areas, along with projects expected to be built in the Yuba/Sutter attainment area [93.122(a)(1)]. Latest Planning Assumptions The emission estimates developed for this conformity determination were based on the latest population and employment projections for the Sacramento and Yuba/Sutter areas that were adopted by the SACOG Board of Directors on December 16, 2004 (93.110). Latest Emissions Model One of the critical inputs into determining emissions associated with the 2006 MTP and the 2006/08 MTIP is the selection of which emissions factors to use. For purposes of this conformity determination, EMFAC 2002 was used, as provided to SACOG by the California Air Resources Board (CARB) along with revised emission factors dated January 24, 2002, which were also provided to SACOG by CARB (93.111). Quantitative emissions analyses have been prepared for the Sacramento nonattainment, maintenance, and moderate areas, as shown in Attachment C.
142 nto Area f ents 1415 L Street, Suite 300 Sacramento, CA tel: fax: tdd: Modeling Documentation A complete description of the Sacramento SACMET model that was used by SACOG to develop the quantitative emissions analyses included with this submittal is available upon request (93.111). Estimates of regional transportation-related emissions for serious, severe, or extreme ozone nonattainment areas that are used to support conformity determinations must be made in accordance with the procedures laid out under section (b) (1) through (3) of the August 15, 1997 Federal Register. The Sacramento ozone nonattainment area is currently classified as a moderate ozone nonattainment area. SACOG s SACMET Travel Demand model, which was used to develop transportation-related emissions for the Sacramento nonattainment areas, currently meets all the modeling requirements, as set forth in the August 15, 1997, Federal Register. The SACMET model was used to develop ROG, NOx and CO emissions for the Sacramento ozone nonattainment and carbon monoxide maintenance areas, respectively. The EPA s AP-42 emissions model was used to develop PM-10 emissions for the PM-10 nonattainment area (Sacramento County only). Consultation Review of this document is part of the conformity consultation process as required under section (a) (2), (c) (1), and (e) and is consistent with the public involvement procedures under 23 CFR 450 (93.112). This air quality conformity analysis was circulated for thirty days to give all affected parties an opportunity to comment. Copies of all comments, along with our responses, are included in Attachment D. Over the last year, the Regional Planning Partnership (Partnership), a committee established by the SACOG Board of Directors to review all conformity determinations and assumptions, was asked to review and approve a set of assumptions for use in future conformity determinations. Those assumptions have been incorporated into these conformity determinations. Transportation Control Measures SACOG has prepared status reports on the implementation of transportation control measures (TCMs) contained in SACOG s 1982 Air Quality Plan (AQP) and 15% Rate-Of-Progress (ROP) Plan. These status reports were last submitted with SACOG s April 28, 1994, conformity submittal that was approved by Federal Highway Administration (FHWA) and the Federal Transit Administration (FTA) on August 16, The information contained in those documents has not changed since that submittal. Therefore, copies of those documents will not be transmitted with this submittal. In summary, the 1987 report written by the EPA concluded "that, in general, most of the agencies that committed to carrying out measures under the 1982 Air Quality Plan (AQP) have fulfilled those commitments and, in many cases, have taken actions which go beyond their 1982
143 nto Area f ents 1415 L Street, Suite 300 Sacramento, CA tel: fax: tdd: Plan commitments." The EPA did, however, point out that not all measures had been fully implemented by Since 1987, jurisdictions included in the 1982 AQP have fully implemented all of their plan commitments, and in many cases, jurisdictions have gone beyond their plan commitments, either through strengthening of existing measures or adoption of new measures, as documented in the TCM status report. Air Quality Emissions Analysis In order for SACOG to make conformity determinations on the 2006 MTP and the 2006/08 MTIP, a quantitative emissions analysis must be performed for the Sacramento air quality planning areas. SACOG has completed a quantitative emissions analysis for Reactive Organic Gases (ROG) and Oxides of Nitrogen (NOx) for the Sacramento ozone nonattainment areas, CO maintenance area and PM-10 moderate area, as shown in Attachment C. Years of Analysis - SACOG prepares estimates of emissions for the Sacramento air quality planning areas for the analysis years described below. Estimates of emissions are prepared in accordance with the conformity regulations as published in the August 15, 1997 Federal Register. The analysis years of 2008, 2010, 2013, 2018, 2020, and 2027 were chosen for the Sacramento air quality planning areas because 2008 represents an ozone budget year under the Rate-Of- Progress State Implementation Plan (ROP/SIP) and the first analysis year for PM10; 2010 represents one of the two milestone years for CO and is the first ozone milestone year and is also no more than 10 years from the calibration year of the transportation model (2000 is the calibration year for SACOG s current transportation model (b)(1)(i); 2013 is the current attainment date for ozone; and 2018 is a milestone year for CO and PM10. The year 2020 was chosen because it represents an horizon year as specified under section (a)(1). The year 2027 is used because it represents the last year of the transportation plan s forecast period and, therefore, is required to be an emission analysis year, as specified under section (a)(iv) of the conformity regulation. Analysis Techniques - The analysis techniques that were used for generating Reactive Organic Gases (ROG), Nitrogen Oxides (NOx), and Carbon Monoxide (CO) emissions for this conformity submittal are documented in Attachment C. Specifically, SACOG employed its "SACMET" travel demand model for the Sacramento ozone nonattainment area to generate trips and daily vehicle miles traveled (VMT) for each alternative scenario. The outputs from the SACMET model were then inputted into a PC-based version of the Direct Travel Impact Model (DTIM), which is used to generate emissions. One of the critical inputs into the DTIM is the selection of emission factors. For this analysis, SACOG used EMFAC2002, as provided to us by the CARB. PM-10 Analysis - In addition to the above pollutants analyzed, SACOG also performed a PM-10 analysis for the Sacramento PM-10 nonattainment area. The methodology employed (AP-42)
144 nto Area f ents 1415 L Street, Suite 300 Sacramento, CA tel: fax: tdd: was provided to SACOG by the EPA. Emission projections of PM-10 were made for the years 2008, 2018, and 2027, as shown in Attachment C. Transit Policies and Ridership Prior to any transportation conformity modeling, SACOG incorporates any changes to fares or levels of service to the transit operating systems within the Sacramento and Yuba/Sutter planning areas for conformity [ (c)]. There have been no significant changes to the fares or levels of service since the last conformity submittal. The last conformity determinations for the Sacramento ozone nonattainment area, CO attainment area, PM-10 moderate, and Yuba/Sutter ozone nonattainment areas were adopted by the SACOG Board of Directors on June 20, 2002 (93.114). On September 1, 2005, the Sacramento Regional Transit Board of Directors approved a phased fare increase effective September 1, 2005, along with some minor reductions in bus service. The first phase of the new fare included an increase in the basic fare from $1.50 to $1.75, plus a new $.25 transfer charge, an increase in the monthly pass from $60 to $80, and an ADA/Paratransit fare increase from $3.00 to $3.25. It is not known at this time whether or not the fare increase will adversely affect ridership. Transit ridership within the SACOG conformity areas has increased slightly from approximately million in FY to approximately million in FY This represents an increase in ridership of approximately 1.2%. The following chart shows the changes in ridership from FY to FY for the major transit systems within the SACOG conformity planning areas. 03/04 04/05 Major Transit Operators within the Actual Actual Sacramento Air Quality Planning Areas Ridership Ridership Regional Transit Light Rail 11,022,004 12,008,620 Regional Transit Bus System 19,446,782 18,929,374 Yolobus 1,215,615 1,245,120 Roseville Transit 391, ,190 Paratransit 650, ,345 Unitrans 3,450,060 3,416,432 Folsom 161, ,973 Yuba/Sutter Yuba/Sutter Transit Authority 652, ,324 Total Ridership 36,990,660 37,545,648
145 nto Area f ents 1415 L Street, Suite 300 Sacramento, CA tel: fax: tdd: The MTP for 2025 includes a number of goals supporting transit, and they are listed below: Develop a fully-integrated, multi-modal transportation system to serve as a catalyst to enhance the quality of life enjoyed by the current and future residents of the Sacramento region. Improve access to goods, jobs, services, housing, and other destinations; provide mobility for people and goods throughout the region, in a safe, affordable, efficient and convenient manner. Develop a transportation system and related strategies that contribute to achieving healthy air in the region. Provide affordable, convenient, safe, and integrated travel choices. Pursue a transportation system that addresses the needs of all people in all parts of the region and assure that impacts of transportation projects don t adversely affect particular communities disproportionately. Develop the transportation system to promote and enhance environmental quality for present and future generations. Influence land use policies to improve access to jobs, services, and housing to everyone in the region by using market forces and the regulatory process. Public Participation Process SACOG s Community Input Plan outlines the techniques employed by SACOG to help facilitate public participation during the development of the 2006 MTP, and solicitation of projects for the 2006/08 MTIP. SACOG's Community Input Plan provides for early and continuing participation in our long-range transportation plans, our project-selection or "programming" process (i.e., Federal TIP), and the air-quality "conformity" determination and environmental reviews associated with these plans and programs. These conformity determinations were circulated to the public and interested federal, state, and local agencies and jurisdictions for their review, consultation, and comment for a minimum of thirty days. Copies of all comments received, along with our responses, are included as Attachment D. Resolutions of Adoption for the 2006 MTP and the 2006/08 MTIP Copies of the resolutions of adoption finding that the 2006 MTP and the 2006/08 MTIP conform to the 2005 ROP/SIP are included as Attachments E and F, respectively, for your review and approval. The SACOG Board approved the attached resolutions at its March 16, 2006, meeting.
146 nto Area f ents 1415 L Street, Suite 300 Sacramento, CA tel: fax: tdd: In summation, we hope that the information provided in this letter, plus the supporting documentation, will assist in your approval of SACOG's air quality conformity determinations on the 2006 MTP and the 2006/08 MTIP for the Sacramento air quality planning areas.
147 nto Area f ents 1415 L Street, Suite 300 Sacramento, CA tel: fax: tdd: If you have any questions concerning this conformity submittal, please call David Young, Senior Planner, at (916) Sincerely, Mike McKeever Executive Director MM:DHY:gg Attachments cc: Jerome Wiggins, Federal Transit Administration Sue Kiser, Federal Highway Administration Karina O Connor, U.S. Environmental Protection Agency Larry Sherwood, Caltrans District 3 Scott McGowan, Caltrans Division of Transportation Programming Steve Luxenberg, Federal Highway Administration S:\Projects 05-06\0301-MTP\MTP 2006\Appendix N - Conformity.doc
148 nto Area f ents 1415 L Street, Suite 300 Sacramento, CA tel: fax: tdd: TO: Federal Highway Administration FROM: Mike McKeever, Executive Director DATE: February 10, 2006 RE: Air Quality Emissions Conformity Analysis on the 2006 Metropolitan Transportation Plan (MTP) and the 2006/08 Metropolitan Transportation Improvement Program (MTIP) for the Sacramento Ozone (ROG, and NOx), Carbon Monoxide (CO) and Particulate Matter (PM-10) Air Quality Planning Areas BACKGROUND: Federal regulations require that the Sacramento Area Council of Governments (SACOG) prepare Air Quality Conformity Determinations on its transportation plans and programs. The purpose of the conformity determination is to ensure that SACOG s plans and programs "conform" to all applicable federal air quality requirements. Based on guidance from the Environmental Protection Agency (EPA) dated August 15, 1997, and January 2, 2002, conformity determinations must be based on the most recent estimates of on-road vehicle-based emissions. The emissions estimates must also be based upon the most recent population, employment, travel and congestion forecasts from SACOG, acting as the federally designated Metropolitan Planning Organization (MPO) for the Sacramento region. SACOG has developed an emissions conformity procedure based on the modeling requirements contained in the August 15, 1997, Federal Register. These regulations require us to develop a series of forecasting model runs for the Sacramento air quality planning areas, using our SACMET Travel Demand models, whenever we prepare a conformity determination. This model uses estimates of population, employment, and travel patterns for 2000, as the "Base Year," and future estimates of these same parameters for a series of future years. The future years are designated as "milestone" or "horizon" years for certain types of pollutant emissions under EPA regulations. The Travel Demand Models are used to estimate daily vehicle miles traveled (VMT), in five-mile-per-hour increments, for each model run. The total number of trips for each model run is also generated. Daily VMT and total trips from each model run are then used as inputs to our vehicle-emissions forecasting model, EMFAC2002 provided by ARB. DISCUSSION: This memo discusses the results of the emissions analysis for the 2006 MTP and the 2006/08 MTIP for the Sacramento reactive organic gas (ROG), nitrogen oxide (NOx), carbon monoxide (CO), and particulate matter (PM-10) air quality planning areas.
149 Mr. Gene K. Fong, Mr. Leslie Rogers, Ms. Lisa Hans, and Ms. Jody Jones Page 10 March 27, 2006 A) SACRAMENTO EMISSIONS CALCULATIONS The following emissions conformity determinations were based upon VMT assumptions as approved by the Regional Planning Partnership on May 26, 2005 and subsequently agreed to by both FHWA and EPA (copies of the memo are available on request). This memo documents the methodology that was used to develop VMT estimates for the current 8-hour ozone Rate-Of- Progress State Implementation Plan (ROP/SIP) and for any future conformity determinations under this ROP/SIP. In order to prepare an emissions conformity analysis on the 2006 MTP and the 2006/08 MTIP, SACOG prepares estimates of emissions for the Sacramento air quality planning areas for the following analysis years: 2008, 2010, 2013, 2018, 2020, and 2027, depending on the pollutant in question. Estimates of emissions are prepared in accordance with the conformity regulations as published in the Federal Register on August 15, Once the analysis years have been selected, SACOG uses its SACMET travel demand model to generate daily vehicle miles traveled (VMT) and total trips for each analysis year in question using population and employment assumptions, as shown in the Table 1. The outputs from the transportation model are then inputted into a PC-based version of EMFAC2002, as provided to SACOG by the California Air Resources Board (CARB). Also included in the emission calculations is credit for NOx emission reductions from on-road mobile source emissions associated with the Sacramento Emergency Clean Air and Transportation (SECAT) program. On June 30, 2000, the Governor signed the State budget that included $50 million for the Sacramento region to fund air quality NOx reduction programs. On May 18, 2000, the SACOG Board of Directors approved $20 million in Congestion Mitigation and Air Quality (CMAQ) funds to match the governor s $50 million in general fund revenues. To administer the program, Assembly Bill 2511 (Assemblyman Steinberg) was signed by the Governor on September 18, 2000, authorizing the formation of the Sacramento Emergency Clean Air and Transportation (SECAT) Program. Since September 2000, SACOG has obligated approximately $46 million out of the $70 million SECAT program. SACOG has submitted an additional allocation request for $13.1 million in SECAT funds that the California Transportation Commission (CTC) is scheduled to act on at their April 26/27, 2006, meeting. SACOG anticipates going back to the CTC in the fall of 2006 for the final allocation of approximately $10.5 million in SECAT funds 1) EMISSION FORECASTS FOR THE 2006 MTP FOR THE SACRAMENTO OZONE, CO AND PM-10 AIR QUALITY PLANNING AREAS a. Emissions Budget Test For Ozone (ROG and NOx) and Carbon Monoxide (CO) Under the emissions budget test, all future year ROG and NOx, emissions associated with the 2006 MTP must be equal to or less than the budgets established in the Sacramento Regional Nonattainment Area 8-Hour Ozone Rate-Of-Progress State Implementation Plan (ROP/SIP) for the Sacramento ozone nonattainment and for CO emissions less than the CO maintenance
150 Mr. Gene K. Fong, Mr. Leslie Rogers, Ms. Lisa Hans, and Ms. Jody Jones Page 11 March 27, 2006 budgets established in the 2004 Revision to the California State Implementation Plan for Carbon Monoxide, January 30, As can be seen from Table 2, ROG, NOx and CO emissions associated with the 2006 MTP are less than the budgets contained in the SIPs for the Sacramento nonattainment areas for all future years. Under the conformity regulations, as long as future year emissions associated with the 2006 MTP, including any amendments, are equal to or less than the budgets contained in the ROP/SIP, we have met the emissions budget test under the conformity regulations. As can be seen from Table 2, we have met the budget tests for ROG, NOx and CO emissions. b. Build vs. No-Build Test For PM-10 Under the Build vs. No-Build test for PM-10, PM-10 emissions must either be less in the future when compared against the Base Year or less in the 2006 MTP (MTP) vs. No-2006 MTP (No MTP). Table 3 shows that PM-10 emissions are projected to increase significantly in future years. The reason for the increase in PM-10 emissions in the future is because of the methodology used to project PM-10 emissions. We are required to use EPA s PM-10 forecasting methodology (AP-42), which relies solely on daily VMT. With daily VMT projected to increase significantly in the future, so will PM-10 emissions. However, the conformity test for PM-10 requires that either of two tests be met: either the MTP results in less emissions than the No-MTP scenario in future years, or the future year emissions are less than the 2000 Base Year levels. In our case, the MTP yields less PM-10 emissions in the future than the No- MTP scenario, so one of the tests is met and, therefore, we have met the conformity test for PM-10 for the 2006 MTP. 2) EMISSION FORECASTS FOR THE 2006/08 MTIP FOR THE SACRAMENTO OZONE, CO AND PM-10 AIR QUALITY PLANNING AREAS a. Emissions Budget Test For Ozone (ROG and NOx) and Carbon Monoxide (CO) Under the emissions budget test, all future year ROG, NOx, and CO emissions associated with the 2006/08 MTIP must be equal to or less than the budgets established in the SIPs for the Sacramento ozone nonattainment and CO maintenance areas. As can be seen from Table 2, ROG, NOx and CO emissions associated with the 2006/08 MTIP are less than the budgets contained in the SIPs for the Sacramento ozone nonattainment and CO maintenance areas for all future years. Under the conformity regulations, as long as future year emissions associated with the 2006/08 MTIP are equal to or less than the budgets contained in the SIPs, we have met the emissions budget tests under the conformity regulations. As can be seen from Table 2, we have met the budget tests for ROG, NOx and CO emissions. b. Build vs No-Build Test For PM-10 Under the Build vs No-Build test for PM-10, PM-10 must either be less in the future when compared against the 2002 Base Year or less in the 2006/08 MTIP (MTIP) vs. No 2006/08 MTIP (No-MTIP). Table 4 shows that PM-10 emissions are projected to increase significantly
151 Mr. Gene K. Fong, Mr. Leslie Rogers, Ms. Lisa Hans, and Ms. Jody Jones Page 12 March 27, 2006 in the future. The reason for the dramatic increase in PM-10 emissions in the future is because of the methodology used to project PM-10 emissions. We are required to use EPA s PM-10 forecasting methodology (AP-42), which relies solely on daily VMT. With daily VMT projected to increase significantly in the future, so will PM-10 emissions. However, the conformity test for PM-10 requires that either of two tests be met: either the 2006/08 MTIP results in less emissions than the No-MTIP scenario in future years, or the future year emissions are less than the 2002 Base Year levels. In our case, the MTIP yields less PM-10 emissions in the future than the No-MTIP scenario, so one of the tests is met and, therefore, we have met the conformity test for PM-10 for the 2006/08 MTIP. c. CONCLUSIONS The results of the emissions analyses shows that the 2006 MTP and the 2006/08 MTIP meet the emissions conformity tests as outlined in the August 15, 1997, Federal Register notice for both the Sacramento ozone, carbon monoxide and PM-10 air quality planning areas. S:\Projects 05-06\0301-MTP\MTP 2006\Appendix N - Conformity.doc
152 APPENDIX O ENVIRONMENTAL JUSTICE ANALYSIS FROM THE MTP


153
154

155


156


157

158


159


160


161
162

163

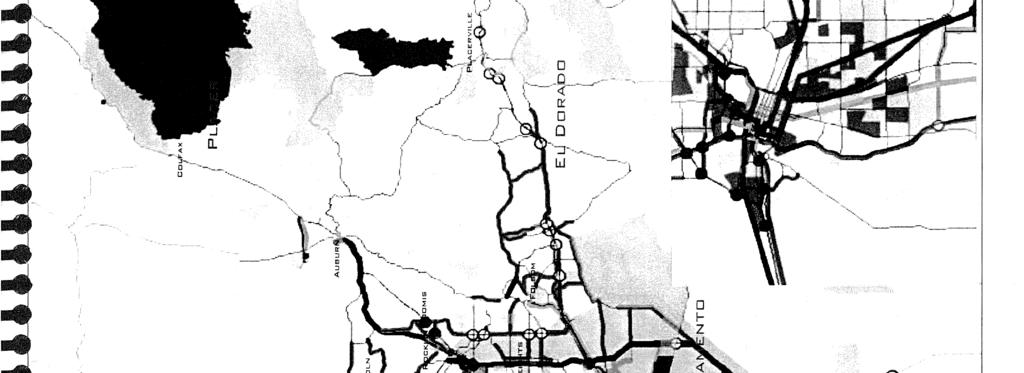

164

165
Board of Directors. Muriel Johnson, Chair Supervisor, Sacramento County
 Board of Directors Muriel Johnson, Chair Supervisor, Sacramento County Tom Cosgrove City of Lincoln, representing Auburn, Colfax, Lincoln, Rocklin and Roseville Claudia Gamar Mayor, City of Roseville,
2045 Long Range Transportation Plan. Summary of Draft
 2045 Long Range Transportation Plan Summary of Draft Fredericksburg Area Metropolitan Planning Organization The George Washington Region includes the City of Fredericksburg and the counties of Caroline,
Regional Transportation Needs Within Southeastern Wisconsin
 Regional Transportation Needs Within Southeastern Wisconsin #118274 May 24, 2006 1 Introduction The Southeastern Wisconsin Regional Planning Commission (SEWRPC) is the official areawide planning agency
Exhibit 1 PLANNING COMMISSION AGENDA ITEM
 Exhibit 1 PLANNING COMMISSION AGENDA ITEM Project Name: Grand Junction Circulation Plan Grand Junction Complete Streets Policy Applicant: City of Grand Junction Representative: David Thornton Address:
Transportation Master Plan Advisory Task Force
 Transportation Master Plan Advisory Task Force Network Alternatives & Phasing Strategy February 2016 BACKGROUND Table of Contents BACKGROUND Purpose & Introduction 2 Linking the TMP to Key Council Approved
Circulation in Elk Grove includes: Motor vehicles, including cars and trucks
 Circulation, as it is used in this General Plan, refers to the many ways people and goods move from place to place in Elk Grove and the region. Circulation in Elk Grove includes: Motor vehicles, including
Chapter 7. Transportation. Transportation Road Network Plan Transit Cyclists Pedestrians Multi-Use and Equestrian Trails
 Chapter 7 Transportation Transportation Road Network Plan Transit Cyclists Pedestrians Multi-Use and Equestrian Trails 7.1 TRANSPORTATION BACKGROUND The District of Maple Ridge faces a number of unique
2. Context. Existing framework. The context. The challenge. Transport Strategy
 Transport Strategy Providing quality connections Contents 1. Introduction 2. Context 3. Long-term direction 4. Three-year priorities 5. Strategy tree Wellington City Council July 2006 1. Introduction Wellington
WILMAPCO Public Opinion Survey Summary of Results
 Wilmington Area Planning Council WILMAPCO Public Opinion Survey Summary of Results Prepared by: 2955 Valmont Road, Suite 300 Boulder, Colorado 80301 t: 303-444-7863 f: 303-444-1145 www.n-r-c.com Table
New Measure A Expenditure Categories DEFINITIONS OF ELIGIBLE EXPENDITURES Adopted March 8, 2007
 New Measure A Expenditure Categories DEFINITIONS OF ELIGIBLE EXPENDITURES Adopted March 8, 2007 City Street and County Road Maintenance Program The preservation and keeping of public street and road rights-of-way
Proposed. City of Grand Junction Complete Streets Policy. Exhibit 10
 Proposed City of Grand Junction Complete Streets Policy Exhibit 10 1 City of Grand Junction Complete Streets Policy Vision: The Complete Streets Vision is to develop a safe, efficient, and reliable travel
MCTC 2018 RTP SCS and Madera County RIFP Multi-Modal Project Eval Criteria GV13.xlsx
 MCTC 8 RTP SCS and Madera County RIFP Multi-Modal Project Eval Criteria GV.xlsx Madera County Transportation Commission Regional Transportation Plan / Sustainable Communities Strategy Multi-Modal Project
Purpose and Need. Chapter Introduction. 2.2 Project Purpose and Need Project Purpose Project Need
 Chapter 2 Purpose and Need 2.1 Introduction The El Camino Real Bus Rapid Transit (BRT) Project (Project) would make transit and other transportation improvements along a 17.6-mile segment of the El Camino
Public Consultation Centre For. Transportation Master Plan Update. Information Package
 Public Consultation Centre For Transportation Master Plan Update Information Package Date Location Hours Tuesday, September 12, 2017 Wednesday, September 13, 2017 Tuesday, September 19, 2017 Cambridge
Memorandum. Fund Allocation Fund Programming Policy/Legislation Plan/Study Capital Project Oversight/Delivery Budget/Finance Contract/Agreement Other:
 Memorandum Date: November 20, 2017 To: Transportation Authority Board From: Eric Cordoba Deputy Director Capital Projects Subject: 12/5/17 Board Meeting: San Francisco Freeway Corridor Management Study
The Route 29 Corridor Study was initiated at the request of Virginia s Commonwealth
 CHAPTER 2: Study Background and approach The Route 29 Corridor Study was initiated at the request of Virginia s Commonwealth Transportation Board in response to requests from members of the General Assembly
Governor s Transportation Vision Panel
 Office of Governor Kate Brown Governor s Transportation Vision Panel JLA Public Involvement Project Overview The is a yearlong effort to develop a series of recommendations for the Governor that address
Corpus Christi Metropolitan Transportation Plan Fiscal Year Introduction:
 Introduction: The Safe, Accountable, Flexible, Efficient Transportation Equity Act: A Legacy for Users (SAFETEA-LU) has continued the efforts started through the Intermodal Surface Transportation Efficiency
City of Novi Non-Motorized Master Plan 2011 Executive Summary
 City of Novi Non-Motorized Master Plan 2011 Executive Summary Prepared by: February 28, 2011 Why Plan? Encouraging healthy, active lifestyles through pathway and sidewalk connectivity has been a focus
2015 Florida Main Street Annual Conference. Complete Streets Equal Stronger Main Streets
 WHAT ARE COMPLETE STREETS? CASE STUDIES COMPLETING YOUR MAIN STREET 2015 Florida Main Street Annual Conference St. Petersburg, Florida August 19, 2015 WHAT ARE COMPLETE STREETS? CASE STUDIES COMPLETING
PEDESTRIAN ACTION PLAN
 ATTACHMENT 2 CITY OF SANTA MONICA PEDESTRIAN ACTION PLAN CITY OF SANTA MONICA PEDESTRIAN ACTION PLAN This page intentionally left blank EXECUTIVE SUMMARY CHAPTER 1 EXECUTIVE SUMMARY Setting the Stage
North Coast Corridor:
 North Coast Corridor: Connecting People, Transportation & Environment Legislative Hearing: 11.8.10 1 North Coast Corridor Region s Lifeline A Regional Strategy Mobility, Economy & Environment North Coast
Appendix T 1: Additional Supporting Data
 Appendix T 1: Additional Supporting Data Project Delivery Delays with the implementation of the 2000 TIP became apparent early in the decade. In response to direction among policy officials, ARC began
Nomination. Halton Region in Context
 Transportation Association of Canada Sustainable Urban Transportation Award Nomination of: Region of Halton Regional Transportation Master Plan Study March 2005 Nominated by: Nomination The TAC Sustainable
SANTA CLARA COUNTYWIDE BICYCLE PLAN August 2008
 SANTA CLARA COUNTYWIDE BICYCLE PLAN August 2008 To assist VTA and Member Agencies in the planning, development and programming of bicycle improvements in Santa Clara County. Vision Statement To establish,
Highway 217 Corridor Study. Phase I Overview Report
 Highway 217 Corridor Study Phase I Overview Report November 3, 24 BACKGROUND AND OVERVIEW Study purpose The Highway 217 Corridor Study is developing multi-modal transportation solutions for traffic problems
Transportation Authority of Marin Renew Existing ½-cent Transportation Sales Tax
 Transportation Authority of Marin Renew Existing ½-cent Transportation Sales Tax Request for Approval of the Final Sales Tax Renewal Expenditure Plan Town of Tiburon June 20, 2018 Request Council to Approve
Dear City Council Members,
 From: Bob Kenyon [mailto: ] Sent: Monday, February 08, 2016 10:20 AM To: City Clerk Subject: Please prioritize Caltrain and a complete transit network Thank you for prioritizing bringing BART to San Jose
Exceeding expectations: The growth of walking in Vancouver and creating a more walkable city in the future through EcoDensity
 Exceeding expectations: The growth of walking in Vancouver and creating a more walkable city in the future through EcoDensity Melina Scholefield, P. Eng. Manager, Sustainability Group, City of Vancouver
Climate Change Action Plan: Transportation Sector Discussion Paper: Cycling
 Climate Change Action Plan: Transportation Sector Discussion Paper: Cycling ontario.ca/climatechange Contents 1. Minister of Transportation s message... 3 2. Introduction... 5 3. Sector Overview and Support
CITY OF BLOOMINGTON COMPLETE STREETS POLICY
 CITY OF BLOOMINGTON COMPLETE STREETS POLICY POLICY OBJECTIVE: The City of Bloomington will enhance safety, mobility, accessibility and convenience for transportation network users of all ages and abilities,
Develop a Multi-Modal Transportation Strategy (Theme 6)
") DEVELOP A MULTI-MODAL TRANSPORTATION STRATEGY (THEME 6) WHY IS THIS THEME ADDRESSED? Develop a Multi-Modal Transportation Strategy (Theme 6) Statement of Ideal Reduce resident and visitor reliance on single
DEVELOP A MULTI-MODAL TRANSPORTATION STRATEGY (THEME 6) WHY IS THIS THEME ADDRESSED? Develop a Multi-Modal Transportation Strategy (Theme 6) Statement of Ideal Reduce resident and visitor reliance on single
Bicycle Master Plan Goals, Strategies, and Policies
 Bicycle Master Plan Goals, Strategies, and Policies Mobilizing 5 This chapter outlines the overarching goals, action statements, and action items Long Beach will take in order to achieve its vision of
Corporate. Report COUNCIL DATE: June 26, 2006 NO: C012 COUNCIL-IN-COMMITTEE. TO: Mayor & Council DATE: June 22, 2006
 Corporate NO: C012 Report COUNCIL DATE: June 26, 2006 COUNCIL-IN-COMMITTEE TO: Mayor & Council DATE: June 22, 2006 FROM: General Manager, Engineering FILE: 0410-20(MoT/Gate) SUBJECT: Surrey Response on
Arnold Hinojosa
 Policy Analysis of the Mass Transit Challenges Facing Rapidly Growing Southern and Western Cities and How These Challenges Can Be Addressed Using the Model Set by Chicago Arnold Hinojosa ahinojosa@kentlaw.edu
WELCOME. City of Greater Sudbury. Transportation Demand Management Plan
 WELCOME City of Greater Sudbury Transportation Demand Management Plan Public Consultation Session St. Andrew s Place, Activity Hall 111 Larch Street Wednesday September 13, 2017 6:00 to 8:00 pm Welcome
CITY OF COCOA BEACH 2025 COMPREHENSIVE PLAN. Section VIII Mobility Element Goals, Objectives, and Policies
 CITY OF COCOA BEACH 2025 COMPREHENSIVE PLAN Section VIII Mobility Element Goals, Objectives, and Policies Adopted August 6, 2015 by Ordinance No. 1591 VIII MOBILITY ELEMENT Table of Contents Page Number
Tulsa Metropolitan Area LONG RANGE TRANSPORTATION PLAN
 Tulsa Metropolitan Area LONG RANGE TRANSPORTATION PLAN Indian Nations Council of Governments August 2005 CONTACTING INCOG In developing the Destination 2030 Long Range Transportation Plan, INCOG s Transportation
Typical Rush Hour Commute. PennyforTransportation.com
 Typical Rush Hour Commute In the News Overview of the Plan Collaborative plan with projects in every community Prioritizing connectivity and congestion relief Dedicated transportation-specific funding;
Basalt Creek Transportation Refinement Plan Recommendations
 Basalt Creek Transportation Refinement Plan Recommendations Introduction The Basalt Creek transportation planning effort analyzed future transportation conditions and evaluated alternative strategies for
FACTS AND FIGURES: MAKING THE CASE FOR COMPLETE STREETS IN LEE COUNTY
 FACTS AND FIGURES: MAKING THE CASE FOR COMPLETE STREETS IN LEE COUNTY Safety: Close to 5,000 pedestrians and bicyclists die each year on U.S. roads, and more than 70,000 are injured. [Mean Streets, Surface
Perryville TOD and Greenway Plan
 Perryville TOD and Greenway Plan Greenway Glossary Pathway: A bicycle and pedestrian path separated from motorized vehicular traffic by an open space, barrier or curb. Multi-use paths may be within the
Context of Transportation Planning in the Central Lane Metropolitan Planning Organization (MPO) Area
 Area") May 2017 May 2017 Context of Transportation Planning in the Central Lane Metropolitan Planning Organization (MPO) Area There are four adopted transportation plans which cover the Central Lane MPO area,
May 2017 May 2017 Context of Transportation Planning in the Central Lane Metropolitan Planning Organization (MPO) Area There are four adopted transportation plans which cover the Central Lane MPO area,
PERFORMANCE ANALYSIS of The Draft 2015 CLRP
 Item 9 PERFORMANCE ANALYSIS of The Draft CLRP Presentation to the Transportation Planning Board September 16, CLRP Performance Analysis 1 What is the Long-Range Transportation Plan (CLRP)? The CLRP identifies
Attachment A: Columbus Area Metropolitan Transportation Plan Objectives, Performance Measures, and Targets
 OBJECTIVE: Reduce the percentage of commuters driving alone, and increase the percentage of commuters riding transit, ing Reducing single occupancy auto commutes and increasing commuters using alternative
How To Encourage More Efficient Transportation in Brazilian Cities
 How To Encourage More Efficient Transportation in Brazilian Cities Todd Litman Victoria Transport Policy Institute Presented Seminar on Discouraging The Use Of Cars São Paulo, Brazil 3 September 2013 Creating
Welcome. Background. Goals. Vision
 Welcome The formal Public Information Centre (PIC) for the Transportation Master Plan How We GO will be held in early 2017. At that time we will present the recommended transportation system for Niagara
AMATS Complete Streets Policy
 AMATS Complete Streets Policy Table of Contents: Section 1. Definition of Complete Streets Section 2. Principles of Complete Streets Section 3. Complete Streets Policy Section 4. Consistency Section 5.
BUILDING THE CASE FOR TRAVEL OPTIONS IN WASHING TON COUNTY. Image: Steve Morgan. Image: Steve Morgan
 BUILDING THE CASE FOR TRAVEL OPTIONS IN WASHING TON COUNTY Image: Steve Morgan Image: Steve Morgan Image: TriMet Image: TriMet WHAT ARE TRAVEL OPTIONS PROGRAMS? Travel options programs encourage residents,
STUDY ADVISORY COMMITTEE. October 8, 2015
 STUDY ADVISORY COMMITTEE October 8, 2015 Study Purpose evaluate the long-term transportation strategies and investments needed to sustain the county s economic health and quality of life in the coming
4. ENVIRONMENTAL IMPACT ANALYSIS 9. TRANSPORTATION AND TRAFFIC
 4. ENVIRONMENTAL IMPACT ANALYSIS 9. TRANSPORTATION AND TRAFFIC 4.9.1 INTRODUCTION The following section addresses the Proposed Project s impact on transportation and traffic based on the Traffic Study
Goal 3: Foster an environment of partnerships and collaboration to connect our communities and regions to one another.
 Non-Motorized Transportation Plan (NMTP) Draft Vision, Goal and,, Tri-County Regional Planning Commission (TCRPC) Purpose The purpose of the Tri-County Regional Planning Commission (TCRPC) Non-Motorized
Vision Public Workshop: Findings
 Vision Public Workshop: Findings Long Range Transportation Plan & Bicycle Mobility Plan February 2018 Vision Workshop South Kingstown 1/23/18 Providence 1/24/18 Newport 1/31/18 Long Range Transportation
 Time of Change We Are Growing We Are An Attractive Place To Live We Are Age Diverse + Living Longer 50000 40000 30000 20000 10000 0 2010 Census Job Density Housing Sheds Transit Sheds The Project FUNDING
May 12, 2016 Metro Potential Ballot Measure Issue Brief: Local Return
 Summary: Local return is an important revenue source for cities to maintain their local transportation infrastructure. Most cities use their local return to operate small bus systems and repave streets,
T1-A - Service Reduction (Re-sizing)
") Key T1-A Choice A Key T1-B Choice B Key T1-C Choice C Key T1-D Choice D Key T1-E Choice E Key T1-F Choice F Key Choice G T2 T1-A - Service Reduction (Re-sizing) Description This key choice would represent
Key T1-A Choice A Key T1-B Choice B Key T1-C Choice C Key T1-D Choice D Key T1-E Choice E Key T1-F Choice F Key Choice G T2 T1-A - Service Reduction (Re-sizing) Description This key choice would represent
Chapter 2. Bellingham Bicycle Master Plan Chapter 2: Policies and Actions
 Chapter 2 Bellingham Bicycle Master Plan Chapter 2: Policies and Actions Chapter 2: Policies and Actions The Bicycle Master Plan provides a road map for making bicycling in Bellingham a viable transportation
TRANSIT & NON-MOTORIZED PLAN DRAFT FINAL REPORT Butte County Association of Governments
 1 INTRODUCTION Maintaining a high quality of life is the essence of this plan for transit and non-motorized transportation in Butte County. Curbing greenhouse gas emissions (GHG) by reducing congestion,
ACTIVE TRANSPORTATION/NONMOTORIZED TRANSPORTATION
 ACTIVE TRANSPORTATION/NONMOTORIZED TRANSPORTATION BACKGROUND Active transportation, also known as nonmotorized transportation, is increasingly recognized as an important consideration when planning and
Clackamas County Comprehensive Plan
 ROADWAYS The County s road system permits the movement of goods and people between communities and regions, using any of a variety of modes of travel. Roads provide access to virtually all property. They
APPROVE A RESOLUTION ADOPTING A COMPLETE STREETS POLICY
 STAFF REPORT MEETING DATE: September 13, 2016 TO: FROM: City Council Bob Brown, Community Development Director Russ Thompson, Public Works Director Patrick Filipelli, Management Analyst 922 Machin Avenue
 MEMORANDUM - CITY OF PASADENA Department Of Transportation DATE: OCTOBER 21, 2008 TO: ENVIRONMENTAL ADVISORY COMMISSION FROM: ~ FRED C. DOCK, DIRECTOR OF TRANSPORTATION SUBJECT: UPDATE ON DEPT. OF TRANSPORTATION
1999 On-Board Sacramento Regional Transit District Survey
 SACOG-00-009 1999 On-Board Sacramento Regional Transit District Survey June 2000 Sacramento Area Council of Governments 1999 On-Board Sacramento Regional Transit District Survey June 2000 Table of Contents
Rochester Area Bike Sharing Program Study
 roc bike share Rochester Area Bike Sharing Program Study Executive Summary ~ January 2015 JANUARY 2015 8484 Georgia Avenue, Suite 800 Silver Spring, MD 20910 3495 Winton Pl., Bldg E, Suite 110 Rochester,
5. Pedestrian System. Accomplishments Over the Past Five Years
 5. Pedestrian System Accomplishments Over the Past Five Years The Alamo Area Metropolitan Planning Organization (MPO) and its partner agencies recognize the importance of improving pedestrian mobility.
Portland International Airport Bicycle and Pedestrian Plan (October 2003) Staff Acknowledgements
 Staff Acknowledgements") Portland International Airport Bicycle and Pedestrian Plan (October 2003) Staff Acknowledgements Scott King, Senior Aviation Planner Jason Gately, Senior Aviation Planner Preston Beck, Associate Planner
Portland International Airport Bicycle and Pedestrian Plan (October 2003) Staff Acknowledgements Scott King, Senior Aviation Planner Jason Gately, Senior Aviation Planner Preston Beck, Associate Planner
Fast Affordable Sustainable Transportation
 Fast Affordable Sustainable Transportation Bay Area October 2017 PC: Dllu Waking up from our traffic nightmare Transportation in the Bay Area has reached a crisis point. There is grinding congestion on
INFRASTRUCTURE: Using the Grid to Create a more Self-Sustaining Downtown. Studio Spring 2013
 EMERGENT FUTURES The San Diego Section of the American Society of Civil Engineers (ASCE) released a new report, the 2012 San Diego County Infrastructure Report Card. Since the last San Diego Report Card
Safe Routes to School as a Transportation Control Measure: Impacts on the Emission Inventory
 Safe Routes to School as a Transportation Control Measure: Impacts on the Emission Inventory Ignatius Fomunung, Joseph Owino, Mbaki Onyango University of Tennessee Chattanooga August 5, 2015 Outline Introduction
NASHUA REGIONAL PLANNING COMMISSION REGIONAL BICYCLE AND PEDESTRIAN PLAN
 NASHUA REGIONAL PLANNING COMMISSION REGIONAL BICYCLE AND PEDESTRIAN PLAN June, 2005 Prepared by the Nashua Regional Planning Commission 2005 NRPC Regional Bicycle and Pedestrian Plan- JUNE 2005 ACKNOWLEDGEMENTS
EXECUTIVE DIRECTIVE NO. 20. Issue Date: July 1, 2011
 ANTONIO R. VILLARAIGOSA MAYOR EXECUTIVE DIRECTIVE NO. 20 Issue Date: July 1, 2011 SUBJECT: Implementation of the 2010 Bicycle Plan It is no secret that the quality of life in Los Angeles is directly influenced
WALKNBIKE DRAFT PLAN NASHVILLE, TENNESSEE EXECUTIVE SUMMARY NASHVILLE, TENNESSEE
 NASHVILLE, TENNESSEE EXECUTIVE SUMMARY Executive Summary A world-class multi-modal transportation system is essential to a vibrant city and better quality of life. -Mayor Barry The WalknBike plan aims
Key objectives of the survey were to gain a better understanding of:
 3 COMMUNITY INPUT Community input is an essential part of corridor studies. For the SR 87 corridor study, VTA staff conducted an extensive online survey of people living and commuting along the corridor.
2.0 Existing Conditions
 20 2.0 Existing Conditions 2.1 Land Use, Future Growth Patterns, Physical Barriers Geographic Overview Sutter County s land use pattern is characterized by extensive agricultural areas, significant natural
Cascade Bicycle Club Strategic Plan
 The Greater Context Bicycling has become fundamentally important as large-scale currents of change threaten the health, economy and livability of communities throughout the United States and the world
Economics of Highway Spending and Traffic Congestion. Todd Litman Victoria Transport Policy Institute Presented Strong Towns Webinar 3 February 2016
 Economics of Highway Spending and Traffic Congestion Todd Litman Victoria Transport Policy Institute Presented Strong Towns Webinar 3 February 2016 Motor Vehicle Travel is Peaking Annual Vehicle Mileage
Chapter 5 Future Transportation
 Chapter 5 Future Transportation The Future Land Use Plan identifies the desired land use designations. The land uses desired for Crozet depend, in large part, on the success of the transportation system,
PRELIMINARY DRAFT FIRST AMENDMENT TO VISION 2050: A REGIONAL LAND USE AND TRANSPORTATION PLAN FOR SOUTHEASTERN WISCONSIN
 PRELIMINARY DRAFT FIRST AMENDMENT TO VISION 2050: A REGIONAL LAND USE AND TRANSPORTATION PLAN FOR SOUTHEASTERN WISCONSIN ESTABLISHING TARGETS FOR FEDERAL PERFORMANCE MEASURES: HIGHWAY SAFETY SOUTHEASTERN
TOWN OF PORTLAND, CONNECTICUT COMPLETE STREETS POLICY
 TOWN OF PORTLAND, CONNECTICUT COMPLETE STREETS POLICY I. VISION, GOALS & PRINCIPLES VISION To improve the streets of Portland making them safer and more accessible for all users including pedestrians,
modes, the increased roadway capacity is the implied solution, which, in turn, has been shown to lead to more driving (induced demand).
.") EXECUTIVE SUMMARY A. Introduction The San Francisco Congestion Management Program (CMP) is a biennial program conducted in accordance with state law to monitor congestion and adopt plans for mitigating
EXECUTIVE SUMMARY A. Introduction The San Francisco Congestion Management Program (CMP) is a biennial program conducted in accordance with state law to monitor congestion and adopt plans for mitigating
Congestion Evaluation Best Practices
 Congestion Evaluation Best Practices Todd Litman Victoria Transport Policy Institute Presented International Transportation and Economic Development Conference 10 April 2014 Congestion Indicators Indicator
Solana Beach Comprehensive Active Transportation Strategy (CATS)
") Solana Beach Comprehensive Active Transportation Strategy (CATS) 3.0 Goals & Policies The Solana Beach CATS goals and objectives outlined below were largely drawn from the Solana Beach Circulation Element
Solana Beach Comprehensive Active Transportation Strategy (CATS) 3.0 Goals & Policies The Solana Beach CATS goals and objectives outlined below were largely drawn from the Solana Beach Circulation Element
City of Hamilton s Transportation Master Plan (TMP) Public Consultation 3 December 2015
 Public Consultation 3 December 2015") City of Hamilton s Transportation Master Plan (TMP) Public Consultation 3 December 2015 McPhail Transportation Planning Services Ltd. AGENDA 6:00 7:00 pm Viewing Boards / Q & A with the Team 7:00 7:50
City of Hamilton s Transportation Master Plan (TMP) Public Consultation 3 December 2015 McPhail Transportation Planning Services Ltd. AGENDA 6:00 7:00 pm Viewing Boards / Q & A with the Team 7:00 7:50
Ann Arbor Downtown Street Plan
 1 Ann Arbor Downtown Street Plan Public Workshop #1 We know that. 2 Public right-of-way (streets, sidewalks, and alleys) make up 30% of the total District area of downtown. Streets need to provide mobility
Cities Connect. Cities Connect! How Urbanity Supports Social Inclusion
 Cities Connect! How Urbanity Supports Social Inclusion Todd Litman Victoria Transport Policy Institute Metropolis Toronto, Canada - 14 June 2006 Cities Connect People with people. People with jobs. People
ACTIVE TRANSPORTATION
 ACTIVE TRANSPORTATION Mobility 2040 Supported Goals Improve the availability of transportation options for people and goods. Support travel efficiency measures and system enhancements targeted at congestion
Sustainable Transportation Planning in the Portland Region
 Sustainable Transportation Planning in the Portland Region Jennifer Dill, Ph.D. Associate Professor School of Urban Studies & Planning jdill@pdx.edu http://web.pdx.edu/~jdill/ Outline Elements of a sustainable
Chapter 4 Transportation Strategies to Support Growth
 City of Brantford Chapter 4 Transportation Strategies to Support Growth TABLE OF CONTENTS 4.1 DESIGNING A TRANSPORTATION STRATEGY... 1 4.2 STRATEGIES TO INCREASE SUPPLY... 2 4.2.1 Optimizing the Existing
STREET AND HIGHWAY PLAN
 STREET AND HIGHWAY PLAN Introduction The street and highway system in the Winston-Salem Urban Area consists of thousands of miles of traffic carrying facilities, ranging from short local residential streets
Connecting Sacramento: A Trip-Making and Accessibility Study
 Connecting Sacramento: A Trip-Making and Accessibility Study Study Overview and Highlights July 2017 Purpose of this study Local governments and transportation agencies often make challenging decisions
Measuring Transportation: Traffic, Mobility and Accessibility
 Measuring Transportation: Traffic, Mobility and Accessibility THIS FEATURE COMPARES THREE APPROACHES TO MEASURING TRANSPORTATION SYSTEM PERFORMANCE. TRAFFIC-BASED MEASUREMENTS EVALUATE MOTOR VEHICLE MOVEMENT;
Guidelines for Providing Access to Public Transportation Stations APPENDIX C TRANSIT STATION ACCESS PLANNING TOOL INSTRUCTIONS
 APPENDIX C TRANSIT STATION ACCESS PLANNING TOOL INSTRUCTIONS Transit Station Access Planning Tool Instructions Page C-1 Revised Final Report September 2011 TRANSIT STATION ACCESS PLANNING TOOL INSTRUCTIONS
Launceston's Transport Futures. Greater travel options for the people of Launceston
 Launceston's Transport Futures Greater travel options for the people of Launceston Final Draft 13 Jan 2014 1 Page Number Executive summary 3 What is Transport Futures? 4 Vision 6 Economy, access and liveability
What s Health Got to Do With It? Health and Land Use Planning
 What s Health Got to Do With It? Health and Land Use Planning CANDACE RUTT, PH.D. EXECUTIVE DIRECTOR APRIL 13 TH, 2016 Planning and Public Health Planning + Public Health Healthy Communities Healthier
Capital Beltway HOT Lanes - Frequently Asked Questions
 Capital Beltway HOT Lanes - Frequently Asked Questions December 20, 2007 1. What is the cost of the project? The fixed-price design-build cost is approximately $1.4 billion. 2. Why have the project costs
Berkeley Strategic Transportation Plan A-76
 Berkeley Strategic Transportation Plan A-76 Appendices 1. A Team Effort 2. Where We ve Been A-11 Berkeley Strategic Transportation Plan Alameda County Transportation Plan Alameda County will be served
Bus Rapid Transit ALTERNATIVES ANALYSIS. Open House
 Bus Rapid Transit ALTERNATIVES ANALYSIS Open House June 23, 2015 Open House Meeting Agenda Agenda Introductions What is BRT? Project Goals Study Tasks Next steps Discussion PVTA Bus Rapid Transit Study
EXECUTIVE SUMMARY. Vision
 Vision Walking and bicycling in Salt Lake City will be safe, convenient, comfortable, and viable transportation options that connect people to places, foster recreational and economic development opportunities,
Benefits for the Bronx, Brooklyn, Queens and Staten Island
 Congestion Pricing for New York: Benefits for the Bronx, Brooklyn, and Staten Island Prepared for the Coalition for Traffic Relief April 007 Schaller Consulting 94 Windsor Place, Brooklyn, NY (78) 768-3487
Cherry Creek Transportation and Land Use Forum September 25, 2013 Meeting Summary
 Cherry Creek Transportation and Land Use Forum September 25, 2013 Meeting Summary I. LEAD-IN TO SMALL GROUP DISCUSSION, POLLING AND STEERING COMMITTEE/TECHNICAL TASK FORCE DISCUSSION The meeting began