SUSTAINABLE & SAFE. A Vision and Guidance for Zero Road Deaths WRI.ORG WORLDBANK.ORG/GRSF
|
|
|
- Moris Chase
- 6 years ago
- Views:
Transcription


1 SUSTAINABLE & SAFE A Vision and Guidance for Zero Road Deaths WRI.ORG WORLDBANK.ORG/GRSF Sustainable & Safe : A Vision and Guidance for Zero Road Deaths i

2 IN COLLABORATION WITH BEN WELLE ANNA BRAY SHARPIN CLAUDIA ADRIAZOLA-STEIL SOAMES JOB MARC SHOTTEN DIPAN BOSE AMIT BHATT SAUL ALVEANO MARTA OBELHEIRO TOLGA IMAMOGLU This report was made possible through funding from Bloomberg Philanthropies. Design and layout by: Jen Lockard

3 TABLE OF CONTENTS 1 Foreword 3 Executive Summary 11 Introduction and Purpose 15 The Safe System Approach to Road Safety 16 What Is the Safe System Approach? 20 Impacts of the Safe System Approach 22 The Connection between a Safe System and Sustainable Mobility and Health 27 Applying the Safe System Approach in Low- and Middle-Income Countries 29 Sustainable and Safe Urban Expansion and Mobility 29 Safe Street Design 29 Safe Rural and Intercity Roads 30 Safe Vehicles 30 Safe Conditions for Children 31 Stronger Economic Development and Reduced Inequality 33 Guidance on Safe System Strategies 34 Core Elements of a Safe System Strategy 39 Action Areas for a Safe System Approach 55 Leapfrogging toward a Safe System Approach in Low- and Middle-Income Countries 56 Prioritizing Finances 57 Strengthening Institutions and Frameworks 57 Strengthening Laws, Regulations, and Guidelines 59 Conclusion 62 References

4 iv WRI.org
5 FOREWORD Road traffic fatalities are the 10th leading cause of death worldwide, claiming 1.25 million lives each year. Ninety percent of these deaths are in low- and middle-income countries. Rather than improving, the problem is getting worse. What can be done to address this tragic loss of life? Evidence from 53 countries and more than 20 years worth of policy is clear: safe roads save lives. The Safe System approach outlined in this report starts from the basic premise that human error is inevitable but traffic fatalities and serious injuries are not. Road users are commonly blamed for traffic collisions for not paying attention or taking unnecessary risks but this fails to account for the built environment and how it affects travel choice and behavior. We need a paradigm shift away from the traditional focus on traffic safety and adhering to the rules of the road toward a more systemic approach. Instead of relying on public education, training, regulation, and enforcement, other variables such as transport governance and planning, road design, and protective road infrastructure must be taken into account. An expanded approach could dramatically affect the ability of people to interact safely while using a country s road network. Shifting much of the responsibility from the road user to the transport system designers is therefore an important development, and is already leading to remarkable change countries with a Safe System approach to road safety have reduced traffic deaths and serious injuries to lower levels, at faster rates, than those without. For example, many urban centers in Safe System countries are increasing public transport options and making more conscious decisions on land use planning and street design. As a result, they are minimizing exposure to unsafe road travel. Road safety is an issue of poverty. Residents of lowand middle-income countries are much more likely to be killed or seriously injured in a traffic collision. In all countries, lower-income people are disproportionately affected, and the long-term impacts on their socioeconomic status are worse. Sadly, it is young people that are most affected. Road deaths are the leading cause of death of children aged 10 to 19 in developing countries. The additional lost opportunity for young people who cannot get to school safely is vast, though difficult to quantify. Safe mobility systems not only save lives, they enable us to travel to work, visit family and friends, transport goods to market, and take our children to school. A transport network that is safe for all people whether they are walking, riding or driving is essential to quality of life, economic productivity, and access to education and health. Walking and biking are the foundations of a successful, equitable, thriving, sustainable city. This report provides guidance for all stakeholders involved in transport decisions, from government officials planning transport systems, to community groups concerned about safety, and businesses building new developments. It explains how to develop a context-specific Safe System-based road safety strategy, focusing on the urgent need and significant opportunity to apply such an approach in low- and middle-income countries. We depend on mobility systems every day; streets need not be a place where we put our lives and those of our loved ones at risk. Safe and sustainable mobility systems, communities, and cities are the building blocks for a better world. Andrew Steer President World Resources Institute José Luis Irigoyen Senior Director, Transport and ICT Global Practice GRSF Board Member Sustainable & Safe : A Vision and Guidance for Zero Road Deaths 1

6 2 WRI.org
7 EXECUTIVE SUMMARY The Safe System approach requires a shift in responsibility from the people using roads to the people designing them. It is a systemic approach that integrates core management elements and action areas to create a safe mobility system. This report describes the components of the approach and presents evidence on its life-saving impact. Sustainable & Safe : A Vision and Guidance for Zero Road Deaths 3
8 HIGHLIGHTS Some 1.25 million people die each year as a result of unsafe roads. Traffic deaths and serious injuries impose huge social and financial costs, particularly in lowand middle-income countries, where 90 percent of deaths occur. This report provides guidance for policymakers on how to develop a context-specific Safe System based road safety strategy. It draws on a review of evidence-based literature, interviews with sector experts, statistical analysis, and the authors experience working with cities. The Safe System approach requires a shift in responsibility from the people using roads to the people designing them. It is a systemic approach that integrates core management elements and action areas to create a safe mobility system. This report describes the components of the approach and presents evidence on its life-saving impact. Analysis of traffic fatalities in 53 countries conducted for this report finds that countries that have adopted a Safe System based approach to road safety achieved both the lowest rates of fatalities and the largest reduction in fatalities over the past 20 years. Context Globally, road transport is on a dangerous path. Many roads, particularly in low- and middleincome countries, are dangerous places for people, whether they are in a car, on a motorcycle, on a bicycle, or especially on foot. As economies, populations, and car ownership rates are growing, so, too, are the numbers of deaths and serious injuries on the road. These deaths are not an inevitable cost of growth or mobility. They do not take place in isolation. The dynamics on streets, roads, and highways are part of a wider system: They are generated by the interrelationship between components such as institutions, laws, regulations, land uses, infrastructure, and road users, among others. These system inputs interact to create roads and cities that are safe for their citizens or unsafe. More dangerous systems tend to be associated with other negative impacts, including greenhouse gas emissions and air pollution that contribute to climate change and harm human health through poor air quality and reduced physical activity. About This Report The aim of this report is to facilitate the application of the Safe System approach to road safety. It provides an overview of the concepts and evidence behind a Safe System, discusses the relevance of this approach to low- and middle-income countries, and the wider benefits to health and the environment, and presents practical guidance that can be applied to develop a strategy and action plan to reduce traffic deaths while also achieving broader sustainability goals. The guidance focuses on action areas that have been shown to save lives and reduce serious injuries. The report can be used at several levels of government and applied in urban, rural, and intercity contexts. Policymakers can use the guidance to prepare strategies to address key issues in their local contexts through proven solutions. Decision makers are encouraged to combine local knowledge and evidence with the broader evidence base of what works to inform their planning. 4 WRI.org

9 Mobility Systems in Crisis Around the world, road systems are leading to fatal outcomes. About 1.25 million people a year die in road traffic accidents, as a result of the lack of safe road and sidewalk networks, poorly planned urban development, inadequate laws and enforcement, and other factors (WHO 2015). Globally, traffic crashes are the leading cause of death for people If action is not taken now, by 2030 they will be the seventh-largest cause of death worldwide. In lowand middle-income countries, serious traffic injuries and fatalities are rising or remain at very high levels. Although rates are falling in many high-income countries, they are falling at different rates, remain significant in absolute numbers, and in some cases are even rising (WHO 2013a, 2015). Living in a low- or middle-income country puts people at much greater risk of being killed or seriously injured in a traffic crash. Such countries account for 90 percent of all traffic fatalities. The rate of road traffic deaths per 100,000 people is about 24 in low-income countries and about 18 in middle-income countries. These rates are more than twice the rate of nine high-income countries and dramatically higher than the best-performing high-income countries, where fewer than 3 deaths per 100,000 occur (WHO 2015). Across all populations, children and poor people are disproportionately at risk (Silverman 2016). The Safe System Approach: Changing the Paradigm Traffic safety has traditionally focused on promoting adherence to the rules of the road through education, training, regulation, and enforcement. Although such initiatives are worthy, they leave out a whole set of design, infrastructure, and systemic issues that affect the ability of people to conduct themselves safely on the road. After seeing the impact from education and enforcement diminish over time, many governments in high-income countries have adopted a broader, systemic approach, with dramatic success (ITF 2008). This approach is called the Safe System. The Safe System approach is based on a more foundational understanding of the underlying causes of traffic fatalities and serious injuries, particularly human fallibility and vulnerability and the responsibility of governments to protect their citizens. This approach is based on the principle that errors are inevitable but traffic fatalities and serious injuries should not be. The road system should be designed so that human error does not have a serious or fatal outcome. Sustainable & Safe : A Vision and Guidance for Zero Road Deaths 5
10 This concept is often referred to as shared responsibility. It implies that governments, the private sector, and civil society all share responsibility with road users for making the transport system safe. The responsible public officials are often referred to as transport system designers, a term that encompasses not only design professionals but everyone involved in contributing to the development and operation of the transport system, from engineers and planners to police to lawmakers and rule-makers, health professionals, and others (ITF 2016). Under the Safe System, they work together to implement many evidence-based measures that reduce the possibility of collisions occurring and their impacts if they do occur. Features of the Safe System Approach The Safe System approach is guided by core elements for planning, implementation, evaluation, and monitoring. They include setting strong and accountable targets, enhancing economic analysis to identify the economic benefits of improved road safety, identifying priority areas to maximize impact, setting up a lead agency for governance and management, evaluating programs to identify evidence-based measures, and ensuring that infrastructure planning and investment consider safety an integral element of mobility. The action areas of the Safe System approach are integrated and go far beyond attempting to persuade people to change their behavior through education or enforcement alone. They include addressing underlying factors such as land use and mobility planning to reduce vehicle dependence and promote safe, healthy, and environment-friendly travel modes; comprehensive speed management to set safe speeds; intersection design to allow people to cross safely; road design that accounts for human error; improved public transport; safe vehicle design and technology; and better coordination and quality of post-crash emergency response and care (Figure ES1.1). Figure ES1.1 Principles, Core Elements, and Action Areas of the Safe Systems Approach PRINCIPLES CORE ELEMENTS ACTION AREAS Humans Make Errors Economic Analysis Land Use Planning Street Design and Engineering Humans Are Vulnerable to Injury Priorities and Planning Improved Mobility Options Speed Management Responsility Is Shared Monitoring and Evaluation No Death or Serious Injury is Acceptable Comprehensive Governance and Management Enforcement, Laws and Regulation Education and Capacity Building Proactive vs. Reactive Strong Targets and Data Vehicle Design and Technology Post-crash Emergency Response and Care Note: Principles are multicolored, core elements are in grey, and action areas are in orange. 6 WRI.org
11 Addressing road safety also requires addressing less obvious systemic issues that reduce the threat of physical force that a traffic crash brings, such as controlling speeds, designing easily understandable roads, and requiring high safety standards for vehicles. By taking an integrated approach to road safety and planning that is both sustainable and safe, it is possible to transform expectations around traffic fatalities and serious injuries and dramatically reduce this preventable global health problem. The Safe System Approach Across Geographies and Scales of Government The Safe System approach was pioneered in the 1990s, through programs such as Vision Zero in Sweden and Sustainable Safety in the Netherlands. Australia and New Zealand, as well as the states of Minnesota and Washington and cities such as New York and San Francisco in the United States, adopted similar policies over the following decades (SWOV 2013, ITF 2016). More recently, cities in middle-income countries, including Bogota and Mexico City, have begun to redirect their road safety strategies toward a system-based approach (CDMX 2017). Policies with a Safe System foundation have various names, including Towards Zero Deaths (in some U.S. states), Road to Zero Coalition (a program of the U.S. Highway Traffic Safety Administration), and Every Accident Is One Too Many (in Denmark) (Danish Road Safety Commission 2013). Although all of these approaches share the premise that it cannot be acceptable for people to be killed or seriously injured in road traffic, they vary in their interpretations of a Safe System. Following its successful implementation across regions and scales, the Safe System approach has gained global attention. The United Nations (UN) Global Plan for the Decade of Action for Road Safety (WHO 2011b) embraces a comprehensive, system-based approach to traffic safety. The UN Sustainable Development Goals (SDGs) include targets of halving global traffic fatalities and injuries by 2020 and providing safe, affordable, accessible, and sustainable transport systems and improved road safety by 2030 (FIA The Safe System approach is guided by core elements for planning, implementation, evaluation, and monitoring. Foundation 2015). 1 The Brasilia Declaration of 2015 called for greater emphasis on sustainable transportation options, in addition to other established methods for improving road safety (Government of Brazil and WHO 2015). The New Urban Agenda of UN-HABITAT commits to safety for all road users and safe and healthy journeys to school for every child (UN-HABITAT 2016). Under these nonbinding goals and policy statements, many countries have made commitments to halve road deaths by Without a dramatic change in approach that creates a safe mobility system, this goal may not be reached even by 2030 in most places. Key Findings of This Report The Safe System approach has been shown to be more effective in reducing traffic deaths and serious injuries than more traditional approaches (Johansson 2009, Mooren et al. 2011, Weijermars and Wegman 2011, Munnich et al. 2012). The action areas of a Safe System approach are based on evidence-based measures. This report summarizes a substantial body of evidence Sustainable & Safe : A Vision and Guidance for Zero Road Deaths 7
12 BOX ES-1 HOW THIS REPORT CONTRIBUTES TO THE KNOWLEDGE BASE ON THE SAFE SYSTEM APPROACH The global road safety agenda is receiving much more attention and action than ever before since initiation of the UN-Decade of Action for Road Safety Galvanizing efforts such as the Decade of Action; ministerial-level meetings; declarations such as the ones made in Moscow in 2009 and Brasilia in 2015; and inclusion of road safety in the SDGs, the New Urban Agenda, and the four pillars of sustainable mobility have generated momentum. As a result of these efforts, understanding has grown that a powerful and lasting way to approach this global health issue is through systemic road safety management rather than isolated road safety interventions. Road safety should therefore be approached through comprehensively planned and integrated action to create safe mobility. Emphasis on country and global road safety actions, goals, and programs has increased, as has interest at the national, state, and city level, in guidance on how to save lives by creating safe streets and transport systems. A variety of reports explain what a Safe System is and guide governments on how to take action. They include World Report on Road Traffic Injury Prevention (WHO 2004), Towards Zero: Ambitious Road Safety Targets and the Safe System Approach (ITF 2008), Global Plan for the Decade of Action for Road Safety (WHO 2011), Zero Road Deaths and Serious Injuries: Leading a Paradigm Shift to a Safe System (ITF 2016), and Save LIVES: A Road Safety Technical Package (WHO 2017). This report draws on a review of these evidence-based documents, as well as on interviews with sector experts and the authors experience working with cities to implement road safety strategies. It takes an in-depth look at the relevance of a Safe System approach to low- and middle-income countries by exploring the connection between a Safe System and broader sustainability, accessibility, and health issues. It links each area of intervention that contributes to a safe system with evidence. It offers guidance for policymakers, planners, and other stakeholders in cities and countries that want to apply the Safe System concept in their local context, even when working in resourceconstrained environments. on effective measures to improve safety. These measures include infrastructure and policies on land use planning, mobility, and road and vehicle design, as well as more traditional measures related to education, enforcement, and post-crash emergency response. Countries at all income levels can adopt the Safe System approach. Although Safe System strategies have been applied mostly in high-income countries, they can be applied in low- and middleincome countries. The approach addresses key issues that are specific to many low- and middleincome countries, such as inadequate road design; lack of planning for pedestrian and other vulnerable users in cities and on rural roads; the inequity of road traffic deaths; the sprawling nature of urban expansion, which fosters unsafe roads; safe vehicle design standards; and the capacity for coordination among decision makers. A Safe System is sustainable. It can help meet broader environmental, social, and health goals. By promoting public transport, walking, and bicycling, it can help mitigate climate change and improve air quality by reducing carbon dioxide emissions from transport. Increasing the safety of public transport, walking, and bicycling also increases people s physical activity and enhances their quality of life and ability to access jobs and education. A mobility system that offers a variety of safe transportation options can better address the needs of a variety of demographic groups, including women, poor people, elderly people, the very young, and people with limited mobility. 8 WRI.org
13
14
15 INTRODUCTION AND PURPOSE This report recommends that countries and cities adopt policies and practices that embrace a more comprehensive approach to road safety, known as a Safe System. The Safe System approach to road safety has different names in different places, and it comes in varying iterations, but it is generally based on a common set of principles that focus on creating a mobility system that is forgiving of human error. Sustainable & Safe : A Vision and Guidance for Zero Road Deaths 11


16 Every year about 1.25 million people die on city streets, rural roads, and highways. As economies, populations, and motorized vehicle ownership rates are growing, so too, are deaths and serious injuries on the road. These deaths are not an inevitable cost of growth or mobility. There is growing evidence and awareness that they do not take place in isolation. The dynamics on streets, roads, and highways are part of a wider system: They are generated by the interrelationship between variables such as institutions, laws, regulations, land uses, infrastructure, and road users. These and other system inputs interact to create roads and cities that are safe for their citizens or unsafe. As a result of poorly designed roads, limited transportation options, a lack of plans and policies, and inappropriate vehicle speeds, traffic crashes are the leading cause of death among 15- to 29-year-olds; in the absence of action, they will be the seventhleading cause of death worldwide by 2030 (WHO 2015). Road injuries rank among the top 10 causes of death after the first year of life through age 59. Injuries are a top-10 cause of death among women of child-bearing age and the fourth-leading cause of death among women (GRSF and IHME 2014). In low- and middle-income countries, serious traffic injuries and fatalities are rising or remain at very high levels. Between the two World Health Organization Global Status Reports on road safety (based on 2010 and 2013 data, respectively), the traffic crash death rate per 100,000 people rose by 32 percent. Although rates fell in most high-income countries, absolute numbers remain high (WHO 2013a, 2015). The numbers of fatalities in developing countries are very high. India has about 207,000 traffic fatalities a year and the number is growing (WHO 2015). In Brazil about 44,000 people die from crashes every year, more than half of them pedestrians, bicyclists, and motorcyclists (WHO 2015; DATASUS 2017). The annual number of traffic-related deaths is estimated at 260,000 in China, more than 38,000 in Indonesia, and more than 23,000 in Bangladesh (WHO 2015) and these figures understate actual deaths, because many traffic deaths go uncounted. In the poorest countries of Sub-Saharan Africa, which have the world s highest road injury death rates, official government statistics are estimated to report less than one-fifth of road injury deaths (GRSF and IHME 2014). The problem is systemic. It therefore requires a comprehensive systemic response that includes an array of evidence-based measures. They can be implemented at all points, from before crashes occur through to post-crash emergency response. 12 WRI.org
17 Few countries or cities have such strategies in place. In fact, according to the World Health Organization (WHO), only 7 percent of the world s population is governed by comprehensive road safety laws and policies (WHO 2015). Few countries have an effectively empowered or appropriately funded lead agency for road safety to manage the delivery of a systemic approach to road safety. There is great opportunity for change. This report recommends that countries and cities adopt policies and practices that embrace a more comprehensive approach, known as a Safe System. The Safe System approach to road safety has different names in different places, and it comes in varying iterations, but it is generally based on a common set of principles that focus on creating a mobility system that is forgiving of human error. Sweden and the Netherlands were the first to package Safe System approaches, in the 1990s. Vision Zero in Sweden and Sustainable Safety in the Netherlands changed the paradigm on safety from one focused on addressing road user behavior through isolated education and marketing campaigns to a more systemic approach in which responsibility is shared by road users and system designers, who create a mobility system that is safe and fosters safe conduct (Belin et al. 2012). This policy changed the notion of safety, establishing the aim that no one should be killed or seriously injured as a consequence of road traffic crashes and that the design and function of the road transport system should be adapted to meet this requirement. Emphasis began to be placed on preventing serious crashes from occurring and reducing death and injury through system design (SWOV 2013). Other countries, states, and cities have since adopted the approach. The European Union, the European Traffic Safety Council and the Organisation for Economic Co-operation and Development (OECD) now embrace these policies across Europe. Australia s National Road Safety Strategy embraces a Safe System, which had already been adopted in the states of New South Wales and Victoria years earlier (Australian Transport Council 2011). Change in Australia began with a push for recognition of the role of government as system operators in road safety outcomes: Many fatalities occur not because of driver error but because of driver error combined with a negligently designed road system and a politically acceptable but technically substandard vehicle (Job et al. 1989). New Zealand s Safer Journeys policy, established in 2010, takes the Safe System approach (New Zealand Ministry of Transport 2010). In the United States, the states of Minnesota and Washington have been implementing similar policies since the early 2000s (Center for Transportation Studies 2013, Washington Traffic Safety Commission 2016). Cities are also adopting Safe System approaches, from Copenhagen and Gothenburg in Scandinavia to the numerous cities embracing Vision Zero in the United States, many sparked by New York City s high-profile adoption of the policy. Mexico City and Bogota are embarking on their own Vision Zero based policies. Mexico City s Integrated Road Safety Plan was formally published in 2017 and now provides a legal frame of reference for road safety efforts (CDMX 2017). With the policy concept spreading, caution needs to be taken to ensure that all the features of a Safe System approach are evident in each new context. Although the distinct needs and opportunities in each location require unique strategies for action; the principles, core elements, and key action areas of a Safe System remain conceptually universal and interrelated. They should be considered holistically when developing a road safety strategy, developed through policy documents and practical implementation. This report provides guidance on developing a context-specific road safety strategy based on the Safe System approach. It describes the Safe System approach to road safety, presents its principles, gives examples of their application in policy and evidence of their record in reducing traffic fatalities and serious injuries, discusses opportunities for wider application of such an approach in low- and middle-income countries, and outlines specific steps policymakers can take to create a plan. The guidance was developed with all levels of government in mind, in both rural and urban contexts. Sustainable & Safe : A Vision and Guidance for Zero Road Deaths 13

18 14 WRI.org
19 THE SAFE SYSTEM APPROACH TO ROAD SAFETY The Safe System approach recognizes road safety as the outcome of the interaction between many components that form a dynamic system that influences the way people travel and behave on the roads, and thus their level of exposure to the risk of a collision. When the mobility system offers a high degree of safety, it also generates many wider societal benefits, related to the broader public health concerns of accessibility, physical activity, air quality, climate change, and environmental sustainability. Sustainable & Safe : A Vision and Guidance for Zero Road Deaths 15
20 What Is the Safe System Approach? The Safe System approach recognizes road safety as the outcome of the interaction between many components that form a dynamic system that influences the way people travel and behave on the roads and thus their level of exposure to the risk of a collision. When this system offers a high degree of safety, it also generates many wider societal benefits, related to the broader public health concerns of accessibility, physical activity, air quality, climate change, and environmental sustainability. The Safe System approach is based on the notion that humans are fallible and errors are to be expected. It emphasizes not how people blunder but why the system s defenses fail when they do. Whereas the followers of the person approach direct most of the management resources at trying to make individuals less fallible or wayward, adherents of the system approach strive for a comprehensive management program aimed at several different targets: the person, the team, the task, the workplace, and the institution as a whole (Reason 2000). System-based approaches based on preventing people from experiencing deadly force are well established in other areas, such as hospital care and nuclear facility safety (Haddon 1972). The Safe System framework developed for this report is based on a thorough review of the evidence-based measures that reduce road traffic death and serious injury and the relationships among them. It takes existing road safety policy approaches into consideration and builds on them. Principles of a Safe System The principles of a Safe System are drawn from the principles in the report published by the International Transport Forum of the OECD (OECD/ITF 2015): 2 1. People make mistakes that can lead to road crashes. 2. The human body has a limited ability to tolerate crash forces before harm occurs. 3. A shared responsibility exists among the people who design, build, manage, and use roads and vehicles and provide post-crash care to prevent crashes that result in serious injury or death. 4. A proactive approach should be taken to making the mobility system safe, rather than waiting for events to occur and reacting. All parts of the system must be strengthened to multiply their effects, so that if one part fails, road users are still protected. 5. No death or serious injury should be accepted in the mobility system. Lack of safety should not be a trade-off for faster mobility. Rather, the mobility system should be both safe and efficient. Figure 2.1 Principles of the Safe System Approach Humans Make Errors Humans Are Vulnerable to Injury Responsibility Is Shared No Death or Serious Injury is Acceptable Proactive vs. Reactive 16 WRI.org


21 In short, people are vulnerable to error, and human bodies are vulnerable to injury. The mobility system should create a forgiving environment that minimizes the possibility of a crash occurring as a result of error and the level of severity if it does. Responsibility for road safety should be shared by the public and the many types of decision makers and public officials who contribute to the design and management of this system. These people often referred to as system designers include policy- and lawmakers, law enforcement officials, planners, administrators, designers, and engineers, among other actors. A challenging element of the Safe System approach is drawing together all the people who contribute to the system design through their individual program areas. For this reason, the Safe System framework emphasizes coordination and leadership. In Sweden s Vision Zero approach, even more emphasis is placed on the system designers and government as having ultimate responsibility. If people make errors that cause road death and serious injury, system designers must come up with interventions to prevent them. A proactive, integrated approach must be taken to create layers of protection in the system, rather than just patching holes in reaction to traffic collisions as they occur. A system has several layers of defenses, barriers, and safeguards. In an ideal world, each layer would be intact; in practice, they are more like slices of Swiss cheese with many holes (areas of weakness) (Wegman et al. 2006, Reason 2000). When this thinking is applied to road safety, the layers include the actions of road users, the choice of travel mode, the active and passive safety systems of the vehicles, the management of travel speed, the features of the road and roadside, and post-crash response, among others. If holes align across layers, the system becomes more dependent on the actions of individual road users and therefore more vulnerable to human error, increasing the risk of a serious or fatal traffic crash. An approach that takes all the components of the system and their interactions into account is likely to decrease the number of holes and increase the number of layers, reducing the chance of the holes aligning. This thinking was applied to road safety in the Netherlands Sustainable Safety program (Wegman et al. 2008). In addition to the four principles outlined by the International Transport Forum, this report adopts the principle that no death or serious injury on the road network is acceptable. Serious traffic crashes are preventable and should not be acceptable. The health and well-being of society should not be sacrificed for other benefits, such as traffic flow or budget savings. Safety and efficiency are not mutually exclusive but complementary. Ultimately, a goal of zero or near zero deaths should be set, with targets for eventually reaching the goal. Many countries will not be able to achieve zero or nearzero deaths in a short period of time. However, setting the goal reflects the perspective that these deaths are not to be accepted as unpreventable events. Sustainable & Safe : A Vision and Guidance for Zero Road Deaths 17
22 Shifting Paradigms The Safe System approach represents a paradigm shift away from the traditional approach to road safety, which focuses on changing behavior through enforcement and education and on actions that protect car occupants, with less attention to people walking and cycling. The traditional approach emphasizes the responsibility of road users to avoid crashes rather than the responsibility of government to provide a safe mobility system. Traditional interventions include advertising campaigns, enforcement of seat belt wearing, and bans on drunk driving. Although these efforts are a valuable part of a road safety strategy, a Safe System approach encompasses a broader set of interacting issues that cause road death and serious injury (ITF 2008). It places a high priority on protecting vulnerable road users such as pedestrians and cyclists, because they are the most exposed to injury and death in the case of a crash and present the least risk to other road users. It also emphasizes the responsibility of the system designers. In addition to traditional enforcement and education approaches, protection of these vulnerable groups can be increased through systemic approaches, including street designs that reduce vehicle speeds and designate safe spaces for walking and cycling. Mobility systems can also be made safe through land use planning that provides for mixed uses, compact development, and efficient public transport. All of these measures reduce the need and length of driving trips, make walking and cycling more practical, and reduce exposure by reducing the vehicle-kilometers of travel. Table 2.1 illustrates the differences between the perspective taken by decision makers under the traditional, more person-based approach and the Vision Zero systems based approach from Sweden. Safe System Policies Around the World The Safe System approach has been developed and refined over many decades of application. Since it was first introduced, in Europe, it has been taken up at the country, state, and city levels around the world (Table 2.2). The system is often branded under a public policy identity that aims to connect with the public and establish a direct link to the desired outcome. In some cases, policymakers use the term Safe System internally with decision makers and brand publicly visible interventions in other ways, as the Netherlands did with its Sustainable Safety policy. The best-known brand may be Sweden s Vision Zero. The name of this policy refers to the foundational principle that no loss of life should be acceptable on the roads. It also establishes an ambitious target to reach zero traffic fatalities. Table 2.1 Vision Zero and Traditional Perspectives on Road Safety ITEM TRADITIONAL APPROACH VISION ZERO (SWEDEN) APPROACH What is the problem? Accident risk Fatalities and serious injuries What causes the problem? Human factors Humans make mistakes. Humans are fragile. Who is responsible? Individual road users System designers Public demand for road safety? People don t want safety People want safety What is the appropriate goal? Optimize the number of fatalities and serious injuries Eliminate fatalities and serious injuries Sources: Belin (2015) and Belin et al. (2012). 18 WRI.org
23 Table 2.2. Development of Safe System Approaches in Selected Areas PROGRAM Vision Zero (Sweden) Sustainable Safety (Netherlands) Safe System (Australia) Safer Journeys (New Zealand) Vision Zero (New York City) Towards Zero Deaths (U.S. states) Vision Zero (Mexico City) TIMELINE OF EVENTS 1994: Vision Zero first imagined. 1997: Swedish Parliament passes Road Traffic Safety Bill and designates the Swedish National Road Administration the lead agency, with a Traffic Safety Department monitoring road safety work. 2003: Road Traffic Inspectorate created to observe and analyze road design (under the supervision of the Swedish National Road Administration) : Institutional arrangements changed. Swedish National Road Administration and Road Traffic Inspectorate disbanded. 2016: Vision Zero relaunched, with the Swedish Transport Administration designated as lead agency, supported by Transport Analysis. Early 1990s: Dutch road safety research community, under the leadership of the Institute for Road Safety Research (SWOV), develops the vision. Mid-1990s: Vision accepted as a part of Dutch policy. Implementation of policies decentralized and supported by central government. Start-up program in 1997 includes 24 actions agreed upon by all sectors of Dutch government : Sustainable Safety vision includes five principles: the functionality of roads, the homogeneity of masses and/or speed and the predictability/recognizability of road design, the forgivingness of the environment and of road users, and awareness of the road users. 1980s: Advocacy for responsibility of government and system operators for road safety begins. Late 1990s 2010: Various states of Australia formally adopt Safe System approach in statements by governments, action plans, and strategies. 2011: Road Safety Working Group, with representatives of all states and territories, drafts Australian National Road Safety Strategy adopting Safe System. Relevant government ministers of all states and territories as well as the federal government sign it into law. 2011: National Road Safety Committee announces first Safer Journeys Action Plan, for : Second Safer Journeys Action Plan adopted, for Ministry of Transport, the New Zealand Transport Agency, the police, the Accident Compensation Corporation, and other agencies undertake other road safety work : Administration of Mayor Michael Bloomberg initiates actions to improve road safety through street design and speed management. 2012: Advocacy group Transportation Alternatives publishes report calling for Vision Zero, organizes support. 2013: Mayor Bill de Blasio embraces policy in 2013 campaign. 2014: Action plan promises a multisectoral approach involving City Hall, the Police Department, the Department of Transportation, the Taxi and Limousine Commission, and the Department of Health and Mental Hygiene. 2014: City passes 11 bills to implement Vision Zero and grant the city power to control speed limits. Early 2000s: Washington (2000) and Minnesota (2003) are first states to adopt a Towards Zero Deaths goal into their road safety plans. Collaboration takes place between government agencies, including transportation, public safety, health, and other agencies and the university (in Minnesota). Programs designate clear lead agency. 2016: National highway provisions incentivize states to incorporate road safety. New transportation bill requires performance measures on safety. 2014: Mexico City s government passes groundbreaking Mobility Law, which reforms the way the city approaches mobility and road safety. Law requires development of new integrated plans for the city, new traffic regulations, and institutional changes, all based on the hierarchy of mobility. 2014: Comprehensive Mobility plan launched, Secretariat for Transport renamed Secretariat for Mobility. 2015: New traffic regulations adopted, with focus on improving safety for vulnerable road users. 2017: Integrated Road Safety Program launched. City joins Vision Zero movement, which strengthens impacts of Mobility Law. Sources: Van Schagen and Janssen (2000), Wegman (2007), New Zealand Ministry of Transport (2010), Belin et al. (2012), Center for Transportation Studies (2013), NYC (2014), CDMX (2017), and interviews with experts. Sustainable & Safe : A Vision and Guidance for Zero Road Deaths 19

24 Impacts of the Safe System Approach Many countries, states, and cities that have adopted a Safe System approach have reduced road fatalities at a faster rate than others that followed the traditional approach. According to the International Traffic Safety Data and Analysis Group (IRTAD the traffic safety data arm of the OECD and the International Transport Forum), the number of road fatalities declined 42 percent between 2000 and 2013 in the 32 countries in IRTAD for which data are available (OECD/ITF 2015). IRTAD concludes that this overall good performance reflects the implementation of systematic road safety strategies and programs. These strategies and programs address education and enforcement issues, such as speeding and lack of compliance with traffic regulations; advance technical standards for road infrastructure and vehicles; improve emergency and heath care; and address economic conditions (OECD/ITF 2015). The World Resources Institute (WRI) conducted additional analysis of traffic fatalities in 53 countries between 1994 and 2015 for this report. It revealed that countries that have adopted a Safe System approach have both the lowest rates of fatalities per 100,000 inhabitants and the fastest rate of change in fatality levels (Figure 2.2). The most impressive progress in improving road safety has been seen in the countries that pioneered the approach, Sweden and the Netherlands. Their policies include lower urban speed limits; roundabouts on rural road junctions; separate zones between pedestrians, bicyclists, and motorized vehicles; and a deep understanding of network planning (Eurostat 2017). Just 3 out of every 100,000 Swedes dies on the road each year, and the fatality rate fell 55 percent between 1994 and The Netherlands has fewer than 4 fatalities per 100,000 residents, and the rate fell by more than 50 percent. Measures taken saved up to 1,700 lives between 1998 and 2007 (Weijermars and Wegman 2011). Other places are also seeing rapid results. Spain, which has adopted a Safe System approach and a Vision Zero policy, has seen fatalities decline by more than 60 percent since 1994, to less than 4 fatalities per 100,000 people (Álvaro 2015). Further evidence comes from the United States. It embraced Safe System at the national level only recently, but some states embraced a systembased Towards Zero Deaths (TZD) initiative in the early 2000s. Between 2001 and 2011, Minnesota, Idaho, and Washington, where TZD programs were implemented, had fewer fatalities and serious 20 WRI.org
25 Figure 2.2 Reduction in Fatalities between 1994 and 2015 and Fatality Rate in 2015 in 53 Countries 100 = Top performing countries for road safety Percent Reduction in Fatalities compared to PRT SVN EST CHE IRL ISR ESP SWE FRA LUX DEU AUT NOR DNK BEL GRC GBR CZE NLD JPN ITA SVK CHN FIN AUS CAN MLT ISL HUN NZL MKD POL LVA LTU KOR HRV MDA SRB ALB BGR MNE USA ROU UKR TUR ARM AZE MEX BLR RUS IND GEO -100 BIH Fatality Rate per 100,000 People in 2015 COUNTRY CODES: ALB = Albania ARM = Armenia AUS = Australia AUT = Austria AZE = Azerbaijan BEL = Belgium BGR = Bulgaria BIH = Bosnia and Herzegovina BLR = Belarus CAN = Canada CHN = China CRO = Croatia CZE = Czech Republic DEU = Germany DNK = Denmark ESP = Spain EST = Estonia FIN = Finland FRA = France GBR = Great Britain GEO = Georgia GRC = Greece HUN = Hungary IND = India IRL = Ireland ISL = Iceland ISR = Israel ITA = Italy JPN = Japan KOR = South Korea LTU = Lithuania LUX = Luxembourg LVA = Latvia MDA = Moldova MEX = Mexico MKD = Macedonia MLT = Malta MNE = Montenegro NLD = Netherlands NOR = Norway NZL = New Zealand POL = Poland PRT = Portugal ROU = Romania RUS = Russia SRB = Serbia SVK = Slovakia SVN = Slovenia SWE = Sweden SWZ = Switzerland TUR = Turkey UKR = Ukraine US = United States Source: WRI, based on data from OECD Sustainable & Safe : A Vision and Guidance for Zero Road Deaths 21
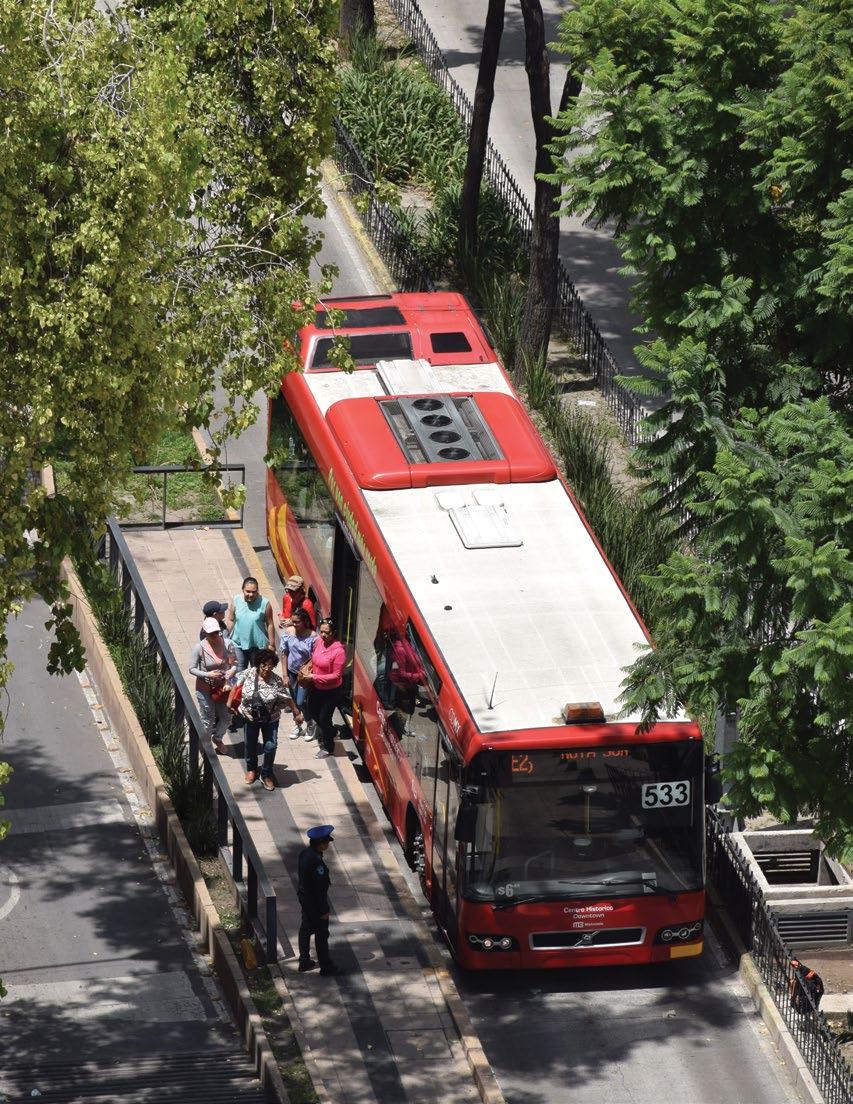
26 BOX 2.1 ADOPTING THE SAFE SYSTEM APPROACH AT ALL LEVELS OF GOVERNMENT Aligning the Safe Systems approach across all governmental levels can significantly increase its impact. Doing so usually involves a national plan or policy and complementary subnational policies at the state or provincial, regional, and city levels. In Denmark, for example, a national road safety strategy is aligned with regional road safety plans. Other European countries, such as Sweden and the Netherlands, also maintain a national-level top-down approach to road safety, with their national governments setting goals and agendas for subnational governments to follow (ITF 2008, 2016). International declarations from the United Nations, such as the UN Decade of Action, the SDGs, and the New Urban Agenda, have encouraged more countries, especially countries outside the OECD, to embrace nationallevel leadership and policies to make their roads safe for all. In countries where a national policy does not yet exist, cities and states can take the lead in introducing Safe System approaches. In most countries, local or municipal governments own most of the road network. Even though national roads see more traffic per kilometer, most road trauma still occurs on local and state or regional roads. In Brazil, for example, 84 percent of fatalities occur on state and municipal roads (Job et al. 2015). In the United States, states and cities have been ahead of the federal government. Many states have introduced a Safe System based Towards Zero Deaths (TZD) approach, and 23 cities have adopted an official Vision Zero policy (Vision Zero Network 2017). The Safe System approach is now being embraced in performance measures and requirements for road safety planning in national-level guidelines. Among developing countries, Bogota and Mexico City are taking the lead on a Safe System approach. As these cities are home to a large proportion of their national populations and often catalyze actions by other cities or at the national level these city-level policies and actions have the potential for enormous impact. injuries than did non-tzd states, and the rate of decline was faster (Munnich et al. 2012). Minnesota adopted the TZD approach in 2003, when the state had 663 deaths from traffic crashes and the number of fatalities was rising. Over the following 10 years, the number of fatalities dropped 40.5 percent, saving an estimated 2,046 lives (Center for Transportation Studies 2013). Peer-reviewed analysis of New York City s experience is not yet available, but New York s first three years of Vision Zero ( ) were the safest three-year period in the City s history, and the first time in over a decade that traffic fatalities fell for three consecutive years according to city statistics (NYC 2017). The city has taken a datadriven approach, analyzing five years of crash data to identify and target the highest-risk corridors with integrated engineering, enforcement, and education efforts. Between 2013 and 2016, total fatalities dropped 23 percent and pedestrian fatalities dropped 21 percent. The Connection between a Safe System and Sustainable Mobility and Health A well-designed Safe System can yield benefits beyond saving lives from traffic crashes. It can help address other issues common to cities all over the world, reducing carbon dioxide emissions and positively affecting air quality, physical activity, and quality of life. A Safe System approach to land use can affect trip length and mode; good road design and infrastructure generate safe motorized vehicle speeds and provide for walking, cycling, and mass public transport. Reducing vehicle travel and speeds to improve safety also reduces other negative externalities generated by unconstrained use of private motor vehicles. Safety and the environment converge when it comes to land use. Cities in the United States with higher urban densities and street connectivity have some of the lowest fatality rates per capita. Compact New York City is one of the safest cities in the country in terms of traffic collisions; sprawling Orlando is on the opposite end of the spectrum (Ewing et al. 2008). Implementing safer, more compact patterns elsewhere in the United States could prevent the release of 79 million metric tons of carbon dioxide a year by 2030 (Ewing et al. 2008). 22 WRI.org
27 Efforts to reduce carbon emissions from transport also create a safer environment, particularly for cyclists and pedestrians (Lefevre et al. 2016). Reducing the vehicle-kilometers of travel as recommended by the International Energy Agency as part of a move from a 4 global climate change scenario to a 2 scenario would also reduce traffic deaths by an estimated 200,000 a year (Hidalgo and Duduta 2014) (Figure 2.3). In London, congestion charging to reduce vehicles and emissions in the city center resulted in a 31 percent reduction in traffic crashes and a 16 percent drop in carbon dioxide equivalent emissions between 2003 and 2006 (Lefevre et al. 2016). Within a year of the implementation of a bus rapid transit system in Ahmadabad, India, greenhouse gases along the corridors were reduced by 35 percent; by the second-year fatalities related to traffic crashes were reduced by 66 percent (Lefevre et al. 2016). Reduced speeds in urban areas can also reduce emissions. Road designs that limit speed and allow for smoother driving, without the need to intensely accelerate and decelerate, can reduce carbon dioxide emissions by about 30 percent (Hyden and Varhelyi 2000, Billingsley 2014). Replacing signalized intersections with roundabouts in Sweden resulted in a net decrease of fuel consumption and emissions and reduced collision risk by 40 percent (Hyden and Varhelyi 2000). Reductions in travel speed not only save lives, they can also deliver economic returns and reduce greenhouse gas emissions, fossil fuel use, and the harmful effects of noise pollution (Sakashita and Job 2016). Shifts to more cycling which safe conditions can foster could lower transport carbon dioxide emissions by 10 percent by 2050 worldwide (Mason et al. 2015). Moving toward a road system based on Figure 2.3. Projected Annual Global Traffic Fatalities under a 2 and a 4 Global Climate Change Scenario, Global traffic fatalities (millions) global climate change scenario 4 global climate change scenario Source: Hidalgo and Duduta Sustainable & Safe : A Vision and Guidance for Zero Road Deaths 23
28 clean energy public transport and nonmotorized modes could reduce public transport emissions by 40 percent by 2050 (Replogle and Fulton 2014). The benefits of reducing vehicle-kilometers of travel and improving public transport and vehicle standards through a Safe System approach also extend to other serious global health issues, such as air pollution and physical inactivity. Globally, air pollution from vehicles causes 184,000 deaths a year from ischemic heart disease, stroke, lower respiratory infections, chronic obstructive pulmonary disease, and lung cancer (GRSF and IHME 2014). Noise pollution from transport, particularly roads, affects quality of life, mental health, and physical health (Job 1996, Carter and Job 1998, WHO 2011a). This problem is greater than generally appreciated: The World Health Organization estimates that more than a million heathy life years are lost each year in Western Europe alone from traffic noise, through effects such as sleep loss, cognitive impairment of children, and stress (WHO 2011a). Physical inactivity is another growing global public health issue, which is linked to the increase in noncommunicable diseases, such as heart disease and stroke. Countries such as the United States have seen steep declines in physical activity since 1965; many rapidly motorizing countries are now experiencing similar trends. China, for example, had a 45 percent drop in physical activity between 1991 and 2009, and Brazil is slated to see a 34 percent decline in physical activity between 2002 and Globally, 5.3 million deaths a year are attributed to inactivity (Designed to Move 2012). Making active transport such as walking, cycling, and public transport safe and thus more appealing can reduce these figures. The benefits of the Safe System approach can catalyze a positive feedback cycle of change. As streets become safer, healthier, and more humane as a result of better design, reduced vehicle numbers and speed, and improved air quality, more people will feel comfortable walking, cycling, and taking public transport, which will contribute to ongoing reductions in vehicle-kilometers of travel, compounding the associated benefits (Figure 2.4). Figure 2.4 Environmental and Health Benefits of a Safe Systems Approach Increased Cycling and Walking Safer, Healthier Environment for All Reduced Vehicle Travel Reduced Emissions and Air Pollution Fewer Crashes and Fatalities 24 WRI.org

29 Sustainable & Safe : A Vision and Guidance for Zero Road Deaths 25
30
31 APPLYING THE SAFE SYSTEM APPROACH IN LOW- AND MIDDLE- INCOME COUNTRIES Most of the world s traffic deaths occur in low- and middle-income countries and the share is rising. This chapter discusses some of the key issues facing rapidly urbanizing low- and middle-income countries and how these could be addressed by taking a Safe System approach. Sustainable & Safe : A Vision and Guidance for Zero Road Deaths 27
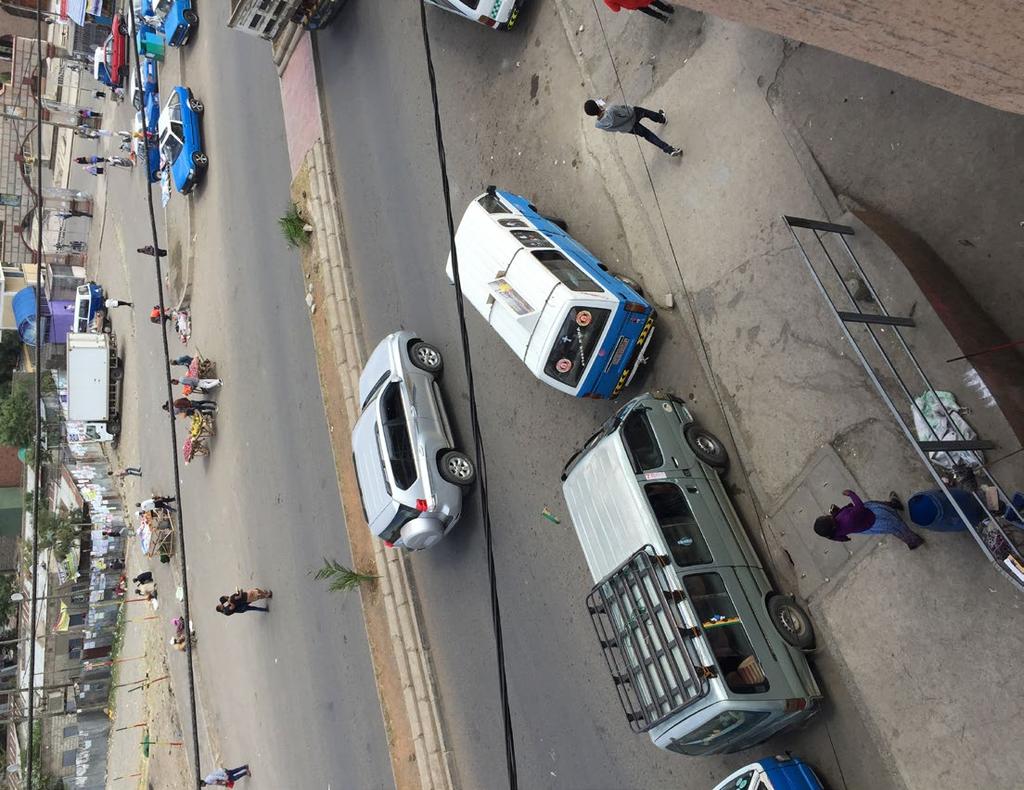
32 Figure 3.1 Annual Traffic Fatalities by Country Income Category, 2013 Road Traffic Deaths per 100,000 People Source: WHO Low- Income Middle- Income World High- Income Most of the world s traffic deaths occur in low- and middle-income countries and the share is rising (WHO 2015) (Figure 3.1). Fatality rates are also high at the city level in developing countries (Welle et al. 2015). Low- and middle-income countries also have higher levels of traffic deaths among pedestrians, bicyclists, and motorcyclists. The risk of a pedestrian death from traffic injury starts to steadily increase around vehicle impact speeds of only kilometers an hour (Hannawald and Kauer 2004, Rosen and Sander 2009, Richards 2010). Pedestrians and bicyclists account for 43 percent of total fatalities in Africa (WHO 2015). In some locations, the proportion is much higher. For example, between 2010 and 2015 pedestrians accounted for 88 percent of BOX 3.1 SAFE SYSTEM: TAKING A COMPREHENSIVE APPROACH WHILE TARGETING THE HIGHEST CONCENTRATIONS OF DEATHS AND SERIOUS INJURIES A Safe System approach addresses entire road networks. Actions can be taken and changes can occur beyond the areas where danger is concentrated. Many problems in road safety can result from decisions, such as land use planning, that occur before roads are even constructed or fatalities and serious injuries begin occurring. For this reason, new infrastructure, road rehabilitation, neighborhood traffic calming, and other measures can all be part of making roads safe. Within this broader approach, decision makers can begin efforts by targeting roads with the highest concentrations of death and serious injuries across a road network to maximize program and project benefit cost ratios and the likelihood of achieving them. A small proportion of a country s road network usually accounts for the majority of deaths and serious injuries. In the absence of reliable fatality and injury data, it is still possible to identify the most dangerous corridors by identifying high traffic volume and high speed corridors, where higher densities of fatal and serious injury crashes can be expected (Bliss and Breen 2013). fatalities in Addis Ababa, Ethiopia, where there is a lack of adequate sidewalks and pedestrian crossings and vehicles move at unsafe speeds. Where sidewalks exist, they are often in ill-repair or commandeered for parking, forcing pedestrians onto the street (Addis Ababa City Administration 2017). A Safe System approach would address these infrastructure problems, helping prevent vulnerable road users from exposure to lethal crash forces. This chapter examines how low- and middleincome countries could benefit from a Safe System approach. It describes the core elements and key action areas necessary to create a Safe System and presents evidence to support them. 28 WRI.org
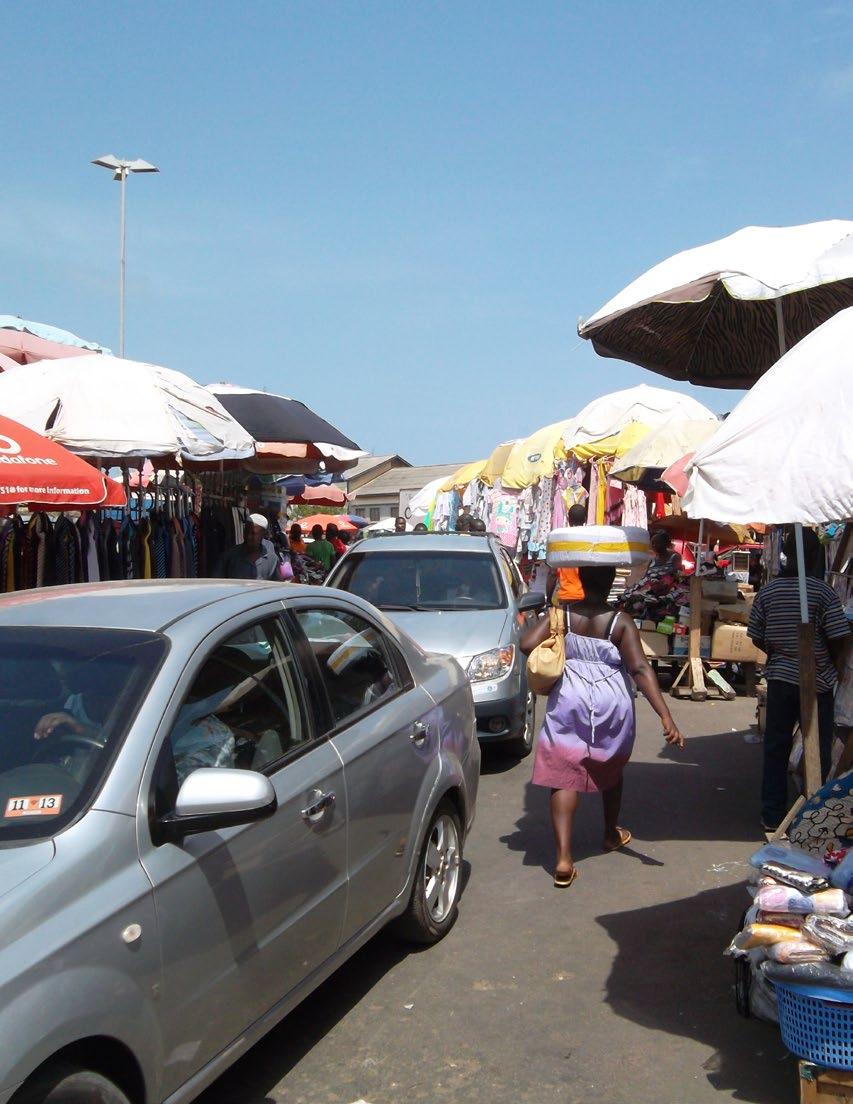
33 Sustainable and Safe Urban Expansion and Mobility Urban expansion and population growth are occurring rapidly in many low- and middle-income countries, particularly in Africa and Asia (Angel 2012). As these cities expand, both geographically and economically, motorized vehicle ownership is increasing, new urban development and roads are being constructed, and the built environment is being redeveloped. These changes present a window of opportunity to incorporate Safe System based road safety considerations into these trends and the policies that shape them. For example, research finds that Delhi and Beijing have the greatest potential for reduction in road deaths when transport safety policies are combined with land use and transport policies that minimize reliance on privately owned motorized vehicles and emphasize space for walking, cycling and public transport (McClure et al. 2015). A development scenario that favors high rates of public transport use can reduce fatalities (Bhalla et al. 2007). Modeling applied to the city of Ahmedabad, India, finds that prioritizing sustainable transport and urban development over car-oriented development would dramatically reduce the number of traffic fatalities over the long term (Pai 2012) (Table 3.1). Safe Street Design Unsafe streets share many characteristics. They lack sidewalks and accessible crossings for pedestrians. Their lane widths invite unsafe speeds and expose pedestrians to long crossing distances. Such streets are particularly pervasive in low- and middleincome countries, many of which have visibly poor road conditions. The International Road Assessment Program (irap) surveyed nearly 250,000 kilometers of roads in 60 countries. It found that more than 80 percent of roads on which pedestrians were present and traffic flowed at more than 40 kilometers an hour had no formal sidewalk; 88 percent of roads with cyclists and speeds of more than 40 kilometers an hour lacked bicycle facilities (irap 2015). The problem is partly related to a lack of local guidance on such matters. Many places lack context-specific guidelines that reflect appropriate approaches to different street types. Traditionally, road designs catered only to motorized traffic and did not protect all road users or take into account the function of streets as public spaces (NACTO and Global Designing Cities Initiative 2016). In the United States, Latin America, and other regions, for example, highway guidelines are frequently applied inappropriately to urban street environments (Mitullah et al. 2017), creating streets that invite inappropriate speeds and do not accommodate the safe passage of pedestrians, cyclists, and public transport users. Safe Rural and Intercity Roads Despite increasing urbanization, the safety of rural roads remains critical to achieving substantial reductions in deaths and serious injuries. Of the 60 countries irap surveyed, more than 60 Table 3.1 Annual Projected Carbon Dioxide Emissions and Traffic Fatalities in Ahmedabad, India, in 2041 under Two Urban Development Scenarios ITEM CAR-ORIENTED DEVELOPMENT SUSTAINABLE TRANSPORT Population (millions) Trips (million per day) Area (square kilometers) 1,330 6,484 3,242 Emissions (million tonnes C0 2 /year) Annual traffic fatalities 175 5,232 1,225 Source: Pai Sustainable & Safe : A Vision and Guidance for Zero Road Deaths 29

34 percent of high-speed roads with significant traffic volumes have only a thin white line of paint separating oncoming vehicles approaching each other at speeds of more than 70 kilometers an hour, and more than half of roadsides do not mitigate the impact if a crash does occur (by, for example, clearing rigid objects located close to the roadside, which create potential for deadly crashes, or installing crash-absorbing barriers) (irap 2015). Fatality rates are likely higher for rural areas in low- and middle-income countries, because in many places they have higher rates of vulnerable users, such as pedestrians, cyclists, and animalpowered vehicles, as well as the presence of livestock (Dimitriou and Gakenheimer 2012). Rural people are at higher risk of road fatalities because of higher speeds on rural roads, less enforcement of traffic regulations, and, in many countries, a lack of appropriate pedestrian and bicycling facilities or lighting. Known engineering solutions that provide a Safe System can dramatically improve safety on rural roads. Safe Vehicles In many low- and middle-income countries, vehicle safety is not effectively regulated through design standards or maintained through mandatory vehicle inspection schemes. Poorly designed and old vehicles contribute significantly to traffic deaths in these countries, which also typically have lower vehicle safety standards for both vehicle occupants and other road users, such as people walking and cycling. Eighty percent of countries sell vehicles that do not meet UN priority safety standards (WHO 2015). The Global New Car Assessment Program (GNCAP) is strongly advocating for better vehicle safety at the point of manufacture (Global NCAP 2015). Taking action in this area is key for reducing fatalities. Implementing a Safe System would require vehicle design standards to reduce the opportunity for human error and the impact of a collision on both car occupants and vulnerable users. Safe Conditions for Children A Safe System approach may be the only way to address the disturbing and disproportionate share of children killed or injured by traffic in low- and middle-income countries. Traffic collisions are the fifth-leading cause of death among 5- to 9-year-olds and the number one cause of death among 10- to 19-year-olds in developing countries (Silverman 2016). Many children in these countries walk to school on roads that are in poor condition and dangerous. Many schools are located along major highways. Children are also more vulnerable to road deaths because of limited impulse control, slower reaction time, and poorer perception of risk (Silverman 2016). A study in Hyderabad, India, finds that 11 percent of boys and 6 percent of girls reported a road traffic injury over the course of a year (Tetali et al. 2015). 30 WRI.org
35 In response to this situation, the Global Initiative for Child Health and Mobility (coordinated and funded by the FIA Foundation) set a goal for all children to have a safe and healthy journey to school by A Safe System approach would consider or reassess where schools and roads are placed and provide for basic road design changes to ensure that children are protected by dedicated sidewalks, traffic calming, safe vehicle speeds, and other measures. This approach reduced child deaths from traffic crashes in South Korea by more than 95 percent between 1988 and 2012 (Sul 2014). A Safe System would also better protect child occupants of cars, through regulation and enforcement requiring the use of child restraints and the inclusion of child restraint latches in all new vehicles. Stronger Economic Development and Reduced Inequality Saving lives is the main goal of the Safe System approach. However, addressing road safety comprehensively also has the potential to yield wider economic benefits, removing traffic problems as a hindrance to economic development. Traffic crashes have a direct economic impact on individuals and families, especially in low- and middle-income countries, perpetuating poverty or pulling people into it. The effect on poverty is compounded by the fact that poor communities are at significantly more risk of serious road traffic injuries than their more affluent counterparts, because they often live beside poorly designed roads that expose pedestrians and cyclists to fast-moving vehicles and are more likely to be walking (Silverman 2016). Various studies show that traffic deaths and serious injuries have a detrimental economic impact on the poor and near-poor. A detailed study of Bangladesh finds that 75 percent of poor households and 59 percent of nonpoor households experienced a decrease in their standard of living after suffering a road traffic injury. In a third of urban and half of rural cases, the decline pushed households into poverty. Employment and educational opportunities also suffer. On average, seriously injured victims in Bangladesh missed four to six months of schooling (Aeron-Thomas et al. 2004). A study of Nigeria finds that 30 percent of people who experienced a road traffic crash were permanently disabled and 14 percent were unable to return to work (Juillard et al. 2010). A study of Vietnam finds that 26 percent of road traffic victims became impoverished as the result of the crash (Nguyen et al. 2016). A study of India finds that the poorest group of road traffic victims spent about half of their annual household income on medical care (Kumar et al. 2012). In addition to the direct impact on people, traffic accidents impose significant macroeconomic costs. The Global Initiative for Child Health and Mobility estimates that at least 500,000 people are killed and 6.5 million seriously injured every year in 82 low- and lower-middle-income countries. The economic cost $220 billion is equivalent to about 5 percent of GDP. This figure far exceeds total OECD overseas development assistance in 2015 of $131 billion (Watkins and Sridhar 2013; irap 2014). A World Bank analysis finds that crashes cost countries in the Middle East and North Africa an average of 5.4 percent of GDP a year, with some countries suffering costs as high as 8 percent (Dahdah and Bose 2013). Traffic fatalities cost percent of GDP in Argentina, percent in Colombia, percent in Mexico, and percent in Paraguay (Bhalla et al. 2013). Rode et al. (2014) show that poor policies on urban growth and infrastructure cause traffic crashes that harm urban economies. A Safe System approach would reduce the impact on poorer families by reducing overall deaths, increasing safety for vulnerable road users, and addressing safety across the entire road system rather than focusing on areas where there is more wealth, constituent pressure, or existing infrastructure. Sustainable & Safe : A Vision and Guidance for Zero Road Deaths 31

36 Photo FPO 32 WRI.org
37 GUIDANCE ON SAFE SYSTEM STRATEGIES This chapter describes the core elements of a Safe System based road safety strategy or plan and provides guidance and evidence on the action areas decision makers need to consider. The information presented is not a template; all road safety strategies should be specific to the local context, informed by local knowledge and evidence. Sustainable & Safe : A Vision and Guidance for Zero Road Deaths 33
38 Core Elements of a Safe System Strategy The core elements of a Safe System strategy are intrinsic to the systemization of a road safety strategy and action plan. They include comprehensive governance and management, strong targets and data, priorities and planning, and monitoring and evaluation. Comprehensive Governance and Management A key concept of the Safe System approach is that responsibility for safe roads is shared by many actors, including road users, road designers, municipalities and other levels of government, the police, vehicle manufacturers and regulators, and road authorities. The World Health Organization recommends that a lead agency be designated to coordinate all road safety activities (WHO 2004, 2015). It could take the form of a dedicated standalone road safety agency, a dedicated safety division within an agency, or a road safety council or standing committee coordinated by one lead agency. There is no prescribed form of institutional leadership and coordination but rather a requirement that an effective governance structure be in place that provides both leadership and coordination for road safety. Responsibility for safe roads should be shared by road users, road designers, municipalities and other levels of government, the police, vehicle manufacturers and regulators, and road authorities. In general systems theory, the interrelationship of components is fundamental (Hughes et al. 2015). A review of several Safe System based road safety approaches finds that even in the most advanced countries, such as Sweden and the Netherlands, the interrelationship between components is rarely specified or elaborated upon (Larsson et al. 2010; Hughes et al. 2015). These strategies still exclude some essential aspects of systems theory that describe relationships and interdependencies between key components, such as the relationship between enforcement, education, and road design when it comes to managing speed (Hughes et al. 2013). Taking an integrated approach to road safety greatly increases impact (ITF 2016). It is also important that commitments be made to address road safety. To create and maintain an institutional framework that improves road safety, stakeholder contributions should be identifiable and accountable (Wegman et al. 2015). Political leaders can greatly facilitate these processes and commit to actions themselves (ITF 2016). Strong Targets and Data Road safety targets make it easier to implement effective countermeasures and set priorities (Elvik 1993). Research on 14 countries that set quantified road safety targets between 1981 and 1999 finds that the targets had an appreciable association with improvement in road safety (Wong and Sze 2010; Allsop et al. 2011). Safe System strategies set ambitious targets to reduce road fatalities and serious injuries. They use targets to measure performance, ensure accountability, and generate public and political support. Targets should be ambitious but realistic. Many countries or cities may not be able to reach the Vision Zero target of zero fatalities. It is therefore wise to set intermediary targets that will help them advance toward an eventual goal of zero. Setting intermediate targets can also reduce the risk of public fatigue from failing to attain an overly ambitious goal despite heavy investment. In line with the SDGs, the European Commission set an objective to halve the number of traffic deaths by the end of 2020 from a 2010 baseline. Denmark seeks to reduce traffic deaths by half by 2020, to a total of 127 deaths from 255 in 2010 (Danish Road Safety Commission 2013). Ghana s national road 34 WRI.org
39 safety strategy includes an action plan for to progressively reduce road fatalities from 1,730 in 2014 to 1,280 by the end of 2017 and 810 by 2020 (NRSC 2015). It includes a target of reducing the number of people seriously injured from 4,473 in 2014 to 3,822 by the end of 2017 and 2,388 by Policymakers should set context-specific targets and consider adopting additional indicators, such as safety performance indicators and action milestones, in order to guide and measure progress while waiting for the numbers of collisions, deaths, and serious injuries to decline. Data analysis is important for monitoring progress toward a target. It also plays a vital role in helping prioritize actions that can have the greatest impact. In low- and middle-income countries, a challenge to setting targets and tracking progress is that the data can be of low quality. Data collection systems are often inadequate or statistics are underreported. A Safe System approach should therefore include actions to improve data reporting systems, so that in the long term, targets can be set and monitored using reliable data that can be publicly shared. In the short term, policymakers can use what data they have to set and reach targets. They should ensure transparency about improvements in data collection and reporting and address the lack of data by focusing on action milestones rather than statistical milestones while working to improve data quality. Priorities and Planning A process to set priorities and actions appropriate to the context is needed to develop a Safe System strategy. Such a process requires a diagnostic that analyzes traffic crash data and identifies areas for highest-impact improvements to reach targets. Data for a diagnostic could include victim travel modes and demographics, and road types or locations where serious collisions concentrate. This process helps guide the preparation of a set of actions that address each area of need and an action plan that includes short-, medium-, and long-term activities. The diagnostic should consider a wide array of variables, including the needs of women, children, the elderly, poor people, and people with disabilities. This process should involve engagement with the public, civil society, and other groups, through meetings, workshops, focus groups, and surveys. Understanding the types of interventions and the scales at which they are applied can help policymakers plan a Safe System, select areas of activity, determine timelines, and identify priorities based on the local context. Planning, setting priorities, and targeting actions also align with the goal of the Swiss cheese model to try to eliminate holes in the system by combining approaches to create multiple layers of defense against traffic fatalities and serious injuries. Table 4.1 gives some examples. Table 4.1 Examples of Types of Interventions That Can Deliver a Safe System GOAL OF INTERVENTION Reduce exposure to crash risks Reduce speeds, to diminish both the probability and severity of a crash Reduce the forces to which humans are exposed in the event of a crash Help road users avoid making mistakes EXAMPLES Land use and mobility planning to reduce vehicle-kilometers of travel; separation of pedestrian and vehicular traffic to prevent pedestrian crashes Vehicles with intelligent speed-control systems, speed humps, raised platform crossings, and speed enforcement Median barriers, shoulder barriers, air bags, seat belts, and helmets Enforcement of drunk driving and other laws, more visible stop signs and traffic signals, street lighting, and safe and frequent pedestrian crossings Sources: Adapted from Job and Sakashita 2016a. Sustainable & Safe : A Vision and Guidance for Zero Road Deaths 35

40 Monitoring and Evaluation Monitoring progress and reporting on impacts is key for scaling up Safe System approaches. Sharing lessons learned and successes can help leverage more political and public support for the Safe System approach and help countries learn how to adapt the principles to their own context. Some indicators that should be monitored include the following (Bliss and Breen 2010): FINAL SAFETY OUTCOMES. Final safety outcomes include deaths and serious injuries recorded by police, hospitals, health authorities, and other sources, such as insurance companies. A common indicator is the number of traffic fatalities per 100,000 inhabitants, which can be useful for comparing jurisdictions or monitoring progress over time. However, caution should be exercised in making comparisons, because data quality, and thus accuracy, can vary greatly. One common metric RISK. PERCEPTIONS. ACTION SYSTEMS is the number of people killed or seriously injured. Other indicators are kilometers traveled by mode, traffic volume by mode, and overall mode share. Risk can be calculated by measuring the number of traffic crashes, fatalities, and serious injuries by mode or passenger distance traveled. Risks should be tracked for different groups, including vulnerable road users and people of different ages, income levels, and gender. Risks should also be considered by location, to identify dangerous locations, road typologies, or high- volume/high-speed roads that require urgent attention. Traditional traffic engineering often focuses on reducing crash frequency per vehicle-kilometer of travel or car fleet numbers. This metric is not recommended, because it can lead to a bias toward interventions that improve car occupant safety or generate misleading statistics if fleets are growing rapidly. The perception of risk or safety has a major impact on behavior and mode choice. Indicators for perceptions include the perceived safety of bicycling and walking; the percent of residents who feel safe crossing the street; the percent of residents satisfied with pedestrian, cycling, and public transport facilities; perceived behavior of other road users (for example, pedestrians perception of driver behavior); and self-perceptions, such as drivers perception of their tendency to follow traffic regulations. Comparing actual and perceived behavior can generate insights into a local mobility culture. MILESTONES. Milestones can monitor strategy implementation progress in the short, medium, and long term. They include changes to road space allocation, new policies implemented, new enforcement effort, the supply of mobility options available, and requirements for new project audits or execution of the audits themselves. OUTPUTS. Over the longer term, outputs can measure wider changes associated with a Safe System. They can include changes in traffic infraction types and rates, mode share shifts, walkability, bikeability, vehicle-kilometers of travel, public health, air quality, and crash types and locations. 36 WRI.org
41 Figure 4.1 Hierarchy of Targets for Road Safety SOCIAL COSTS Outcome Final Outcomes NUMBER KILLED AND INJURED Intermediate Outcomes SAFETY PERFORMANCE INDICATORS Policy Output SAFETY MEASURES AND PROGRAMS Policy Performance Policy Input STRUCTURE AND CULTURE Policy Context Source: Wilmots et al. 2010, citing Morsink et al One approach to establishing and prioritizing targets is the target hierarchy for road safety (Figure 4.1). It originated in New Zealand and has been adapted for many road safety projects, particularly in Europe. The approach provides guidance on identifying targets related to underlying factors that affect road safety that are not necessarily measured through final outcomes alone (Koornstra et al. 2002). The hierarchy recognizes that the local institutional framework and culture affect policy and underlie road safety efforts. Policy outputs can take the form of specific safety measures and programs, such as national road safety plans, action programs, and safety-related standards and legislation, which can be measured in terms of their development, existence, content, and degree of implementation. These outputs directly influence intermediate outcomes or safety performance indicators (Wilmots et al. 2010, citing Morsink et al. 2005). Safety performance indicators can be established based on some of the most clearly identifiable local safety risks and evaluated in terms of progress in reaching a desired objective, ideally from a measured starting point, as in the examples in Table 4.2 (Berg et al. 2009). They can form valuable interim targets and give an indication of the likely progress of final outcomes in terms of the number of people killed or seriously injured (Wilmots et al. 2010). They can also offer a more reliable point of comparison across locations than final outcome statistics (Koornstra et al. 2002). The social costs of road safety have overarching but difficult to measure outcomes, including costs for communities, individuals, and emergency services (Wilmots et al. 2010). Sustainable & Safe : A Vision and Guidance for Zero Road Deaths 37
42 Table 4.2 Examples of Road Safety Performance Indicators INDICATOR MEASURE OBJECTIVE Speed Proportion of traffic volume complying with speed limit 100 percent Seat belts Proportion of traffic volume wearing a seat belt 100 percent Drunk driving Proportion of traffic volume complying with blood alcohol limit 100 percent Motorcycle helmets Proportion of motorcycle users wearing helmets 100 percent Source: Adapted from Berg et al Rationale for Safe System Investment: Economic Analysis An economic evaluation of crash costs can be a valuable tool for communicating the importance of a comprehensive set of Safe System measures. The economic costs of road crashes can be calculated using established methodologies (McMahon and Dahdah 2008; SWOV 2011; European Commission 2016). Road crash costs include medical costs, loss of work productivity, loss of quality of life, property damage, and other costs, such as those incurred by the police or the courts (SWOV 2014). Costs that are often overlooked or difficult to quantify include the following: Individual or household costs, such as premature funeral; disability-related; noneconomic (pain, suffering, grief); vehicle repair and unavailability; and legal and court costs. Business costs, such as workplace, recruitment and retraining, vehicle repair and unavailability, and travel delay and vehicle operating costs. Public or collective costs, such as road and other infrastructure repair, insurance administration, police, correctional services, ambulance and other emergency response, and coroner costs. The high cost of road crashes and the immense fiscal burden that accompanies dangerous roads must be appreciated, and not undervalued, so that economically viable decisions on road safety interventions can be made. These costs are high even in high-income countries. New York City, for example, loses an estimated $3.9 billion annually (1 percent of gross city product) as a direct consequence of traffic crashes and these figures do not include social costs (for example, grief, posttraumatic stress, lost opportunity) (NHTSA 2010). The economic burden on low- and middle-income countries is even higher, estimated at about 2 5 percent of national GDP (WHO 2015). Such high economic losses make a compelling case for governments to not only invest in road safety but to make strategic cost-effective decisions based on the Safe System principles to reduce the overall burden from traffic crashes. The main type of analysis is cost-effectiveness, which compares the benefits of improved health with the costs of the intervention. Cost-effectiveness can help prioritize investments. The Netherlands and other countries also use cost-benefit analysis to show that the costs of Safe System are lower than the economic benefits (Elvik 1997; SWOV 2014). One of the challenges to Vision Zero or the Safe System comes from economists accustomed to cost-benefit analysis. Such models are based on the notion of the optimal number of fatalities and injuries, considered the price to be paid for reaping the benefits of a modern transport system. This kind of analysis should consider the economic costs and benefits beyond lives saved. It should consider the broad effects of different interventions on safety, travel time, accessibility, and ideally, other health indicators, such as physical activity, air quality, and impacts on land values. In practice, these items may not be considered. Instead, the emphasis is often on travel times, which can be valued more highly than safety. Cost-benefit analysis often biases decisions against investment in road safety because of disregarding or undercounting costs (Hauer 2010). 38 WRI.org


43 Adopting a Vision Zero mindset based on a Safe System approach means moving away from the cost-benefit mindset and recognizing that being killed or seriously injured while traveling is not acceptable. In Sweden this notion is considered an ethical imperative that underlies the Vision Zero philosophy, which emphasizes that life and health can never be exchanged for other benefits within the society (Tingvall and Haworth 1999). Action Areas for a Safe System Approach This section presents and explains the action areas to be taken into account when creating a safe road system. All of them should be considered in a road safety strategy and plan. The action areas listed cover all interventions that have been shown to reduce traffic death and serious injury. Because they are interrelated, the principles and evidence listed are often relevant to more than one area. Some action areas have a more powerful effect on a road safety system than others, because of the scale and range of their influence. They are presented here in order of impact. However, each country and city has a different set of problems and possible solutions. The action areas should not be presumed to have equal importance; some may have much greater potential impact or more urgent necessity in a particular context. Priorities should be determined by preliminary studies and data analysis. The action areas presented here are based on a thorough review of the evidence-based measures that reduce road traffic death and serious injury and the relationships among them. Guidance and supporting evidence are provided for each action area. Land Use Planning In order to achieve a truly safe system, road safety policy should be integrated into broader city and urban planning efforts that affect mobility options and travel patterns. Land use planning should foster less private vehicle travel, create safe conditions for vulnerable users, and ensure that high-speed roads are adequately separated from mixed land uses. Land use plans can also prescribe public transport corridors and street connectivity, providing increased transportation choices and closer destinations. For these reasons, land use planning is closely interrelated with the provision of mobility choices. It is also interrelated with speed management and street design, as a hierarchy of streets and their purposes should be established at a land use planning level and enacted through the setting of speed limits and the implementation of appropriate design. Although many studies have identified the link between land use and traffic fatalities, few road safety frameworks have incorporated this consideration until recently. Guidance Create long-range comprehensive plans for cities and towns that integrate strategic road safety and mobility planning. Establish a clear hierarchy of road types based on adjacent land uses, and categorize roads accordingly for planning and implementation purposes. Establish Plan street design standards and recommended cross-sections for each road type category, with particular attention to safety for vulnerable users. well-connected streets with short blocks to facilitate walking and bicycling.
44 Orient Create In development around public transport corridors in urban areas. Avoid development alongside expressways wherever possible. residential densities that are sufficient to support schools, public transport, parks, retail outlets, and other activities, and decrease reliance on vehicles for travel. Combine density with other form elements, such as street connectivity, mixed use, and proximity to destinations in order to make it an effective measure. rural areas, create land use plans that encourage safe access management along highways, consider town bypasses, and provide for high-speed to low-speed transition zones through towns (Figure 4.3). Supporting evidence Urban sprawl in the form of low density, long blocks, and poor street connectivity is directly related to poor road safety. For every 1 percent change toward a more compact and connected urban form, all-mode traffic fatality rates fall by 1.49 percent and pedestrian fatality rates by percent (Ewing et al. 2003). Land uses that increase the density of urban dwelling space and are connected by safe and rapid transport are the most desirable from a safety perspective. They also reduce public Grid-based Rural Travel health burdens (McClure et al. 2015). street network layouts promote high health development index ratings and meet sustainable transport safety principles. They are estimated to produce percent fewer road collisions than arterial-oriented suburban road patterns (Dumbaugh and Rae 2009, Sun and Lovegrove 2013). highways with lower access density (such as private business or residential access points, private drives, and minor roads) have fewer traffic fatalities and serious injuries than highways with high access density (Preston et al. 1998, Elvik et al. 2009). patterns are heavily influenced by land use patterns. Clark and Cushing (2004) find that vehicle-kilometers traveled is a strong predictor of traffic fatality rates in both urban and rural areas. U.S. states with higher daily vehicle-kilometers traveled per capita have higher traffic fatality rates (Figure 4.2). Figure 4.2 Relationship between Vehicle-Kilometers Traveled on Urban Roads and Traffic Fatality Rates in U.S. States, Annual Traffic Fatalities/100,000 People Daily Vehicle-Kilometers Traveled on Urban Roads Source: Clark and Cushing WRI.org


45 Figure 4.3 Transition Zones Figure 4.4 Low Speed Zones This transition zone into a village improves safety. Land use planning can enhance safety in rural areas as well, including managing access points and dictating smooth transitions between town and country settings, in addition to separating vulnerable users. Street Design and Engineering Street design has a crucial effect on how people use and experience roads. When streets are designed and implemented for safety, they limit driving to appropriate speeds. Street design has a strong interrelationship with speed management and enforcement. It can reduce or eliminate conflicts between modes of transport and make it easier for people to understand how the space is divided or shared by different modes, which makes walking, cycling, and accessing public transport much safer and more appealing. Street design has a strong interrelationship with with mobility and transport choice. By being more forgiving that is, by reducing the opportunity for errors to occur and the impacts of those errors when they do occur it can reduce the likelihood that a collision is fatal. Guidance Craft designs that reflect proven solutions, prioritized or refined based on local data and analysis of traffic deaths and serious injuries. Conduct traffic safety audits on new infrastructure plans and inspections of existing infrastructure. Low-speed zones in Fortaleza, Brazil, prioritize pedestrian safety. Prioritize Design Provide Use Apply Physically Change Avoid Provide Apply safe design within transport investments, projects, and budgets. roads to move traffic at appropriate speeds in cities, towns, and rural areas. safe spaces for pedestrians, bicyclists, and motorcyclists. speed humps, curb extensions, medians and median refuge islands, roundabouts, and neighborhood traffic calming to reduce speeds (Figure 4.4). design techniques to control speeds and improve visibility at intersections. separate highways in urban areas from pedestrians, and avoid mixed land uses next to them. roads to urban streets with lower speeds if highways enter urban areas where pedestrians are present. flyovers and underpasses in areas with a mix of land uses and where pedestrians are present. connected networks of protected bicycle infrastructure in cities, with special attention to the design of safe intersections. distinct designs to account for the different needs of rural roads, urban streets, and highways. Sustainable & Safe : A Vision and Guidance for Zero Road Deaths 41
.")
46 Design rural roads to account for human error, using medians, cable-divided highways, roundabouts at dangerous junctions, well-designed roadsides, special junction treatments to avoid vehicle conflicts, and traffic calming when high- Provide In Limit ways pass through towns (Figure 4.5). dedicated pedestrian and cyclist infrastructure on rural and intercity roads if they are used by pedestrians and cyclists. Separate them from vehicle traffic as much as possible, by creating walking or cycling paths parallel to the road. cities with high rates of motorcycle use, design for maximum visibility and to prevent invasion of pedestrian spaces. speeds to no more than 50 kilometers an hour at intersections at which side-impact crashes can occur. Supporting evidence Various street design measures improve road safety. They include roundabouts (70 90 percent injury reduction), chicanes (curvatures) to slow vehicles (54 percent injury reduction), and speed humps (41 percent injury reduction). (For descriptions of these measures and the evidence behind them, see Cities Safer by Design [Welle et al. 2015]). Figure Roads 2+1 roads, which alternate two lanes on one side and one on the other every few kilometres, with a dividing barrier between, are part of Sweden s systembased approach to reducing the number of head-on crashes on highways. Research on Canada finds that the risk to cyclists of a physically segregated cycle lane on a high traffic volume is one-ninth the risk of the same type of street without such infrastructure The A (Teschke et al. 2012). Handbook of Road Safety Measures presents a large body of evidence on a variety of measures proven to improve road safety in rural and urban settings in high-income countries, including the use of roundabouts, median separations, shoulder barriers, speed humps, two-way turning lanes, retro-reflective pavement markers, and service roads (Elvik et al. 2009). study on Latin America finds that each additional traffic lane increased the number of fatal crashes by 17 percent (Duduta et al. 2015). Another study shows that narrow lane widths are better fitted for urban environments and wider lanes for expressways and highways (Welle and Banerjee 2016). Improved Mobility Options Fostering a range of safe and comfortable transportation choices reduces the number of people traveling by private motorized vehicle, which in turn reduces the risk of traffic deaths. High-quality public transport, such as urban bus and rail networks and intercity public transport, attract more riders when it is properly governed and managed and sufficient infrastructure is provided for stops and stations. Good-quality public transport consistently outperforms other modes in terms of safety. By pulling people away from private motorized vehicle trips, it reduces the risk associated with vehicle-kilometers of travel. Encouraging people to walk or bike instead of driving, by providing safe bicycling and walking infrastructure, reduces fatalities while promoting healthier modes of transport. Coordination and implementation of multiple transportation options can be integrated within one mobility plan for greatest impact (Figure 4.6). Policies that provide economic incentives to reduce motorized vehicle use, such as implementing congestion pricing and parking policies and removing fuel subsidies, reduce unnecessary vehicle travel and road deaths. 42 WRI.org

47 Figure 4.6 Mobility Plans Mobility plans required by all Brazilian cities with more than 50,000 residents prioritize safe walking, cycling, and high-quality public transport. Guidance Create or support high-quality public transport in cities that provides access to opportunities and destinations and is safe, affordable, and accessible by all residents. Provide Ensure Protect Design Provide safe intercity public transport that connects effectively with urban public transport systems to facilitate non-road-based passenger transport. that sidewalks exist and are walkable and accommodating for all users, including the elderly, people with strollers, and people with limited walking ability. sidewalks from encroachment by other uses, such as parking, commerce, and infrastructure. public transport stops and stations that allow safe passage for users separate from vehicle traffic. networks of bicycling infrastructure that protect cyclists from fast-moving vehicles and allow their free movement. Where feasible, consider public bicycle sharing. Consider demand-side interventions such as congestion pricing in city centers and avoidance of minimum parking requirements in building construction. Reduce or remove fuel subsidies and subsidies Facilitate for motor vehicles (including motorcycles), which encourage driving. the non-road-based transport of freight, by supporting other transport modes, such as rail and shipping, and effective intermodal connectivity. Supporting evidence In high-income countries, the traffic casualty (death or injury) rate for public transport travel is about 1/10th that for automobile travel, and people who live in transit-oriented communities have about a fifth the crash casualty rate as people who live in automobile-oriented communities (Litman and Fitzroy 2016). High-quality Networks After An bus rapid transit reduces fatal traffic crashes on urban roads by nearly half. Traveling by bus is safer for passengers than traveling by car (Duduta et al. 2012). of bicycling infrastructure reduce the risk of bicycle fatalities (Jacobsen 2003; Duduta et al. 2012). the introduction of a congestion charge in central London, in 2003, the number of traffic crashes, fatalities, and serious injuries fell 40 percent (Green et al. 2015). estimated 35,000 road deaths a year could be prevented by removing global fuel subsidies (Burke and Nishitateno 2014). Speed Management Speed determines the severity of crashes and injuries. It also affects the potential to avoid a crash, because higher speeds reduce drivers capacity to stop in time, reduce maneuverability in evading a problem, make it harder to negotiate curves or corners, and cause others to misjudge the timing of approaching vehicles (Job and Sakashita 2016b). Even small increases in speed result in significant Sustainable & Safe : A Vision and Guidance for Zero Road Deaths 43
.")
. Speed also determines the level of safety features and physical separation between road users required in the transport system.")


48 increases in risk. Nilsson s (2004) meta-analysis of the relationship between speed and crash risk finds that for every 1 percent increase in speed there is a 4 percent increase in fatal crashes. Speed management is increasingly recognized as a key mechanism for road safety (Mooren et al. 2011). Speed can be managed through many elements of the system, including sound road design and management, appropriate speed limits, speed limit regulation, and education on the impacts of vehicle speed (GRSP 2008). Speed also determines the level of safety features and physical separation between road users required in the transport system. Guidance Establish strong speed management as a point of focus for safety, with strong advocacy for the safety value of managing speeds effectively. Set speed limits that are appropriate for the type of road and the safety of road users (Figure 4.7): 30 kilometers an hour or less where large numbers of pedestrians are present and no Manage Design Make more than 50 kilometers an hour on urban roads. Grade-separated and median-divided urban expressways can have speeds of 80 kilometers an hour or more when there is full separation between motorized and nonmotorized modes, depending on the curvature and side protection of roads. Base rural road speed limits on the type of road users and adjacent land uses (WHO 2013b). speeds on rural roads and highways to levels that favor the probability of survival in the case of a collision, considering the possibilities of side-impact, head-on, and off-road crashes (Figure 4.8). roads to limit driving speeds to the safe speed limit, through features such as speed humps, crossings raised to pedestrian level, roundabouts, chicanes, and road narrowing. signs highly visible in places where drivers are supposed to change from one speed limit to another. Facilitate compliance through regulation and design at gateways to lower speed areas, such as a staggered reduction in the limit. Figure 4.7 The Safe System Approach to Speed Limits on Rural and Urban Roads in Sweden RURAL ROADS Rural Roads 70km/h 2-Lane Roads 80 90km/h (Milled rumble strips) 2 +1 Roads 100km/h Motorways 110km/h High Standard Motorways and Low Traffic Flow 120km/h URBAN ROADS Risk of Head-on Crash 70 km/h Risk of Crash at Intersections 50 km/h Risk of Crash with Obstacles 60 km/h Risk of Crash with Vulnerable Road Users 30 km/h Source: Vadeby WRI.org
49 Figure 4.8 Relationship between Fatality Risk and Vehicle Speed for Pedestrians, Cyclists, and Motorists Pedestrian or Cyclist Side Collision Head-on or Fixed Object 70 Fatality Risk, % kph mph Source: Wramborg (2005). Collision Speed Encourage Develop Set Establish Allow and advocate for vehicle-based speed limiting, an existing technology for limiting speeding. effective automated (camera) and police enforcement to discourage speeding, with strong communications in support of these programs. penalties for speeding that are aligned with the risk speeding creates and that genuinely deter, such as high fines or a license demerit points system. stronger penalties for speeding by novice drivers, such as license loss. only a small tolerance level before enforcement to prevent the real speed limit being seen as well above the posted limit. Supporting evidence Both the number and the severity of crashes increase with each incremental increase in speed (Nilsson 2004; GRSP 2008; Job and Sakashita 2016b). Speed cameras reduce the number of deaths and serious injuries (Wilson et al. 2010; CDC 2011; Job and Sakashita 2016b). Road Speed-governing In Lowering speed limits reduces the number of deaths and serious injuries, even though not all drivers obey them. Increasing speed limits increases the number of deaths and serious injuries (Sliogeris 1992; Stuster et al. 1998; Bhatnagar et al. 2010; Graham and Sparkes 2010). design treatments such as speed humps, speed cushions, raised platform crossings, roundabouts that require the vehicle to turn to enter, gateway treatments, and painted lane lines to narrow lanes and widen shoulders are highly effective (Lum 1984; Huang et al. 2011; Makwasha and Turner 2013). vehicles reduce speeding. This type of intelligent speed adaptation can be inexpensive if introduced on all new vehicles. The evidence shows clear benefits even for driver warning (advisory) systems, such as alert sounds. Much larger benefits accrue to direct speed limiting of the vehicle (Carsten et al. 2008). New South Wales, Australia, imposition of a higher penalty for any speeding offences by novice drivers reduced the number of fatal crashes by those drivers by more than 30 percent (Job et al. 2013). Sustainable & Safe : A Vision and Guidance for Zero Road Deaths 45

50 Enforcement of Laws and Regulations Enforcement of laws and regulations is an important complement to safe street design and education. Consistent enforcement provides a strong economic incentive to comply with the laws, which can contribute to a change in traffic culture over time. Laws and enforcement should consider risk factors such as speed, yielding to pedestrians or cyclists, seatbelt wearing, drunk driving, motorcycle helmet wearing, and use of child restraints, with the focus based on the local context. Speed and red-light cameras, data collection, and analysis can improve enforcement. Guidance Establish and enforce safe speed limits with a low level of tolerance for exceeding the limit before enforcement and no tolerance for exceeding the limit by novice drivers. Establish Establish Establish Establish Establish and enforce alcohol regulations that maintain strict limits on blood alcohol content. Upper limits of 0.02 grams per deciliter (g/dl) for the general driving population are recommended. and enforce laws on the use of car seats for children under the age of five. Consider subsidies to ensure their accessibility to low-income families. and enforce laws to require seat belt use in both front and back seats of cars and taxis. and enforce laws to require helmet wearing by drivers of motorized two-wheelers, including requirements that helmets be appropriately sized and correctly latched. and enforce regulations to prevent public spaces, such as sidewalks and cycling lanes, from being appropriated by automobiles, motorcycles, or commercial activities (Figure 4.9). Design elements such as bollards, which physically prevent such encroachment, should be included. Figure 4.9 Encroachment on Pedestrian Spaces Shops, hawkers, and parked cars should not commandeer pedestrian pavements or sidewalks, as they do in Accra, Ghana, where pedestrians are forced to walk in the street next to heavy traffic. 46 WRI.org


51 Figure 4.10 Motorcycle Helmet Enforcement in Vietnam Introduction and enforcement of compulsory use of motorcycle helmets has saved thousands of lives in Vietnam. Supporting evidence Less severe but more common events, such as receiving a fine, are more effective in motivating behavior change than more severe but less likely events, such as risk of death in a crash (Job 1988). Crash risk increases after a blood alcohol content of 0.03 g/dl, steadily increasing thereafter (Compton et al. 2002; Voas et al. 2012). In Brazil enactment and enforcement of a maximum blood alcohol level of 0.02 g/dl cut the number of adults who drove after excessive alcohol consumption by almost half, from 2.0 percent in 2007 to 1.1 percent in 2013 (Andreuccetti et al. 2013). Seat belt use cuts the number of serious injuries and deaths following crashes by about half (Kahane 2000). Use of car seats and booster seats reduces children s risk of significant injury or death by more than half (Ehiri et al. 2009). The year after Vietnam introduced a policy requiring standard motorcycle helmets, the number of deaths fell by 2,200 and the number of head injuries fell by 29,000, saving $18 million in acute care costs and $31 million in income losses (Passmore et al. 2010; Olson et al. 2015) (Figure 4.10). U.S. cities that enforced red-light cameras had 24 percent fewer crashes than cities without such cameras; fatal crashes at signalized intersections were 17 percent lower (Hu et al. 2011). Education and Capacity Building Road safety education can increase traffic regulation awareness and compliance. It can also help overcome misconceptions or a lack of awareness about road safety. Traditionally, road safety education focused on making road users aware of traffic rules and the risks of noncompliance. This type of education is an important complement to safe street design and appropriate traffic regulation and enforcement, but it is not sufficient. Behavioral norms should be addressed through media campaigns that address specific problems and are linked to education and enforcement actions. Educational programs can be developed in schools to help children become safe and confident pedestrians, cyclists, and motorized vehicle passengers. They can also teach children the wider Safe System concepts that streets should provide space for pedestrians and cyclists, not just motorized vehicles, and that traffic crash fatalities are not acceptable and can be prevented. Communities or local governments can engage the public through active educational experiences, such as street-theater performances; street closure events; temporary street design changes, using road cones or other movable materials; and speed limit trials. Sustainable & Safe : A Vision and Guidance for Zero Road Deaths 47
52 As the Safe System approach is based on the responsibility of systems designers to create and manage a safe system, it is important that education also extends to them. Planners, engineers, health professionals, law enforcement officers, and others must understand the Safe System approach. Capacity building and education should therefore target these crucial stakeholders. Guidance Design age-appropriate educational programs and classes in schools. Topics for children include safe street crossing, navigation of sidewalks, and lessons on how to ride a bicycle and navigate streets safely. Topics for teenagers include the risks of drunk driving, distracted driving, and speeding. Require the driver s licensing process to include training, testing, and supervised on-road experience. Ensure that mass media campaigns target specific issues. Conduct testing to determine how the public reacts to campaigns, in order to gauge their effectiveness and identify potential problems, and create tailored messages that reflect local culture, demographics, and other factors. Include promotion of enforcement and consequences in messaging. Provide Educate engaging public outreach experiences, through temporary street and intersection redesigns that develop community awareness of the benefits of road safety interventions. system designers as well as road users. Apply a public health spectrum of prevention (Figure 4.11) that includes strengthening individual knowledge and skills; promoting community education; educating providers (through curricula, civil engineering training, workforce standards, etc.); fostering coalitions and networks; and changing organizational practices (Cohen and Swift 1999). Figure 4.11 Public Health Spectrum of Prevention Supporting evidence Mass media campaigns have little effect on behavior unless coupled with enforcement and educational activities. With the addition of these measures, they reduce crashes by 10 percent (Elvik 2009; Hoekstra and Wegman 2011). Meta-analysis shows that including enforcement in messaging increases the efficacy of the behavior change achieved (Phillips et al. 2011). Training on how to cross streets for children 5 12 reduces the number of injury crashes in this cohort by percent (Elvik 2009). Many studies and reviews of evidence show that both school-based and post-license driver training consistently fail to deliver safety benefits (Roberts and Kwan 2001; Ker et al. 2003). But research conducted in Sweden shows that learners who received more hours of on-road supervised driving experience subsequently had fewer crashes than learners with fewer hours. The benefits of reducing crashes far outweighed the small increase in risk of the extra hours of supervised experience (Gregerson et al. 2003). In Influencing Policy and Legislation Changing Organizational Practices Fostering Coalitions and Networks Educating Providers Promoting Community Education Strengthening Individual Knowledge and Skills Source: Cohen and Swift the United States, graduated licensing systems in which new drivers earn driving privileges in stages led to a percent decrease in the crash risk of the youngest new drivers (Neyens et al. 2008). In New Zealand, a graduated licensing system reduced the number of crashes with casualties by 25 percent (Kirley et al. 2008). 48 WRI.org

53 Vehicle Design and Technology Vehicle design and technology is perhaps the fastest-growing area of road safety. Traditionally, it focused on keeping vehicle occupants safe from crashes. Recently, car design and technology has made it possible to increase safety for occupants of other vehicles, pedestrians, and cyclists in the case of a collision. Higher safety ratings can be achieved at relatively low cost. Most countries do not require this technology, however: 80 percent of countries sell vehicles that do not meet UN priority safety standards (WHO 2015). Guidance Require that all new cars adopt UN regulations for higher levels of road user protection, such as electronic stability control and designs to absorb impact from front and side collisions and reduce injuries in the case of impact of a collision with a pedestrian or cyclist. Require seat belt and child restraint anchorages for all new cars. Ban the export or import of new or used cars with low safety standards. Require motorcycles and scooters to feature antilock braking systems. Consider additional vehicle technology systems, such as autonomous emergency braking systems and vehicle-to-vehicle communications. Consider vehicle technologies that help prevent dangerous behavior, such as alcohol ignition interlocks, seatbelt wearing systems, and intelligent speed control. Review design and safety requirements of lightweight motor vehicles, such as auto rickshaws, to increase their crashworthiness. Require safety standards for large vehicles, with particular attention to the safety of people walking or riding bikes or motorbikes. Design features such as lower driver positions, longer truck cabs, and smaller dashboards increase the visibility of vulnerable road users for drivers of trucks and buses. Truck side-guards can reduce the risk of a vulnerable user falling under the wheels. Encourage commercial fleet operators to lead innovation by voluntarily adopting higher safety standards. Establish vehicle registration processes that include vehicle inspection schemes, to ensure that basic safety features, such as safe tires and Put working brakes, are maintained. in place Safe System based regulations in cities and countries with emerging autonomous vehicle use in advance of fleet launch (Box 4.1). Supporting evidence An estimated 40,000 car occupant fatalities and 400,000 serious injuries could be prevented between 2016 and 2030 if minimum vehicle safety standards for seat belts and car seat anchorages and frontal/side crash protection are applied in Argentina, Brazil, Chile, and Mexico (Figure 4.12) (Wallbank et al. 2016). Antilock Truck Use A braking systems on motorcycles reduce the number of severe and fatal crashes by percent (Teoh 2011); for scooters the reduction is 31 percent (Rizzi et al. 2015). designs with longer cabs and rounded noses, smaller dashboards, expanded glazed areas, and a lower driver position increase visibility and the safety of cyclists (Summerskill et al. 2014). of side guards on large trucks reduced cyclist fatalities by 61 percent and pedestrian fatalities by 20 percent in side-impact crashes in the United Kingdom (Vision Zero Network 2016). study of auto rickshaws in India recommends improving crashworthiness through design modifications such as seat orientation, seat belt provision, and surface padding (Schmucker et al. 2011). Figure 4.12 Crash Testing Following crash testing and a campaign by the Global New Car Assessment Programme (Global NCAP), Nissan ceased production of the Tsuru in The model, produced for the Mexican market, received a zero-star rating for safety performance. Sustainable & Safe : A Vision and Guidance for Zero Road Deaths 49
54 BOX 4.1 WHAT IS NEW MOBILITY? The concept of new mobility encompasses the disruptive technologies, often linked to smartphones, that are reshaping the way people travel. A wide variety of technologies and models makes up new mobility, including phone applications to facilitate car sharing, ride hailing, bike sharing, and on-demand public transport. New mobility innovations also include regionally specific projects, such as mapping paratransit (privately operated public transport) in African countries using mobile technologies and using the data to improve operations and access to information. Also falling within this category are autonomous vehicles, which will disrupt current mobility systems when they become widespread. These technologies still need significant time to develop. The deployment of autonomous vehicles on a large scale may not occur for many years (Litman 2017), especially in the more difficult road environments of low- and middleincome countries. Partially autonomous vehicles are beginning to enter the marketplace, but they are certified for safe operation only under certain conditions in carefully mapped and controlled environments, mostly in high-income countries. There will be significant safety challenges in managing transitions from autonomous driving to drivercontrolled driving when partially autonomous vehicles encounter operational domains in which they are not capable of safe operation. Driver distraction, already a major safety issue, will be a critical challenge in such handovers. It will be important for local, state, and national policymakers to ensure that autonomous vehicles be required to operate in compliance with traffic laws, such as speed limits, to ensure the potential safety benefits of such vehicles are reaped. The impact of autonomous vehicles on road safety will depend greatly on the mobility system in which the vehicles are allowed to operate. Autonomous vehicle technology shows great potential for eliminating traffic deaths and serious road injuries if the vehicles are deployed within a Safe System that reduces the opportunity for conflict with other types of road users and limits speeds to survivable levels. For this reason, Safe System principles should be considered during the genesis of autonomous vehicles, particularly on setting safe standards and designing cities that ensure the safety and comfort of cyclists and pedestrians. Many countries and cities do not have appropriate speed limits in place (WHO 2015). Vehicles will need to be programmed to travel at safe speeds for everyone, especially in urban areas where a mix of land uses and road users is present. Looking broadly at this new mobility paradigm further into the future, driverless cars may offer opportunities to expand street space for pedestrians and cyclists, though cities may have to create a regulatory environment that allows this to happen (Chase 2016). Many technological innovations can already be deployed to improve vehicle safety. The immediate focus in low- and middle-income countries should be on increasing crash protection for both car occupants and vulnerable users and promoting the mass deployment and uptake of vehicle safety technologies such as electronic stability control, automatic emergency braking, and antilock braking systems for motorcycles. All of these technologies have been proven to save lives and are currently available, but they are rarely required by law. These technologies will also be needed in the driverless future. By itself, vehicle technology will not solve the problem of road fatalities. Policymakers need to address the wide range of problems with solutions that are available today and presented in this report, while also preparing for the future. 50 WRI.org
55 Post-crash Emergency Response and Care Emergency response is key for reducing the impact of injuries. For this reason, first responders and trauma centers should be coordinated within the larger road safety strategy. Figure 4.13 presents the key components of post-crash response, as summarized by the WHO (2016). Figure 4.13 Components of the World Health Organization s Post-crash Response RESEARCH AND INFORMATION Crash data: police, insurance, auto industry Prehospital care documentation Trauma registry and quality improvement Care documentation, quality improvement, surveillance Fatal injury surveillance (mortuary) LEGAL SUPPORT AND LEGISLATION Collision investigation Duty to assist and Good Samaritan laws Police evidence reports Emergency care access legislation Regulations for providers and financing mechanisms Facility designation, standards and regulations Legal support for affected Legal process (inquest, criminal charges, prosecution, etc.) COLLISION EVENT AT THE SCENE AT THE TREATMENT FACILITY FOLLOW-UP INJURY CARE First response (including system activation and universal access number) Transport In-facility injury care (including triage, resuscitation, and management) Rehabilitation (including occupational and physiotherapy) Prehospital injury care Management of disabilities Workplace reintegration MENTAL HEALTH CARE Acute stress coaching Trauma counseling and support groups Treatment of PTSD and other disabling conditions Source: WHO Sustainable & Safe : A Vision and Guidance for Zero Road Deaths 51

56 Guidance Establish and promote one countrywide emergency access telephone number. Set up responder systems that are organized and coordinated across different areas of road safety expertise. Maintain robust trauma centers with appropriate funding. Ensure that health departments are included in a Safe System institutional framework. Monitor and manage performance through measures such as the percent of crash victims brought to the hospital by ambulances and response time to crashes. Include nonprofessional first responders, such as delivery and taxi drivers, in first-aid and basic emergency care. Encourage all road users to stop and call emergency services at the scene of a crash, in order to reduce notification time. If necessary, create Good Samaritan laws (which protect members of the public who assist a person who is injured or in danger from liability if unintended consequences result from their assistance), to remove fear of helping in the case of an emergency. Supporting evidence More traffic deaths occur outside the hospital in low- and middle-income countries than in high-income countries, because of less effective emergency response (Nielsen et al. 2012). Trauma In Coordination experts consider response time critical in reducing the risk of death or severe injury (Carr et al. 2006; Bigdeli et al. 2010). Delays during the first hour can influence the chances of survival and the completeness of recovery, underscoring the importance of appropriate treatment and equipment (Bernard et al. 2010). The first minutes after the crash are critical to lowering the probability of death (Sánchez-Mangas et al. 2010). the United States, establishing organized emergency department trauma care reduced mortality among front-seat car occupants involved in collisions by 8 percent (Nathens et al. 2000). of emergency services in Mexico City in 2002 is considered one of the factors that resulted in a 17.5 percent drop in traffic fatalities and (Hijar et al. 2011). 52 WRI.org

57

58 54 WRI.org
59 LEAPFROGGING TOWARD A SAFE SYSTEM APPROACH IN LOW- AND MIDDLE- INCOME COUNTRIES A Safe System approach to road safety is urgently needed in low- and middle-income countries. The opportunity exists to leapfrog over many decades of experimentation in highincome countries to take specific actions that are proven to be fast and effective at improving road safety and saving lives. This chapter discusses some of the key challenges countries face in doing so. Sustainable & Safe : A Vision and Guidance for Zero Road Deaths 55
60 Prioritizing Finances Allocating financial resources for integrated road safety management is a constant challenge. Some may argue that low- and middle-income countries cannot take a systemic approach because it is too expensive to enforce laws, design and build safe infrastructure, and establish other initiatives simultaneously. However, the limits to improved road safety performance are shaped less by cost and more by the road safety management system. It is the system that determines the results being sought and produces the interventions to achieve them (Bliss and Raffo 2013). Additional investment is needed in road safety, infrastructure, safe vehicles, and institutions. A report by the Commission for Global Road Safety notes that annual bilateral grant aid explicitly for road safety in low- and middle-income countries was less than $10 million in 2005 (CGRS 2005). The report called for an additional $300 million over 10 years, about 10 percent of multilateral funding of road infrastructure. The report also noted the absence of road safety in the Millennium Development Goals, which reduced its importance in global development finance agendas. In the last decade, international declarations from the United Nations, such as the UN Decade of Action, the SDGs, the Brasilia Declaration, and the New Urban Agenda, have encouraged more countries, especially developing countries, to demonstrate national-level leadership and adopt policies that make their roads safe for all. Multilateral institutions have made serious commitments to address the lack of road safety funding. In 2006 the World Bank set up its Global Road Safety Facility, the first global road safety fund of its kind. 3 It helps integrate safety into all Bank transport activity and provides support for capacity building and country-level safety plans. In 2016 the Bank added road safety to its social and environmental safeguards. Its inclusion means that all relevant projects will henceforth address road safety. Other development banks, such as the Asian Development Bank and the African Development Bank, as well as private philanthropies, such as Bloomberg Philanthropies and the FIA Foundation, have made significant commitments. In 2012 the large development institutions committed a total of US$175 billion to sustainable mobility over five years, a goal they are reportedly on track to meet. To leverage the greatest benefits from this financing, the banks should ensure that safety is an integral element of the mobility projects that receive this funding. A clear effort was made to do so in 2014, when the banks combined integrated road safety activities into the coordination of responsibilities for this financial commitment. A shared approach was already under way through the 2011 Multilateral Development Bank (MDB) Road Safety Initiative launched by the World Bank and the Global Road Safety Facility (AfDB et al. 2015). For their part, UN-related agencies and officials are proposing that the UN Road Safety Fund provide $7.7 billion of catalytic grant funding, which could leverage an additional $262 billion in road safety investments (UNECE 2016). The issue is often not the availability of funding but how funding is spent. A study by the International Road Assessment Program shows that only 1 3 percent of road construction budgets are needed to increase road safety, suggesting that the problem is more about awareness, perceptions, priorities, goals, and design than lack of resources (irap 2013). Studies show the benefits of shifting from costly urban highways to well-designed streets with safe, attractive public transport and pedestrian and bicycling infrastructure, which comes at a lower price (Bocarejo et al. 2012). Shifts in current transportation finances toward these more sustainable transportation modes can be made using existing financial flows (Lefevre et al. 2016a). Furthermore, speed reduction, one of the fastest and highest-impact ways of improving road safety, can be targeted in the short term through relatively inexpensive options such as lowering speed limits and targeting enforcement while processes are under way to improve road design (Job and Sakashita 2016b). Regarding vehicle design, the Global New Car Assessment Program reports that given the reduced costs of key technologies such as airbags and electronic stability control, it is simply not the case that safer cars are unaffordable (Global NCAP 2015). It should be possible for a typical small car to pass basic UN regulations at an extra cost of just US$200 (based on two airbags and some body strengthening) (Global NCAP 2015). Additional 56 WRI.org
.")
61 measures, such as antilock braking systems and electronic stability control, might cost an additional US$125. These sums are a small fraction of the cost of new vehicles in almost all markets (in India, for example, a car that lacks these safety measures costs roughly $6,000). As more vehicles include such features and productivity improves, costs will continue to fall. Strengthening Institutions and Frameworks The ultimate goal of road safety policies should be to empower the lead agency to take responsibility for a country s road safety performance and the direction of strategic partnerships targeted to improve it (Bliss and Raffo 2013). Building institutional leadership, capacity, and knowledge on road safety can be a challenge in low- and middle-income countries, which may lack strong institutions or established mechanisms for intersectoral cooperation. Engineers, planners, the police, and others may not have the information, resources, or authority to coordinate or implement a Safe System approach. Institutional progress is being made. As of 2015, 167 countries had lead agencies for national road safety efforts (WHO 2015), and the World Bank s Global Road Safety Facility had conducted almost 40 road safety management capacity reviews to guide the development of such agencies (GRSF 2016b). Another 131 countries have a partially or fully funded national strategy, and 68 have a strategy to reduce nonfatal injuries (WHO 2015). continuous funding and a comprehensive multisectoral approach led by the Ministry of Health (Cervantes-Trejo et al. 2016). Strengthening Laws, Regulations, and Guidelines Few developing countries have adequate road safety laws and regulations. A 2013 report by the World Health Organization found that less than 10 percent of the world s population lived in countries with comprehensive road safety laws that are part of a Safe System approach (WHO 2013a). Only 28 countries had comprehensive road safety laws that account for all five pillars of the Decade of Action. 4 Only 47 countries had speed laws that met best practices. Few countries have street design guides for specific urban or rural contexts. Although speed is critical to crash probability and severity, it is often ineffectively managed (Job and Sakashita 2016b). Few provincial-level governments or cities have road safety strategies, and in many cities enforcement of traffic regulations is so weak that there is little knowledge or motivation among road users to follow them. In many countries, vehicle safety is not effectively regulated through design standards or maintained through mandatory vehicle inspection schemes. The Global New Car Assessment Program is strongly advocating for better vehicle safety at the point of manufacture. The UN has identified an urgent need for all countries to adopt safety standards (WHO 2015, Global NCAP 2016). There are opportunities to craft Safe System strategies in countries where they do not exist, to strengthen existing Safe System strategies; and to spread such strategies to provincial, regional, state, and city levels. A vertically coordinated approach across multiple levels of government can help overcome institutional weaknesses or limits to capacity. For example, despite limited federal control over urban streets, Mexico reversed an upward trend in road fatalities between 2009 and 2012 by implementing an evidence-based action plan for road safety that targeted the highest-risk groups. This first sustained effort of national scope [involved]

62 58 WRI.org
63 CONCLUSION The key to real change in road safety is shifting responsibility from people who use the road to people who design, set policy, execute operations, and otherwise contribute to the mobility system. An overemphasis on victim behavior and personal responsibility has long relieved pressure on governments to take responsibility and act to protect their citizens. This mindset needs to change, in terms of both public expectation and political and professional perceptions of responsibility. Sustainable & Safe : A Vision and Guidance for Zero Road Deaths 59
64 The Safe System approach to road safety is the best and fastest way to reduce traffic fatalities. Its widespread application will be necessary to meet the SDG target of halving the number of global road deaths by Beyond saving lives, the approach yields many other benefits, including economic, health, and environmental improvements. A Safe System for all road users addresses wider land use and mobility patterns in addition to design, enforcement, education, vehicle safety, and emergency response. At its heart, the approach is about designing roads, vehicles, and any new mobility technology that enters the system to be forgiving of human fallibility. It does so by reducing speeds in rural and urban areas, crafting urban development policies that create safe new development as urbanization occurs, protecting bicyclists and pedestrians, designing roadways in rural areas and on highways that prevent head-on collisions, strictly enforcing road safety laws, ensuring that vehicles are safe, reducing post-crash response times, and much more. The approach requires ongoing revision and proactivity, as mobility is extremely dynamic. Adjustments may be needed over time as improvements are made, travel patterns shift, and technologies change. A huge body of evidence on the effectiveness of Safe System activity areas allows designers and authorities to adapt and implement them based on local knowledge. As the Safe System approach is refined and adapted in new contexts, additional research and local evidence will be generated. More extensive research is needed to identify which actions are most effective in low- and middle-income countries; comparative research and case studies are needed to offer lessons. Data and planning can help reorient existing mobility funds for more sustainable and safe outcomes. A vision of zero deaths is not just a slogan. It is a worthy ambition that acknowledges that traffic deaths are preventable when the many evidencebased measures outlined in this report are applied. A variety of means can protect the human body from life-threatening force. A Safe System approach to road safety must include capacity building for systems designers, improved governance systems, integrated plans, strong regulations and laws, and design standards. Without this supporting framework, the meaning of Safe System can get lost and the traditional approach of placing the bulk of responsibility on road users and limiting systemic solutions will continue to inhibit progress. The key to real change in road safety is shifting responsibility from people who use the road to people who design, set policy, execute operations, and otherwise contribute to the mobility system. An overemphasis on victim behavior and personal responsibility has long relieved pressure on governments to take responsibility and act to protect their citizens. This mindset needs to change, in terms of both public expectation and political and professional perceptions of responsibility. Reshaping entire systems for greater safety will not be easy. Doing so requires comprehensive institutional governance and management, ambitious targets, good data, economic analysis, priority setting and planning, and monitoring and evaluation of progress. Every country, state, and city needs to use data and stakeholder research to identify the greatest risk and priority areas to target for the fastest and most significant impacts while also working holistically to make the entire mobility system safe. For long-term change, an integrated approach that addresses all the action areas presented in this report will be necessary. The widespread implementation of road safety strategies based on a Safe System is the necessary response to the scale of death and injury taking place globally. 60 WRI.org

65 Sustainable & Safe : A Vision and Guidance for Zero Road Deaths 61
Physical inactivity as a major risk factor
 Physical inactivity as a major risk factor Worldwide, physical inactivity causes at least 6 10% NCDs (CHD, diabetes, breast and colon cancer)* Physical inactivity causes 9% premature mortality* In Europe,
Total points. Nation Men kayak Women kayak Men canoe Women canoe Total 600 BELARUS KAZAKHSTAN 54. Page 1 of 4. powered by memórias
 Total points Nation Men kayak Women kayak Men canoe Women canoe Total HUN HUNGARY 80 4 37 6 803 RUS RUSSIA 5 7 03 8 77 3 GER GERMANY 5 9 8 09 644 4 ESP SPAIN 06 76 0 98 600 5 BLR BELARUS 5 30 6 70 587
UEFA European Qualifying Competition for the 2020 FIFA Futsal World Cup. Draw Procedure & Coefficient Ranking
 UEFA European Qualifying Competition for the 2020 FIFA Futsal World Cup Draw Procedure & Coefficient Ranking UEFA European Qualifying Competition for the 2020 FIFA Futsal World Cup Preliminary & Main Round
Road Safety Pledge. Route to vision zero 2050 in Europe The Hague, June 14th, Malta. Luxembourg Lithuania Latvia Italy
 Malta Luxembourg Lithuania Latvia Italy Ireland The Netherlands Sweden Spain Slovenia Slovakia Romania Portugal Poland 1965 Road Safety Pledge Route to vision zero 2050 in Europe The Hague, June 14th,
The Economy of Finland
 The Economy of Finland Aug 30st 2013, Finnish Ministry of Foreign Affairs Presentation for the American Fulbright Grantees Petteri Rautaporras, Economist at the Federation of Finnish Technology Industries
Road Safety Vademecum
 Road Safety Vademecum Road safety trends, statistics and challenges in the EU 2010-2013 March, 2014 European Commission DG for Mobility and Transport Unit C.4 Road Safety Contents Summary of findings...
Medal Standing. WU23CH Linz-Ottensheim, AUT July As of 28 JUL INTERNET Service:
 Medal Standing Men G S B Total Women G S B Total Total G S B Total 1 GER - Germany 2 3 5 2 2 2 6 4 2 5 11 1 2 ITA - Italy 4 1 5 1 1 4 2 6 2 3 ROU - Romania 1 1 3 3 4 4 =5 4 USA - United States of America
Welcome. Eurocodes Implementation: Training JRC report
 Welcome Eurocodes Implementation: Training JRC report Artur Pinto Silvia Dimova Luisa Sousa Borislava Nikolova Joint Research Centre, European Commission J C Juncker (President Elect) 10 Political priorities
Medal Standing. ECH Seville, Spain 31 May - 2 June As of 2 JUN INTERNET Service: Men.
 Medal Standing Men Women Total 1 GER - Germany 2 1 2 5 1 3 4 3 4 2 9 1 2 ITA - Italy 1 1 1 3 1 1 2 2 1 2 5 =3 3 CZE - Czech Republic 1 1 2 1 1 2 1 3 =5 3 ROU - Romania 1 1 2 2 2 1 3 =5 5 DEN - Denmark
OVERALL STANDING WORLD ROWING CUP 2013
 OVERALL STANDING WORLD ROWING CUP 2013 Rk Nation Pts. SYD ETD LUC W2- M2- W2x M2x M4- W1x M1x LW2x LM2x LM4- W4x M4x W8+ M8+ 1 GBR 179 68 72 39 8 3 2 2 4 5 3 4 4 4 2 NZL 144 55 42 47 6 8 6 8 4 5 8 2 3
European Shooting Confederation. European Youth League Championship RULES
 European Shooting Confederation European Youth League Championship RULES 1. Events Mixed Team 10m Air Pistol Mixed Team 10m Air Rifle 1.1. Participants 1.1.1 Countries / Nations Each Member Federation
ZERO DRAFT OF THE BRASILIA DECLARATION ON ROAD SAFETY (VERSION PROPOSED BY BRAZIL DATED 26 MARCH 2015)
") ZERO DRAFT OF THE BRASILIA DECLARATION ON ROAD SAFETY (VERSION PROPOSED BY BRAZIL DATED 26 MARCH 2015) Second Global High-Level Conference on Road Safety: Time for Results Brasilia, 18-19 November 2015
ZERO DRAFT OF THE BRASILIA DECLARATION ON ROAD SAFETY (VERSION PROPOSED BY BRAZIL DATED 26 MARCH 2015) Second Global High-Level Conference on Road Safety: Time for Results Brasilia, 18-19 November 2015
Country fact sheet South Korea
 ESRA results Country fact sheet South Korea The ESRA project is a joint initiative of research institutes in 25 countries aiming at collecting comparable national data on road users opinions, attitudes
Road safety. REGIONAL COMMITTEE Provisional Agenda item 8.5. SEA/RC70/11 Malé, Maldives 6 10 September July Seventieth Session
 REGIONAL COMMITTEE Provisional Agenda item 8.5 Seventieth Session SEA/RC70/11 Malé, Maldives 6 10 September 2017 21 July 2017 Road safety Road traffic injuries constitute a major public health burden with
Safe System approach A beckoning perspective for children
 Plenary Session 1 Safe System approach A beckoning perspective for children Fred Wegman Emeritus Professor, Traffic Safety at Delft University of Technology, the Netherlands Traditional approach: for example
Relative age effect: a serious problem in football
 CIES Football Observatory Monthly Report Issue no. 10 - December 2015 Relative age effect: a serious problem in football Drs Raffaele Poli, Loïc Ravenel and Roger Besson 1. Introduction Numerous studies
III. Importance of Revenue Administration
 Outline of Presentation I. Trends in Revenue Mobilization II. Growth Friendly Tax Policy III. Importance of Revenue Administration 2 I. Trends in Revenue Mobilization Trends in Overall Revenues - Median
2 nd Road Safety PIN Conference 23 June 2008 Countdown to only two more years to act!
 2 nd Road Safety PIN Conference 23 June 2008 Countdown to 2010 - only two more years to act! EU ambition EU target to cut by 50% yearly road deaths between 2001 and 2010 Countries have similar national
TOWARDS A BIKE-FRIENDLY CANADA A National Cycling Strategy Overview
 TOWARDS A BIKE-FRIENDLY CANADA A National Cycling Strategy Overview NationalCyclingStrategFrameworkv3.indd 1 Potential for this modal shift can be found in municipalities of all sizes, in every population
Economics of Road Safety What does it imply under the 2030 Agenda for Sustainable Development?
 Presentation issued without formal editing FOR PARTICIPANTS ONLY 14 March 2017 ENGLISH ONLY UNITED NATIONS CENTRE FOR REGIONAL DEVELOPMENT In collaboration with Ministry of Public Works and Transport,
CEDR N5 Improvements in the field of Road Safety New trends in member states Road Safety strategies
 CEDR N5 Improvements in the field of Road Safety New trends in member states Road Safety strategies CEDR Strategic Plan 2013-2017 TD3 Network Management Thorshavn, Faroe Islands, March 30th 2016 Auður
CISM Friendship through Sport
 Conseil International du Sport Militaire International Military Sports Council - Netherlands Delegation - Regional Military Basketball Championship INVITATION CISM Friendship through Sport Dear Chiefs
DEVELOPMENT AID AT A GLANCE
 DEVELOPMENT AID AT A GLANCE STATISTICS BY REGION 5. EUROPE 2018 edition All the data in this report are available at: http://www.oecd.org/dac/financing-sustainable-development/ 5.1. ODA TO EUROPE - SUMMARY
FAQ sheet Dutch Cycling Embassy
 FAQ sheet Dutch Cycling Embassy Table of Contents Benefits of cycling... 2 The development of cycling in the Netherlands... 3 Accident liability... 4 Bicycle parking in the Netherlands... 4 E-bike & Speed
POLICY STATEMENT: VISION ZERO
 Overview of APBP Policy Statements POLICY STATEMENT: VISION ZERO The Association of Pedestrian and Bicycle Professionals (APBP) supports the community of professionals working to create more walkable,
MDB Road Safety Initiative: A Development Priority
 MDB Road Safety Initiative: A Development Priority Every six seconds, someone is killed or maimed on the world s roads. Over 90 percent of these injuries occur in low- and middle-income countries. The
Golf Participation Report for Europe 2018
 Golf Participation Report for Europe 218 Golf Advisory Practice in EMEA golfbenchmark.com 2 Golf Participation Report for Europe 218 Foreword Andrea Sartori Partner KPMG Global Head of Sports Foreword
WATERFRONT CONGRESS CENTRE
 ACHIEVING GLOBAL GOALS 2030 3RD GLOBAL MINISTERIAL CONFERENCE ON ROAD SAFETY WATERFRONT CONGRESS CENTRE STOCKHOLM 19 20 FEB 2020 SWEDEN TO HOST GLOBAL MINISTERIAL CONFERENCE ON ROAD SAFETY IN 2020 Sweden
7 th Annual Meeting of the Commission January, The Hague, The Netherlands. CMM on Commission Record of Fishing Vessels
 7 th Annual Meeting of the Commission 23-27 January, The Hague, The Netherlands COMM7-Prop05 Amend CMM 05-2016 on Commission Record of Fishing Vessels Submitted by: NEW ZEALAND Summary of the proposal:
A N N O U N C E M E N T
 Junior Grand Prix of Figure Skating Junior Grand Prix of Figure Skating Final 2018 / 19 A N N O U N C E M E N T INTERNATIONAL SKATING UNION 1. GENERAL The ISU Junior Grand Prix of Figure Skating comprises
EGYPT: a national decade of action for road safety
 EGYPT: a national decade of action for road safety 2011 2020 Egypt EGYPT Population: 75 497 913 Income group: Middle Gross national income per capita: $1 580 INSTITUTIONAL FRAMEWORK Lead agency Funded
THE PEP Partnership on Cycling
 THE PEP Partnership on Cycling Pan-European Master Plan for Cycling THE PEP Bureau Meeting, July 4 th /5 th, 2017 Robert Thaler Head of Division Mobility, Transport, Noise Austrian Federal Ministry of
A Road Safety Decade - The Case for Action
 A Road Safety Decade - The Case for Action Presentation by Dmitry Sambuk International Coordinator, Make Roads Campaign, FIA Foundation Monday 12 May 2009, Minsk, Republic of Belarus World Report on Road
EUROPEAN RIDERS, HORSES AND SHOWS AT THE FEI 2012
 EUROPEAN RIDERS, HORSES AND SHOWS AT THE FEI 2012 Presentation to the EEF Sports Forum Essen, 21 st March 2013 1 Introduction In 2010 the Small Nations Working Group started this study, to know exactly
Medal Standing. WCH Chungju, Korea 25 Aug - 1 Sept As of 1 SEP INTERNET Service: Women G S B Total.
 Medal Standing Rank Men G S B Total Women G S B Total Mixed G S B Total Total G S B Total 1 ITA - Italy 2 1 2 5 1 1 2 1 1 3 2 3 8 =1 2 AUS - Australia 1 2 3 1 1 2 1 1 3 2 1 6 5 3 GBR - Great Britain 1
Selection statistics
 Selection statistics ERASMUS+ Sport Call for proposals EAC-A05-2017 Selection year 2018 Collaborative Partnerships Small Collaborative Partnerships Not-for-profit European Sport Events Applications received
Road Safety: African Action Plan for the Global Decade of Action for Road Safety
 The First Ordinary Session of the African Union Specialized Technical Committee on Transport, Intercontinental and Interregional Infrastructures, Energy and Tourism THEME: Financing Infrastructure in Africa
Selection statistics
 Selection statistics ERASMUS+ Sport Call for proposals EAC-A03-2016 Selection year 2017 Collaborative Partnerships Small Collaborative Partnerships Not-for-profit European Sport Events Erasmus+ Applications
Vision Zero in Canada. 9 th International Conference on Urban Traffic Safety August 2017
 Vision Zero in Canada 9 th International Conference on Urban Traffic Safety August 2017 Parachute National charity focused on preventable injuries Vision: An injury-free Canada with Canadians living long
2. Context. Existing framework. The context. The challenge. Transport Strategy
 Transport Strategy Providing quality connections Contents 1. Introduction 2. Context 3. Long-term direction 4. Three-year priorities 5. Strategy tree Wellington City Council July 2006 1. Introduction Wellington
2016/17 UEFA European Under-17 and Under-19 Championships Qualifying round draws. 3 December 2015, Nyon, Switzerland
 2016/17 UEFA European Under-17 and Under-19 Championships Qualifying round draws 3 December 2015, Nyon, Switzerland DRAW PROCEDURE Qualifying rounds 16th UEFA European Under-17 and Under-19 Championships,
7 th Annual Meeting of the Commission January, The Hague, The Netherlands
 7 th Annual Meeting of the Commission 23 27 January, The Hague, The Netherlands COMM7 Report ANNEX 7a CMM for the Establishment of the Commission Record of Vessels authorised to fish in the Convention
Complete Streets 101: The Basics
 Complete Streets 101: The Basics Michigan Municipal League - Capital Conference March 21, 2017 Chip Smith, AICP - Senior Planner - Wade Trim Inc. and City Council member City of Ann Arbor 2017 MML Capital
Child- and Youth-friendly Land-use and Transport Planning Guidelines
 Child- and Youth-friendly Land-use and Transport Planning Guidelines Richard Gilbert Centre for Sustainable Transportation (In April 2006, the Centre moved from Toronto, Canada, to the University of Winnipeg)
Drawing of Lots Luxembourg, October 26, 2013
 Drawing of Lots Luxembourg, October 26, 2013 2015 CEV Volleyball European Championship Men 2015 CEV Volleyball European Championship Women 2014 CEV U19 Women Volleyball European Championship 2014 CEV U20
Introduction. 2
 Introduction In 2010, the United Nations General Assembly adopted Resolution 64/255 proclaiming 2011 2020 to be a Decade of Action for Road Safety. 1 In order to establish a baseline for the road safety
AREA TOTALS OECD Composite Leading Indicators. OECD Total. OECD + Major 6 Non Member Countries. Major Five Asia. Major Seven.
 Reference series Composite leading indicators OECD Composite Leading Indicators AREA TOTALS 7-03- 19 OECD Total 19 OECD + Major 6 Non Member Countries 19 Major Seven 19 Major Five Asia 19 Euro area 19
The African Road Safety Observatory
 Committee on Transportation in Tuesday, 15 January 2019 Washington D.C. The African Road Safety Observatory George Yannis 1, Antonino Tripodi 2, Luca Persia 2 1 National Technical University of Athens
ROAD TRAFFIC SAFETY IN BELARUS CURRENT SITUATION
 ROAD TRAFFIC SAFETY IN BELARUS CURRENT SITUATION Yuri VAZHNIK ian Association of Transport Experts and Surveyors BAES ian National Technical University Dzmitri NAVOI State Automobile Inspection of Ministry
New Road Safety Strategy Aims to Ensure Canada Has World s Safest Roads
 New Road Safety Strategy Aims to Ensure Canada Has World s Safest Roads OTTAWA, January 26, 2011 The Ministers Responsible for Transportation and Highway Safety have approved a new five year Road Safety
SUSTAINABILITY, TRANSPORT, & HEALTH. Ralph Buehler, Virginia Tech
 SUSTAINABILITY, TRANSPORT, & HEALTH Ralph Buehler, Virginia Tech Prepared for National Academies Roundtable on Science and Technology for Sustainability 6 December 2013 Overview Trends in Motorization
OVERALL STANDING WORLD ROWING CUP 2013
 OVERALL STANDING WORLD ROWING CUP 2013 Rk Nation Pts. SYD ETD LUC W2- M2- W2x M2x M4- W1x M1x LW2x LM2x LM4- W4x M4x W8+ M8+ 1 GBR 140 68 72 8 3 8 5 6 4 6 6 6 5 4 3 8 2 AUS 99 81 18 1 8 5 4 3 NZL 97 55
Launceston's Transport Futures. Greater travel options for the people of Launceston
 Launceston's Transport Futures Greater travel options for the people of Launceston Final Draft 13 Jan 2014 1 Page Number Executive summary 3 What is Transport Futures? 4 Vision 6 Economy, access and liveability
Setting Regional and National Road Safety Targets
 10 th Meeting of the United Nations Road Safety Collaboration 3-4 June 2009, Bangkok Setting Regional and National Road Safety Targets Commemorating 60 years in Thailand 1949-2009 Lives at stake people
ROAD SAFETY IN COUNTRIES WITH LESS DEVELOPED INFRASTRUCTURES: Policies to maximize effect with minimum resources
 ROAD SAFETY IN COUNTRIES WITH LESS DEVELOPED INFRASTRUCTURES: Policies to maximize effect with minimum resources Prof G. A. Giannopoulos Head, Hellenic Institute of Transport National Center for Research
2015 Victorian Road Trauma. Analysis of Fatalities and Serious Injuries. Updated 5 May Page 1 of 28. Commercial in Confidence
 2015 Victorian Road Trauma Analysis of Fatalities and Serious Injuries Updated 5 May 2016 Page 1 of 28 Commercial in Confidence VICROADS_n3445896_2015_Victorian_Trauma_Report_- _updated_may_2016.docx 2015
Implications of the Safe System Approach for young driver safety
 Implications of the Safe System Approach for young driver safety Professor Barry Watson Developing New Approaches to Prevent Young Driver Crashes: 11 May 2018 Overview Historical changes in the way we
SHARING GETS YOU FURTHER
 16-22 SEPTEMBER 2017 #MOBILITYWEEK SHARING GETS YOU FURTHER ABOUT EUROPEANMOBILITYWEEK is an annual campaign on sustainable urban mobility, organised with the political and financial support of the European
Manifesto for a safe, efficient and sustainable transport in NZ
 8 January 2018 Manifesto for a safe, efficient and sustainable transport in NZ Movement is an alliance of organisations working to achieve a safe, efficient and sustainable transport system that provides
THE PEP Partnership on Cycling Pan-European Master Plan for Cycling
 THE PEP Partnership on Cycling Pan-European Master Plan for Cycling International Cycling Conference, Mannheim, September 2017 THE PEP Relay Race Robert Thaler Head of Division Mobility, Transport, Noise
A N N O U N C E M E N T
 Junior Grand Prix of Figure Skating Junior Grand Prix of Figure Skating Final 2013 / 14 A N N O U N C E M E N T INTERNATIONAL SKATING UNION 1. GENERAL The ISU Junior Grand Prix of Figure Skating comprises
Recent Fiscal Developments and Outlook: The April 2014 IMF Fiscal Monitor Julio Escolano
 Recent Fiscal Developments and Outlook: The April 214 IMF Fiscal Monitor Julio Escolano Division Chief, Fiscal Policy and Surveillance Fiscal Affairs Department, IMF Joint Vienna Institute, Vienna, June,
Road Safety Initiatives at the International Transport Forum :
 Road Safety Initiatives at the International Transport Forum : IRTAD 2016 annual report Zero Road Deaths and Serious Injuries Report Safer City Streets Initiatives TRB Annual Meeting Joint IRTAD / NHTSA
Country fact sheet Germany
 Country fact sheet Germany ESRA 2015 results The ESRA project is a joint initiative of research institutes in 17 European countries aiming at collecting comparable national data on road users opinions,
Fibre to the Home: Taking your life to new horizons!
 Fibre to the Home: Taking your life to new horizons! Hartwig Tauber, Director General FTTH Council Europe Press Conference - Milan, 13 January 2011 FTTH Council Europe Photo by Nicolo Baravalle FTTH Council
A N N O U N C E M E N T
 Junior Grand Prix of Figure Skating Junior Grand Prix of Figure Skating Final 2012 / 13 A N N O U N C E M E N T INTERNATIONAL SKATING UNION 1. GENERAL The ISU Junior Grand Prix of Figure Skating comprises
Max Sort Sortation Option - Letters
 Max Sort Sortation Option - Letters Western Europe Prices Product Code PS5 PS6 Austria* 0.330 7.550 0.330 7.400 Belgium* 0.370 3.700 0.370 3.540 Denmark* 0.620 5.350 0.620 4.215 Finland* 0.385 4.400 0.385
Beer statistics edition. The Brewers of Europe
 Beer statistics 2015 edition The Brewers of Europe Beer statistics 2015 edition The Brewers of Europe Editor: Marlies Van de Walle October 2015 ISBN 978-2-9601382-5-2 EAN 9782960138252 1 TABLE OF CONTENTS
Fact sheets on sustainable development goals: health targets. Road Safety
 SDG target 3.6: by 2020, halve the number of global deaths and injuries from road traffic accidents. SDG target 11.2: by 2030, provide access to safe, affordable, accessible and sustainable transport systems
FIRST DRAFT OF THE BRASILIA DECLARATION ON ROAD SAFETY
 FIRST DRAFT OF THE BRASILIA DECLARATION ON ROAD SAFETY (Version proposed by Brazil dated 28 May 2015) *DOCUMENT AS SHOWN ON SCREEN ON FRIDAY 5 JUNE 2015 AT 15:00* Second Global High-level Conference on
Table 34 Production of heat by type Terajoules
 Table 34 Production of heat by type Table Notes geo represents heat used directly for district heating, agriculture etc. without a commercial transaction taking place. represents heat used for the production
2013 Summer Deaflympics Team Sports Preliminary Registration (Deadline - 28 January 2011)
") Team Sports Country Basketball Football Volleyball Basketball Football Volleyball team sports Algeria (ALG) X Argentina (ARG) X X X X Armenia (ARM) X Australia (AUS) X X X X X X Austria (AUT) X Azerbaijan
Team Sports Country Basketball Football Volleyball Basketball Football Volleyball team sports Algeria (ALG) X Argentina (ARG) X X X X Armenia (ARM) X Australia (AUS) X X X X X X Austria (AUT) X Azerbaijan
THE WORLD COMPETITIVENESS SCOREBOARD 2011
 THE WORLD COMPETITIVENESS SCOREBOARD 2011 98.557 94.063 92.588 92.011 90.782 90.219 89.259 87.824 86.475 86.418 86.313 85.707 84.380 84.120 81.629 81.619 81.100 80.278 79.799 78.499 77.599 77.101 76.827
TRANSPORTATION ENGINEERING AND PLANNING Vol. I - Safety of Transportation - Benekohal R.F.
 SAFETY OF TRANSPORTATION Benekohal R.F. University of Illinois at Urbana-Champaign,USA Keywords: transportation safety, traffic safety, highway accidents, road fatality and injury, roadway crashes, driver
1 Road and HGV danger in London. Hannah White, Freight & Fleet Programme Manager November 2017
 1 Road and HGV danger in London Hannah White, Freight & Fleet Programme Manager November 2017 2 London and its transport networks London: 8.6m residents + 30m visitors 30m journeys per day 6.3m by bus
OCEAN2012 Fish Dependence Day - UK
 OCEAN2012 Fish Dependence Day - UK Europeans are now so dependent on fish products originating from external waters that half the fish they consume are sourced outside the EU Fish dependence: The EU s
2016/17 UEFA European Women s Under 17 and Women s Under 19 Championships Qualifying draws
 2016/17 UEFA European Women s Under 17 and Women s Under 19 Championships Qualifying draws 13 November 2015, Nyon, Switzerland DRAW PROCEDURE Qualifying rounds UEFA European Women s Under-17 and Women
Citizens Advisory Committee March 26, 2014
 Memorandum 0..1 Citizens Advisory Committee March, 1 Citizens Advisory Committee Maria Lombardo Chief Deputy for Policy and Programming Elizabeth Sall Interim Deputy Director for Planning Vision Zero Committee
Road safety training for professional drivers: worldwide practices
 International Conference on Traffic Safety: The impact of Education and Training on Traffic Behaviour Abu Dhabi, UAE 1-2 November, 2017 Road safety training for professional drivers: worldwide practices
Growth Strategies and Dynamics in Developing Countries. Michael Spence Hamilton Project/CGD Forum Washington D.C. April 14, 2008
 Growth Strategies and Dynamics in Developing Countries Michael Spence Hamilton Project/CGD Forum Washington D.C. April 14, 2008 1 The Focus The subject is sustained high inclusive growth and the policies,
23 November 2018, Nyon, Switzerland. 2019/20 UEFA European Women s Under-17 and Women s Under-19 Championships. Qualifying round draws
 23 November 208, Nyon, Switzerland 209/20 UEFA European Women s Under-7 and Women s Under-9 Championships Qualifying round draws DRAW PROCEDURE Qualifying rounds 3th UEFA European Women s Under-7 and 9th
UEFA Nations League 2018/19 League Phase Draw Procedure
 Date and time: Wednesday, 24 January 2018 Place: Duration: Regulations: Participants: Objective: Seeding: Lausanne, Switzerland approx. 40 minutes for technical part Art. 12-13 of the competition regulations
THE IRAP ROAD SAFETY TOOLKIT A WEBSITE-BASED APPROACH TO ADDRESSING ROAD SAFETY PROBLEMS
 THE IRAP ROAD SAFETY TOOLKIT A WEBSITE-BASED APPROACH TO ADDRESSING ROAD SAFETY PROBLEMS Blair TURNER Principal Research Scientist, Safe Systems Division ARRB Group Ltd 500 Burwood Highway, Vermont South,
TARGETING CITIES AND COUNTRIES REBECCA BAVINGER, MPA SEPTEMBER 21, 2016
 TARGETING CITIES AND COUNTRIES REBECCA BAVINGER, MPA SEPTEMBER 21, 2016 BLOOMBERG PHILANTHROPIES PUBLIC HEALTH PROGRAMS Tobacco Control 2007-2016 Road Safety 2007-2019 Maternal and Reproductive Health
The road transport system is an open and complex system. Vision Zero The Basics
 TMALL 0146 Presentation widescreen engelsk v 1.0 2017-11-07 Vision Zero The Basics Anders Lie Specialist, Trafikverket The road transport system is an open and complex system Infrastructure Vehicles Road
We believe the following comments and suggestions can help the department meet those goals.
 The Honorable Secretary Anthony Foxx The Secretary of Transportation United States Department of Transportation 1200 New Jersey Avenue, SE Washington, DC 20590 August 30, 2013 Dear Secretary Foxx, Thank
Film Guide for Educators. Designing for Safety
 Film Guide for Educators Designing for Safety Designing For Safety Key Concepts Speeding While Driving Speeding is the number one cause of injuries and deaths from driving. The main reasons are because
Improving Global Road Safety
 United Nations Regional Commissions Improving Global Road Safety Setting Regional and National Road Traffic Casualty Reduction Targets Report and Recommendations United Nations Regional Commissions Report
CIES Football Observatory Monthly Report Issue 28 - October Performance and playing styles in 35 European football leagues. 1.
 CIES Football Observatory Monthly Report Issue 28 - October 2017 Performance and playing styles in 35 European football leagues Drs Raffaele Poli, Loïc Ravenel and Roger Besson 1. Introduction The analysis
Walking and Cycling Action Plan Summary. A Catalyst for Change The Regional Transport Strategy for the west of Scotland
 Walking and Cycling Action Plan Summary A Catalyst for Change The Regional Transport Strategy for the west of Scotland 2007-2021 Strathclyde Partnership for Transport Contents Purpose...2 Issues, Constraints
España, Portugal + Important roads of Europe 2012 FX
 1 Road coverage CD-ROM 1 CD-ROM 2 ~100 % detailed street Important road of Europe 2 Sales arguments CD-ROM 1 provides updated navigation data with a superior coverage of ~100 % of all roads in Spain incl.
Delivering Accident Prevention at local level in the new public health system
 1 Safety issue accidents don t have to happen Delivering Accident Prevention at local level in the new public health system Part 2: Accident prevention in practice Raise awareness Fact Sheet Road casualties
SECTION 1. The current state of global road safety
 SECTION 1 The current state of global road safety The number of road traffic deaths each year has not increased but remains unacceptably high at 1.24 million per year. Many countries have successfully
International Journal of Research (IJR) Vol-1, Issue-8, September *
 Vol-1, Issue-8, September *") Development towards Sustainable Transportation Planning in India through Management of Non-motorized Transport Akshay Patil 1 * & 2 * 1 3 rd year B. Tech Planning student at College of Engineering Pune,
Development towards Sustainable Transportation Planning in India through Management of Non-motorized Transport Akshay Patil 1 * & 2 * 1 3 rd year B. Tech Planning student at College of Engineering Pune,
Road Safety Institute Panos Mylonas
 Road Safety Institute Panos Mylonas UN ECOSOC Consultative Status European Citizen s Award SCOUTING FOR GLOBAL ROAD SAFETY ACTIONS FOR YOUTH Vassiliki Danelli-Mylona President of R.S.I. Panos Mylonas Geneva,
European Values Study & World Values Study - Participating Countries ( )
") GESIS Data Archive for the Social Sciences http://www.gesis.org/en/home/ ASEP/JD Data Archive http://www.jdsurvey.net/jds/jdsurvey.jsp European Values Study & World Values Study - Participating Countries
GESIS Data Archive for the Social Sciences http://www.gesis.org/en/home/ ASEP/JD Data Archive http://www.jdsurvey.net/jds/jdsurvey.jsp European Values Study & World Values Study - Participating Countries
Climate Change Action Plan: Transportation Sector Discussion Paper: Cycling
 Climate Change Action Plan: Transportation Sector Discussion Paper: Cycling ontario.ca/climatechange Contents 1. Minister of Transportation s message... 3 2. Introduction... 5 3. Sector Overview and Support
The Road Safety Performance Review Case of Albania
 The Road Safety Performance Review Case of Albania Albania is a Constitutional Parliamentary Republic located in the Southeastern Europe. It is bordered by land with Montenegro in the north west, north
Working for a world free of road crash death and injury
 Working for a world free of road crash death and injury Presentation Outline What makes a road user vulnerable? Who is a Vulnerable Road User? What can be done to protect Vulnerable Road Users? Goal 3:
RUGBY EUROPE COMPETITIONS CALENDAR 2017 / 2018
 RUGBY EUROPE COMPETITIONS CALENDAR 2017 / 2018 Competitions calendar 2017-2018 updated on February 7th 15-a-side Men Senior Competitions Competing Teams Details (dates and venues) North South North South