Annex 3. Rod and net catches; and juvenile salmon and trout data
|
|
|
- Miles Stokes
- 6 years ago
- Views:
Transcription
1 Annex 3. Rod and net catches; and juvenile salmon and trout data Annex 3. Rod and net catches; and juvenile salmon and trout data This Annex presents a catchment by catchment summary of the net and rod catch statistics for all of the principal salmon and sea trout rivers. It also presents the results of the juvenile salmonid monitoring programme for the 32 surveyed catchments in Wales. A Wales-wide summary is also shown of the rod catches and juvenile salmonid populations and trends. Details of how these data are collected are given below. Nets Net (and rod) licencees in E&W have a statutory duty to submit annual catch returns. For net fisheries this includes daily information on tides fished, the number of salmon and sea trout caught and their individual weights. Since the introduction of carcass tags in 29 to control the sale of illegally caught fish, these details have had to be recorded in a log book along with the number of the carcass tag applied to each fish. Net catch records (1975 to 215) for salmon and sea trout are given here where a fishery is or was active on a river. Numbers are from the official reported catch, and no correction is made for under-reporting or illegal fishing. Rods A national rod licence for salmon and migratory trout has been in place in E&W since This and an associated catch return and reminder system has operated since that time and is one of the most consistent and comprehensive catch recording systems in Europe. The national catch recording system replaces a series of regional and river based systems of variable quality some of which extend back to the 19s or earlier. The national catch recording system provides information on each fish caught as well as the activity of fishermen. This includes: weight of individual fish whether killed or released date and river of capture method of capture (fly/spin/bait) total number of days fished each season Rod catch records for salmon and sea trout given here are from 1975 to 215; they are declared catches from licence returns and are not corrected for under-reporting. The exception to this is the river Wye, where owners returns are used due to a more complete record. Catch and release has only been reported since 1993, figures before this date are for total catch - killed and released.
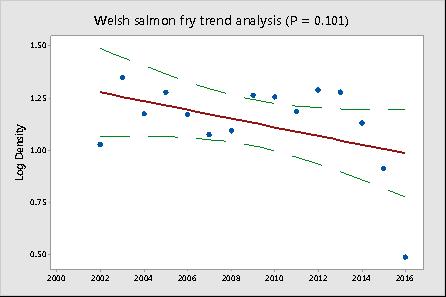
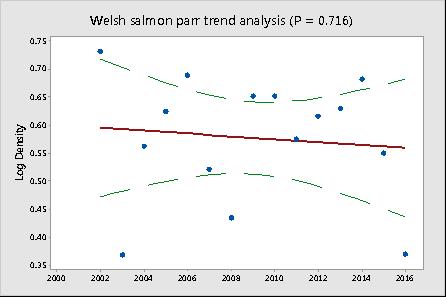
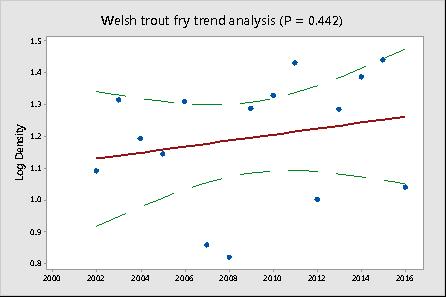
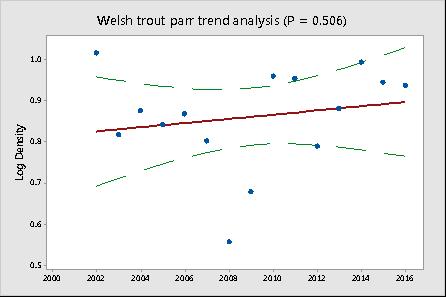
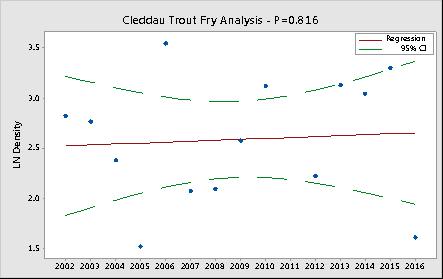
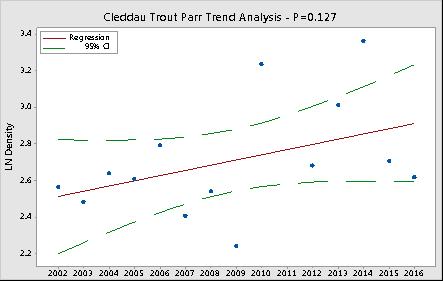
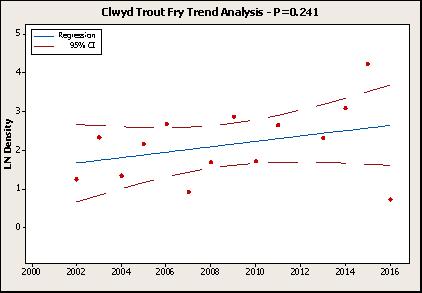
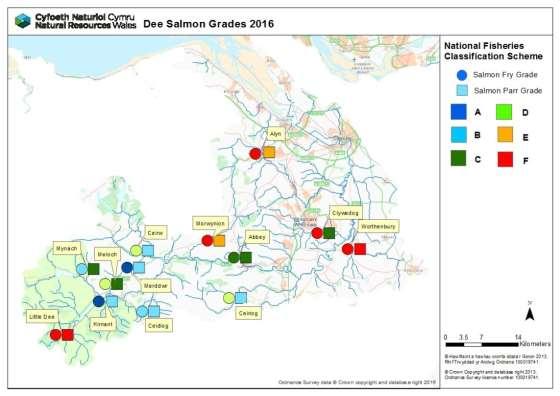
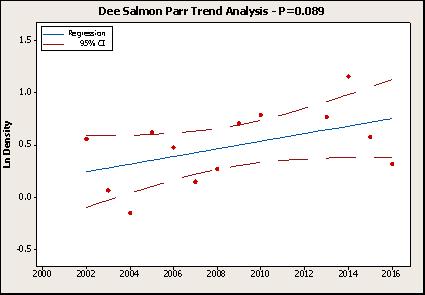
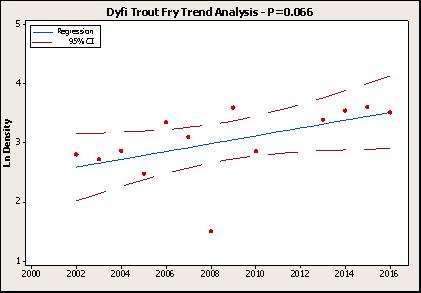
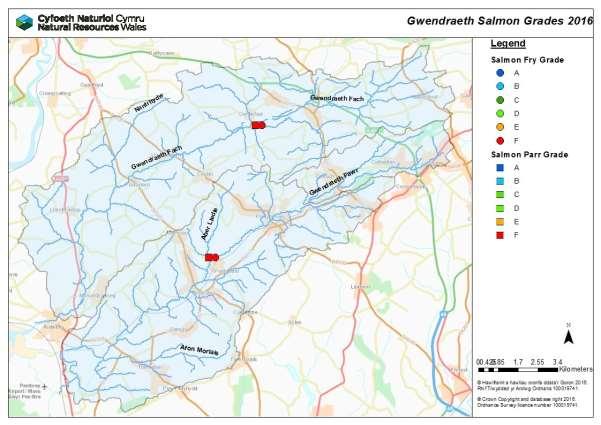
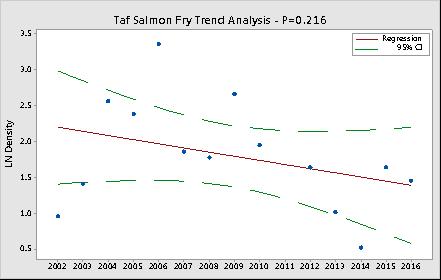
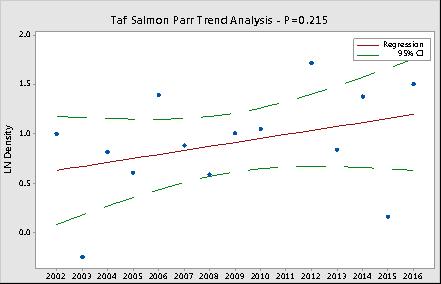
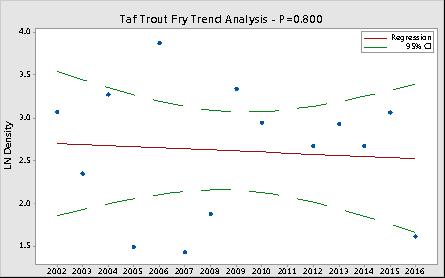
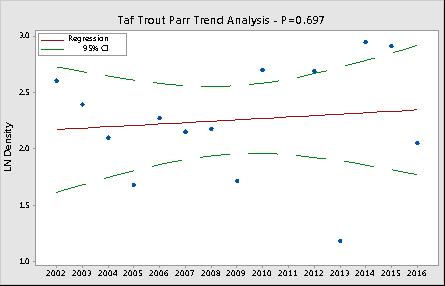
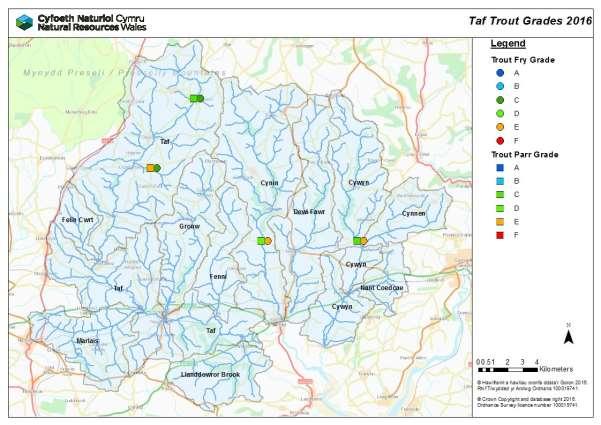
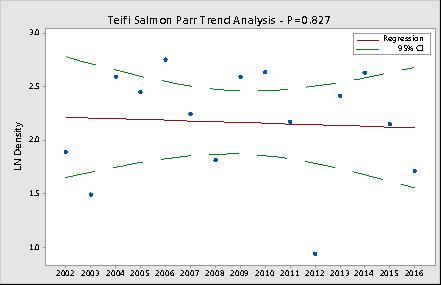
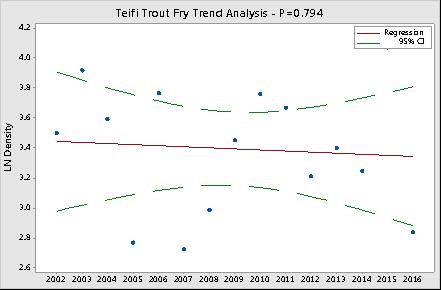
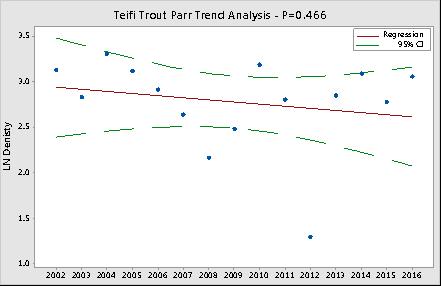
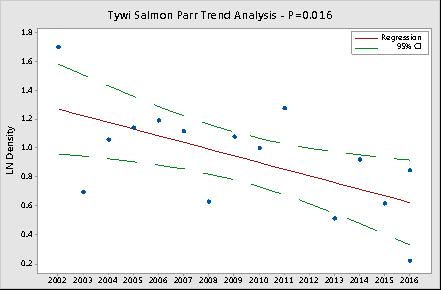
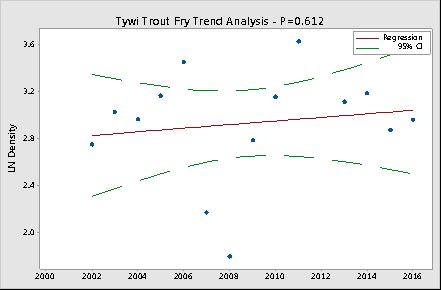
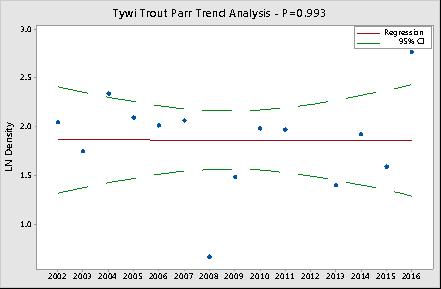
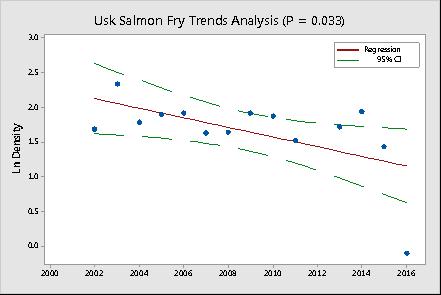
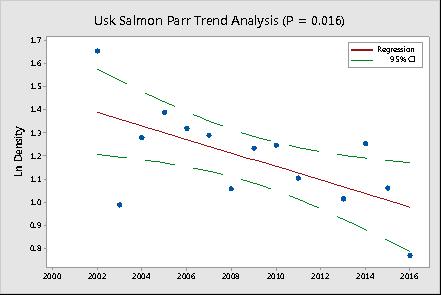
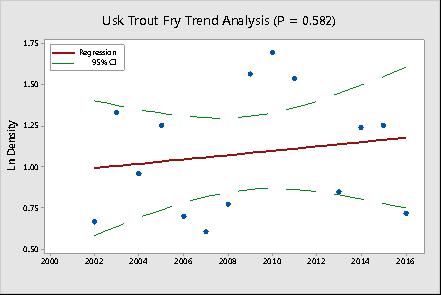
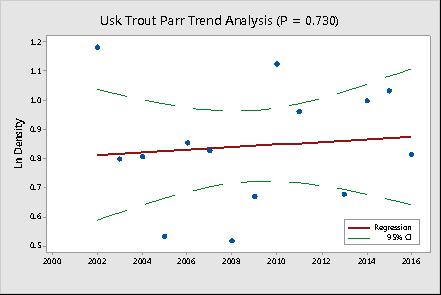
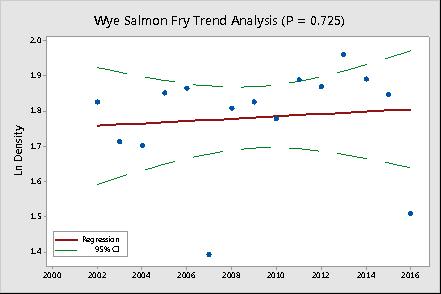
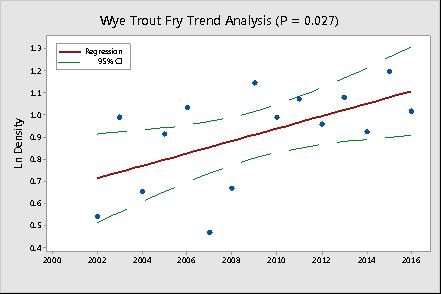
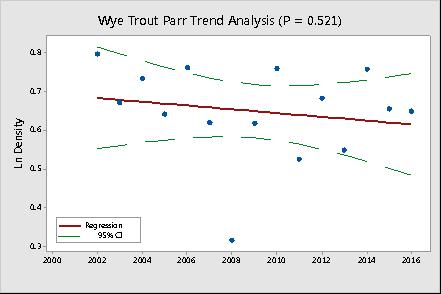
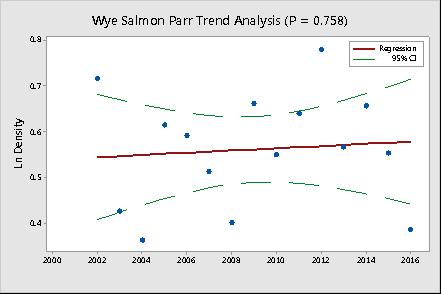
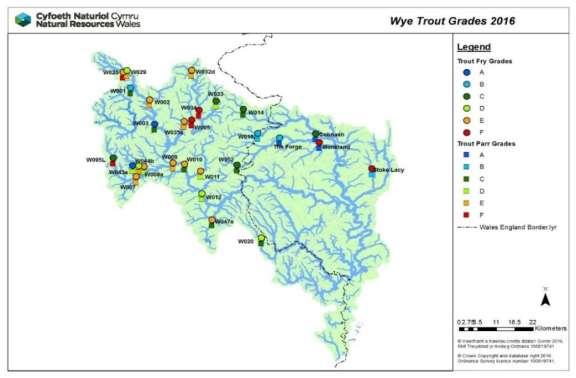
2 Annex 3. Rod and net catches; and juvenile salmon and trout data Juvenile salmonid classifications 216 The monitoring programme comprises Temporal surveys - a number of fixed sites surveyed annually; and Spatial surveys considerable more sites spread across the catchment and surveyed every 6 years as a snapshot of fish populations. The number of sites in the temporal and spatial programmes varies between catchments and is related to the size of the catchment. Densities calculated from quantitative (3 run catch depletion) and semi-quantitative (single run) surveys are used to assign a classification for salmon fry (+) and parr (>+) and for trout fry (+) and >+ (parr and adults combined) at each site, from A Excellent through to F Fishless. The National Fish Classification (NFC) evaluates and compares the results of fish population surveys in a consistent manner; ranking survey data by comparing fish abundance at the survey sites with sites nationally where juvenile salmonids are present. The following table shows the values and classification of NFC. Grade Descriptor Interpretation A Excellent In the top 2% for a fishery of this type B Good In the top 4% for a fishery of this type C Fair In the middle 2% for a fishery of this type D Fair In the bottom 4% for a fishery of this type E Poor In the bottom 2% for a fishery of this type F Fishless No fish of this type present The maps below show the results of the routine juvenile salmonid population surveys from 216. Catchment population trends The graphs show a simple comparison of average salmon and trout densities across the catchments since 22; this is only shown for catchments with at least 4 annual monitoring sites. The data used are only from surveys of the same methodology at sites in the current Welsh monitoring programme. It is not necessarily the case that every site in the programme was done every year. A linear trend analyses using Minitab was carried out on each of these catchments and a statistical significance attached. The linear model fits a straight line to the data in order to determine whether a trend (upwards or downwards) is present in fish numbers over the timeframe. The statistical significance of the trend is denoted by the P value, P<.5 indicates statistical significance (where there is >95% confidence that the trend is not due to chance). The graphs presented show the trend line with associated confidence intervals. Know Your Rivers Reports For catchment specific information on fisheries statistics, including action plans, please refer to the Know Your Rivers reports on the Natural Resources Wales website.
3 Annex 3. Rod and net catches; and juvenile salmon and trout data 216 juvenile salmonid population survey results Routine monitoring in 216 revealed fry numbers, especially young salmon hatched in the spring of 216 at critically low levels on a number of principal catchments. These were rivers which had previously produced consistent salmon fry numbers. The maps (Figs 1a and 1b salmon; 2a and 2b trout) and Table 1 below show a comparison of these 216 juvenile survey results as compared to the 5-year average. The raw densities for sites in each catchment can be seen further on in this Annex. Many of these catchments only have 1 or 2 survey sites, and so certainty around trends is reduced, especially for example on the Rhymney where any variation in the very low numbers of salmon caught may result in big percentage differences Table juvenile salmon and trout results compared to the 5-year average River Salmon Trout No of + >+ + >+ Sites Aeron -93% -49% -65% 1% 2 Afan -47% -5% -8% -13% 2 Cleddau (East) -1% -1% -69% -38% 2 Cleddau (West) -43% -31% -94% -3% 2 Clwyd -1% -89% -89% 12% 5 Conwy -8% -28% 2% -25% 4 Dee -44% -1% -21% 4% 11 Dwyfawr -46% -84% -36% -85% 1 Dwyryd -49% -47% -65% 28% 1 Dyfi -95% -43% -7% -18% 4 Ely -9% -34% -64% 62% 1 Erch -1% -1% 57% 44% 1 Glaslyn -7% 7% -32% 37% 1 Gwendraeths -1% -1% -84% -22% 2 Loughor -1% -1% -69% -12% 1 Mawddach -8% -45% -28% 68% 2 Neath -1% -1% 17% -39% 2 Nevern -93% -4% -37% 98% 2 Ogmore -73% -7% -77% -33% 2 Ogwen -43% -43% -31% -3% 1 Rhiedol -1% % -43% 15% 1 Rhymney 983% 4% -13% 16% 2 Seiont 11% -3% -12% -3% 1 Severn -55% 11% -53% 3% 16 Taf -66% -3% -47% -4% 4 Taff -1% -1% 25% -49% 1 Tawe 12% 13% -44% -46% 2 Teifi -86% -33% -33% 25% 6 Tywi -82% -49% -81% -16% 13 Usk -97% -52% -67% -22% 13 Wye -58% -51% 2% 5% 24 Ystwyth -1% -1% -63% 79% 2
4 Annex 3. Rod and net catches; and juvenile salmon and trout data Figure 1a Change in salmon fry density Figure 1b Change in salmon parr density

5 Annex 3. Rod and net catches; and juvenile salmon and trout data Figure 2a Change in trout fry density Figure 2b Change in trout parr density
6 All Wales All Wales Salmon Rod Catch Salmon Killed Salmon Released All Wales Sea Trout Rod Catch Sea Trout Killed Sea Trout Released
7 Density fish/1m Density fish/1m2 All Wales Welsh Average Densities of Salmon Salmon >+ Salmon Welsh Average Densities of Trout Trout >+ Trout
8 All Wales
9 River Aeron 6 Aeron Salmon Rod Catch Rod Killed Rod Released Aeron Sea Trout Rod Catch Rod Killed Rod Released There is no salmon or sea trout net fishery on the Aeron

10 River Aeron
11 River Aeron Juvenile salmon and trout densities 211 to 216 (fish per 1m 2 ) River Site name Year Average ( ) % Change from 215 % Change from 5 year average Salmon Salmon Salmon Salmon Salmon Salmon Salmon Salmon Salmon + >+ + >+ + >+ + >+ + >+ + >+ + >+ + >+ + >+ Aeron - AE % -95% -46% Aeron - AE % + -85% -52% Average % 391% -93% -49% River Site name Year Average ( ) % Change from 215 % Change from 5 year average Trout Trout Trout Trout Trout Trout Trout Trout Trout + >+ + >+ + >+ + >+ + >+ + >+ + >+ + >+ + >+ Aeron - AE % 124% -54% -39% Aeron - AE % 28% -78% 48% Average % 49% -65% 1%
12 River Afan Afan Salmon Rod Catch Rod Killed Rod Released Afan Sea Trout Rod Catch Rod Killed Rod Released There is no salmon or sea trout net fishery on the Afan

13 River Afan
14 River Afan Juvenile salmon and trout densities 211 to 216 (fish per 1m 2 ) River Site name Year Average ( ) % Change from 215 % Change from 5 year average Salmon Salmon Salmon Salmon Salmon Salmon Salmon Salmon Salmon + >+ + >+ + >+ + >+ + >+ + >+ + >+ + >+ + >+ Afan - AF % 28% -29% 24% Pelenna - AF % % % -1% Average % 28% -47% -5% River Site name Year Average ( ) % Change from 215 % Change from 5 year average Trout Trout Trout Trout Trout Trout Trout Trout Trout + >+ + >+ + >+ + >+ + >+ + >+ + >+ + >+ + >+ Afan - AF % -54% -68% -18% Pelenna - AF % -14% -96% 8% Average % -42% -8% -13%
15 Cleddau Rivers (Eastern and Western) 4 Cleddau Salmon Rod Catch Cleddau Sea Trout Rod Catch Rod Killed Rod Released Rod Killed Rod Released 14 Cleddau Salmon Compass Net Catch Cleddau Sea Trout Compass Net Catch Salmon Sea trout
16 Density fish/1m Density fish/1m2 Cleddau Rivers (Eastern and Western) Cleddau Catchment Average Densities of Salmon Salmon >+ Salmon Cleddau Catchment Average Densities of Trout Trout >+ Trout


17 Cleddau Rivers (Eastern and Western)

18 Cleddau Rivers (Eastern and Western)
19 Cleddau Rivers (Eastern and Western) Juvenile salmon and trout densities 211 to 216 (fish per 1m 2 ) Catchment Cleddau (East) Cleddau (West) River - Site Name Year Average ( ) % Change from 215 % Change from 5 year average Salmon Salmon Salmon Salmon Salmon Salmon Salmon Salmon Salmon + >+ + >+ + >+ + >+ + >+ + >+ + >+ + >+ + >+ Afon Rhyd Afallen - EC % % % -1% Wern - EC % -1% -1% -1% Average % -1% -1% -1% Anghof - WC7A % -1% -36% -31% Trerhos - WC % -16% -1% -32% Average % -7% -43% -31% Catchment Cleddau (East) Cleddau (West) River - Site Name Year Average ( ) % Change from 215 % Change from 5 year average Trout Trout Trout Trout Trout Trout Trout Trout Trout + >+ + >+ + >+ + >+ + >+ + >+ + >+ + >+ + >+ Afon Rhyd Afallen - EC % -29% -87% -3% Wern - EC % -34% -34% -52% Average % -31% -69% -38% Anghof - WC7A % 87% -83% 1% Trerhos - WC % -32% -1% -46% Average % % -94% -3%
20 River Clwyd 3 Salmon rod catch, River Clwyd Sea Trout rod catch, River Clwyd Rod Killed Rod Released Rod Killed Rod Released 15 Salmon net catch, River Clwyd Sea Trout net catch, River Clwyd Sling net Sling net
21 Density fish/1m Density fish/1m2 River Clwyd Clwyd Catchment Average Densities of Salmon Salmon >+ Salmon Clwyd Catchment Average Densities of Trout Trout >+ Trout

22 River Clwyd

23 River Clwyd
24 River Clwyd Juvenile salmon and trout densities 211 to 216 (fish per 1m 2 ) 5 Year Average % Change from % Change from River Site ( ) year average Name Salmon Salmon Salmon Salmon Salmon Salmon Salmon Salmon Salmon + >+ + >+ + >+ + >+ + >+ + >+ + >+ + >+ + >+ Aled % -83% -1% -87% Clwyd % -81% -1% -86% Clywedog % -1% -1% -1% Elwy % 47% -1% -64% Ystrad % -1% -1% -1% Average % -81% -1% -89% River Site Name Year Average ( ) % Change from 215 % Change from 5 year average Trout Trout Trout Trout Trout Trout Trout Trout Trout + >+ + >+ + >+ + >+ + >+ + >+ + >+ + >+ + >+ Aled % -51% -98% -21% Clwyd % -12% -93% 48% Clywedog % 7% -75% 31% Elwy % 39% -97% 95% Ystrad % -73% -85% -61% Average % -2% -89% 12%
25 River Conwy Salmon rod catch, River Conwy Sea Trout rod catch, River Conwy Rod Killed Rod Released Rod Killed Rod Released 4 Salmon net catch, River Conwy Sea Trout net catch, River Conwy Net & Fixed engines Net & Fixed engines
26 Density fish/1m Density fish/1m2 River Conwy Conwy Catchment Average Densities of Salmon Salmon >+ Salmon Conwy Catchment Average Densities of Trout Trout >+ Trout

27 River Conwy

28 River Conwy
29 River Conwy Juvenile salmon and trout densities 211 to 216 (fish per 1m 2 ) Year Average ( ) % Change from 215 % Change from 5 year average River Salmon Salmon Salmon Salmon Salmon Salmon Salmon Salmon Salmon + >+ + >+ + >+ + >+ + >+ + >+ + >+ + >+ + >+ Lledr % 22% -75% 13% Merddwr % -39% -8% -79% 39.1 Nant Y Goron % 2% -96% 5% Roe % -45% -1% Average % 2% -8% -28% 5 Year Average % Change from % Change from ( ) year average River Trout Trout Trout Trout Trout Trout Trout Trout Trout + >+ + >+ + >+ + >+ + >+ + >+ + >+ + >+ + >+ Lledr % 43% 8% 65% Merddwr % -1% -88% -1% Nant Y Goron % -24% -32% -1% Roe % -45% 39% -3% Average % -42% 2% -25%
30 River Dee 12 Salmon rod catch, River Dee Sea Trout rod catch, River Dee Rod Killed Rod Released Rod Killed Rod Released Salmon net catch, River Dee Sea Trout net catch, River Dee Trammel & Seine Trammel & Seine
31 Density fish/1m Density fish/1m2 River Dee Dee Catchment Average Densities of Salmon Salmon >+ Salmon Dee Catchment Average Densities of Trout Trout >+ Trout
32 River Dee
33 River Dee
34 Juvenile salmon densities 211 to 216 (fish per 1m 2 ) River - Site Name River Dee Year Average ( ) % Change from 215 % Change from 5 year average Salmon Salmon Salmon Salmon Salmon Salmon Salmon Salmon Salmon + >+ + >+ + >+ + >+ + >+ + >+ + >+ + >+ + >+ Abbey Brook % 36% -79% -53% Ceidiog % 77% -52% 242% Ceiriog % -8% -94% -47% Ceirw % -21% -93% -38% Clywedog % -4% -1% -76% 284 Hirnant % 82% 72% 55% Little Dee % % -1% -1% Meloch % 71% -92% 21% Merddwr % 13% 46% -13% Morwynion % + -1% -76% 54 Mynach % -13% 5% 11% Average % 14% -44% -1%
35 Juvenile trout densities 211 to 216 (fish per 1m 2 ) River - Site Name River Dee 5 Year Average % Change from % Change from ( ) 215 year average Trout Trout Trout Trout Trout Trout Trout Trout Trout + >+ + >+ + >+ + >+ + >+ + >+ + >+ + >+ + >+ Abbey Brook % -1% -33% -72% Ceidiog % 17% -58% 2% Ceiriog % -33% -17% -41% Ceirw % -6% -21% -32% Clywedog % -16% -84% -15% Hirnant % 88% -2% 246% Little Dee % -22% -66% -13% Meloch % 151% -11% 82% Merddwr % 117% 24% 7% Morwynion % 99% -14% -31% Mynach % 17% -36% 112% Average % 31% -21% 4%
36 River Dwyfor 14 Salmon rod catch, River Dwyfor Rod Killed Rod Released 3 Sea Trout rod catch, River Dwyfor Rod Killed Rod Released There is no net fishery for salmon or sea trout on the Dwyfor

37 River Dwyfor
38 River Dwyfor Juvenile salmon and trout densities 211 to 216 (fish per 1m 2 ) River - Site Name Year Average ( ) % Change from 215 % Change from 5 year average Salmon Salmon Salmon Salmon Salmon Salmon Salmon Salmon Salmon + >+ + >+ + >+ + >+ + >+ + >+ + >+ + >+ + >+ Dwyfawr % -76% -46% -84% Year Average ( ) % Change from 215 % Change from 5 year average River Trout Trout Trout Trout Trout Trout Trout Trout Trout + >+ + >+ + >+ + >+ + >+ + >+ + >+ + >+ + >+ Dwyfawr % -87% -36% -85%
39 River Dwyryd Salmon rod catch, River Dwyryd Sea Trout rod catch, River Dwyryd Rod Killed Rod Released Rod Killed Rod Released 35 Salmon net catch, River Dwyryd Sea Trout net catch, River Dwyryd Seine Seine

40 River Dwyryd
41 River Dwyryd Juvenile salmon and trout densities 211 to 216 (fish per 1m 2 ) River Site name Year Average ( ) % Change from 215 % Change from 5 year average Salmon Salmon Salmon Salmon Salmon Salmon Salmon Salmon Salmon + >+ + >+ + >+ + >+ + >+ + >+ + >+ + >+ + >+ Teigl % 67% -49% -47% River Site name Year Average ( ) % Change from 215 % Change from 5 year average Trout Trout Trout Trout Trout Trout Trout Trout Trout + >+ + >+ + >+ + >+ + >+ + >+ + >+ + >+ + >+ Teigl % 148% -65% 28%
42 River Dyfi 7 Salmon rod catch, River Dyfi Sea Trout rod catch, River Dyfi Rod Killed Rod Released Rod Killed Rod Released 3 Salmon net catch, River Dyfi Sea Trout net catch, River Dyfi Seine Seine
43 Density fish/1m Density fish/1m2 River Dyfi Dyfi Catchment Average Densities of Salmon Salmon >+ Salmon Dyfi Catchment Average Densities of Trout Trout >+ Trout

44 River Dyfi

45 River Dyfi
46 River Dyfi Juvenile salmon and trout densities 211 to 216 (fish per 1m 2 ) River Site Name Year Average ( ) % Change from 215 % Change from 5 year average Salmon Salmon Salmon Salmon Salmon Salmon Salmon Salmon Salmon + >+ + >+ + >+ + >+ + >+ + >+ + >+ + >+ + >+ Crewi % -67% -1% -76% Dulas N % % % % Dyfi % -3% -94% -31% Iain % -1% -1% -1% Average % -24% -95% -43% River Site name Year Average ( ) % Change from 215 % Change from 5 year average Trout Trout Trout Trout Trout Trout Trout Trout Trout + >+ + >+ + >+ + >+ + >+ + >+ + >+ + >+ + >+ Crewi % -13% 13% 47% Dulas N % -49% 9% -47% Dyfi % -45% 39% -47% Iain % -12% -51% -16% Average % -29% -7% -18%
47 River Dysynni 35 Salmon rod catch, River Dysynni Sea Trout rod catch, River Dysynni Rod Killed Rod Released Rod Killed Rod Released Salmon net catch, River Dysynni Sea Trout net catch, River Dysynni Seine Seine

48 River Dysynni No surveys were carried out on the Dysynni during 216 due to high flows. The following maps show the juvenile salmonid survey data collected in 215.
49 River Dysynni Juvenile salmon and trout densities 211 to 216 (fish per 1m 2 ) Year Average ( ) % Change from 215 % Change from 5 year average River - Site Name Salmon Salmon Salmon Salmon Salmon Salmon Salmon Salmon Salmon + >+ + >+ + >+ + >+ + >+ + >+ + >+ + >+ + >+ Dysynni River - Site Name Year Average ( ) % Change from 215 % Change from 5 year average Trout Trout Trout Trout Trout Trout Trout Trout Trout + >+ + >+ + >+ + >+ + >+ + >+ + >+ + >+ + >+ Dysynni
50 River Glaslyn Salmon rod catch, River Glaslyn Sea Trout rod catch, River Glaslyn Rod Killed Rod Released Rod Killed Rod Released 8 Salmon net catch, River Glaslyn Sea Trout net catch, River Glaslyn Seine Seine

51 River Glaslyn
52 River Glaslyn Juvenile salmon and trout densities 211 to 216 (fish per 1m 2 ) River - Site Name Nant Gwynant Year Average ( ) % Change from 215 % Change from 5 year average Salmon Salmon Salmon Salmon Salmon Salmon Salmon Salmon Salmon + >+ + >+ + >+ + >+ + >+ + >+ + >+ + >+ + > % 22% -7% 7% River - Site Name Nant Gwynant Year Average ( ) % Change from 215 % Change from 5 year average Trout Trout Trout Trout Trout Trout Trout Trout Trout + >+ + >+ + >+ + >+ + >+ + >+ + >+ + >+ + > % + -32% 37%
53 River Gwendraeth 7 Gwendraeth Salmon Rod Catch Rod Killed Rod Released Gwendraeth Sea Trout Rod Catch Rod Killed Rod Released There is no salmon or sea trout net fishery on the Gwendraeth
54 River Gwendraeth
55 River Gwendraeth Juvenile salmon and trout densities 211 to 216 (fish per 1m 2 ) River Site name 5 Year Average % Change from % Change from ( ) year average Salmon Salmon Salmon Salmon Salmon Salmon Salmon Salmon Salmon + >+ + >+ + >+ + >+ + >+ + >+ + >+ + >+ + >+ Gwendraeth Fawr - GR % % -1% % Gwendraeth Fach - GH % % -1% -1% Average % % -1% -1% River Site name Year Average ( ) % Change from 215 % Change from 5 year average Trout Trout Trout Trout Trout Trout Trout Trout Trout + >+ + >+ + >+ + >+ + >+ + >+ + >+ + >+ + >+ Gwendraeth Fawr - GR % 13% -82% -3% Gwendraeth Fach - GH % -54% -1% -72% Average % 67% -84% -22%
56 River Gwyrfai Salmon rod catch, River Gwyrfai Rod Killed Rod Released Sea Trout rod catch, River Gwyrfai Rod Killed Rod Released There is no net fishery for salmon or sea trout on the Gwyrfai
57 River Gwyrfai
58 River Llyfni 9 Salmon rod catch, River Llyfni Rod Killed Rod Released 12 Sea Trout rod catch, River Llyfni Rod Killed Rod Released There is no net fishery for salmon or sea trout on the Llyfni
59 River Llyfni
60 River Loughor 7 Lougor Salmon Rod Catch Rod Killed Rod Released 6 Loughor Sea Trout Rod Catch Rod Killed Rod Released There is no net fishery for salmon or sea trout on the Loughor

61 River Loughor
62 River Loughor Juvenile salmon and trout densities 211 to 216 (fish per 1m 2 ) River Site Name Morlais - LO12 5 Year Average % Change from % Change from ( ) 215 year average Salmon Salmon Salmon Salmon Salmon Salmon Salmon Salmon Salmon + >+ + >+ + >+ + >+ + >+ + >+ + >+ + >+ + > % % -1% -1% River Site Name Morlais - LO12 5 Year Average % Change from % Change from ( ) year average Trout Trout Trout Trout Trout Trout Trout Trout Trout + >+ + >+ + >+ + >+ + >+ + >+ + >+ + >+ + > % 9% -69% -12%
63 River Mawddach Salmon rod catch, River Mawddach Sea Trout rod catch, River Mawddach Rod Killed Rod Released Rod Killed Rod Released 2 Salmon net catch, River Mawddach Sea Trout net catch, River Mawddach Seine Seine

64 River Mawddach
65 River Mawddach Juvenile salmon and trout densities 211 to 216 (fish per 1m 2 ) 5 Year Average % Change from % Change from River ( ) year average Site Name Salmon Salmon Salmon Salmon Salmon Salmon Salmon Salmon Salmon + >+ + >+ + >+ + >+ + >+ + >+ + >+ + >+ + >+ Eden % -25% -73% -48% Wnion % -57% -87% -51% Average % -42% -8% -45% 5 Year Average % Change from % Change from River ( ) year average Site Name Trout Trout Trout Trout Trout Trout Trout Trout Trout + >+ + >+ + >+ + >+ + >+ + >+ + >+ + >+ + >+ Eden % 16% -24% 211% Wnion % 96% -34% 28% Average % 25% -28% 68%
66 River Neath 12 Neath Salmon Rod Catch Rod Killed Rod Released Neath Sea Trout Rod Catch Rod Killed Rod Released There is no net fishery for salmon or sea trout on the Neath

67 River Neath
68 River Neath Juvenile salmon and trout densities 211 to 216 (fish per 1m 2 ) River Site Name 5 Year Average % Change from % Change from ( ) year average Salmon Salmon Salmon Salmon Salmon Salmon Salmon Salmon Salmon + >+ + >+ + >+ + >+ + >+ + >+ + >+ + >+ + >+ Nant Clwyd - NE % -1% -1% -1% Sychryd - NE7i % % % % Average % -1% -1% -1% River Site Name 5 Year Average % Change from % Change from ( ) year average Trout Trout Trout Trout Trout Trout Trout Trout Trout + >+ + >+ + >+ + >+ + >+ + >+ + >+ + >+ + >+ Nant Clwyd - NE % -4% -1% -8% Sychryd - NE7i % -78% 78% -87% Average % -26% 17% -39%
69 River Nevern Nevern Salmon Rod Catch Rod Killed Rod Released Nevern Sea Trout Rod Catch Rod Killed Rod Released There is no net fishery for salmon or sea trout on the Nevern

70 River Nevern
71 River Nevern Juvenile salmon and trout densities 211 to 216 (fish per 1m 2 ) River Site Name 5 Year Average % Change from % Change from ( ) year average Salmon Salmon Salmon Salmon Salmon Salmon Salmon Salmon Salmon + >+ + >+ + >+ + >+ + >+ + >+ + >+ + >+ + >+ Bryn Berian - NV % + 35% -73% Nevern - NV % 1% -1% 13% Average % 112% -93% -4% River Site Name 5 Year Average % Change from % Change from ( ) year average Trout Trout Trout Trout Trout Trout Trout Trout Trout + >+ + >+ + >+ + >+ + >+ + >+ + >+ + >+ + >+ Bryn Berian - NV % 93% -32% 97% Nevern - NV % 9% -42% 1% Average % 92% -37% 98%
72 River Ogmore Ogmore Salmon Rod Catch Rod Killed Rod Released Ogmore Sea Trout Rod Catch Rod Killed Rod Released There is no net fishery for salmon or sea trout on the Ogmore

73 River Ogmore
74 River Ogmore Juvenile salmon and trout densities 211 to 216 (fish per 1m 2 ) River Site Name Year Average ( ) % Change from 215 % Change from 5 year average Salmon Salmon Salmon Salmon Salmon Salmon Salmon Salmon Salmon + >+ + >+ + >+ + >+ + >+ + >+ + >+ + >+ + >+ Ogwr Fach - Og % -28% -95% -45% Ogwr Fawr - OG16A % -83% -55% -84% Average % -65% -73% -7% River Site Name Year Average ( ) % Change from 215 % Change from 5 year average Trout Trout Trout Trout Trout Trout Trout Trout Trout + >+ + >+ + >+ + >+ + >+ + >+ + >+ + >+ + >+ Ogwr Fach - Og % -27% -74% -36% Ogwr Fawr - OG16A % -7% -83% -28% Average % -21% -77% -33%
75 River Ogwen Salmon rod catch, River Ogwen Sea Trout rod catch, River Ogwen Rod Killed Rod Released Rod Killed Rod Released 35 Salmon net catch, River Ogwen Sea Trout net catch, River Ogwen Seine Seine

76 River Ogwen
77 River Ogwen Juvenile salmon and trout densities 211 to 216 (fish per 1m 2 ) 5 Year Average % Change from % Change from River ( ) year average Site Name Salmon Salmon Salmon Salmon Salmon Salmon Salmon Salmon Salmon + >+ + >+ + >+ + >+ + >+ + >+ + >+ + >+ + >+ Ogwen % -17% -43% -43% 5 Year Average % Change from % Change from River ( ) year average Site Name Trout Trout Trout Trout Trout Trout Trout Trout Trout + >+ + >+ + >+ + >+ + >+ + >+ + >+ + >+ + >+ Ogwen % -74% -31% -3%
78 River Rheidol Rheidol Salmon Rod Catch Rod Killed Rod Released Rheidol Sea Trout Rod Catch Rod Killed Rod Released There is no net fishery for salmon or sea trout on the Rheidol

79 River Rheidol
80 River Rheidol Juvenile salmon and trout densities 211 to 216 (fish per 1m 2 ) River Site Name Melindwr - RH1A River Site Name Melindwr - RH1A 5 Year Average % Change from % Change from ( ) year average Salmon Salmon Salmon Salmon Salmon Salmon Salmon Salmon Salmon + >+ + >+ + >+ + >+ + >+ + >+ + >+ + >+ + > % % -1% % Year Average ( ) % Change from 215 % Change from 5 year average Trout Trout Trout Trout Trout Trout Trout Trout Trout + >+ + >+ + >+ + >+ + >+ + >+ + >+ + >+ + > % 14% -43% 15%
81 River Rhymney 12 Salmon rod catch River Rhymney Rod Killed Rod Released 6 Sea Trout rod catch River Rhymney Rod Killed Rod Released There is no net fishery for salmon or sea trout on the Rhymney

82 River Rhymney
83 River Rhymney Juvenile salmon and trout densities 211 to 216 (fish per 1m 2 ) River Site Name Year Average ( ) % Change from 215 % Change from 5 year average Salmon Salmon Salmon Salmon Salmon Salmon Salmon Salmon Salmon + >+ + >+ + >+ + >+ + >+ + >+ + >+ + >+ + >+ Rhymney - R1b % % 117% % Rhymney Bargoed - R % % % % Average % % 983% 4% River Site Name 5 Year Average % Change from % Change from ( ) year average Trout Trout Trout Trout Trout Trout Trout Trout Trout + >+ + >+ + >+ + >+ + >+ + >+ + >+ + >+ + >+ Rhymney - R1b % 96% -17% 96% Rhymney Bargoed % 129% 27% 73% R5 Average % 121% -13% 16%
84 River Seiont 35 Salmon rod catch, River Seiont Sea Trout rod catch, River Seiont Rod Killed Rod Released Rod Killed Rod Released 6 Salmon net catch, River Seiont Sea Trout net catch, River Seiont Seine Seine

85 River Seiont
86 River Seiont Juvenile salmon and trout densities 211 to 216 (fish per 1m 2 ) River - Site Nant Peris Year Average % Change from % Change from ( ) year average Salmon Salmon Salmon Salmon Salmon Salmon Salmon Salmon Salmon + >+ + >+ + >+ + >+ + >+ + >+ + >+ + >+ + > % 25% 11% -3% River - Site Nant Peris Year Average % Change from % Change from ( ) year average Trout Trout Trout Trout Trout Trout Trout Trout Trout + >+ + >+ + >+ + >+ + >+ + >+ + >+ + >+ + > % + -12% -3%
87 River Severn 2 Salmon rod catch, River Severn Sea Trout rod catch, River Severn Rod Killed Rod Released Rod Killed Rod Released Salmon net catch, River Severn There is no net fishery for sea trout on the River Severn TOTAL (NETS & FIXED ENGINES)

88 River Severn
89 Juvenile salmon densities 211 to 216 (fish per 1m 2 ) River Severn Year Average ( ) % Change from 215 % Change from 5 year average River Site Name Salmon Salmon Salmon Salmon Salmon Salmon Salmon Salmon Salmon + >+ + >+ + >+ + >+ + >+ + >+ + >+ + >+ + >+ Banwy - Y Fron % 17% -8% 14% Bechan Brook - Aberbechan % -1% -31% -1% Cain - Green Hall % -52% -91% -57% Camlad - Forden Hospital % -6% 238% -38% Carno - Wig Bridge % 14% -84% -6% Clywedog - U/S Dieldre Conf % + -94% Dulas - Rank Cottage % 118% 1% 14% Gam - Cefnllys Uchaf % -7% -89% -7% Mule - Abermule % -17% Rhiew - New Mills % 23% -9% 54% Rhiew - RVLR % -35% -57% 61% Severn - Old Hall % -5% 55% -58% Tanat - Peddair Ffordd % 395% -75% 138% Tanat - U/S Llangynog STW % -1% -33% -1% Twrch - Dol y Gaseg % -25% -73% 31% Vyrnwy - Plas Dolanog Falls % -54% -83% -66% Average % -23% -55% 11%
90 Juvenile trout densities 211 to 216 (fish per 1m 2 ) River Severn Year Average ( ) % Change from 215 % Change from 5 year average River - Site Trout Trout Trout Trout Trout Trout Trout Trout Trout + >+ + >+ + >+ + >+ + >+ + >+ + >+ + >+ + >+ Banwy - Y Fron % 5% -79% 138% Bechan Brook - Aberbechan % -86% -1% -84% Cain - Green Hall % -63% 3% -35% Camlad - Forden Hospital % 13% % 81% Carno - Wig Bridge % + -1% + Clywedog - U/S Dieldre Conf % -87% 7% -87% Dulas - Rank Cottage % 26% -1% -26% Gam - Cefnllys Uchaf % -44% -1% -48% Mule - Abermule % 213% Rhiew - New Mills % 775% -63% 56% Rhiew - RVLR % -72% 44% Severn - Old Hall % -73% -78% -66% Tanat - Peddair Ffordd % % -74% -1% Tanat - U/S Llangynog STW % 18% -42% -28% Twrch - Dol y Gaseg % -65% -3% -48% Vyrnwy - Plas Dolanog Falls % -71% -1% -55% Average % -15% -53% 3%
91 River Taf 3 Taf Salmon Rod Catch Rod Killed Rod Released 7 Taf Sea Trout Rod Catch Rod Killed Rod Released There is no net fishery for salmon or sea trout on the Taf
92 Density fish/1m Density fish/1m2 River Taf Taf Catchment Average Densities of Salmon Salmon >+ Salmon Taf Catchment Average Densities of Trout Trout >+ Trout
93 River Taf
94 River Taf
95 River Taf Juvenile salmon and trout densities 211 to 216 (fish per 1m 2 ) 5 Year Average % Change from % Change from River Site ( ) year average Name Salmon Salmon Salmon Salmon Salmon Salmon Salmon Salmon Salmon + >+ + >+ + >+ + >+ + >+ + >+ + >+ + >+ + >+ Cynin - TA % -1% -1% -1% Cywyn - TA % 921% -1% 139% Taf - TA % 175% 28% -23% Tigen - TA34a % % -1% -1% Average % 292% -66% -3% 5 Year Average % Change from % Change from River Site ( ) year average Name Trout Trout Trout Trout Trout Trout Trout Trout Trout + >+ + >+ + >+ + >+ + >+ + >+ + >+ + >+ + >+ Cynin - TA % -67% -86% -58% Cywyn - TA % 15% -93% 32% Taf - TA % 25% -37% 32% Tigen - TA34a % -9% -31% -85% Average % -19% -47% -4%
96 Rivers Taff and Ely 12 Salmon rod catch River Taff Rod Killed Rod Released 3 Sea trout rod catch River Taff Rod Killed Rod Released There is no salmon or sea trout net fishery on the Taff or Ely
97 Rivers Taff and Ely Fish trap data Since a fish trap has been operated at either Blackweir or Radyr on the River Taff. Variable trapping effort has been extrapolated to give an annual estimate of Taff salmon and sea trout adult numbers, shown in the graphs below. It is this data that is used for the Egg Deposition Target compliance assessment, rather than the rod catch. Due to the installation of a hydropower system on Radyr weir there was no fish trapping in 215 or Salmon run estimate Sea trout run estimate
98 Cardiff Barrage fish counter data Rivers Taff and Ely Salmon passage through the Cardiff Bay Barrage, into the rivers Taff and Ely, is monitored by two Vaki Riverwatcher fish counters. One counter is situated on the main pass, the other on the auxiliary pass. Both counters have been generating data since 28, although the counters were running at a lower efficiency for these first two years, and so only data from 21 onwards is shown below. The primary route into the bay is through the main pass. A programme of validation has been carried out on the main pass counter and an assessment of fish passage up the sides of the fishway gate carried out - it is possible for fish to traverse the sides of the fishway gate at certain states of tides and enter the bay without passing through the counter. The numbers of salmon entering Cardiff Bay are estimated by adding together the counts from both the main pass (adjusted for counter efficiency and proportion of fish traversing the fishway gate) and the auxiliary pass. Some passage may occur via other routes (e.g. locks and sluices) but this is not considered to be significant. The main Vaki was down for the majority 212 and as such is excluded from this data set. Year Total run estimate for salmon

99 Rivers Taff and Ely
100 Rivers Taff and Ely Juvenile salmon and trout densities 211 to 216 (fish per 1m 2 ) Taff Ely River Site Name Year Average ( ) % Change from 215 % Change from 5 year average Salmon Salmon Salmon Salmon Salmon Salmon Salmon Salmon Salmon + >+ + >+ + >+ + >+ + >+ + >+ + >+ + >+ + >+ Taf Fechan - T % % -1% -1% Taff Fawr - T Average % -1% -1% -1% Nant Mychydd % -2% -9% -34% E1 Taff Ely River Site Name Year Average ( ) % Change from 215 % Change from 5 year average Trout Trout Trout Trout Trout Trout Trout Trout Trout + >+ + >+ + >+ + >+ + >+ + >+ + >+ + >+ + >+ Taf Fechan - T % -58% -4% -51% Taff Fawr - T Average % -61% 25% -49% Nant Mychydd % 3% -64% 62% E1
101 River Tawe 25 Tawe Salmon Rod Catch Rod Killed Rod Released 12 Tawe Sea Trout Rod Catch Rod Killed Rod Released There is no net fishery for salmon or sea trout on the Tawe

102 River Tawe
103 River Tawe Juvenile salmon and trout densities 211 to 216 (fish per 1m 2 ) River Site Name Year Average ( ) % Change from 215 % Change from 5 year average Salmon Salmon Salmon Salmon Salmon Salmon Salmon Salmon Salmon + >+ + >+ + >+ + >+ + >+ + >+ + >+ + >+ + >+ Cwm du - TW % 15% 225% 18% Tawe - TW % % -88% 8% Average % 41% 12% 13% River Site Name Year Average ( ) % Change from 215 % Change from 5 year average Trout Trout Trout Trout Trout Trout Trout Trout Trout + >+ + >+ + >+ + >+ + >+ + >+ + >+ + >+ + >+ Cwm du - TW % % -44% -1% Tawe - TW % -28% -44% -28% Average % -28% -44% -46%
104 River Teifi Teifi Salmon Rod Catch Teifi Sea Trout Rod Catch Rod Killed Rod Released Rod Killed Rod Released Teifi Salmon Net Catch Teifi Sea Trout Net Catch Seine Coracle Seine Coracle
105 River Teifi A DIDSON imaging sonar has been annually deployed at Glanteifi to monitor and enumerate salmon migration since 29. The overall aims of the Glanteifi salmon monitoring site is to provide data that can be used to: 1. Investigate the relationships between adult salmon migration and environmental factors such as river flow; 2. Provide stock assessment data for fisheries management. Combining the early season run estimate (from rod exploitation) and the DIDSON derived run estimate for July to November gives a total estimate of the salmon run into the Teifi for each year (see table below). Some fish may enter between January and March and again in December but this is likely to be minimal. Both the annual run estimates and the rod catches have shown a continuous decline since the first year of deployment in 21. Both the rod catch and run estimate for 214 are approximately a third of the estimate for 21, with the run estimate decreasing from 6,56 to 1,91 and the rod catch decreasing from 113 to 331. As such the extant rod exploitation rate has remained relatively constant over the period, with a minimum estimate of 16.1% in 211 and maximum of 18.5% in 212. Annual run estimates of salmon and rod exploitation at Glanteifi between 21 and 215 Year Early Season Estimate 1 DIDSON Derived Run Estimate 2 Total Run Estimate 3 Annual Rod Catch 4 Extant Rod Exploitation (%) NB - numbers may be rounded up to give whole fish figures 1 Early season estimate is based on early season rod catch, includes July prior to Salmon run estimates differ from those previously reported due to new species apportionment approach. 3 No estimate is available for December to March. 4 Figures adjusted for 1.1 licence return rate 21 to 214, and 1.36 for figures are provisional
106 Density fish/1m Density fish/1m2 River Teifi Teifi Catchment Average Salmon Densities Salmon >+ Salmon Teifi Catchment Average Trout Densities Trout >+ Trout

107 River Teifi

108 River Teifi
109 River Teifi Juvenile salmon and trout densities 211 to 216 (fish per 1m 2 ) River Site Name Year Average ( ) % Change from 215 % Change from 5 year average Salmon Salmon Salmon Salmon Salmon Salmon Salmon Salmon Salmon + >+ + >+ + >+ + >+ + >+ + >+ + >+ + >+ + >+ Brefi - TE % -3% -21% -16% Duar - TE % -62% -91% -49% Nant Bargoed - Te % -1% -1% -1% Ceri - TE % 67% -1% -5% Clywedog - TE25A % -38% -85% -58% Cych - TE % 51% -1% -86% Average % -31% -86% -33% 5 Year Average % Change % Change from River Site ( ) from 215 year average Name Trout Trout Trout Trout Trout Trout Trout Trout Trout + >+ + >+ + >+ + >+ + >+ + >+ + >+ + >+ + >+ Brefi - TE % -28% -24% -14% Duar - TE % 6% -72% 55% Nant Bargoed % -21% -75% -27% Te12 Ceri - TE % 136% -71% 234% Clywedog - TE25A % 8% -65% -1% Cych - TE % 176% 9% -11% Average % 3% -33% 25%
110 River Twyi 2 Tywi Salmon Rod Catch Tywi Sea Trout Rod Catch Rod Killed Rod Released Rod Killed Rod Released Tywi Salmon Net Catch Tywi Sea Trout Net Catch Seine Seine
111 Density fish/1m Density fish/1m2 River Twyi Tywi Catchment Average Densities of Salmon Salmon >+ Salmon Tywi Catchment Average Densities of Trout Trout >+ Trout

112 River Twyi

113 River Twyi
114 River Twyi Juvenile salmon densities 211 to 216 (fish per 1m 2 ) River Site Name 5 Year Average % Change from % Change from ( ) year average Salmon Salmon Salmon Salmon Salmon Salmon Salmon Salmon Salmon + >+ + >+ + >+ + >+ + >+ + >+ + >+ + >+ + >+ Alltwalis - TY % -48% -65% -62% Gwili - TY5A % 459% -1% 69% Gorlech - TY % -32% -1% -54% Melindwr - TY % + -84% 32% Dulas - TY % -1% -1% -1% Cennen - TY % -1% -1% -1% Gwydderig - TY35B % 141% -1% 57% Gwenlais - TY % -21% -55% -45% Gwenffrwd - TY % -1% -95% -1% Nant Pibwr - TYM33i % -1% % -1% Doethie - TYM % -99% 5% -99% Pysgotwr Fawr - TYWFD % -1% -74% -1% Average % -11% -82% -49%
115 River Twyi Juvenile trout densities 211 to 216 (fish per 1m 2 ) 5 Year Average % Change from % Change from ( ) year average River - Site Trout Trout Trout Trout Trout Trout Trout Trout Trout + >+ + >+ + >+ + >+ + >+ + >+ + >+ + >+ + >+ Alltwalis - TY % -83% -9% -77% Gwili - TY5A % 32% -98% -4% Gorlech - TY % 46% -92% -6% Melindwr - TY % 8% -77% -25% Dulas - TY % -85% -1% -92% Cennen - TY % % -91% -26% Gwydderig - TY35B % 2% -82% -65% Gwenlais - TY % 2% -43% 59% Gwenffrwd - TY % 68% -61% 21% Nant Pibwr - TYM33i % 111% -1% 22% Doethie - TYM % -1% -63% -1% Pysgotwr Fawr % -1% -91% -1% TYWFD3 Average % -1% -81% -16%
116 River Usk 15 Salmon rod catch, River Usk Sea Trout rod catch, River Usk Rod Killed Rod Released Rod Killed Rod Released Salmon net catch, River Usk Sea Trout net catch, River Usk Drift nets Putts / Putchers TOTAL (NETS & FIXED ENGINES)
117 Density fish/1m Density fish/1m2 River Usk Usk Catchment Average Densities of Salmon Salmon >+ Salmon Usk Catchment Average Densities of Trout Trout >+ Trout
118 River Usk
119 River Usk NB data shown here are from both the 216 salmonid temporal and eel index programmes
120 Juvenile salmon densities 211 to 216 (fish per 1m 2 ) River Site Name River Usk Year Average ( ) % Change from 215 % Change from 5 year average Salmon Salmon Salmon Salmon Salmon Salmon Salmon Salmon Salmon + >+ + >+ + >+ + >+ + >+ + >+ + >+ + >+ + >+ Usk - U % -16% -1% -28% Hydfer % -13% -1% -15% U2 Crai - U % -2% -97% -26% Senni - U % -9% -99% -45% Cilieni - U % -37% -99% -2% Bran - U % 45% -1% 2% Ysgir - U % -72% -99% -67% Honddu - U9 Menasgin - U1 Rhiangoll - U11 Grwyne Fawr - U12 Grwyne Fechan - U % -54% -1% -7% % -53% -1% -81% % + -1% -77% % -61% -1% -72% % -83% -1% -79% Tarell - U % -65% -82% -75% Average % -49% -97% -52%
121 Juvenile trout densities 211 to 216 (fish per 1m 2 ) River Usk Year Average ( ) % Change from 215 % Change from 5 year average River - Site Trout Trout Trout Trout Trout Trout Trout Trout Trout + >+ + >+ + >+ + >+ + >+ + >+ + >+ + >+ + >+ Usk - U % -29% -73% -6% Hydfer % -48% -5% -61% U2 Crai - U % + 58% Senni - U % -43% -17% -13% Cilieni - U % -23% -51% -22% Bran - U % -95% -78% -91% Ysgir - U % 3% -97% -9% Honddu - U9 Menasgin - U1 Rhiangoll - U11 Grwyne Fawr - U12 Grwyne Fechan - U % -77% -67% -51% % -57% -75% -31% % + -85% -55% % -15% -11% 46% % 23% -7% 32% Tarell - U % -13% -88% -12% Average % -37% -67% -22%
122 River Wye Salmon rod catch (owners returns) River Wye Sea Trout rod catch River Wye Rod Killed Rod Released Rod Killed Rod Released 2 Salmon net catch River Wye There is no sea trout net fishery on the Wye 5 TOTAL (NETS & FIXED ENGINES)
123 Density fish/1m Density fish/1m2 River Wye Wye Catchment Average Densities of Salmon Salmon >+ Salmon Wye Catchment Average Densities of Trout Trout >+ Trout
124 River Wye
125 River Wye
126 Juvenile salmon densities 211 to 216 (fish per 1m 2 ) River Site Name River Wye Yr Average ( ) % Change from 215 % Change from 5 yr Av. + >+ + >+ + >+ + >+ + >+ + >+ + >+ + >+ + >+ Dernol - W % -71% 19% -79% Marteg - W % % -58% -13% Llanwrthyl Dulas - W % -1% -56% -1% Ithon - W % + -58% -3% Clywedog - W % 68% -21% -4% South Dulas - Irfon - W % 118% -71% 59% Garth Dulas - W8a % -2% -51% -52% Chwerfri - W % -1% -74% -1% Duhonw - W % -7% 1% -12% Edw - W % -74% -59% -37% Sgithwen - W % -52% -87% -65% Lugg - W % % % % Hindwell Brook - W % % % % Honddu - W % % % % Wye - W % -26% -76% -33% Bidno - W % -43% -17% -31% Ithon - W32d % + 27% -48% Aran - W % + -94% -36% Nantmel Dulas - W35a % -75% -71% -76% Cammarch - W43a % 21% -44% 45% Einon - W44b % -1% -1% -1% Llynfi - W47e % % -1% % Arrow - W % % % -1% Irfon - W95L % -2% Average % -47% -58% -51% Note densities here are calculated from the first run only of the quantitative surveys in order that semi-quantitative surveys could also be included in the analysis. The densities are not directly comparable to the graphs above which use only fully quantitative surveys.
127 Juvenile trout densities 211 to 216 (fish per 1m 2 ) River Wye Yr Average ( ) % Change from 215 % Change from 5 yr Av River Site Name Trout Trout Trout Trout Trout Trout Trout Trout Trout + >+ + >+ + >+ + >+ + >+ + >+ + >+ + >+ + >+ Dernol - W % -36% -29% -43% Marteg - W % 33% -37% 78% Llanwrthyl Dulas - W % -38% -16% -44% Ithon - W % % % % Clywedog - W % -1% % 1% South Dulas - Irfon - W % % -64% 1% Garth Dulas - W8a % -16% -85% 151% Chwerfri - W % -71% -61% -77% Duhonw - W % -26% 9% 56% Edw - W % -58% 25% -26% Sgithwen - W % 59% 79% -24% Lugg - W % 18% -1% 21% Hindwell Brook - W % 11% 69% 131% Honddu - W % 25% 17% 73% Wye - W % % 83% 1% Bidno - W % -1% -79% 1% Ithon - W32d % + -29% 1% Aran - W % + -17% 78% Nantmel Dulas - W35a % 2% -32% -19% Cammarch - W43a % 126% -18% 178% Einon - W44b % -45% 62% -47% Llynfi - W47e % -26% 13% 55% Arrow - W % 27% 27% -38% Irfon - W95L % 1% Average % -8% 2% 5% Note densities here are calculated from the first run only of the quantitative surveys in order that semi-quantitative surveys could also be included in the analysis. The densities are not directly comparable to the graphs above which use only fully quantitative surveys.
128 River Ystwyth 7 Ystwyth Salmon Rod Catch Rod Killed Rod Released Ystwyth Sea Trout Rod Catch Rod Killed Rod Released There is no salmon or sea trout net fishery on the Ystwyth

129 River Ystwyth
SALMONID AND FRESHWATER FISHERIES STATISTICS FOR ENGLAND AND WALES, 2003
 SALMONID AND FRESHWATER FISHERIES STATISTICS FOR ENGLAND AND WALES, 2003 (Declared catches of salmon and migratory trout by rods, nets and other instruments) This report, prepared by the Environment Agencys
Know Your River - Clwyd Salmon & Sea Trout Catchment Summary
 Know Your River - Clwyd Salmon & Sea Trout Catchment Summary Introduction This report describes the status of the salmon and sea trout populations in the Clwyd catchment. Bringing together data from rod
THE NATURAL RESOURCES BODY FOR WALES WATER RESOURCES ACT 1991 THE WALES ROD AND LINE (SALMON AND SEA TROUT) BYELAWS 2017
 BYELAWS 2017") THE NATURAL RESOURCES BODY FOR WALES WATER RESOURCES ACT 1991 THE WALES ROD AND LINE (SALMON AND SEA TROUT) BYELAWS 2017 The Natural Resources Body for Wales in exercise of powers vested in it by section
THE NATURAL RESOURCES BODY FOR WALES WATER RESOURCES ACT 1991 THE WALES ROD AND LINE (SALMON AND SEA TROUT) BYELAWS 2017 The Natural Resources Body for Wales in exercise of powers vested in it by section
SALMON STOCKS AND FISHERIES IN ENGLAND AND WALES, Preliminary assessment for ICES, April 1998
 SALMON STOCKS AND FISHERIES IN ENGLAND AND WALES, 1997 Preliminary assessment for ICES, April 1998 1 ISBN: 97545 8 4 Acknowledgement: This report has been compiled jointly by staff from the CEFAS Salmon
Know Your River Conwy Salmon & Sea Trout Catchment Summary
 Know Your River Conwy Salmon & Sea Trout Catchment Summary Introduction This report describes the status of the salmon and sea trout populations in the Conwy catchment. Bringing together data from rod
Know Your River - Ogwen Salmon & Sea Trout Catchment Summary
 Know Your River - Ogwen Salmon & Sea Trout Catchment Summary Introduction This report describes the status of the salmon and sea trout populations in the Ogwen catchment. Bringing together data from rod
Know Your River Conwy Salmon & Sea Trout Catchment Summary
 Know Your River Conwy Salmon & Sea Trout Catchment Summary Introduction This report describes the status of the salmon and sea trout populations in the Conwy catchment. Bringing together data from rod
Know Your River Dee Salmon & Sea Trout Catchment Summary
 Know Your River Dee Salmon & Sea Trout Catchment Summary Introduction This report describes the status of the salmon and sea trout populations in the Dee catchment. Bringing together data from rod catches,
Know Your River - Clwyd Salmon & Sea Trout Catchment Summary
 Know Your River - Clwyd Salmon & Sea Trout Catchment Summary Introduction This report describes the status of the salmon and sea trout populations in the Clwyd catchment. Bringing together data from rod
Know Your River - River Ogmore Salmon and Sea Trout Catchment Summary
 Know Your River - River Ogmore Salmon and Sea Trout Catchment Summary Introduction This report describes the status of the salmon and sea trout populations in the Ogmore catchments. Bringing together data
Know Your River River Neath Salmon and Sea Trout Catchment Summary
 Know Your River River Neath Salmon and Sea Trout Catchment Summary Introduction This report describes the status of the salmon and sea trout populations in the Neath catchments. Bringing together data
Know Your River River Afan Salmon and Sea Trout Catchment Summary
 Know Your River River Afan Salmon and Sea Trout Catchment Summary Introduction This report describes the status of the salmon and sea trout populations in the Afan catchments. Bringing together data from
Salmon spawning report 2010
 Salmon spawning report 21 Midlands Region, West Julie Cowley, April 211 We are the Environment Agency. It's our job to look after your environment and make it a better place - for you, and for future generations.
Conservation Limits and Management Targets
 Conservation Limits and Management Targets Setting conservation limits The use of conservation limits (CLs) in England and Wales (E&W) has developed in line with the requirement of ICES and NASCO to set
North Wales Fisheries Byelaws
 North Wales Fisheries Byelaws Third LFAG consultation February 2011 Aims In July 2010 and November 2010 we consulted the Local Fishery Advisory Groups (LFAG) on proposals to change fishing byelaws in North
Know Your River River Loughor Salmon and Sea Trout Catchment Summary
 Know Your River River Loughor Salmon and Sea Trout Catchment Summary Introduction This report describes the status of the salmon and sea trout populations in the Loughor catchments. Bringing together data
Rod fishing byelaws 2018 A guide for anglers in Wales
 Rod fishing byelaws 2018 A guide for anglers in Wales To find out how you can help stop the spread of harmful invasive species visit: https://secure.fera.defra.gov.uk/nonnativespecies/home/index.cfm Introduction
In July 2010 we consulted the Local Fishery Advisory Groups (LFAG) on proposed changes to fishing byelaws in North Wales. The main aims were to:
 on proposed changes to fishing byelaws in North Wales. The main aims were to:") North Wales Fisheries Byelaws Second LFAG consultation November 2010 In July 2010 we consulted the Local Fishery Advisory Groups (LFAG) on proposed changes to fishing byelaws in North Wales. The main aims
North Wales Fisheries Byelaws Second LFAG consultation November 2010 In July 2010 we consulted the Local Fishery Advisory Groups (LFAG) on proposed changes to fishing byelaws in North Wales. The main aims
Fisheries Statistics Salmonid and freshwater fisheries statistics for England and Wales
 Fisheries Statistics 2000 Salmonid and freshwater fisheries statistics for England and Wales Salmonid and Freshwater Fisheries Statistics for England and Wales 1. Fisheries Statistics 1989 (out of print)
Usk Catchment 2013 Fishery Survey Report
 Usk Catchment 2013 Fishery Survey Report Sophie Gott Report TM/SE_A&R/14/18 The river Usk is one of the premier salmon rivers in Wales, with its fishery contributing significantly to the local economy.
Salmon Conservation Limits in England and Wales. Ian Davidson September 2013
 Salmon Conservation Limits in England and Wales Ian Davidson September 2013 Setting Conservation Limits (CLs): CLs are defined from two relationships: (i) A stock-recruitment (S-R) curve relating egg deposition
IP(08)05(rev) Fisheries Management Focus Area Report. European Union -UK (England and Wales)
05(rev) Fisheries Management Focus Area Report. European Union -UK (England and Wales)") IP(08)05(rev) Fisheries Management Focus Area Report European Union -UK (England and Wales) North Atlantic Salmon Conservation Organisation FOCUS AREA REPORT ON MANAGEMENT OF SALMON FISHERIES UK(England
IP(08)05(rev) Fisheries Management Focus Area Report European Union -UK (England and Wales) North Atlantic Salmon Conservation Organisation FOCUS AREA REPORT ON MANAGEMENT OF SALMON FISHERIES UK(England
FISHERIES STATISTICS 1998
 FISHERIES STATISTICS 1998 Salmonid and Freshwater Fisheries Statistics for England and Wales Salmonid and Freshwater Fisheries Statistics for England and Wales 1. Fisheries Statistics 1989 (out of print)
Ad Hoc Review Group IP(07)10 FINAL. Implementation Plan. European Union UK (England and Wales)
10 FINAL. Implementation Plan. European Union UK (England and Wales)") Ad Hoc Review Group IP(07)10 FINAL Implementation Plan European Union UK (England and Wales) NASCO Implementation Plan for Salmon Management in UK (England and Wales) 2006/07 to 2010/11 1. Introduction
Ad Hoc Review Group IP(07)10 FINAL Implementation Plan European Union UK (England and Wales) NASCO Implementation Plan for Salmon Management in UK (England and Wales) 2006/07 to 2010/11 1. Introduction
Fish population survey report
 Fish population survey report River Teme 2016 This report provides a summary of results from recent coarse fish population surveys on the River Teme between Tenbury Wells and Powick. The surveys were carried
Salmon population monitoring in England and Wales (E&W): Informing stock assessment and management
: Informing stock assessment and management") Salmon population monitoring in England and Wales (E&W): Informing stock assessment and management Salmon population monitoring in England and Wales (E&W): Informing stock assessment and management Fisheries
Salmon population monitoring in England and Wales (E&W): Informing stock assessment and management Salmon population monitoring in England and Wales (E&W): Informing stock assessment and management Fisheries
Technical case supporting a public consultation on proposals for new fishing controls to protect salmon and sea trout stocks in Wales.
 Technical case supporting a public consultation on proposals for new fishing controls to protect salmon and sea trout stocks in Wales. www.naturalresourceswales.gov.uk 2 P a g e About Natural Resources
River Ribble Net Limitation Order and Byelaw review Brian Shields, Senior Fisheries Technical Specialist
 River Ribble Net Limitation Order and Byelaw review 217 Brian Shields, Senior Fisheries Technical Specialist Darren Bedworth, Fisheries Technical Specialist, Cumbria and Lancashire i River Ribble Net Limitation
Ecological Appraisal Monitoring ecosystems; identifying pollution causes & impacts
 Ecological Appraisal Monitoring ecosystems; identifying pollution causes & impacts Major issues over the last 3 months: Arctic Charr monitoring in Llyn Padarn Seine netting in North Wales estuaries Llyn
N PA- fi sn e< i 3. National Rivers Authority SEA TROUT IN ENGLAND AND WALES FISHERIES TECHNICAL REPORT
 N PA- fi sn e< i 3 N R A National Rivers Authority SEA TROUT IN ENGLAND AND WALES FISHERIES TECHNICAL REPORT 1 ASIANTAETH YR AMGYLCHEDD CYMRU En v ir o n m e n t Ag en c y W ales GWASANAETH LLYFRGELL A
Proposals for new fishing controls to protect salmon and sea trout stocks in Wales. Frequently asked questions.
 Proposals for new fishing controls to protect salmon and sea trout stocks in Wales. Sections Frequently asked questions. 1. Conservation limits (CL) for salmon management... 1 2. Sea trout SR stock-recruitment
ELECTRO-FISHING REPORT 2016 UPPER TWEED
 ELECTRO-FISHING REPORT 2016 UPPER TWEED The electro-fishing programme carried out each summer by The Tweed Foundation is part of our management plan, which details the information that is required to manage
Catch and Recapture Rates of Tweed Salmon and the Effect of Recaptures on the Catch Statistics
 Catch and Recapture Rates of Tweed Salmon and the Effect of Recaptures on the Catch Statistics A. CATCH RATES What proportion of the salmon running the Tweed actually get caught by anglers? 1. The most
Report on a Salmon Survey in the Waterford Estuary in 2010
 Report on a Salmon Survey in the Waterford Estuary in 2010 Dr. P. Gargan Inland Fisheries Ireland June 2011 1 Contents 1. Introduction 3 2. Proposal for a Survey in Waterford estuary in 2010 3 3. Survey
Council CNL(18)29. Annual Progress Report on Actions Taken Under the Implementation Plan for the Calendar Year EU-UK (England and Wales)
29. Annual Progress Report on Actions Taken Under the Implementation Plan for the Calendar Year EU-UK (England and Wales)") Agenda item 7.1 For information Council CNL(18)29 Annual Progress Report on Actions Taken Under the Implementation Plan for the Calendar Year 2017 EU-UK (England and Wales) CNL(18)29 Annual Progress Report
Agenda item 7.1 For information Council CNL(18)29 Annual Progress Report on Actions Taken Under the Implementation Plan for the Calendar Year 2017 EU-UK (England and Wales) CNL(18)29 Annual Progress Report
Note for the Usk Local Fisheries Group Meeting November Rod and net catches of Usk salmon and stock status in 2018
 Summary: Note for the Usk Local Fisheries Group Meeting November 2018 Rod and net catches of Usk salmon and stock status in 2018 Guy Mawle (guy.mawle@gmail.com) River conditions in the fishing season were
Guidance Note. Hydropower Guidance Note: HGN 8 Fish Passage. When do you need to install a fish pass?
 Guidance Note Hydropower Guidance Note: This guidance note is not intended as a statement of law. It should be read in combination with, and in the context of, the relevant enactments and EU obligations.
BUILDING THE CASE FOR FURTHER EXPLOITATION CONTROL MEASURES REQUIREMENT AND OPTIONS.
 ENVIRONMENT AGENCY RIVER WYE SALMON ACTION PLAN BUILDING THE CASE FOR FURTHER EXPLOITATION CONTROL MEASURES REQUIREMENT AND OPTIONS. Peter Gough, 17.3.11 EXECUTIVE SUMMARY The Environment Agency is seeking
Fish population survey report
 Fish population survey report River Lugg This report provides a summary of results from recent fish population surveys on the River Lugg between Leominster and Hereford. The surveys were carried out to
South East Wales Rivers Trust
 Newsletter Summer 2017 Page 1 A significant part of our work is the improvement of our river habitats and, within that, the implementation of easements to facilitate the passage of migratory fish. Although
Questionnaire on exploitation controls for salmon and sea trout in Wales
 Questionnaire on exploitation controls for salmon and sea trout in Wales Following our local engagement workshops with fisheries interests around Wales and taking into account the input and feedback from
Abundance of Steelhead and Coho Salmon in the Lagunitas Creek Drainage, Marin County, California
 scanned for KRIS Abundance of Steelhead and Coho Salmon in the Lagunitas Creek Drainage, Marin County, California Prepared for: Marin Municipal Water District 220 Nellen Drive Corte Madera, California
Lamprey populations in the UK & the development of a new sampling tool for deep water habitats. Nicola Teague
 Lamprey populations in the UK & the development of a new sampling tool for deep water habitats Nicola Teague Lamprey in the UK Lamprey among the most ancient & curious aquatic vertebrates Along with hagfish
Loughs Agency Gníomhaireacht na Lochanna Factrie fur Loughs
 CONSULTATION DOCUMENT PROPOSED AMENDMENTS OF THE FOYLE AREA (CONTROL OF FISHING) REGULATIONS 1999 Foyle Area (Control of Fishing) (Amendment) Regulations 2008 INTRODUCTION This Consultation Document sets
The Fishery. Newfoundland Region Stock Status Report D2-05
 Fisheries Pêches and Oceans et Océans DFO Science Newfoundland Region Stock Status Report D2-05 ATLANTIC SALMON INSULAR NEWFOUNDLAND, SOUTHWEST COAST, SALMON FISHING AREAS 12-13 Background Salmon Fishing
ASMFC Stock Assessment Overview: Red Drum
 Purpose The purpose of this document is to improve the understanding and transparency of the Commission s stock assessment process and results. It is the first of several that will be developed throughout
A review into NRW s salmon stocking and fish hatcheries owned and operated by Natural Resources Wales
 A review into NRW s salmon stocking and fish hatcheries owned and operated by Natural Resources Wales Chris Uttley 7 th February 2014 Introduction and background 1 Natural Resources Wales has inherited
2013 Electrofishing Program Summary. Miramichi Salmon Association In collaboration with the Department of Fisheries and Oceans
 2013 Electrofishing Program Summary Miramichi Salmon Association In collaboration with the Department of Fisheries and Oceans Prepared by: Alex Parker Biologist Miramichi Salmon Association 485, Route
Stillwater Status Report: Lough Muck, County Donegal
 LOUGHS AGENCY OF THE FOYLE CARLINGFORD AND IRISH LIGHTS COMMISSION Stillwater Status Report: Lough Muck, County Donegal Stillwater Fish Stock Survey Loughs Agency of the Foyle Carlingford and Irish Lights
ENVIRONMENT AGENCY WATER RESOURCES ACT 1991
 ENVIRONMENT AGENCY WATER RESOURCES ACT 1991 FISH REMOVAL (ROD and LINE) BYELAWS The Environment Agency, in exercise of powers conferred on it under section 210 of, and paragraph 6(1)(b) of Schedule 25
Fish population survey report
 Fish population survey report Upper River Avon Catchment This report provides a summary of results from recent fish population surveys on the Tetbury Avon, Sherston Avon and River Marden The surveys were
ANGLING GUIDE St Asaph, North Wales Tel:
 N O R T H WA L E S G A M E / C OA R S E ANGLING GUIDE 2017 St Asaph, North Wales Tel: 01745 583583 Email: info@foxons.com WWW.FOXONS.COM S T I L L WAT E R S CRAIGLWYD SPRINGS TAN-Y-MYNYDD Penmaenmawr.
Southern Gulf of St. Lawrence (4T) Herring
 Herring") Fisheries Pêches and Oceans et Océans DFO Science Stock Status B3-1 (22) Southern Gulf of St. Lawrence (4T) Herring Background Herring are a pelagic species which form schools during feeding and spawning
Fisheries Pêches and Oceans et Océans DFO Science Stock Status B3-1 (22) Southern Gulf of St. Lawrence (4T) Herring Background Herring are a pelagic species which form schools during feeding and spawning
ATLANTIC SALMON NEWFOUNDLAND AND LABRADOR, SALMON FISHING AREAS 1-14B. The Fisheries. Newfoundland Region Stock Status Report D2-01
 Fisheries Pêches and Oceans et Océans DFO Science Newfoundland Region Stock Status Report D2-01 ATLANTIC SALMON NEWFOUNDLAND AND LABRADOR, SALMON FISHING AREAS 1-14B Background There are 15 Atlantic salmon
Council CNL(16)30. Annual Progress Report on Actions Taken Under the Implementation Plan for the Calendar Year EU - Spain (Navarra)
30. Annual Progress Report on Actions Taken Under the Implementation Plan for the Calendar Year EU - Spain (Navarra)") Agenda item 6.1 For information Council CNL(16)30 Annual Progress Report on Actions Taken Under the Implementation Plan for the Calendar Year 2015 EU - Spain (Navarra) CNL(16)30 Annual Progress Report
Agenda item 6.1 For information Council CNL(16)30 Annual Progress Report on Actions Taken Under the Implementation Plan for the Calendar Year 2015 EU - Spain (Navarra) CNL(16)30 Annual Progress Report
WELSH GAME FISHING CLUBS DEE & CLWYD REGION
 WELSH GAME FISHING CLUBS DEE & CLWYD REGION LLANGOLLEN & MAELOR ANGLING LTD. www.llangollen Maelor Angling MR KEN BATHERS Tel 01978 820608 / 07714 612651 Email bathers@deesalmon.fsnet.co.uk CORWEN AND
THE CONFEDERATED TRIBES OF THE WARM SPRINGS RESERVATION OF OREGON
 THE CONFEDERATED TRIBES OF THE WARM SPRINGS RESERVATION OF OREGON To: Branch of Natural Resources P.0. Box C, Warm Springs, Oregon 97761 Phone (541) 553-2002/2003 Fax (541) 553-1994 The Independent Science
2017 PRE-SEASON EXPECTATIONS: 2017 OBSERVATIONS TO DATE:
 South Coast Salmon Bulletin #4 22 September, 2017 Escapement Update All salmon species - Strait of Georgia Stock Assessment SUMMARY: This bulletin details the current in-season escapement information for
D. Clifton-Dey M. Walsingham January 1995.
 REPORT ON THE ANALYSIS OF SALMON SCALE SAMPLES RETURNED BY AMGLERS ON THE RIVERS RJBBLE AND HODDER. NRA/NW/FTR/95/ D. CliftonDey M. Walsingham January 995. CONTENTS Page Summary Introduction 2 Methods
SOUTH PACIFIC COMMISSION. TWENTY-SECOND REGIONAL TECHNICAL MEETING ON FISHERIES (Noumea, New Caledonia, 6-10 August 1990)
") Page 1 ORIGINAL : ENGLISH SOUTH PACIFIC COMMISSION TWENTY-SECOND REGIONAL TECHNICAL MEETING ON FISHERIES (Noumea, New Caledonia, 6-10 August 1990) STOCK STATUS OF SKIPJACK TUNA IN THE WESTERN TROPICAL
Page 1 ORIGINAL : ENGLISH SOUTH PACIFIC COMMISSION TWENTY-SECOND REGIONAL TECHNICAL MEETING ON FISHERIES (Noumea, New Caledonia, 6-10 August 1990) STOCK STATUS OF SKIPJACK TUNA IN THE WESTERN TROPICAL
monitoring salmon and sea trout in the River Tyne
 &A~rsToATM e/vrt a>=>v & monitoring salmon and sea trout in the River Tyne River Tyne index report Report two - 2005 We are the Environment Agency. It s our job to look after your environment and make
Preliminary survival estimates for the passage of spring-migrating juvenile salmonids through Snake and Columbia River dams and reservoirs, 2018
 UNITED STATES DEPARTMENT OF COMMERCE National Oceanic and Atmospheric Administration NATIONAL MARINE FISHERIES SERVICE Northwest Fisheries Science Center Fish Ecology Division 2725 Montlake Boulevard East
Salmon Five Point Approach restoring salmon in England
 Salmon Five Point Approach restoring salmon in England Our Mission To restore the abundance, diversity and resilience of salmon stocks throughout England We will do this by:- a) Maximising the production
Plaice (Pleuronectes platessa) in Division 7.e (western English Channel)
 in Division 7.e (western English Channel)") Celtic Seas and Greater North Sea ecoregions Published 30 June 2016 Version 2: 15 May 2017 5.3.51 Plaice (Pleuronectes platessa) in Division 7.e (western English Channel) ICES stock advice ICES advises
Celtic Seas and Greater North Sea ecoregions Published 30 June 2016 Version 2: 15 May 2017 5.3.51 Plaice (Pleuronectes platessa) in Division 7.e (western English Channel) ICES stock advice ICES advises
Preliminary survival estimates for the passage of spring-migrating juvenile salmonids through Snake and Columbia River dams and reservoirs, 2017
 UNITED STATES DEPARTMENT OF COMMERCE National Oceanic and Atmospheric Administration NATIONAL MARINE FISHERIES SERVICE Northwest Fisheries Science Center Fish Ecology Division 2725 Montlake Boulevard East
Council CNL(15)26. Annual Progress Report on Actions Taken Under Implementation Plans for the Calendar Year EU Spain (Navarra)
26. Annual Progress Report on Actions Taken Under Implementation Plans for the Calendar Year EU Spain (Navarra)") Agenda Item 5.1 For Information Council CNL(15)26 Annual Progress Report on s Taken Under Implementation Plans for the Calendar Year 2014 EU Spain (Navarra) CNL(15)26 Annual Progress Report on s taken
Agenda Item 5.1 For Information Council CNL(15)26 Annual Progress Report on s Taken Under Implementation Plans for the Calendar Year 2014 EU Spain (Navarra) CNL(15)26 Annual Progress Report on s taken
In each summer issue of Lake
 The 2000 Lake Erie Walleye Report by Rick Kubb In each summer issue of Lake Erie Walleye Magazine, we provide a synopsis of the walleye fishery in Lake Erie based on the scientific reports produced by
Results of the 2015 nontidal Potomac River watershed Smallmouth Bass Young of Year Survey
 Results of the 2015 nontidal Potomac River watershed Smallmouth Bass Young of Year Survey Natural reproduction of smallmouth bass in the nontidal Potomac River mainstem has been assessed annually since
Kenai River Sockeye Escapement Goals. United Cook Inlet Drift Association
 Kenai River Sockeye Escapement Goals United Cook Inlet Drift Association 2014 Evaluating Sockeye Escapement Goals in the Kenai River Utilizing Brood Tables and Markov Tables This presentation pertains
Council CNL(17)33. Annual Progress Report on Actions Taken Under the Implementation Plan for the Calendar Year EU - Denmark
33. Annual Progress Report on Actions Taken Under the Implementation Plan for the Calendar Year EU - Denmark") Agenda item 6.3 For information Council CNL(17)33 Annual Progress Report on Actions Taken Under the Implementation Plan for the Calendar Year 2016 EU - Denmark CNL(17)33 Annual Progress Report on Actions
Agenda item 6.3 For information Council CNL(17)33 Annual Progress Report on Actions Taken Under the Implementation Plan for the Calendar Year 2016 EU - Denmark CNL(17)33 Annual Progress Report on Actions
Increasing urban and industrial development, particularly during the 19 th and 20 th centuries,
 The return of salmon to cleaner rivers: England & Wales Guy W. Mawle 1 & Nigel J. Milner 2 1 Environment Agency, Waterside Drive, Aztec West, Almondsbury, Bristol BS12 4UD 2 National Salmon & Trout Fisheries
Monitoring of sea trout post-smolts, 2012
 Monitoring of sea trout post-smolts, 2012 A report to the West Sutherland Fisheries Trust, Report No. WSFT2/13 January 2013 Shona Marshall Fisheries Biologist West Sutherland Fisheries Trust Gardeners
NINTH MEETING DOCUMENT SAC-09-16
 INTER-AMERICAN TROPICAL TUNA COMMISSION SCIENTIFIC ADVISORY COMMITTEE NINTH MEETING La Jolla, California (USA) 14-18 May 2018 DOCUMENT SAC-09-16 STOCK STATUS INDICATORS FOR BIGEYE TUNA Mark N. Maunder,
Year Avg. TAC Can Others Totals
 SKATE IN DIVISIONS 3L, 3N, 3O AND SUBDIVISION 3Ps Background There are 8 to 1 species of skate in the waters around Newfoundland. Of these, thorny skate (Raja radiata) is by far the most common, comprising
Wild Salmon Stock Assessment and Scientific Advice for Management in Ireland
 Wild Salmon Stock Assessment and Scientific Advice for Management in Ireland The Only way is Irish An Irish Solution for an Irish problem??? Administration and management of salmon fisheries in Ireland
Abalone spatial- and age-structured assessment model and projections for Zones A, B, C and D
 FISHERIES/215/AUG/SWG-AB/15 Abalone spatial- and age-structured assessment model and projections for Zones A, B, C and D A. Brandão and D.S. Butterworth Marine Resource Assessment & Management Group (MARAM)
Job 1. Title: Estimate abundance of juvenile trout and salmon.
 STUDY PERFORMANCE REPORT State: Michigan Project No.: F-53-R-13 Study No.: 461 Title: Population dynamics of juvenile rainbow trout and coho salmon in Lake Superior tributaries Period Covered: April 1,
West Coast Rock Lobster. Description of sector. History of the fishery: Catch history
 West Coast Rock Lobster Description of sector History of the fishery: The commercial harvesting of West Coast rock lobster commenced in the late 1800s, and peaked in the early 1950s, yielding an annual
Survival Testing at Rocky Reach and Rock Island Dams
 FISH PASSAGE CENTER 1827 NE 44 th Ave., Suite 240, Portland, OR 97213 Phone: (503) 230-4099 Fax: (503) 230-7559 http://www.fpc.org/ e-mail us at fpcstaff@fpc.org MEMORANDUM TO: FROM: Michele DeHart Erin
Adventure activity on rivers and streams during the spawning season It was suggested at recent meeting which was attended by a representative of
 Adventure activity on rivers and streams during the spawning season It was suggested at recent meeting which was attended by a representative of Canoe Wales that it may be useful for Conwy Valley Fisheries
Foyle Area and Tributaries Catchment Status Report 2015 Conservation and assessment of fish populations and aquatic habitats
 LOUGHS AGENCY OF THE FOYLE CARLINGFORD AND IRISH LIGHTS COMMISSION Foyle Area and Tributaries Catchment Status Report 2015 Conservation and assessment of fish populations and aquatic habitats Art Niven,
Agenda Item Summary BACKGROUND. Public Involvement ISSUE ANALYSIS. Attachment 1
 Agenda Item Summary Attachment BACKGROUND Between 996 and 03 white sturgeon fisheries in the Columbia River downstream from Bonneville Dam were managed under a series of management accords between the
A review of Rotary Screw Trap operations on the River Faughan
 LOUGHS AGENCY OF THE FOYLE CARLINGFORD AND IRISH LIGHTS COMMISSION A review of Rotary Screw Trap operations on the River Faughan 2003-2016 Monitoring and Conservation Loughs Agency of the Foyle Carlingford
ASSESSMENT OF THE WEST COAST OF NEWFOUNDLAND (DIVISION 4R) HERRING STOCKS IN 2011
 HERRING STOCKS IN 2011") Canadian Science Advisory Secretariat Science Advisory Report 212/24 ASSESSMENT OF THE WEST COAST OF NEWFOUNDLAND (DIVISION 4R) HERRING STOCKS IN 211 Context Figure 1. Map of unit areas of NAFO Division
Canadian Science Advisory Secretariat Science Advisory Report 212/24 ASSESSMENT OF THE WEST COAST OF NEWFOUNDLAND (DIVISION 4R) HERRING STOCKS IN 211 Context Figure 1. Map of unit areas of NAFO Division
***Please Note*** April 3, Dear advisory committee members:
 April 3, 29 Dear advisory committee members: The fifth meeting of the CHF advisory committee will be held April 13 in Grants Pass from 6:-8:3 PM, and the purpose of this document is to help committee members
DRAFT REPORT. EN United in diversity EN. European Parliament 2017/2120(INI)
") European Parliament 2014-2019 Committee on Fisheries 2017/2120(INI) 19.12.2017 DRAFT REPORT on the state of play of recreational fisheries in the European Union (2017/2120(INI)) Committee on Fisheries
European Parliament 2014-2019 Committee on Fisheries 2017/2120(INI) 19.12.2017 DRAFT REPORT on the state of play of recreational fisheries in the European Union (2017/2120(INI)) Committee on Fisheries
REPORT OF ICES ADVISORY COMMITTEE NORTH ATLANTIC SALMON STOCKS. NORTH ATLANTIC SALMON CONSERVATION ORGANIZATION NEAC Area
 REPORT OF ICES ADVISORY COMMITTEE ON NORTH ATLANTIC SALMON STOCKS TO NORTH ATLANTIC SALMON CONSERVATION ORGANIZATION NEAC Area CNL(14)8 Advice generated by ICES in response to terms of reference from NASCO
Cedar Lake Comprehensive Survey Report Steve Hogler and Steve Surendonk WDNR-Mishicot
 Cedar Lake- 2006 Comprehensive Survey Report Steve Hogler and Steve Surendonk WDNR-Mishicot ABSTRACT Cedar Lake is a 142 acre lake located in the southwest corner of Manitowoc County. It is a seepage lake
Current Status and Management Recommendations for the Fishery in the Cloverleaf Chain of Lakes
 Current Status and Management Recommendations for the Fishery in the Cloverleaf Chain of Lakes Jason Breeggemann Senior Fisheries Biologist Wisconsin Department of Natural Resources Outline DNR fisheries
Fifth otter survey of England
 Fifth otter survey of England 2009-2010 Summary report We are The Environment Agency. It's our job to look after your environment and make it a better place for you, and for future generations. Your environment
Evaluate Bull Trout Movements in the Tucannon & Lower Snake Rivers. Mike Faler - USFWS, Ahsahka, ID Glen Mendel - WDFW, Dayton, WA
 Evaluate Bull Trout Movements in the Tucannon & Lower Snake Rivers Mike Faler - USFWS, Ahsahka, ID Glen Mendel - WDFW, Dayton, WA Background Occurrence of bull trout at the Snake River dams is only incidentally
Afonydd Cymru The Right Bank The Square Talgarth Powys LD3 0BW
 Afonydd Cymru The Right Bank The Square Talgarth Powys LD3 0BW Gareth Harvey Esq The Planning Inspectorate Crown Buildings Cathays Park Cardiff CF10 3NQ 16 th December 2018 Dear Mr Harvey The Wales Rod
Council CNL(11)35. Annual Report on Actions Taken Under Implementation Plans. EU - France
35. Annual Report on Actions Taken Under Implementation Plans. EU - France") Agenda Item 6.1 For Information Council CNL(11)35 Annual Report on Actions Taken Under Implementation Plans EU - France Annual Report on actions taken under Implementation Plans for the Calendar Year
Agenda Item 6.1 For Information Council CNL(11)35 Annual Report on Actions Taken Under Implementation Plans EU - France Annual Report on actions taken under Implementation Plans for the Calendar Year
Holman Char Fishing Plan
 Holman Char Fishing Plan 2001-2004 Fisheries and Oceans Canada Northwest Territories Fishery Regulations that apply to subsistence fisheries for Holman area char: 1) Nets must be checked every 30 hours
Hydroacoustic surveys of Otsego Lake s pelagic fish community,
 Hydroacoustic surveys of Otsego Lake s pelagic fish community, 2010 1 Holly A. Waterfield 2 and Mark Cornwell 3 INTRODUCTION Hydroacoustic surveys were conducted in May and November 2010 to estimate pelagic
Preliminary survival estimates for the passage of spring-migrating juvenile salmonids through Snake and Columbia River dams and reservoirs, 2016
 UNITED STATES DEPARTMENT OF COMMERCE National Oceanic and Atmospheric Administration NATIONAL MARINE FISHERIES SERVICE Northwest Fisheries Science Center Fish Ecology Division 2725 Montlake Boulevard East
TAY DISTRICT SALMON FISHERIES BOARD POLICY ON SALMON STOCKING
 TAY DISTRICT SALMON FISHERIES BOARD POLICY ON SALMON STOCKING August 2011 1 INTRODUCTION This document describes the policy adopted by the Tay District Salmon Fisheries Board for the artificial stocking
SCIENTIFIC COMMITTEE SEVENTH REGULAR SESSION August 2011 Pohnpei, Federated States of Micronesia
 SCIENTIFIC COMMITTEE SEVENTH REGULAR SESSION 9-17 August 2011 Pohnpei, Federated States of Micronesia CPUE of skipjack for the Japanese offshore pole and line using GPS and catch data WCPFC-SC7-2011/SA-WP-09
Loughs Agency Freshwater Fisheries Monitoring Programme
 Loughs Agency Freshwater Fisheries Monitoring Programme Fisheries Coordination Centre/RAFTS Annual Biologists Meeting 29 th 30 th January 2014 Marine Scotland Freshwater Laboratory, Pitlochry Art Niven,
Estimation and Analysis of Fish Catches by Category Based on Multidimensional Time Series Database on Sea Fishery in Greece
 Estimation and Analysis of Fish Catches by Category Based on Multidimensional Time Series Database on Sea Fishery in Greece Georgios Tegos 1, Kolyo Onkov 2, Diana Stoyanova 2 1 Department of Accounting