Section 3. Fisheries Monitoring Report for Rush, Lee Vining, Parker, and Walker Creeks
|
|
|
- Neil Strickland
- 5 years ago
- Views:
Transcription
1 Section 3 Fisheries Monitoring Report for Rush, Lee Vining, Parker, and Walker Creeks
2
3 Monitoring Report Rush, Lee Vining, and Walker Creeks 2013 Prepared by Ross Taylor and Associates for Los Angeles Department of Water and Power s Annual Compliance Report to the State Water Resoruces Control Board Date: March 31, 2014
4
5 Table of Contents Executive Summary... 4 Densities of Age-0 Trout... 4 Densities of Age-1 and older Trout... 5 Standing Crop Estimates... 5 Condition Factors... 6 Relative Stock Densities... 6 Introduction... 8 Study Area... 9 Hydrology Grant Lake Reservoir Water Temperature Methods Calculations Mortalities Length-Weight Relationships Relative Stock Density (RSD) Calculations Termination Criteria Calculations and Analyses Results Channel Lengths and Widths Trout Population Abundance Rush Creek Lee Vining Creek Walker Creek Catch of Rainbow Trout in Rush and Lee Vining Creeks Relative Condition of Brown Trout PIT Tag Recaptures Growth of Age-1 Brown Trout between 2012 and Growth of Age-2 Brown Trout between 2012 and Growth of Age-3 Brown Trout between 2012 and Growth of Age-4 and Age-5 Brown Trout between 2012 and Growth of MGORD Brown Trout by size class between 2012 and Growth of MGORD Brown Trout from non-consecutive years Apparent one-year survivals of PIT tagged Brown Trout Average Growth Rate of Rainbow Trout Movement of PIT Tagged Trout between Sections Shed Rate of PIT Tags between 2009 and Comparison of Growth Rates by Age-class amongst Sample Sections Estimated Trout Densities Age-0 Brown Trout Age-1+ Brown Trout Age-0 Rainbow Trout Age-1+ Rainbow Trout Estimated Trout Densities Expressed in Numbers per Unit Length
6 Estimated Trout Standing Crop Comparisons Termination Criteria Results Discussion Brown Trout Responses to Consecutive Dry Runoff Years Trout Growth between 2012 and Condition Factors Annual densities of brown trout >255 mm Methods Evaluation References Cited Appendices for the 2013 Mono Basin Annual Fisheries Report Appendix A: Aerial Photographs of Long-term Monitoring Sections Appendix B: Stream Scientist s June 3, 2013 Letter to SWRCB
7 Executive Summary This report presents results of the seventeenth year of trout population monitoring for Rush, Lee Vining, and Walker Creeks pursuant to State Water Resources Control Board s (SWRCB) Water Right Decision 1631 (D1631) and the fifteenth year following SWRCB Orders #98-05 and # This report provides the trout population data collected between September 6 and September 17, 2013 as mandated by the Orders and the Settlement Agreement. The 2013 runoff year was 66% of normal and classified a dry runoff year type. This was the second consective dry runoff year type (RY 2012 was 55% of normal). Annual electrofishing mark-recapture monitoring was conducted in three sections of Rush Creek and in the main channel section of Lee Vining Creek. Multiple-pass depletion electrofishing was conducted in the Lee Vining Creek side channel and in Walker Creek. These data were used to generate population estimates, density estimates, standing crop estimates, condition factors, relative stock densities, and growth rates from PIT tag recaptures. A single electrofishing pass was made in the MGORD section of Rush Creek and this information was used for calculating condition factors, relative stock density values, and growth rates from PIT tag recaptures. Densities of Age-0 Trout Age-0 brown trout density estimates (numbers per hectare) decreased in the three Rush Creek sections in 2013 when compared to the 2012 values. The Upper Rush section s estimated density of age-0 brown trout decreased by 33%, the Bottomlands section decreased by 41%, and the County Road section experienced a 28% decrease. In Walker Creek, the 2013 density estimate of age-0 brown trout was a 49% increase from the 2012 estimate and was the second highest in the 15-year sampling period. The 2013 age-0 brown trout density estimate in the main channel of Lee Vining Creek was a 42% decrease from the 2012 estimate. The 2013 density estimate of age-0 brown trout in the Lee Vining Creek side channel was a 92% decrease from the 2012 estimate. In 2013, only a single age-0 brown trout was captured in the Lee Vining Creek side channel. For the fifth consecutive year no age-0 rainbow trout were captured in the Lee Vining Creek side channel. Estimated densities of age-0 rainbow trout in the Lee Vining Creek main channel section decreased by 89% in 2013 when compared to the 2012 estimate. However, when compared to the 14 years that the main channel was sampled, the 2013 density estimate was the fourth highest estimate. 4
8 Densities of Age-1 and older Trout Age-1 and older brown trout density estimates (numbers per hectare) decreased in the three Rush Creek sections in 2013 when compared to the 2012 values. The Upper Rush section s estimated density of age-1+ trout/ha decreased by 19%, the Bottomlands section decreased by 37%, and the County Road section decreased by 23%. The 2013 density estimate of age-1+ brown trout in the Walker Creek section experienced a 122% increase from the 2012 estimate. In the Lee Vining Creek main channel section, the 2013 density estimate of age-1+ brown trout was a 161% increase from the 2012 estimate. In 2013, the side channel of Lee Vining Creek had the highest density of age-1 and older brown trout/ha ever generated for this section that was 27% greater than the 2012 estimate. For a third consecutive year no age-1 and older rainbow trout were captured in the Lee Vining Creek side channel. Estimated densities of age-1 and older rainbow trout in the Lee Vining Creek main channel increased more than tenfold (1,080%) between 2012 and The 2013 estimate was the second highest for the 14 years in which data were collected in this section. Standing Crop Estimates Standing crop estimates (kilograms per hectare) decreased in the three Rush Creek sections in 2013 when compared to the 2012 values. The estimated standing crop for brown trout in the Upper Rush section was 140 kg/ha in 2013, a 21% decrease from the 2012 estimate. The estimated standing crop for brown trout in the Bottomlands section of Rush Creek was 55 kg/ha in 2013, a 47% decrease from the 2012 estimate. The estimated standing crop for brown trout in the County Road section of Rush Creek was 67 kg/ha in 2013; which was a 36% decrease from the 2012 estimate. The estimated standing crop for brown trout in Walker Creek was 194 kg/ha in 2013, a 24% increase from the 2012 estimate. The 2013 standing crop estimate was the highest value recorded in Walker Creek over the 15-year sample period. The Lee Vining Creek main channel in 2013 produced a total standing crop of 184 kg/ha for both rainbow and brown trout and was a 6% increase from the 2012 estimate of 173 kg/ha. The 2013 brown trout standing crop estimate was 133 kg/ha and the rainbow trout standing crop estimate was 51 kg/ha. The Lee Vining Creek side channel produced a brown trout standing crop estimate of 26 kg/ha in 2013, a 33% decrease compared to the 2012 estimate. No rainbow trout were captured in the side channel in 2013 and none have been sampled in the side channel for three consecutive years ( ). 5
9 Condition Factors Relative condition factors of brown trout 150 to 250 mm in length in 2013 decreased in nearly all sections (six of seven sections) from 2012 values. For the first time in the 15-year history of fisheries monitoring in Rush and Lee Vining creeks, no sampling section had a relative condition factor The Upper Rush section had a relative condition factor of 0.97 in 2013, a decrease from 0.98 in 2012 and 1.00 in The Bottomlands section had a relative condition factor of 0.91 in 2013, a decrease from 0.92 in The 2013 value was the fourth consecutive decrease in condition factor in the Bottomlands section since 2009 s value of Relative condition factor in the County Road section for 2013 was 0.90, the second lowest condition factor for the 14 years of County Road data (2008 had a condition factor of 0.89). The MGORD s 2013 value of 0.94 was the lowest condition value in the 11 years of sample data for this section and the fourth straight decrease from 2009 s value of For MGORD brown trout 300 mm in length, the condition factor was Walker Creek, brown trout had a condition factor of 0.93 in 2013, the first time it s been below 1.00 since In 2013, Lee Vining Creek s main channel had the lowest brown trout condition factor in sampling history at 0.95, the first time this section s condition factor has dipped below Rainbow trout 150 to 250 mm in length in the main channel also had a condition factor of less than Rainbow trout in 2013 once again had a better condition factor than the brown trout (0.96 versus 0.95) in the main channel of Lee Vining Creek. In 2013, brown trout in Lee Vining Creek s side channel had a condition factor 0.93, an increase from 2012 s value of This was the second consecutive year in the 14 years of sampling the side channel that condition factors were less than Relative Stock Densities RSD-225 values for brown trout in the three sections of Rush Creek continued to decrease from the 2010 values. In the Upper Rush section, since the 2010 value of 34, the RSD-225 has steadily decreased to 23 in 2011, 20 in 2012, and 14 in In the Bottomlands section of Rush Creek, since the 2010 value of 27, the RSD-225 has steadily decreased to 18 in 2011, 11 in 2012, and 4 in The County Road section s RSD-225 values have dropped since 2010 from 25 to 17 to 8 to 2(Table 23). The RSD-300 value in the Upper Rush section was 1 in 2013, which has not changed for the past three sampling years. Over the 14 sampling years, a total of 83 brown trout 300 mm were captured in the Upper Rush Creek section, an average of 5.9 fish per year. No brown trout 300 mm were captured in the Bottomlands or County Road sections, thus the RSD-300 values equaled 0 for these sections. 6
10 In the MGORD section of Rush Creek, the 2013 RSD-225 value of 42 was the lowest recorded for the 11 years of MGORD sampling. The RSD-300 value of 14 was also the lowest ever recorded for the 11-year period. The RSD-375 value has equaled 4 for three consecutive years, RSD values in Lee Vining Creek were generated for the main channel only and the main channel combined with the side channel. The 2013 RSD-225 values dropped compared to 2012, most likely due to the extremely high abundance of age-1 brown trout in 2013 that were less than 225 mm in length. 7
11 Introduction This report presents results of the seventeenth year of trout population monitoring for Rush, Lee Vining, and Walker Creeks pursuant to State Water Resources Control Board s (SWRCB) Water Right Decision 1631 (D1631) and the fifteenth year following SWRCB Orders #98-05 and # D1631 states that prior to water diversions on Rush Creek, brown trout averaging thirteen to fourteen inches were regularly observed and that Rush Creek fairly consistently produced brown trout that weighted three-quarters to two pounds. With regards to Lee Vining Creek, it sustained catchable brown trout averaging eight to ten inches in length and some trout reached thirteen to fifteen inches. A Settlement Agreement signed in 1997 (Settlement Agreement) called for establishment of size and structure of trout populations criteria for determining when stream restoration will be considered complete, i.e. terminated. Order approved the general termination criteria (TC) agreed to in the Settlement Agreement. The general description of the termination criteria described in Order included: 1. Whether trout are in good condition. This includes self-sustaining populations of brown trout similar to those that existed prior to the diversion of water by Los Angeles and which can be harvested in moderate numbers. 2. Whether the stream restoration and recovery process has resulted in a functional and self-sustaining stream system with healthy riparian ecosystem components for which no extensive physical manipulation is required on an ongoing basis. Order states that the stream restoration program may be terminated upon approval of the State Water Resources Control Board following public notice and opportunity for public comment (SWRCB 1998) and the SWRCB will base its determination upon consideration of the two above termination criteria. Order also states the monitoring team will develop and implement a means for counting or evaluating the number, weights, lengths and ages of trout present in various reaches of Rush Creek, Lee Vining Creek, Parker Creek and Walker Creek. No specific termination criteria were set forth for Parker and Walker Creeks. In 2006, the Fisheries Stream Scientist proposed new termination criteria in an attempt to make the calculation and interpretation of the fisheries termination criteria more quantifiable (Hunter 2007). The proposed termination criteria included biomass, density, condition factor, and relative stock density because these are generally accepted by fishery professionals as repeatable and quantifiable measurements of stream-dwelling trout populations. While the termination criteria were proposed, they were never formally adopted by the SWRCB, but have been used by the Stream Scientists in their annual reports. This report provides trout population data collected in 2013 as mandated by the Orders and the Settlement Agreement. 8
12 Study Area Between Sept 6 and Sept 17, 2013, Los Angeles Department of Water and Power (LADWP) staff and Ross Taylor, the SWRCB fisheries scientist, conducted the annual fisheries monitoring surveys in seven reaches along Rush, Lee Vining, and Walker Creeks in the Mono Lake Basin. These reaches were similar in length to those which have been sampled between 2009 and 2012 (Figure 1). One exception was the Lee Vining Creek side channel section which was shorter in length due to the streamflow going sub-surface towards the downstream end of the reach. Aerial photographs of the 2013 sampling reaches can be found in Appendix A. Figure 1. Annual fisheries sampling sites within Mono Basin study area, September
13 Hydrology The 2013 runoff year was 66% of normal and considered a dry runoff year type. This was the second consective dry runoff year type (RY 2012 was 55% of normal). According to Grant Lake Management Plan (GLOMP), in consecutive dry years LADWP was to release a maintenance flow of 100 cfs for five days in Rush Creek and a maintenance flow of 75 cfs for five days in Lee Vining Creek. Winter baseflows (October 1 st March 31 st ) were 36 and 25 cfs for Rush and Lee Vining Creeks, respectively. Prescribed SRF summer baseflows for Rush and Lee Vining Creeks were 31 and 37 cfs, respectively. The peak discharge in Rush Creek at the MGORD occurred between June 12 th and 17 th, with daily average flow releases of 91, 95, 95, 94, 94 and 90 cfs (red line on Figure 2). Accretions from Parker and Walker creeks resulted in peaks flows in Rush Creek below the Narrows of 110, 115, 114, 114, 113, and 109 cfs for the same 6-day period (green line on Figure 2). Summer baseflow started on June 24 th with a MGORD release of 35 cfs and was maintained between 32 and 38 cfs for the remainder of 2013 (Figure 2) Daily Average Stream Flow (cfs) Rush Creek at Damsite Rush Creek at MGORD Rush Creek at Narrows 0.0 1/1/2013 2/20/2013 4/11/2013 5/31/2013 7/20/2013 9/8/ /28/2013 Date Figure 2. Rush Creek hydrographs between January 1 st and November 30 th of
14 Peak flows in Lee Vining Creek below LADWP s intake occurred between June 8 th and 14 th with flows of 71, 78, 77, 72, 74, 77 and 70 cfs (Figure 3). The summer baseflow remained above 37 cfs until the flow above Intake dropped below 37 cfs on July 12 th (Figure 3). Flows in Lee Vining Creek below LADWP s intake were then less than 20 cfs between August 23 rd and November 4 th (Figure 3) Daily Avcerage Stream Flow (cfs) /1/2013 2/20/2013 4/11/2013 5/31/2013 7/20/2013 9/8/ /28/ /17/2013 Date Figure 3. Lee Vining Creek Hydrograph below LADWP intake between January 1 st and December 31 st of
15 Grant Lake Reservoir In 2013, elevation levels in Grant Lake Reservoir (GLR) fluctuated from a low of 7,112.3 ft to a high of 7,121.8 ft (Figure 4). Overall GLR s 2013 elevations were lower than in 2012, most likely due to the consecutive dry year runoffs. For example, prior to snowmelt runoff GLR was at 7,118.8 ft on April 1, 2012 and was at 7,114.2 ft on April 25, In 2012, GLR s elevation reached a maximum elevation of 7,127.6 ft on May 25 th (2.4 ft below the spill elevation of 7,130 ft); whereas in 2013 GLR s maximum elevation was 7,121.8 ft on July 3 rd (8.2 ft below spill level and 5.8 ft lower than 2012 s maximum level)(figure 4). GLR s minimum elevation was 7,112.3 ft on October 7, 2013 (Figure 4). Throughout the remainder of 2013, GLR s elevation remained above the low GLR level as defined in the Synthesis Report by the Stream Scientists (<25,000 AF storage or 7,108 ft elevation) Grant Lake Reservoir Elevation (ft) GLR Elevation GLR Spill Elevation /1/2013 2/20/2013 4/11/2013 5/31/2013 7/20/2013 9/8/ /28/ /17/2013 Date Figure 4. Grant Lake Reservoir Elevation (GLR) between January 1 st and December 31 st
16 Water Temperature Although water temperatures were recorded year-round during 2013, summer water temperatures in July-September were more closely examined due to influences of warm temperatures on fish growth and condition factor (Table 1). Daily maximum water temperatures above 70 F were recorded at all Rush Creek temperature monitoring locations below the Top of MGORD during the summer of Rush Creek at Old Highway 395 had the most days with a daily maximum water temperature exceeding 70 F in 2013 (40 days), followed by below Narrows (24 days), County Road (seven days), and Bottom of MGORD (one day)(table 1). Mean daily temperatures were within 2 o F throughout Rush Creek during the summer largely due to lower daily minimum temperatures downstream of the MGORD offsetting a higher maximum daily temperature (62.6 F at Top of MGORD compared to 56.5 F at County Road). Downstream of the MGORD, maximum diurnal fluctuations of summer water temperatures in Rush Creek exceeded 13 o F (Table 1). The average daily maximum summer water temperature in Lee Vining Creek was 58.0 F in RY2013 and warmest temperature recorded all summer long was 62.2 o F on July 26 th (Table 1). The maximum diurnal fluctuation was 14.2 o F and occurred on August 30 th (Table 1). Table 1. Summary of water temperature data during the summer of runoff year 2013 (July to September). Averages were calculated for daily mean, daily maximum, and daily minimum temperatures between July 1 st and September 30 th. All temperature data (Daily Mean, Daily Max, Daily Min, and Max Daily Flux) are in F. Temperature Monitoring Location Rush Ck. Top of MGORD Rush Ck. Bottom MGORD Rush Ck. Old Highway 395 Rush Ck. below Narrows Rush Ck. County Road Lee Vining at intake Daily Mean Ave Daily Minimum Ave Daily Maximum No. Days > 70 o F Max Diurnal Fluctuation Date of Max. Fluct /9/ /9/ /17/ /19/ /29/ /30/13 13
17 Methods The annual fisheries monitoring was conducted between September 6 and 17, Closed population mark-recapture and depletion methods were utilized in order to estimate trout abundance. The mark-recapture method was used on the Upper, Bottomlands and County Road sections of Rush Creek and the Lee Vining Creek main channel section. The depletion method was used on the Lee Vining Creek side channel and Walker Creek sections. For the mark-recapture method to meet the assumption of a closed population, semipermanent block fences were installed at the upper and lower ends of each section. The semipermanent fences were 48 inches tall, constructed with ½ inch-mesh hardware cloth, t-posts, and rope. Hardware cloth was stretched across the entire width of the creek and t-posts were then driven at roughly three foot intervals through the cloth on the upstream side approximately one foot from the edge. Rocks were placed on the lower edge to keep trout from swimming underneath the fence. Rope was secured across the top of the t-post and tied to both banks upstream of the fence. Cloth downstream of the t-post was raised and secured to the rope with bailing wire. Fences were raised the morning of the mark run and left in place for seven days until the recapture run was finished. To prevent failure, all fences were cleaned of leaves, twigs, and checked for mortalities twice daily (morning and evening). Depletion estimates only required temporary fencing to stop fish movement in and out of the study area while conducting the survey. Temporary fencing was erected at the upper and lower ends of the study areas with 3/16 inch-mesh nylon mesh seine nets installed across the channel. Rocks were placed on the lead line to prevent trout from swimming underneath the seine. Sticks were used to keep the top of the seine above the water line. Both ends of the seine were then tied to bank vegetation to hold it in place. Equipment used to conduct mark-recapture electrofishing on Rush Creek included a six foot plastic barge that contained the Smith-Root 2.5 GPP electro-fishing system, an insulated cooler, and battery powered aerators. The Smith-Root 2.5 GPP electro-fishing system included a 5.5 horse power Honda generator which powers the 2.5 GPP control box. Electricity from the 2.5 GPP control box was introduced into the water via two anodes. The electrical circuit was completed by the metal plate cathode attached to the bottom of the barge. Due to the steep-gradient and relatively narrow width of Lee Vining Creek, two Smith- Root LR-24 backpack units were used for the mark-recapture runs. Mark-recapture runs on Rush Creek consisted of a single downstream pass starting at the upper block fence and ending at the lower block fence. In 2013 the field crew consisted of a barge operator, two anode operators, and four netters, two for each anode. The barge operator s job consisted of carefully maneuvering the barge down the creek, and ensuring overall safety of the entire crew. The anode operator s job was to safely shock and hold trout until they were netted. The netters job was to net and transport fish to the insulated cooler and monitor trout for signs of stress. Once the cooler was full, electrofishing was temporarily stopped to process the trout. The trout were then transferred from the cooler to live cars and placed back in the creek. The trout were then processed in small batches and then returned to a recovery live car 14
18 in the creek. Once all the trout were processed the crew resumed electrofishing until the cooler was once again full. Mark-recapture runs on Lee Vining Creek consisted of an upstream pass starting at the lower block fence and ending at the upper block fence followed shortly by a downstream pass back to the lower block fence. The electrofishing crew consisted of two crew members running the backpack electro-fishers, three netters, and one bucket carrier who transported the captured trout to several live cars positioned throughout the sample reach. Once the two passes were finished the crew then processed the trout. Due to the depth of the MGORD, all electrofishing and netting was done from inside a drift boat. The drift boat was held perpendicular to the flow by two crew members who walked it down the channel. The electrofishing barge was tied off to the upstream side of the drift boat and a single throw anode was used. A single netter used a long handled dip net to net the stunned trout, which were then placed in an insulated cooler equipped with aerators. A safety officer sat at the stern of the drift boat whose job was to monitor the trout in the cooler, the electro-fishing equipment, the electro-fishing crew and shut off the power should the need arise. Once the cooler was full, the trout were moved to a live car and placed back in the creek for the shore crew to process before continuing the electrofishing effort. The Walker Creek and Lee Vining Creek side channel (B-1 side channel) depletions were both two-pass depletions. A single pass was considered an upstream pass from the lower seine net to the upper seine net followed by a downstream pass back to the lower seine net. One member of the electrofishing crew operated the LR-24 electrofisher; another member was the primary netter and a third member was the backup netter/bucket carrier. The other crew members processed the trout captured during the first pass while the electrofishing crew was conducting on the second pass. Processed first-pass fish were temporarily held in a live car until the second pass was completed and it was determined that only two passes were required to generate a suitable estimate. Once the electrofishing crew was finished with the second pass, those trout were then processed. To process trout during the mark-run, small batches of fish from the live car were transferred to a five gallon bucket equipped with aerators. Trout were then anesthetized, identified as either brown trout or rainbow trout, measured to the nearest millimeter (total length), and weighed to the nearest gram on an electronic balance. Trout were then marked with a small (< 3 mm) fin clip for identification during the recapture run. Trout captured in the Rush Creek Upper and County Road sections and the main channel of Lee Vining Creek received anal fin clips. Trout captured in the Bottomlands section of Rush Creek received a lower caudal clip. Before placing trout into the aerated recovery bucket, each fish was examined for a missing adipose fin. Trout missing their adipose fin were then scanned for their Passive Integrated Transponder (PIT) tag number. Any trout missing their adipose fin that failed to produce a tag number when scanned were recorded as having shed the PIT tag. Partially regenerated adipose fins of fish with PIT tags were reclipped for ease of future identification. Once recovered, fish were then moved from the recovery bucket to a live car to be held until the day s sampling effort was completed this was done to prevent captured fish from potentially moving downstream into the actively 15
19 sampled section. At the end of the electrofishing effort, fish were released from the live cars back into the sub-sections they had been captured in. Fish were then provided a seven-day period to remix back into the section s population prior to conducting the recapture-run. Processing trout during the recapture-run was similar to the mark-run. Trout were transferred in small batches to a five gallon bucket. They were then anesthetized, identified, and examined for the mark fin clip. Trout that were fin clipped were only measured to the nearest millimeter and placed in the recovery bucket. Trout that were not clipped during the mark run (i.e. new fish) were measured to the nearest millimeter total length, weighed to the nearest gram, and examined for missing adipose fins. Trout missing adipose fins were then scanned for their PIT tag number then placed into recovery. Again, trout that failed to produce a tag number were recorded as having shed the PIT tag. Between 2009 and 2012, PIT tags were implanted in most age-0 trout in Rush and Lee Vining Creeks and all trout in the MGORD. In 2013, the SWRCB Stream Scientist in charge of directing the fisheries monitoring program recommended that PIT tagging continue in 2013, as well as during the proposed post-settlement monitoring period. Unfortunately, LADWP decided to discontinue the PIT tagging during the 2013 season, which will create a data-gap when the postsettlement monitoring program begins. All data collected in the field, were written on data sheets and entered into Excel spreadsheets using a Trimble Yuma GPS. Data sheets were then used to proof the Excel spreadsheets back at the office. Calculations To calculate the area of each sample section, channel lengths and wetted widths were measured in the sample reaches. Wetted widths were measured at 10-meter intervals to 0.1 foot accuracy within each reach. Average widths were used in area calculations which were then used to calculate each section s estimates of trout biomass and density. Mark-recapture population estimates were derived from the Chapman modification of the Petersen equation (Ricker 1975 as cited in Taylor and Knudson 2011). Depletions estimates and condition factors were derived from Microfish 3.0 software program. Estimates were generated for three size groups of trout: <125 mm in length, mm in length, and 200 mm in length (200 mm is approximately eight inches). Mortalities For the purpose of conducting the mark-recapture methodology, accounting for fish killed during the sampling process was important. Depending on when the fish were killed and whether or not they were sampled during the mark-run, how these fish were accounted for varied. 16
20 All fish killed during the mark-run were unavailable for sampling during the recapture-run. These fish were considered "morts" in the mark-run for the purposes of mark-recapture estimates, were removed from the mark-run data, and then were added back into the total estimate after computing the mark-recapture estimate. During the seven-day period between the mark-run and the recapture-run, when the block fences were cleaned twice daily, fence cleaners also looked for additional morts. When "marked" morts were found on the fences, we went back into the mark-run data and assigned block fence morts on a one-to-one basis as "morts" to individual fish on the mark-run based on species and size. When this occurred, a comment was added to the individual fish, such as "assigned as fence mort". These marked morts were then removed from the mark-run data since they were unavailable for sampling during the recapture-run. Because of fin deterioration on some morts, exact lengths were not always available. Fortunately, it was not critical to match the exact length when assigning these marked fence morts to fish from the mark-run, but it was important that the fence morts were placed within the proper "length group" for which estimates were computed. As with fish killed during the mark-run, these marked fence morts were added back into the total estimate after the mark-recapture estimate was computed. Unmarked fence morts (fish not caught and clipped during the mark-run) were measured and tallied by the three length groups for which estimates were computed. These fish were then added to the total number of morts (for each length group), which were then added back into the mark-recapture estimates to provide unbiased total estimates for each of the three length groups. Length-Weight Relationships Length-weight regressions (Cone 1989 as cited in Taylor and Knudson. 2011) were calculated for all brown trout greater than 100 mm in all section of Rush Creek. Regressions using Log10 transformed data were used to compare length-weight relationships by year and by section. Fulton-type relative condition factors were computed in MicroFish 3.0 using methods previously reported in (Taylor and Knudson 2011) for brown trout 150 to 250 mm. A trout condition factor of 1.00 is considered average (Reimers 1963; Blackwell et al. 2000). Relative Stock Density (RSD) Calculations Relative stock density (RSD) is a numerical descriptor of length frequency data (Hunter et al. 2007). RSD values are the proportions (percentage x 100) of the total number of brown trout 150 mm in length that are also 225 mm or (RSD-225), 300 mm (RSD-300) and 375 mm or (RSD-375). These three RSD values are calculated by the following equations: 17
21 RSD-225 = [(# of brown trout 225 mm) (# of brown trout 150 mm)] x 100 RSD-300 = [(# of brown trout 300 mm) (# of brown trout 150 mm)] x 100 RSD-375 = [(# of brown trout 375 mm) (# of brown trout 150 mm)] x 100 Termination Criteria Calculations and Analyses Information regarding the proposed termination criteria, calculations, and analyses was conducted as described in past Annual Fisheries Reports (Taylor and Knudson 2011). Results Channel Lengths and Widths Differences in wetted widths between years can be due to several factors such as, magnitude of spring peak flows, stream flows at time of measurements, and locations of where measurements were taken. In 2013, widths in Rush Creek were slightly wider than in 2012; whereas in Walker and Lee Vining creeks the 2013 widths were slightly less than the 2012 measurements. Lengths, widths, and areas from 2012 are provided for comparisons (Table 2). Table 2. Total length, average wetted width, and total surface area of sample sections in Rush, Lee Vining, and Walker Creeks sampled between September 6-17, Values from 2012 are provided for comparisons. Sample Section Length (m) 2012 Width (m) 2012 Area (m 2 ) 2012 Length (m) 2013 Width (m) 2013 Area (m 2 ) 2013 Area (ha) 2013 Rush Upper , , Rush - Bottomlands , , Rush Co. Road , , Lee Vining Main , , Lee Vining - Side Walker Creek
22 Trout Population Abundance Rush Creek In 2013, a total of 1,245 brown trout ranging in size from 60 mm to 331 mm were captured in Upper Rush section (Figure 5). Age-0 brown trout comprised 69% of the total catch this year (compared to 86% in 2012). Upper Rush supported an estimated 2,046 age-0 brown trout in 2013 (including morts) compared to 2,895 trout in 2012 (a 29% decrease between 2012 and 2013). Standard error on age-0 brown trout was 7% of the estimate versus 2012 s 5% (Table 3). In 2013, brown trout mm in length comprised 24% of the total catch in the Upper Rush section (compared to 16% in 2012). This section supported an estimated 444 brown trout mm in length in 2013 compared to 492 brown trout in 2012 (a 10% decrease). Standard error for this size class was 7% of the estimate (same as the 2012 estimate). Brown trout 200 mm and greater comprised of 8% of the Upper Rush total catch in 2013 (compared to 7% in 2012). In 2013, Upper Rush supported an estimated 135 brown trout greater than 200 mm in length compared to an estimate of 177 fish in 2012 (a 24% decrease). Standard error for this size class was 9% of the estimate versus 4% in In 2013, only three brown trout greater than 300 mm in length were captured in the Upper Rush section; these fish were 305, 328 and 331 mm in length (Figure 5). A total of 44 rainbow trout were captured on the Upper Rush section comprising 3.4% of the total catch in 2013 (Table 3). The 44 rainbow trout ranged in size from 58 mm to 270 mm (Figure 6). Twenty-one of the captured rainbow trout were age-0 fish, 18 fish were in the mm size class, and the remaining five fish were 200 mm in length. In 2013, there were too few recaptures of rainbow trout to generate estimates for any of the size classes (Table 3). Within the Bottomlands section of Rush Creek a total of 452 brown trout were captured in 2013 (Table 3) which ranged in size from 61 mm to 247 mm (Figure 7). Age-0 brown trout comprised 50% of the total catch in 2013 versus 47% of the total catch in The Bottomlands section supported an estimated 508 age-0 brown trout in 2013 versus 843 age-0 fish in 2012 (a 40% decrease between 2012 and 2013). Standard error on age-0 brown trout was 13% of the estimate in 2013 compared to 8% in 2012 (Table 3). Brown trout mm in length comprised 46% of the total catch in the Bottomlands section in 2013 versus 41% of the total catch in This section supported an estimated 331 brown trout mm in length in 2013 compared to 460 brown trout in 2012 (a 28% decrease). Standard error for this size class was 8% in 2013 versus 3% in 2012 (Table 3). Brown trout 200 mm and greater comprised of 4% of the total catch in 2013 (10% in 2012) with the largest trout 247 mm in length. The Bottomlands supported an estimated 26 brown trout greater than 200 mm in 2013 compared to 99 trout in 2012 (a 74% decrease). Standard error for this size class was 15% versus 4% in 2012 (Table 3). 19
23 Table 3. Rush Creek and Lee Vining Creek mark-recapture estimates for 2013 showing total number of trout marked (M), total number captured on the recapture run (C), total number recaptured on the recapture run (R), and total estimated number and its associated standard error (S.E.) by stream, section, date, species, and size class. Mortalities (Morts) were those trout that were captured during the mark run, but died prior to the recapture run. Mortalities were not included in mark-recapture estimates and were added to estimates for accurate total estimates. NP = estimate not possible. Stream Mark - recapture estimate Section Species Date Size Class (mm) M C R Morts Estimate S.E. Rush Creek Upper Rush-BNT 9/06/2013 & 9/13/ mm mm >200 mm Upper Rush-RBT 9/06/2013 & 9/13/ mm NP NP mm NP NP >200 mm NP NP Bottomlands-BNT 9/07/2013 & 9/14/ mm mm >200 mm Bottomlands-RBT 9/07/2013 & 9/14/ mm NP NP mm NP NP >200 mm NP NP County Road-BNT 9/08/2013 & 9/15/ mm mm >200 mm County Road-RBT 9/08/2013 & 09/15/ mm NP NP mm NP NP >200 mm NP NP 20
24 Stream Mark - recapture estimate Section Species Date Size Class (mm) M C R Morts Estimate S.E. Lee Vining Creek Main Channel-BNT 9/09/2013 & 9/16/ mm mm >200 mm Main Channel-RBT 9/09/2013 & 9/16/ mm * mm >200 mm *estimate made with less than seven marked fish 300 Rush Creek - Upper - Brown Trout Number of Fish Length Class (10 mm) Figure 5. Length-frequency histogram for Upper Rush captured brown trout, September 6 th and 13 th,
25 20 Rush Creek - Upper - Rainbow Trout Number of Fish Length Class (10 mm) Figure 6. Length-frequency histogram for Upper Rush captured rainbow trout, September 6 th and 13 th, Rush Creek - Bottomlands - Brown Trout Number of Fish Length Class (10 mm) Figure 7. Length-frequency histogram of captured brown trout in the Bottomlands section of Rush Creek, September 7 th and 14 th, In 2013, a total of eight rainbow trout ranging in size from 63 mm to 181 mm were captured in the Bottomlands section (Table 3), representing 1.7% of the section s total catch (Figure 8). Of the eight rainbow trout caught, five were in the age-0 size class. No population estimate was generated for rainbow trout for this section due to insufficient numbers of recaptures. 22
26 4 Rush Creek - Bottomlands - Rainbow Trout Number of Fish Length Class (10 mm) Figure 8. Length-frequency histogram of captured rainbow trout in the Bottomlands section of Rush Creek, September 7 th and 14 th, Within the County Road section of Rush Creek a total of 551 brown trout were captured in 2013 (compared to 804 fish in 2012) and these fish ranged in size from 56 mm to 246 mm (Table 3 and Figure 9). Age-0 brown trout comprised 55% of the total number of trout captured. The County Road section supported estimated 511 age-0 brown trout in 2012 compared to an estimated 687 age-0 brown trout in 2011 (a 26% decrease). The standard error on the age-0 brown trout estimate was 8% in 2013 versus 5% in Brown trout mm comprised 42% of the total catch in the County Road section. This section supported an estimated 337 brown trout mm in 2013 (Table 3) compared to 381 trout in 2012 (a 12% decrease). Standard error for this size class was 7% of the estimate in 2013 compared to 4% in Brown trout 200 mm and greater only comprised of 3% of the total catch in 2013 with the largest trout just 246 mm in length. The County Road section supported an estimated 24 brown trout greater than 200 mm in 2013 (Table 3) versus 70 fish in 2012 (a 66% decrease). Standard error for this size class was 16% of the estimate in 2013 (same as in 2012). 23
27 150 Rush Creek - County Road - Brown Trout Number of Fish Length Class (10 mm) Figure 9. Length-frequency histogram of captured brown trout in the County Road section of Rush Creek, September 8 th and 15 th, Four rainbow trout were caught in 2013 on the County Road section (Table 3). These four fish were 131, 135, 191, and 202 mm in length (Figure 10). No population estimates were generated for rainbow trout in any of the size classes due to insufficient number of recaptures. In 2013, a single electrofishing pass captured a total of 442 brown trout in the MGORD ranging in size from 83 to 588 mm (Figure 11). A total of 25 age-0 brown trout were captured in the MGORD which comprised 5% of the total catch (24% in 2012). A total of 189 brown trout between mm in length were captured and comprised 43% of the total catch on the MGORD in 2013 (10% in 2012). Brown trout 200 mm and greater comprised 52% of the total catch on the MGORD in (62% in 2012). In 2013, a total of nine rainbow trout were captured on the MGORD, down from the 40 rainbow trout captured in 2012 (Figure 12). No age-0 rainbow trout were captured in the MGORD during the 2013 single-pass sampling. 24
28 3 Rush Creek - County Road - Rainbow Trout Number of Fish Length Class (10 mm) Figure 10. Length-frequency histogram of captured rainbow trout in the County Road section of Rush Creek, September 8 th and 15 th, Rush Creek - MGORD - Brown Trout Number of Fish Length Class (10 mm) Figure 11. Length-frequency histogram of captured brown trout in the MGORD section of Rush Creek, September 10 th
29 3 Rush Creek - MGORD - Rainbow Trout Number of Fish Length Class (10 mm) Figure 12. Length-frequency histogram of captured rainbow trout in the MGORD section of Rush Creek, September 10 th Lee Vining Creek In 2013, a total of 658 trout were captured in the Lee Vining Creek main channel section (versus 838 fish in 2012) (Table 3). Of the 658 trout captured, 531 were brown trout making up 81% of the total trout captured. Brown trout ranged in size from 59 mm to 330 mm (Figure 13). Age-0 fish comprised 45% of the total brown trout catch in 2013 (compared to 56% in 2012). Lee Vining Creek s main channel section supported an estimated 444 age-0 brown trout in 2013 while it supported an estimated 673 age-0 brown trout in Standard error for age-0 brown trout was 10% of the estimate vs s 6%. In 2013, brown trout mm in length comprised 51% of the total brown trout catch in Lee Vining Creek s main channel section (versus 8% in 2012). This section supported an estimated 331 brown trout mm in length in 2013 compared to 72 brown trout in Standard error for this size class was 8% of the estimate compared to 2011 s 9%. Brown trout 200 mm and greater comprised of 4% of the total brown trout catch in Lee Vining Creek s main channel supported an estimated 25 brown trout greater that 200 mm (versus 47 fish in 2012). Standard error for this size class was 7% of the 2013 estimate vs. 6% in
30 Number of Fish Lee Vining - Main Channel - Brown Trout Length Class (10 mm) Figure 13. Length-frequency histogram of captured brown trout in the main channel section of Lee Vining Creek, September 9 th and 16 th, A total of 127 rainbow trout were captured in Lee Vining s main channel making up approximately 19% of the total catch in 2013 (versus 32% of 2012 s total catch) (Table 3). Rainbow trout ranged in size from 57 mm to 287 mm (Figure 14). Of the 127 rainbow trout captured, 26 fish were in the age-0 size class. The 2013 age-0 estimate in the main channel was 40 rainbow trout (compared to 306 fish in 2012) and standard error was 22% of the estimate. The relatively high standard error for 2013 (was 6% in 2012) was caused by the low number of marked fish caught during the recapture run (Table 3). The 77 rainbow trout captured in the mm size class comprised 61% of the total rainbow trout catch in The 2013 estimate for rainbow trout in this size class was 94 fish and the standard error was 8% of the estimate (Table 3). No estimate was generated for this size class in 2012 because very few age-1 and older rainbow trout were caught. The 24 rainbow trout caught in Lee Vining Creek s main channel 200 mm comprised 19% of the total rainbow trout catch in The 2013 estimate for rainbow trout in this size class was 26 fish and the standard error was 8% of the estimate (Table 3). No estimate was generated for this size class in 2012 because very few age-1 and older rainbow trout were caught. 27
31 20 Lee Vining - Main Channel - Rainbow Trout Number of Fish Length Class (10 mm) Figure 14. Length-frequency histogram of captured rainbow trout in the main channel section of Lee Vining Creek, September 9 th and 16 th, In the Lee Vining Creek side channel 16 brown trout were captured in two electrofishing passes during the 2013 sampling (Table 4). Of the 16 trout captured, only a single age-0 fish was captured on the first pass (Figure 15). Brown trout mm in length made up 88% of the total catch in The estimate for this size class was 14 brown trout (Table 4). Only one brown trout in the 200 mm size class was captured in the side channel during the 2013 sampling (Figure 15). This one fish was 238 mm in length. No rainbow trout were captured in the Lee Vining Creek side channel in 2013 (Table 4). This was the fifth consecutive year that no age-0 rainbow trout were captured in the Lee Vining Creek side channel. 6 Lee Vining - Side Channel - Brown Trout Number of Fish Length Class (10 mm) Figure 15. Length-frequency histogram of captured brown trout in the side channel section of Lee Vining Creek, September 11 th,
32 Walker Creek In 2013, a total of 345 brown trout were captured in two electrofishing passes in the Walker Creek section (in 2012 a total of 296 brown trout were captured) (Table 4). Of these, 230 brown trout or 67% were age-0 fish ranging in size from 50 mm to 123 mm (Figure 16). The age-0 brown trout estimate for Walker Creek was 236 fish (compared to an estimate of 231 in 2012) with a standard error of 1.6% of the estimate. Brown trout in the mm size class (96 fish) accounted for 28% of the total catch in 2013 (compared to 15% in 2012). The population estimate for brown trout mm was 96 trout with a standard error of <1% of the estimate (Table 4). Brown trout greater than 200 mm (19 fish) accounted for 6% of the total catch in 2013 (was 9% in 2012). The population estimate for this size class was 19 brown trout with a standard error of zero since all 19 fish were captured on the first pass. The largest brown trout captured in Walker Creek in 2013 was 269 mm in length (Figure 16). A single rainbow trout was also captured in Walker Creek during the 2013 electrofishing. This fish was 203 mm in length and probably migrated out of Walker Lake downstream into the sampling section. Over the 15 years of annual fish sampling only three trout other than brown trout have been captured in Walker Creek: in 2002 a single rainbow trout, in 2006 a single brook trout, and in 2013 a single rainbow trout. Number of Fish Walker Creek - Brown Trout Length Class (10 mm) Figure 16. Length-frequency histogram of captured brown trout in Walker Creek, September 11 th,
33 Table 4. Depletion estimates made in the Lower side channel section of Lee Vining Creek and Walker Creek during September 2013 showing number of trout captured in each pass, estimated number, probability of capture (P.C.) by species and size class. Stream - Section Date Removal Species Size Class (mm) Removals Pattern Estimate P.C. Lee Vining Creek- Side Channel B-1 Brown Trout mm mm mm Rainbow Trout mm mm mm Walker Creek - above old Hwy 395-9/11/2013 Brown Trout mm mm mm Catch of Rainbow Trout in Rush and Lee Vining Creeks Beginning with the 2008 annual report rainbow trout catch numbers have largely been reported for Rush Creek. This decision was made because rainbow trout usually accounted for <5% of the total catch in Rush Creek. In 2011 GLR spilled, carrying hatchery-orgin rainbow trout out of the reservoir resulting in rainbow trout accounting for 8% of the total catch in 2011, the highest ever sampled in Rush Creek. In 2012, rainbow trout once again accounted for 5% of the total catch in Rush Creek. Although there were only 10 fewer rainbow trout captured in 2012 compared to 2011 the total number of trout in Rush Creek captured increased from 3,352 trout in 2011 to 4,697 in 2012 thus driving down the percent-catch of rainbow trout. In 2013, the rainbow trout catch in Rush Creek was down to 66 fish versus 3,035 brown trout, thus rainbow trout comprised 2% of the trout captured (66 rainbow trout/3,101 total trout). 30
34 Rainbow trout numbers in Lee Vining Creek have been variable over the last 13 years. Sufficient numbers of age-0 rainbow trout were captured in the main channel to generate population estimates for five of the 13 years sampled (Table 5). Adequate numbers of age-1 and older rainbow trout were captured in the main channel to generate population estimates five of the 13 years sampled (Table 6). The side channel produced enough numbers of age-0 and age-1 and older rainbow trout to generate population estimates for six of the 14 years sampled (Tables 7 and 8). However, no age-0 rainbow trout have been caught in the side channel in the past five years and no age-1 and older rainbows have been caught in the past three years (Tables 7 and 8). Due to rainbow trout encompassing a large portion (10-40%) of the Lee Vining Creek fishery, an effort has been made to generate density and biomass values using all data available. In years when adequate numbers of rainbows have been captured statistically valid density and biomass estimates have been generated. In years when less than adequate numbers of rainbow trout have been captured, catch numbers have been used to generate density and biomass estimates. While catch numbers are not statistically valid they are consistently lower than statistically valid estimates and allow for comparison between years (Tables 5-8). Table 5. Numbers of age-0 rainbow trout caught in Lee Vining Creek main channel section, Sample Pop Year Estimate Area of Sample Section (Ha) Number of Trout on Marking Run Number of Trout on Capture Run Number of Recap Trout Estimated Number of Trout per Hectare Number of Trout Caught (Catch) Catch per Hectare , , NP NP NP NP , NS* NP NP NP NP NP NP NP NP 1 22 *NS stands for not sampled due to high flows 31
35 Table 6. Numbers of age-1 and older rainbow trout caught in Lee Vining Creek main channel section, Sample Pop Year Estimate Area of Sample Section (Ha) Number of Trout on Marking Run Number of Trout on Capture Run Number of Recap Trout Estimated Number of Trout per Hectare Number of Trout Caught (Catch) Catch per Hectare NP NP NP NP NP NP NS* NP NP NP NP NP NP NP NP NP NP 4 45 *NS stands for not sampled due to high flows Table 7. Numbers of age-0 rainbow trout caught in Lee Vining Creek side channel section, Sample Pop Year Estimate Area of Sample Section (Ha) Number of Trout Caught on Pass #1 Number of Trout Caught on Pass #2 Number of Trout Caught on Pass #3 Estimated Number of Trout per Hectare Number of Trout Caught (Catch) Catch per Hectare NP NP , , ,
36 Table 8. Numbers of age-1 and older rainbow trout caught in Lee Vining Creek side channel section, Sample Pop Year Estimate Area of Sample Section (Ha) Number of Trout Caught on Pass #1 Number of Trout Caught on Pass #2 Number of Trout Caught on Pass #3 Estimated Number of Trout per Hectare Number of Trout Caught (Catch) Catch per Hectare NP NP NP NP NP NP NP NP NP NP
37 Relative Condition of Brown Trout After Log 10 transformations were performed on the lengths and weights of captured brown trout 100 mm, a simple linear regression analysis was then performed. All sections had r 2 values 0.98 or greater, indicating that length was strongly correlated with weight (Table 9). Table 9. Regression statistics for log 10 transformed length (L) to weight (WT) for brown trout 100 mm and longer captured in Rush Creek by sample section and year. The 2013 regression equations are in bold type. Section Year N Equation r 2 P County Road Log 10 (WT) = 2.764*Log 10 (L) < Log 10 (WT) = *Log 10 (L) < Log 10 (WT) = 2.950*Log 10 (L) < Log 10 (WT) = 3.014*Log 10 (L) < Log 10 (WT) = 2.994*Log 10 (L) < Log 10 (WT) = 2.794*Log 10 (L) < Log 10 (WT) = 2.789*Log 10 (L) < Log 10 (WT) = 3.00*Log 10 (L) < Log 10 (WT) = 2.97*Log 10 (L) < Log 10 (WT) = 2.97*Log 10 (L) < Log 10 (WT) = 3.00*Log 10 (L) < Log 10 (WT) = 2.95*Log 10 (L) < Log 10 (WT) = 2.91*Log 10 (L) < Log 10 (WT) = 2.94*Log 10 (L) < 0.01 Bottomlands Log 10 (WT) = *Log 10 (L) < Log 10 (WT) = *Log 10 (L) < Log 10 (WT) = 2.926*Log 10 (L) < Log 10 (WT) = 2.999*Log 10 (L) < Log 10 (WT) = 2.920*Log 10 (L) < Log 10 (WT) = 2.773*Log 10 (L) <0.01 Upper Rush Log 10 (WT) = *Log 10 (L) < Log 10 (WT) = *Log 10 (L) < Log 10 (WT) = 3.006*Log 10 (L) < Log 10 (WT) = 2.995*Log 10 (L) < Log 10 (WT) = 2.941*Log 10 (L) <
38 Table 9 (continued). Section Year N Equation R 2 P Log 10 (WT) = 2.967*Log 10 (L) < Log 10 (WT) = 2.867*Log 10 (L) < Log 10 (WT) = 2.99*Log 10 (L) < Log 10 (WT) = 3.02*Log 10 (L) < Log 10 (WT) = 2.97*Log 10 (L) < Log 10 (WT) = 2.96*Log 10 (L) < Log 10 (WT) = 2.94*Log 10 (L) < Log 10 (WT) = 2.99*Log 10 (L) < Log 10 (WT) = 3.00*Log 10 (L) < Log 10 (WT) = 2.93*Log 10 (L) < 0.01 MGORD Log 10 (WT) = *Log 10 (L) < Log 10 (WT) = *Log 10 (L) < Log 10 (WT) = 2.917*Log 10 (L) < Log 10 (WT) = 2.892*Log 10 (L) < Log 10 (WT) = 2.974*Log 10 (L) < Log 10 (WT) = 2.827*Log 10 (L) < Log 10 (WT) = 2.914*Log 10 (L) < Log 10 (WT) = 2.956*Log 10 (L) < Log 10 (WT) = 2.984*Log 10 (L) < Log 10 (WT) = 2.873*Log 10 (L) < Log 10 (WT) = 2.909*Log 10 (L) <0.01 Relative condition factors of brown trout 150 to 250 mm in length in 2013 decreased in nearly all sections (six of seven sections) from 2012 (Figure 17). For the first time in the 15-year history of fisheries monitoring in Rush and Lee Vining creeks, no sampling section had a relative condition factor The Upper Rush section had a relative condition factor of 0.97 in 2013, a decrease from 0.98 in 2012 and 1.00 in 2011 (Figure 17). The lowest condition factor value in the 14-year sampling history was 0.96 in The Bottomlands section had a relative condition factor of 0.91 in 2013, a decrease from 0.92 in 2012 (Figure 17). Like the County Road section, 2013 was the fourth consecutive decrease in condition factor in the Bottomlands section since 2009 s value of The 2013 conditon 35
39 factor of 0.91 was the lowest recorded for the six years that the Bottomlands section has been sampled (Figure 17). Relative condition factor in the County Road section for 2013 was 0.90 (Figure 17). The 2013 value was the second lowest condition factor for the 14 years of County Road data (2008 had a condition factor of 0.89). The 2013 value was also the fourth straight decrease in condition factor since 2009 s value of 1.00 (Figure 17). The MGORD s 2013 value of 0.94 was the lowest condition value in the 11 years of sample data for this section and the fourth straight decrease from 2009 s value 1.02 (Figure 17). For MGORD brown trout 300 mm in length, the condition factor was In 2013, Lee Vining Creek s main channel had the lowest condition factor in sampling history at 0.95, the first time this section s condition factor has dipped below 1.00 (Figure 17). Rainbow trout 150 to 250 mm in length in the main channel also had a condition factor of less than 1.00 (Figure 18). Rainbow trout in 2013 once again had a better condition factor than the brown trout (0.96 versus 0.95) in the main channel of Lee Vining Creek (Figure 18). In 2013, brown trout in Lee Vining Creek s side channel had a condition factor 0.93, an increase from 2012 s value of 0.83 (Figure 17). This was the second consecutive year in the 14 years of sampling the side channel that condition factors were less than For the third year in a row, no rainbow trout were captured in the Lee Vining Creek side channel. Walker Creek, brown trout had a condition factor of 0.93 in 2013, the first time it s been below 1.00 since 2008 (Figure 17). 36
40 Walker Creek Rush MGORD Rush Upper Rush Bottomlands Rush County Road Lee Vining Main Channel Lee Vining Side Channel Condition Factor Figure 17. Condition factors for brown trout 150 to 250 mm long in sample sections of Rush, Lee Vining, and Walker Creeks from 1999 to
41 Brown Trout Rainbow Trout Sample Year Condition Factor Figure 18. Comparison of condition factors for rainbow trout and brown trout 150 to 250 mm long in the main channel section of Lee Vining Creek from 2000 to Main channel was not sampled in 2006 due to high flows. 38
42 PIT Tag Recaptures In 2009, a total of 1,596 trout received PIT tags and adipose fin clips in Rush, Lee Vining, and Walker Creeks. Of the 1,596 trout tagged, 711 were age-0 and 861 were age-1+ brown trout, 19 were age-0 rainbow trout, and five were age-1 and older rainbow trout. In 2008, age-0 trout received adipose fin clips to help track growth rates of that cohort of trout into the future. Knowing that this cohort of trout was age-1 in 2009, 224 trout with adipose fin clips were PIT tagged in All trout in the MGORD were tagged; a total of 54 age-0 brown trout and 642 age-1 and older brown trout. No rainbow trout were captured in the MGORD. Most of these trout in the MGORD were older than age-1 (Table 10). In 2010, a total of 1,274 trout received PIT tags and adipose fin clips in Rush, Lee Vining, and Walker Creeks. Of the 1,274 trout, 855 were age-0 and 43 were age-1 and older brown trout. Four age-0 and one age-1 and older rainbow trout received PIT tags and adipose fin clips. Again all trout in the MGORD (371 trout) were tagged and given an adipose fin clip. Of the 371 trout, 359 were age-1 and older brown trout and 12 were age-1 rainbow trout. Like 2009, most of the trout tagged in the MGORD were older than age-1 (Table 11). In 2011, a total of 1,065 trout received adipose fin clips and PIT tags in Rush, Lee Vining, and Walker Creeks. Of these 1,065 trout, 851 were age-0 brown trout and 19 were age-1 and older brown trout. Fifty age-0 rainbow trout received PIT tags and adipose fin clips. All age-1 and older trout in the MGORD (145 trout) were tagged and given adipose fin clips. Of the 145 trout 142 were age-1 and older (mostly older) brown trout and three were age-1 and older rainbow trout (Table 12). In 2012, a total of 496 trout received PIT tags and adipose fin clips in Rush, Lee Vining, and Walker Creeks. Of the 496 trout tagged, 412 were age-0 and 4 were age-1 and older brown trout. For rainbow trout, only age-0 fish were tagged in 2012 which totaled 80 trout. No new tags were implanted in trout in the County Road section, but trout with missing adipose fins and did not produce a tag number when scanned were retagged. No trout in the MGORD in 2012 were tagged or retagged due to a limited number of PIT tags available for deployment (Table 13). In 2013 no PIT tags were implanted in any fish. Only length and weight data from recaptures of previously tagged fish were collected during the 2013 sampling. Implications of failing to implant PIT tags during the 2013 season will be discussed later in this report. In the following text, growth rate between 2012 and 2013 will be referred as a 2013 growth rate. A 2013 trout refers to a fish recaptured in September of An age of a PIT tagged trout reflects the age during the sampling year. For instance, an age-1 trout in 2013 indicates that a trout had been tagged in 2012 as age-0 and its length and weight were measured in 2013 when it was recaptured. 39
43 Table 10. Total numbers of trout implanted with PIT tags during the 2009 sampling season, by stream, sample section, age-class and species. Stream Sample Section Number of Age-0 Brown Trout Number of Age-1 Brown Trout Number of Age-0 Rainbow Trout Number of Age-1 Rainbow Trout Reach Totals Upper Rush Trout Rush Creek Bottomlands Trout County Road Trout MGORD * Trout Lee Vining Main Channel Trout Creek Side Channel Trout Walker Creek Above old Trout Totals: Total Trout: 1,596 *Many of these MGORD trout were >age-1. Table 11. Total numbers of trout implanted with PIT tags during the 2010 sampling season, by stream, sample section, age-class and species. Stream Sample Section Number of Age-0 Brown Trout (<125 mm) Number of Age-1 and older Brown Trout Number of Age-0 Rainbow Trout (<125 mm) Number of Age-1 and older Rainbow Trout Reach Totals Upper Rush Trout Rush Creek Bottomlands Trout County Road Trout MGORD 1 359* Trout Lee Vining Main Channel Trout Creek Side Channel Trout Walker Creek Above old Trout Totals: Total Trout: 1,274 *Many of these MGORD trout were >age-1. 40
44 Table 12. Total numbers of trout implanted with PIT tags during the 2011 sampling season, by stream, sample section, age-class and species. Stream Sample Section Number of Age-0 Brown Trout (<125 mm) Number of Age-1 and older Brown Trout Number of Age-0 Rainbow Trout (<125 mm) Number of Age-1 and older Rainbow Trout Reach Totals Upper Rush Trout Rush Creek Bottomlands Trout County Road Trout MGORD 8 142* Trout Lee Vining Main Channel Trout Creek Side Channel Trout Walker Creek Above old Trout Totals: Total Trout: 1,065 *Many of these MGORD trout were >age-1. Table 13. Total numbers of trout implanted with PIT tags during the 2012 sampling season, by stream, sample section, age-class and species. Stream Sample Section Number of Age-0 Brown Trout (<125 mm) Number of Age-1 and older Brown Trout Number of Age-0 Rainbow Trout (<125 mm) Number of Age-1 and older Rainbow Trout Reach Totals Upper Rush Trout Rush Creek Bottomlands Trout County Road Trout MGORD Trout Lee Vining Main Channel Trout Creek Side Channel Trout Walker Creek Above old Trout Total Trout: Totals:
45 Growth of Age-1 Brown Trout between 2012 and 2013 In 2013, a total of 64 age-1 brown trout were recaptured that were tagged as age-0 fish in 2012, for a recapture rate of 13% (Table 14). All sections experienced decreases in average growth rates (length) of age-1 brown trout when compared to 2012 age-1 brown trout (Table 15). When comparing 2012 and 2013 growth rates as expressed in weight (g) most sections had decreased weight gains for age-1 trout (Table 15). The exception was the Upper Rush section, where growth in weight increased by 2 g between 2012 and 2013 (Table 15). For the Upper Rush section, the average 2013 growth rates of six age-1 PIT tagged brown trout were 67 mm and 35 g. When compared to 2012 brown trout of the same age, the average growth rates were 5 mm shorter, but 2 g heavier. When compared to 2009 brown trout growth rates (the highest rates sampled), the 2013 growth rates were 22 mm and 16 g less (Table 15). For the Bottomlands section, the average 2013 growth rates of eight age-1 PIT tagged brown trout were 58 mm and 25 g. Compared to 2012 PIT tagged age-1 recaptures, the 2013 trout were 2 mm shorter and had similar average weight gain. When compared to the 2009 growth rates (the highest average annual growth rate), the 2013 growth rates were reduced by 28mm and 19 g (Table 15). No age-1 fish with PIT tags were recaptured in the County Road section of Rush Creek because no age-0 fish were tagged during the 2012 sampling. Also, the MGORD failed to produce any age-1 recaptures in 2013, thus no growth rates were available for age-1 brown trout in the MGORD. The 26 PIT-tagged age-1 brown trout recaptured in the Lee Vining Creek main channel had an average growth rate of 61 mm and 27 g in Compared to 2012 PIT tagged age-1 recaptures, the 2013 brown trout growth rates were reduced by 38 mm and 25 g (Table 15). Only a single PIT tagged brown trout was captured in Lee Vining Creek side channel in This fish had been tagged in 2011, thus calculation of a one-year growth rate between 2012 and 2013 was not feasible. The ten PIT tagged age-1 brown trout recaptured in the Walker Creek section had an annual growth rate of 59 mm and 23 g in These 2013 growth rates were 9 mm and 13 g less than the 2012 growth rates of 68 mm and 36 g for age-1 fish (Table 15). 42
46 Table 14. Number of brown and rainbow trout recaptured in 2013, implanted with PIT tags in 2009 through 2013, by stream reach, sample section, and of known age. Rainbow trout numbers denoted within (#). Sample Number of Number of Number of Number of Number of Creek Reach Totals Section Age-1 Trout Age-2 Trout Age-3 Trout Age-4 Trout Age-5+ Trout Upper Rush 6 10 (1) Trout Rush Creek Bottomlands Trout County Road Trout MGORD * * * * * 35** Trout Lee Vining Creek Main Channel 26 (14) Trout Side Channel Trout Walker Creek Above old Trout Known Age Class Totals: Total Trout: 162 * MGORD brown trout ages are unknown and are presented by size class not age. **Fifteen fish were captured in both 2012 and 2013, thus annual growth of these fish can be determined. 43
47 Table 15. Average growth (length and weight) of all brown trout recaptured from 2009 through 2013 by age. NOTE: rainbow trout from Lee Vining Creek main channel are included. Average Annual Average Annual Stream Stream Reach Cohort Growth Length (mm) Growth Weight (g) Age Upper Rush Age Age Age Age Rush Age Bottomlands Creek Age Age Age County Road Age Age ** ** 1 Age 4 Lee Vining Creek* Walker Creek Main Channel Main Channel Rainbow Trout Above Old 395 * No consectutive-year recaps in Side Channel **Only one trout recaptured Age 1 80* ** Age Age ** 92 48** Age 4 21** 41** Age Age 2 Age 3 Age 4 Age Age Age Age 4 7 2** 2-16** 44
48 Growth of Age-2 Brown Trout between 2012 and 2013 In 2013, a total of 35 known age-2 brown trout were recaptured that were tagged as age-0 fish in 2011, for a recapture rate of 4.1% (35/851 age-0 fish tagged in 2011) (Table 14). Most sections exhibited slight-to-moderate decreases in average growth rates (length and weight) of age-2 brown trout when compared to growth rate of age-2 brown trout captured in The Upper Rush section had average growth rates of 41 mm and 42 grams for the 10 age-2 brown trout recaptured in Compared to the 2012 growth rates, the 2013 brown trout growth rates were reduced by 2mm, but the growth rate in weight remained at 42 g. By weight, both the 2012 and 2013 growth rates (during dry year-types) were approximately 40% reductions from 2009 and 2010 growth rates (Table 15). The Bottomlands section of Rush Creek had average growth rates of 27 mm and 22 grams for the eight age-2 brown trout recaptured in Compared to 2012 rates, the growth rates of age-2 brown trout were reduced by 3 mm and 6 g in 2013 (Table 15). Growth rates of age-2 brown trout in the Bottomlands section have declined annually since 2010 (Table 15). The County Road section of Rush Creek had average growth rates of 23 mm and 16 g for the nine age-2 brown trout recaptured in Compared to 2012 rates, the growth rates of age-2 brown trout were reduced by 3 mm and 3 g in 2013 (Table 15). Similar to the Bottomlands sections, growth rates of age-2 brown trout in the County Road section have declined annually since 2010 (Table 15). The Lee Vining Creek main channel had four age-2 PIT tagged brown trout recaptured in The average growth rates of these trout were 33 mm and 34 g (Table 15). When compared to the 2012 growth rates of age-2 fish, the 2013 rates declined dramatically, by 57% for length and 69% for weight (Table 15). Walker Creek had three age-2 PIT tagged brown trout recaptured in Average growth rates of these fish were 27 mm and 21 g (Table 15). When compared to the 2012 growth rates of age-2 fish, the 2013 rates declined by 33% for length and 36% for weight (Table 15). Growth of Age-3 Brown Trout between 2012 and 2013 In 2013, a total of 23 known age-3 brown trout were recaptured that were tagged as age-0 fish in 2010, for a recapture rate of 2.7% (23/855 age-0 fish tagged in 2010) (Table 14). The oneyear growth of trout between age-2 and age-3 was typically less than the one-year growth rates of younger fish. In the Upper Rush section, two PIT tagged age-3 brown trout were recaptured during the 2013 sampling; however these fish were not captured in 2012 as age-2 fish. Thus, no one-year growth rates for age-3 fish were available for the Upper Rush section in
49 In the Bottomlands section, nine PIT tagged age-3 brown trout were recaptured during the 2013 sampling and seven of these fish had been caught as age-2 fish in These seven brown trout had average growth rates of 27 mm and 22 g (Table 15). Compared to 2012 rates, the growth rates of age-3 brown trout were reduced by 3 mm and 6 g in 2013 (Table 15). In the County Road section, seven PIT tagged age-3 brown trout were recaptured during the 2013 sampling and five of these fish had been caught as age-2 fish in These five brown trout had average growth rates of 10 mm and 1 g (Table 15). Only one of the five age-3 fish gained weight between 2012 and 2013 (14 g); three fish lost weight (1-5 g) and one weighed the same in 2012 and In the Lee Vining Creek main channel a single PIT tagged age-3 brown trout was recaptured in Its one-year growth between 2012 and 2013 was 23 mm and 48 g (Table 15). In Walker Creek two PIT tagged age-3 brown trout were recaptured in These two trout had average growth rates of 9 mm and 2 g. Compared to 2012 rates, the growth rates of age-3 brown trout declined by 50% for length and 83% for weight in 2013 (Table 15). Growth rates of age-3 brown trout in the Walker Creek have declined annually over the past three years (Table 15). Growth of Age-4 and Age-5 Brown Trout between 2012 and 2013 Only two PIT tagged age-4 brown trout were recaptured in 2013 that were tagged as age-0 in 2009 for a recapture rate of 0.3% ( 2/711 age-0 fish tagged in 2009) (Table 14). Both of these age-4 fish were recaptured in the Upper Rush section and had average growth rates of 12 mm and -22 g (Table 15). Between 2012 and 2013, one fish exhibited growth rates of 15 mm and 27 g and the other fish grew by 9 mm but lost 70g in weight. The 2013 sampling season was the first opportunity for the recapture of age-5 fish that were PIT tagged at age-1 in In Walker Creek a single age-5 brown trout was recaptured and between 2012 and 2013 this fish grew 2 mm in length, but lost 16 g in weight. This fish had been recaptured every year since being tagged in 2009 and between 2012 and 2013 was the first time this fish had lost weight. Another age-5 brown trout recaptured in 2013 was from the County Road section and was 235 mm in length. This fish had last been caught in 2011 and in two years had grown 5 mm in length and had lost 15 g in weight. A third probable age-5 fish was a brown trout in the Upper Rush section. This fish was re-implanted with a PIT tag in 2011 as an ad-clipped/shed tag fish and was 286 mm and 217 g when re-tagged. It was recaptured in 2012 and was 287 mm and 171 g (lost 46 g). When caught in 2013, this fish had grown to 298 mm in length and had gained back 33 g (weighed 204 g). Growth of MGORD Brown Trout by size class between 2012 and 2013 Because there were no recaptures of known aged brown trout in the MGORD, determination of actual age of recaptured trout was not possible. Thus, growth rate comparisons within the 46
50 MGORD were based on size classes (Table 16). Due to the majority of the brown trout in the MGORD being larger sized, size classes were based on the RSD values for the MGORD. When evaluating growth rates by size classes, the size classes in Table 16 designate each fish s size class in 2012, not its size class at the time of recapture in In 2013, a total of 35 PIT tagged brown trout were recaptured during the single electrofishing pass made on September 10 th. Of these 35 recaptures, 15 fish had also been captured in 2012, thus one-year growth rates between 2012 and 2103 were calculated for these fish. There were six PIT tagged brown trout captured in the MGORD in 2012 within the mm size class that were recaptured in These six trout had averages growth rates of 7 mm and 2 g in 2013 (Table 16). Of these six fish, three of them lost weight between 2012 and 2013 (two fish lost 14 g and one fish lost 46 g). Compared to the three previous years, average growth rates for this size class in 2013 were the lowest for both length and weight (Table 16). There were six PIT tagged brown trout captured in the MGORD in 2012 within the mm size class that were recaptured in These six trout had averages growth rates of 12 mm and 49 g in 2013 (Table 16). Of the six fish, two lost weight (1 and 66 g) between 2012 and 2013; and the four remaining fish experienced weight gains of 16, 21, 39, and 287 g. There were three PIT tagged brown trout captured in the MGORD in 2012 within the >375 mm size class that were recaptured in These three trout had averages growth rates of 10 mm and -2 g in 2013 (Table 16). Of the three fish, one lost weight (106 g) between 2012 and 2013; and the two remaining fish experienced weight gains of 24 and 75 g. Table 16. Average growth rates, length (mm) and weight (g), of all brown trout recaptured from 2009 through 2013 by size class. Average Annual Average Annual Size Stream Growth Length (mm) Growth Weight (g) Class Reach (mm) Rush Creek MGORD Section > Growth of MGORD Brown Trout from non-consecutive years Twenty of the 35 PIT tagged brown trout captured in the MGORD during the 2013 sampling were captured, measured and weighed in years prior to 2012; thus annual growth calculations were not possible. These 20 brown trout exhibited a wide range growth, from a fish tagged in 2010 that grew 1 mm in length and lost 415 g in three years (# ) to a fish tagged in 2009 that grew 136 mm and gained 460 g in four years (# ) (Table 17). 47
51 Table 17. PIT tagged brown trout caught in the MGORD section, nonconsecutive recaptures. Last 7 Digits of PIT Tag # Year of Capture Total Length (mm) Weight (g) Difference in Length (mm) Difference in Weight (g)
52 Apparent one-year survivals of PIT tagged Brown Trout Apparent one-year survivals of trout between age-0 and age-1 (2012 to 2013) were based on the number of age-0 brown trout originally PIT tagged with an assumption that any trout not recaptured the following year had died ( apparent mortality ) unless those trout were recaptured in another section. Any PIT tagged trout recaptured in a different section were counted in the apparent survival calculation for the section where they were originally tagged. Apparent one-year survivals for brown trout in Rush Creek in 2013 was 5% for the Upper Rush section (6% in 2012) and 7% for the Bottomlands section (25% in 2012). In 2013, the Lee Vining Creek main channel had apparent one-year survivals of 21% for brown trout (46% in 2012) and 19% for rainbow trout. Walker Creek s apparent one-year survival for 2013 was 17%, compared to 29% in Overall, the three creeks had apparent one-year survivals of 13% for all PIT tagged brown trout and rainbow trout (was 15% for brown trout in 2012). Average Growth Rate of Rainbow Trout Because in 2012 there was successful reproduction of rainbow trout in Lee Vining Creek, 72 age-0 fish were PIT tagged during the September 2012 field season. During the 2013 sampling, 14 age-1 PIT tagged rainbow trout were recaptured in the main channel section. These age-1 fish exhibited superior growth rates when compared to the age-1 brown trout, with rates of 61 mm in length and 47 g in weight (Table 15). In the Upper Rush section, a rainbow trout that was tagged in 2011 as an age-0 fish (72 mm and 4 g) was recaptured at age-1 in 2012 and had grown 91 mm and 44 g. This fish was also recaptured in 2013 at age-2 and had grown another 59 mm and gained 56 g. None of the eight age-0 rainbow trout implanted with PIT tags in Upper Rush and the Bottomlands in 2012 were recaptured as age-1 fish in 2013 (Table 13). Movement of PIT Tagged Trout between Sections From 2009 to 2012 a total of 4,071 PIT tags were surgically implanted in brown and rainbow trout in the following stream reaches: Upper Rush, County Road, Bottomlands, MGORD, and Walker Creek. Between 2010 and 2013, 25 brown trout have been recaptured in a stream reach other than where they were initially tagged. The majority of movement between sections has occurred from the Upper Rush section upstream into the MGORD. There has also been some movement between the Bottomlands and County Road sections. With the PIT tagged fish, no other movement between sections has been recorded. The 2012 Annual Fisheries Report presented the summarized data for 23 brown trout that had moved from one section to another. In all cases, fish which moved experienced higher growth rates than other members of their cohorts which stayed in the section where they had been tagged (LADWP 2013). These growth differences were most markedly different for brown trout 49
53 PIT tagged as age-0 fish in the Upper Rush section that were eventually recaptured in the MGORD. In 2013, two PIT tagged brown trout were recaptured in the MGORD that were originally tagged in the Upper Rush section. Fish # was tagged as an age-0 fish in 2010 and was recaptured in Upper Rush in 2011, the same section it was originally tagged in. Two years later this fish was caught in the MGORD as a 255 mm/169 g age-3 fish. The second fish that moved between Upper Rush and the MGORD was # that was tagged at age-0 in 2011 and was caught in the MGORD in 2013 as an age-2 fish that was 215 mm in length and weighed 94 g. Because neither of these fish were caught in 2012, it is uncertain when or what age they migrated upstream into the MGORD. PIT tagged brown trout moving between Upper Rush and the MGORD must travel at least 1.4 miles. We have yet to record one of these tagged fish moving back downstream into the Upper Rush section. We have also never recorded a PIT tagged fish making any larger migrations within Rush Creek; however we do know some fish make more extensive migrations. During the radio telemetry study, approximately 50% of the radio-tagged MGORD brown trout migrated downstream during the spawning season (Taylor et al. 2009). Some of these fish moved back up into the MGORD within several weeks, while others returned the following spring. For example, Code 23 (mature female) travelled 12,400 feet (2.35 miles) in a two-week period. Another large female brown trout (Code 21) logged 13,350 feet (2.53 miles) of gross movement in 10 days, out of the MGORD and back. Shed Rate of PIT Tags between 2009 and 2013 In 2013, a total of 12 brown trout with adipose fin clips were recaptured and failed to produce a PIT tag number when scanned with the tag reader. Assuming that all 12 trout in 2013, all 13 fish in 2012, all eight trout in 2011, and all 45 trout in 2010 were previously PIT tagged, the calculated shed rate was 1.8% (78 shed tags/4,255 tags deployed). This rate was lower than rates reported by other PIT tagging studies (Ombredane et al. 1998; Bateman and Gresswell 2006 as cited in Taylor and Knudson. 2011). Comparison of Growth Rates by Age-class amongst Sample Sections During 2013, five age-classes of PIT tagged brown trout were recaptured within six fisheries monitoring sections in Rush, Walker and Lee Vining creeks (Table 18). In 2013, age-1 rainbow trout tagged as age-0 fish in 2012 were also recaptured in Lee Vining Creek. Along with providing age-specific growth information for each section, these data also allowed comparisons of growth rates between sample sections (Table 18). The age-2 size ranges for the County Road and Bottomlands sections were similar in 2013 and the average lengths for age-2 brown trout were within 6 mm of each other (Table 18). The difference between the smallest age-3 trout in the County Road and Bottomlands sections was 39 mm while the difference between the largest age-3 trout was 6 mm; however the average 50
54 lengths of age-3 fish were just 7 mm apart (Table 18). No PIT tagged fish older than age-3 were captured in the Bottomlands section. A single age-5 brown trout was caught in the County Road section and this fish was only 235 mm in length (Table 18). This fish was previously captured in 2011 and its two-year growth rate was only 5 mm in length and had lost 15 g in weight. The size range of age-1 brown trout in the Upper Rush section was larger than the Bottomlands section and Upper Rush s average age-1 length was 15 mm longer (Table 18). This discrepancy in age-class lengths increased with subsequent ages. For age-2 brown trout, the Upper Rush fish had an average length of 204 mm which was 27 mm longer than age-2 fish in the Bottomlands section and 33 mm longer than age-2 fish in the County Road section (Table 18). For age-3 brown trout, the Upper Rush fish had an average length of 245 mm which was 41 mm longer than age-3 fish in the Bottomlands section and 48 mm longer than age-3 fish in the County Road section (Table 18). The one age-5 brown trout caught in Upper Rush was 63 mm longer than the one age-5 fish caught in the County Road section. These increasing descrepancies were mainly due to higher average growth rates in the Upper Rush for all age classes than those in the lower two sections (Table 18). In fact, age-2 brown trout in Upper Rush had an average length greater than age-3 fish in the County Road section, 205 mm versus 197 mm (Table 18). In the main channel of Lee Vining Creek age-2 and age-3 brown trout were slightly larger than those same age classes in Rush Creek, 10 mm and 8 mm respectively (Table 18). The age-3 size class in Lee Vining Creek was similar to the age-4 size class trout in Rush Creek. No PIT tagged brown trout greater than age-3 were captured in Lee Vining Creek. The highest average length for any age-1 fish was for rainbow trout in Lee Vining Creek (Table 15). The age-1 rainbow trout had an average length of 179 mm, larger than the average length of age-2 brown trout in the Bottomlands and County Road sections of Rush Creek (Table 18). In the 2012 Annual Fisheries Report, PIT tag data from Walker Creek showed that age-2 and age-3 brown trout were smaller than the same cohorts in other sections of Rush Creek. In 2013, age-2 and age-3 brown trout in Walker Creek were, on average, larger than the same cohorts in the Bottomlands and County Road sections of Rush Creek (Table 18). One PIT tagged age-4 brown trout was recaptured in 2013 and this individual had been recaptured each year (four times) since tagged at age-0 in Between 2012 and 2013, this fish grew 2 mm longer, but lost 16 g in weight. These findings of average lengths by age-class appear to support the previous conclusions by the Stream Scientist that very few brown trout reach age-4 or older on Rush Creek or Lee Vining Creek. Also, the low growth rates that brown trout exhibited in Rush Creek during dry runoff years make it highly unlikely that many fish survive long enough to attain lengths 300 mm. 51
55 Table 18. Size range of PIT tagged fish recaptured in 2013 by age class for brown trout populations at four electrofishing sections on Rush and Walker Creeks and for brown trout and rainbow trout on Lee Vining Creek. Creek Section Cohort Size Range (mm) Average Length (mm) Age Upper Age Rush Age Age Age Age Age Bottomlands Age Age-4 None captured Rush Age-5 None captured Creek Age-1 None available for capture County Age Road Age Age-4 None captured Age Age Walker Age Creek Age Age Age-5 None captured Age Brown Trout in Age Main Age Channel Age-4 None captured Lee Vining Age-5 None captured Creek Age Rainbow Trout Age-2 None available for capture in Main Age-3 None available for capture Channel Age-4 None captured Age-5 None captured 52
56 Estimated Trout Densities Age-0 Brown Trout The Upper Rush section had an estimated density of 5,733 age-0 brown trout/ha in 2013, a decrease of 33% from 2012 s second highest estimate of 8,615 trout/ha (Figure 19). The 2013 density value on the Upper Rush section was 15% lower than the 14 year average of 6,739 trout/ha. The Bottomlands section of Rush Creek had a density estimate of 1,550 age-0 brown trout/ha in This estimate was a 41% decrease in the number of trout/ha when compared to the 2012 estimate of 2,616 trout/ha (Figure 19). The 2013 estimate was the lowest age-0 estimate since the start of sampling the Bottomlands section in When compared to the six-year average of 2,419 trout/ha, 2013 s estimate was 46% lower. The density estimate of age-0 brown trout in the County Road section of Rush Creek in 2013 was 1,992 trout/ha (Figure 19). The 2013 estimate was a 28% decrease from the 2012 estimate of 2,781 trout/ha. This year s density estimate is the fifth lowest estimate of all years sampled and was 24% lower compared to the 14-year average of 2,605 trout/ha (Figure 19). In Walker Creek the 2013 density estimate of 7,193 age-0 brown trout/ha was a 49% increase over the 2012 estimate of 4,813 trout/ha and was the second highest in the 15-year sampling period (Figure 19). The 2013 density estimate of 7,193 trout/ha was 95% higher than the 15- year average of 3,696 trout/ha (Figure 19). In 2013, the age-0 brown trout density estimate in the main channel of Lee Vining Creek was 3,055 trout/ha which was a 42% decrease from the 2012 density estimate of 5,293 trout/ha (Figure 20). The 2013 estimate was still nearly twice the 15 year average of 1,741 trout /ha. The 2013 density estimate of age-0 brown trout on the Lee Vining Creek side channel was 51 trout/ha which was a 92% decrease from the 2012 estimate of 658 trout/ha (Figure 20). In 2013, only a single age-0 brown trout was captured in the Lee Vining Creek side channel. 53
57 Age-0 Brown Trout Rush Ck - County Rd. Rush Ck - Bottomlands Rush Ck - Upper Walker Creek Number of Fish per Hectare Figure 19. Estimated number of age-0 brown trout per hectare in Rush Creek and Walker Creek from 2000 to
58 Age-0 Brown Trout Lee Vining Ck - Side Channel Lee Vining Ck - Main Channel Number of Fish per Hectare Figure 20. Estimated number of age-0 brown trout per hectare in Lee Vining Creek from 1999 to
59 Age-1+ Brown Trout The Upper Rush section had an estimated density (number per hectare) of 1,622 age-1+ brown trout/ha in 2013, a decrease of 19% from the 2012 estimate of 1,993 trout/ha (Figure 21). The 2013 density value was the fifth highest in the 15-year sampling period. The Bottomlands section of Rush Creek produced a density estimate of 1,089 age-1+ brown trout/ha in 2013, a 37% decrease from the 2012 estimate of 1,735 trout/ha (Figure 21). The 2013 age-1+ density estimate was lowest since the start of sampling the Bottomlands section in 2008 (Figure 21). The density estimate of age-1+ brown trout for the County Road section in 2013 was 1,406 trout/ha (Figure 21). The 2013 estimate was a 23% decrease from the 2012 estimate of 1,826 trout/ha. This year s density estimate was the sixth highest estimate of the 14 years the County Road section has been sampled (Figure 21). The 2013 density estimate for age-1+ brown trout for the Walker Creek section was 3,505 trout/ha which was a 122% increase from the 2012 estimate of 1,578 trout/ha (Figure 21). The 2013 density estimate of age-1+ brown trout was the highest estimate ever for the 15 years that Walker Creek has been sampled (Figure 21). The 2013 density estimate for age-1+ brown trout in the Lee Vining main channel section was 2,449 trout/ha., an increase of 161% from the 938 trout/ha in The 2013 estimate was the highest density estimate for this section for the 14 seasons that estimates have been generated (2006 was not sampled due to high flows) (Figure 22). In 2013, the side channel of Lee Vining Creek produced an estimated density of 768 age-1 and older brown trout/ha which was the highest estimate ever generated for this section and a 27% increase from the 2012 estimate of 603 fish/ha (Figure 22). The 2013 estimate was the third straight season in which this estimate has increased and the second straight year that the density estimates of age-1+ brown trout have been the highest ever recorded in the Lee Vining Creek side channel (Figure 22). 56
60 Rush Ck - County Rd. Age-1+ Brown Trout Rush Ck - Bottomlands Rush Ck - Upper Rush Ck - MGORD Walker Creek Number of Fish per Hectare Figure 21. Estimated number of age-1 and older brown trout per hectare in sections of Rush and Walker Creeks from 1999 to
61 Lee Vining Ck - Side Channel Age-1+ Brown Trout Lee Vining Ck - Main Channel Number per Hectare Figure 22. Estimated number of age-1 and older brown trout per hectare in sections of Lee Vining Creek from 1999 to
62 Age-0 Rainbow Trout For the fifth consecutive year no age-0 rainbow trout were captured in the Lee Vining Creek side channel. For the Lee Vining Creek main channel, the estimated densities of age-0 rainbow trout decreased by 89% from 2,393 trout/ha in 2012 to 275 trout/ha in 2013 (Figure 23). However, when compared to the 14 years that the main channel was sampled, the 2013 density estimate was the fourth highest estimate (Figure 23). In six sampling years, insufficient numbers of age-0 rainbow trout were captured to generate population estimates (density estimates were derived from catch data) and in three sampling years no age-0 rainbow trout were captured in the main channel section of Lee Vining Creek (Figure 23). Age-0 Rainbow Trout Lee Vining Ck - Side Channel Lee Vining Ck - Main Channel Numbers of Fish per Hectare Figure 23. Estimated number of age-0 rainbow trout per hectare in sections of Lee Vining Creek from 1999 to
63 Age-1+ Rainbow Trout For the third consecutive year no age-1 and older rainbow trout were captured in the Lee Vining Creek side channel. For the Lee Vining Creek main channel, the estimated densities of age-1 and older rainbow trout increased more than tenfold (1,080%) from 70 trout/ha in 2012 to 826 trout/ha in 2013 (Figure 24). The 2013 density estimate of age-1+ rainbow trout is the second highest in the 14 years in which data were collected in this section (Figure 24). Sampling years ( , , 2007 and 2011) produced insufficient numbers of age-1 and older rainbow trout to generate population estimates, thus these density estimates were derived from catch data. Age-1+ Rainbow Trout Lee Vining Ck - Side Channel Lee Vining Ck - Main Channel Number of Fish per Hectare Figure 24. Estimated number of age-1 and older rainbow trout per hectare in sections of Lee Vining Creek from 1999 to
64 Estimated Trout Densities Expressed in Numbers per Unit Length The Upper Rush section produced a total density estimate of 6,105 brown trout per kilometer in 2012 which was 26% lower than 2012 s estimate of 8,288 fish/km (Table 19). The estimated numbers of brown trout per kilometer have fallen for two straight years in the Upper Rush section. The estimated age-1+ brown trout density in 2013 was 1,347 brown trout/km which was 11% lower than the 2012 estimate of 1,516 fish/km (Table 19). The Bottomlands section in 2013 produced a total density estimate of 1,980 brown trout/km which was a 38% decrease from the 2012 estimate of 3,208 fish/km (Table 19). The estimated density of age-1+ brown trout in 2013 was 817 fish/km, a 36% decrease from 2011 s estimate of 1,279 fish/km (Table 19). In 2013, both the total numbers of fish/km and numbers of age-1+ fish/km were the lowest estimates for the six-year sampling period in the Bottomlands section. The County Road section in 2013 had a total density estimate of 2,651 brown trout/km, which was a 24% decrease from the 2012 estimate of 3,459 fish/km (Table 19). The density estimate of age-1+ brown trout in 2013 was 1,097 fish/km, a 20% decrease from the 2012 estimate of 1,371 fish/km. In 2013, the total numbers of fish/km in the County Road section was the lowest density estimate recorded for the past eight years and the numbers of age-1+ fish/km was the second lowest estimate recorded for the past eight years (Table 19). The Lee Vining Creek main channel produced a total density estimate of 3,765 rainbow and brown trout/km in 2013 (Table 20). The 2013 estimate was 14% less than the 2012 estimate of 4,361 rainbow trout and brown trout/km; however the 2013 value was still the second highest total density estimate for 13 sampling years. For age-1+ rainbow trout and brown trout, the estimated density was 1,867 fish/km in 2013, which was a 269% increase from 2012 s estimate of 506 age-1+ fish/km (Table 20). The 2013 density estimate of age-1+ rainbow trout and brown trout per kilometer was the highest ever recorded in 13 years of sampling the Lee Vining Creek main channel section. The Lee Vining side channel produced a total density estimate of 131 brown trout/km in 2012, a 49% decrease from the 2012 estimate of 257 fish/km (Table 20). For age-1 and older brown trout, the 2013 density estimate was 123 brown trout/km which was an 8% decrease from the 2012 density estimate 134 fish/km (Table 20). The Lee Vining Creek main channel and the side channel densities were added in order to compare to the proposed termination criteria as discussed in the 2011 Annual Fisheries Report (Taylor and Knudson 2011). When combined, the two channels produced a total density estimate of 2,643 rainbow and brown trout/km in 2013, a slight decrease (1%) from the 2012 estimate of 2,668 rainbow and brown trout/km (Table 20). Age-1 and older trout in these two channels produced an estimate of 353 rainbow and brown trout/km in 2013, a 1% increase from the 2012 estimate of 348 fish/km. 61
65 Table 19. Total number of brown trout per kilometer of stream channel for Rush Creek sample sections from 2000 to The value within (#) denotes the number of age-1 and older trout per kilometer. Collection Location Rush Creek, Upper Rush Rush Creek, Bottomland Rush Creek, County Road ,054 (1,547) 8,535 (837) 6,137 (900) 2,740 (791) 3,881 (495) 5,032 (1,167) 7,905 (1,100) 8,698 (1,621) N/A N/A N/A N/A N/A N/A N/A N/A 3,832 (725) 2,530 (942) 2,618 (536) 3,136 (764) 2,095 (641) 1,737 (641) 3,242 (702) 5,011 (1,402) 3,607 (1,267) 3,579 (1,467) 3,186 (1,346) 3,444 (1,186) 2,961 (1,146) 3,064 (1,611) 5,726 (881) 3,405 (963) 3,498 (1,222) 10,821 (1,833) 2,725 (929) 2,836 (1,021) 8,288 (1,556) 3,208 (1,279) 3,459 (1,371) 6,105 (1,347) 1,980 (817) 2,651 (1,097) Average Total # 6,570 (1,181) 2,976 (1,100) 3,064 (1,002) Table 20. Total number of brown and rainbow trout per kilometer of stream channel for Lee Vining Creek sample sections from 2000 to The value within ( #) denotes the number of age-1 and older trout per kilometer. Collection Location Average Total # Lee Vining, Main Channel 674 (337) 1,333 (567) 883 (729) 1,181 (355) 936 (568) 917 (910) No Sample due to high flow 2,103 (148) 2,357 (1,204) 1,192 (1,023) 518 (326) 727 (258) 4,361 (506) 3,765 (1,867) 1,611 (677) Lee Vining, Side Channel 853 (112) 623 (287) 731 (369) 626 (154) 1,144 (165) 169 (154) 618 (48) 129 (62) 103 (67) 133 (108) 103 (36) 159 (87) 257 (123) 131 (123) 413 (135) LV Main + LV Side Additive Approach 764 (225) 978 (427) 807 (549) 904 (255) 1,040 (367) 543 (532) N/A 1,116 (105) 1,230 (636) 663 (566) 311 (181) 443 (173) 2,668 (348) 2,588 (1,302) 1,081 (436) 62
66 Estimated Trout Standing Crop Comparisons The estimated standing crop for brown trout in the Upper Rush section was 140 kg/ha in 2013; which was a 21% decrease from the 2012 estimate of 178/kg and a 38% decrease from the 2011 estimate of 224 kg/ha (Table 21 and Figure 24). When compared to the 15-year average of 153 kg/ha, the 2013 standing crop estimate was approximately 9% lower (Figure 24). The estimated standing crop for brown trout in the Bottomlands section of Rush Creek was 55 kg/ha in 2013; which was a 47% decrease from the 2012 estimate of 103/kg and a 39% decrease from the 2011 estimate of 90 kg/ha (Table 21 and Figure 24). When compared to the six-year average of 99 kg/ha, the 2013 standing crop estimate was approximately 44% lower (Figure 24). The estimated standing crop for brown trout in the County Road section of Rush Creek was 67 kg/ha in 2013; which was a 36% decrease from the 2012 estimate of 104/kg and a 20% decrease from the 2011 estimate of 84 kg/ha (Table 21 and Figure 24). When compared to the 14-year average of 93 kg/ha, the 2013 standing crop estimate was approximately 28% lower (Figure 24). Although there are no standing crop termination criteria for Walker Creek, an estimate was still generated for this annually-sampled section. The estimated standing crop for brown trout in Walker Creek was 194 kg/ha in 2013; which was a 24% increase from the 2012 estimate of 156/kg (Table 21 and Figure 24). The 2013 standing crop estimate was the highest value recorded in Walker Creek over the 15-year sample period and the long-term average for this period is 125 kg/ha, and this average is higher than all Rush Creek sections except for Upper Rush (153 kg/ha). The Lee Vining Creek main channel in 2013 produced a total standing crop of 184 kg/ha for both rainbow and brown trout (Table 22 and Figure 25). The 2013 total estimate was a 6% increase from the 2012 estimate of 173 kg/ha. The 2013 brown trout standing crop estimate was 133 kg/ha and the rainbow trout standing crop estimate was 51 kg/ha. In 2013, the brown trout estimated standing crop decreased from the 2012 estimate by 8% and the rainbow trout estimated standing crop increased by 82% from the 2012 estimate. The 2013 total standing crop of 184 kg/ha was the second highest estimate for this sampling section and was 54 kg/ha greater than the 14-year average of 130 kg/ha. The Lee Vining Creek side channel produced a brown trout standing crop estimate of 26 kg/ha in 2013 which was a 33% decrease compared to the 2012 estimate of 39 kg/ha (Table 22 and Figure 25). No rainbow trout were captured in the side channel in 2013 and none have been sampled in the side channel for three consecutive years ( ). When standing crop estimates for the Lee Vining Creek main channel and the side channel were added, a total standing crop estimate equaled 153 kg/ha, a 145% increase from 2011 (Table 63
67 22). Compared to the seven year average since 2007, the 2013 total standing crop estimate was 58% higher. Table 21. Comparison of brown trout standing crop (kg/ha) estimates between 2011, 2012, and 2013 for Rush Creek sections. Collection Location Rush Creek Upper Rush Creek - Bottomlands Rush Creek - County Road Walker Creek 2011 Total Standing Crop (kg/ha) 2012 Total Standing Crop (kg/ha) 2013 Total Standing Crop (kg/ha) Percent Change Between 2012 and % % % % Table 22. Comparison of total (brown and rainbow trout) standing crop (kg/ha) estimates between 2012 and 2013 for the Lee Vining Creek sections. Collection Location 2012 Total Standing Crop (kg/ha) 2013 Total Standing Crop (kg/ha) Percent Change Between 2011 and 2012 Lee Vining Creek - Main Channel % Lee Vining Creek - Side Channel % Lee Vining Creek Main and Side Channel Combined % 64
68 RushCoRd 00 RushCoRd 01 RushCoRd 02 RushCoRd 03 RushCoRd 04 RushCoRd 05 RushCoRd 06 RushCoRd 07 RushCoRd 08 RushCoRd 09 RushCoRd 10 RushCoRd 11 RushCoRd 12 RushCoRd 13 RushBottom 08 RushBottom 09 RushBottom 10 RushBottom 11 RushBottom 12 RushBottom 13 RushUpper 99 RushUpper 00 RushUpper 01 RushUpper 02 RushUpper 03 RushUpper 04 RushUpper 05 RushUpper 06 RushUpper 07 RushUpper 08 RushUpper 09 RushUpper 10 RushUpper 11 RushUpper 12 RushUpper 13 MGORD 01 MGORD 04 MGORD 06 MGORD 08 MGORD 10 MGORD 12 MGORD 14 Walker 99 Walker 00 Walker 01 Walker 02 Walker 03 Walker 04 Walker 05 Walker 06 Walker 07 Walker 08 Walker 09 Walker 10 Walker 11 Walker 12 Walker Standing Crop (kg/ha) Figure 24. Estimated total standing crop (kilograms per hectare) of brown trout and rainbow trout (red) in all sample sections within Rush Creek from 1999 to
69 LV SideCh 99 LV SideCh 00 LV SideCh 01 LV SideCh 02 LV SideCh 03 LV SideCh 04 LV SideCh 05 LV SideCh 06 LV SideCh 07 LV SideCh 08 LV SideCh 09 LV SideCh 10 LV SideCh 11 LV SideCh 12 LV SideCh 13 Brown Trout Rainbow Trout LV MainCh 99 LV MainCh 00 LV MainCh 01 LV MainCh 02 LV MainCh 03 LV MainCh 04 LV MainCh 05 LV MainCh 07 LV MainCh 08 LV MainCh 09 LV MainCh 10 LV MainCh 11 LV MainCh 12 LV MainCh Standing Crop (kg/ha) Figure 25. Estimated total standing crop (kilograms per hectare) of brown trout and rainbow trout (red) in all sample sections within the Lee Vining Creek drainage from 1999 to
70 Relative Stock Density (RSD) Results for Rush and Lee Vining Creeks RSD-225 values for brown trout in the three sections of Rush Creek continued to decrease from the 2010 values (Table 23). In the Upper Rush section, since the 2010 value of 34, the RSD-225 has steadily decreased to 23 in 2011, 20 in 2012, and 14 in 2013 (Table 23). The RSD-225 in 2013 was also lower than the 14- year average of 22 mainly due to relatively large numbers of trout between mm and low numbers of trout 225 mm (lowest total in past five years). The RSD-300 value was 1 in 2013, which has not changed for the past three sampling years (Table 23). Over the 14 sampling years, a total of 83 brown trout 300 mm were captured in the Upper Rush Creek section, an average of 5.9 fish per year (Table 23). In the Bottomlands section of Rush Creek, since the 2010 value of 27, the RSD-225 has steadily decreased to 18 in 2011, 11 in 2012, and 4 in 2013 (Table 23). In 2013 there were large decreases both in brown trout 150mm and brown trout 225 mm (only five fish). The average number of brown trout 225 mm captured over the six-year sampling history was 41 trout per year, and five trout in this size class in 2013 was the lowest ever (Table 23). No trout 300 mm were captured in 2013; thus the RSD-300 value was 0. These meager RSD values along with the PIT tag data suggest both poor survivals of fish from age-2 to age-3 as well as poor growth rates of fish from age-1 to age-2 (from 2012 to 2013). Similar to the Bottomlands section, the County Road section s RSD-225 values have dropped since 2010 from 25 to 17 to 8 to 2 (Table 23). In the County Road section, the total number of trout 150 and 225 mm decreased in 2013 compared to previous years (Table 23). The average number of brown trout 225 mm captured over the 14-year sampling history was 43 trout per year, and three trout captured in this size class in 2013 was, by far, the lowest ever (Table 23). No trout 300 mm were captured in 2013; thus the RSD-300 value was 0. These meager RSD values along with the PIT tag data suggest both poor survivals of fish from age-2 to age-3 as well as poor growth rates of fish from age-1 to age-2 (from 2012 to 2013). In the MGORD since the 2011 value of 83, the RSD-225 has decreased to 75 in 2012 and 42 in 2013 (Table 23). The 2013 RSD-225 value of 42 was the lowest recorded for the 11 years of MGORD sampling. The RSD-300 value of 14 was also the lowest ever recorded for the 11-year period (Table 23). The RSD-375 value has equaled 4 for three consecutive years, Part of the reason for lower RSD values in 2013 were the relatively large numbers of smaller fish captured (the mm size class) in the single electrofishing pass made. However; capture numbers were also reduced for fish in the three larger size classes (Table 23). RSD values in Lee Vining Creek were generated for the main channel only and the main channel combined with the side channel (Table 24). In 2012, RSD values were recalculated using both the main and side channel sections since 2008 (Table 24). The 2013 RSD-225 values dropped compared to 2012, most likely due to the extremely high abundance of age-1 brown trout in 2013 that were less than 225 mm in length. 67
71 Table 23. RSD values for brown trout in Rush Creek sections from 2000 to Sample Year Sampling Location Rush Creek Number of Trout 150 mm Number of Trout mm Number of Trout mm Number of Trout 375 mm Upper Rush Upper Rush Upper Rush Upper Rush Upper Rush Upper Rush Upper Rush Upper Rush Upper Rush Upper Rush Upper Rush Upper Rush Upper Rush Upper Rush Bottomlands Bottomlands Bottomlands Bottomlands Bottomlands Bottomlands County Road County Road County Road County Road County Road County Road 2008* County Road County Road County Road County Road County Road County Road County Road County Road *The relatively low number of trout captured 150 mm in 2008 is due to the shortening of the County Road section. Number of Trout mm RSD- 225 RSD- 300 RSD
72 Table 23 (continued). Sampling Sample Location Year Rush Creek Number of Trout 150 mm Number of Trout mm Number of Trout mm Number of Trout 375 mm MGORD MGORD MGORD MGORD MGORD MGORD MGORD MGORD MGORD MGORD Number of Trout mm RSD- 225 RSD- 300 RSD
73 Table 24. RSD values for brown and rainbow trout in the Lee Vining Creek main channel and side channel sections from 2008 to RSD values for brown and rainbow trout in the Lee Vining Creek main channel section from 2000 to Sampling Location Rush Creek Sample Year Number of Trout 150 mm Number of Trout mm Number of Trout mm Number of Trout 375 mm Main & Side Main & Side Main & Side Main & Side Main & Side Main & Side Main Channel Main Channel Main Channel Main Channel Main Channel Main Channel Main Channel Main Channel 2006* NS NS NS NS NS - - Main Channel Main Channel Main Channel Main Channel Main Channel Main Channel Number of Trout mm RSD- 225 RSD
74 Termination Criteria Results The Rush Creek sampling sections for years 2009 through 2013, failed to meet four of the five termination criteria for any of the three, three-year running averages. The Upper Rush section met the density criterion for all three of the three-year running averages. This section also met the biomass criterion for the two most recent three-year running averages and condition factor for the running average (Table 25). Table 25. Termination criteria analyses for the Upper Rush section of Rush Creek. Bold values indicate that an estimated value met the termination criterion. Termination Criteria Average Average Average Biomass ( 175 kg/ha) Density ( 3,000 trout/km) 8,405 8,278 6,664 Condition Factor ( 1.00) RSD ( 35) RSD-300 ( 5) Conclusion Met two of five TC Met two of five TC Met two of five TC For the three-year average, the Bottomlands section failed to meet any of the termination criteria (Table 26). Table 26. Termination criteria analyses for the Bottomlands of Rush Creek. Bold values indicate that an estimated value met the termination criterion. Termination Criteria Average Average Average Biomass ( 175 kg/ha) Density ( 3,000 trout/km) 2,638 3,113 3,030 Condition Factor ( 1.00) RSD ( 35) RSD-300 ( 5) Conclusion Met none of five TC Met one of five TC Met one of five TC 71
75 Similar to the Bottomlands, the County Road section failed to meet any of the termination criteria for the three-year average (Table 27). Table 27. Termination criteria analyses for the County Road section of Rush Creek. Bold values indicate that an estimated value met the termination criterion. Termination Criteria Average Average Average Biomass ( 175 kg/ha) Density ( 3,000 trout/km) 2,982 3,264 3,133 Condition Factor ( 1.00) RSD ( 35) RSD-300 ( 5) Conclusion Met none of five TC Met one of five TC Met one of five TC The MGORD only met the RSD-225 termination criterion for all the of the three-year running averages. The MGORD RSD-375 value has equaled 4 for all three, three-year running averages (Table 28). Table 28. Termination criteria analyses for the MGORD section of Rush Creek. Bold values indicate that an estimated value met the termination criterion. Termination Criteria Average Average Average RSD-225 ( 60) RSD-300 ( 30) RSD-375 ( 5) Conclusion Met TC ## of three RSD values Met TC one of three RSD values Met TC one of three RSD values The main and side channel of Lee Vining Creek together met the condition factor criterion, for all three of the three-year running averages (Table 29). The two channels also met the RSD-225 termination criterion for years and (Table 29). 72
76 Table 29. Termination criteria analyses for the Lee Vining Creek sample sections. Bold values indicate that an estimated value met the termination criterion. Termination Criteria Average Average Average Biomass ( 150 kg/ha) Density ( 1,400 trout/km) 1,902 1, Condition Factor ( 1.00) RSD-225 ( 30) Conclusion Met two of four TC Met two of four TC Met two of four TC 73
77 Discussion The 2013 sampling year was the fifteenth consecutive year in which fish population data were collected and the fifth year since PIT tagging was initiated on Rush, Lee Vining, and Walker creeks. The fish sampling methods have been consistent since they were derived from two years of pilot studies conducted in 1997 and The 2013 runoff year was 66% of normal and classified as a dry runoff year type. This was the second consective dry runoff year type (RY 2012 was 55% of normal). According to GLOMP, in consecutive dry years LADWP was to release a maintenance flow of 100 cfs for five days in Rush Creek and a maintenance flow of 75 cfs for five days in Lee Vining Creek. Winter baseflows (October 1 st March 31 st ) were 36 and 25 cfs for Rush and Lee Vining Creeks, respectively. Prescribed SRF summer baseflows for Rush and Lee Vining Creeks were 31 and 37 cfs, respectively. In Lee Vining Creek, by mid-july the streamflow coming to LADWP s facilities had dropped below 37 cfs, thus the channel below the diversion facilities received those flows which gradually decreased throughout the rest of the summer period (the daily average flow for the month of August was 21 cfs). Calendar year 2013 was also marked by LADWP, the Mono Lake Committee, California Trout, and the California Department of Fish and Wildlife signing Terms of Settlement in late September. These new settlement terms are now in the process of being translated into enforceable license language prior to issuance of amended State Water Resources Control Board licenses. Major components of the Terms of Settlement include: 1) release of SEF flow regimes, 2) modification of GLR Dam by LADWP to permit release of SEF wet-year peak flows, 3) export of additional water to offset capital costs of the GLR Dam project, 4) deferrance of mandated SWRCB hearing on Mono Lake levels until 2020, and 5) development of a Mono Basin Monitoring Administrative Team to oversee a 10-year post-settlement monitoring program funded annually by LADWP. In 2010, the Stream Scientists released their Synthesis Report which recommended new Stream Ecosystem Flows (SEF) for Rush and Lee Vining creeks. Besides addressing geomorphic and riparian needs, the new SEF regimes were developed to improve the growth and survival of the trout in these creeks by; 1) lowering winter baseflows in both Rush and Lee Vining creeks to increase preferred trout winter holding habitat, 2) to increase storage and maintain higher storage levels in GLR to improve summer thermal conditions in Rush Creek, and 3) modifying the receding limb of the Rush Creek s hydrograph to improve summer thermal conditions (M&T and RTA 2010). Winter baseflows in Rush and Lee Vining creeks were consistent with the SEFs for several years, starting in the winter of Lee Vining Creek experienced five consecutive winters with the SEF winter baseflows and Rush Creek had four consecutive winters of SEF winter baseflows until the winter of Then, SRF baseflows returned in the winter of and were also released during the winter of In Rush Creek, flow releases during the winter of were right around 40 cfs at the MGORD and with accretions from Parker and Walker creeks, the winter flows in Rush Creek below the Narrows were in the cfs range. 74
78 The past several Annual Fisheries Reports have discussed how the SEF winter baseflows may have positively influenced improved growth and survival in (LADWP 2012; Taylor and Knudson 2011). These discussions also acknowledged that winter baseflow is one of several factors that influence trout growth and survival. One factor that has also received past attention is summer water temperature (Shepard et al. 2009). Given that RY2013 was the second of consecutive dry years and a third dry year is looming for 2014, a bulk of this Annual Report s Discussion is focused on the 2013 summer thermal regime in Rush Creek. Brown Trout Responses to Consecutive Dry Runoff Years As previously stated, RYs 2012 and 2013 were consecutive dry year-types. During the summer of 2013, the water level in GLR was consistently lower than in 2012 (Figure 4). The preliminary summary of 92 days of water temperature data in Rush Creek between July 1 and September 30, 2013 indicated periods where temperatures were not favorable for trout growth (Table 1). Before discussing the fish growth and condition factor results, further examination of the water temperature data is warrented. The SNTEMP temperature modeling conducted for development of Synthesis Report recommendations examined past summer water temperature data sets to determine a range of average daily temperatures that would be indicative of good growth conditions for brown trout and a threshold above which would be classified as a bad thermal day for brown trout (Appendix D-4.4 of Synthesis Report). The basis of these analyses was a study that measured the growth of brown trout provided varying food rations over a range of water temperatures (Elliot and Hurley 1999). A figure from this study depicted how growth rates gradually improved as temperatures increased to about 57 o F and then growth rates rapidly dropped as temperatures increased beyond 57 o F (Figure 26). For the Rush Creek SNTEMP model calibration we then overlaid the temperature range cited by other authors as providing good growth opportunities (Raleigh et al. 1996; Ojanguren et al. 2001). Interestingly, the good growth up to 67 o F cited by these authors is not reflected in caloric gain measured by Elliot and Hurley (1999), especially when less than 100% rations were provided (Figure 26). Also, a literature review by Bell (2006) regarding the thermal impacts on growth, reproduction, and survival of brown trout concluded that: Studies tend to agree that the stream distribution of healthy adult brown trout is largely bounded by the 19 o C thermal physiological limit, with a maximum not to exceed 22 o C for an extended period. In this thermal window of o C ( o F), brown trout may be physiologically stressed and living at the edge of their survival tolerance. Furthermore, temperatures of o C are near the upper metabolic limit of trout and may affect their ability to gain weight or maintain normal physiological functions. Brown trout do not grow in the o C range and are likely to experience high mortality rates from both the direct and indirect effects of inhabiting this temperature range. Reproductive efforts may also be limited by depressed juvenile fitness following a reduction in female condition prior to spawning. Our analyses for the SNTEMP modeling examined thousands of records of summer water temperature data from Rush Creek and determined that daily average water temperatures 75

79 between 55.5 o F and 60.5 o F defined the range of good growth for brown, and potential for growth would likely decline rapidly as daily averages increased above 60.5 o F. When daily average water temperatures exceeded 65 o F, these days were defined as bad thermal days because these days often had extended periods where temperatures exceeded 67 o F. Figure 26. Relationship between water temperature and growth (expressed in change in energy content per day in calories) with numbers showing proportion of full ration provided to fish (graph from Elliot and Hurley 1999). Shaded portion of graph is temperature range cited as good growth temperature by Raleigh et al and Ojanguren ewt al NOTE: red line was added to enhance no change in energy content demarcation on the y-axis. Another temperature metric to consider is diurnal fluctuation. Needham (1969) concluded that both absolute temperature and thermal constancy determined habitat suitability, and that trout in streams with springs and relatively constant temperatures experienced high growth 76
80 rates. Werley et al. (2007) found that the maximum temperature fluctuations tolerated by brown trout varied as a function of daily mean temperature and length of exposure. For example, the maximum tolerated temperature fluctuations were 11.5 o F for a 63-day exposure and 12.6 o F for a 21-day exposure. Chadwick (2012) reported that brook trout exposed to 14 o F diurnal fluctuations exhibited significantly reduced growth rates (43% by length and 35% by weight). A closer examination of the 2013 Rush Creek summer water temperature data was done by classifying daily average temperatures as either: 1) good growth potential days, 2) fair growth days (daily averages on sharply declining limb of Figure 26, 3) poor potential growth days (daily averages within one degree or less of a bad thermal day ), or 4) bad thermal days (Table 30). Using these daily average metrics, good growth potential days varied from 11 to 17 days in Rush Creek out of the 92-day period from July 1 to September 30. Nearly all of these good days occurred in mid to late September. The days designated as fair occurred primarily in July and September. The poor days and bad thermal days were mostly clustered in late-july through most of August. Interestingly, the Bottomlands and County Road, the two sections where brown trout exhibited the lowest growth rates and poor condition factors had fewer poor and bad thermal days (County Road temperature monitoring location) compared to the upstream temperature monitoring locations. While brown trout in the Upper Rush section experienced reduced growth rates and condition factors compared to previous years, these trout s growth and condition factor metrics still out-performed the Bottomlands and County Road in Table 30. Classification of runoff year 2013 water temperature data into good growth days, fair growth, poor growth days and bad thermal days based on daily average temperatures (92-day period from July 1 to September 30). The percent (%) designates each thermal day-type s occurrence for the 92-day summer period. Temperature Monitoring Location Rush Ck. Top of MGORD Rush Ck. Bottom MGORD Rush Ck. Old Highway 395 Rush Ck. below Narrows Rush Ck. County Road No. of Days for Good Growth Potential Daily Ave o o F No. of Days for Fair Growth Potential Daily Ave o 63.9 o F No. of Days of Poor Growth Potential Daily Ave o o F No. of Bad Thermal Days - Daily Ave. 65 o F 14 (15%) 43 (47%) 17 (18%) 18 (20%) 11 (12%) 38 (41%) 20 (22%) 23 (25%) 14 (15%) 41 (45%) 33 (36%) 4 (4%) 17 (18%) 69 (75%) 6 (7%) 0 17 (18%) 64 (70%) 8 (9%) 3 (4%) Initially counterintuitive, these results suggest that additional factors beyond daily average water temperatures influenced brown trout growth and condition factor in Rush Creek during the summer of Diurnal temperature fluctuations for July September 2013 were 77
81 characterized by the one-day maximum fluctuation that occurred each month and by monthly averages (Table 31). Also, for each temperature monitoring location, the highest average diurnal fluctuation over a consecutive 21-day duration was determined (Table 31). These diurnal fluctuation analyses consistently show worse metrics at the Below Narrows and County Road temperature monitoring locations when compared to the upper three locations. For all months, the one-day maximum and monthly average fluctuations were greatest at the Below Narrows and County Road locations (Table 31). The 21-day duration values for the Old Highway 395, Below Narrows and County Road locations were close to, or exceeded, the 12.6 o F tolerance limit defined by Werley et al. (2006). Brown trout residing in the Bottomlands and County Road fish-sampling sections were subjected to a 21-day exposure of 12.5 o F, right at the upper tolerance limit. Table 31. Diurnal temperature fluctuations in Rush Creek: maximum daily for month, daily average for month, and highest average for consecutive 21-day duration (92-day period from July 1 to September 30). Temperature Monitoring Location Rush Ck. Top of MGORD Rush Ck. Bottom MGORD Rush Ck. Old Highway 395 Rush Ck. below Narrows Rush Ck. County Road Maximum and Average Daily Diurnal Fluctuation for July Max = 4.2 o F Ave = 1.8 o F Max = 9.0 o F Ave = 6.8 o F Max = 13.5 o F Ave = 10.4 o F Max = 16.3 o F Ave = 11.7 o F Max = 14.1 o F Ave = 10.0 o F Maximum and Average Daily Diurnal Fluctuation for August Max = 1.5 o F Ave = 0.9 o F Max = 7.5 o F Ave = 6.2 o F Max = 12.6 o F Ave = 10.4 o F Max = 15.0 o F Ave = 12.4 o F Max = 14.7 o F Ave = 11.3 o F Maximum and Average Daily Diurnal Fluctuation for September Max = 1.4 o F Ave = 0.6 o F Max = 7.1 o F Ave = 5.6 o F Max = 10.7 o F Ave = 8.8 o F Max = 12.6 o F Ave = 10.2 o F Max = 11.6 o F Ave = 9.2 o F Highest Average Dirunal Fluctuation for a Consecutive 21- Day Duration 2.0 o F July o F July o F July o F July 29 Aug o F July 28 Aug 17 Finally, the thermal window bounded by o F where brown trout may be physiologically stressed and living at the edge of their survival tolerance was quantified for each Rush Creek temperature monitoring location. The hourly temperature data for the 92-day (or 2,208-hour) summer period were sorted from low to high and the number of hours where temperatures exceeded 66.2 o F were summed by month and entire summer period (Table 32). These data indicated that below the Top of the MGORD, the other temperature monitoring locations were within the o F thermal window for 18 to 22% of the 92-day summer period. For the Bottom of the MGORD, Old Highway 395 and Below Narrows locations, the month of August had the highest percentage of hours within the thermal window; whereas at the County Road location July was the month with the highest percentage of hours within the thermal window 78
82 (Table 32). These data also illustrate a sizeable warming trend as streamflow travels down the MGORD (Table 32). Table 32. Number of hours that temperature exceeded 66.2 o F in Rush Creek: by month and for 92-day period from July 1 to September 30. Percent (%) designates amount of month or summer where hourly temperatures exceeded 66.2 o F. Temperature Monitoring Location Rush Ck. Top of MGORD Rush Ck. Bottom MGORD Rush Ck. Old Highway 395 Rush Ck. below Narrows Rush Ck. County Road Number of Hours Temperature exceeded 66.2 o F in July Number of Hours Temperature exceeded 66.2 o F in August Number of Hours Temperature exceeded 66.2 o F in September Number of Hours Temperature exceeded 66.2 o F in 92-day period 4 hours (0.5%) 4 hours (0.5%) 0 hours 8 hours (0.4%) 121 hours (16%) 229 hours (31%) 61 hours (9%) 411 hours (19%) 181 hours (24%) 228 hours (31%) 73 hours (10%) 482 hours (22%) 158 hours (21%) 192 hours (26%) 55 hours (7%) 405 hours (18%) 197 hours (27%) 172 hours (23%) 42 hours (6%) 411 hours (19%) Trout Growth between 2012 and 2013 PIT tagged brown trout in the Bottomlands section of Rush Creek had an average growth rate of 25 g for age-0 to age-1 trout between 2011 and 2012 which was 1g less that the previous year (Table 33). In Upper Rush, the average growth of age-0 to age-1 trout between 2012 and 2013 was 35g, 2g more than the average from 2011 to No information was available for the County Road section because no age-0 trout were implanted with PIT tags in Growth rates for age-1 to age-2 brown trout between 2012 and 2013 remained low (Table 33). The average growth rate in Upper Rush for age-2 fish remained at 42g, while in the Bottomlands and County Road sections growth rates of age-2 fish dropped in 2013 compared to 2012 (6 g/year to 3 g/year, respectively) (Table 33). Across all years, average growth rates of brown trout in Rush Creek between age-0 and age-1 have consistently decreased in the downstream direction even though differences between lower two sections have been realtively small. Except for the slight increase in growth in (Bottomlands versus County Road) this trend has also held true for average growth rates between age-1 and age-2 brown trout (Table 33). Four potential reasons were presented in the 2011 Annual Fisheries Report that attempted to explain this spatial trend in growth rates. These reasons were: 1) increased organic and nutrient loading along Upper Reach because of its proximity to GLR, 2) more favorable DO and thermal conditions along the upper reaches, 3) the difference in timing of fry emergence 79
83 between the upper and lower sections and 4) genetic differences between sections, such that fish along the upper sections maybe progeny of larger MGORD trout (Taylor and Knudson 2012). The 2012 Annual Fisheries Report suggested that thermal and DO gradients would seem the most plausible in explaining the difference in growth gradients between the upper and lower sections (LADWP 2013). But then the 2012 Annual Report countered with, longitudinal water-temperature pattern revealed that relative to the upstream sections, less than 50% of the days between June 1 and September 30, 2012 (57 days out of 122 days) did water temperatures increase in the downstream sections. Consequently, water temperatures in the Bottomlands section were no worse than that of the Upper Rush. However, dissection of the 2013 summer water temperature (Tables 30-32), indicates that some water temperature metrics actually were worse near the Bottomlands and County Road sections than in Upper Rush Creek. More detailed analyses of previous years water temperature data sets may be warrented. Table 33. Growth rate (g) comparisons of Rush Creek age-0 to age-1, age-1 to age-2, and age-2 to age-3 brown trout, by years. Age Class Growth Years Upper Rush Growth (g) Bottomlands Growth (g) County Road Growth (g) Fin clip or PIT Tag N/A 25 Ad Clip Ad Clip Age-0 to PIT Tag Age PIT Tag PIT Tag N/A PIT Tag Age-1 to Age-2 Age-2 to Age N/A N/A N/A PIT Tag PIT Tag PIT Tag PIT Tag N/A PIT Tag PIT Tag N/A 9 1 PIT Tag The decreasing trend of growth rates for age-3 and older brown trout noted in the 2012 Annual Fisheries Report was observed again in For age-3 fish, growth rates (g) declined for the three years data were available (Table 33). The single PIT tagged age-4 brown trout captured in 2013 was from the Upper Rush section and this fish had lost 22 g of weight between 2012 and 2013 (Table 15). No PIT tagged age-4 trout were captured in the Bottomlands and County Road sections in Because no trout residing within the MGORD were implanted with PIT tags in 2012, there were limited 2013 recaptures of younger PIT tagged trout to gauge the growth rates of trout less than 300 mm in length. Six trout between mm were recaptured in 2013 with an 80
84 average growth rate of 7 g, the lowest for the four seasons these data were available (Table 16). In fact, three of these fish had lost weight between 2012 and In past years, the PIT tag data has confirmed excellent growth of these younger fish in the MGORD; however this was not the case in As was the case with PIT tag recaptures in 2011 and 2012, some PIT tagged fish recaptured in 2013 that were >300 mm in length had lost weight between 2012 and Overall, the six trout recaptured in the mm size class had an average growth rate of 49 g and two of the six fish had lost weight. However, if not for one trout which gained 287g, the average growth rate for the remaining trout in the mm size class would have been only 1.5 g. Even though most water temperature metrics in the lower MGORD were better than downstream sections, Table 30 classified 47% of the days between July and September as poorgrowth and bad thermal days. Also, larger fish require more caloric intake for maintenance, let alone growth, thus the stressors of marginal temperature conditions may have resulted in lower growth rates for larger trout. The effect of senescence among larger trout may have also contributed to lower growth rates. Inconsistent patterns of growth rates for large trout were pointed out in the previous Annual Fisheries Reports. This inconsistency was also found in 2013 as some large trout were able to gain weight (287 g by tag # ) while a majority of trout showed a little or negative weigh gain. In 2013, several large brown trout were recaptured that had large weight gains over multiple-year periods. For example, tag # was implanted in a fish in 2009 that weighed 507 g. This fish gained 283 g between 2009 and 2010, but was not recaptured until 2013 when it weighed 1,412 g, a 622 g weight gain over a three-year period. Another example of a robust MGORD fish was tag # which weighed 109 g when tagged in In 2010 it had weighed 218g (+109g), in 2011 it had weighed 349g (+131g), and two years later in 2013 it weighed 801g (+452 g). Condition Factors Between 2012 and 2013, condition factors decreased in all the Rush Creek sections and in the Lee Vining Creek main channel section. Decreases in condition factors also occurred between the sampling years 2011 and 2012, the first of the consecutive dry runoff years. Poor condition factors (<1.00) were also recorded in the Rush Creek sections in 2007 and The 2007 runoff year was one of the driest ever and 2008 was a normal runoff year, but was one of the hotter summers on record with an average monthly maximum air temperature of 81.9 o F (Shepard et al. 2009). Also, GLR storage was very low (<15,000 acre feet) throughout the summer of The analysis of the 2013 summer water temperature data revealed that brown trout in Rush Creek spent significant portions of the summer living in physiologically stressful conditions where little or no growth probably occurred. The five to six weeks leading up to the annual fisheries sampling in September was most likely particularily poor for trout growth, based on thermal-day classifications (Table 30) and large diurnal fluctuations (Table 31). Based on these 81
85 temperature regimes, it is not surprising that brown trout in Rush Creek were in poor condition when sampled. In 2013, condition factors of brown trout and rainbow trout mm in length fell below 1.00 for the first time in the 14 years of sampling the Lee Vining Creek main channel. Thermally, Lee Vining Creek had summer water temperatures conducive for good growth. When most Rush Creek sections were experiencing poor-growth and bad thermal days in late-july and August of 2013, Lee Vining Creek s daily average temperatures were in the 52 o F to 54 o F range. The 2013 decline in Lee Vining Creek s condition factors appear related to trout densities. Sampling years 2005, 2008 and 2013 had the three highest standing crop estimates in the Lee Vining Creek main channel and these estimates were reasonably similar (14.5% difference between smallest and largest estimate) (Table 34). The condition factors were highest in 2005 when the standing crop estimate was also the highest (Table 34). However, in 2005 age-0 recruitment was extremely low (13 fish/ha) and densities of age-1 and older trout were also the lowest of these three years. In 2005, the high standing crop estimate was packaged into relatively few trout that were in good condition. These age-1 and older trout had very little competition for food items by age-0 fish. Condition factors in 2008 were right above average and densities were much higher than in 2005, with age-0 fish comprising 49% of the total estimate. In 2013, total densities of trout were even higher and even larger numbers of age-0 brown trout and rainbow trout were present. Thus, in both of these years, but more so in 2013, age-1 and older trout had relatively high competition for food items by age-0 fish. Also, in 2013 there was increased competition for resources amongst age-1 brown trout since the previous year s recruitment of age-0 fish was the highest ever recorded in this sampling section. Total densities (fish/km) were 410% higher in 2013 than in 2005, thus it makes sense that condition factors were lower in Table 34. Comparison of condition factors to standing crop and density estimates for brown and rainbow trout in Lee Vining Creek, sampling years 2005, 2008 and Sample Year Brown Trout Condition Factor Rainbow Trout Condition Factor Total Standing Crop (kg/ha) Age-0 Density (fish/ha) Age-1+ Density (fish/ha) Total Density (fish/km) ,330 3,275 3, ,135 2,230 2, ,
86 Annual densities of brown trout >255 mm The principal objective of the SEF winter baseflows was to increase the amount of winter holding habitat for brown trout, which may ultimately increase the survival of older and thus larger trout in lower Rush Creek (Taylor and Knudson 2011). The 2012 Annual Fisheries Report evaluated this hypothesis by making comparisons of annual densities of brown trout greater than 255 mm (10 ) in length between winters with SRF and SEF baseflows (LADWP 2013). The 255 mm fish length was related to the minimum size of an age-4 brown trout in 2011 that was determined by PIT tag recaptures and length-frequency histograms for the Bottomlands and County Road sections (Taylor and Knudson 2012). The 2012 Annual Fisheries Report concluded that, based on the data collected to date, it does appear that lower winter baseflow is one factor of many that produces older and larger trout (LADWP 2013). Continuing these analyses with the 2013 data was problematic considering that no brown trout greater than 255 mm were caught in the Bottomlands or County Road sections. In the Bottomlands section only four brown trout greater than 230 mm in length were sampled in 2013 (235, 236, 242, 247 mm). In County Road only three fish were greater than 230 mm in length (233, 235, and 246 mm). The 233 mm fish was an age-3 PIT tag recapture and the 235 mm fish was an age-5 PIT tag recapture. The paucity of brown trout greater than 230 mm in length in the Bottomlands and County Road sections suggest very poor survival of age-2 and older fish from September 2012 to September A combination of factors was most likely at play; however marginal-to-stressful summer water temperatures in both summers seems an obvious factor. A cursory review of the 2012 summer water temperature data suggests that this summer was more thermally stressful than The number of hours bounded by o F where brown trout may be physiologically stressed and living at the edge of their survival tolerance was greater for the five temperature monitoring locations in 2012 than in 2013 (Table 35). At the County Road location, 122 hours of the 601 hours were actually warmer than the 71.6 o F upper boundary of the thermal window referenced by Bell (2006). Table 35. Comparison of number of hours that temperature exceeded 66.2 o F in Rush Creek during the summers of 2012 and 2013 at five temperature monitoring locations. Temperature Monitoring Location Rush Ck. Top of MGORD Rush Ck. Bottom MGORD Rush Ck. Old Highway 395 Rush Ck. below Narrows Rush Ck. County Road Number of Hours Temperature exceeded 66.2 o F in 92-day period during 2012 Number of Hours Temperature exceeded 66.2 o F in 92-day period during hours (2%) 8 hours (0.4%) 428 hours (19%) 411 hours (19%) 557 hours (25%) 482 hours (22%) 514 hours (23%) 405 hours (18%) 601 hours (27%) 411 hours (19%) 83
87 According to Bell (2006), brown trout were also likely to experience high mortality rates from both the direct and indirect effects of inhabiting this temperature range. Indirect effects would include after surviving a thermally stressful summer, a brown trout undergoing the rigors of the fall spawning season, followed by enduring the other end of the thermal spectrum of nearfreezing winter water temperatures. Another indirect effect of stressful summer water temperatures to trout growth and survival are temperature impacts to the viability of the stream s benthic macroinvertebrate populations. Galli (1990) reported that a Maryland fisheries study determined that many coldwater insect species were eliminated or reduced by thermal enrichment; these included important food species of trout such as mayflies, caddisflies and stoneflies. One of the thermal metrics that stressed and severly impacted the macroinvertebrates was stream temperature fluctuations (Galli 1990). Finally, Bell (2006) noted that, reproductive efforts may also be limited by depressed juvenile fitness following a reduction in female condition prior to spawning. Others researchers have also documented reduced viability in trout egg production caused by thermally stressful conditions (Campbell et al. 1992). Although implementing the SEF winter baseflow recommendation coincided with increases of brown trout >255 mm in the Bottomlands and County Road sections in , it appears that summer water temperature in drier runoff year types may have a stronger influence on the production of older and larger brown trout in lower reaches of Rush Creek. If RY2014 results in a third consecutive dry year, the annual fisheries monitoring in September 2014 may detect further declines in Rush Creek s trout fishery. The RSD-300 metric was developed in part to gauge the ability of Rush Creek to produce brown trout that were 12 inches in length, allowing comparison to the D-1631 statement that, prior to water diversions on Rush Creek, brown trout averaging thirteen to fourteen inches were regularly observed. In the Upper Rush section, a total of 83 brown trout 300mm have been captured in 14 seasons, an average of 5.9 fish per year. In the Bottomlands section, a total of seven brown trout 300 mm have been caught in six sampling years, an average of 1.1 fish per year. In the County Road section, a total of 11 brown trout 300mm have been captured in 14 seasons, an average of 0.8 fish per year. The only section of Rush Creek where brown trout 300mm were regularily observed was in the MGORD. A total of 1,352 brown trout 300mm were captured in the MGORD during 11 sampling seasons for an average of fish per year. 84
88 Methods Evaluation In 2013, mark-recapture and depletion estimates were again used to produce population estimates on Rush Lee Vining and Walker Creeks. Block fences were cleaned twice a day, and each section met the assumption of a closed population with no block fence failures. While there were no major changes to the channels due to peak flows, between 2012 and 2013 there were slight increases in average widths of the three Rush Creek sections and the Lee Vining Creek main channel. The average channel width of the Walker Creek section decreased between 2012 and These changes in average channel widths may be a function of where the individual measurements were taken since peak flows were neglible during the 2013 runoff period. In 2013, most of the Lee Vining Creek side channel was dry. The top of the reach was dry, with surface flow emerging in several locations throughout the annual electrofishing section. There were isolated pools dispersed amongst several shallow riffles. Flow in the side channel during the 2013 September sampling was approximately a tenth of a cfs. Condition factors for fish in the side channel were 0.83 in 2012 and 0.93 in 2013, the lowest values in the 15-year sampling period. It is recommended that channel length and width be re-measured annually. Modifying the sections sampled could represent a loss of time-series data unless efforts are made to index relative changes between individual sample sections. In past annual reports the fisheries monitoring team found that the length-weight regression lines for the Bottomlands and County Road sections were nearly identical (Taylor et al. 2010), indicating that brown trout in these two sections were responding in a similar fashion to their environment. This response suggests that replacing the County Road section with the Bottomlands section should not result in any loss of time-series information related individual fish condition factor analyses. In the 2010 Annual Fisheries Report it was recommended that the County Road section was sampled annually until sufficient data (a minimum of five annual sampling events) were collected in the Bottomlands section to compute a series of three, three-year running averages (Taylor et al. 2011). In the Annual Fisheries Report for the 2011 sampling season (Taylor and Knudson 2012), a recommendation was made to sample the County Road section for one final season (September 2012) so that specific growth information was collected from the large numbers of PIT tagged fish residing in that section. However, LADWP opted to sample the County Road again in September of 2013, which generated a sixth year of data further confirming that the Bottomlands and County Road sections exhibit similar values and trends (Table 36). The SWRCB-appointed Stream Scientist again recommends that the County Road section of Rush Creek is dropped as a sampling section. This recommendation is consistent with the 10-year post-settlement monitoring program (refer to Appendix 3 of the Mono Basin Settlement Agreement). Thus starting September 2014, the Bottomlands section would be the annually sampled section downstream of the Narrows and the Upper Rush section would be the annually sampled section upstream of the Narrows. It is still recommended that the MGORD section of Rush Creek is sampled in even years for mark-recapture population estimates and in odd years for RSD calculations, condition factors, and PIT tagging. The 10-year post-project monitoring plan also includes continued fisheries monitoring in Lee Vining and Walker creeks. 85
89 Table 36. Comparisons of standing crop estimates and condition factors for six years of fisheries data from the Bottomlands and County Road sections of Rush Creek. Collection Location 2008 Total Standing Crop (kg/ha) 2009 Total Standing Crop (kg/ha) 2010 Total Standing Crop (kg/ha) 2011 Total Standing Crop (kg/ha) 2012 Total Standing Crop (kg/ha) 2013 Total Standing Crop (kg/ha) Rush Creek - Bottomlands Rush Creek - County Road Collection Location 2008 Condition Factor 2009 Condition Factor 2010 Condition Factor 2011 Condition Factor 2012 Condition Factor 2013 Condition Factor Rush Creek - Bottomlands Rush Creek - County Road In the 2011 Annual Fisheries Report, the Stream Scientist stated that rainbow trout comprised a very small portion of the Rush Creek trout population and recommended only reporting numbers of rainbow trout caught. Rush Creek generally experiences slight increases in rainbow trout numbers whenever GLR spills in wetter years. These rainbow trout are of hatchery orgin and were planted in GLR to augment the reservoir s put-and-take fishery. Within a year or two after a GLR spill event, rainbow trout numbers typically fall to nearly undetectable numbers in Rush Creek, especially downstream of the Upper Rush section. It is highly unlikely that these few rainbow trout exert the required level of interspecific competition to negatively impact Rush Creek s brown trout population. In the 2012 Annual Fisheries Report drafted by LADWP, a recommendation was made that in Rush Creek rainbow trout should either be lumped in with the brown trout estimate or a separate rainbow trout estimate be generated with whatever data were available. The Stream Scientist does not concur with this recommendation. The original Mono Basin Settlement, D-1631 and termination criteria for Rush Creek were based on brown trout, thus the fisheries monitoring should be focused on this species. Also, combining the catch numbers of both species to generate a single trout estimate is not recommended nor is making a regular practice of extrapolating rainbow trout catch numbers into standing crop and density estimates. Finally, the new settlement terms terminated the fisheries termination criteria, thus there will no longer be a need for LADWP to account for every last kilogram of trout biomass in Rush Creek. In fact, the proposed post-settlement monitoring program will only generate population estimates every other year. Between 2009 and 2012, implanting of PIT tags has allowed the growth, survival, and movement of individual trout up to age-5 to be monitored. In the 2012 Annual Fisheries Report, LADWP failed to include the Stream Scientist s recommendation to continue the use of PIT tags. After the annual report was submitted, the Stream Scientist sent a letter to the SWRCB (Appendix B). This letter described the importance of the PIT tagging data, as well as how the continued use of PIT tags during the 10-year post-settlement monitoring program will result in significant cost savings to LADWP while still maintaining robust data sets. So once again, the 86
90 Stream Scientist strongly recommends that the use of PIT tags is an integral component of future long-term monitoring of Rush and Lee Vining creeks trout populations for evaluating the effectiveness of the flow regimes prescribed when an amended license is eventually issued by the SWRCB. Because no PIT tags were deployed in age-0 trout in 2013, the annual fisheries monitoring program moves forward with a potential missing data gap at a crucial time a third dry runoff year looming and the possibly of reissuance of LADWP s license under the new Terms of Settlement. Thus, the Stream Scientist also recommends that members of the 2013 cohort of age-0 trout are tagged as age-1 fish in 2014 to allow the tracking of their growth and survival into age-2 and beyond. Because the use of PIT tags (post-settlement) has been agreed to in the new Terms of Settlement, it is imperative to maintain continuity in the PIT tag data set. If PIT tagging is not resumed in 2014, a two-year gap would exist in this data set, which is not acceptable moving into the post-settlement monitoring program. Trout size classes (0-124, , and 200 mm) developed and discussed during the 2008 annual report should continue to be used in the future (Hunter et al. 2008). Using these size classes provides for long-term consistency as well as year to year consistency with the annual fisheries data sets. Finally, to ensure that electrofishing sampling can be conducted safely and efficiently, flows in Rush and Lee Vining creeks not exceed 40 cfs. (± 5 cfs.) during the annual sampling period. Allowances for flow variances to allow for safe wading conditions and effective sampling were included in the new Terms of Settlement. 87
91 References Cited Bateman, D.S. and R.E. Gresswell Survival and growth of age-0 steelhead after surgical implantation of 23-mm passive integrated transponders. North American Journal of Fisheries Management 26: Bell, J.M The assessment of thermal impacts on habitat selection, growth, reproduction, and mortality in brown trout (Salmo trutta): a review of the literature. Vermillion River EPA Grant #WS p. Blackwell, B.G., M.L. Brown and D.W. Willis Relative weight (W r ) status and current use in fisheries assessment and management. Reviews in Fisheries Science, 8(1): Campbell, P.M, T.G. Pottinger and J.P. Sumpter Stress reduces the quality of gametes produced by rainbow trout. Biology of Reproduction 47: Chadwick, J.G Temperature effects on growth and stress physiology of brook trout: implications for climate change impacts on an iconic cold-water fish. Master s Thesis, Wheaton College, Amherst, MA, Paper #897. Chapman, D.W. 1951, as cited in Ricker, W.E Computation and interpretation of biological statistics of fish populations. Bulletin 191 of the Fisheries Research Board of Canada, Ottawa, Canada. Cone, R.S The need to reconsider the use of condition indices in fishery science. Transactions of the American Fisheries Society 118: Elliot, J.M. and M.A. Hurley A new energetics model for brown trout, Salmo trutta. Freshwater Biology 42: Galli, J Thermal impacts associated with urbanization and storm water best management practices. Final report for the Maryland Department of Transportation, Bethesda, MD. Hunter, C Recommended changes to State Water Resources Control Board Order Numbers and 98-07, Fisheries Termination Criteria. Hunter, C., B. Shepard, D. Mierau, K. Knudson, and R. Taylor Fisheries Monitoring Report for Rush, Lee Vining, Parker and Walker Creeks Los Angeles Department of Water and Power. 27 p. Hunter, C., B. Shepard, K. Knudson, R. Taylor Fisheries Monitoring Report for Rush, Lee Vining, Parker and Walker Creeks Los Angeles Department of Water and Power. 35 p. 88
92 Hunter, C., B. Shepard, K. Knudson, R. Taylor, M. Sloat and A. Knoche Fisheries Monitoring Report for Rush, Lee Vining, Parker and Walker Creeks Los Angeles Department of Water and Power. 37 p. Hunter, C., B. Shepard, K. Knudson, R. Taylor and M. Sloat Fisheries Monitoring Report for Rush, Lee Vining, Parker and Walker Creeks Los Angeles Department of Water and Power. 43 p. Hunter, C., B. Shepard, K. Knudson, R. Taylor and M. Sloat Fisheries Monitoring Report for Rush, Lee Vining, Parker and Walker Creeks Los Angeles Department of Water and Power. 45 p. Hunter, C., R. Taylor, K. Knudson, B. Shepard, and M. Sloat Fisheries Monitoring Report for Rush, Lee Vining, Parker and Walker Creeks Los Angeles Department of Water and Power. 51 p. Hunter, C., R. Taylor, K. Knudson and B. Shepard Fisheries Monitoring Report for Rush, Lee Vining, Parker and Walker Creeks Los Angeles Department of Water and Power. 61 p. Hunter, C., R. Taylor, K. Knudson and B. Shepard Fisheries Monitoring Report for Rush, Lee Vining, Parker and Walker Creeks Los Angeles Department of Water and Power. 74 p. Hunter, C., R. Taylor, K. Knudson and B. Shepard Fisheries Monitoring Report for Rush, Lee Vining, Parker and Walker Creeks Los Angeles Department of Water and Power. 11 p. Hunter, C., R. Taylor, K. Knudson and B. Shepard Fisheries Monitoring Report for Rush, Lee Vining, Parker and Walker Creeks Los Angeles Department of Water and Power. 67 p. LADWP Fisheries Monitoring Report for Rush, Lee Vining, Parker and Walker Creeks Los Angeles Department of Water and Power. 89 p. M&T and RTA Synthesis of instream flow recommendations to the State Water Resources Control Board and the Los Angeles Department of Water and Power. Needham, P.R Trout streams. Holden-Day Press, San Francisco, Cambridge, London, Amsterdam. 241 p. Ojanguren, A.F., F.G. Reyes-Gavilan and F. Brana Thermal sensitivity of growth, food intake, and activity of juvenile brown trout. Journal of Thermal Biology 26:
93 Ombredane, D., J. Bagliniere, and F. Marchand The effects of passive integrated transponder tags on survival and growth of juvenile brown trout (Salmo trutta L.) and their use for studying movement in a small river. Hydrobiologica 371: Raleigh, R.F., L.D. Zimmerman, and P.C. Nelson Habitat suitability index models and instream flow suitability curves: brown trout, revised. U.S. Fish and Wildlife Service, Biological Report 82(10.124). 65 p. Reimers, N Body condition and over-winter survival of hatchery-reared trout in Convict Creek, California. Transactions of the American Fisheries Society 92 (1): SWRCB (State Water Resources Control Board) State Water Control Board Order Sacramento, CA. 63 p. Taylor, R., K. Knudson, B. Shepard and C. Hunter Radio telemetry0movement study of brown trout in Rush Creek. Los Angeles Department of Water and Power. 55 p. Taylor, R., K. Knudson, and B. Shepard Fisheries Monitoring Report for Rush, Lee Vining, Parker and Walker Creeks Los Angeles Department of Water and Power. 73 p. Taylor, R., K. Knudson, and B. Shepard Fisheries Monitoring Report for Rush, Lee Vining, Parker and Walker Creeks Los Angeles Department of Water and Power. 82 p. Taylor, R., K. Knudson Fisheries Monitoring Report for Rush, Lee Vining, Parker and Walker Creeks Los Angeles Department of Water and Power. 90 p. Werley, K.E., L. Wang and M. Mitro Field-based estimates of thermal tolerance limits for trout: incorporating exposure time and temperature fluctuation. Transactions of the American Fisheries Society, 136 (2):
94 Appendices for the 2013 Mono Basin Annual Fisheries Report 91

95 Appendix A: Aerial Photographs of Long-term Monitoring Sections. 92
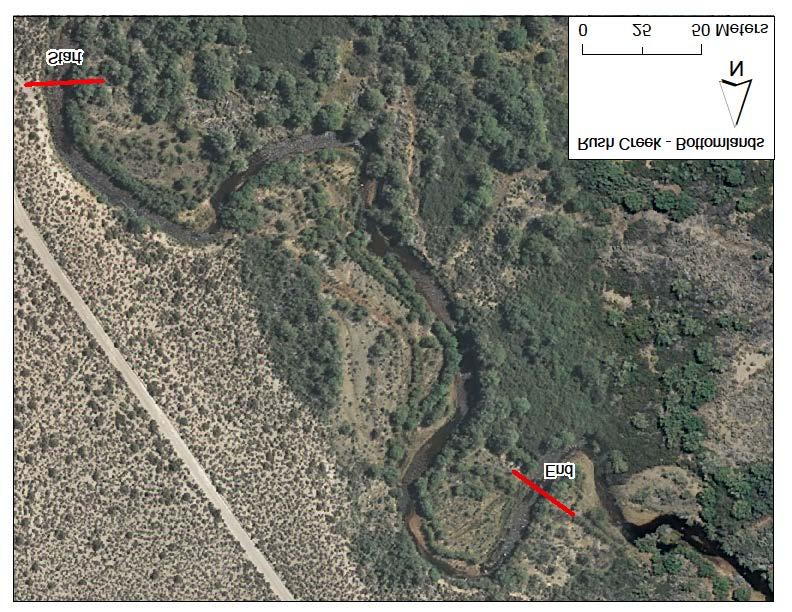
96 93
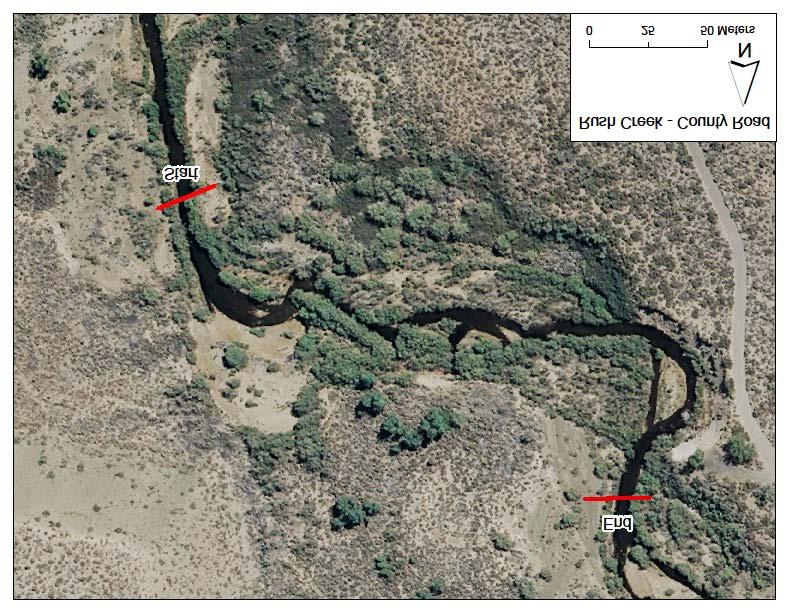
97 94
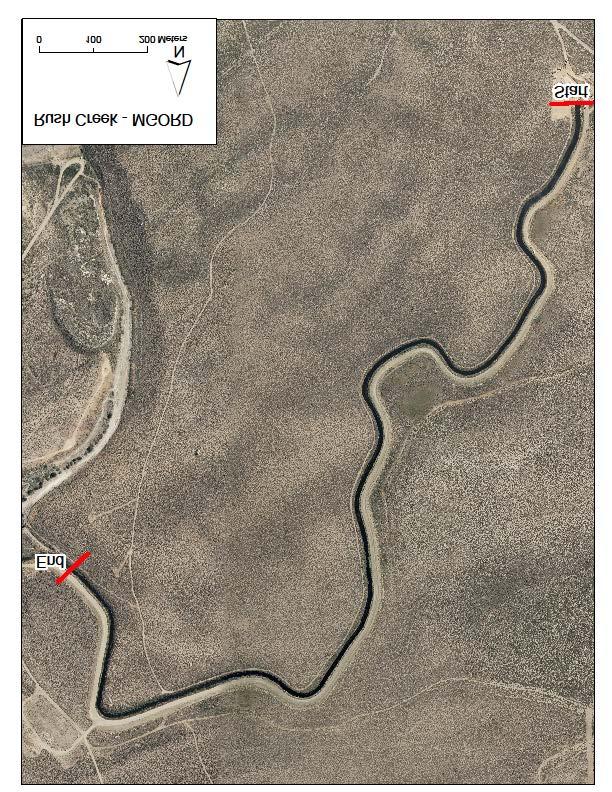
98 95
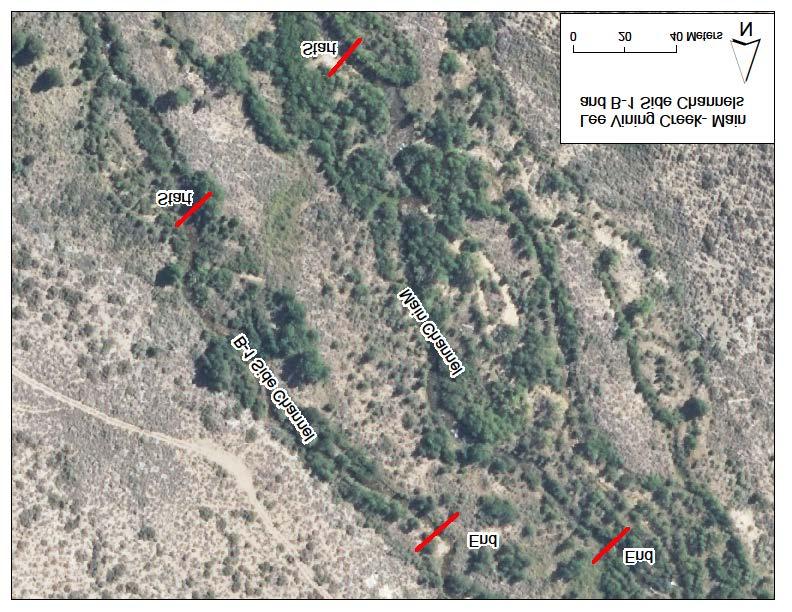
99 96
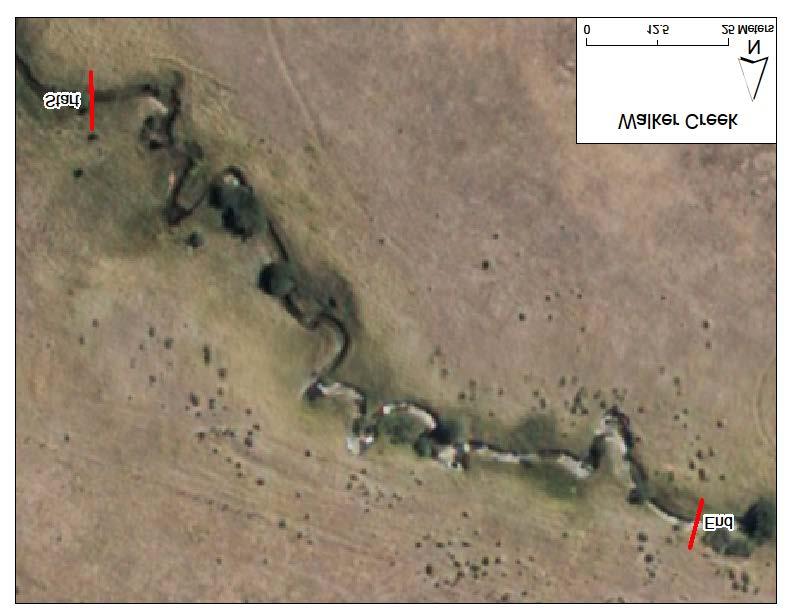
100 97
101 Appendix B: Stream Scientist s June 3, 2013 Letter to SWRCB 98
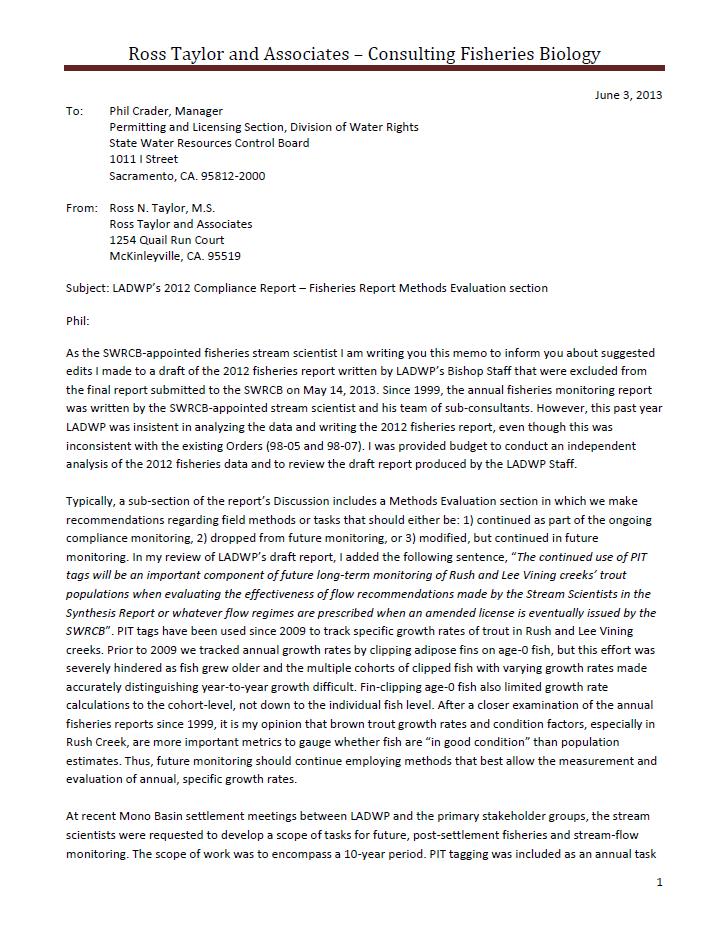
102 99
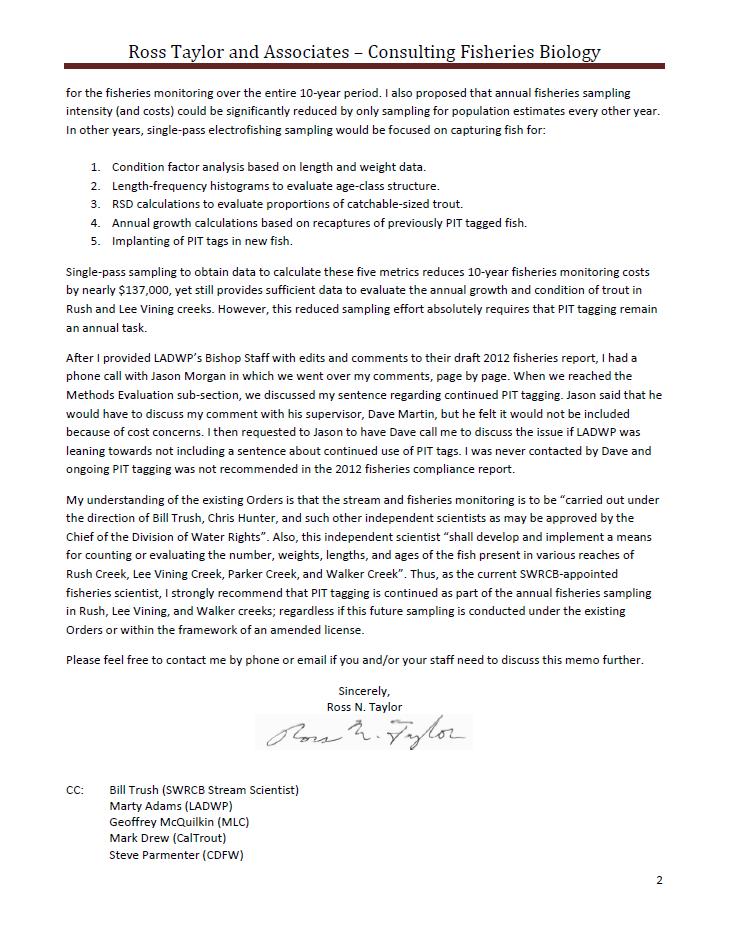
103 100
Section 3. Fisheries Monitoring Report for Rush, Lee Vining, Parker, and Walker Creeks
 Section 3 Fisheries Monitoring Report for Rush, Lee Vining, Parker, and Walker Creeks 2009-10 Fisheries Monitoring Report for 2009 Prepared by: Ross Taylor Ken Knudson Brad Shepard Prepared for: Los Angeles
Minnesota Department of Natural Resources Fisheries Division, Lake Superior Area
 Minnesota F-9-R(P)- Study 4 Job 616 Minnesota Department of Natural Resources Fisheries Division, Lake Superior Area Coaster Brook Trout Status in Minnesota-Lake Superior Tributaries Following Regulation
Job 1. Title: Estimate abundance of juvenile trout and salmon.
 STUDY PERFORMANCE REPORT State: Michigan Project No.: F-53-R-13 Study No.: 461 Title: Population dynamics of juvenile rainbow trout and coho salmon in Lake Superior tributaries Period Covered: April 1,
FINAL Caples Lake Fisheries Management Plan. Version 4.0
 FINAL Caples Lake Fisheries Management Plan Version 4.0 August 15, 2008 Purpose The Caples Lake Fisheries Management Plan (Plan) outlines the stocking plan to reestablish a sport fishery in Caples Lake
Monitoring of Downstream Fish Passage at Cougar Dam in the South Fork McKenzie River, Oregon February 8, By Greg A.
 Monitoring of Downstream Fish Passage at Cougar Dam in the South Fork McKenzie River, Oregon 1998- February 8, 2 By Greg A. Taylor Oregon Dept. of Fish & Wildlife 315 E. Main Street Springfield, OR 97478
* * * * * * * * * * * *
 Excerpts from Idaho Department of Fish and Game, 2003 Fishery Management Report. Southwest Region Nampa 2003. Brian J. Flatter, Regional Fishery Biologist, Kurtis Plaster, Senior Fishery Technician, Jeff
Rock Creek Huntington County Supplemental Evaluation
 Rock Creek Huntington County Supplemental Evaluation Date of Survey: September 8 to September 10, 2008 Biologist: Rod A. Edgell Survey Objectives: Conduct population estimates for game fish at Rock Creek
Current Status and Management Recommendations for the Fishery in the Cloverleaf Chain of Lakes
 Current Status and Management Recommendations for the Fishery in the Cloverleaf Chain of Lakes Jason Breeggemann Senior Fisheries Biologist Wisconsin Department of Natural Resources Outline DNR fisheries
NEVADA DEPARTMENT OF WILDLIFE STATEWIDE FISHERIES MANAGEMENT
 NEVADA DEPARTMENT OF WILDLIFE STATEWIDE FISHERIES MANAGEMENT FEDERAL AID JOB PROGRESS REPORTS F-20-52 2016 Lake Tahoe Rainbow Trout Study WESTERN REGION NEVADA DEPARTMENT OF WILDLIFE, FISHERIES DIVISION
NEVADA DEPARTMENT OF WILDLIFE STATEWIDE FISHERIES MANAGEMENT
 NEVADA DEPARTMENT OF WILDLIFE STATEWIDE FISHERIES MANAGEMENT FEDERAL AID JOB PROGRESS REPORTS F-20-52 2016 BOULDER RESERVOIR WESTERN REGION NEVADA DEPARTMENT OF WILDLIFE, FISHERIES DIVISION ANNUAL PROGRESS
c h a p t e r 6 n n n Related to the VAMP
 c h a p t e r 6 n n n Complimentary Studies Related to the VAMP Throughout 27 several fishery studies were conducted to advance the understanding of juvenile salmon abundance and survival in the San Joaquin
2012 Hat Creek Trout Population Estimate
 2012 Hat Creek Trout Population Estimate Michael Dege Introduction In 1972 a section of Hat Creek, Shasta County (from PG&E s Hat Creek Powerhouse #2 to Lake Britton) became one of California s first designated
Rivers and Streams Investigations
 Rivers and Streams Investigations Brian J. Flatter, Regional Fisheries Biologist Lance Hebdon, Regional Fisheries Biologist Jeff Dillon, Regional Fishery Manager ABSTRACT Three sections of the lower Boise
Minnesota Department of Natural Resources Division of Fish and Wildlife Section of Fisheries. Stream Survey Report. Cold Spring Creek.
 Minnesota F-29-R(P)-24 Area 315 Study 3 March 2015 Minnesota Department of Natural Resources Division of Fish and Wildlife Section of Fisheries Stream Survey Report Cold Spring Creek 2014 Mark Pelham Montrose
Abundance of Steelhead and Coho Salmon in the Lagunitas Creek Drainage, Marin County, California
 scanned for KRIS Abundance of Steelhead and Coho Salmon in the Lagunitas Creek Drainage, Marin County, California Prepared for: Marin Municipal Water District 220 Nellen Drive Corte Madera, California
Blue Creek Chinook Outmigration Monitoring Technical Memorandum
 Blue Creek Chinook Outmigration Monitoring 2012 Technical Memorandum Prepared by: Andrew Antonetti and Erika Partee Yurok Tribe Fisheries Program PO Box 1027 Klamath, California 95548 In Partnership with:
NEVADA DEPARTMENT OF WILDLIFE STATEWIDE FISHERIES MANAGEMENT
 NEVADA DEPARTMENT OF WILDLIFE STATEWIDE FISHERIES MANAGEMENT FEDERAL AID JOB PROGRESS REPORT F-20-50 2014 LAHONTAN CUTTHROAT TROUT STUDY WESTERN REGION NEVADA DEPARTMENT OF WILDLIFE, FISHERIES DIVISION
Application of a New Method for Monitoring Lake Trout Abundance in Yukon: Summer Profundal Index Netting (SPIN)
") Application of a New Method for Monitoring Lake Trout Abundance in Yukon: Summer Profundal Index Netting (SPIN) Prepared by: Lars Jessup Nathan Millar November 2011 Application of a New Method for Monitoring
Application of a New Method for Monitoring Lake Trout Abundance in Yukon: Summer Profundal Index Netting (SPIN) Prepared by: Lars Jessup Nathan Millar November 2011 Application of a New Method for Monitoring
LAKE TANEYCOMO 2012 ANNUAL LAKE REPORT. Shane Bush Fisheries Management Biologist Missouri Department of Conservation Southwest Region
 LAKE TANEYCOMO 12 ANNUAL LAKE REPORT Shane Bush Fisheries Management Biologist Missouri Department of Conservation Southwest Region March 1, 13 EXECUTIVE SUMMARY Lake Taneycomo was formed by the construction
Big Spring Creek Habitat Enhancement and Fishery Management Plans
 Big Spring Creek Habitat Enhancement and Fishery Management Plans November 5, 2012 Big Spring Events and Activities Center Newville, PA Charlie McGarrell Regional Habitat Biologist Pennsylvania Fish and
Final Bull Trout Genetics Monitoring Plan for the Wallowa Falls Hydroelectric Project. (FERC No. P-308) June 2017
 June 2017") Final for the Wallowa Falls Hydroelectric Project (FERC No. P-308) June 2017 Prepared by: Jeremiah Doyle PacifiCorp 825 NE Multnomah Street Portland, OR 97232 June, 2017 Page 1 of 8 Table of Contents 1.0
Final for the Wallowa Falls Hydroelectric Project (FERC No. P-308) June 2017 Prepared by: Jeremiah Doyle PacifiCorp 825 NE Multnomah Street Portland, OR 97232 June, 2017 Page 1 of 8 Table of Contents 1.0
NURSERY POND Fish Management Report. Jason C. Doll Assistant Fisheries Biologist
 NURSERY POND 2004 Fish Management Report Jason C. Doll Assistant Fisheries Biologist FISHERIES SECTION INDIANA DEPARTMENT OF NATURAL RESOURCES DIVISION OF FISH AND WILDLIFE I.G.C. South, Room W273 402
BOGUS CREEK SALMON STUDIES 2002
 BOGUS CREEK SALMON STUDIES 2002 BY: JEANNINE RICHEY California Department of Fish and Game KLAMATH RIVER PROJECT 303 SOUTH STREET YREKA, CALIFORNIA 96097 (530) 842-3109 California Department of Fish and
Jason Blackburn, Paul Hvenegaard, Dave Jackson, Tyler Johns, Chad Judd, Scott Seward and Juanna Thompson
 Alberta Conservation Association (ACA) Date: 2014-2015 Project Name: Owl River Walleye and Aquatic Habitat Assessment Fisheries Program Manager: Peter Aku Project Leader: Tyler Johns Primary ACA staff
Arizona Game and Fish Department Region I Fisheries Program. Chevelon Canyon Lake Fish Survey Report Trip Report April 2015
 Arizona Game and Fish Department Region I Fisheries Program Chevelon Canyon Lake Fish Survey Report Trip Report April 2015 Authors: Sally Petre and Mike Lopez Report Date: June 25, 2015 The Arizona Game
Discussion on the Selection of the Recommended Fish Passage Design Discharge
 Discussion on the Selection of the Recommended Fish Passage Design Discharge Introduction The provision of fish passage is a requirement for most proposed culvert and bridge installations in Alberta, depending
LAKE TANEYCOMO ANGLER CREEL SURVEY SUMMARY. Shane Bush Fisheries Management Biologist Missouri Department of Conservation Southwest Region
 LAKE TANEYCOMO 2008-2009 ANGLER CREEL SURVEY SUMMARY Shane Bush Fisheries Management Biologist Missouri Department of Conservation Southwest Region February 1, 2013 Introduction Lake Taneycomo was formed
LOGAN MARTIN RESERVOIR MANAGEMENT REPORT. Prepared by. E. Daniel Catchings District Fisheries Supervisor
 LOGAN MARTIN RESERVOIR MANAGEMENT REPORT 2008 Prepared by E. Daniel Catchings District Fisheries Supervisor Robert O. Andress District Fisheries Biologist Department of Conservation and Natural Resources
2013 Electrofishing Program Summary. Miramichi Salmon Association In collaboration with the Department of Fisheries and Oceans
 2013 Electrofishing Program Summary Miramichi Salmon Association In collaboration with the Department of Fisheries and Oceans Prepared by: Alex Parker Biologist Miramichi Salmon Association 485, Route
Cedar Lake Comprehensive Survey Report Steve Hogler and Steve Surendonk WDNR-Mishicot
 Cedar Lake- 2006 Comprehensive Survey Report Steve Hogler and Steve Surendonk WDNR-Mishicot ABSTRACT Cedar Lake is a 142 acre lake located in the southwest corner of Manitowoc County. It is a seepage lake
MINNESOTA DEPARTMENT OF NATURAL RESOURCES DIVISION OF FISHERIES AND WILDLIFE. Gamefish Assessment Report
 Minnesota DNR F-29-R(P) Area F312 February 1, 2013 MINNESOTA DEPARTMENT OF NATURAL RESOURCES DIVISION OF FISHERIES AND WILDLIFE Gamefish Assessment Report Spring Gamefish Assessment on the Mississippi
Arizona Game and Fish Department Region VI Fisheries Program
 Arizona Game and Fish Department Region VI Fisheries Program Saguaro Lake Fish Survey Report April 18 th 21 st, 2016 Author: Bryant Dickens Report Date: July 7, 2016 The Arizona Game and Fish Department
Final Fish Salvage & Temporary Tailrace Barrier Report for the Wallowa Falls Hydroelectric Project Tailrace. (FERC No. P-308) December 20, 2018
 December 20, 2018") Final Fish Salvage & Temporary Tailrace Barrier Report for the Wallowa Falls Hydroelectric Project Tailrace (FERC No. P-308) December 20, 2018 Prepared by: Jeremiah Doyle PacifiCorp 825 NE Multnomah Street
Final Fish Salvage & Temporary Tailrace Barrier Report for the Wallowa Falls Hydroelectric Project Tailrace (FERC No. P-308) December 20, 2018 Prepared by: Jeremiah Doyle PacifiCorp 825 NE Multnomah Street
Minnesota Department of Natural Resources Division of Fish and Wildlife Section of Fisheries. Stream Survey Report. Luxemburg Creek.
 Minnesota F-29-R(P)-24 Area 315 Study 3 March 2016 Minnesota Department of Natural Resources Division of Fish and Wildlife Section of Fisheries Stream Survey Report Luxemburg Creek 2015 Mark Pelham Sauk
Manual of Fisheries Survey Methods II: with periodic updates. Chapter 22: Guidelines for Sampling Warmwater Rivers with Rotenone
 Manual of Fisheries Survey Methods II: with periodic updates : Guidelines for Sampling Warmwater Rivers with Rotenone P. W. Seelbach, G. L. Towns, and D. D. Nelson Suggested citation: Seelbach, Paul W.,
2014 Winnebago System Walleye Report
 1986 1988 199 1992 1994 1996 1998 2 22 24 26 28 21 212 214 Number of YOY WAE / Trawl 214 Winnebago System Walleye Report Adam Nickel, Winnebago Gamefish Biologist, 18 March 215 The spring rush of 215 will
Final Fish Salvage & Temporary Tailrace Barrier Report for the Wallowa Falls Hydroelectric Project Tailrace. (FERC No. P-308) December 18, 2017
 December 18, 2017") Final for the Wallowa Falls Hydroelectric Project Tailrace (FERC No. P-308) December 18, 2017 Prepared by: Jeremiah Doyle PacifiCorp 825 NE Multnomah Street Portland, OR 97232 December 18, 2017 Page 1
Final for the Wallowa Falls Hydroelectric Project Tailrace (FERC No. P-308) December 18, 2017 Prepared by: Jeremiah Doyle PacifiCorp 825 NE Multnomah Street Portland, OR 97232 December 18, 2017 Page 1
Redd Dewatering and Juvenile Salmonid Stranding in the Lower Feather River,
 Redd Dewatering and Juvenile Salmonid Stranding in the Lower Feather River, 2005-2006 Interim Report for NOAA Fisheries Prepared by: California Department of Water Resources Division of Environmental Services
JadEco, LLC PO BOX 445 Shannon, IL 61078
 Introduction: With the assistance of Lake Holiday staff and volunteers, we were able to conduct an AC electrofishing survey on May 8, 27. Water temperatures were 2.3 C (8.5 F) and water clarity was decent
NEVADA DEPARTMENT OF WILDLIFE STATEWIDE FISHERIES MANAGEMENT
 NEVADA DEPARTMENT OF WILDLIFE STATEWIDE FISHERIES MANAGEMENT FEDERAL AID JOB PROGRESS REPORTS F-20-52 2016 REDBAND TROUT EASTERN REGION NEVADA DEPARTMENT OF WILDLIFE, FISHERIES DIVISION ANNUAL JOB PROGRESS
145 FERC 62,070 UNITED STATES OF AMERICA FEDERAL ENERGY REGULATORY COMMISSION
 145 FERC 62,070 UNITED STATES OF AMERICA FEDERAL ENERGY REGULATORY COMMISSION Public Utility District No. 1 of Douglas County, Washington Project No. 2149-163 ORDER APPROVING BULL TROUT STRANDING, ENTRAPMENT,
NEVADA DEPARTMENT OF WILDLIFE STATEWIDE FISHERIES MANAGEMENT
 NEVADA DEPARTMENT OF WILDLIFE STATEWIDE FISHERIES MANAGEMENT FEDERAL AID JOB PROGRESS REPORTS F-20-52 2016 MARLETTE LAKE WESTERN REGION Contents NEVADA DEPARTMENT OF WILDLIFE, FISHERIES DIVISION ANNUAL
MIDDLE FORK RESERVOIR Wayne County 2004 Fish Management Report. Christopher C. Long Assistant Fisheries Biologist
 MIDDLE FORK RESERVOIR Wayne County 2004 Fish Management Report Christopher C. Long Assistant Fisheries Biologist FISHERIES SECTION INDIANA DEPARTMENT OF NATURAL RESOURCES DIVISION OF FISH AND WILDLIFE
***Please Note*** April 3, Dear advisory committee members:
 April 3, 29 Dear advisory committee members: The fifth meeting of the CHF advisory committee will be held April 13 in Grants Pass from 6:-8:3 PM, and the purpose of this document is to help committee members
Salmonid Community of Lake Michigan: 2017 Fall Harbor Assessment
 Illinois Department of Natural Resources Division of Fisheries Salmonid Community of Lake Michigan: 2017 Fall Harbor Assessment Steven R. Robillard Illinois Department of Natural Resources - Lake Michigan
2015 Winnebago System Walleye Report
 215 Winnebago System Walleye Report Adam Nickel, Winnebago Gamefish Biologist, March 216 As winter passes in the rear view mirror, it won t be long until the spring rush of the 216 walleye run is here.
Agenda Item Summary BACKGROUND. Public Involvement ISSUE ANALYSIS. Attachment 1
 Agenda Item Summary Attachment BACKGROUND Between 996 and 03 white sturgeon fisheries in the Columbia River downstream from Bonneville Dam were managed under a series of management accords between the
Justification for Rainbow Trout stocking reduction in Lake Taneycomo. Shane Bush Fisheries Management Biologist Missouri Department of Conservation
 Justification for Rainbow Trout stocking reduction in Lake Taneycomo Shane Bush Fisheries Management Biologist Missouri Department of Conservation December 14, 2017 Lake Taneycomo was formed by the construction
LAKE DIANE Hillsdale County (T8-9S, R3W, Sections 34, 3, 4) Surveyed May Jeffrey J. Braunscheidel
 Surveyed May Jeffrey J. Braunscheidel") Michigan Department of Natural Resources Status of the Fishery Resource Report No. 2003-4, 2003 LAKE DIANE Hillsdale County (T8-9S, R3W, Sections 34, 3, 4) Surveyed May 2001 Jeffrey J. Braunscheidel Environment
Michigan Department of Natural Resources Status of the Fishery Resource Report No. 2003-4, 2003 LAKE DIANE Hillsdale County (T8-9S, R3W, Sections 34, 3, 4) Surveyed May 2001 Jeffrey J. Braunscheidel Environment
Steelhead Tagging Project at Moricetown Canyon. Data Analysis and Recommendations
 Steelhead Tagging Project at Moricetown Canyon AUGUST TO SEPTEMBER 2007 by Wet suwet en Fisheries Data Analysis and Recommendations by SKR Consultants Ltd. Smithers, B.C. for Pacific Salmon Foundation
Penns Creek, Section 05 Fishery Update and Regulation Review
 Penns Creek, Section 05 Fishery Update and Regulation Review Mission: To protect, conserve, and enhance the Commonwealth s aquatic resources and provide fishing and boating opportunities 66-mile long tributary
ASMFC Stock Assessment Overview: Red Drum
 Purpose The purpose of this document is to improve the understanding and transparency of the Commission s stock assessment process and results. It is the first of several that will be developed throughout
NEVADA DEPARTMENT OF WILDLIFE STATEWIDE FISHERIES MANAGEMENT FEDERAL AID JOB PROGRESS REPORTS F EUREKA COUNTY Small Lakes and Reservoirs
 NEVADA DEPARTMENT OF WILDLIFE STATEWIDE FISHERIES MANAGEMENT FEDERAL AID JOB PROGRESS REPORTS F-20-48 2012 EUREKA COUNTY Small Lakes and Reservoirs NEVADA DEPARTMENT OF WILDLIFE, FISHERIES DIVISION ANNUAL
OCTOBER 2006 MAMMOTH CREEK FISH COMMUNITY SURVEY
 OCTOBER 2006 MAMMOTH CREEK FISH COMMUNITY SURVEY Prepared for: Mammoth Community Water District P.O. Box 597 Mammoth Lakes, California 93546 FINAL REPORT Prepared by: Tim Salamunovich Thomas R. Payne &
SECTION 2 HYDROLOGY AND FLOW REGIMES
 SECTION 2 HYDROLOGY AND FLOW REGIMES In this section historical streamflow data from permanent USGS gaging stations will be presented and discussed to document long-term flow regime trends within the Cache-Bayou
INLAND LAKE MANAGEMENT REPORT FY Spring 2008
 INLAND LAKE MANAGEMENT REPORT FY 2008 Spring 2008 Prepared by Robert O. Andress District Fisheries Biologist E. Daniel Catchings District Fisheries Supervisor Kevin W. Baswell District Biologist Aide Department
ASMFC American Shad Sustainable Fishing Plan for Georgia
 ASMFC American Shad Sustainable Fishing Plan for Georgia Introduction: Submitted by Don Harrison Georgia Department of Natural Resources Wildlife Resources Division P.O. Box 289, 18 Darling Avenue Waycross,
index area in Pine Creek mainstem to establish redd-life
 Pine Creek Bull Trout - 2011 1. Swift Reservoir adult migration estimate 2. Half-duplex Passive Integrated Transponder (PIT) tag antenna arrays in Pine and Rush Creeks 3. Yale tailrace collection and transport
ASMFC Stock Assessment Overview: Red Drum
 Introduction This document presents a summary of the 217 stock assessments for red drum. These assessments were initially conducted through the Southeast Data, Assessment and Review (SEDAR) process using
Lake Butte des Morts Commercial Seining Project Report
 Lake Butte des Morts Commercial Seining Project Report Adam Nickel, Winnebago Gamefish (excluding sturgeon) Biologist, 22 December 2014 Conducting comprehensive fish surveys on the Upriver Lakes, including
FISHERIES BLUE MOUNTAINS ADAPTATION PARTNERSHIP
 FISHERIES A warming climate, by itself, substantially affects the hydrology of watersheds in the Blue Mountains. Among the key hydrologic changes projected under all scenarios for the 2040s and beyond
Minnesota Department of Natural Resources Division of Fish and Wildlife Section of Fisheries. Stream Survey Report. Three Mile Creek 2011
 Minnesota Department of Natural Resources Division of Fish and Wildlife Section of Fisheries Stream Survey Report Three Mile Creek 2011 By Joseph D. Stewig Montrose Area Fisheries Office TABLE OF CONTENTS
Study Update Fish Distribution and Species Composition
 Study Update Fish Distribution and Species Composition Goals and Study Area Gain a better understanding of fish species composition and abundance in waters associated with the Packwood Lake Hydroelectric
STURGEON CONSERVATION
 MIDDLE SCHOOL DISCUSSION GUIDE DISCUSSION GUIDE STURGEON CONSERVATION Natural Resource Science DISCUSSION GUIDE OVERVIEW GRADE LEVELS - Grades 6-8 ENDURING KNOWLEDGE Students should know the history of
Kirt Hughes Washington Department of Fish and Wildlife Region 6 - Fish Program Manager
 Kirt Hughes Region 6 - Fish Program Manager Habitat Hatcheries Harvest Clean Water Act Shorelines Harvest Hydro Habitat Forest Practices Non-regulatory Programs Water Supply & Conservation Growth Management
FY 2012 ANNUAL PROJECT REPORT PROJECT NUMBER: 123-b. I. Project Title: Nonnative fish control in the middle Green River
 COLORADO RIVER RECOVERY PROGRAM RECOVERY PROGRAM FY 2012 ANNUAL PROJECT REPORT PROJECT NUMBER: 123-b I. Project Title: Nonnative fish control in the middle Green River II. Bureau of Reclamation Agreement
STUDY PERFORMANCE REPORT
 STUDY PERFORMANCE REPORT State: Michigan Project No.: F-80-R-7 Study No.: 230654 Title: Evaluation of brown trout and steelhead competitive interactions in Hunt Creek, Michigan. Period Covered: October
M E M O R A N D U M. Garcia and Associates P.O. Box 1268 Tahoe City, CA Phone: (530)
") M E M O R A N D U M Garcia and Associates P.O. Box 1268 Tahoe City, CA 96145 Phone: (530) 363-2008 ichan@garciaandassociates.com TO: Curtis Steitz (PG&E, Environmental Services) FROM: Ian Chan (Aquatic
M E M O R A N D U M Garcia and Associates P.O. Box 1268 Tahoe City, CA 96145 Phone: (530) 363-2008 ichan@garciaandassociates.com TO: Curtis Steitz (PG&E, Environmental Services) FROM: Ian Chan (Aquatic
NEVADA DEPARTMENT OF WILDLIFE STATEWIDE FISHERIES MANAGEMENT
 NEVADA DEPARTMENT OF WILDLIFE STATEWIDE FISHERIES MANAGEMENT FEDERAL AID JOB PROGRESS REPORTS F-20-50 2014 BILK CREEK RESERVOIR WESTERN REGION 1 NEVADA DEPARTMENT OF WILDLIFE, FISHERIES DIVISION JOB PROGRESS
JOINT STAFF REPORT WINTER FACT SHEET NO. 9 Columbia River Compact March 18, 2004
 JOINT STAFF REPORT WINTER FACT SHEET NO. 9 Columbia River Compact March 18, 2004 Purpose: To review ongoing commercial fisheries and consider non-indian commercial fishing seasons for salmon, smelt and
NEVADA DEPARTMENT OF WILDLIFE STATEWIDE FISHERIES MANAGEMENT
 NEVADA DEPARTMENT OF WILDLIFE STATEWIDE FISHERIES MANAGEMENT FEDERAL AID JOB PROGRESS REPORTS F-20-48 2012 LAKE TAHOE WESTERN REGION Contents NEVADA DEPARTMENT OF WILDLIFE, FISHERIES DIVISION ANNUAL PROGRESS
TABLE ROCK LAKE 2014 ANNUAL LAKE REPORT. Shane Bush Fisheries Management Biologist Missouri Department of Conservation Southwest Region
 TABLE ROCK LAKE 14 ANNUAL LAKE REPORT Shane Bush Fisheries Management Biologist Missouri Department of Conservation Southwest Region March 1, 15 EXECUTIVE SUMMARY Table Rock Lake is a 43,1 acre reservoir
STUDY PERFORMANCE REPORT
 STUDY PERFORMANCE REPORT State: Michigan Project No.: F-81-R-3 Study No.: 491 Title: Evaluation of lake sturgeon Acipenser fulvescens populations in the St. Clair River and Lake St. Clair Period Covered:
WFC 10 Wildlife Ecology & Conservation Nov. 29, Restoration Ecology: Rivers & Streams. Lisa Thompson. UC Cooperative Extension
 Restoration Ecology: Rivers and Streams WFC 10 29 Nov 2010 Restoration of ecosystems often involves creating new systems with only partial resemblance to the original ecosystems Lisa Thompson Fisheries
Big Canyon 67 miles upstream. 38 miles upstream
 TEXOMA STRIPED BASS MANAGEMENT/RESEARCH Texoma is one of only about 1 reservoirs in the country that has a naturally reproducing striped bass population. Texoma is set off further from most reservoirs
FINAL REPORT. Yonkers Creek Migration Barrier Removal Project Wonderstump Road Del Norte County. Submitted By:
 FINAL REPORT Yonkers Creek Migration Barrier Removal Project Wonderstump Road Del Norte County Submitted By: Del Norte County Community Development Department Yonkers Creek Migration Barrier Removal Project
NEVADA DEPARTMENT OF WILDLIFE STATEWIDE FISHERIES MANAGEMENT
 NEVADA DEPARTMENT OF WILDLIFE STATEWIDE FISHERIES MANAGEMENT FEDERAL AID JOB PROGRESS REPORTS F-2-52 216 CHIMNEY RESERVOIR WESTERN REGION NEVADA DEPARTMENT OF WILDLIFE, FISHERIES DIVISION JOB PROGRESS
Fisheries Aide Intern with the Monterey Peninsula Water Management District. Kenneth Norberg. California State University Monterey Bay
 Fisheries Aide Intern with the Monterey Peninsula Water Management District Kenneth Norberg California State University Monterey Bay June 2 2012 to August 13 2012 Dr. Arlene Haffa, California State University
NEVADA DEPARTMENT OF WILDLIFE STATEWIDE FISHERIES MANAGEMENT FEDERAL AID JOB PROGRESS REPORTS F LAHONTAN CUTTHROAT TROUT EASTERN REGION
 NEVADA DEPARTMENT OF WILDLIFE STATEWIDE FISHERIES MANAGEMENT FEDERAL AID JOB PROGRESS REPORTS F-20-50 2014 LAHONTAN CUTTHROAT TROUT EASTERN REGION NEVADA DEPARTMENT OF WILDLIFE, FISHERIES DIVISION ANNUAL
NEVADA DEPARTMENT OF WILDLIFE STATEWIDE FISHERIES MANAGEMENT
 NEVADA DEPARTMENT OF WILDLIFE STATEWIDE FISHERIES MANAGEMENT FEDERAL AID JOB PROGRESS REPORTS F-20-49 2013 LAKE TAHOE WESTERN REGION NEVADA DEPARTMENT OF WILDLIFE, FISHERIES DIVISION ANNUAL PROGRESS REPORT
Michigan Department of Natural Resources Status of the Fishery Resource Report Page 1
 Michigan Department of Natural Resources 2007-33 Status of the Fishery Resource Report Page 1 Grand Sable Lake Alger County, T49N, R14W, Sec. Many Lake Superior watershed, last year surveyed 2004 James
LAKE TANEYCOMO 2011 ANNUAL LAKE REPORT
 LAKE TANEYCOMO 211 ANNUAL LAKE REPORT Shane Bush Fisheries Management Biologist Missouri Department of Conservation Southwest Region March 1, 212 EXECUTIVE SUMMARY Lake Taneycomo was formed by the construction
LOWER MOKELUMNE RIVER UPSTREAM FISH MIGRATION MONITORING Conducted at Woodbridge Irrigation District Dam August 2014 through July 2015.
 LOWER MOKELUMNE RIVER UPSTREAM FISH MIGRATION MONITORING Conducted at Woodbridge Irrigation District Dam August 2014 through July 2015 August 2015 Casey Del Real and Matt Saldate East Bay Municipal Utility
The Effects of Stream Adjacent Logging on Downstream Populations of Coastal Cutthroat Trout
 The Effects of Stream Adjacent Logging on Downstream Populations of Coastal Cutthroat Trout. D. S. Bateman 1, R.E. Gresswell 2, Aaron M. Berger 3, D.P. Hockman-Wert 4 and D.W. Leer 1 1 Department of Forest
NORTHWEST SCIENCE AND INFORMATION
 Science and Information Branch NORTHWEST SCIENCE AND INFORMATION Aquatics Update 2002-1 Fall Walleye Index Netting (FWIN) and Trap Netting Summary for Niobe Lake, 2000 by T. Cano Introduction Since 1981,
I. Project Title: Upper Yampa River northern pike management and monitoring
 COLORADO RIVER RECOVERY PROGRAM FY 217 ANNUAL PROJECT REPORT RECOVERY PROGRAM PROJECT NUMBER: 98b I. Project Title: Upper Yampa River northern pike management and monitoring II. Bureau of Reclamation Agreement
Year Avg. TAC Can Others Totals
 SKATE IN DIVISIONS 3L, 3N, 3O AND SUBDIVISION 3Ps Background There are 8 to 1 species of skate in the waters around Newfoundland. Of these, thorny skate (Raja radiata) is by far the most common, comprising
ASSESSMENT OF WHITE PERCH IN LAKE WINNIPESAUKEE, TUFTONBORO (2016) Anadromous and Inland Fisheries Operational Management Investigations
 Anadromous and Inland Fisheries Operational Management Investigations") ASSESSMENT OF WHITE PERCH IN LAKE WINNIPESAUKEE, TUFTONBORO (2016) STATE: GRANT: GRANT TITLE: JOB 9: New Hampshire F-50-R-33 Anadromous and Inland Fisheries Operational Management Investigations Warmwater
ASSESSMENT OF WHITE PERCH IN LAKE WINNIPESAUKEE, TUFTONBORO (2016) STATE: GRANT: GRANT TITLE: JOB 9: New Hampshire F-50-R-33 Anadromous and Inland Fisheries Operational Management Investigations Warmwater
Packwood Lake Intake Screen Velocity Test Report for Energy Northwest's Packwood Lake Hydroelectric Project FERC No Lewis County, Washington
 for Energy Northwest's Packwood Lake Hydroelectric Project FERC No. 2244 Lewis County, Washington Submitted to P.O. Box 968 Richland, Washington 99352-0968 Submitted by EES Consulting 1155 North State
Gitanyow Fisheries Authority
 Gitanyow Fisheries Authority The 211 Kitwanga River Salmon Smolt Assessment Submitted to: Prepared by: Gitanyow Hereditary Chiefs Skeena Wild Fisheries and Oceans Canada (Prince Rupert Stock Assessment)
NEVADA DEPARTMENT OF WILDLIFE STATEWIDE FISHERIES MANAGEMENT
 NEVADA DEPARTMENT OF WILDLIFE STATEWIDE FISHERIES MANAGEMENT FEDERAL AID JOB PROGRESS REPORTS F-20-49 2013 SQUAW CREEK RESERVOIR WESTERN REGION Contents NEVADA DEPARTMENT OF WILDLIFE, FISHERIES DIVISION
Tracking Juvenile Summer Flounder
 Tracking Juvenile Summer Flounder East Coast MARE Materials For the leader: Whiteboard Markers (different colors) For each group: Copies of student group packets Copies of student worksheet Overview Scientists
Comprehensive Fisheries Survey of High Falls Reservoir, Marinette County Wisconsin during 2004 and Waterbody Identification Code
 Comprehensive Fisheries of High Falls Reservoir, Marinette County Wisconsin during 2004 and 2005 Waterbody Identification Code 540600 Justine Hasz Senior Fisheries Biologist Wisconsin Department of Natural
Behavior and survival of hatchery reared advanced fingerling largemouth bass using radio telemetry. Brandon Thompson
 Behavior and survival of hatchery reared advanced fingerling largemouth bass using radio telemetry Brandon Thompson Florida largemouth bass Micropterus salmoides floridanus Premier freshwater sportfish
LONE TREE POCKET ESTUARY RESTORATION 2004 FISH SAMPLING AND PRE-RESTORATION PROJECT MONITORING REPORT
 Skagit River System Cooperative 11426 Moorage Way P.O. Box 368 LaConner, WA 98257-368 Phone: 36-466-7228 Fax: 36-466-447 www.skagitcoop.org LONE TREE POCKET ESTUARY RESTORATION 24 FISH SAMPLING AND PRE-RESTORATION
ASSESSMENT OF BLACK CRAPPIE AND WHITE PERCH IN HIGHLAND LAKE, STODDARD-WASHINGTON, NH (2014) New Hampshire
 New Hampshire") ASSESSMENT OF BLACK CRAPPIE AND WHITE PERCH IN HIGHLAND LAKE, STODDARD-WASHINGTON, NH (2014) STATE: GRANT: GRANT TITLE: JOB 9: New Hampshire F-50-R-31 Anadromous and Inland Fisheries Operational Management
ASSESSMENT OF BLACK CRAPPIE AND WHITE PERCH IN HIGHLAND LAKE, STODDARD-WASHINGTON, NH (2014) STATE: GRANT: GRANT TITLE: JOB 9: New Hampshire F-50-R-31 Anadromous and Inland Fisheries Operational Management
MARTINDALE POND Wayne County 2004 Fish Management Report. Christopher C. Long Assistant Fisheries Biologist
 MARTINDALE POND Wayne County 2004 Fish Management Report Christopher C. Long Assistant Fisheries Biologist Fisheries Section Indiana Department of Natural Resources Division of Fish and Wildlife I.G.C.
Dan Rawding Ann Stephenson Josh Holowatz Ben Warren Mara Zimmerman
 Dan Rawding Ann Stephenson Josh Holowatz Ben Warren Mara Zimmerman Background Since 1915 Columbia River fisheries have been regulated by the Columbia River Compact (States of OR & WA) Commercial harvest
Quemahoning Reservoir
 Pennsylvania Fish & Boat Commission Biologist Report Quemahoning Reservoir Somerset County May 2011 Trap Net, Gill Net and Electrofishing Survey Quemahoning Reservoir is an 899 acre impoundment located
TROUT CREEK WATERSHED (Second Year of Snowline Data)
") Extent of Snow Cover During the 2002 Spring Freshet For the TROUT CREEK WATERSHED (Second Year of Snowline Data) (Penticton Forest District) 1.0 INTRODUCTION The extent of snow cover over a watershed basin
Extent of Snow Cover During the 2002 Spring Freshet For the TROUT CREEK WATERSHED (Second Year of Snowline Data) (Penticton Forest District) 1.0 INTRODUCTION The extent of snow cover over a watershed basin