Exxon Valdez Oil Spill Restoration Project Annual Report. Comprehensive Killer Whale Investigation. Restoration Project
|
|
|
- Edmund Ferguson
- 5 years ago
- Views:
Transcription
1 Exxon Valdez Oil Spill Restoration Project Annual Report Comprehensive Killer Whale Investigation Restoration Project This annual report has been prepared for peer review as part of the Exxon Valdez Oil Spill Trustee Council restoration program for the purpose of assessing project progress. Peer review comments have been addressed in this annual report. Craig 0. Matkin Dr. David Scheel Graeme Ellis Lance Barrett Lennard Eva Saulitis North Gulf Oceanic Society P.O. Box Homer, AK April 1996
2 Comprehensive Killer Whale Investigations Restoration Project Annual Report Study History: The current project was initiated under Restoration Project 95012a and this is the first annual report. Killer whales were previously monitored in Prince William Sound, Alaska with funding from the Exxon Valdez Oil spill Trustee Council in 1989, 1990, and 1991 (Dahlheim, M.E. and C.O. Matkin, 1993) and in 1993 (Dahlheim 1994). The North Gulf Oceanic Society (NGOS) independently maintained a monitoring program in all other years since An assessment of the status of killer whales from 1984 to 1992 in Prince William Sound is made in Matkin et d. (1994). Abstract: Population monitoring of killer whales (Orcinusorca) was continued using photoidentification methods similar to those used in damage assessment following the Exxon VaMez oil spill. The loss of 5 whales from the AB pod of resident killer whales in 1994 was confirmed in At least nine individuals from the AT transient group have been missing since 1990 and appear to be dead or have permanently emigrated from Prince William Sound. Input of historical data on behavior and predation events into a specially designed Geographic Infromation System was initiated in This data is being used to examine changes in killer whale behavior and the predation killer whales on the nonrecovering harbor seal population. Preliminary results indicate harbor seals comprise 30% if the diet of transient killer whales. Biopsy samples were collected from 48 free ranging killer whales including whales from both resident and transient groups. Skin tissue samples are being used for genetic analysis to determine the extent of separation of resident and transient killer whale populations and to examine other population characteristics. Blubber samples collected in 1995 were provided to NMFS/NMML for lipid/fatty acid and isotope analysis. Key Words: biopsy, Exxon Valdez, GIs, harbor seals, killer whales, ~hotoidentification, Orcinusorca, predation, Prince William Sound, resident, transient Citation: Matkin, C.O., D. Scheel, G. Ellis, L. Barrett-Lennard, E. Saulitis Comprehensive killer whale investigation, Exxon Valdez Oil Spill Restoration Project Annual Report (Restoration Project ), North Gulf Oceanic Society, Homer, Alaska.
3
4
. The North Gulf Oceanic Society (NGOS) independently maintained a monitoring program in all other years since 1984 (Matkin et ul. 1994).")
5 Executive Summary Killer whales were monitored in Prince William Sound, Alaska with funding from the Emon Valdez Oil spill Trustee Council in 1989,1990, and 1991 (damage assessment) and in 1993 (restoration monitoring). The North Gulf Oceanic Society (NGOS) independently maintained a monitoring program in all other years since 1984 (Matkin et ul. 1994). This report details the continued monitoring of killer whales in Prince William Sound in The goal of the monitoring has been to obtain identification photographs of all whales in all major resident pods and transient groups on an annual basis. Photoidentification techniques (after Bigg et al. 1990) were used to identify individual whales. The current photographic database includes thousands of frames of film collected from used to provide individual identifications for each encounter with whales. These data have been computerized in a separate photographic database for association analysis and examination of pod structure. Companion of vital rates and a preliminary examination of pod structure were made between AB pod and all other frequently sighted resident pods based on this photographic data. Changes in the resightings of individual whales from the AT transient group were examined statistically. Data on killer whale behavior and predation events were recorded in a standard format during all years of the monitoring program. These data include the locations and behaviors of killer whales and the tracks of the survey vessels. It is appropriate that the data be input, maintained, and analyzed in a spatial database using a Geographic Information System (GIs). Analyses of these data will help evaluate recovery, recognize changes in behavior, and estimate killer whale impact on harbor seals. A GIs system was designed and data input initiated in 1995 at the Prince William Sound Science Center. Improvements were made in the field data collection format prior to the 1995 season. Tissue samples from individually identified, free ranging killer whales were collected in 1994 and 1995 using a biopsy dart system and field techniques developed by Barrett-Lnnard eta2. (19%). Genetic analysis using mtdna techniques was initiated in 1995 to examine the separation of two putative populations of killer whales in Prince William Sound. Although four calves were recruited into AB pod during the period , five additional mortalities were recorded in 1994 and confirmed in The pod now contains 22 individuals. Mortalities in 1994 included one reproductive female, three juveniles, and one adult male whose fin collapsed at the time of the oil spill. These deaths may be related to changes in pod structure following the 14 mortalities of One subgroup of six whales from AB pod has traveled with AJ pod in 1994 and These observations indicate AB pod is not recovering following the Exxon Vuldez oil spill. Despite substantial field effort the number of AT whales sighted each year has declined following Only 11 of the original 22 whales attributed to the AT group were photographed in The rate of encounter with members of this group has also declined. Modeling of resighting data ( ) for the individual AT group whales supports the hypothesis that the missing whales are dead or have permanently emigrated from Prince William Sound. Twelve years of systematic data collected under pubiic and private funding are being placed in a specially designed GIs system at the Prince William Sound Science Center (PWSSC). Approximately 60% of this data was input in This database will allow examination of feeding habits and other behaviors of killer whales in a spatial context before and after the spill. An important product of this investigation will be a clarification of the relationship between killer whales and the non-recovering harbor seals in Prince William Sound. Additional observation of killer whale predation and collection of killer whale prey items occurred in Predation information is included as part of the GIs data base and
 and transient (marine mammal eating) killer whales.")
6 analysis of prey items are being used to determine the specific components of the killer whale diet. Preliminary results indicate a clear dietary separation between resident (fish eating) and transient (marine mammal eating) killer whales. Harbor seals and Dall's porpoise are important prey items for transient killer whales in the April-October period comprising 30% and 44% respectively of the observed kills. Biopsy tissue sampling for genetic analysis occurred in 1994 and A total of 48 full size samples have been collected from resident and transient killer whales. Determination of the genetic separation of resident and transient killer whales is the initial goal of this aspect of the project. From the skin samples two segments of mitochondria1 DNA (mtdna) from each sample were amplified using the polymerase chain reaction (PCR). Restriction fragment length polymorphism analysis is currently being performed on the PCR products and will discriminate any mitochondria1 differences between proposed Prince William Sound killer whale populations. The analysis is being camed out concurrently with a comprehensive genetic analysis of British Columbian killer whale stocks, which will make it possible to assess relatedness of Prince William Sound killer whales to whales from other areas. The subcutaneous portion of the 1995 biopsy samples were forwarded to Dr. Graeme Worthy for lipidlfatty acid analysis (separate report). The subcutaneous portion of the 1994 samples (collected under private funding) is being analyzed for environmental contaminants at the NMFS Environmental Contaminant Laboratory, Seattle. Introduction On March 31, 1989, a week after the Exron Valdez Oil spill ( the spill), the AB pod of resident killer whales was observed traveling through oil sheens in western Prince William Sound and six members of the pod were missing. In the two years following the spill a total of 14 whales were lost from AB pod and there was no recruitment into the pod. The rate of mortality observed in this pod after the oil spill (19% in 1989 and 21% in 1990) far exceeds rates recorded over the past 11 years for the other resident pods in Prince William Sound or over the past 20 years for 19 resident pods in British Columbia and Washington State (Balcomb et al. 1982, Bigg 1982, Olesiuk et al. 1990, Matkin et al. 1994). Since the time of spill the social structure within AB pod has continued to show sips of deterioration. Subgroups have traveled independently of the pod, and pod members have not consistently traveled with closest relatives. AB pod was seen less frequently following the spill. Prior to spill AB pod was the most frequently encountered resident pod in Prince William Sound (Matkin et al. 1994). Nine of the 22 whales from the transient AT1 group were not observed or photodocumented from 1990 to 1994 despite extensive field effort. While mortalities in transient groups cannot be confirmed with the same certainty as for residents, there is an increasing likelihood that these whales are dead or have permanently emigrated from the Sound. The AB pod and AT group possibly were injured due to the effects of the Exxon Valdez oil spill and that they do not appear to be recovering. Numbers of whales in other well-documented resident pods have increased during the same period. Annual photographic monitoring has been the most effective tool in determination of the recovery status of AB pod and the AT group and the status of the entire Prince William Sound killer whale population (Matkin et al. 1994). This project continues using photoidentification to monitor changes in resident killer whale pods (including AB pod) and the AT transient group in Prince William Sound. Predation by killer whales may be a factor in the non-recovery of harbor seals in Prince William Sound following the Exxon Valdez oil spill. At least 300 harbor seals were killed at the time of spill and the harbor seal population continues to decline. It appears that 5
7 there are two types of killer whales in Prince William Sound, only one (transients) has been observed preying on marine mammals. This project examines harbor seal predation parameters using historical killer whale behavioral data in a GIs framework The separation of marine mammal eating and fish eating killer whales is examined using this behavioral data and genetic analysis. Genetic material was obtained using lightweight biopsy darts (Barrett-Lennard et a1 1996). Subcutaneous material collected was supplied for lipidlfatty acid analysis and/or contaminant analysis. Results from 1995 indicate that AB pod suffered five additional mortalities in 1994 that included one reproductive female, three juveniles and adult male. Other resident pods did not demonstrate atypical mortalities or mortality rates. The whales missing from the AT transient group since 1990 remain missing. The GIs system was designed, data sheets reworked, and approximately 60% of historic data entered into the system. Preliminary tabulation of predation events indicated harbor seals and Dall's porpoise are the primary food items of transient killer whales from April to October. Resident killer whales appear to select coho salmon from mixed schools during the July to September period. Full sized biopsy samples have been obtained from 48 whales. DNA has been successfully extracted from all samples and polymerase chain reaction (PCR) products have been obtained. Objectives 1. To monitor AB pod, the AT group and the other major resident pods in Prince William Sound and determine recovery status of AB pod and the AT group
. The 12.")
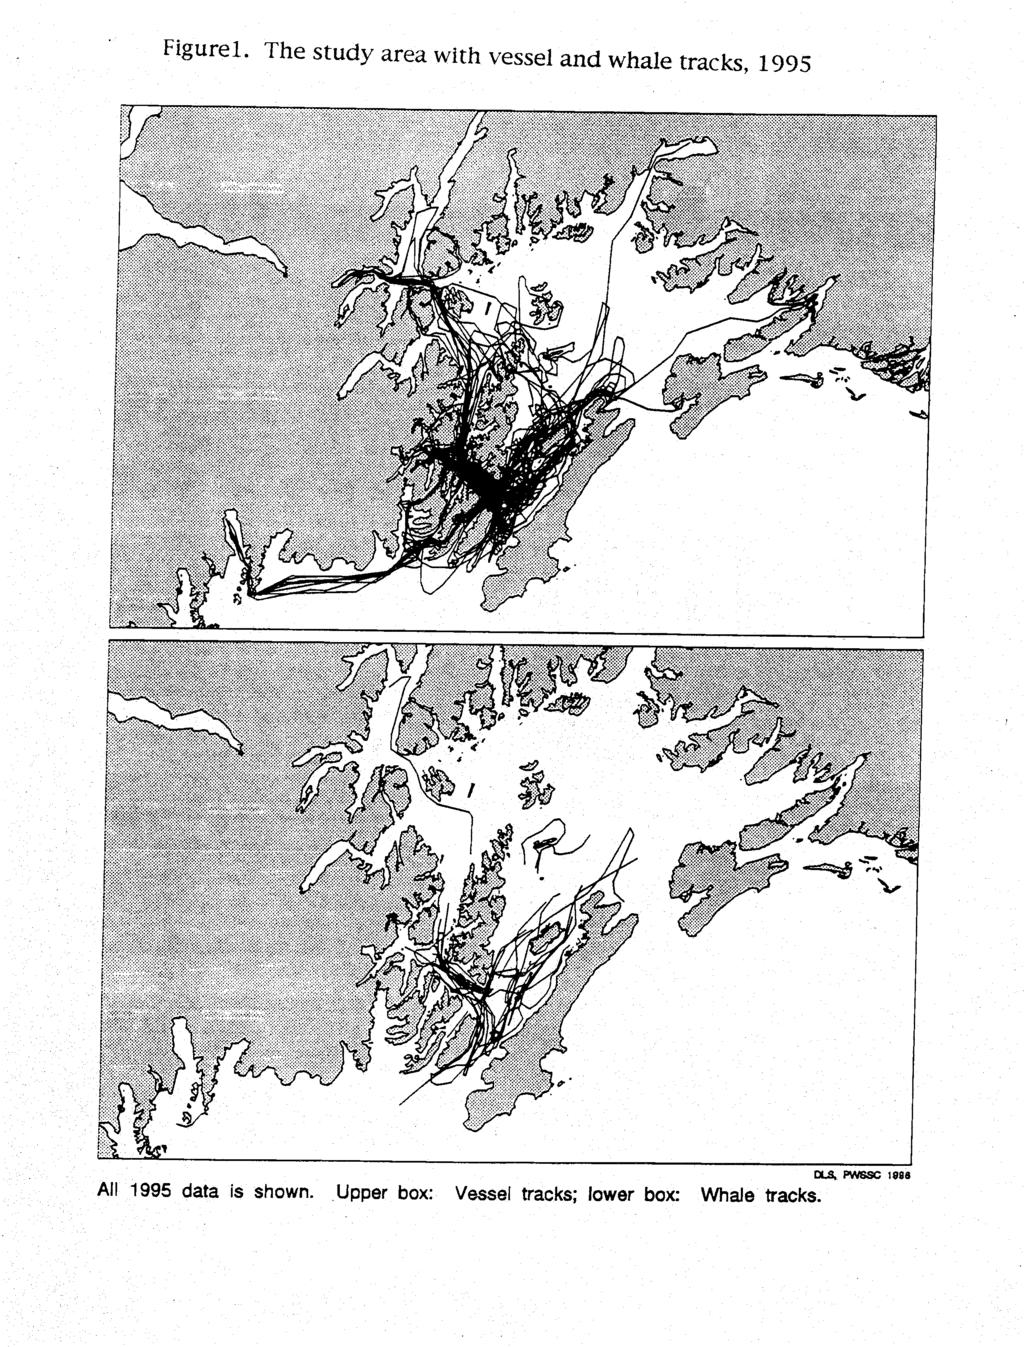
8 Methods Most field work for the 1985 photoidentification study was conducted from the Whale 2, a 7.9m live-aboard vessel powered by a 165 hp diesel engine with inboard/outboard drive. This vessel centered its range in Montague Strait and lower Knight Island Passage but also made occasional searches in northwestern PWS and Upper Knight Island Passage (Figure I). The 12.8 m vessel Lucky Star and an 5.1 m console skiff with 60 hp outboard were used as a mobile research platform and supply boat, collecting biopsy samples, predation data, and conducting photoidentification studies as well as supplying food and fuel to thewhale 2. N.G.O.S. biologists on the Whale I( a 15.5m cabin skiff with 8Shp outboard) and Auklet (18m inboard diesel powered vessel) also photographed killer whales and kept data sheets during surveys directed at humpback whale photoidentification. The field time and killer whale encounters for these vessels were included in the GIs data base and used in our analysis. Researchers attempted to maximize the number of contacts with each killer whale pod to insure sufficient photographs of each individual within the pod. Searches for whales were not random, but based on current and historical sighting information. An encounter was defined as the successful detection, approach and taking of identification photographs. Accounts of whales from other mariners (generally by VHF radio were termed "reports". Although reports were used to select areas to be searched, all identifications were made from photographs taken during encounters. Searches were centered in areas that had produced the most encounters with killer whales in the past. In all years whales were found visually, or by listening for killer whale calls with a directional hydrophone, or by responding to VHF radio calls from other vessels. Regular requests for recent killer whale sightings were.made on hailing Channel 16 VHF. Photographs for individual identification were taken of the port side of each whale showing details of the dorsal fin and white saddle patch. Photographs were taken at no less than sec using Ilford HP5, a high speed black and white film, exposed at 1600 ASA. A Nikon 8008 autofocus camera with internal motor drive and a 300 mm f4.5 autofocus lens was used. When whales were encountered, researchers systematically moved from one subgroup (or individual) to the next keeping track of the whales photographed. If possible individual whales were photographed several times during each encounter to insure an adequate identification photograph. Whales were followed until all whales were photographed or until weather andlor darkness made photography impractical A vessel log and chart of the vessel track were kept for each day the research vessels operated ( LOG, Appendix 1 ). Similar logs were kept for all previous study years will be used in the GIs format to estimate effort. On these logs the elapsed time and distance traveled were recorded and vessel track was plotted. Record was made of time and location of all whale sightings and weather and sea state noted at regular intervals. Specifics of each encounter with killer whales were recorded on standardized data forms that have been used since These forms were modified in 1995 to improve collection of data for GIs input (ENCOUNTER, Appendix 2). Data recorded included date, time, duration, and location of the encounter. Rolls of film exposed and the estimated number of whales photographed also were recorded. A chart of the whales' trackline during the encounter was completed and the distance traveled by the vessel with the whales calculated. Specific group and individual behaviors (i.e. feeding, resting, traveling, socializing, milling) were recorded by time and location when possible. Only one or a few sightings were recorded on any field day, but encounters with whales averaged from 3-6 hours, providing considerable behavioral information (travel rates, duration of feeding bouts, etc.). On each sheet the path of the vessel (LOG) or whales (ENCOUNTER) was recorded on a sketch map. These tracklines were entered by hand into the GIs database along with associated tabular data against a background map of the coastline. In all cases, location data was stored as the trackline, rather than as tabular arrays of point locations.

9 The GIS (Arcllnfo) can produce such coordinate arrays if from the tracklines if needed. Comments on the data sheets regarding the specific locations of events such as feeding activity or changes in the weather were recorded in the comments fields. The data entry system was designed and written using the ESRI Advanced Macro Language for Arcllnfo. Complete procedures for entering the data are described in Appendix 5. The user proceeds through a series of menus and fills in the designated field for each tabular data item. When all data for a particular boat or whale path has been entered, the user clicks on "Add Record" and is prompted to enter the path of the associated boat or whale. Once this is entered, the macro attends to relating the tabular and vector data and processing the data layer to maintain its spatial structure in ArcIInfo. Directed observations of feeding behavior and identification and collection of prey of killer whales were made from all vessels as a part of the 1995 fieldwork. Opportunistic prey identification and collection from prior years was also available and used in our analysis. Only events that provided positive evidence of a kill were categorized as predation. Evidence included prey observed in the mouth of the whale, bits of hair or other parts, or oil slicks with bits of blubber. Incidents of harassment of potential marine mammal prey were also collected. This included instances where evidence was not observed but a kill was suspected or when potential prey exhibited fright or flight response or other strong behavioral reaction to killer whales. Harassment was demonstrated by behaviors such as flipper slapping and lobtailing by humpback whales and fleeing behavior by small cetaceans, pinnepeds, or mustelids. When predation on fish was observed, fish scales from the site of fish kills by killer whales were collected and later identified by species. Slides were individually mounted and identifications were made by a laboratory specializing in fish scale aging and identification. Fish scales and marine mammal remains were collected with a fine mesh net on an extendible handle (5 m. maximum extension). The pod or group of killer whales and specific individuals present at the kill or harassment incidents were recorded on the encounter data sheets (Appendix 2). Tissue samples were collected from killer whales in Rince William Sound using a pneumatic rifle and custom-designed biopsy darts (biopsy system as described in Bmett- Lennard et al. 1996). A small dart was fired from a specially outfitted rifle powered by air pressure from a.22 caliber blank cartridge. The setup is similar to that used to deliver tranquilizing drugs to terrestrial mammals in wildlife research. A lightweight plastic dart (approx. 10 cm long by 1.2cm dia.) was fitted with a beveled tubular sterile stainless steel tip that took a small core of skin and blubber (approximately 1.6cm long and 0.5cm dia.). The sterilized dart is fired from a range of The dart hit the animal in the upper back, excised a small tissue sample and bounced off. The dart floated with sample contained until retrieved. From the biopsy samples the epidermis, which was heavily pigmented, was separated aseptically from the other layers with a scalpel as soon as the dart was retrieved from the water. The dermal sample was used as a source of DNA, and was stored at 4 deg C. in a sterile 1.7 ml cryovial containing 1.2 ml of an autoclaved solution of 20% DMSO and 80% sodium chloride saturated double distilled water (for properties of storage solution see Amos and Hoelzel, 1991). The dermis and hypodemis were made up primarily of collagen and lipid, respectively, and were frozen in autoclaved, solvent-washed vials for fatty acid and contaminant analysis. 8

10 Data Analvsis All photographic negatives were examined under a Wild M5 stereo microscope at 9.6 power. Identifiable individuals in each frame were recorded. When identifications were not certain, they were not included in the analysis. Unusual wounds or other injuries were noted. The alphanumeric code used to label each individual was based on Leatherwood et. al. (1984) and Heise et al. (1992). The first character in the code is "A" to designate Alaska, followed by a letter (A-Z) indicating the individual's pod. Individuals within the pod receive sequential numbers. For example, AB3 is the third whale designated in AB pod. New calves were identified with the next available number. Individual identifications from each roll of film were computerized on a frame by frame basis using a specially designed data entry program. The actual number of whales identified from photographs and pods of whales present for each encounter was extracted from the photographic database and included with each encounter entered in the GIs database. New calves were already present when fieldwork began and exact birth dates could not be determined. We followed the method of Olesiuk et al. (1990) and placed the birth of all calves in January for calculation of vital rates. Thus, birth rates could not be measured, andrecruitment rates represent- the survival -of calves-to about 0.5 years of age The determination of mothers of new calves was based on the consistent close association of calves with an adult female. Although young calves may travel with other individuals at times, a majority of time is spent with the mother as demonstrated by association analysis of identification photographs from repeated encounters (Bigg et al. 1990). The white saddle patch of calves generally does not develop for several years, but other scars and marks including the shape of the white eye patch are used to reliably reidentify calves. If a whale from a resident pod is not photographed swimming alongside other members of its maternal group during repeated encounters over the course the summer field season it is considered missing. If it is again missing during the repeated encounters in the following summer season it is considered dead. No individual resident whale consistently missing during repeated encounters with its pod and maternal group over the course of a summer season has ever returned to its pod or appeared in another pod in all the years of research in Canada and the United States (Bigg et al. 1990, Matkin et al. 1994). Subgroups of resident pods may travel separately from the pod for a season or longer; however, this has not been observed for individuals. In a few instances missing whales have been found dead on beaches, but strandings of killer whales are infrequent events and most missing whales are never found. During 1975 to 1987 only six killer whales were found on beaches throughout the entire Gulf of Alaska (Zirnmerman 1991). One explanation for the lack of recorded dead killer whales comes from the observations of early Soviet researchers. Killer whales that were shot for specimens were reported to sink. (Zenkovich 1938). Immigration and emigration may occur among groups of transient whales. In British Columbia, infrequently sighted transients missrng from their original groups for periods ranging from several months to several years or more have been resighted swimming with other groups of transient whales (Ellis, unpub. data). For this reason, transient whales missing from a particular group for several years cannot necessarily be considered dead. However, members of the AT group of transients have been resighted consistently in Prince William Sound since 1983.
11 Finite annual mortality rates (MR) and reproductive rates (RR) for resident pods were calculated as follows: where: NM = number of whales missing from a pod in given year NIP = number of whales present in a pod at end of previous year NR = number of calves recruited to 0.5 years in a pod in a given year then: Mortality rate = NM/NP and Reproductive rate = NRINP If the year a mortality or recruitment occurred could not be determined it was split between the possible years. A mean weighted mortality and reproductive rate for all pods for all years was determined by pooling the data for all pods for all years. The sex and age class of missing whales were determined from data collected prior to their disappearance when possible. In some cases sex had been determined by viewing the ventral side of the whale. Reproductive females wen identified by the presence of offspring. Whales of adult conformation at the beginning of the study that had not calved since 1983 and were not accompanied by a juvenile(s) were considered as possibly postreproductive. Exact ages of whales could be determined only for whales born since Juveniles born before 1984 were given approximate ages by comparing the relative size of the whale and development of saddle patch and dorsal fin in photographs from Males are readily identified at about 15 years of age as their dorsal fin grows taller and less falcate than females. At sexual maturity fin height will exceed width by at 1.4 times (Olesiuk et. al. 194)). The fin continues to grow until physical maturity (about 21 years of age). -, Subgroupings of whales within resident pods were determined from repeated examination of photographic data as well as from field observations of travel patterns. Cole's Association Index dendrograms are being used to clarify the subgroups and relationships within them. The effect of the oil spill on the probability of resighting AT group whales was examined using log-linear models (PROC CATMOD of SAS; SAS 1988). For each year, each individual AT whale was classified as either having been seen or not seen in that year. Data from 1987 were excluded from the analysis because of low effort in that year. Two effects were included in the analysis: year, and whether the year was in the category 1% or We tested three log-linear models in our analyses. Two of these models treated year as a continuous variable; i.e. these models assumed that there was continuous and systematic variation in the probability of sighting whales through time. Year was treated as a continuous variabie in order to test whether the probability of resighting whales was decreasing through time, irrespective of the oil spill. The third model treated year as a categorical variable, assuming that probability of sighting whales could vary among years, but that the variation did not have to be systematic. (I) Probability = intercept.t Re 1990 or post Year (year continuous) (2) Probability = Intercept + Pre 1990 or post 1989 x Year " I! (3) Probability = Intercept + Pre 1990 or post Year (year categorical) Where: Probability = probability of sighting a given AT whale Intercept = a constant with variation caused by: (a) year falling pre or post 1989, (b) the specific year, (c)the interaction of the year and being pre 1990 or post 1989 The most appropriate model was decided upon on the basis of the overall goodnessof-fit of the model, and the match between observed and predicted values. 10

12 Graphical display and query tools were developed for the GIs database. These allow users that may be unfamiliar with ArclInfo to output summary statistics about the data and to create simple maps showing the locations of selected data records. Simple routines were developed to categorize and tabulate behavioral data after entry into the GIs system. Data was summarized by behavioral category, number of occurrences and duration. Data from most pre-spill years has not been entered and tabulation is not complete, however killer whale predation data was tabulated and presented graphically. For genetic analysis approximately 30 mg of skin from each biopsy sample was minced finely with a scalpel, and ground for one minute on ice in a glass tissue grinder. It was then combined with 400 ul of proteinase K buffer (Sambrook et al. 1989) and 0.3 mg of proteinase K enzyme, and incubated for 48 hr at 65 degrees C. This solution was combined with a similar volume of 2524: 1 phenol:chlorofom: isoamyl alcohol, mixed gently by inversion for 5 minutes, and centrifuged at 10,000 g for 2 min. The DNAcontaining aqueous phase was then removed with awide bore pipette. The phenol: chloroform: isoamyl alcohol extraction was repeated twice, and followed by a single extraction with 241 chloroform: isoamyl alcohol. The aqueous phase was then combined with 2 volumes of 95% ethanol, and incubated at -20 degrees C for 1 h. This solution was centrifuged at 13,000 g for 15 minutes. The precipitate was washed twice with 70% ethanol, and dried overnight at room temperature. The DNA precipitate was then dissolved in 100 ul of TE buffer to make a stock solution (Sambrook et a1 1989). The concentration and purity of DNA was de tennined by UV photospectrometry (Sarnbrook et a1 1989). The mean yield of DNA from 30 mg of skin was 98 ug (range 41 to 257 ug). Aliquots of DNA stock solution were added to sterile distilled water to make up standard solutions of 50 nglul DNA for use in polymerase chain reaction (PCR). Two segments of mitochondrial DNA (mtdna) from each sample were amplified using the PCR. The first was approximately 2,350 base pairs long and contained the D- loop and cytochrome b regions, The other was approximately 2,450 base pairs and contained NADH dehydrogenase, subunits 5 and 6 (ND5/6). The first segment includes the most variable part of the mitochondrial genome, the latter is more conserved. Primers for the PCR reactions were custom-designed based on published sequences in similar species (eg Arnason et al. 1991). For the cytochrome bl D-loop amplification the following primer sequences were used (5'-3'): GACATGAAAAATCATCGTTGT and CTAATAGAAAGGCTGGGACC; for NW6 the primer sequences were ACAACGATGATTlTTCATGTC and GTAGTTATCCATTGGTCTTAGG. After experimental optimization, the following protocol was used: (1) 50 ul reactionmixes were prepared containing 75 ng of template DNA, 10 mm Tris-HCl (ph8.3), 50 mm KC1,0.3 rnm each dntp, 1 um each primer, 1.5 mm MgCI, and 1 unit of Taq DNA polymerase; (2) each reaction mix was cycled once for 3:00 min at 94 deg C, 1:00 min at 60 deg, and 3:00 at 72 deg.; 30 times for 45 s at 94 deg, l:00 rnin at 60 deg, and 3:00 min at 72 deg; and once for 45 sec at 94 deg, 1:00 min at 60 deg, and 12:OO min at 72 deg. Results The Lucky Star completed 39 survey days ( three weather days) and five partial non-survey days supplying field operations for the Whale 2. The Whale2 completed 64 survey days with four weather days. The Whale I completed 20 survey days and Auklet completed two survey days A total of 125 survey days (LOG entries) were entered in the GIS database for 1995 (Table 1). Killer whales were encountered on 63 occasions in 1995 ( ENCOUNTER entries, Appendix 6), with 43 encounters with resident pods, 13 encounters with the AT transient group and seven encounters with other transients. Researchers traveled approximately 1514 km with whales during these encounters. A total of 162 identifiable killer whales were photographed in Of these, 132 were resident whales that were attributed to

13 pods. Nine resident whales were photographed that could not be placed in designated pods. Additionally, 21 different transient whales were identified in The transient AT group was most frequently photographed in the April-June and September-October periods while resident whales were most frequently encountered in July and particularly August. Consistent sightings of resident pods in southwestern Prince William Sound did not occur in September 1995 as has been the case in many other years. Resident whales were not observed in October. The most killer whale encounters (22), occurred in August and were primarily with resident pods. All encounters of three or more resident pods ("superpods") occurred in late July or August. Resident Pods The total number of whales in well-documented resident pods other than AB pod has increased from 78 to 83 whales from 1992 through 1995, while AB pod has declined from 26 whales to 22 whales in that same time period (Figure 2) Since the last accounting accounting of AB pod killer whales in 1993 (Dahlheim, 1994), five mortalities were recorded in this pod. All of these deaths occurred during the winter of and were confirmed in Two calves were recruited to AB pod; one (AB48) in 1992/93 and one (AB49) in 19931%. AB 48, was one of the mortalities in 1993/94. Births and deaths from 1984 to1995 in the six well-documented resident pods are listed in Table 2. Annual mortality and recruitment rates were calculated by pod and listed in Table 3. A summary of pooled mortality rates for AB pod and other pods before and after the spill is given in Table 4. Mortality rates for AB pod were much higher (6.1 %) for the period before spill than for other pods (1.9%) and nearly doubled (11.7%) again for the period following spill while the rate for other pods dipped slightly (1-4%). The years 84/85 and 85/86 made the major contribution to AB pod pre-spill mortality and the years 88/89,89/90 and 93/94 were the major contributors to post spill mortality. The pooled recruitment rate for AB pod was higher before and lower after the spill than for other pods and AB pod recruitment dropped to zero for two years following the spill. However, the overall recruitment rates from 1984 to 1995 (4.5% for AB pod and 4.6% for other pods) were comparable. Graphic representation of annual mortality and recruitment rates by year for AB pod and the six other well-documented resident pods (AI,AK,AE,AJ,ANlO) is presented in Figure 3 and Figure 4. Killer whales appear to have a very high rate of mortality, near SO%, in the first months after birth (Olesiuk et al. 1990) and births generally occur in the winter months. These he recruitment rates represent survival to approximately 0.5 years, birth rates could not be determined. The five mortalities that occurred within AB pod between 1992 to 1994 included an adult male (AB2), a reproductive female (AB 16) and three juveniles (AB38, AB 41, AB48, Table 5). Mortalities in other resident pods included two apparent old, nonreproductive females (AJ 5, ANS), an older male (AJ 11) and one juvenile (AE 13). Initial examination of pod structure indicated seven subgroups in AB pod containing 22 whales (Figure 5) and six subgroups in another major resident podn pod, that contained 35 whales in 1995 (Figure 6). One AB pod subgroup (seven whales in 1988) has only a single surviving member, AB3. Seven of the mortalities within this subgroup occurred at the time of the spill or thereafter. Another AB pod subgroup (five whales in 1988) now has only 3 surviving members (AB22, AB45, AB49) despite recent recruitment of two calves (AB45, AB49). Another AB pod subgroup (10 whales in 1988) is now reduced to six whales and was only photographed traveling with AJ pod in 1994 and It was last photographed with AB pod in There were no mortalities within three of the AB pod subgroups at the time of spill. AJ pod (Figure 6) has demonstrated vital rates more representative of the other frequently encountered resident pods, It has had an an above average recruitment rate since 12

14 1984 (Table 3). Unlike AB pod, mortalities in AJ pod were apparently older whales and do not include reproductive females and juveniles (Table 5). Transient Whales A total of 10 of the original 22 AT group whales was photographed in This was the largest number of individuals identified in this group since 11 were photographed in AT whales identified in 1995 included two, AT13 and AT17, that had not been photographed since 1992 and three, AT2,AT4 and AT6, that had not been photographed since There were no new calves identified in 1995 and there has been no recruitment observed in this group since The sighting rate of AT whales declined after 1989 (Figure 8). This coincides with the absence of at least 9 members of the group since that year. On average for all years Encounters with members of the AT group have occurred on average ( ) only once in ten field days. In some years (1991 and 1994) this figure fell to less than one encounter in 20 days. For all years each encounter was typically with only a few members of the group. Despite an above average rate of encounter in 1993, only seven different individuals where photographed. The number of different AT individuals sighted each year decreased sharply after Since 1989 the number of individuals identified has been 12 or less despite a field effort that exceeded 200 vessel days in 1990 and 1991 (Figure 9). Both before and after 1989 there was an initial high rate of discovery of nonphotographed AT individuals in the first 60 days of each field season followed by a sharp reduction of new whale discoveries despite repeated encounters with AT whales (Figure9; years with less than 60 days of field effort were not charted). AT whales were most frequently encountered in the early season (April-June) In some years such as 1995 new whale discoveries were made near the end of the field season. Three AT whales that were photographed in 1995 were seen only in April andlor October. The sighting data for the AT group used in logistic regression (Figure 7). Logistic regression analysis using model (1) with year and occurrence before and including 1989 or after 1989 as explanatory variables, and with year treated as a continuous variable, indicated significant decline in the probability of sighting individual AT whales from 1984 to The year variable made a significant contribution while the variable of year occurring before or after the spill did not (Table 6). Model (2) assumed that the explanatory variables of year and occurrence of the year before and including or after 1989 were interrelated. Levels of significance were highest for this model (Table 7) indicating the interaction of year and occurrence of the year before and including or after 1989 was a better predictor of the observed pattern of sighting AT whales than was year alone. For model (2) the probabilities of not seeing a given whale were predicted for each year and compared with the actual probabilities (Table 8). When year was treated as a categorical variable, model (3), there was a significant effect of both year and occurrence before and including or after 1989 on the overall significance of the decline (Table 9). The results of logistic regression analysis indicated the probability of sighting specific individual AT whales decreased significantly since 1984 and that the decreased probability of sighting AT individuals accelerated after Another 2% transient whales were encountered in small groups on a very irregular basis from These whales were not seen in association with the AT group nor with resident pods. Sighting trends for these whales were not examined and no attempt was made to assess changes within these groups. Descri~tion of GIs database NGOS data for were transferred from NGOS to the Science Center in Spring Data for 1995 amved at the Science Center following completion of the 13
. Response via phone (29 November 1995) and letter (5 December 1995) was received from M. Dahlheim. She sent a copy of a 1993 report detailing some analysis of these data (Bahlheim et. al.")
15 season's field work. NMFS data for 1993 were requested via letter dated 22 November 1995 from the Prince William Sound Science Center (D. Scheel) to National Marine Mammal Laboratory (H. Braham and M. Dahlheim). Response via phone (29 November 1995) and letter (5 December 1995) was received from M. Dahlheim. She sent a copy of a 1993 report detailing some analysis of these data (Bahlheim et. al. 1993). Data from NMML for GIS input has not yet been obtained and if available it may not contain systematic behavioral data. The GIS database is physically housed at the Prince William Sound Science Center. Security is maintained through restricted access permissions and user passwords. Spatial and tabular data are stored in ArciTnfo (version 6.1.1) on a Sun network running Openwindows. An exact total count of the killer whale encounters awaits completion of the database, but we estimate there are about 560 encounters encompassing hours of whale observation during hours of field effort from 1984 through 1994 (1 1 years). For example, in 1984, 180 field-boat days resulted in 1700 hours and 7600 miles of search effort including 64 sightings and 320 hours of whale observation. Data from the current season (1995) was entered into the database and summarized in this report. For each year, the database consists of two GIs data layers. One layer contains the Log data; one contains the Encounter data. Eight different relate tables store the information associated with each day's observations (Figure 10). For both Log and Encounter layers, meta- and primary- level data were associated with a vector object portraying the trackline and direction. These data reside in the arc attribute table (AAT). Whenever there was a one-to-many relationship between a trackline and a data type (e.g. weather may have been recorded several different times during the day from a single vessel), that data type was stored in a related table linked to the AAT via a record ID number. Each Log was assigned a Log-ID that was written on the data sheet and entered into the data base. Log IDS were of the form yr-xxx (e.g. the first Log for 1994 was numbered 94001). Each Encounter received a letter designation following the Log-ID (e.g. subsequent encounters on the first day receive the IDS 94-OOla, b). Weather and marine mammal sightings data were related to the appropriate log record and vessel path via the Log ID. Encounter records and whale paths were related to their Log records in the same manner. For data with a many-to-one relationship to the whale track lines, four tables were created linked to the Encounter AAT via the Encounter ID number. For a complete listing of the data types contained in each database table, see Figure 10. Data are available for the years 1984 to 1995 inclusive. Under this project in FY95, all records for the years , 1989, and were entered into the database (Table 10). Entry of data from the remaining years is scheduled for February-March Search effort was greatest in Effort was also high in 1995, 1992, and Search success (encounters per mile searched) was highest in 1985 and lowest in 1994 and Search effort was focused in the south west portion of Prince William Sound (Knight Island Passage and Montague Straight) in all years, although some years include effort in other areas as well. Creating a database for the behavior-related aspects of the killer whale research focused attention on the design of the data sheets being used to collect the data. As a result, several changes were proposed to the data sheets (Appendix 5 & 6). These changes were implemented in the field in These changes serve to make data collection more precise and unambiguous and to assist in tracking samples from one database to the next (e.g. noting in this database the identifying information for any biopsy samples collected). Killer Whale Predation A total of 27 kills and 34 incidents of harassment of marine mammals by killer whales were observed from 1988 through 1995 (Table 1 P). All observations were made 14
. The mortality rate for AB pod rose sharply again in 1993194.")
16 Discussion Elevated mortality rates for AB pod occurred in and 1985/86 and were attributed to fishery interactions (Matkin et al. 1986, Matkin et al. 1987). The very high mortality rate in and followed the Enxon Valdez oil spill (Matkin et al. 1994, Dahlheim and Matkin 1994). The mortality rate for AB pod rose sharply again in The majority these mortalities in were juveniles and reproductive females while recent mortalities in other pods appeared to be primarily older whales (Table 5). This pattern is consistent with the composition of mortalities in AB pod and other pods in the years (Matkin et al. 1994). Very low mortality rates were reported for, reproductive females and juveniles for resident pods in British Columbia and Washington (Olesiuk et al. 1990). These rates are similar to the resident pods other than AB pod in Prince William Sound (Matkin et a1 1994). Peaks in recruitment rate coincide between AB pod and other pods for some years (Figure 3, note: , and the recent decline). To some extent these recruitment rates may reflect annual conditions that influenced early survival. The longterrn recruitment rates for AB pod and for other pods are similar, the decline in AB pod since 1988 is not attributed to lack of recruitment but to very high mortality rates. In British Columbian killer whale studies close relatives demonstrated the highest index of association (Bigg et al. 1990). Whales in the subgroups we have identified appear to be close relatives, primarily mothers and their offspring but may include some extended family, possibly sisters and their offspring and grandmothers. The identity of the fathers of the calves is unknown, but fathers are not thought to travel with their offspring. The recent mortalities within AB pod can be visualized in the context of their subgroups (Figure 5). The juveniles AB38 and AB41 were both orphaned following the spill and lost many other apparent close relatives. The reproductive female AB 16 had lost most of her subgroup. The death of reproductive females is extremely unusual (Matkin et. al. 1994). The male AB2 suffered a collapsed dorsal fin and appeared in poor condition following the spill. The calf AB48 possibly was less than one year at death and may have been a natural juvenile mortality. It appears that resident pod social structure and the association of close relatives is extremely important in maintaining pod structure and viability. Bigg et al. (1990) found that within pods of resident killer whales the relative strength of bonds among individuals appear to be correlated with degree of relatedness. Deaths of key individuals in subgroups may reduce the viability of remaining relatives as appears to be the case for orphaned juveniles in AB pod. The calf AB45 orphaned by the death of AB16 has lost not only its mother but most of its close relatives. AB3, whose fin declined following spill, is the only surviving member of his once large subgroup. In 1995 he was often traveling behind the rest of the pod. Some AB subgroups have not shown abnormal losses since the spill. These subgroups may not have had extensive contact with oil. Subgroups of pods do not always travel in tight formation. For example, the ABIO subgroup (a mother and her three adult sons) frequently travels some distance from the rest of AB pod. There is no precedent for a resident pod subgroup joining another pod on an extended basis (Matkin et al. 1984, Bigg et al. 1990). When many closely related individuals within a pod die, the bonds that hold the pod together may weaken. It is conceivable that this would result in splitting of the pod and may explain while one AB pod subgroup has traveled with AJ pod for two consecutive years. Because the ages and sex is not known for all whales within AB pod or any of the other pods, an accurate modeling of population dynamics is not possible at this time. Although there are six remaining reproductive females in AB pod, some of these may be entering post-reproductive age. Because of the large number of juveniles lost since the spill, there may not be enough maturing females to replace them. 16

17 between April 1 and October 30. All incidents involved transient whales, no resident whales were observed taking marine mammals. For the majority of observations the predators were members of the AT group, although some incidents involved other transient whales. The proportion of kills by prey species are represented in figure 1 1. Dall's porpoise and harbor seal predation by killer whales made up 74% of the observations. Inclusion of harassment incidents to create a diagram of potential prey (Figure 12) reduced the Dall's and harbor porpoise components and introduced other potential prey. These included Steller sea lion, sea otter, river otter, humpback whales. There was one incidence of an AT whale harassing or possibly preying on salmon not included in the chart. Recording predation events sometimes required identification of subtle evidence. Pursuit and capture of marine mammal prey sometimes occurred entirely below the surface. For some mammal kills, oil slicks and very small bits of blubber or flesh were the only physical evidence of the kill. Gulls often gathered at kill sites. Mammal kills were typically followed by milling behavior by the killer whales when, presumably, prey was shared. During June through September resident killer whales appeared to feeding in the mixed schools of salmon that enter Prince William Sound. In June and early July field effort was sporadic and surface feeding on fish was not frequently observed. From late July through September fish kills often occurred near the surface and scales from prey could be retrieved. Pursuit and kill of a fish was usually accomplished by individual whales although cow-calf pairs or pairs of juveniles were observed in tandem pursuit. A fish kill was often preceded by a chase below and at the surface. Whales sometimes made tight, twisting turns near the surface prior to making the kill. Five killer whales were found stranded in or near Prince William Sound in the three years following the spill (Table 12). None of these whales had fish parts in the stomachs. Three of the stranded whales contained marine mammal parts. All three of these contained harbor seal parts, two contained Steller sea lion parts, one contained Dall's porpoise parts, and one contained harbor porpoise parts. A majority returning salmon enter through southwestern Sound. Most of the scale samples from fish kills were collected in the Montague Strait and Lower Knight Island Passage area. A total of 46 scale samples were retrieved and identified from (Figure 13). Coho salmon scales were identified in 41 of the 46 scale samples obtained Other species of salmon, notably pink salmon, were far more abundant in the observed schools and in the catch of fishermen. Biops~ sample collection and analysis In 1994 and 1995 a total of 48 full size samples and seven micro-size biopsy samples were collected from free ranging whales for genetic analysis. Six full size samples were from AT group whales, five full size and one micro sample from other transients, and 37 full and six micro samples from resident killer whales. In most cases, the tips of darts that obtained samples were completely filled with tissue. These samples weighed approximately 0.5 gm and consisted of a core containing three primary cell layers: epidermis, dermis and hypodermis. Micro samples indicated improper retention of tissue by the dart. They were tiny bits of skin, sufficient for limited DNA analysis, but far less than a full sample. PCR products were obtained from all full sized samples using custom primers. Two ul of each PCR product was run on a 1.5 % agarose gel and visualized by ethidium bromide staining under UV light. Both reactions consistently produced a single product estimated by comparison with standard concentrations of molecular weight marker DNA to contain 3 ug of DNA. 15

18 Transient type whales have been distinguished from resident whales by lack of association, differences in diet (this manuscript) and by preliminary genetic analysis. In the mid f 980s, the AT transient group consisted of 22 transient whales that seldom associated as a single group, but as small sub-groupings of varying composition (Leatherwood et al. 1984, Leatherwood et al. 1990, Matkin et al. 1994). Relationships within this group still are not clear, the social system is clearly different from that of residents. Travel associations are variable over time. Although the reduction in rate of sighting of AT whales coincides with the absence of many individuals since 1989, it also appears that the remaining AT whales are spending less time in the Sound than in previous years. The larger number of AT individuals observed in 1995 than in the previous two seasons was probably due to increased field time in the spring (April) and fall (late September/ October). Three of the eleven AT whales photographed were only seen during these months. The fall winter and spring may be important periods for transient whales in the Sound and extending field seasons into those periods may increase the number of observations of transient individuals. The logistic regression models and probabilities of resighting AT group whales developed in our analysis indicate significant changes occurred following These results should be viewed in conjunction with the sighting and effort data in Figure 9. The nine AT whales missing since 1989 may be dead or they may have emigrated to other areas, In either case the analysis suggests a change in the system that supports these whales, The change apparently began before the oil spill but was accelerated after spill. This pattern is similar to that described for the harbor seal population in Prince William Sound (K. Frost, pers. comm.). Harbor seals appear to be an important prey item for AT group killer whales. Although harbor seals were indicated as an important prey item during the April to October period (30% of observed kills), the Dall's porpoise was a more frequently observed prey (44% of observed kills). Because incidents of harbor seal predation often leave scant evidence, we suspect harbor seals comprise a large component of the unidentified mammal kills (19%~ of observed kills). Harbor seal kills often occur underwater and leave only an oil slick and bits of blubber and hair as evidence. We have no systematic observations of transient killer whale predation from late October through March. Numbers of Steller sea lions increase in the Sound in winter months and other trained observers have reported predation on sea lions by killer whales at that time (Karl Becker, Rich Corcoran, personal communication). Sea lion predation may increase during the winter months. Barrett-Lennard et al. (1995) estimated that Steller sea lions made up 25% of the diet of transient killer whales in Alaska Examination of stomach contents from the five stomachs available supports the direct field observations which indicate specific killer whales eat either marine mammals or fishes, but not both (Table 13). Stomach contents also indicate the importance of harbor seals as prey of marine mammal eating killer whales. Although the stomach sample size is small it suggests a greater proportion of Steller sea lion in the diet than field observations indicate. Perhaps this is due to an increase in the proportion of Steller sea lions in the diet in winter when field observations are lacking. The strandings apparently occurred in winter or early spring although whales were not necropsied until spring or summer. Opportunistic observations over the years by the authors have suggested larger numbers of harbor porpoise and fewer numbers of Dall's porpoise occur in the Sound in late winter and early spring than in the summer months. Little observation of killer whale predation has occurred in winter and early spring; increased killer whale predation on harbor porpoise and decreased predation on Dall' porpoise may take place at these times. During the July through September period coho salmon (Oncorhynchus kisutch)comprised 89% of the observed of killer whale predation on salmon indicating the apparent selectivity of feeding resident killer whales. Unfortunately samples from the early summer season when silver salmon would be rare were not available. The winter 2 7
 scales may exist since the scales from these fish are much smaller and may be less easily observed in the water.")
19 feeding habits of fish eating killer whales are unknown. Some bias against collection of pink salmon (Oncorhynchus gorbusck) scales may exist since the scales from these fish are much smaller and may be less easily observed in the water. However, it is striking that no pink salmon scales were recovered nor were the distinctly smaller pink salmon ever observed being attacked or in the mouths of killer whales in Prince William Sound. Pink salmon comprised about 16% of scale samples collected at sites of killer whale predation in British Columbia (J. Ford, pers. comm). In British Columbia killer whales appeared to selectively prey on chinook salmon (62% of scale samples). Mitochondria1 DNA is employed extensively as a molecular marker in population biology because (1) it evolves quickly relative to the nuclear genome,(2) it is inherited maternally and is ideal for tracing maternal genealogies, and (3) it is free from recombination, making it possible to discriminate between common ancestry and convergence (Harrison 1989). In British Columbia, the existence of fixed, albeit small mtdna differences (Stevens et al 1989, Hoelzel 1991, Barrett-Lemard, unpubl. data) are very strong evidence that females do not move between the two populations of resident and transient killer whales. The current analysis will determine whether Prince William Sound resident imd transient killer whales are also mutually closed stocks as far as female emigration is concerned, and will also provide evidence as to whether either population is genetically linked to southern populations. If the analysis reveals fixed differences in mtdna genotypes diagnostic of each type of whale, as is the case in British Columbia, then this information will be useful in the future for classifying rarelyphotographed groups of killer whales that frequent other parts of the Gulf of Alaska (Dal heim 1994). Despite the fact that the mtdna analysis is likely to shed important light on the structure and discreteness of the two populations, it cannot entirely eliminate the possibility of nuclear gene flow between them. Nuclear gene flow would occur if animal from the two populations mate on occasion, even if females do not emigrate and transfer mtdna. Such a situation could arise if only males move between the two populations. The photoidentification databases for both Prince William Sound and British Columbia provide no evidence of male emigration, suggesting it is at the least uncommon. A second way it could happen is if matings occur between temporary associations of residents and transients that involve no permanent immigration. Again, the photo-identification databases provide no evidence of residentftransient associations. However, such matings in the absence of emigration may well occur between resident pods (Barrett-Lennard, unpubl. data), and it is not out of the question that they occur between residents and transients. Restriction fragment length polymorphism analysis is currently being performed on the PCR products, using 6 base-pair recognition site restriction enzymes that were informative in discriminating mitochondria1 differences between British Columbian killer whale populations (Stevens et al. 1989, Hoelzel 1991). In addition to the RFLP analysis, 360 base pair regions of the D-loop of selected individuals from each population will be sequenced using automated sequencing facilities at the University of British Columbia. This work is well underway at present, and we anticipate completing it within EY Conclusions AB pod is not recovering from the deaths of 14 individuals following the spill. There were five additional mortalities in These mortalities were primarily juveniles, but included one reproductive female. In addition, a subgroup of six AB pod whales was traveling with AJ pod in.1994 and 1995 and has not been sighted with AB pod since All other well-documented resident pods are stable or increasing. Recent changes within AB pod are thought to be linked to changes in social structure due to earlier deaths within the pod. We suspect that 9 whales in the AT group died after There has been no recruitment within the group since The encounter rates with AT group whales and 18

20 theprobability of sighting individual AT whales has declined, especially since the spill. The factors contributing to the decline of this group and its reduced role in the Prince William Sound ecosystem is unknown, but these changes accelerated after 1989 with the death or emigration of 9 individuals. Long-term changes could be related to changes in abundance or quality of prey. The GIs system data base for killer whales has been designed and described. Over 60% of the available historical data was placed in the system. Simple mapping and tabulation routines were developed for initial data access. Field data sheets were redesigned to provide more detailed spatial resolution of behavioral events. Killer whale behaviors were more clearly defined. The examination of seasonal components of the diet of resident and transient killer whales demonstrated a clear distinction between the two killer whale types. At least during the spring, summer and fall, residents consume fish while transients prey on marine mammals. Resident killer whales appear to be highly selective when preying on salmon, selecting for coho salmon during the July to September period. Dall's porpoise and harbor seal are important components of transient whale diet during April to October period. Steller sea lions and harbor porpoise may become more important in the winter months. Temporal and spatial aspects of killer whale foraging and predation will be investigated following completion of GIs data input. Sufficient numbers of resident and transient killer whales have been sampled successfully to initiate mtdna analysis. DNA has been successfully extracted and analysis is in progress. To examine the issue of population discreteness in more detail, we propose to conduct a parallel analysis to the present mtdna analysis beginning in FY 1W, using nuclear microsatellite DNA instead of mitochondria1 DNA. Microsatellites are simple tandem repeat loci that tend to be highly polymorphic and that are short enough to amplify readily using PCR. They are appropriate markers for investigating a wide variety of population properties, including mating systems, kinship patterns, inbreeding levels, effective population size, and population divisions (Queller et al. 1993). Unlike DNA fingerprints (which are based on larger minisatellite loci), microsatellite genotypes can be scored unambiguously, and samples need not be run simultaneously to be compared. As well as providing information regarding the discreteness of resident and transient populations that would compliment and extend the mtdna analysis, microsatellite analysis of Prince William Sound killer whales would answer questions such as the following: (1) Is the spill impacted AB-pod closely related to other resident pods in Prince William Sound? (2) What is the effective size of the breeding populations of resident and transient killer whales in Prince William Sound, and (3) how inbred are they? (4) Is the commonly seen AT pod of transient whales that has lost many of its members since spill genetically isolated from other transients? Acknowledgements Funding for work in and in 1995 was provided by the Exxon Valdez Oil Spill Trustee Council via the National Marine Fisheries Service. Work in 1984 was supported by Hubbs SeaWorld Research Institute and field work in 1986 was supported by the Alaska Sea Grant Program and the National Marine Mammal Laboratory. Data for killer whale pods in PWS in 1985, 1987,1988, was provided by the North Gulf Oceanic Society. The Society was funded by private donations, the Alaska State Legislature and various State programs, the Alaska Sea Grant Program, Sail Alaska Foundation, and the American Licorice Company. We wish to thank the Pacific Biological Station for final identifications on fish scale samples. John Lyle, Kathy Turco and Olga von Ziegesar provided field assistance in 1994 and 1995.
21 Literature Cited Amos,W; and A.R. Hoelzel hng-tern preservation of whale skin for DNA Arnason,U; Guilberg,A; Widegren,B (1991) The complete n ucleotidesequence of the mitochondria1 DNA of the fin whale, (Balaenopteraphysalus}. J. Mol. Evol. 33, Balcomb, K. C., 3. R. Boran and S. L. Heimlich Killer whales in Greater Puget Sound. Reports of the International Whaling Commission 32: Barrett-Lemard,LG; Smith,TG; Ellis,GM 19%. A cetacean biopsy system using lightweight pneumatic darts, and its effect on the behaviour of killer whales. Mar. Marnrn. Sci. 12.1: Barrett-Lennard, L.G., K Heise, E Saulitis, G. Ellis, and C. Matkin The impact of killer whale predation on Steller sea lion populations in British Columbia and Alaska. North Pacific Universities Marine Mammal Research Consortium, Universtiy of British Columbia, Vancouver, BC unpubl. rept. PP 66 Bigg, M. A. i982. An assessment of killer whale (Orcinusorca) stocks off Vancouver Island, British Columbia. Reports of the International Whaling Commission 32: Bigg, M. A., G. M. Ellis, J. K. B. Ford and K. C. Balcomb Killer whales: A study of their identification, genealogy and natural history in British Columbia and Washington State. Phantom Press, Nanaimo, British Columbia 79pp. Bigg, M.A., P.F. Olesiuk, G.M. Ellis, J.K.B. Ford, and K.C. Balcomb Social organization and geneaology of resident killer whales (Orcinus om) in the coastal waters of British Columbia and Washington State. Reports of the International Whaling Commission. Special issue 12 : Dahlheim,ME Abundance and distribution of killer whales Orcinus orca, in Alaska, 1W. Unpubl. Report National Marine Mammal Laboratory. Alaska Fisheries Science Center, NMFS, NOAA, 7600 Sandpoint Way, N.E. Seattle, WA Dahlheim, M. E Assessment of injuries and recovery monitoring of Prince William Sound killer whales injured by the Exxon Valdez oil spill using photo-identihation techniques. Report to the Exxon Valdez Oil spill Trustee Council, Restoration Project No pp. Dahlheim, M.E. and C.O. Matkin Assessment of Injuries to Prince William Sound Killer Whales in: Thomas Loughlin, ed. Marine Mammals and the ExxonValdez, Academic Press. DaMheim, M.E. and C. 0. Matkin Assessment of Injuries to killer whales in Prince William Sound. Report to the Spill Valdez oil spill Trustee Council. Marine Mammal Study Number 2. Final report 19pp. Ford, J.K.B Vocal traditions among resident killer whales (Orcinus orca) in coastal waters of British Columbia. Canadian Journal of Zoology 69: Ford, J.K.B., and A.B. Hubbard-Morton Vocal behavior and dialects of transient killer whales in coastal waters of British Columbia, California, and southeastern Alaska. Abstract submitted to the Third International Orca Symposium, Victoria, B.C., Canada Heise, K., G. Ellis, and C. Matkin A catalogue of Prince William Sound killer whales, ISBN# , North Gulf Oceanic Society, Homer, Alaska. 51 pp. 20

22 Hoelze1,AR (1991) Analysis of regional mitochondrial DNA variation inthe killer whale; implications for cetacean conservation. Rep. int. Whal. Commn (Special Issue 13), Hoelzel, A. R. and G. A. Dover Genetic differentiation between sympatric killer whale populations. Heredity 66 : Leathenvood,S., Kenneth C. Balcomb 111, Craig 0. Matkin, and G. Ellis Killer whales (Orcinus orca) in southern Alaska. Hubbs Seaworld Research Institute Technical Report No pp. Leatherwood, S., C.O. Matkin, J.D. Hall, and G.M. Ellis Killer whales, Orcinus orca, photo-identified in Prince William Sound, Alaska, 1976 hrough Canadian Field-Naturalist 104(3): Matkin, C.O.,G.E. Ellis, M.E. Dahlheim, and J.Zeh Status of killer whale pods in Prince William Sound in: Thomas Loughlin, ed. Marine Mammals and the ExxonValdez, Academic Press Matkin, C.O., G.M. Ellis, 0. von Ziegesar, and R. Steiner Killer whales and longline fisheries in Prince William Sound, Alaska, Unpublished report for National Marine Mammal Laboratory, NMFS, Seattle, WA. Matkin, C.O., R. Steiner, and G.M. Ellis Photoidentification and deterrent experiments applied to killer whales in Prince William Sound, Alaska, Unpublished report to the University of Alaska, Sea Grant Matkin, C.O. and E. Saulitis Killer whale (Orcinusorca): Biology and Management in Alaska. U.S. Marine Mammal Commission,Washington, D.C. (Contract T ). Morton,A.B A quantitative comparison of the behavior of resident and transient forms of killer whale off the central British Columbia coast. Reports of the International Whaling Commission Secial Issue 12: Olesiuk, P.F., M.A. Bigg and G.M. Ellis Life history and population dynamics of resident killer whales (Orcinusorca) in the coastal waters of British Columbia and Washington State. Reports of the International Whaling Commission Special Issue 12 : Queller,DC; S trassmannje; Hughes,CR Microsatellites and kinship. Trends Ecol. Evol. 8(8), Sambrook,J; Fritsc h,ef; Maniatis,T (1989) Molecular cloning: a laboratory manual. 3rd ed. Cold Spring Harbor, NY. Saulitis, E The behavior and vocalizations of the AT group of transient killer whales in Prince William Sound, Alaska. MSc. Thesis, Institute of Marine Science, University of Alaska, Fairbanks. Stevens, T. A., D. A. Duffield, E. D. Asper, K. G. Hewlett, A. Bolz, L. J. Gage, and G. D. Bossart Preliminary findings of restriction fragment differences in mitochondria1 DNA among killer whales (Orcinusorca). Canadian Journal of Zoology 67: von Ziegesar, O., G. Ellis, C. 0. Matkin, and B. Goodwin Sightings of identifiable killer whales in Prince William Sound, Alaska 19n Cetus Vol. 6 No. 2 pp Zenkovich,B.A. 1B8. On the Kosatka or whale killer (Grampus orca) Priroda 4: (Translated by L.G. Robbins) Zimrnerman, S A history of marine mammal stranding networks in Alaska with notes on the most commonly stranded cetacean species , in: Marine Mammal Strandings in the U.S. Proceedings of the 2nd Marine Mammal Stranding Workshop
23
24
25
26
27 Table 4. Pre and post spill and overall recruitment and mortality rates for AB pod and other resident killer whale pods. Re s~ill( ) Post spiil( ) Overall( ) Recruitment Rates AB Others* AB Others AB Others Mortality Rates AB Others* AB Others AB Others Table 5. Mortalities in Prince William Sound resident pods ( ) Pod Whale Died Sex Aee class Deseri~tion AB 2 93/94 M Adult fin folded at time of spill 16 93/94 F Reproductive Leaves juvenile (AM54 yr) 38 93/94 - Juvenile(7yr) Orphaned calf of AB3 l(died'89) 41 93/94 - Juvenile(6yr) Orphaned calf of AB8 (died190) 48 93/94 - Juvenile(< 1 yr) Calf of AB26 (born 92/93) AJ 5 W93 F Old Non-reproductive 11 93/94 M Old Photographed as adult in "77 AN 5 92/93 F Old Non-reproductive(mother AN 1?) AE 13 93/94 - Juvenile(9yr) 26
28 Table 6. Maximum-Likelihood Analysis-Of-Variance Model (1) Source DF Chi-square Prob. Intercept Pre or Post Year Likelihood Ratio 8 lo.% Table7. Maximum-Likelihood Analysis-Of-Variance Model (2) Source Df Chi-square Prob Intercept Year x Pre or Post Likelihood Ratio Table 8. Predicted (Model 2) and actual probability of not seeing a given AT whale by year Year Predicted Probabilitv Actual Probabilitv Table 9. Maximum-Likelihood Analysis-Of-Variance Model (3) Source Df Chi-square Prob Intercept Prepost Year 9* Likelihood Ratio 0 '*' Contain one or more redundant or restricted parameters 2 7
29 Table 10 - Data entered into the Killer Whale GIs database in FY95. Year Logs Encounters Miles Miles wl Dates Enc.lmi Searched whales xlooo / / / / / Total Tablell. Summary of Kills and Harassments of Marine Mammals SPECIES KILLS HARASSMENT Harbor seal 8 13 Dall's porpoise 12 3 Harbor porpoise 2 0 UnID mammal 5 5 Steller sea lion 0 6 Sea otter 0 2 River otter 0 1 Humpback whale Table 12. Stomach contents from killer whales stranded in Prince William Sound and adjacent waters 1990 Culross Is., PWS bones, whiskers and hair from adult and L. Bamttjuvenile harbor seal, 18 teeth (13 Lemard and K. confirmed harbor seal, 5 probable Heise harbor seal), Dall's porpoise parts 1990 Beartrap Bay, empty K. Wyme 17April PWS 1991 Cape St. Elias, sub-adult sea lion including sw1, K. Wynne $March AK* harbor seal, harbor porpoise 1992 Montague Is. 15 Steller sea lion tags, 480 sea lion E. Saulitis PWS whiskers, harbor seal claws, 20 harbor seal whiskers, bullet, halibut hook, 29 small and 27 large sea lion claws, 1 squid beak 1991 Montague Is. 2 circle hooks with gangion and L Barrett- PWS stainless steel snap, small pieces of Lennard and K. plastic Heise * approx. 130 km SE of PWS 28
30
31
32
33
34
35
36
37
38

39
40
41
42
43
44 Appendix 2: Modified killer whale encounter data collection sheet Date/Enc # NGOS Killer Whale Survey Platform O bservers Time (Beg/ End) Location (Beg/ End) Pods Naut. miles traveled w / whales Total # whales ad ad /im j uv / calf Recognized individuals Film (Date / Enc# / Roll# / Initials) #Whales photographed Recordings (Tape# / Side Beg / End) Prey samples (Type /Sample # /Location /Whale I. D.) Tissue samples (Sample #/Whales darted) Oil present Yes/No (Type) Harrassment of whales by researchers Yes/No (#harrassed) 0 bservations: Time Behavior Location Observations Time 1 Rec#
45 Killer Whale Killer Whale Survey Continued of- Time Behavior Location 0 bservations Tape /Rec# Behavioral categories for Iriller whales: Travel (Tr) Feed / Forage1 Fish (Ffish) Feed/ Mammal (Fmam) Mill Social (Soc) Rest Forage/ Offshore /Transient (Ofor) Forage / Nearshore / Transient (Nfor) Rub Associated behaviors that may appear on kw data sheets or daily logs: Breach (Br) Tail slap (Tail) Pec slap (Pec)
46
47
48 Appendix 4: Beaufort Scales Beaufort Sea Surface Scale Beaufort Number Stxed [knots) Effects Observed at Sea 0 el Calm, sea like mirror Light air; ripples with no foam crests Light breeze; small wavelets; glassy, non-breaking crests Gentle breeze; large wavelets crests begin to break; scattered whitecaps Moderate breeze; small waves m becoming longer; numerous whitecaps Fresh breeze; moderate waves m becoming longform; many whitecaps, some spray Strong breeze; larger waves m; whitecaps everywhere, spray Near gale; sea heaps up; waves 4-6 m; white foam from breaking waves blown in streaks Gale; waves 4-6 m of greater length; edges of crests break into spindrift; foam blown in well-marked streaks Beaufort numbers 9-12 not applicable to this database. Beau fort Visibility Scale Number 1 Descri~tion Excellent Effects Observed Clear or high overcast with no glare; horfzon visible; effective sighting distance (efd) = >3 miles 2 Very Good Clear or some cloud cover; some glare or surface ripple; efd = 2-3 miles 3 Good Some fog, haze, or low clouds; some chop, surf, or glare; efd = 1-2 miles 4 Fair Fog, full overcast, light rain, or haze with glare; whitecaps; efd = 1 / 2-1 mile 5 Poor Moderate rain or fog, large surf, bad glare, etc; efd = 1 /4-1/2 mile 6 Unacceptable Heavy rain, dense fog, near darkness, etc; efd < 1 / 4 mile
49 Appendix 5: Instructions for Entering Data into the Long-term Killer Whale Database Getting Started (Unk-based network at the Science Center) *Turn on the appropriate computer. *Log in to "Whale" at the login prompt. *If not in a windows environment already,, type "openwin". *Otherwise, the windows will open up automatically. *To get into the longterm U er whale directory, *Type "cd ltkwdb/" at the % prompt. *Type "arc" at the next % prompt. *Type "&r swim" at the Arc: prompt. *A menu will come up with several choices. *With the mouse, using the right button, click on the Data input button. (When using the mouse, the right button is used to open a menu. The left button is used when there is only one choice.) *Using the left mouse button, click on longterm killer whale. *The year menu will come up on the screen. *Click on the year for which data wlll be entered. *If starting a new year, click on "Start a new year". Watch the x term window. When the computer is finished getting the new year shells ready, click on the "add/edit data" button. *If continuing a year already begun, simply press the add/ edit button. *You are now ready to enter data. Data Entry *Keep in mind that the cursor needs to be in the window you are working on. *For missing numerical data, enter "-99". For other missing data leave blank. *After each item entered, a carriage return is necessary or the item will not be saved. Entering the Daily Log Data Enter the Sheet ID. This is assigned to each daily log sheet. The first day for each year is, for example, Write this id on the top of each data sheet that is entered, along with the initials of the person entering the data. Once the sheet id is entered, press return. Enter the date on the log sheet as mm/dd/yy. Press return. Enter the vessel name. Return. Enter the location at which the day was begun. Return. Enter the end location for the day. Press return. Enter the time that observation were begun. To do this you must convert the time on the data sheet to decimal time, i.e., 0930 should be entered as 9.5. Do the same for the end time. Enter the search time. On older data sheet (pre- 1990) there is no space for search time or time with whales. Enter

50 missing and the computer will later calculate out search time. The same is true for the time with whales. Enter miles traveled. Enter the initials of the personnel. After this is entered the first time during a session, personnel and platform will automatically come up with the same data on the next log sheet. Enter activities and comments. Only relevant statements need to be entered. For example, if whales were heard on the hydrophone but not found, it can be entered. Abbreviate words whenever possible to conserve space. Comments on boat / engine problems, personal activities, or information that is repeated again elsewhere, such as whale encounters, should not be entered. The only pinniped sightings that should be entered are counts of Steller sea lions at haul-outs like the Needle or Cape Elrington, or counts of harbor seals at haul-outs or in Icy Bay. Press return. Weather Data on Log Sheets If there is weather data present on the log sheet, click on "weather data" with the left mouse button. Another menu will come up on the screen. Enter the time of the weather observation in the same way as on the log sheet, as decimal time. If the weather notes say "overcast" or "cloudy", enter 100 for cloud cover. If the notes say "clear skies" or "sunny" enter 0. For ambiguous cloud descriptions such as partly cloudy, or clearing, type -99. Only in late 1995 did we start noting %cloud cover. Enter the Beaufort number for "Sea". This will usually be written on the data sheet as, i.e., BlV2. In this example you would enter 1 for Sea and 2 for Visibility. In years prior to 1990 these items will generally be missing. For wind enter the direction and speed as, for example "NE15", for northeasterly winds of 15 knots. If no direction is given, just type in the wind speed, or if no speed is given just type in the abbreviation for the wind direction. If the wind was calm, type in "calm"; if the data sheet says light winds type in "lt"; if the data sheet says variable winds type in 'Var". Otherwise leave blank. Precipitation has a menu. To see the choices place the cursor on the line after precipitation and click the right mouse button. Select a choice. If you know the choices, you can also type in the first 2 or 3 letters of the appropriate choice and press return and the rest of the choice will be typed out automatically. For weather comments type in the location of the weather observation and any reference to cloud cover, such as "high ovc" for high overcast, "low ovc" for low overcast, and "ptly cldy" for partly cloudy. Qpe in "fog" if ground fog was present. Press return. When you are done fflling in a weather observation, press "Add record". This saves the data for that weather observation. If there is another observation, enter the data after the previous weather has been saved. Watch the x term window and check to see that the correct data was entered. In general, it is wise to keep an eye on this window whenever something is being saved. Any error messages will be listed there. They should be carefully noted and brought to Dave Scheel's attention before continuing with data entry. If there are more weather observations, enter them, pressing "Add record" after each and remembering to press return after

51 each item that is added. Enter no more than 3 weather records. If there are more than 3 on the log sheet, choose ones at the beginning, middle, and end of the day. When all weather records are entered, press "Done adding weather". Watch the x tenn window for error messages. You will be returned to the log sheet. Whale Sightings on the Log Sheet If there were any whale sightings, press "Whale sightings". Enter only whale sightings at this time, not porpoise sightings. Enter the beginning time of the observation, in decimal time. The species item is a menu. Place the cursor on the line following species and click the right mouse button. Choose the appropriate species. If you remember the choices, just enter the abbreviation for the species without clicking on the menu button. If there is a killer whale data sheet for the day you are entering, you will need to All in the Encounter#. This is simply the same number as the log sheet with a letter after it, to indicate which sighting is being entered. For example, if there is only one killer whale sighting, the encounter id could be, i.e., a. If there is another killer whale data sheet, the next encounter id for that date would be b. If there is no killer whale data sheet, or if the sighting is of another species of whale, leave the encounter# blank. Next fill in the number of animals in the encounter, if known. If the number is missing, remember to type in -99, or the computer will replace the blank with a zero. ttbehavior of whales" is a menu item. The choices, however, are rarely used. This item is most often left blank. Enter the beginning location of the sighting. Under whale sighting comment, type in the pods of killer whales present if known. Other comments related to other species may include behavior of the whales, i.e. lunge feeding, etc. Do not repeat comments that will be entered in the killer whale encounter menu. Press return. Click on "Add record". If there is not another sighting to enter, click on "Done adding sightings". Once again, check for error messages in the x-term window. Drawing in the Vessel Track *You are now ready to draw in the vessel track. *In the log sheet menu, click on "Add record". *You are now in arcedit mode and ready to use the mouse and cursor to draw in the vessel track. Locate the beginning point of the vessel track on the map. Without clicking the mouse button, type in "2". This locates the "node" marking the beginning of the arc you are drawing. Move the cursor along, clicking the right mouse button whenever you need to change direction. Each of these clicked on points is called a vertex. If you make a mistake, and just need to delete part of the line you are drawing, type in the number "4". This will delete the last vertex you entered. If you want to delete the whole arc and start all over again, type in the number "5". These choices are also listed at the bottom of the x-tenn window when you are in

52 arcedit mode. When you have reached the end point of the vessel track on the map, do not click the mouse button, but simply mark the end point by typing in the number "2", which marks the end node of the arc. Ifyou need to make the background map bigger, you can place the cursor at the right lower corner of the map box until you see the pointer turn into a circle. Click the left mouse button and "drag" the corner of the map to enlarge the desired map. You can also use the menu at the top left comer of the map to change the map scale. Click on the "Pan/Zoomn button with the right mouse button. If you want to enlarge a certain area, click on "Zoom In" with the left mouse button and then click on the center of the area which you would like to enlarge with the left mouse button. "Zoom Out" works the same way and will allow you to expand the area that you are looking at on the map. If you want to move to other areas on the map that are not visible on the screen, click on "Pan" with the left mouse button, then click on the map in the direction of the area you wish to have displayed. You can zoom in and out or pan while in the middle of drawing a vessel track. When you are finished drawing the vessel track and have ended your arc by typing "2", type in "9", which quits the map-drawing session. Move the cursor to the x-term window and at the prompt type "&retw. You will now be out of arcedit and returned to data-editing mode. If there is a killer whale encounter for the day just entered, click on "Enter Encounters for Log". Entering Killer Whale Encounter Sheets Assign an encounter id to the sheet. This is the same encounter number entered in the sighting menu on the log sheet, i.e., for an encounter fkom the same day as log , assign a to the first encounter for that day. Write this encounter id number and your initials on the killer whale data sheet. Enter the initials of the observers present during the encounter. Type in the Begin and End times in decimal time. Type in the beginning and end locations of the whale encounter. l)qx in the miles traveled with whales. Remember to type in "-99" if this is missing on the data sheet. Enter the pods present in the encounter. No spaces are necessary after commas, i.e., AB,AI,AN...etc. The pods present should be verified by checking Graeme Ellis's photographic database. Enter the total number of whales estimated to be present in the encounter in "Total whale". If present, enter field estimates for number of adult males, female/imrnatures and calves. For non-resident whales (AT,AC,AU whales),' enter the individuals recognized in the field from the data sheet. For AT,AC, or AU whales, enter the actual whales photographed In the "Recognized individuals" item, using Graeme Ellis's photographic data summaries for AT,AC, and AU whales. If the data sheets indicate that other whales were present but not photographed, enter these whales as well. For non-resident whales, enter the number of whales photographed from Graeme Ellis's data summary. For resident whales, enter -99 at this time. For "Oil", enter the type seen, i.e., "hv oil sheen" for heavy oil sheen, etc. Otherwise, type in "none". In , the information for
Long-term killer whale monitoring in Prince William Sound/ Kenai Fjords
 ATTACHMENT C EVOSTC Annual Project Report Form 1. Program Number: See, Reporting Policy at III (C) (1). 12120114-M 2. Project Title: See, Reporting Policy at III (C) (2). Long-term killer whale monitoring
EVOSTC Annual Project Report Form. Long-term killer whale monitoring in Prince William Sound/ Kenai Fjords
 ATTACHMENT C EVOSTC Annual Project Report Form 1. Program Number: See, Reporting Policy at III (C) (1). 12120114-M 2. Project Title: See, Reporting Policy at III (C) (2). Long-term killer whale monitoring
Errors and omissions: Date posted: August 29, 2017.
 Context: Gabriola natural history Citations: Phyllis Reeve, Orcas at Page s, SHALE 12, pp.3 6, November 2005. Copyright restrictions: Copyright 2005: Gabriola Historical & Museum Society. For reproduction
BAJA BLUE WHALE RESEARCH 2011
 BAJA BLUE WHALE RESEARCH 2011 Summary of research conducted by Cascadia Research as a part of an Oceanic Society Research Expedition with volunteers from Road Scholar Expedition Dates: ch 26 il 2, 2011
2016 West Coast Entanglement Summary
 March 2017 2016 West Coast Entanglement Summary Overview of Entanglement Data west coast region MMHSRP Permit #18786 In 2016, 71 separate cases of entangled whales were reported off the coasts of Washington,
National Report on Large Whale Entanglements
 National Report on Large Whale Entanglements Confirmed in the United States in 2017 In 2017, 76 confirmed cases of large whale entanglements were documented along the coasts of the United States. Seventy
Puget Sound s whales face intertwined obstacles By The Seattle Times, adapted by Newsela staff Jul. 15, :00 AM
 Puget Sound s whales face intertwined obstacles By The Seattle Times, adapted by Newsela staff Jul. 15, 2014 4:00 AM A sheet of water cascades off the back of an Orca that surfaced in Haro Strait near
Genetic analysis of radio-tagged westslope cutthroat trout from St. Mary s River and Elk River. April 9, 2002
 Genetic analysis of radio-tagged westslope cutthroat trout from St. Mary s River and Elk River April 9, 2002 Report prepared for: Angela Prince, M.Sc., R.P. Bio Westslope Fisheries 517 13 th Avenue South
Puget Sound's whales face intertwined obstacles
 Puget Sound's whales face intertwined obstacles By The Seattle Times, adapted by Newsela staff on 07.15.14 Word Count 892 A sheet of water cascades off the back of an Orca that surfaced in Haro Strait
Salmon bycatch patterns in the Bering Sea pollock fishery
 Salmon bycatch patterns in the Bering Sea pollock fishery James Ianelli Seattle, WA Data from the North Pacific Observer Program (Fisheries Monitoring and Assessment) were analyzed for seasonal, temporal,
Looking back after 20 years
 Exxon Valdez Oil Spill: Long Term persistence and and Long term effects Looking back after 20 years Dr. Stanley Jeep Rice Auke Bay Laboratory Alaska Fisheries Science Center Juneau, AK Jeep.rice@noaa.gov
Injury and Recovery of Sea Otters and Harlequin Ducks following the Exxon Valdez Oil Spill: a Quarter-Century Perspective
 Injury and Recovery of Sea Otters and Harlequin Ducks following the Exxon Valdez Oil Spill: a Quarter-Century Perspective Dan Esler Research Wildlife Biologist Alaska Science Center U.S. Geological Survey
Modern status of Sea otter population on the Commander Islands
 Modern status of Sea otter population on the Commander Islands Alexander Burdin, Kamchatka branch of Pacific Institute of Geography, RAS, University of Alaska, Fairbanks, ASLC, Sergey Zagrebelny, Commander
I. D. Number: Marine Mammals study Number 2
 ASSESSMENT OP INJURIES TO KILLER WHALES IN PRINCE WILLIAM SOUND I. D. Number: Marine Mammals study Number 2.. This is an Interim and not a final Report. It may not have been subjected to scientitic peer
Final Report Alaska Department of Fish and Game State Wildlife Grant T July 1, 2003 June 30, 2006:
 Final Report Alaska Department of Fish and Game State Wildlife Grant T-1-6-4 July 1, 2003 June 30, 2006: Acoustic Monitoring for Killer Whales in the Bering Sea John Hildebrand and Erin Oleson Marine Physical
Alaska Salmon Shark Assessment Project
 Alaska Salmon Shark Assessment Project Project Number: 02396 Restoration Category: Proposer: Lead Trustee Agency: Cooperating Agencies: Alaska Sea Life Center: Duration: Cost FY 02: Research NOAA Dr. Stan
AGENCY: National Marine Fisheries Service (NMFS), National Oceanic and Atmospheric
, National Oceanic and Atmospheric") This document is scheduled to be published in the Federal Register on 05/30/2013 and available online at http://federalregister.gov/a/2013-12869, and on FDsys.gov BILLING CODE 3510-22-P DEPARTMENT OF COMMERCE
This document is scheduled to be published in the Federal Register on 05/30/2013 and available online at http://federalregister.gov/a/2013-12869, and on FDsys.gov BILLING CODE 3510-22-P DEPARTMENT OF COMMERCE
submitted: fall 2009
 Cat Project of the Month April 2010 The IUCN/SSC Cat Specialist Group's website (www.catsg.org) presents each month a different cat conservation project. Members of the Cat Specialist Group are encouraged
Search for the missing sea otters
 Search for the missing sea otters Objectives: Based on a real study of sea otter declines Apply your knowledge of basic concepts of population and community ecology Interpret data from graphs and tables
Acoustic and Visual Survey of Cetaceans at Palmyra Atoll
 Acoustic and Visual Survey of Cetaceans at Palmyra Atoll Trip report 08/2010 Palmyra, August 18 September 9, 2010 Jason P Larese Mark Deakos Contact: sbaumann@ucsd.edu, jhildebrand@ucsd.edu Scripps Institution
I'd like to thank the Board for the opportunity to present here today.
 Martin Knutson, NWT Wildlife Federation. I'd like to thank the Board for the opportunity to present here today. The NWT Wildlife Federation represents approximately six hundred and fifty (650) resident
4. Instruction in telemetry requires IACUC review if live vertebrates are used in the training session. a. True b. False
 Name: Quiz for Module 5: Field Biology - Mammals Date: 1. The Guidelines for the Capture, Handling, and Care of Mammals as Approved by the American Society of Mammalogists: were prepared by mammalogists
Largemouth Bass in Northern Wisconsin: Factors Regulating Recruitment and Potential Dietary Interactions with Walleyes
 Largemouth Bass in Northern Wisconsin: Factors Regulating Recruitment and Potential Dietary Interactions with Walleyes Craig J. Kelling Daniel A. Isermann Shelli A. Dubay Brian L. Sloss Jonathan F. Hansen
Harbour Porpoise Release Program Newsletter
 Harbour Porpoise Release Program Newsletter Volume 5 Fall 2003 We have come to the end of another successful year for the Harbour Porpoise Release Program. We would like to thank all of you for ensuring
Concept for a Whale Protection Zone for the Endangered Southern Resident Killer Whale
 Concept for a Whale Protection Zone for the Endangered Southern Resident Killer Whale Supported (in part) by the Charlotte Martin Foundation and the Norcliffe Foundation The concept described in this document
COSTA RICA DOME BLUE WHALE CRUISE REPORT Todd Chandler and John Calambokidis Cascadia Research Collective November 2004
 COSTA RICA DOME BLUE WHALE CRUISE REPORT Todd Chandler and John Calambokidis Cascadia Research Collective November 2004 Vessels: 50 (15m) Sailing vessel Russamee 14 (4.3m) Inflatable launch Cruise Dates:
Population Parameters and Their Estimation. Uses of Survey Results. Population Terms. Why Estimate Population Parameters? Population Estimation Terms
 Population Parameters and Their Estimation Data should be collected with a clear purpose in mind. Not only a clear purpose, but a clear idea as to the precise way in which they will be analysed so as to
Become a Marine Biologist for the Day
 Become a Marine Biologist for the Day Grade: 9-12 Subject: Social Studies Duration: One three lessons Objectives It is expected that students will: Demonstrate an ability to present and interpret geographic
A Hare-Lynx Simulation Model
 1 A Hare- Simulation Model What happens to the numbers of hares and lynx when the core of the system is like this? Hares O Balance? S H_Births Hares H_Fertility Area KillsPerHead Fertility Births Figure
Chapter 5: Methods and Philosophy of Statistical Process Control
 Chapter 5: Methods and Philosophy of Statistical Process Control Learning Outcomes After careful study of this chapter You should be able to: Understand chance and assignable causes of variation, Explain
Long-Term Monitoring Program (Gulf Watch Alaska) Final Report. Exxon Valdez Oil Spill
 Final Report. Exxon Valdez Oil Spill") Exxon Valdez Oil Spill Long-Term Monitoring Program (Gulf Watch Alaska) Final Report Long-Term Killer Whale Monitoring in Prince William Sound/Kenai Fjords Exxon Valdez Oil Spill Trustee Council Project
Exxon Valdez Oil Spill Long-Term Monitoring Program (Gulf Watch Alaska) Final Report Long-Term Killer Whale Monitoring in Prince William Sound/Kenai Fjords Exxon Valdez Oil Spill Trustee Council Project
Yale Reservoir Kokanee (Oncorhynchus nerka) Escapement Report 2016
 Escapement Report 2016") Yale Reservoir Kokanee (Oncorhynchus nerka) Escapement Report 2016 North Fork Lewis River Hydroelectric Project Yale FERC No. 2071 Prepared by: Jeremiah Doyle, PacifiCorp April 4, 2017 1.0 INTRODUCTION
Yale Reservoir Kokanee (Oncorhynchus nerka) Escapement Report 2016 North Fork Lewis River Hydroelectric Project Yale FERC No. 2071 Prepared by: Jeremiah Doyle, PacifiCorp April 4, 2017 1.0 INTRODUCTION
Salmon age and size at maturity: Patterns and processes
 Salmon age and size at maturity: Patterns and processes 1. Age Designation 2. Variation among populations 1. Latitude 2. Within regions 3. Within watersheds 3. Variation within populations 1. Smolt size
Exxon Valdez Oil Spill Restoration Project. Photographic and Acoustic Monitoring of Killer Whales in Prince William Sound and Kenai Fjords, Alaska
 Exxon Valdez Oil Spill Restoration Project Photographic and Acoustic Monitoring of Killer Whales in Prince William Sound and Kenai Fjords, Alaska Restoration Project 000 12 Annual Report This annual report
Findings of the Alaska Board of Game BOG
 Findings of the Alaska Board of Game 2004-148-BOG Authorizing Predator Control in the Western Cook Inlet Area in Unit 16B with Airborne or Same Day Airborne Shooting March 10, 2004 Purpose This action
Killer whales and their prey in Iceland
 Killer whales and their prey in Iceland Filipa I. P. Samarra Marine and Freshwater Research Institute, Skúlagata 4, 101 Reykjavík, Iceland June-August 2018 PAGE 1 Letter to Volunteers Dear Earthwatch volunteers,
Black Sea Bass Encounter
 Black Sea Bass Encounter Below is an adaptation of the Shark Encounter (Lawrence Hall of Science: MARE 2002) lesson plan to be about Black Sea Bass and to incorporate information learned from Dr. Jensen
Marine Mammals. James M. Price. Division of Environmental Sciences. from NOAA photograph library
 Marine Mammals from NOAA photograph library James M. Price James.Price@boem.gov Division of Environmental Sciences Environmental Studies Program R/V Pisces (from NOAA Web site) Develops and oversees applied
STUDY PERFORMANCE REPORT
 SUDY PERFORMANCE REPOR State: Michigan Project No.: F-81-R-1 Study No.: 495 itle: Assessment of lake trout populations in Michigan waters of Lake Superior Period Covered: October 1, 1999 to September 3,
Near-Field Sturgeon Monitoring for the New NY Bridge at Tappan Zee. Quarterly Report July 1 September 30, 2014
 Near-Field Sturgeon Monitoring for the New NY Bridge at Tappan Zee Quarterly Report July 1 September 30, 2014 Prepared by AKRF, Inc. 7250 Parkway Drive, Suite 210 Hanover, MD 21076 for New York State Thruway
STUDY PERFORMANCE REPORT
 STUDY PERFORMANCE REPORT State: Michigan Project No.: F-80-R-7 Study No.: 230703 Title: Lakewide assessment of the contribution of natural recruitment to the Chinook salmon population of Lake Huron. Period
Dauphin Lake Fishery. Status of Walleye Stocks and Conservation Measures
 Dauphin Lake Fishery Status of Walleye Stocks and Conservation Measures Date: December, 21 Dauphin Lake Fishery Status of Walleye Stocks and Conservation Measures Background: Walleye stocks in Dauphin
A Combined Recruitment Index for Demersal Juvenile Cod in NAFO Divisions 3K and 3L
 NAFO Sci. Coun. Studies, 29: 23 29 A Combined Recruitment Index for Demersal Juvenile Cod in NAFO Divisions 3K and 3L David C. Schneider Ocean Sciences Centre, Memorial University St. John's, Newfoundland,
IMPROVING POPULATION MANAGEMENT AND HARVEST QUOTAS OF MOOSE IN RUSSIA
 IMPROVING POPULATION MANAGEMENT AND HARVEST QUOTAS OF MOOSE IN RUSSIA Vladimir M. Glushkov Research Institute of Game Management and Fur Farming, Kirov, Russia. ABSTRACT: Annual harvest quotas for moose
Marine predators and prey
 Science Unit: Lesson 5: Beluga Whale Marine predators and prey School Year: 2015/2016 Developed for: Developed by: Grade level: Duration of lesson: Notes: Champlain Heights Annex, Vancouver School District
Kenai River Sockeye Escapement Goals. United Cook Inlet Drift Association
 Kenai River Sockeye Escapement Goals United Cook Inlet Drift Association 2014 Evaluating Sockeye Escapement Goals in the Kenai River Utilizing Brood Tables and Markov Tables This presentation pertains
ELECTRO-FISHING REPORT 2016 UPPER TWEED
 ELECTRO-FISHING REPORT 2016 UPPER TWEED The electro-fishing programme carried out each summer by The Tweed Foundation is part of our management plan, which details the information that is required to manage
Federal Aid in Wildlife Restoration Annual Performance Report of Survey-Inventory Activities 1 July June IS 0 N
 Alaska Department of Fish and Game Division of Wildlife Conservation Federal Aid in Wildlife Restoration Annual Performance Report of Survey-Inventory Activities 1 July 1991-30 June 1992 8 IS 0 N Susan
CALIFORNIA DEPARTMENT OF FISH AND WILDLIFE RECOMMENDATIONS ON ADDITIONAL WINTER-RUN PROTECTIONS IN 2016 OCEAN FISHERIES
 Agenda Item E.1 CDFW Supplemental Report April 216 CALIFORNIA DEPARTMENT OF FISH AND WILDLIFE RECOMMENDATIONS ON ADDITIONAL WINTER-RUN PROTECTIONS IN 216 OCEAN FISHERIES In April 215, CDFW recommended
2009 Update. Introduction
 29 Update Introduction The Wyoming Game & Fish Department, the University of Wyoming, and the U.S. Fish & Wildlife Service initiated the Absaroka Elk Ecology Project in January 27. Objectives of this project
Bainbridge Island School District Life Science UNIT 2 - Southern Resident Orcas Grade 4
 Bainbridge Island School District Life Science UNIT 2 - Southern Resident Orcas Grade 4 Unit created by Laurie Spickard, curriculum specialist Essential question for the unit Why are the Southern Resident
California Department of Fish and Wildlife Report to the International Pacific Halibut Commission on 2017 California Fisheries
 IPHC-2018-AM094-AR08 Received: 22 December 2017 California Department of Fish and Wildlife Report to the International Pacific Halibut Commission on 2017 California Fisheries California Department of Fish
ASSESSMENT OF THE WEST COAST OF NEWFOUNDLAND (DIVISION 4R) HERRING STOCKS IN 2011
 HERRING STOCKS IN 2011") Canadian Science Advisory Secretariat Science Advisory Report 212/24 ASSESSMENT OF THE WEST COAST OF NEWFOUNDLAND (DIVISION 4R) HERRING STOCKS IN 211 Context Figure 1. Map of unit areas of NAFO Division
Canadian Science Advisory Secretariat Science Advisory Report 212/24 ASSESSMENT OF THE WEST COAST OF NEWFOUNDLAND (DIVISION 4R) HERRING STOCKS IN 211 Context Figure 1. Map of unit areas of NAFO Division
Agriculture Zone Winter Replicate Count 2007/08
 PEACE REGION TECHNICAL REPORT Agriculture Zone Winter Replicate Count 2007/08 by: Conrad Thiessen Wildlife Biologist Ministry of Environment 400 10003 110 th Avenue Fort St. John BC V1J 6M7 November 2008
Admiralty Inlet Pilot Tidal Project FERC No Appendix C. Derelict Gear Monitoring Plan
 Appendix C Derelict Gear Monitoring Plan ADMIRALTY INLET PILOT TIDAL PROJECT FERC PROJECT NO. 12690 DERELICT GEAR MONITORING PLAN (submitted with the Final Application for a New Pilot Project License)
Status Report on the Yellowstone Bison Population, August 2016 Chris Geremia 1, Rick Wallen, and P.J. White August 17, 2016
 Summary: Status Report on the Yellowstone Bison Population, August 2016 Chris Geremia 1, Rick Wallen, and P.J. White August 17, 2016 The bison population is estimated near 5,500 (range = 5,200-5,800),
OREGON DEPARTMENT OF FISH AND WILDLIFE SUMMARY OF COUGAR POPULATION MODEL AND EFFECTS OF LETHAL CONTROL
 OREGON DEPARTMENT OF FISH AND WILDLIFE SUMMARY OF COUGAR POPULATION MODEL ODFW is authorized to reduce human-cougar conflict, livestock depredation, and benefit native ungulate populations through the
Discussion on the Selection of the Recommended Fish Passage Design Discharge
 Discussion on the Selection of the Recommended Fish Passage Design Discharge Introduction The provision of fish passage is a requirement for most proposed culvert and bridge installations in Alberta, depending
1. A Report to the Attorney General of the State of Alaska I TO THE EXXON VALDEZ OIL SPILL. December 18, 1992 OF RECREATIONAL FISHING LOSSES RELATED
 A PRELIMINARY ECONOMIC ANALYSIS OF RECREATIONAL FISHING LOSSES RELATED TO THE EXXON VALDEZ OIL SPILL Richard T. Carson W. Michael Hanemann December 18, 1992 1. A Report to the Attorney General of the State
Year Avg. TAC Can Others Totals
 SKATE IN DIVISIONS 3L, 3N, 3O AND SUBDIVISION 3Ps Background There are 8 to 1 species of skate in the waters around Newfoundland. Of these, thorny skate (Raja radiata) is by far the most common, comprising
STUDY PERFORMANCE REPORT
 STUDY PERFORMANCE REPORT State: Michigan Project No.: F-80-R-7 Study No.: 230654 Title: Evaluation of brown trout and steelhead competitive interactions in Hunt Creek, Michigan. Period Covered: October
ATLANTIC SALMON NEWFOUNDLAND AND LABRADOR, SALMON FISHING AREAS 1-14B. The Fisheries. Newfoundland Region Stock Status Report D2-01
 Fisheries Pêches and Oceans et Océans DFO Science Newfoundland Region Stock Status Report D2-01 ATLANTIC SALMON NEWFOUNDLAND AND LABRADOR, SALMON FISHING AREAS 1-14B Background There are 15 Atlantic salmon
Blue cod 5 (BCO5) pot mesh size review
 pot mesh size review") Blue cod 5 (BCO5) pot mesh size review Discussion Document MPI Discussion Paper No: 2017/01 Prepared for public consultation by the Ministry for Primary Industries ISBN No: 978-1-77665-454-3 (o) ISSN No:
Blue cod 5 (BCO5) pot mesh size review Discussion Document MPI Discussion Paper No: 2017/01 Prepared for public consultation by the Ministry for Primary Industries ISBN No: 978-1-77665-454-3 (o) ISSN No:
EXHIBIT ARWA-700 TESTIMONY OF PAUL BRATOVICH
 EXHIBIT ARWA-700 TESTIMONY OF PAUL BRATOVICH 1. I am a fisheries biologist employed by the firm of HDR, Inc. I hold a Bachelor of Science degree in Fisheries from the University of Washington, located
Wyoming Range Mule Deer Project. Summer 2017 Update
 Wyoming Range Mule Deer Project Summer 2017 Update TABLE OF CONTENTS PROJECT BACKGROUND... 3 WINTER 2016/2017... 4 Adult Survival... 4 Fawn Survival... 4 MARCH 2017 ADULT CAPTURES... 5 Nutritional Condition...
A REVIEW AND EVALUATION OF NATURAL MORTALITY FOR THE ASSESSMENT AND MANAGEMENT OF YELLOWFIN TUNA IN THE EASTERN PACIFIC OCEAN
 A REVIEW AND EVALUATION OF NATURAL MORTALITY FOR THE ASSESSMENT AND MANAGEMENT OF YELLOWFIN TUNA IN THE EASTERN PACIFIC OCEAN Mark N. Maunder and Alex Aires-da-Silva Outline YFT history Methods to estimate
Migration, Behaviour and Habitat Selection by Anadromous Brook Trout, Salvelinus fontinalis (Mitchell), in a Nova Scotia Southern Upland:
, in a Nova Scotia Southern Upland:") Migration, Behaviour and Habitat Selection by Anadromous Brook Trout, Salvelinus fontinalis (Mitchell), in a Nova Scotia Southern Upland: FFRC Year-End REPORT E.A. Halfyard Dalhousie University and the
Migration, Behaviour and Habitat Selection by Anadromous Brook Trout, Salvelinus fontinalis (Mitchell), in a Nova Scotia Southern Upland: FFRC Year-End REPORT E.A. Halfyard Dalhousie University and the
Report on a Salmon Survey in the Waterford Estuary in 2010
 Report on a Salmon Survey in the Waterford Estuary in 2010 Dr. P. Gargan Inland Fisheries Ireland June 2011 1 Contents 1. Introduction 3 2. Proposal for a Survey in Waterford estuary in 2010 3 3. Survey
Susitna-Watana Hydroelectric Project Document ARLIS Uniform Cover Page
 Alaska Resources Library & Information Services Document ARLIS Uniform Cover Page Title: Wildlife harvest analysis study, Study plan Section 10.20 : Final study plan SuWa 200 Author(s) Personal: Author(s)
FIELDTRIP REPORT. The Selati River flowing. 5 th January to 7 th March st WET SEASON. Report by:
 The Selati River flowing FIELDTRIP REPORT 5 th January to 7 th March 2017 1 st WET SEASON Report by: Jessica Comley, Rhodes University, Grahamstown INTRODUCTION My second field trip to Selati Game Reserve
WHALES. & Whale Sharks
 WHALES & Whale Sharks Introduction Today we are going to learn about the biggest mammals of the ocean and one animal that is commonly mistaken for a whale but is actually a fish. Whale is the common name
Preliminary survival estimates for the passage of spring-migrating juvenile salmonids through Snake and Columbia River dams and reservoirs, 2018
 UNITED STATES DEPARTMENT OF COMMERCE National Oceanic and Atmospheric Administration NATIONAL MARINE FISHERIES SERVICE Northwest Fisheries Science Center Fish Ecology Division 2725 Montlake Boulevard East
BOGUS CREEK SALMON STUDIES 2002
 BOGUS CREEK SALMON STUDIES 2002 BY: JEANNINE RICHEY California Department of Fish and Game KLAMATH RIVER PROJECT 303 SOUTH STREET YREKA, CALIFORNIA 96097 (530) 842-3109 California Department of Fish and
Keywords: 7SI/Brown bear/harvest/harvest quota/hunting/malme/management/ mortality/population size/trend/ursus arctos
 Ministry of the Environment and Spatial Planning. Management with the brown bear population in Slovenia. Report: 1-6. 2006. Republic of Slovenia, Ministry of the Environment and Spatial Planning. Keywords:
Job Title: Game Management, Subsection B Game Management Mountain Lion
 Job Title:, Subsection B Goal: Manage the mountain lion population, its numbers and distribution, as an important part of Arizona s fauna and to provide mountain lion hunting recreation opportunity while
***Please Note*** April 3, Dear advisory committee members:
 April 3, 29 Dear advisory committee members: The fifth meeting of the CHF advisory committee will be held April 13 in Grants Pass from 6:-8:3 PM, and the purpose of this document is to help committee members
PEDESTRIAN/BICYCLIST CRASH ANALYSIS 2015
 PEDESTRIAN/BICYCLIST CRASH ANALYSIS 2015 Central Arkansas Regional Transportation Study Table of Contents Executive Summary... 3 CARTS Pedestrian/Bicycle Crash Analysis... 3 Report Format... 3 Results...
Puyallup Tribe of Indians Shellfish Department
 Puyallup Tribe of Indians Shellfish Department Dungeness crab trap catch efficiency related to escape ring location and size George Stearns* 1, Robert Conrad 2, David Winfrey 1, Nancy Shippentower-Games
Appendix M. Gas Bubble Trauma Monitoring and Data Reporting for 2007
 Appendix M Gas Bubble Trauma Monitoring and Data Reporting for 2007 FISH PASSAGE CENTER 1827 NE 44 th Ave., Suite 240, Portland, OR 97213 Phone: (503) 230-4099 Fax: (503) 230-7559 http://www.fpc.org e-mail
Evaluating the Influence of R3 Treatments on Fishing License Sales in Pennsylvania
 Evaluating the Influence of R3 Treatments on Fishing License Sales in Pennsylvania Prepared for the: Pennsylvania Fish and Boat Commission Produced by: PO Box 6435 Fernandina Beach, FL 32035 Tel (904)
INTRODUCTION TO PATTERN RECOGNITION
 INTRODUCTION TO PATTERN RECOGNITION 3 Introduction Our ability to recognize a face, to understand spoken words, to read handwritten characters all these abilities belong to the complex processes of pattern
SEA GRANT PROGRESS REPORT
 SEA GRANT PROGRESS REPORT Project Title: The relationship between seasonal migrations of berried female lobster Homarus americanus, egg development and larval survival. Principal Investigator: Winsor H.
Continued Genetic Monitoring of the Kootenai Tribe of Idaho White Sturgeon Conservation Aquaculture Program
 Continued Genetic Monitoring of the Kootenai Tribe of Idaho White Sturgeon Conservation Aquaculture Program Deliverable 1): Monitoring of Kootenai River white sturgeon genetic diversity Deliverable 2):
Proposed 2018 Fisheries Management Measures to Support Recovery of Interior Fraser River Steelhead
 Proposed 2018 Fisheries Management Measures to Support Recovery of Interior Fraser River Steelhead 22-March-2018 Spawning escapements of two Interior Fraser River steelhead stocks, Thompson and Chilcotin
Minnesota Department of Natural Resources Fisheries Division, Lake Superior Area
 Minnesota F-9-R(P)- Study 4 Job 616 Minnesota Department of Natural Resources Fisheries Division, Lake Superior Area Coaster Brook Trout Status in Minnesota-Lake Superior Tributaries Following Regulation
Falmouth and St.Austell pspa bird bycatch analysis report year
 Natural England Commissioned Report NECR231 Falmouth and St.Austell pspa bird bycatch analysis report year 1-2014 First published 20 April 2017 www.gov.uk/natural-england Foreword Natural England commission
Charter Boat Fishing in Lake Michigan: 2017 Illinois Reported Harvest
 Illinois Department of Natural Resources Division of Fisheries Charter Boat Fishing in Lake Michigan: 2017 Illinois Reported Harvest Steven R. Robillard Illinois Department of Natural Resources Lake Michigan
2010 Wildlife Management Unit 501 moose and deer
 2010 Wildlife Management Unit 501 moose and deer Section Authors: Barb Maile and Velma Hudson Suggested Citation: Maile, B., and V. Hudson. 2010. Wildlife Management Unit 501 moose and deer. Pages 73 77.
Monitoring Amur Leopards in Southwest Primorskii Krai, Russia
 Monitoring Amur Leopards in Southwest Primorskii Krai, Russia An Amur leopard passes our camera trap on February 8, 2017 in Land of the Leopard National Park. Photo LLNP/WCS Russia FINAL REPORT TO THE
Introduction (2 of 2) Systematic approach should be followed
 Systematic approach should be followed") Origin Determination Knowledge Objectives (1 of 2) Describe the recommended techniques for determining the origin of a fire. Explain the need for fire scene reconstruction. Develop and test origin hypotheses.
Origin Determination Knowledge Objectives (1 of 2) Describe the recommended techniques for determining the origin of a fire. Explain the need for fire scene reconstruction. Develop and test origin hypotheses.
Gulf of St. Lawrence (4RST) Greenland Halibut
 Greenland Halibut") Fisheries and Oceans Science Pêches et Océans Sciences DFO Science Stock Status Report A4-3 () 52 5 48 46 Québec Nouveau-Brunswick Québec 4T 4S 4R 3Pn 4Vn Terre-Neuve 3Ps 3K 3L Gulf of St. Lawrence (4RST)
Fisheries and Oceans Science Pêches et Océans Sciences DFO Science Stock Status Report A4-3 () 52 5 48 46 Québec Nouveau-Brunswick Québec 4T 4S 4R 3Pn 4Vn Terre-Neuve 3Ps 3K 3L Gulf of St. Lawrence (4RST)
NORTH RIVER FISH KILL PRELIMINARY REPORT 2014 SUMMARY
 NORTH RIVER FISH KILL PRELIMINARY REPORT 2014 SUMMARY A fish kill on Nor River was reported to e 1-800 Environmental emergency number on August 9, 2014. Representatives from e PEI Department of Environment,
Assessment of Guide Reporting & Preliminary Results of Lion Monitoring
 Assessment of Guide Reporting & Preliminary Results of Lion Monitoring Mara Predator Project December 21 Sara Blackburn Laurence Frank maralions@gmail.com lgfrank@berkeley.edu SUMMARY The Mara Predator
Student Population Projections By Residence. School Year 2016/2017 Report Projections 2017/ /27. Prepared by:
 Student Population Projections By Residence School Year 2016/2017 Report Projections 2017/18 2026/27 Prepared by: Revised October 31, 2016 Los Gatos Union School District TABLE OF CONTENTS Introduction
STUDY PERFORMANCE REPORT
 STUDY PERFORMANCE REPORT State: Michigan Project No.: F-53-R-14 Study No.: 486 Title: Assessment of lake trout populations in Michigan s waters of Lake Michigan. Period Covered: April 1, 1997 to March
COSEWIC Assessment and Status Report for Grizzly Bear Western population (Ursus arctos) in Canada SUMMARY
 in Canada SUMMARY") 1 COSEWIC Assessment and Status Report for Grizzly Bear Western population (Ursus arctos) in Canada SUMMARY The COSEWIC Assessment and Status Report for grizzly bears assess the status of Western and Ungava
1 COSEWIC Assessment and Status Report for Grizzly Bear Western population (Ursus arctos) in Canada SUMMARY The COSEWIC Assessment and Status Report for grizzly bears assess the status of Western and Ungava
Employer Name: NOAA Fisheries, Northwest Fisheries Science Center
 Internship Description Employer Name: NOAA Fisheries, Northwest Fisheries Science Center Employer Description: Manchester Research Station functions as a satellite facility to the NOAA Fisheries Northwest
Preliminary survival estimates for the passage of spring-migrating juvenile salmonids through Snake and Columbia River dams and reservoirs, 2017
 UNITED STATES DEPARTMENT OF COMMERCE National Oceanic and Atmospheric Administration NATIONAL MARINE FISHERIES SERVICE Northwest Fisheries Science Center Fish Ecology Division 2725 Montlake Boulevard East
Climate Change and Arctic Marine Mammals: Living on the Edge
 Climate Change and Arctic Marine Mammals: Living on the Edge M.O. Hammill Maurice Lamontagne Institute Dept. of Fisheries & Oceans Canada Mont-Joli, QC, Canada Outline: Hudson Bay- Bears (losers?) Killer
ALASKA DEPARTMENT OF FISH AND GAME DIVISION OF COMMERCIAL FISHERIES NEWS RELEASE
 ALASKA DEPARTMENT OF FISH AND GAME DIVISION OF COMMERCIAL FISHERIES NEWS RELEASE Sam Cotten, Commissioner Scott Kelley, Director Contact: Cordova ADF&G Stormy Haught, PWS Finfish Research Biologist 401