University of Nevada, Reno. Nevada. A thesis submitted in partial fulfillment of the requirements for the degree of Master of
|
|
|
- Clement Haynes
- 5 years ago
- Views:
Transcription
1 University of Nevada, Reno Resource Partitioning and Dietary Overlap of Mule Deer and Elk in Eastern Nevada A thesis submitted in partial fulfillment of the requirements for the degree of Master of Science in Natural Resources and Environmental Science By Moira Kolada Dr. Peter J. Weisberg/Thesis Advisor December 2011


2 UMI Number: All rights reserved INFORMATION TO ALL USERS The quality of this reproduction is dependent on the quality of the copy submitted. In the unlikely event that the author did not send a complete manuscript and there are missing pages, these will be noted. Also, if material had to be removed, a note will indicate the deletion. UMI Copyright 2012 by ProQuest LLC. All rights reserved. This edition of the work is protected against unauthorized copying under Title 17, United States Code. ProQuest LLC. 789 East Eisenhower Parkway P.O. Box 1346 Ann Arbor, MI
3 THE GRADUATE SCHOOL We recommend that the thesis prepared under our supervision by MOIRA KOLADA entitled Resource Partitioning And Dietary Overlap Of Mule Deer And Elk In Eastern Nevada be accepted in partial fulfillment of the requirements for the degree of MASTER OF SCIENCE Dr. Peter Weisberg, Advisor Dr. Kelley Stewart, Committee Member Mike Cox, Committee Member Kimberly Rollins, Graduate School Representative Marsha H. Read, Ph. D., Associate Dean, Graduate School December, 2011
4 i Abstract In semi-arid environments, such as the Great Basin, low productivity and frequent drought conditions increase the complexity of understanding the potential for competition, habitat selection, and dietary separation between native ungulates and cattle. I studied resource partitioning and spatial patterns of habitat use by female mule deer (Odocoileus hemionus) and female elk (Cervus elaphus) in eastern Nevada during winter, spring, and summer. I also examined dietary composition and overlap of mule deer, elk, and cattle. To assess resource partitioning and spatial distributions I used ecological niche factor analysis (ENFA) to analyze the areas used by radio-collared mule deer and elk and create habitat suitability maps for both species. I found that both species were using habitats close to dirt roads and that areas with high pinyon-juniper cover were avoided during all seasons. Nonetheless, there was selection for low-density pinyonjuniper areas and areas in proximity to pinyon-juniper. Mule deer selected for specific elevational ranges (2300m to 2500m) and areas close to springs during the summer. Elk selected for higher elevations during spring and summer. Slope and proximity to springs were also important during summer. I found that habitat use was more restricted during summer than for the other seasons for both species, but especially mule deer. My results suggest that in these semi-arid watersheds, mule deer and elk may be more restricted by availability of water and high quality forage during summer. To assess dietary composition and overlap between mule deer, elk, and cattle, diet utilization was quantified from microhistological analysis of rumen and fecal samples. I observed that that there was not substantial dietary overlap among elk and mule deer from October to December, but that dietary overlap was greatest in summer. Elk and
5 ii mule deer showed greater dietary overlap than elk and cattle. I observed a slight dietary separation among male and female elk, with female elk diets having a greater graminoid component than male elk. Elk and cattle exhibited greater dietary separation in my study area that included a crested wheatgrass seeding, suggesting either that elk avoided areas of high cattle concentration (i.e. crested wheatgrass seedings), or that cattle preferred the seeded grasses and utilized less of other forage species favored by elk.
6 iii Acknowledgments This thesis would not have been possible without the endless hours of work done by a variety of field assistants: Tracy Benson, Heather Tallerico, Heather Mobley, Jack and Shannon Ilg, Jean Heidker, and Eric Kolada. Their help and support in the field was invaluable, and certainly made fieldwork a much more enjoyable experience. I also would like to thank Curt Baughman and Mike Cox from the Nevada Department of Wildlife for their invaluable expertise and their willingness to be a drop off location for far more rumen samples than we expected. Without them learning the oddities of my study area and how it affected the mule deer and elk in the area would have been much more challenging. In addition, I would like to thank the Nevada Arid Rangelands Initiative for funding this project. Nevada Bighorns Unlimited and Rocky Mountain Elk Foundation kindly provided additional funding for VHF collars and capture. I owe my deepest gratitude to my committee Peter Weisberg, Kelley Stewart, Mike Cox, and Kim Rollins. Especially Peter without his gentle prodding, patience, and guidance this thesis would have not been possible.
7 iv Table of Contents Abstract... i Acknowledgments... iii Table of Contents... iv List of Tables... vi List of Figures... ix Chapter Introduction... 1 Literature Cited... 5 Chapter Resource Partitioning and Habitat Overlap of Mule Deer and Elk in Eastern Nevada... 8 Abstract... 9 Introduction... 9 Methods Study Area Species Presence Data Environmental Variables Data Analysis Validation Results Spatial Distributions Mule Deer Elk Habitat Overlap Discussion Management Implications Literature Cited Tables Figure Legend Chapter Diet Composition and Overlap among Elk, Mule Deer, and Cattle in Eastern Nevada Abstract Introduction... 49
8 v Methods Study Area Field Methods Statistical Analysis Results Discussion Management Implications Literature Cited Chapter Summary... 85
9 vi List of Tables Chapter 2 Table 1. Environmental predictor variables used to determine habitat use and overlap between mule deer and elk, and the transformation used for each variable Table 2. Overall marginality for each environmental variable examined for mule deer and elk during winter, spring, and summer. Marginality values indicate whether the species habitat differs from the average habitat conditions in the study area. Bolded variables indicate variables that contribute the most to each factor or component of overall suitability. The elk winter model is not included due to poor model performance Table 3. Overall specialization for each environmental variable examined for mule deer and elk during winter, spring, and summer. Specialization factors indicate the breadth of the habitat conditions the species is willing to tolerate. Bolded variables indicate variables that contribute the most to each factor or component of overall suitability. The elk winter model is not included due to poor model performance Table 4. Overall Marginality and specialization values for mule deer and elk for winter, spring, and summer. Larger marginality values indicate that the species range is different than average conditions in the study area, and large specialization factors indicate that species niche is narrow. Elk winter values are not included due to poor model performance Table 5. Boyce index for mule deer and winter for winter, spring, and summer for habitat suitability models. A Boyce index of 0 indicates that the model did not different from the random model. The elk winter model was dropped due to poor model performance
10 vii Table 6. Amount of habitat (km 2 ) for each habitat suitability classification for mule deer and elk in winter, spring, and summer. Habitat suitability is divided into 4 categories, low, moderate, good, and prime habitat. The elk habitat suitability model for winter is not included due to poor model performance Chapter 3 Table 1. Descriptive statistics for diet composition (%) for elk, mule deer, and cattle collected during winter (October to December) and summer (June to September) in Duck Creek (Duck Creek) and Horse and Cattle Camp (Horse and Cattle Camp), near Ely, Nevada Rumen samples were not available for cattle Table 2. Plant species that make up 10% of average diet of male and female elk and mule deer in Duck Creek (Duck Creek) and Horse and Cattle Camp (Horse and Cattle Camp) during winter (October to December) as determined by microhistological analysis of rumen samples. Rumen samples were not available for cattle Table 3. Plant species that make up 10% of average diet of elk, mule deer, and cattle in Duck Creek (Duck Creek) and Horse and Cattle Camp (Horse and Cattle Camp) during summer (June to September) as determined by microhistological analysis of fecal samples Table 4. Results from Shannon-Wiener calculations for winter (October to December) and summer (June to September) for elk, mule deer and cattle. Samples were collected from Duck Creek (Duck Creek) and Horse and Cattle Camp (Horse and Cattle Camp) near Ely, Nevada
11 viii Table 5. Results from Morisita s similarity index calculations for winter (October to December) and summer (June to September) for elk, mule deer and cattle. Samples were collected from Duck Creek (Duck Creek) and Horse and Cattle Camp (Horse and Cattle Camp) near Ely, Nevada
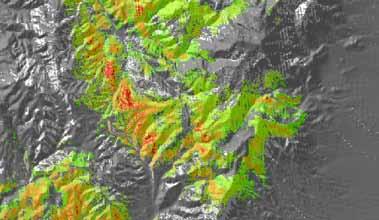
12 ix List of Figures Chapter 2 Figure 1. Climograph of mean monthly temperature and precipitation used to define seasons for Ely, Nevada Solid lines indicate months and dotted lines separate seasons Figure 2. Habitat suitability maps for mule deer. Green indicates low quality habitat, orange inidates medium quaity habitat, and red indicates high quality habitat Figure 3. Box plots presenting the distributions among sites at which mule deer were present and the entire study site during the winter months for the predictor variables contributing to mule deer habitat suitability. Predictor variables are a.) slope, b.) elevation, c.) pinyon-juniper cover, d.) distance from road, and e.) distance from spring Figure 4. Box plots presenting the distributions among sites at which mule deer and elk were present and the entire study site during the spring months for the predictor variables contributing to mule deer habitat suitability. Predictor variables are a.) slope, b.) elevation, c.) pinyon-juniper cover, d.) distance from road, and e.) distance from spring Figure 5. Box plots presenting the distributions among sites at which mule deer and elk were present and the entire study site during the summer months for the predictor variables contributing to mule deer habitat suitability. Predictor variables are a.) aspect, b.) distance from stream, c.) elevation, d.) pinyon-juniper cover, e.) distance from road, f.) slope, and g.) distance from spring Figure 6. Habitat suitability map depicting the difference in mule deer and elk habitat selection during the spring and summer. During the spring mule deer used slopes varying
13 x from 4 to 17% and elevations from 2400 to 19950m. Elk used slopes varying from 2 to 12% and elvations from 2400 to 2050m. During the summer mule deer used slopes varying from 9 to 16% and elevations from 2300 to 2500m and elk used slopes varying from 5 to 18% and elevations from 2100 to 2700m. Green indicates low habitat overlap, orange indicates moderate habitat overlap, and red indicates high overlap Chapter 3 Figure 1. Climograph of mean monthly temperature and precipitation used to define seasons for Ely, Nevada Solid lines indicate months and dotted lines separate seasons Figure 2. Dietary overlap among species in winter, shown using principal component analysis (PCA) on forage classes determined from microhistological analysis of rumen samples collected in Duck Creek (DC) and Horse and Cattle Camp (HCC) for elk (Duck Creek=36; Horse and Cattle Camp=33) and mule deer (Duck Creek=31;Horse and Cattle Camp=8). Rumen samples were collected from hunters that harvested a mule deer or elk near Ely, Nevada for October to December Ellipses are 95% confidence intervals of PCA axis scores Figure 3. Dietary overlap among species in summer, shown using principal component analysis (PCA) on forage classes determined from microhistological analysis of feces collected in Duck Creek (DC) and Horse and Cattle Camp (HCC) from cattle (Duck Creek=4; Horse and Cattle Camp=4), elk (Duck Creek=4; Horse and Cattle Camp=8), and mule deer (Duck Creek=5; Horse and Cattle Camp=5) near Ely, Nevada from June to
14 xi September, Ellipses represent 95% confidence intervals of PCA axis scores. Note: scale is different from rumen sample graphs Figure 4. Dietary overlap among sexes of elk in winter, shown using principal component analysis (PCA) on forage classes determined from microhistological analysis of rumen samples collected in Duck Creek (DC) and Horse and Cattle Camp (HCC) from female elk (Duck Creek=16; Horse and Cattle Camp=10) and male elk (Duck Creek=20; Horse and Cattle Camp=23). Rumen samples were collected from hunters that harvested elk near Ely, Nevada from October to December Ellipses are 95% confidence intervals of PCA axis score
15 Chapter 1 Introduction 1
16 2 Sympatric species with similar life-history strategies typically exhibit resource partitioning on three niche axes: spatial separation, temporal avoidance, and dietary differences (Stewart et al. 2002). Mule deer (Odocoileus hemionus) and elk (Cervus elaphus) are known to co-exist throughout the western states and both of these species are thought to have coevolved; therefore a high degree of resource partitioning is expected (Connell 1980). Habitat selection coupled with dietary requirements add a complex dimension to competition in the Intermountain West where native large herbivores, such as elk and mule deer, utilize the same rangelands as domestic livestock (Stewart et al. 2002). Many studies have shown resource partitioning and dietary differences between mule deer, elk, and cattle (Vavra et al. 1989; Kingerly et al. 1996; Stewart et al. 2002; Stewart et al. 2003, Beck and Peek 2005; Torstensen et al. 2006; Stewart et al. 2010). However, few studies (Beck and Peek 2005; Beck et al. 2006) have been conducted in regions with a semi-arid climate, which can dramatically impact resource selection and competition. In semi-arid environments, low levels of precipitation and frequent drought conditions add to the complexity of understanding ungulate use of their environment and have the potential to increase competition, resource partitioning, and dietary separation. Low levels of precipitation and drought conditions affect body condition, survival, distribution, and habitat use (Marcum and Scott 1985; McKinney 2003; Bender et al. 2007). Levels of precipitation, especially in semi-arid environments, have impacts on plant productivity and nutritional quality, which affect the overall body condition of mule deer and elk (Smith and LeCount 1979; McKinely et al. 2003; Marshal et al. 2006; Bender et al. 2007) and are likely to affect habitat selection. Competition among large
17 3 herbivores is most evident where forage productivity is low, and population densities of native herbivores or stocking rates of domestic species are high (Hobbs et al. 1996a). Semi-arid rangelands, such as those in Nevada, are likely to have intensified competitive interactions among large herbivores because of low primary productivity (Manier and Hobbs 2007). As availability of forage declines, herbivores expand their dietary niche to include sub-optimal, but often less contested forages resulting in greater niche breadth (Pianka 1988; Nicholson et al. 2006). The resulting increase in dietary overlap among sympatric large herbivores may increase the likelihood and intensity of competition (Hobbs et al. 1996b). Elk were reintroduced in 1932 northeastern Nevada, and the increasing elk population has prompted concerns about the interactions between elk, mule deer, and cattle. Moreover, declining mule deer populations are of great concern and competition with cattle and elk may exacerbate the decline (Fuller 1998; Ballard et al. 2001; Wasley 2004; Cook et al. 2007; Bishop et al. 2009). Thus, niche partitioning and competitive interactions are important components of management decisions regarding these three species of large herbivores and the ecosystems that they inhabit. I conducted a study of habitat selection and overlap of mule deer, elk, and cattle in eastern Nevada. This thesis is divided into two parts. First, I examined resource partitioning and habitat overlap among mule deer and elk, using statistical modeling approaches based on environmental variables constructed within a GIS. I hypothesized that habitat overlap would be greatest during the winter, when resources were most limiting, and that habitat overlap would be least during the summer. Secondly, I examined dietary overlap between mule deer, elk, and cattle. My objectives were to
18 4 determine levels of dietary overlap between elk, cattle, and mule deer in eastern Nevada. I hypothesized that greater dietary overlap will occur during winter when resources are more restricted. In addition, I expected dietary overlap to be the greatest between native intermediate feeder, elk, and the non-native grazer, cattle, because of digestive morphology, physiology, and lack of coevolution, than either species with mule deer. I also predicted that female elk would consume fewer graminoids than their male counterparts, because females are more selective for higher quality forage due to greater metabolic demands and smaller body size than males. Lastly, I hypothesized that there would be greater dietary overlap in my more arid study site due to differences in precipitation, elevation, and plant communities.
19 5 Literature Cited Beck, J. L. and J. M. Peek Diet Composition, Forage Selection, and Potential for Forage Competition Among Elk, Deer, and Livestock on Aspen-Sagebrush Summer Range. Rangeland Ecology and Management 58: Beck, J.L., J.M. Peek, and E.K. Strand Estimates of elk summer range nutritional carrying capacity constrained by probabilities of habitat selection. Journal of Wildlife Management 70(1): Bender, L.C., L.A. Lomas, and J. Browning Condition, survival and causespecific mortality of adult female mule deer in north-central Mexico. Journal of Wildlife Management 71(4): Connell, J.H Diversity and the coevolution of competitors, or the ghost of competition past. Oikos. 35(2): Hobbs, N. T., D. L. Baker, G. D. Bear, and D. C. Bowden. 1996a. Ungulate grazing in sagebrush grassland: Effects of resource competition on secondary production. Ecological Applications 6: Hobbs, N. T., D. L. Baker, G, D. Bear, and D. C. Bowden. 1996b. Ungulate grazing in sagebrush grassland: Mechanisms of resource competition. Ecological Applications 6: Kingerly, J. L., J. C. Mosley, and K. C. Bordwell Dietary overlap among cattle and cervids in northern Idaho forests. Journal of Range Management 49:8-15. Manier, D.J. and N.T. Hobbs Large herbivores in sagebrush steppe ecosystems: livestock and wild ungulates influence structure and function. Oecologia 152:
20 6 Marshal, J.P., VC. Bleich, P.R. Krausman, M.L. Reed, and N.G. Andrew Factors affecting habitat use and distribution of desert mule deer in an arid environment. Wildlife Society Bulletin 34(3): Marcum, C.L. and M.D. Scott Influences of weather on elk use of spring-summer habitat. Journal of Wildlife Management 49(1): McKinney, T., S.R. Boe, J.C. devos Jr GIS based evaluation of escape terrain and desert bighorn sheep populations in Arizona. Wildlife Society Bulletin. 31(4): Nicholson, M.C., R.T. Bowyer, and J.G. Kie Forage selection by mule deer: does niche breadth increase with population density? Journal of Zoology 269: Pianka, E.R Evolutionary Ecology. New York, NY: Harper and Row. P.468. Smith, R.H. and A. LeCount Some factors affecting survival of desert mule deer fawns. Journal of Wildlife Management 43(3): Stewart, K. M., R. T. Bowyer, J. G. Kie, N. J. Cimon, and B. K. Johnson Temporospatial distributions of elk, mule deer, and cattle: resource partitioning and competitive displacement. Journal of Mammalogy. 83(1): Stewart, K. M., R. T. Bowyer, J. G. Kie, B. L. Dick, and M. Ben-David Niche partitioning among mule deer, elk, and cattle: Do stable isotopes reflect dietary niche? Ecoscience 10: Stewart, K.M., R.T. Bowyer, J.G. Kie, and M.A. Hurley Spatial distributions of mule deer and North American elk: resource partitioning in a sage-steppe environment. American Midland Naturalist. 163(2):
21 7 Torstensen, W. L. F., J. C. Mosley, T. K. Brewer, M. W. Tess, and J. E. Knight Elk, mule deer, and cattle foraging relationships on foothill and mountain rangeland. Rangeland Ecology & Management 59: Vavra, M., M. McInnis, and D. Sheehy Implications of dietary overlap to management of free-ranging large herbivores. Proceedings of the Western Section of the American Society of Animal Science 40: Wasley, T Mule deer population dynamics: issues and influences. Nevada Department of Wildlife, Biological Bulletin No. 14. P.70.
22 8 Chapter 2 Resource Partitioning and Habitat Overlap of Mule Deer and Elk in Eastern Nevada
23 9 Abstract I studied habitat selection and overlap and patterns of spatial distribution for female mule deer (Odocoileus hemionus) and female elk (Cervus elaphus) in eastern Nevada during winter, spring, and summer. My objective was to examine the degree of resource partitioning and habitat overlap between mule deer and elk in a semi-arid environment. I used ecological niche factor analysis (ENFA) implemented in Biomapper software to analyze known locations of radio-collared mule deer and elk and to create habitat suitability maps. I found that both species were commonly found close to roads and that areas with high pinyon-juniper cover were avoided during all seasons. During the summer, mule deer selected for specific elevational ranges and areas close to springs. Elk selected for higher elevations during spring and summer. Steeper slopes and areas closer to springs were also important during summer. I found that habitat use was more restricted during summer than other seasons for both species, indicating that mule deer and elk are more restricted during the summer by availability of water and high quality forage. Introduction Mule deer (Odocoileus hemionus) and elk (Cervus elaphus) are known to co-exist throughout the western states, and concerns about declining mule deer populations have prompted concerns about competition between mule deer and elk (Fuller 1998; Ballard et al. 2001; Stewart et al. 2002; Wasley 2004; Cook et al. 2007; Bishop et al. 2009; Stewart et al. 2010). Many studies have shown resource partitioning between mule deer and elk (Vavra et al. 1989; Stewart et al. 2002; Torstensen et al. 2006; Stewart et al. 2010).
24 10 However, few studies have been conducted in semi-arid conditions (Beck and Peek 2005; Beck et al. 2006), which can dramatically impact resource selection and competition. Mule deer and elk habitat preferences are diverse, species- and season-specific, and often particular to a given study area, making it difficult to determine the interaction between animals and their habitats. In semi-arid environments, low levels of precipitation and frequent drought conditions add to the complexity of understanding ungulate use of their environment and have the potential to increase interspecific competition and resource partitioning. Naturally occurring low levels of precipitation and drought conditions affect body condition, survival, habitat use and distribution for mule deer and elk (Marcum and Scott 1985; McKinney 2003; Bender et al. 2007). In semi-arid environments, plant productivity and nutritional quality are strongly influenced by water availability during the growing season, and in turn influence the overall body condition of mule deer and elk (Smith and LeCount 1979; McKinney et al. 2003; Marshal et al. 2005; Bender et al., 2007). Resource partitioning, or the division of resources among multiple co-occurring species, is generally divided into three categories: temporal, spatial, and dietary (Schwartz and Ellis 1981; Stewart et al. 2002; Mobaek et al., 2009; Stewart et al. 2010). Seasonality likely influences the degree of resource partitioning and the degree of competition between mule deer and elk due to fluctuation of availability high quality habitat. Mule deer and elk separate on multiple niche axes both spatially and temporally along environmental and resource gradients (Stewart et al. 2002; 2010). During autumn and winter months, resources become scarce due to low plant productivity (Cook et al. 2001) and limited access due to snow (Peek et al. 1982; Parker et al. 1984). This
25 11 decrease in productivity and availability may result in increased spatial overlap (Stewart et al. 2002), especially as elk and mule deer populations migrate to lower elevations to avoid snow at higher elevations. During spring and summer months resources are more plentiful and spatial overlap is generally less but may be higher if resources are not limiting. However, the degree of spatial overlap may be less pronounced in semi-arid environments. The combination of these factors may cause overlap on one niche axis but separation on another niche axis (Pinaka 1988) and in some cases force one species to utilize less desirable habitats (Kie et al. 2003). My objective was to examine the degree of resource partitioning and habitat overlap between mule deer and elk in eastern Nevada. I hypothesized that resource partitioning would occur during all seasons but would be most pronounced during the winter due to limited availability of resources. I predicted that distributions of both species would be similar during the winter, when available habitats are restricted, and that distribution during summer would show greater variability. I also predicted that during the summer elk and mule deer would select for more similar habitat variables than during winter or spring, times of year when essential resources are expected to be more limiting. Methods Study Area My field site was located near Ely, Nevada (39.17 N, W) in the Schell Creek Mountain Range. The 5292-km 2 study area ranged in elevation from 1286 to 3980m. Seasonal temperatures range from -9 to 31 C, with an average precipitation of 23cm (Western Regional Climate Center 2008). The study area is managed by the
26 12 Bureau of Land Management and the United States Forest Service, with some private holdings. The area is open to cattle grazing from late May to October; in addition, the area receives hunting pressure for elk and mule deer from late summer into early winter. General habitat types include pinyon-juniper (PJ) stands dominated by singleleaf pinyon (Pinus monophylla Torr. & Frèm.) and Utah juniper (Juniperus osteosperma Torr. (Little)), quaking aspen (Populus tremuloides Michaux), planted and natural meadows, big sagebrush (Artemisia tridentata [Rybd.] Beetle) steppe, and crested wheatgrass (Agropyron cristatum [L.] Garertn) seedings. Species Presence Data A total of 10 female elk and 10 female mule deer were captured July 2005 and fitted with a GPS store-on-board radio collar (Sirtrack Ltd.). Collars were programmed to record a GPS location every 4 hours until retrieval of the collars. One adult female deer was harvested in August (2005), and 1 mule deer collar and 1 elk collar were not recovered. Data downloaded from the collars were randomly subset; one point was randomly sampled for each collar for each day (Stewart et al. 2002). Those data were then sampled to reflect the times of greatest activity for the study species, by selecting only those points that were recorded two hours before or after sunrise and sunset (Stewart et al. 2002). Environmental Variables A total of 8 environmental variables (Table 1.1) were chosen to be used for determining habitat suitability because they have been shown to affect habitat selection of mule deer and elk in other studies (Stewart et al. 2002, Marshal et al. 2006, and Stewart et al ). All of the variables were calculated using ArcGIS (ESRI 2006) and then
27 13 converted to IDRISI (Eastman 1999). Snow depth was calculated using ArcGIS (ESRI 2006) based on slope, aspect, local exposures, and the average wind speed, dominant wind direction, and amount of snowfall for the previous 10 years (Western Regional Climate Center, 2008). Aspect was converted into a measure of northeastness (cos[aspect-45º]). Pinyon and juniper tree crowns were classified from 1-m resolution digital orthophotography quadrangles (DOQ images) from 1996, using ecognition Professional 4.0 software (Definiens Imaging), following the object-oriented classification approach of Greenwood and Weisberg (2009). Tree canopy cover was then aggregated to a 30-m pixel resolution using a neighborhood summation function in ArcGIS (version 9.3). SWReGAP (USGS National Gap Analysis Program 2004) data were used for broad scale vegetation classification, and only areas comprising 1 km 2 or greater were considered for further analysis. Vegetation types considered in the analysis included Intermountain mountain basins big sagebrush shrubland, Intermountain basins montane sagebrush steppe, Great Basin xeric mixed sagebrush shrubland, crested wheatgrass seeding, Intermountain basins mixed salt desert scrub, pinyon and juniper woodlands, Intermountain basin mountain mahogany woodland and shrubland, aspen and mixed conifer woodland, subalpine limber pine and bristlecone pine, and aspen woodlands. Data Analysis I used ecological niche factor analysis (ENFA) implemented in Biomapper software v. 4.0 (Hirzel et al., 2008) to analyze the presence data for each species. This software was chosen for its ability to calculate habitat suitability based on presence-only data (Hirzel et al., 2002). Biomapper uses ENFA to compute habitat suitability (HS)
28 14 maps based on habitat variables that are important for the study species (Hirzel et al. 2002). Habitat suitability maps provide a visual depiction of habitat suitability, as well as a GIS tool for further model exploration. ENFA compares the distribution of the predictor variables between the set of locations where the species is known to have occurred and the global distribution of the study area by summarizing the predictor variables into a few uncorrelated factors (Hirzel et al., 2008). Biomapper computes two parameters to create HS maps: 1.) marginality, which is the difference between the species distribution and the global distribution with respect to a given predictor variable, and 2.) specialization, which is the ratio between the variances of the global distribution and the species distribution (Hirzel et al. 2002). The ENFA provides marginality factors, specialization factors, and habitat suitability maps. The marginality factors indicate whether species habitat requirements differ from the average habitat conditions while the specialization factors indicate the breadth of habitat conditions the species is willing to tolerate. A large marginality factor indicates that the species range is different from the average conditions of the study area, while a large specialization factor indicates that the niche range is narrow. Biomapper was run with all environmental variables listed in Table 1, using the geometric mean algorithm to calculate the habitat suitability (Hirzel and Arlettaz 2003). McArthur s broken stick advice was used to determine the number of factors used in developing the habitat model (MacArthur 1957). Habitat models were developed for each species by season. Seasons were defined using a climograph by grouping months that had similar ranges of temperature, and reflected changes in plant phenology (Stewart et al. 2002; Fig. 1.1). Because autumn was a transitional period and consisted of only a
29 15 single month, I combined autumn and winter samples. This does not account for the importance of autumn as a critical time period for both mule deer and elk for both dietary needs and migration; however, the objectives of the study did not allow for a single month to provide adequate data to examine habitat suitability. Thus, the October through December period was classified as winter, March through May was classified as spring, and June through September was classified as summer (Fig 1.1) Validation The predictive power of the HS maps generated by the habitat model was evaluated using 10-fold cross validation (Fielding and Bell 1997). The k-cross fold validation uses all of the available locations. Animal locations are randomly partitioned into k identically sized groups (10 groups in our study) and k-1 set are used to create the suitability map. This process is repeated k times and each subset is left out one time. The relationships between the observed and expected number of validation points at different habitat suitability values are evaluated to determine the predictive power (Boyce et al. 2002). I used the continuous Boyce index, with a window size of 25 for all model validations within Biomapper to determine the HS maps performance. Biomapper uses a moving window with computation starting with a first class covering the suitability range chosen (i.e. a window size of 25) which contains a proportion of the maps total area and a proportion of validation points (observations left out during the cross-validation), this provides the predicted to expected frequency. Then the moving window is shifted a small amount upwards and the predicted to expected ratio is again calculated. The Boyce index is finally computed by the Spearman s rank between the PE and the class rank,
30 16 varying from 1 to 1, with 0 indicating a random model (Boyce et al. 2002; Hirzel et al. 2006). Results Spatial Distributions Mule Deer During winter, mule deer selected for areas of gradual slope but across a broad range of elevations, and avoided areas with high pinyon and juniper tree cover (Table 1.2). During the winter mule deer also selected for areas close to roads. Selection for areas of steeper slopes and avoidance of areas with higher pinyon and juniper tree cover continued during the spring. During the summer, I found that mule deer selected for areas of higher elevation and closer to springs. The specialization factors indicate that mule deer were sensitive to slope, elevation, and distance to springs during all seasons (Table 1.3). During summer, however, mule deer habitat use appeared confined to a narrow range of environmental conditions for pinyon and juniper tree cover, distance to roads, distance to springs, and aspect (Figures 1.3, 1.4, and 1.5). Mule deer had a more restricted range of habitat conditions during the summer than in the spring or winter (Table 1.4 and Figures 1.3, 1.4, and 1.5). Habitat suitability maps provide a visual representation of the seasonal expansion and contraction of mule deer habitat within the study area (Figure 1.2). Model validation for mule deer during the winter indicates that this model performed better than the random model. The spring model performed only slightly better than the random model, while the summer model performed much better than the random model (Table 1.5)
31 17 Elk Elk habitat selection during the spring was driven by selection for areas at higher elevation and areas closer to roads. During the summer elk selected for areas at higher elevation with steeper slopes (Table 1.2). The specialization factors indicate that elk were sensitive to the distance to streams during all seasons. Slope, elevation, and distance to springs were important during the spring and summer. Distance to roads was important only during the summer (Table 1.3). Both elk and deer were more selective in their habitat requirements in summer than in spring, although mule deer exhibited the higher degree of specialization (Table 1.4). Model validation for elk during the winter indicates that this model did not perform better than the random model, and was dropped from further analysis. Lack of model performance is likely caused elk by being generalist during the winter in regards to suite environmental variables examined and therefore selection was not occurring at a level that was able to be detected. The spring model performed only slightly better than the random model, while the summer model performed much better than the random model (Table 1.5) Habitat Overlap Areas that were predicted to be of greatest habitat suitability (i.e. top 25%) for elk and mule deer were examined for spatial overlap using GIS overlays of predictive habitat suitability maps. During the spring, deer had approximately 243 km 2 of high-quality habitat, elk had approximately 280 km 2 high-quality habitat. Of the total area of highquality habitat, only 55 km 2 were shared by mule deer and elk. Mule deer used steeper slopes than elk, while elk used higher elevations (Figures 1.2 and 1.4). During the
32 18 summer, mule deer had 11 km 2 of high-quality habitat, while elk had 109 km 2. There was a total of 3 km 2 of prime habitat that was used by both species (Table 1.6). However, during the summer elk used steeper slopes than mule deer. Elk continued to use higher elevations than mule deer, and mule deer were confined to a narrower range of elevations (approximately 2300m to 2500m) (Figure 1.5). Vegetation types were then identified within areas of prime habitat for mule deer and elk (Table 1.7). During the winter, deer used a total of 16 vegetation types, while elk only used 7 vegetation types. Both utilized big sagebrush shrublands, montane sagebrush steppe, xeric mixed sagebrush shrublands, and pinyon and juniper woodlands. During spring, the number of vegetation types used decreased to 5 for mule deer, while the number used by elk remained the same as for winter. During the spring, both species continued to utilize the same vegetation types as during the winter with the addition of mountain mahogany woodlands and shrublands. Elk also utilized two additional vegetation types, crested wheatgrass seeding and a mixed salt desert scrub. During the summer, mule deer used 6 vegetation types, while elk used 4 vegetation types. The only shared vegetation type was montane sagebrush steppe. Mule deer prime habitat consisted primarily of montane sagebrush steppe and pinyon and juniper woodlands. Prime elk habitat consisted of montane sagebrush steppe, pinyon and juniper woodlands, and mountain mahogany woodlands and shrublands. Discussion It is important to identify the factors that influence habitat selection in areas with environmental extremes. Processes of segregation may be most distinct, and hence amenable to study, in environments with severe resource limitation. Semi-arid
33 19 environments add to the complexity of understanding resource selection and habitat overlap. In the present study, I examine habitat variables that are known to effect mule deer and elk resource selection and habitat overlap. In particular I examined only those time periods in which mule deer and elk are most likely to be actively foraging. By focusing on only active foraging times, habitats used for other purposes are likely to underrepresented. My findings for mule deer selection during winter for elevation and slope are similar to other studies (Poole and Mowat 2005; Stewart et al. 2010). Elevation and slope are often correlated to snow depth (Poole and Mowat 2005; Keating et al. 2007) and selection for less steep areas at lower elevations is interpreted as mule deer avoiding areas of high snow depth. However, my proxy variable for snow depth did not contribute significantly to the mule deer winter habitat model, indicating either that snow depth was not a driving factor in mule deer habitat selection in my study area, or that snow depth was inadequately estimated by my topographically defined algorithm. Areas of high pinyon and juniper cover were avoided, but areas with low pinyon-juniper cover or areas that were adjacent to denser pinyon-juniper stands were used, which is consistent with other studies (Anderson et al. 2005). Mule deer and elk selected particular habitats during the spring. I found that mule deer and elk differed in their use of slopes, elevations, and distance to roads. Mule deer used areas of steeper slopes than elk. Other studies have documented that mule deer and elk have exhibited segregation by selecting areas of differing slopes (Stewart et al. 2002). Elk used a more restricted range of elevation than mule deer, which is consistent with the findings of Stewart et al. (2010). The restricted elevation use may have been a result of
34 20 selectivity for certain forage types from spring green up. Both species were found closer to roads than expected and unlike other studies, elk were found closer to roads than mule deer (Johnson et al. 2000; Stewart et al. 2010) During the summer, mule deer used an extremely narrow elevational range and were found close to springs. Selection for elevation and distance from springs may be related, as many of the springs are located at higher elevations. Nevertheless, this does not completely explain the small range of elevation used by mule deer. I hypothesize that habitat preferences for a small range of elevation and proximity to springs is driven by the lack of available water sources and the propensity of high quality forage near water sources. In addition, areas near water sources often have taller grasses and shrubs which can provide hiding cover. The requirement for high quality vegetation during lactation may strongly influence habitat selection of female mule deer during the summer. Summer forage intake rates have a great effect on black-tailed deer (Odocoileus hemionus columbianus) condition and elk (Parker 1988; Peek et al. 2002; Stewart et al. 2005) and the same is likely true for mule deer. In addition, mule deer that have fawns may be selecting for areas that are not favored by coyotes which can include factors such as hiding cover, elevation, and steepness slopes during the time period when their fawns are most susceptible to predation (Riley and Dood 1984; Fox and Krausman 1994; Bleich 1997; Brunjes et al. 2007). Cattle and sheep grazing occur in portions of the study area during all seasons. The presence of cattle can influence resource selection and may cause avoidance of otherwise favorable habitats by mule deer and elk (Stewart et al. 2003; Beck and Peek 2005; Torstensen et al. 2006; Cooper et al. 2008). Although I was unable to investigate
35 21 the influence of cattle and sheep on habitat selection behavior of mule deer and elk, I suspect that their presence likely had an effect. Both species selected for areas that were generally nearer to roads and in some cases they were found to be using the road itself in all seasons. This is counter to what most studies have found (Perry and Overly 1976; Morgantini and Hudson 1979; Thomas et al. 1979; Irwin and Peek 1983; Wisdom 1998; Wisdom et al. 2004; Sawyer et al. 2007, Stewart et al. 2010). However, if the type of road and the level of traffic that the road receives are taken into account my findings are similar to the other studies. I found that mule deer were farther from roads than elk during the spring, but during the summer mule deer were closer to roads than elk. Johnson et al. (2000) reported that mule deer use areas closer to roads than elk, as a means to avoid elk. Mule deer may also use areas near roadside due to greater cover associated with roadsides. I believe that in my study area the relationships among mule deer, elk, and distance roads are more complex and are related to the level of traffic levels. I included paved roads (323 miles), maintained dirt roads (2,171 miles), closed and abandoned roads, and seldom-used two-tracks (8,345 miles). The degree to which mule deer or elk avoid roads is likely influenced by the amount of motorized traffic the road receives (Naylor et al. 2009). Throughout the year, motorized traffic within the study area is primarily limited to paved highways. Some of the maintained dirt roads and two-tracks are only seasonally accessible due to snowy and muddy conditions. These roads are only used sparingly by the local human population and are less likely to be avoided by wildlife (Stubblefield et al. 2006; Gagnon et al 2007). In addition local land management agencies have closed some of the two-track roads, and as these roads no longer are accessible for motorized vehicles there is little reason for
36 22 mule deer or elk to avoid these areas. Roads that receive little traffic provide travel corridors for elk and mule deer. The energy expenditure is less for traveling along a road than it is when an animal traveling through brush, in a manner inversely related to body size (Parker et al. 1984). Areas of high pinyon and juniper cover were avoided, but areas with low pinyonjuniper cover and areas that were adjacent to denser pinyon-juniper stands were used during all seasons. Nutritional condition is negatively related to the amount of pinyonjuniper (Bender et al. 2007; Hallbritter and Bender 2011). Pinyon-juniper communities that have high canopy cover produce little vegetation due to competition for water, lack of sunlight for understory vegetation, litter accumulation, phytotoxic exudates from roots, and binding of nutrients (Miller et al. 1979; Schott and Pieper 1985; Dahms and Geils, 1997). However, areas adjacent to denser pinyon-juniper woodlands or that have low cover of pinyon-juniper can provide security cover (Bender et al. 2007). These areas may also be important for thermal cover for mule deer during the summer (Bowyer and Kie 2009), but Cook et al. (1998) found that thermal cover did not provide energetic benefits for elk during winter. However, these areas have also been shown to be preferred by elk (Anderson et al. 2005) and by white-tailed deer (Odocoileus virginianus) during drought (Grovenberg et al. 2011). During the winter months open canopy pinyon-juniper woodlands may provide increased access for foraging and lower energetic cost for movement as the canopy can prevent heavy snow accumulation on the ground. In addition, open canopy pinyon-juniper woodlands can be associated with increased available ground water, which translates to increased forage in some areas. Our results
37 23 suggest that, in this semi-arid ecosystem, some degree of tree cover is an important component of habitat mosaics preferentially selected by both elk and mule deer. In addition I expected to find that mule deer would have more restricted habitat use than elk, and that both species would select for a narrow range of habitat conditions within their critical winter range. However, I found that habitat use was more restricted during the summer for both species, suggesting that the dry summer season may be more limiting in semi-arid environment. Mule deer in particular may be more limited during the summer by availability of water and high quality forage. Mule deer exhibited greater specialization during the summer than elk. This finding is counter to the findings of Stewart et al. (2010) for mule deer and elk in southeastern Idaho, who found that mule deer were more widely distributed than elk; however this was not a water limited ecosystem. Management Implications I found evidence that mule deer and elk avoid areas of high pinyon-juniper cover during all seasons, but do utilize areas that have low levels of pinyon-juniper cover. Mule deer and elk also appeared to be more limited during the summer months possibly by water and high quality forage than during the winter. Focusing habitat restoration efforts in areas with moderate pinyon-juniper to decrease pinyon-juniper cover and maintaining mosaics of trees and shrub steppe may increase the available habitat for both species. This may also increase available summer habitat for both species. The propensity of mule deer and elk to use seldom traveled roads, i.e. two-tracks, may provide additional travel corridors. As travel management plans are implemented for federal lands that close off some two-tracks new travel corridors may be created. If
38 24 habitat restoration projects were preferentially located along these travel corridors a larger useable area of high quality habitat could perhaps be created for both species.
39 25 Literature Cited Anderson, D. P., J.D. Forester, M.G. Turner, J.L. Frair, E.H. Merrill, D. Fortin, J.S. Mao, and M.S. Boyce Factors influencing female home range sizes in elk (Cervus elaphus) in North American landscapes. Landscape Ecology 20: Ballard, W.B., D. Lutz, T.W. Keegan, L.H. Carpenter, and J.C. DeVos Jr Deerpredator relationships: a review of recent North American studies with emphasis on mule and black-tailed deer. Wildlife Society Bulletin 29: Beck, J.L. and J.M. Peek Diet composition, forage selection, and potential for forage competition among elk, deer, and livestock on aspen-sagebrush summer range. Rangeland Ecology and Management. 58(2): Bender, L.C., L.A. Lomas, and J. Browning Condition, survival and causespecific mortality of adult female mule deer in north-central Mexico. Journal of Wildlife Management 71(4): Bishop, C.J., G.C. White, D.J Feddy, B.E Watkins, and T.R. Stephenson Effect of enhanced nutrition on mule deer population rate of change. Wildlife Monographs 172:1-28. Bleich, V.C., R.T. Bowyer, and J.D. Wehausen Sexual segregation in mountain sheep: resources or predation? Wildlife Monographs 134:1-50. Boyce, M. S., P. R. Vernier, S. E. Nielson, and F. K. A. Schmiegelow Evaluating resource selection functions. Ecological Modeling 157: Bowyer, R.T. and J.G. Kie Thermal landscapes and resource selection by blacktailed deer: implications for large herbivores. California Fish and Game 95(3):
40 26 Brunjes, K. J., W. B. Ballard, M. H. Humphrey, F. Harwell, N. E. Mcintrye, P. R. Krausman, M. C. Wallace Habitat use by sympatric mule and white-tailed deer in Texas. Journal of Wildlife Management 70(5): Cook, J.G., L.L. Irwin, L.D. Bryant, R. A. Riggs, J.W. Thomas. Relations of forest cover and condition of elk: a test of thermal cover hypothesis in summer and winter. Wildlife Monographs 141: Cook, R.C., J.G. Cook, D.L. Murray, P. Zager, B.K. Johnson, and M.W. Gratson Development of predictive models of nutritional condition for Rocky Mountain elk. Journal of Wildlife Management 65(4): Cook, R.C., T.R. Stephenson, W.L. Myers, J.G. Cook, and L.A. Shipley Validating predictive models of nutritional condition for mule deer. Journal of Wildlife Management 71: Cooper, S.M., H.L. Perotto-Baldivieso, M.K. Ownes, M.G. Meek, and M. Figueroa- Pagan Distribution and interaction of white-tailed deer and cattle in a semi-arid grazing system. Agriculture Ecosystems and Environment 127(1-2): Connell, J.H Diversity and the coevolution of competitors, or the ghost of competition past. Oikos. 35(2): Dahms, C.W. and B.W. Geils. Technical editors An assessment of forest ecosystem health in the southwest. United States Department of Agriculture Forest Service, Rocky Mountain Forest and Range Experiment Station, Southwestern Region, General Technical Report RM-GTR-295:1-97.
41 27 Eastman, J.R., Worcester, Clark University. URL: Fielding, A. H. and J. F. Bell A review of methods for the assessment of prediction errors in conservation presence/absence models. Environmental Conservation 24(1): Fox, K. B. and P. R. Krausman Fawning habitat of desert mule deer. Southwestern Naturalist 39: Fuller, A A history of mule deer in northwestern Arizona. Proc. West Assoc. Fish Widl. Agen. 78: Gagnon, J. W., T. C. Theimer, N. L. Dodd, S. Boe, and R. E. Schweinsburg Traffic volume alters elk distribution and highway crossings in Arizona. Journal of Wildlife Management 71(7): Greenwood, D. L. and P. J. Weisberg GIS-Based modeling of pinyon-juniper woodland structure in the Great Basin. Forest Science 55:1-12. Grovenburg, T. W., C. N. Jacques, R. W. Klaver, and J. A. Jenks Drought effect on selection of conservation reserve program grasslands by white-tailed deer on the northern Great Plains. American Midland Naturalist 166: Halbritter, H. and L.C. Bender Quality of habitat occupied by elk (Cervus elaphus) in the southern Sacramento Mountains, New Mexico. Southwestern Naturalist 56(1):1-8. Hirzel, A., H. Hausser, D. Chessel, and N. Perrin Ecological niche factor analysis: how to compute habitat-suitability maps without absence data. Ecology 83(7):
42 28 Hirzel, A.H. and R. Arlettaz Modeling habitat suitability for complex species distributions by environmental-distance geometric mean. Environmental management. 32(5): Hirzel, A.H., G. Le Lay, V. Helfer, C. Randing, and A. Guisan Evaluating the ability of habitat suitability models to predict species presences. Ecological Modeling 199(2): Hirzel, A.H., J. Hausser, and N. Perrin Biomapper 4.0. Lab. of Conservation Biology, Department of Ecology and Evolution, University of Lausanne. URL: Irwin, L. L. and J. M. Peek Elk habitat use relative to forest succession in Idaho. Journal of Wildlife Management 47: Johnson, B.K., J.W. Kern, M.J. Wisdom, S.L. Findholt, and J.G. Kie Resource selection and spatial separation of mule deer and elk during spring. Journal of Wildlife Management 64(3): Keating, K. A., P. J. P Gogan, J. M. Vore, and L. R. Irby A simple solar radiation index for wildlife habitat studies. Journal of Wildlife Management 71(4): Kie, J. G., R. T. Bowyer, K.M. Stewart Ungulates in western coniferous forests: habitat requirements, population dynamics, and ecosystem processes. In: C. J. Zabel and R. G. Anthony editors. Mammal community dynamics; Management and conservation in the coniferous forests of western North America. New York, NY, USA: Cambridge University Press. p Pianka, E. R Evolutionary Ecology. New York, NY: Harper and Row. p.468.
43 29 MacArthur, R.H On the relative abundance of bird species. Proc. Natl. Acad. Sci 43: Marcum, C.L. and M.D. Scott. Influences of weather on elk use of spring-summer habitat Journal of Wildlife Management 49(1): Marshal, J.P., VC. Bleich, P.R. Krausman, M.L. Reed, and N.G. Andrew Factors affecting habitat use and distribution of desert mule deer in an arid environment. Wildlife Society Bulletin 34(3): McKinney, T., S.R. Boe, J.C. devos Jr GIS based evaluation of escape terrain and desert bighorn sheep populations in Arizona. Wildlife Society Bulletin. 31(4): Miller, H.G., J.M. Cooper, J.D. Miller, and O. Pauline Nutrient cycles in pine and their adaptation to poor soils. Canadian Journal of Forest Research 9: Mobaek, R., A. Mysterud, L. E. Loe, O. Holand, and G. Austrheim Density dependent and temporal variability in habitat selection by a large herbivore; an experimental approach. Oikos 188: Morgantini, L. E., and R. J. Hudson Human disturbance and habitation selection in elk. Pages in M. S. Boyce and L. D. HaydenWing, editors. North America elk: ecology, behavior, and management. Proceedings of a symposium on elk ecology and management. University of Wyoming, Laramie, USA. Naylor, L.M., M.J. Wisdom, and R.G. Anthony Behavioral responses of North American Elk to recreational activity. Journal of Wildlife Management 73(3):
44 30 Parker, K.L., C.T. Robbins, and T.A. Hanley Energy expenditures for locomotion by mule deer and elk. Journal of Wildlife Management 48(2): Parker, K. L Effects of heat, cold, and rain on coastal black-tailed deer. Canadian Journal of Zoology 66: Peek, J.M., M.D. Scott, L.J. Nelson, D.J. Pierce, L.L. Irwin Role of cover in habitat management for big game in northwestern United-States. Transactions of the North American wildlife and natural resources conference 47: Peek, J. M., B. Dennis, and T. Hersey Predicting population trends of mule deer. Journal of Wildlife Management 57: Perry, C. and R. Overly Impacts of roads on big game distribution in portions of the Blue Mountains of Washings. Pages in S. R. Hieb, editor. Proceedings of the elk logging roads symposium. Forestry Wildlife and Range Experiment Station, University of Idaho, Moscow, USA. Poole, K.G. and G. Mowat Winter habitat relationships of deer and elk in temperate interior mountains of British Columbia. Wildlife Society Bulletin 33: Riley, S.T. and A. R. Dood Summer movements, home range, habitat use, and behavior of mule deer fawns. Journal of Wildlife Management 48(4): Sawyer, H., R.M. Nielson, F.G Lindzey, L. Keith, J. H. Powell and A. A. Abraham Habitat selection of rocky mountain elk in a nonforested environment. Journal of Wildlife Management. 71(3):
45 31 Schwartz, C.C. and J.E. Ellis Feeding ecology and niche separation in some native and domestic ungulates on the shortgrass prairie. Journal of Applied Ecology 18(2): Schott, M.R. and R.D. Pieper Influence of canopy characteristics of one-seed juniper on understory grasses. Journal of Range Management 38: Smith, R.H. and A. LeCount Some factors affecting survival of desert mule deer fawns. Journal of Wildlife Management 43(3): Stewart, K. M., R. T. Bowyer, J. G. Kie, N. J. Cimon, and B. K. Johnson Temporospatial distributions of elk, mule deer, and cattle: resource partitioning and competitive displacement. Journal of Mammalogy. 83(1): Stewart, K. M., R. T. Bowyer, J. G. Kie, and M. A Hurley Spatial Distributions of mule deer and north American elk: Resource partitioning in a sage-steppe environment. American Midland Naturalist 163: Stubblefield, C. H., K. T. Vierling, and M. A. Rumble Landscape-scale attributes of elk centers of activity in the central Black Hills of South Dakota. Journal of Wildlife Management 70(4): Thomas, J.W., H. Black, Jr., R. J. Scherzinger, and R. J. Pedersen Deer and elk. Pages in J. W. Thomas, technical editor. Wildlife habitats in managed forests the Blue Mountains of Oregon and Washington. U. S. Department of Agriculture, Agriculture Handbook, 553 Washington, D. C., USA. Torstensen, W. L. F., J. C. Mosley, T. K. Brewer, M. W. Tess, and J. E. Knight Elk, mule deer, and cattle foraging relationships on foothill and mountain rangeland. Rangeland Ecology & Management 59:80-87.
46 32 USGS National Gap Analysis Program Provisional Digital Land Cover Map for the Southwestern United States. Version 1.0. RS/GIS Laboratory, College of Natural Resources, Utah State University. Vavra, M., M. McInnis, and D. Sheehy Implications of dietary overlap to management of free-ranging large herbivores. Proceedings of the Western Section of the American Society of Animal Science 40: Wasley, T Mule deer population dynamics: issues and influences. Nevada Department of Wildlife, Biological Bulletin No. 14. P.70. Western Regional Climate Center Desert Research Institute, Reno, NV. Wisdom, M. J Assessing life-stage importance and resource selection for conservation of selected vertebrates. Dissertation, University of Idaho, Moscow, USA. Wisdom, M. J., A. A. Ager, H. K. Preisler, N. J. Cimon, and B. K. Johnson Effects of off-road recreation on mule deer and elk. Transactions of the North American Wildlife and Natural Resources Conference 69:
47 33 Tables Table 1. Environmental predictor variables used to determine habitat use and overlap between mule deer and elk, and the transformation used for each variable. Environmental Variable Transformation Slope Square Root Elevation Box Cox Tree Cover Square Root Distance to Roads Box Cox Distance to Springs Square Root Snow Depth Square Root Distance to Streams Square Root Aspect -
48 34 Table 2. Overall marginality for each environmental variable examined for mule deer and elk during winter, spring, and summer. Marginality values indicate whether the species habitat differs from the average habitat conditions in the study area. Bolded variables indicate variables that contribute the most to each factor or component of overall suitability. The elk winter model is not included due to poor model performance. Species and Season Environmental Variables Slope Elevation Tree Cover Distance to Roads Distance to Springs Snow Depth Distance to Streams Aspect DEER Winter Spring Summer < ELK Spring Summer <
49 35 Table 3. Overall specialization for each environmental variable examined for mule deer and elk during winter, spring, and summer. Specialization factors indicate the breadth of the habitat conditions the species is willing to tolerate. Bolded variables indicate variables that contribute the most to each factor or component of overall suitability. The elk winter model is not included due to poor model performance. Species and Season Environmental Variables Slope Elevation Tree Cover Distance to Roads Distance to Springs Snow Depth Distance to Streams Aspect DEER Winter Spring Summer ELK Spring Summer Table 4. Overall Marginality and specialization values for mule deer and elk for winter, spring, and summer. Larger marginality values indicate that the species range is different than average conditions in the study area, and large specialization factors indicate that species niche is narrow. Elk winter values are not included due to poor model performance. Species and Season Marginality Specialization DEER Winter Spring Summer ELK Spring Summer
50 36 Table 5. Boyce index for mule deer and winter for winter, spring, and summer for habitat suitability models. A Boyce index of 0 indicates that the model did not different from the random model. The elk winter model was dropped due to poor model performance. Species and Season Boyce index Standard deviation DEER Winter Spring Summer ELK Winter Spring Summer
51 37 Table 6. Amount of habitat (km 2 ) for each habitat suitability classification for mule deer and elk in winter, spring, and summer. Habitat suitability is divided into 4 categories, low, moderate, good, and prime habitat. The elk habitat suitability model for winter is not included due to poor model performance. WINTER Low Deer Habitat (0-25) Moderate Deer Habitat (26-50) Good Deer Habitat (51-75) Prime Deer Habitat (76-100) Total SPRING Low Deer Moderate Deer Good Deer Prime Deer TOTAL Habitat (0-25) Habitat (26-50) Habitat (51-75) Habitat (76-100) Low Elk Habitat (0-25) Moderate Elk Habitat (26-50) Good Elk Habitat (51-75) Prime Elk Habitat (76-100) TOTAL SUMMER Low Deer Moderate Deer Good Deer Prime Deer TOTAL Habitat (0-25) Habitat (26-50) Habitat (51-75) Habitat (76-100) Low Elk Habitat (0-25) Moderate Elk Habitat (26-50) Good Elk Habitat (51-75) Prime Elk Habitat (76-100) TOTAL
52 38 Table 7. Vegetation types from SWReGAP for high suitability habitat for winter, spring, and summer for mule deer and elk. Only vegetation types that made up 11km 2 were included. Habitat type is split into two categories, based on the dominate vegetation type: shrublands and woodlands. Species Habitat type (km 2 used) Shrublands Woodlands WINTER Elk and Deer Deer SPRING Elk and Deer Deer Elk SUMMER Elk and Deer Deer Elk Intermountain Mountain Basins Big Sagebrush Shrubland Intermountain Basins Montane Sagebrush Steppe Great Basin Xeric Mixed Sagebrush Shrubland Crested Wheatgrass Seeding 5 1 Great Basin Foothill and Lower Montane Riparian Woodland and Shrubland 2 Intermountain Basins Greasewood Flats 2 Intermountain Basins Mixed Salt Desert Scrub 11 2 Pinyon and Juniper Woodland Intermountain Basins Mountain Mahogany Woodland and Shrubland Aspen and Mixed Conifer Woodland 3 38 Montane Mesic Mixed Conifer Woodland Dry Mesic Mixed Conifer Woodland 2 Subalpine Spruce Woodland 1 Dry Mesic Spruce and Fir Woodland 1 Subalpine Limber Pine and Bristlecone Pine woodland 13 1 Aspen Woodland 5
53 39 Figure Legend Figure 1. Climograph of mean monthly temperature and precipitation used to define seasons for Ely, Nevada Solid lines indicate months and dotted lines separate seasons. Figure 2. Habitat suitability maps for mule deer. Green indicates low quality habitat, orange inidates medium quaity habitat, and red indicates high quality habitat. Figure 3. Box plots presenting the distributions among sites at which mule deer were present and the entire study site during the winter months for the predictor variables contributing to mule deer habitat suitability. Predictor variables are a.) slope, b.) elevation, c.) pinyon-juniper cover, d.) distance from road, and e.) distance from spring. Figure 4. Box plots presenting the distributions among sites at which mule deer and elk were present and the entire study site during the spring months for the predictor variables contributing to mule deer habitat suitability. Predictor variables are a.) slope, b.) elevation, c.) pinyon-juniper cover, d.) distance from road, and e.) distance from spring. Figure 5. Box plots presenting the distributions among sites at which mule deer and elk were present and the entire study site during the summer months for the predictor variables contributing to mule deer habitat suitability. Predictor variables are a.) aspect, b.) distance from stream, c.) elevation, d.) pinyon-juniper cover, e.) distance from road, f.) slope, and g.) distance from spring. Figure 6. Habitat suitability map depicting the difference in mule deer and elk habitat selection during the spring and summer. During the spring mule deer used slopes varying from 4 to 17% and elevations from 2400 to 19950m. Elk used slopes varying from 2 to
54 40 12% and elvations from 2400 to 2050m. During the summer mule deer used slopes varying from 9 to 16% and elevations from 2300 to 2500m and elk used slopes varying from 5 to 18% and elevations from 2100 to 2700m. Green indicates low habitat overlap, orange indicates moderate habitat overlap, and red indicates high overlap.
55 Figure 1. 41


56 42 Figure 2. Deer Winter Deer Spring Deer Summer Elk Spring Elk Summer
57 43 Figure 3. a.) b.) c.) d.) e.)
58 44 Figure 4. a.) b.) c.) d.) e.)
 c.) d.) e.) f.) g.")
59 45 Figure 5. a.) b.) c.) d.) e.) f.) g.)


60 46 Figure 6. Spring Summer
A Review of Mule and Black-tailed Deer Population Dynamics
 A Review of Mule and Black-tailed Deer Population Dynamics Tavis Forrester and Heiko Wittmer Wildlife, Fish & Conservation Biology University of California, Davis Background Role of predation in mule deer
Competition. Competition. Competition. Competition. Competition. Competition. Competition. Long history in ecology
 Two species use the same limited resource or harm one another while seeking a resource Resource Organisms use common resources that are in short supply Resource Interference Interference Organisms seeking
Ecology and Environmental Impact of Javan Rusa Deer (Cervus timorensis russa) in the Royal National Park
 in the Royal National Park") Ecology and Environmental Impact of Javan Rusa Deer (Cervus timorensis russa) in the Royal National Park Andrew James Moriarty B. App. Sc. (Hons.) A thesis submitted in fulfillment of the requirements
Ecology and Environmental Impact of Javan Rusa Deer (Cervus timorensis russa) in the Royal National Park Andrew James Moriarty B. App. Sc. (Hons.) A thesis submitted in fulfillment of the requirements
Deer Management Unit 252
 Deer Management Unit 252 Geographic Location: Deer Management Unit (DMU) 252 is 297 miles 2 in size and is primarily in southeastern Marquette, southwestern Alger and northwestern Delta County. This DMU
2012 Kootenay-Boundary Mule Deer Management Plan: Outline and Background Information
 2012 Kootenay-Boundary Mule Deer Management Plan: Outline and Background Information The Ministry of Forests, Lands and Natural Resource Operations is currently developing a mule deer management plan for
FIVE YEAR SUMMARY OF EAST REGION WILDLIFE RESEARCH PROGRAM
 FIVE YEAR SUMMARY OF EAST REGION WILDLIFE RESEARCH PROGRAM The Oregon Department of Fish & Wildlife (ODFW) Statewide Research Grant consists of multiple programs that investigate issues related to the
Evaluating the Influence of Development on Mule Deer Migrations
 2013 Annual Report Evaluating the Influence of Development on Mule Deer Migrations Teal Wyckoff 1,2, Matt Kauffman 3, Hall Sawyer 4, Shannon Albeke 2 1 Wyoming Cooperative Fish and Wildlife Research Unit,
Subject: Scoping Comments Ochoco Summit OHV Trail Project
 Bill Richardson Oregon & Washington Lands Program Manager Rocky Mountain Elk Foundation 24550 Ervin Road Philomath OR 97370 866-399-6089 office 541-760-5083 cell brichardson@rmef.org December 21, 2009
2009 Update. Introduction
 29 Update Introduction The Wyoming Game & Fish Department, the University of Wyoming, and the U.S. Fish & Wildlife Service initiated the Absaroka Elk Ecology Project in January 27. Objectives of this project
Spatial and Temporal Interactions of Elk, Mule Deer, and Cattle Introduction
 Coe et al. 1 Spatial and Temporal Interactions of Elk, Mule Deer, and Cattle Priscilla K. Coe 1, Bruce K. Johnson, Kelley M. Stewart, and John G. Kie Introduction Elk (Cervus elaphus), mule deer (Odocoileus
Deer Management Unit 152
 Deer Management Unit 152 Geographic Location: Deer Management Unit (DMU) 152 is 386 miles 2 in size and is primarily in southwestern Marquette County. This DMU falls within the moderate snowfall zone and
Summary of discussion
 Tweedsmuir Caribou Modelling Project: Caribou Population Ecology Meeting Notes held March 5, 2008 Participants: Mark Williams, Debbie Cichowski, Don Morgan, Doug Steventon, Dave Daust Purpose: The purpose
Diet Composition, Dry Matter Intake, and Diet Overlap of Mule Deer, Elk, and Cattle
 Findholt et al. 1 Diet Composition, Dry Matter Intake, and Diet Overlap of Mule Deer, Elk, and Cattle Scott L. Findholt 1, Bruce K. Johnson, Daalkhaijav Damiran, Tim DelCurto, and John G. Kie Mule deer
Deer-Elk Ecology Research Project
 Deer-Elk Ecology Research Project 2016 Summer Update Spring helicopter captures for the DEER Project wrapped up in late April this year. Given concerns about potentially missing migratory animals that
Population Ecology Yellowstone Elk by C. John Graves
 Population Ecology Yellowstone Elk by C. John Graves Group Names: Hour Date: Date Assignment is due: end of class Score: + - Day of Week Date Rocky Mountain elk (Cervus elaphus) living in Yellowstone National
Mule and Black-tailed Deer
 Mule and Black-tailed Deer Mule and Black-tailed Deer: Because mule deer are closely tied to the history, development, and future of the West, this species has become one of the true barometers of environmental
Factors Influencing Cattle, Elk, and Mule Deer Distribution in Managed Forests
 Factors Influencing Cattle, Elk, and Mule Deer Distribution in Managed Forests Marty Vavra SUMMARY Intensive research involving elk, mule deer, and cattle has been conducted on the Starkey Experimental
FISHERIES BLUE MOUNTAINS ADAPTATION PARTNERSHIP
 FISHERIES A warming climate, by itself, substantially affects the hydrology of watersheds in the Blue Mountains. Among the key hydrologic changes projected under all scenarios for the 2040s and beyond
021 Deer Management Unit
 021 Deer Management Unit Geographic Location: Deer Management Unit (DMU) 021 is 1,464 square miles in size and is located in the central Upper Peninsula (UP). This DMU is dominated by publicly owned land
Identifying mule deer migration routes to and from the Pinedale Anticline Project Area
 Identifying mule deer migration routes to and from the Pinedale Anticline Project Area Prepared For: University of Wyoming School of Energy Resources Dept. 3012, 1000 E. University Ave. Laramie, WY 82071
TEMPOROSPATIAL DISTRIBUTIONS OF ELK, MULE DEER, AND CATTLE: RESOURCE PARTITIONING AND COMPETITIVE DISPLACEMENT
 Journal of Mammalogy, 83(1):229 244, 2002 TEMPOROSPATIAL DISTRIBUTIONS OF ELK, MULE DEER, AND CATTLE: RESOURCE PARTITIONING AND COMPETITIVE DISPLACEMENT KELLEY M. STEWART, R. TERRY BOWYER,* JOHN G. KIE,
Record of a Sixteen-year-old White-tailed Deer (Odocoileus virginianus) in Carbondale, Illinois: a Brief Note.
 in Carbondale, Illinois: a Brief Note.") Southern Illinois University Carbondale OpenSIUC Publications Department of Zoology 2011 Record of a Sixteen-year-old White-tailed Deer (Odocoileus virginianus) in Carbondale, Illinois: a Brief Note. Clayton
Southern Illinois University Carbondale OpenSIUC Publications Department of Zoology 2011 Record of a Sixteen-year-old White-tailed Deer (Odocoileus virginianus) in Carbondale, Illinois: a Brief Note. Clayton
Sierra Nevada Bighorn Sheep Proposal
 Sierra Nevada Bighorn Sheep Proposal Emily Cline Background: The Sierra Nevada bighorn sheep population began being threatened as early as the 1850s with the arrival of gold miners to the Sierra Nevada
DEER AND ELK POPULATION STATUS AND HARVEST STRUCTURE IN WESTERN NORTH AMERICA: A SUMMARY OF STATE AND PROVINCIAL STATUS SURVEYS.
 DEER AND ELK POPULATION STATUS AND HARVEST STRUCTURE IN WESTERN NORTH AMERICA: A SUMMARY OF STATE AND PROVINCIAL STATUS SURVEYS. JUSTIN BINFET,' Wyoming Game and Fish Department, 5400 Bishop Boulevard,
The Role and Economic Importance of Private Lands in Providing Habitat for Wyoming s Big Game
 March 2004 B-1150 The Role and Economic Importance of Private Lands in Providing Habitat for Wyoming s Big Game By Roger Coupal, Department of Agricultural and Applied Economics; Gary Beauvais, Wyoming
The interaction of livestock and wildlife on rangeland. Dietary Composition and Conflicts of Livestock and Wildlife on Rangeland INTRODUCTION
 B-1260 November 2014 Dietary Composition and Conflicts of Livestock and Wildlife on Rangeland Derek Scasta, Assistant Professor and Extension Rangeland Specialist INTRODUCTION The interaction of livestock
Mule deer foraging preference among five sagebrush (Artemisia L.) taxa
 taxa") Western North American Naturalist Volume 61 Number 4 Article 13 11-15-2001 Mule deer foraging preference among five sagebrush (Artemisia L.) taxa Carl L. Wambolt Montana State University, Bozeman Follow
Western North American Naturalist Volume 61 Number 4 Article 13 11-15-2001 Mule deer foraging preference among five sagebrush (Artemisia L.) taxa Carl L. Wambolt Montana State University, Bozeman Follow
Copyright 2018 by Jamie L. Sandberg
 Copyright 2018 by Jamie L. Sandberg All rights reserved. This book or any portion thereof may not be reproduced or used in any manner whatsoever without the express written permission of the publisher,
22 Questions from WildEarth Guardians - September 19, 2016
 22 Questions from WildEarth Guardians - September 19, 2016 Piceance Basin Study Area Questions: 1. What scientific basis does CPW have for the hypothesis that black bear predation is an important factor
Identifying Mule Deer Migration Routes
 Identifying Routes in the Atlantic Rim Project Area Prepared for: The Wildlife Heritage Foundation of Wyoming Prepared by: Hall Sawyer and Matthew Kauffman Wyoming Cooperative Wildlife Research Unit University
DMU 056 Midland County Deer Management Unit
 DMU 056 Midland County Deer Management Unit Area Description The Midland County Deer Management Unit (DMU) 056 is in the Northern Lower Peninsula (NLP) Region. It has roughly 333, 440 acres and consists
Northern Yellowstone Cooperative Wildlife Working Group 2012 Annual Report (October 1, 2012-September 30, 2012) Member Agencies
 Member Agencies") Northern Yellowstone Cooperative Wildlife Working Group 2012 Annual Report (October 1, 2012-September 30, 2012) Member Agencies Montana Fish, Wildlife & Parks National Park Service, Yellowstone National
Northern Yellowstone Cooperative Wildlife Working Group 2012 Annual Report (October 1, 2012-September 30, 2012) Member Agencies Montana Fish, Wildlife & Parks National Park Service, Yellowstone National
White-Tailed Deer Management FAQ
 December 6 th, 217 Ministry of Forests, Lands, Natural Resource Operations and Rural Development White-Tailed Deer Management FAQ What are current white-tailed deer management objectives in the Kootenay
Job Title: Game Management, Subsection B Game Management Mountain Lion. SPECIES: Mountain Lion
 SPECIES: Goal: Manage the mountain lion population, its numbers and distribution, as an important part of Arizona s fauna and to provide mountain lion hunting recreation opportunity while maintaining existing
DMU 053 Mason County Deer Management Unit
 DMU 053 Mason County Deer Management Unit Area Description Mason County Deer Management Unit is in the Northern Lower Peninsula Region (NLP) on the Lake Michigan coast. Only 17% of the land base is public
Michigan Predator-Prey Project Phase 1 Preliminary Results and Management Recommendations. Study Background
 Michigan Predator-Prey Project Phase 1 Preliminary Results and Management Recommendations Study Background White-tailed deer are important ecologically, socially, and economically throughout their geographic
Enclosed, please find the 2018 Spotlight Deer Survey Report and Recommendations that we have prepared for your review and records.
 July 26, 2018 YO Ranchlands Landowner Association 1323 Whispering Pines Houston, TX 77055 To the Wildlife Committee: Enclosed, please find the 2018 Spotlight Deer Survey Report and Recommendations that
DMU 040 Kalkaska County Deer Management Unit
 DMU 040 Kalkaska County Deer Management Unit Area Description The Kalkaska County Deer Management Unit (DMU 040) is in the Northern Lower Peninsula Region (NLP) (Figure 1). It has roughly 170,000 acres
Deer Management Unit 255
 Deer Management Unit 255 Area Description DMU 255 is located primarily in northern Menominee County, but also extends into a small portion of Dickinson, Marquette, and Delta counties. It has totaled 463
Deer Management Unit 127
 Deer Management Unit 127 Area Description Deer Management Unit (DMU) 127 is 328 sq. miles in size and is found in far western Gogebic County surrounding Ironwood, Bessemer and adjacent rural communities.
DMU 072 Roscommon County Deer Management Unit
 DMU 072 Roscommon County Deer Management Unit Area Description Roscommon County Deer Management Unit is in the Northern Lower Peninsula Region (NLP). It has roughly 205,000 acres of public land which is
Deer Management Unit 249
 Deer Management Unit 249 Geographic Location: DMU 249 lies along the Lake Michigan shoreline and is comprised largely of Mackinac and Chippewa counties with a small portion of southeastern Luce County

Job Title: Game Management, Subsection B Game Management Mountain Lion. SPECIES: Mountain Lion
 SPECIES: Goal: Manage the mountain lion population, its numbers and distribution, as an important part of Arizona s fauna and to provide mountain lion hunting recreation opportunity while maintaining existing
2008 WMU 106 mule deer
 2008 WMU 106 mule deer Section Authors: Mike Grue and Kim Morton Suggested citation: Grue, M. and K. Morton. 2009. WMU 106 mule deer. Pages 50 54. In: N. Webb and R. Anderson. Delegated aerial ungulate
PREDATOR CONTROL AND DEER MANAGEMENT: AN EAST TEXAS PERSPECTIVE
 PREDATOR CONTROL AND DEER MANAGEMENT: AN EAST TEXAS PERSPECTIVE BEN H. KOERTH, Institute for White-tailed Deer Management and Research, Box 6109, Arthur Temple College of Forestry, Stephen F. Austin State
Thomas and Wisdom 1. Has The Starkey Project Delivered On Its Commitments? Jack Ward Thomas 1 and Michael J. Wisdom. Introduction
 Thomas and Wisdom 1 Has The Starkey Project Delivered On Its Commitments? Jack Ward Thomas 1 and Michael J. Wisdom Introduction The Starkey Project was conceived from intense debate about how best to manage
2017 LATE WINTER CLASSIFICATION OF NORTHERN YELLOWSTONE ELK
 2017 LATE WINTER CLASSIFICATION OF NORTHERN YELLOWSTONE ELK A collaborative survey by the Northern Yellowstone Cooperative Wildlife Working Group Report Prepared by: Karen Loveless, Montana Fish Wildlife
Identifying Mule Deer Migration Routes Along the Pinedale Front
 Identifying Mule Deer Migration Routes Along the Pinedale Front Prepared for: The Wyoming Wildlife and Natural Resource Trust 500 East Fremont Riverton, Wyoming 82501 Prepared by: Hall Sawyer and Matthew
Monitoring Population Trends of White-tailed Deer in Minnesota Marrett Grund, Farmland Wildlife Populations and Research Group
 Monitoring Population Trends of White-tailed Deer in Minnesota - 2014 Marrett Grund, Farmland Wildlife Populations and Research Group INTRODUCTION White-tailed deer (Odocoileus virginianus) represent one
Spatial and Temporal Interactions of Elk, Mule Deer and Cattle
 Spatial and Temporal Interactions of Elk, Mule Deer and Cattle Priscilla K. Coe Oregon Department of Fish and Wildlife La Grande Bruce K Johnson Oregon Department of Fish and Wildlife La Grande Kelley
Nevada Department of Wildlife Predator Management Plan Fiscal Year 2018
 Nevada Department of Wildlife Predator Management Plan Fiscal Year 2018 Summary on Plans and Reports Just reported on FY 2016 Currently in FY 2017 About to present on FY 2018 All available at www.ndow.org
The Impact of Wolf Reintroduction on the Foraging Efficency of Elk and Bison
 University of Wyoming National Park Service Research Center Annual Report Volume 22 22nd Annual Report, 1998 Article 1 1-1-1998 The Impact of Wolf Reintroduction on the Foraging Efficency of Elk and Bison
The Greater Sage-Grouse:
 The Greater Sage-Grouse: Hunter opinions regarding potential conservation strategies in eleven western states For: National Wildlife Federation October 30, 2014 PO Box 6435 Fernandina Beach, FL 32035 Tel
Kootenay (Region 4) Mule Deer: Frequently Asked Questions
 Mule Deer: Frequently Asked Questions") 1986 1987 1988 1989 1990 1991 1992 1993 1994 1995 1996 1997 1998 1999 2000 2001 2002 2003 2004 2005 2006 2007 2008 2009 2010 2011 Kills/100 hunter days Kootenay (Region 4) Mule Deer: Frequently Asked Questions
1986 1987 1988 1989 1990 1991 1992 1993 1994 1995 1996 1997 1998 1999 2000 2001 2002 2003 2004 2005 2006 2007 2008 2009 2010 2011 Kills/100 hunter days Kootenay (Region 4) Mule Deer: Frequently Asked Questions
Life history Food Distribution Management... 98
 BEAR: Table of Contents Overview Life history... 97 Food... 97 Distribution... 98 Management... 98 2010 Statistical Reports Controlled spring bear season harvest... 100 General season black bear harvest...
RYAN WALKER, New Mexico Department of Game and Fish, P. O. Box 1145, Raton, NM 87740, (575) ,
 ,") State Status Reports RYAN WALKER, New Mexico Department of Game and Fish, P. O. Box 1145, Raton, NM 87740, (575) 445-2311, ryan.walker@state.nm.us Abstract: Overall population estimates for all deer species
State Status Reports RYAN WALKER, New Mexico Department of Game and Fish, P. O. Box 1145, Raton, NM 87740, (575) 445-2311, ryan.walker@state.nm.us Abstract: Overall population estimates for all deer species
Jeffrey M. Ver Steeg Colorado Parks and Wildlife. December 14, 2016
 Jeffrey M. Ver Steeg Colorado Parks and Wildlife December 14, 2016 If the proposals make sense, seem worth the financial investment and have the potential to inform future wildlife management If the two
Mule deer in the Boundary Region: Proposed research and discussion
 Mule deer in the Boundary Region: Proposed research and discussion Sophie Gilbert, U. of Idaho Adam Ford, UBC Okanagan Jesse Zeman, BC Wildlife Federation The Boundary Deer Herd (it is) difficult to cast
DMU 043 Lake County Deer Management Unit
 DMU 43 Lake County Deer Management Unit Area Description Lake County Deer Management Unit is in the Northern Lower Peninsula Region (NLP). It has approximately 2, acres of public land which is about half
Diet Composition, Dry Matter Intake and Diet Overlap of Mule Deer, Elk and Cattle
 Diet Composition, Dry Matter ntake and Diet Overlap of Mule Deer, Elk and Cattle Scott L. Findholt Oregon Department of Fish and Wildlife La Grande Bruce K. Johnson Oregon Department of Fish and Wildlife
P.O. Box 24 Joshua Tree, California July 16, 2015
 P.O. Box 24 Joshua Tree, California 92254 www.mbconservation.org July 16, 2015 CA Fish and Game Commission Sonke Mastrup, Executive Director 1416 Ninth Street, Room 1320 Sacramento, CA 95814 Submitted
Living World Review #2
 Living World Review #2 1. Each of these organisms are found within Yellowstone National Park in the western United States. Use the following guidelines to create this food web and then answer questions
Minnesota Deer Population Goals
 This document is made available electronically by the Minnesota Legislative Reference Library as part of an ongoing digital archiving project. http://www.leg.state.mn.us/lrl/lrl.asp Minnesota Deer Population
DMU 065 Ogemaw County Deer Management Unit
 DMU 065 Ogemaw County Deer Management Unit Area Description Ogemaw County Deer Management Unit is in the Northern Lower Peninsula Region (NLP). It has roughly 99,000 acres of public land which is about
2008 WMU 360 moose, white tailed deer and mule deer. Section Authors: Robb Stavne, Dave Stepnisky and Mark Heckbert
 2008 WMU 360 moose, white tailed deer and mule deer Section Authors: Robb Stavne, Dave Stepnisky and Mark Heckbert Suggested citation: Stavne, R., D. Stepnisky, and M. Heckbert. 2009. WMU 360 moose, white
DMU 006 Arenac County Deer Management Unit
 DMU 006 Arenac County Deer Management Unit Area Description The Arenac County Deer Management Unit (DMU) 006 is in the Northern Lower Peninsula (NLP) Region. It has roughly 248,320 acres and consists of
Science Skills Station
 Science Skills Station Objective 1. Interpret and analyze data so to determine the relationship between resource availability and carrying capacity of a population. 2. Identify biotic and abiotic factors
DMU 057 Missaukee County Deer Management Unit
 DMU 057 Missaukee County Deer Management Unit Area Description Missaukee County Deer Management Unit is in the Northern Lower Peninsula Region (NLP). It has over 100,000 acres of state land, just over
MOUNTAIN LION DATA ANALYSIS UNIT L-9 MANAGEMENT PLAN
 MOUNTAIN LION DATA ANALYSIS UNIT L-9 MANAGEMENT PLAN GAME MANAGEMENT UNITS 41, 411, 42, 421, 52, 521, 53, 63 Northwest and Southwest Regions Prepared for: Colorado Division of Wildlife By: Van Graham and
DMU 005 Antrim County Deer Management Unit
 DMU 005 Antrim County Deer Management Unit Area Description Antrim County Deer Management Unit is in the Northern Lower Peninsula Region (NLP). It has roughly 74 square miles (47,451 acres) of public land
Mule deer migration and the Bald Mountain Mine a summary of baseline data
 Mule deer migration and the Bald Mountain Mine a summary of baseline data Prepared for: Nevada Department of Wildlife 1100 Valley Road Reno, NV 89512 Prepared by: Hall Sawyer and Megen Brittell Western
Evolving niche of the coy-wolf in northeastern forests and implications for biodiversity
 Evolving niche of the coy-wolf in northeastern forests and implications for biodiversity Principal Investigators Dr. Jacqueline Frair Roosevelt Wild Life Station, SUNY ESF 1 Forestry Drive, Syracuse, NY
A pheasant researcher notebook:
 A pheasant researcher notebook: what we are learning about pheasants and pheasant hunters in Nebraska TJ Fontaine Nebraska Cooperative Fish and Wildlife Research Unit Managing pheasants is challenging
Mule Deer. Dennis D. Austin. Published by Utah State University Press. For additional information about this book
 Mule Deer Dennis D. Austin Published by Utah State University Press Austin, D.. Mule Deer: A Handbook for Utah Hunters and Landowners. Logan: Utah State University Press, 2010. Project MUSE., https://muse.jhu.edu/.
Deer Management Unit 349
 Deer Management Unit 349 Geographic Location: DMU 349 lies along the lake Michigan shoreline and is largely comprised of western Mackinac county with small portions of southern Luce county and southeastern
Management History of the Edwards Plateau
 Management History of the Edwards Plateau Eco regions of Texas Edwards Plateau 24,000,000 acres About 15,000 years ago, the Edwards Plateau was much cooler and was more forested than today. Pollen counts
DMU 361 Fremont Deer Management Unit Newaygo, Oceana, N. Muskegon Counties
 DMU 361 Fremont Deer Management Unit Newaygo, Oceana, N. Muskegon Counties Area Description The Fremont Deer Management Unit (DMU 361) was established in 2013. It lies within the Southwest Region and covers
San Juan Basin Elk Herd E-31 Data Analysis Unit Plan Game Management Units 75, 751, 77, 771, and 78
 San Juan Basin Elk Herd E-31 Data Analysis Unit Plan Game Management Units 75, 751, 77, 771, and 78 Andy Holland Terrestrial Biologist Colorado Division of Wildlife 151 E. 16 th Street Durango, CO 81301
SPOTLIGHT DEER SURVEY YO RANCHLANDS LANDOWNERS ASSOCIATION ±10,400 ACRES KERR COUNTY
 SPOTLIGHT DEER SURVEY YO RANCHLANDS LANDOWNERS ASSOCIATION ±10,400 ACRES KERR COUNTY WRITTEN BY: SHANE KIEFER, CWB SARAH KAHLICH, AWB PLATEAU LAND & WILDLIFE MANAGEMENT AUGUST 1, 2016 EXECUTIVE SUMMARY
BLACK GAP WMA/ECLCC MULE DEER RESTORATION PROJECT UPDATE. February 2, 2016
 //CEMEX USA BLACK GAP WMA/ECLCC MULE DEER RESTORATION PROJECT UPDATE February 2, 2016 Mule deer numbers at Black Gap Wildlife Management Area (BGWMA) and El Carmen Land & Conservation Company-CEMEX USA
REBOUND. on the. It was the winter of 2000/2001, and it seemed like the snow
 JILLIAN COOPER / istockphoto.com 12 January / February 2018 on the While concerns remain, American marten are making a comeback in New Hampshire REBOUND by Jillian Kilborn It was the winter of 2000/2001,
DMU 045 Leelanau County Deer Management Unit
 DMU 045 Leelanau County Deer Management Unit Area Description The Leelanau County Deer Management Unit (DMU 045) is in the Northern Lower Peninsula Region (NLP). It has roughly 7,100 acres of State Forest
JULY 2017 SUMMARY BULLETS
 FY 2017 Predator Report Appendix Project 21-02 Comments To: From: NV Department of Wildlife, Bureau of Land Management U.S. Geological Survey, WERC Research Team Subject: March July 2017 Progress Update
LITTLE SALMON AND MAGUNDY RIVERS
 MOOSE SURVEY LITTLE SALMON AND MAGUNDY RIVERS LATE-WINTER 2007 Prepared by: Mark O'Donoghue February 2013 MOOSE SURVEY LITTLE SALMON AND MAGUNDY RIVERS LATE-WINTER 2007 Yukon Department of Environment
Early History, Prehistory
 History of Management of Large Mammals in North America What experience and history teach us is this that nations and governments have never learned anything from history, or acted upon any of the lessons
BRENT N. LONNER, Montana Fish, Wildlife & Parks, Fish & Wildlife Division, PO Box 488, Fairfield, MT 59436, USA
 History of Bighorn Sheep in the Sun River Area, Montana BRENT N. LONNER, Montana Fish, Wildlife & Parks, Fish & Wildlife Division, PO Box 488, Fairfield, MT 59436, USA Abstract: The Sun River bighorn sheep
Diversity of Life Field Trip Guide Student
 Diversity of Life Field Trip Guide Student This field trip was designed as an exploratory activity with a slight emphasis on content development and should be utilized at the beginning of the Diversity
Annual Report Ecology and management of feral hogs on Fort Benning, Georgia.
 Annual Report 2005 Ecology and management of feral hogs on Fort Benning, Georgia. PROJECT INVESTIGATORS: Stephen S. Ditchkoff, School of Forestry and Wildlife Sciences, Forestry and Wildlife Sciences Bldg.,
Deer Management Unit 122
 Deer Management Unit 122 Area Description DMU 122 is located in south Dickinson County and includes a small portion of west central Menominee County. It encompasses 163 sq. miles and has remained unchanged
Wyoming Range Mule Deer Project. Summer 2017 Update
 Wyoming Range Mule Deer Project Summer 2017 Update TABLE OF CONTENTS PROJECT BACKGROUND... 3 WINTER 2016/2017... 4 Adult Survival... 4 Fawn Survival... 4 MARCH 2017 ADULT CAPTURES... 5 Nutritional Condition...
Tennessee Black Bear Public Opinion Survey
 Tennessee Black Bear Public Opinion Survey Executive Summary 2012 Survey TWRA Technical Report 12 02 This electronic publication was developed by the Tennessee Wildlife Resources Agency s Division of Wildlife
Agriculture Zone Winter Replicate Count 2007/08
 PEACE REGION TECHNICAL REPORT Agriculture Zone Winter Replicate Count 2007/08 by: Conrad Thiessen Wildlife Biologist Ministry of Environment 400 10003 110 th Avenue Fort St. John BC V1J 6M7 November 2008
MOUNTAIN LION MANAGEMENT GUIDELINES FOR LION DAU L-2
 MOUNTAIN LION MANAGEMENT GUIDELINES FOR LION DAU L-2 Game Management Units 3, 301, 4, 5, 441, 14, 214 Prepared for: Colorado Division of Wildlife Northwest Region By: Darby Finley Terrestrial Wildlife
New Mexico Supercomputing Challenge
 Oryx Populations at White Sands Missile Range New Mexico Supercomputing Challenge Final Report April 2, 2008 Team 68 Melrose High School Team Members: Kyle Jacobs Richard Rush Randall Rush Teachers: Alan
Utah. North Stansbury Mountains Wilderness Study Area Site-Specific Monitoring Guide
 Utah North Stansbury Mountains Wilderness Study Area Site-Specific Monitoring Guide 1 General Information WildSNAP Monitoring Peter Woodruff, American Conservation Experience Coordinator Phone (801) 989-7069
Status and Distribution of the Bobcat (Lynx rufus) in Illinois
 in Illinois") Transactions of the Illinois State Academy of Science received 9/14/99 (2000), Volume 93, #2, pp. 165-173 accepted 1/16/00 Status and Distribution of the Bobcat (Lynx rufus) in Illinois Alan Woolf 1, Clayton
Transactions of the Illinois State Academy of Science received 9/14/99 (2000), Volume 93, #2, pp. 165-173 accepted 1/16/00 Status and Distribution of the Bobcat (Lynx rufus) in Illinois Alan Woolf 1, Clayton
Crossing Corridors. Objective. Materials. Background Information
 Objective Students will be able to demonstrate how habitat fragmentation limits survival of the Pacific Fisher, compare habitat specialists and generalists, and describe the importance of corridors within
Job Title: Game Management, Subsection B Game Management Mountain Lion
 Job Title:, Subsection B Goal: Manage the mountain lion population, its numbers and distribution, as an important part of Arizona s fauna and to provide mountain lion hunting recreation opportunity while
Wildlife Introduction
 Wildlife Introduction The wildlife section of this chapter is divided into sections for various habitats and groups of species. Old growth, snags and downed wood, and riparian areas are unique habitats