Data Accuracy from Well Test Operations
|
|
|
- Irma Henry
- 6 years ago
- Views:
Transcription
1
2 Master Thesis Fall 2015 Data Accuracy from Well Test Operations By Ida Stuksrud Gundersen for the Department of Petroleum Technology & Expro Norway AS Stavanger 2015
3 Acknowledgements I would like to express my gratitude to Expro DST Manager Arild Fosså and Expro DAQ Manager Anders Frafjord for all information, comments, remarks and engagement they have contributed with through the learning process of this master thesis. I would also like to thank my supervisor at the University of Stavanger, Professor Leif Larsen, for comments and feedback during the process. Furthermore I would like to thank my loved one for support through these years with late nights and lot of work. Finally is my goal reached. I will forever be grateful for your love. I am also greatful for all the information and support Expro Group has provided during this entire process. I will especially thank Offshore supervisor Jimmy Bøklepp and Technical supervisor Harald Holene for providing me information about how the processes actually works in the field. Last but not least, I would like to thank my family: my parents Hilde Stuksrud and Ole Kristian Gundersen, my siblings Miriam, Hans Ruben and Knut Oskar. 2
4 Abstract This master thesis presents a study on data accuracy from well test operations. All data measuring methods, except bottomhole and surface PVT sampling, is investigated for the accuracy related to procedure and equipment used. The objectives with this study is to highlight potential weaknesses in the procedures or equipment so that Expro can improve the quality of their data acquisition. The main research area is the measurement methods, but also the impact of the type of fluids produced has been studied. Oil, gas or gas/condensate may have different inaccuracies for different methods. Results from this study shows that some of the measurements should be improved. The most critical measurement is the oil flow rate, where no procedure for executing meter correction factor is given. Oil flow rate is one of the most important surface parameters the client want obtain with a well test and should therefor be as accurate as possible. Another weakness is an Excel spreadsheets that is used for various calculations for oil is not protected and formulas has been manipulated. This may again give wrong output values. Another factor is the lack of knowledge among offshore personnell about phase changes due to changes in pressure and temperature. This may have impact on all the measurements that include gas and oil. Since this is something they can not expect offshore personnell to be experts on, should the procedures be updated to cover all scenarios for measurements of various phases. The conclusion from this study is that measurements regarding oil and gas parameter are the most inaccurate and an update of procedures is necessary to improve the data accuracy. Most of the calculations today is done by computer softwares, but correct input values is necessary to get correct output values. Knowledge about what formulas the software contain is important to know to be able to make necessary measurement and data collection for input variables to the software. This should be taken into account if procedure is to updated. 3
5 Table of Contents 1. Introduction Background and motivation Research objectives Study area Summary Database and methodology Chapter description Limitation Assumptions and Abbreviation Assumptions Abbreviations Conclusions Recommendations Theory When to perform a Well Test Types of Well Tests Well Test Equipment Downhole equipment Subsea equipment Surface equipment Data Acquisition Calculations Gas flow rate[5] Oil flow rate Error and Accuracy[8] Absolute error Relative error (of rate error) Full scale error (FS) Additional information Field information Discussion
6 7.1 Data Gathering Methods Downhole Pressure and Temperature Surface Pressure Surface Temperature BS&W Ph Salinity H 2 S and CO Oil gravity Gas gravity Oil flow rate Gas flow rate Coriolis meter Evaluation of test data Case 1 - Gas well, DST Case 2 - Gas/condensate well, Clean-up Case 3 - Oil well, DST Plots Case 1 Gas well, DST Case2 Gas/condensate well, clean up Case3 Oil well, DST Case3 Oil well, DST References Attachment I Attachment II Attachment III Attachment IV Attachment V Attachment VI
7 List of Figures Figure 1 Fluid systems overview - phase envelope[30] Figure 2 N-rate test [2] Figure 3 DHT String Figure 4 BOP Figure 5 Subsea landing string Figure 6 Surface well test system Figure 7 STT (Flowhead) Figure 8 STT valves Figure 9 SSV Figure 10 Desander Figure 11 Sand filter Figure 12 Choke manifold[3] Figure 13 Multitube Heat Exchanger Figure 14 Separator Figure 15 Calibration tank[4] Figure 16 Burner boom Figure 17 Burner head Figure 18 Full scale error & relative error[8] Figure 19 Three quartz crystal transducer[17] Figure 20 Downhole memory gauge[18] Figure 21 Rosemount Pressure transmitter[28] Figure 22 Mechanical displacement[14] Figure 23 Piezoelectric effect - deformation[20] Figure 24 Temperature transducer[21] Figure 25 BS&W measurement Figure 26 ph paper[11] Figure 27 Refractometer Figure 28 Dreager tubes Figure 29 H2S/CO2 sampling compartment Figure 30 Hydrometer[22] Figure 31 Ranarex meauring wheels schematics[32] Figure 32 Ranarex gravitometer[12] Figure 33 Turbine meter internal components[5] Figure 34 Phase envelope[26] Figure 35 Shrinkage tester Figure 36 Total volume correction factor Figure 37 Meter factor method Figure 38 Meter factor method Figure 39 Meter factor method Figure 40 Daniel box[5]
8 Figure 41 Orfice plate[5] Figure 42 Straightening vanes[5] Figure 43 Coriolis meter orientation Figure 44 Coriolis meter function Figure 45 Case 1 - History plot Figure 46 Case 1 - Initial flow plot Figure 47 Case1 - Cleanup flow plot Figure 48 Case1 - Main flow plot Figure 49 Case1 - Sampling flow plot Figure 50 Case1 - Critical flow check plot Figure 51 Case1 - Critical flow check plot - Initial flow Figure 52 Case1 - Critical flow check plot - Cleanup flow Figure 53 Case1 - Critical flow check plot - Main flow Figure 54 Case1 - Critical flow check plot - Sampling flow Figure 55 Case 2 - History plot Figure 56 Case 2 History plot - zoom Figure 57 Case2 - Critical flow check plot Figure 58 Case2 - Critical flow check plot - zoom Figure 59 Case3, DST1 - History plot Figure 60 Cas3, DST1 - Critical flow check plot Figure 61 Case3, DST2 - History plot Figure 62 Case3, DST2 - History plot - zoom Figure 63 Case3, DST2 - Critical flow check plot
9 List of Tables Table 1 Data Acquisition Table 2 Reservoir fluids characteristics Table 3 Expro memory gauges specification Table 4 SPARTEK memory gauges specification[34] Table 5 Pressure transmitter specification[35] Table 6 Temp. transmitter specification 1[36] Table 7 Temp. transmitter specification 2[37] Table 8 Refractometer specification[38] Table 9 Dreager tubes specification[39] Table 10 Dreager fluids properties[23] Table 11 Thermohydrometer specifications[40] Table 12 Aerometer specifications[41] Table 13 Cylider specification Table 14 Densiometer specification[42] Table 15 Ranarex specifications[31] Table 16 Turbin meter specification[43] Table 17 Accuracies turbin meter[43] Table 18 Coriolis meter specification[44]
10 1. Introduction 1. Introduction 1.1 Background and motivation New exploration wells are drilled on a daily basis all around the world. As a part of the exploration process oil companies can decide to run well tests. The test objectives can range from simple identification of produced fluids and determination of reservoir deliverability to the characterisation of complex reservoir features. Determination of the well behaviour is completed by evaluating pressure data from downhole gauges. Surface pressure data can be used as an alternative to downhole data if required. During a well test a number of surface mesasurements can be made of for instance sediments and water, hazardeous gases, densities of oil and gas, flow rates, gas-oil-ratio, and others. My motivation for this thesis is to look into the data collected and study the accuracy, based on the equipment used and how the measurements are taken. 1.2 Research objectives Expro Group AS is an oil service company that executes Well Test operations and Production cleanups. This thesis includes a study of the data accuracy of measurements taken during a selection of jobs executed by Expro. The required reports and procedures for execution of this thesis have been provided by Expro. The objectives of the research can be highlighted as follow: Study all the methods and equipment used for collecting data during a Well test and a Clean-up job Investigate inaccuracies due to mechanical factors Investigate inaccuracies due to human factors Identify if there are difference in accuracy for different types of reservoir fluids Study if there are possibility for improvement of the data accuracy 1.3 Study area Three different wells which contains different fluids have been studied in this thesis: 1. Case1 Gas field, DST 2. Case2 Gas/condensate, Cleanup 3. Case3 Oil field, DST Note: The three different wells will be referred to as Case 1, Case 2 and Case 3 due to confidentiality. 9
11 2. Summary 2. Summary 2.1 Database and methodology In this study has procedures for collection of manual measurements, the equipment used and data collected from well tests been evaluated. Most of the data has been provided by Expro. The three reports that has been evaluated represents gas well, gas/condensate well and oil well. Mathcad has been used for calculations comparing manual calculations and the software and Microsoft Excel for graphical presentation. Expro is using a software called Report2 to plot graphs in conjunction with IDEA or EDGE-X software. The limited availability to the software listed above, was one of the limitations during execution of this thesis. 2.2 Chapter description This thesis is divided into 7 chapters. First chapter is a general introduction to the background and motivation for this thesis, including research objectives and study area. Second chapter contains a brief summary about the database, methodology and limitations. Chapter three contains assumptions and abbreviations. Chapter 4 & 5 contain conclusion and recommendations. Chapter 6 contains theory about well testing and equipment used in well testing. Chapter 7 contains the discussion about the data accuracies. Attachment I Expro procedures Attachment II New procedure proposal Attachment III Tables used for calculations Attachment IV Technical specifications Attachments V Well Test job informations Attachment VI Mathcad calculations 10
12 2. Summary 2.3 Limitation 1. Software one focus area was to be able to look into the equations used in the software to compare these with the equations given in Expro procedures and standards. Due to limited number of available licenses of the software at Expro and no available public program manual, I have not been able to research this. The comparison was then done of values given in well test reports instead. In Expro, both IDEA and EDGE-X has been used to record and calculate well data such as pressures, temperatures, flow rates and others the last years, but EDGE-X is taking over more now. 2. Well name data in this thesis have been taken from well test jobs performed by Expro. These reports have not been published by the Norwegian Petroleum Directorate, so they need to be treaded as confidential. The field and well number has therefore been replaced by case1, case2 and case3. 11
13 3. Assumptions & Abbreviation 3. Assumptions and Abbreviation 3.1 Assumptions 1. If no reference is given the information has been taken from Expro internal documents[1]. 2. All data used for evaluation in this thesis have been taken from post-completion tests. 3. A lot of data taken from a DST is also recorded during a Clean-up job. 4. Surface and bottomhole sampling are not discussed in this thesis. 5. Only equipment used within Expro is discussed. Other companies may use other equipment for the same measurements. 6. When oil is in the calibration tank, the temperature is assumed to be the same in center as in the edge. 3.2 Abbreviations AGA American Gas Association AORV Annulus Operated Reversing Valve API American Petroleum Institute ARTS Annulus Reference Trap System ASTM American Standard Test Methods BHP Bottom Hole Pressure BHT Bottom Hole Temperature BOP Blow Out Preventer BPM Barrel Per Minute BS&W Basic, Sediments & Water CGR Condensate Gas Ratio CO 2 Carbon Dioxide CMSF Combined Meter & Shrinkage Factor CPU Central Processing Unit DAQ Data Acquisition DCP Downstream Choke Pressure DCT Downstream Choke Temperature DH Down Hole DHSV Down hole Safety Valve DHT Down Hole Tools DP Differential Pressure DST Drill Stem Test ESD Emergency Shut Down FS Full Scale GOR Gas Oil Ratio GPM Gallon Per Minute GPSA Gas Processing Supplier Association 12
14 3. Assumptions & Abbreviation H 2 S Hydrogen Sulphide ID Inside Diameter LRL Lower Reading Limit MF Meter Factor MRST Multi Reverse Spot Tool N 2 - Nitrogen NCS Norwegian Continental Shelf OD Outside Diameter ODCT Oil Density Cylinder Temperature P&ID Pipe & Instrumentation Diagram POTV Pressure Operated Tester Valve ppm parts per million PVT Pressure, Volume, Temperature RA Radio Active RFT Repeat formation test RIH Run In Hole RTD Resistive Temperature Detector RV Retainer Valve SC Standard Conditions SF-TTV Self Fill Tubing Tester Valve SG Specific Gravity Shr - Shrinkage SSTT Subsea Test Tree STT Surface Test Tree SSV Surface Safety Valve TCP Tubing Conveyed Perforationg TVCF Total Volume Correction Factor URL Upper Reading Limit VCF Volume Correction Factor WH Well Head WHP Well Head Pressure WHT Well Head Temperature WT Well Test X-mas Christmas (tree) Key phrases that are central in this thesis: Upstream the pipe that goes into an equipment Downstream the pipe that goes from the equipment Upstream and downstrem choke terms is used for determine the change in high pressure and low pressure 13
15 4. Conclusion 4. Conclusions This thesis evaluated the data acquasition accuracies related to well test operations. The data measurements that was studied was: 1. Downhole pressure and temperature 2. Surface pressure 3. Surface temperature 4. BS&W 5. ph 6. Salinity 7. H 2 S & CO 2 8. Oil gravity 9. Gas gravity 10. Oil flowrate 11. Gas flowrate 12. Coriolis meter Some of the measurements mentioned above are more complex than others. Downhole memory gauges and surface pressure and temperature transmitters are equipment that are installed by qualified people before a job and flow starts and they are responsible for correct installation. The surface temperature transmitters come in full range, but the pressure transmitters come in various ranges. Special care must be taken concerning the choice of range in the surface system. For the manual measurements the quality of procedures and equipment was varying. BS&W, ph, Salinity and H 2 S and CO 2 is data measurements that are collected to ensure environmental safety and to identify properties in the mud produced in the clean-up phase. This is measurements that mainly is taken to prove that clean-up phase are completed and to determine the content of hazardouse gases, but the accuracies of reading should be good. For the BS&W and H 2 S/CO 2 was the procedures brief and did not include what to do in additional scenarios. If a measurement is affected by the type of fluids produced should special notes be included in the procedure on how to solve this challenge. In the H 2 S/CO 2 procedure a wrong sampling compartment was also stated. A compartment with continous flow should be used instead of gas bladders and stainless steel bottles. The main surface data collected during a well test are oil and gas gravities and flow rates. This is the information the client is interested in to decide the quality of the reserves found. From this study can we see that these are also the paramteres that have the highest inaccuracies. Phase changes due to reduction in pressure and temperature is the biggest challenge when it comes to these measurements. The gas gravity is measured at atmospheric pressure and temperature, but if the gas is a wet gas or gas/condensate, then liquids might affect the reading since the silica gel in the Ranarex gravitometer only can handle small amounts of moisture. For oil gravity the procedure is very poor. Unless you have a heavy oil the oil will most likely contain disolved gas at sampling pressure and temperature. The reading 14
16 4. Conclusion si taken at atmospheric pressure, but to make sure all the gas have evaporated from the solution, should the oil get some time to settle. Correction for temperature is also missing. The gas flowrate is today calculated by software. The main input parameters are differential pressure across the orifice meter, static pressure, flowing temperature and specific gravity of the gas. From this study it is shown that several factors are included in the final flow equations. Most of the factors are included in all of the methods, but the orifice thermal expansion factor is only mentioned in GPSA handbook. If this factor is included in the software or not, is unknown. From subchapter 7.2 can we see that this is just a small factor, so it will not contribute to a much higher flowrate if it is included. Oil flow rate had the most critical method on how to correct to standard conditions. There were no procedure given on how to execute a meter factor or combined meter and shrinkage factor. This is the factor that is multiplied with the turbine meter value to give flow rate and cumulative production in standard cubic meter or feet, and this should be very accurate. We saw that the Excel spreadsheet that was used for calculating this factor was not protected, and for Case 3 the formulas had been manipulated, thus giving a wrong CMSF. We see that for coriolis meter both mass flow and volumetric flow be measured. Expro only uses mass flow so densities need not be included. Densities can be measured for liquids but is not recommended for gas by manufacturer. Coriolis meter is more and more taking over for orifice meter or a combination of both is used. Figure 1 Fluid systems overview - phase envelope[30] 15
17 4. Conclusion A lack of quality and updates of Expro procedures makes many of the measurements more inaccurate than necessary. Ignorance about what formulas the software uses and what inaccuracies that is related to this software is also something that lowers the quality of the data that are provided to the costumer. Knowledge about fluids behaviour due to pressure and temperature is something there is lack of in learning courses and offshore personnel, and on many of the surface measurements this is something that can affect the reading. An update of procedures is necessary to improve the quality of the data acquisition. 16
18 5. Recommendations 5. Recommendations Below are some recommendations for Expro to improve the data acquisition: Get to know the background of the software used for data acquisition. Formulas, input parameter, unit of input parameters etc. BS&W update procedure with how to take measurement with small liquid contents. H 2 S/CO 2 update procedure with correct sampling compartment. Make sure all laboratory containers are equipped with this sampling compartment. Also include the importance of continuous and controlled flow to avoid splashing of liquid droplets. Oil gravity let the oil get sufficient time to settle and gas to evaporate before oil gravity is measured. This should be done in the sampling cabinet in the laboratory container. Gas gravity if a wet gas or gas/condensate is about to be measured, make sure to keep the inlet of the balloon upwards so no liquids will be collected at the inlet of the balloon. Only gas with a small amount of moisture will then enter the inlet of the Ranarex gravitometer. A test to confirm that the temperature in the balloon actually is the same as surroundings should also be performed. Oil flow rate create a detailed procedure on how to execute and calculate a final meter correction factor. CMSF Excel spreadsheet if an Excel spreadsheet shall be used to calculate the total volume correction factor for the meter, then all formulas should be documented and have a reference. The Excel spreadsheet should be protected with only input cells open for change. Oil flow rate manual calculations update procedure with an approved standard. Gas flow rate clearly state in the well test report or another public place if the static pressure is taken upstream or downstream of the orifice meter. Gas flow rate manual calculation update procedure with an approved standard. References all procedures and formulas should be based on an exicting standard. Phase behaviour personnel need to be trained in how oil and gas behave with pressure and temperature. 17
19 6. Theory 6. Theory 6.1 When to perform a Well Test Once a well has been drilled the oil companies needs to decide whether or not to go ahead with a well test(wt). Some common situations when a well test is conducted is given below. Prior to completion WT can be run to assist with the choice of completion. Drill Stem Test (DST) or Repeat Formation Test (RFT), or both, is normally being carried out. Post-completion WT is done after the well is completed. A build-up, draw-down, or deliverability test can be run to quantify near-wellbore and reservoir conditions, and to determine inflow performance characteristics. Pre-stimulation and Post-stimulation stimulation is acidizing or fracturing of the formation to improve the well performance. This is usually done after a build-up test to evaluate the need for stimulation. After the treatment the productivity of the well should improve. Fracturing is also done to evaluate the strenght of the bearing rock. Other scenarios: Whenever change in operation to evaluate any problems that may have developed Periodic survey to record the pressure build-up Enhanced recovery when fluid is being injected or if a well is converted from production to an injection well. Objective for the well test is to monitor fluid movement. Most well tests can be group into productivity testing or descriptive/reservoir testing[29]: Productivity well tests - Identify produced fluids and determine their respective volume ratios - Measure reservoir pressure and temperature - Obtain samples suitable for PVT analysis - Determine well deliverability - Evaluate completion efficiency - Characterise well damage - Evaluate work-over or simulation treatment 18
20 6. Theory Descriptive tests - Evaluate reservoir parameters - Characterise reservoir heterogenities - Assess reservoir extent and geometry - Determine hydraulic communication between wells Whatever the objectives might be, well test data are essential for the analysis and improvement of reservoir performance and for reliable predictions. 19
21 6. Theory 6.2 Types of Well Tests In Expro mostly two types of jobs are performed: Clean-up flow - Bring mud filtrate, rock particles and extraneous fluids such as mud cake to surface, to allow the well to flow at it s maximum allowable flow rate. This is done prior to a test on an exploration well or to clean up a well that is ready for production. DST Drill Stem Test - Focuses on obtaining near well bore information and PVT fluid samples from an exploration well. A lot of the same data is gathered during a clean-up test where the main purpose is to remove mud filtrate prior to production and a full DST test. The main difference between the two: reservoir heterogeneity and geometry are additional parameters established during a DST. There are several types of test that can be performed on a well. An important decision is the selection of the right test. This depends on Type of fluid expected Test objectives And more Below the most common groups of test are listed. For more detailed description of each test see reference [2] - PRESSURE DRAWDOWN TESTING - PRESSURE BUILD-UP TESTING - MULTIPLE-RATE TESTING Two-rate flow test N-rate flow test - GASS WELL TESTING Flow-after-flow test Isochronal test Modified isochronal test - INJECTION WELL TESTING Injection test Fall-off test - MULTIPLE WELL TESTING Interference testing Pulse testing - CLOSED CHAMBER TESTING Alexander Method Surge testing Slug testing 20
22 6. Theory FasTest Method SILD Wireline Formation Tests Expro is often utilizing a N-rate flow test-program. N-rate flow test With a single pressure drawdown test it is often impossible to get a constant flow long enough to complete a drawdown test. Hence, a multiple-rate test is preferred. During a multiple-rate test a range from one flow with uncontrolled variable rate to a flow with a series of constant rates is available. Accurate flow rate and pressure measurements are essential since it is used in analysing transients of the well test. Without good flow rate data, good analysis of multiple-rate tests is impossible. By utilizing a N-rate test additional data such as turbulent skin and max sand free rate can be determined. Below is a schematic of a typical N-rate test Figure 2 N-rate test [2] Explanation of figure 1: 1. Initial flow with initial build-up 2. Clean-up flow with clean-up build-up 3. Sampling flow with build-up 4. Main flow with main build-up 5. Mini-frac test 21

23 6. Theory 6.3 Well Test Equipment Downhole equipment A set of Drill stem test tools is used for the temporary completion of a well. The tools are run as a means to provide a safe and efficient method of controlling a formation during a well test. Many of the components are similar in function to those for permanent completions, but the temporary nature of the string requires some additional functionalities normally not associated with permanent completions. Temporary tools are designed for a wide range of operation environments and can be redressed between runs, while permanent completions are designed for specific installations and long life. The main components in a DST string are listed below[29]. 1. TCP Guns, firing head & perforated tubing Equipment used to perforate holes in the casing to allow communication with the reservoir. 2. Packer A packer is a sealing and bearing device. Its purpose is to provide a seal and to isolate hydrostatic pressure in the well from formation pressure. It is very much the same as for a permanent completion packer[29]. 3. Safety joint A safety jont is operated only if the hydraulic jar cannot pull loose stuck tools. The safety joint is basically two housings connected by a coarse thread. Release is performed by a combination of reciprocation and rotation. 11 turns are required to release the test string from the packer[29]. 4. Hydraulic jar Provides the means of transmitting an upward shock to the tool string in case that the packer and lower assembly becomes stuck. An upward pull activates a regulated oil flow until the hammer section is released thus giving a rapid upward movement and generation the relevant shock[29]. Figure 3 DHT String 22
24 6. Theory 5. SF-TTV Used to pressure test the string when RIH. The SF-TTV is kept closed by rupture discs, and when the packer is set the annullus is pressurised to burst the rupture discs and the SF-TTV shifts to open position. 6. Gauge carrier Gauge carrier for downhole memory gauges, to record DH pressure and temperature. 7. DHSV A safety valve that is independent of the main tester valve is often required to provide an additional well control in case the main downhole valve fails. This is a single shot valve and is activated by bursting rupture discs and thus shifting the valve to a closed position. The DHSV has a pump through function allowing to kill the well[29]. 8. Drain valve Bleed-off point in case of trapped pressure between two closed valves, for example POTV and DHSV. 9. POTV, N2-chamber & ARTS Downhole ball valve operated by annulus pressure with a nitrogen section below compensating for changes in annulus hydrostatic pressure. ARTS is used to trap the hydrostatic pressure inside the N2-chamber. This valve is opened and closed to allow for shut-in and flows per test procedures. 10. MRST A circulation valve allowing communication between annulus and tubing. Used to spot cushion and acid treatments before testing and to remove produced fluids before POOH after a test[29]. 11. AORV A single shot circulation valve also called Annulus Operated Reversing Valve. Once rupture discs are burst, tool shift position and there is full communication between annulus and tubing. Closed position can not be obtained again, so the AORV is commonly used for killing the well. 12. RA Marker sub Used to control the position and depth in the well against a RA marker in the casing. 13. Test collar To provide the necessary weight required to set the packer. The weight can vary on what type of packer that is used. 23
25 6. Theory 14. Slip joint A slip joint is an expansion/contraction compensation tool. It accommodates any changes in the string length due to temperature during a DST. The slip joint has a 5 foot stroke. The number of slip joints depends on the well conditions, but normally three or four slip joints are run, one closed, one half-open and one in open position, or two closed and two open. 15. Sampling chamber tool A sampling chamber tool is used to trap downhole samples anytime during the test without shutting in the well. The sampling tool can be operated with rupture discs or accusticly. If a production clean-up is performed, the string design has less components compared to a full well test string/dst string. A production clean-up test string comprises gun section, production packer, tubing to subsea and a subsea safety valve. Perforation can also be executed using Wireline. 24

26 6. Theory Subsea equipment When testing from a semi submersible or a floating vessel, a landing string is run and placed inside the blow out preventer. This is to allow the rig to shut-in the well, quickly disconnect from the main landing string and safely come off location in the event of unforseen weather patterns causing excessive heave. The main components in the landing string are described below[29]. 1. Adjuster sub and Fluted Hangar The adjusted sub enables the adjustment of the fluted hangar to facilitate the correct depth of the primary safety barrier in the BOP. 2. Subsea Test Tree It is the primary safety barrier and provides the possibility to disconnect the landing string from the well in case of emergency. It controls well flow and holds pressure from below in the event of an emergency disconnection of the rig from the well without requiring the BOP to shear the landing string. It has slick joints at the lower end and shear sub at the upper end, allowing it to be installed inside the BOP stack. 3. Retainer Valves An environmental valve used to contain the riser content during a disconnection. It has a vent sleeve to vent off any trapped pressure between RV and SSTT, thus minimizing the time required to disconnect the rig from the well. Figure 4 BOP 4. Subsea Lubricator & Cutting Lubricator Valve Used for well isolation and is part of the landing string safety system. Used to establish an operable fail-as-is barrier in the landing string, capable to maintaining pressure control. The cutting lubricator is used when there is planned for coil tubing or wireline. 25
27 6. Theory 5. Hydraulic Control panel To operate the subsea equipment from deck. 6. Other equipment Shear sub positioned in the BOP allowing the shear rams to cut SSTT slick joint enables closure of pipe rams Adjuster sub Fluted hangar Umbilical Reeler Unit connects the hydraulic control panel to the subsea equipment The tools above are primary for semi-submersibles. For platforms, jack-ups or land rigs other safety system can be used. 7. SAFE Valve A fail-closed valve that is held open during test operation due to applied hydraulic pressure. The SAFE valve is categorized as the primary safety barrier and is inteded as the last line of defence and must only be operated in emergencies. During an exploration test in the North Sea wireline operations are rare, but lubricator valves are included in the string design. For clean-up tests subsea bigbore equipment is used. This is similar to subsea equipment, but with a larger diameter. Figure 5 Subsea landing string 26

28 6. Theory Surface equipment At surface the produced fluid is handled by use of surface testing packages. This equipment needs to be designed and assembled to safely furfill a wide range of operations[29]: Provide a means of quickly controlling the pressure and shutting in the well Separate produced fluids into oil, gas and water phases, allowing the constituents to be metered and record key parameters like temperature and pressure Allow representative samples of the produced fluids to be taken Dispose of fluids in an environmentally acceptable manner A brief description of the main components in a surface testing package is given below. It must be emphasised that each well test job requires detaild planning and design related to expected operating conditions and customer objectives. Figure 6 Surface well test system 27

29 6. Theory 1. Surface test tree(flowhead) A STT is installed directly onto a temporary completion string and creates a duplicate of a permanent X-mas tree. It contains four main valves[29]: Master valve allows isolation of the surface equipment from the downhole string. Kill valve allows to kill the well quickly Swab valve allows introduction and retrieval of slickline, wireline and coiled tubing. Flow valve equipped with an automatic hydraulic actuator which is linked into the ESD, thus automatically closing the valve in the event of a pre-programmed event (example too high presurre). Lower master valve An optional item which can be installed below the swivel. The lower master valve provide additional security in case of leakage in the swivel. Figure 7 STT (Flowhead) Figure 8 STT valves 2. Surface safety valve SSV is a Fail-Closed valve that can be activated in case of an emergency. It is operated by air supply to be held open. It is connected to the ESD system and will close if Hi-Low Pressure pilots or Fluid level pilots are activated, or if any of the ESD buttons that are located around in the well test area are activated. If the ESD system is activated, air supply that is holding the valve open is cut, and the valves closes automatically. Figure 9 SSV 28


30 6. Theory 3. Sand filter A filter installed upstream choke to remove drilling, completion and perforation debris during well tests and clean-ups. This is an additional equipment that is installed if high sand production is expected. Figure 11 Sand filter Figure 10 Desander 4. Choke Manifold Primary means of controlling the flow from the well. Equipped with two types of chokes: Adjustable used during clean-up period and allows for changing of fixed choke without closing in the well Fixed choke a a calibrated choke bean with an orifice that gives a more accurate flow The flow can be controlled by changing size of choke bean or adjusting the adjustable choke. The fixed choke bean sizes are given in 64 th. The aim is to get a critical flow across the choke. When this has been achieved, changes in pressure made downstream of the choke does not affect pressures and flow rates upstream of the choke. Figure 12 Choke manifold[3] 29


31 6. Theory 5. Heat Exchanger Used if hydrating, emulsion, wax and foamy oil are expected due to heat loss through the choke. Heating of the fluids prevents the formation of emulsion, hydrates, wax and foamy oil and improves the separation of oil, water ad gas in the separator. It also lowers the viscosity that promotes better flow to the burners. Figure 13 Multitube Heat Exchanger 6. Separator The fluids produced must be separated into oil, water and gas to be able to accurately measure flow rates and take samples. The separator is equipped with pneumatic controls which are needed for controlling the pressure and the fluid levels. Flow meters, either turbine meters or coriolis, are mounted on both the oil and water outlets and a daniel box or coriolis meter on the gas outlet. In the last years a new device called coriolis meter has been more and more used in well tests. Turbine, coriolis and orifice meters are described and discussed in chapter 7. Figure 14 Separator 30
32 6. Theory 7. Calibration tank The separated liquids can be diverted to a calibration tank which can vent to atmospheric pressure. The volume diverted to the tank is measured to help calibrate the flow meters. Because the pressure is reduced to atmospheric additional gas comes out of solution, causing shrinkage, wich can also be measured[29] Figure 15 Calibration tank[4] 8. Burner boom To have a safe disposal of hydrocarbons on the offshore installation, it is important to position the gas/oil flare over the side of the installation. This require that the burner heads are placed at the end of a boom. Figure 16 Burner boom 31
 used for diverting the oil and gas flow to the burners.")
33 6. Theory 9. Burner head Used to provide clean and efficient disposal of produced oil during well test operations. Figure 17 Burner head 10. Oil/Gas Diverter Manifold A manifold with a number of valves (included number of gas/oil) used for diverting the oil and gas flow to the burners. Oil and gas manifolds are not commonly used on the Norwegian sector. Rig diverters are used to divert the oil or gas from the separator to burner booms. 32
34 6. Theory 6.4 Data Acquisition Below is an overview of different data collected during a Well Test Operation and where in the system they are collected. Table 1 Data Acquisition Where data is taken Description Purpose Pressure Find BHP and transient Temperature Find BHT (and transient) Bottom hole Get samples as close to reservoir properties as Samples possible Pressure Find WHP and transient Well Head Temperature Find WHT (and transient) WH fluid sampling Get samples for PVT purpose and find CGR Downstream pressure Monitor pressure Downstream temperature Monitor temperature BS&W Monitor when clean-up phase is done Choke Salinity Monitor brine vs. formation water H 2 S Environmental and health risk CO 2 Environmental and health risk ph Monitor when clean-up phase is done Gas flow rate Well productivity Separator Gas line Specific gravity Fluid parameter Gas samples Recombination & GOR control Oil flow rate Well productivity Temperature Fluid properties for sampling at exact temp. Separator Oil line Specific gravity Fluid parameter Oil samples Recombination, GOR control & wax/asphaltenes studies Separator Water line Meter reading Volumetric flow Water samples Formation water analysis Separator shrinkage See shrinkage of oil from pressurised to Shrinkage factor tester atmospheric Calibration tank Correction factor Correction of meter readings Bulk fluid samples Separator experiment for field development 33
35 6. Theory 6.5 Calculations A number of calculations lie behind the final parameters the client requires. Today softwares are available that do most of the calculations, but there are still some manual calculations needed to get the required input data for the software. Two of the most important surface parameter the client is looking for, is the gas and oil rates. The gas and oil rate equations should form the basis for the calculations of rates in the software. Later in the thesis examples are given where equations are used to calculate the flow rates by hand and compared with rates calculated by the software to see the gap in the result Gas flow rate[5] ( ) The gas flow rate is measured with an equipment called Daniel box or orifice meter. Alternative measurement is mass flow with a coriolis meter. We will describe this in more detail in chapter 7. h w Differental pressure measured across orifice plate P f Static pressure, uptream or downstream F b Basic orifice factor F bp Pressure base factor F tf Flowing temperature factor F pv Supercompressibility factor, deviation from the ideal gas law F g Relative density factor F r Reynolds number factor Y Expansion factor (compensate for change in density through orifice) F tb Temperature base factor F a Orifice thermal expansion factor 34
36 6. Theory Oil flow rate ( ) ( ) ( ) The oil flow rate is measured with a turbine meter installed on the oil line outlet from the separator. This is described in chapter 7. Vs uncorrected flow rate measured by turbine meter (M 3 /day) MF meterfactor Shr shrinkage factor BS&W basic, sediment & water VCF volume correction factor. 35
37 6. Theory 6.6 Error and Accuracy[8] Specifications of error and accuracy of a device can be written in different ways. In this sub chapter the different types of errors that might occur for instruments used for Well Testing are described. In any measurements that is taken there will be some error. The lower the error, the higher the accuracy, and vice versa. It is important that the error and the accuracy are clearly specified. Below is the most common types of errors that are considered in practice Absolute error The absolute error is the difference between the real value and the meter reading. Example: real value is 57 degrees and metered value is 55 degrees. Absolute error equals 2 degrees. The absolute error itself does not give the full information and can be misleading. Two degrees error when we measure 200 gives 1%, while it is 10% if we measure 20 degrees Relative error (of rate error) The relative error represents the relation between the absolute error and the real value. Example: Real value is 300 bar and metered value is 295 bar. The absolute error is 5 bar. The relative error is 5 bar divided by 300 bar = 1.67%, and the accuracy equals (of pressure) The relative error does not take into account the range (the full scale) of the meter and where the real value is within the range, but we have clearly specified the error with this type Full scale error (FS) Full scale error is the absolute error divided by the range(the full scale). Example: A flow meter is specified to measure maximum 1000 GPM. We measure 50 GPM and the metered value is 45 GPM. The absolute error is 5 GPM and the full scale error is 5 divided by 1000 = 0.5% full scale. This means that no matter what the flow rate is the error will be 5 GPM. On the next page are some illustrations of relative error and full scale error. 36
38 6. Theory Figure 18 Full scale error & relative error[8] 37
39 6. Theory 6.7 Additional information Below is an overview of different types of reservoir fluids and their characteristics. This categorizations comes from Petrowiki.com, and these values have been used to characterise fluids in this thesis. This is not a determined range, so companies and other organizations might have different ranges for the different fluids[7]. Table 2 Reservoir fluids characteristics Reservoir fluid characteristics Gases Oils Dry gas Wet gas Gas Condensate Volatile Oil Black Oil Heavy Oils and tars Initial fluid mol. weight < Stock tank oil Greenish to Brown to Clear Orange to clear color orange light green Black API gravity to to to 45 5 to 15 C7+ fraction mol% 0 to 1 1 to 6 10 to to 50 >50 Initial FVF, B o Typical res. temp, F
40 6. Theory 6.8 Field information Because field and well information need to be kept confidential, depths and critical information will not be mentioned, but a brief summary about what type of formation the discovery was found in will be given below. P&IDs and additional information for each well can be found in Attachment V.[6] Case 1 Gas field: this area is dominated by marine claystone. Case 2 Gas/consensate field: the area consists of sandstones, siltstones and shales with subordinate coal beds and conglomerates. Case 3 Oil field: this area consists mainly of fine-grained marine sediments with varying content of calcareaus material. Calcareous clayston, slitstones and marstones is dominating, but subordinate layers of limestone and sandstone may occur. 39
41 7. Discussion 7. Discussion In this chapter I will describe each data gathering method and take a look at how the Expro procedures for performing the data gathering are. I will take a look to see if the procedures are in compliance with the standards that should be used and if there are some uncertanties related to the equipment that is used. I will also evaluate some data from three different jobs Expro has perform during the last 5 years and see if this has had some impact on data. 7.1 Data Gathering Methods Downhole Pressure and Temperature Downhole pressure and temperature gauges are used to get data as near reservoir conditions as possible. Today the technology has come so far that it is possible to get surface readout while a test is ongoing, but Expro is now using the old method with memory gauges. These are storing devices that take pressure and temperature readings during a test, but the gauges need to be retrieved to surface before the data can be read. The most common used is a three-quartz crystal transducer. These works by vibration in the crystals that changes frequency in response to changes in pressure and temperature. The quartz crystal pressure transducer has an excellent gauge factor that gives an exeptional accuracy, resolution and long-term stability. The reference crystal is used to reduce the frequency signals from the pressure and temperature. This is to simplify the frequency counting requirements. The quartz resonators vibration can be driven with very little electrical power.[17,19] Figure 19 Three quartz crystal transducer[17] A short summary of the accuracies related to the equipment used will be described in the next section. The full technical specification can be found in Attachment IV Figure 20 Downhole memory gauge[18] 40
42 7. Discussion Memory gauges used by Expro: 1. Expro Memory Gauges Table 3 Expro memory gauges specification Technical specification CT1000 MT1000 HT1000 Pressure range 0 16,000 psi 0 16,000 psi 0 20,000 psi Accuracy +/- 3.2 psi +/- 3.2 psi +/- 3.2 psi Temperature range F (0-177 C) F (0-177 C) F (0-200 C) Accuracy =/- 1.8 F =/- 1.8 F =/- 1.8 F 2. SPARTEK Memory Gauges Table 4 SPARTEK memory gauges specification[34] Technical specification SS5063 SS5067 SS5200 Pressure range 0 16,000 psi 0 25,000 psi 0 25,000 psi 0 35,000 psi 0 35,000 psi Accuracy 0.020% Full-scale 0.020% Full-scale 0.020% Full-scale 0.025% Full-scale 0.025% Full-scale Temperature range F ( C) F ( C) F ( C) Accuracy 0.9 F (0.5 C) 0.9 F (0.5 C) 0.9 F (0.5 C) Inaccuracies related to this measurement: Memory gauges for the downhole memory gauge we will have the inaccuracies that are related to the gauge itself. One accuracy is related to the quartz pressure crystal and one to the quartz temperature crystal. For the SPARTEK Memory gauges the pressure might come in two different range. There will be different accuracy related to each range. The accuracies are shown in the table above. For Expro memory gauges I assume that the accuracy is +/- 3.2 psi of reading, but is should have been written clearly in the specification what type of error it is. Procedure there is no procedure related to this measurement. Downhole memory gauges are run by personell that are specialists in the field of gauges and data acquisition. 41


![This force deflects a diaphragm and the deflections are converted to electrical outputs. The output will be a current between 4- and 20 ma.[14] An illustration is shown below.](/docs-images/76/73033638/images/43-2.jpg "Figure 21 Rosemount Pressure transmitter[28] Another method for measuring pressure is a transmitter with Piezoelectric effect.")
43 7. Discussion Surface Pressure Surface pressure is measured by the use of a pressure transmitter. A pressure transmitter will produce an electrical output signal, current, when it is exposed to a pressure source and connected to an appropritate electrical source. Most of the pressure transmitters are designed to produce an output signal that is linear with respect to the applied pressure. A transmitter works by having a sensing element of constant area and the responds to the force applied to this area by the fluid pressure. This force deflects a diaphragm and the deflections are converted to electrical outputs. The output will be a current between 4- and 20 ma.[14] An illustration is shown below. Figure 21 Rosemount Pressure transmitter[28] Another method for measuring pressure is a transmitter with Piezoelectric effect. This effect is the ability of a certain material to generate an electric charge due to applied mechanical stress. See picture below for illustration on how this effect works.[16] Figure 22 Mechanical displacement[14] Figure 23 Piezoelectric effect - deformation[20] 42
44 7. Discussion The pressure unit itself is a very complex device with a lot of conversions to get the pressure value from the software. Below I have made a block diagram to show how the process works and to be able to evaluate the steps for error later in this chapter. I will describe each step to give the reader a better understanding how this system works. In the first block a change in voltage due to mechanical displacement or deformation will be detected. This signal is sent to a analog/digital converter. The next step is the CPU that processes the digital value for temperature corrections and against the max and min range that is set, normally 4-20 ma. This digital value is sent to the digital/analog coverter and you will get a value that is between 4-20 ma. The logger is set up with a specific bit size and and the bit size gives some numbers that are used to calculate the output value in bar or psi. See a example below. The bit numbers are not correct, but used for illustration only. For this example a pressure transmitter with a range bar is assumed. A signal of 12 ma goes into the logger A short summary of the accuracies related to the equipment used will be described in next section. The full technical spesification can be found in Attachment IV 43
45 7. Discussion Pressure transmitters used by Expro: 1. Rosemount 3051T Table 5 Pressure transmitter specification[35] Technical specification Range an sensor limits Range Minimum span Upper (URL) Lower (LRL) Lower gauge (LRL) psi (20.6 mbar) 30 psi (2.07 bar) 0 psi (0 bar) psig (-1.01 barg) psi (0.103 bar) 150 psi (10.3 bar) 0 psi (0 bar) psig (-1.01 barg) psi (0.55 bar) 800 psi (55.2 bar) 0 psi (0 bar) psig (-1.01 barg) 4 40 psi (2.76 bar) 4000 psi (257.8 bar) 0 psi (0 bar) psig (-1.01 barg) psi (137.9 bar) 10,000 psi (689.4 bar) 0 psi (0 bar) psig (-1.01 barg) Reference accuracy - standard Range 1-4 For spans less than 10:1 [ ] Range 5 Spans less than 10:1 Range 2-4 For spans less that 5:1 [ ] Reference accuracy - high [ ] Inaccuracies related to this measurement: The pressure transmitter as mentioned above there is a lot of conversion from detecting a change in voltage to get the output in bar or psi. There will be an uncertainty related to each conversion. The reference accuracy for the Rosemount 3051T takes into account all the blocks from the pressure sensor to the digital/analog converter. Logger the logger that is converting the analog reading to a pressure value will also have an uncertainty. The logger might be supplied by the vendor of the software used or Expro will buy components and build a logger. Since the logger is a part of the software package and this is one of my limitation in this thesis, I have not been able to find the accuracies related to this equipment. The loggers that were build by Expro were build in UK, and here as well did I not manage to find out who was delivering the components and what the accuracy related to each component was. Location the Rosemount 3051T comes in different range sizes. It is important to place a pressure transmitter with a correct range at the right place in the well test system. If a transmitter with lower range than necessary is placed in a particular place in the system you wil not get the correct reading. Procedure there is no procedure related to this measurement. The installation of pressure tranmitter is done by the data aquasition personnel. 44
, and this will change the resistance as a function of temperature.")
46 7. Discussion Surface Temperature The surface temperature is measured by the use of a temperature transmitter. A temperature transmitter has a sensor called a resistive temperature detector (RTD), and this will change the resistance as a function of temperature. The most common sensor is a Pt100 that measures 100 omhs at 0 C. A change in temperature on the Pt100 sensor will create a change in its resistance. The resistance can be measured and the temperature can be attained.[15] A picture of a temperature transmitter from Rosemount is shown to the right. Inside the probe will there normally be a 3 wire circute system for a temperature transmitter. The wire will approximately be of the same length as the probe. Since we have some length on the probe to be able to measure temperature in the center of the pipe, there will be an additional resistance in the wire. To compensate for this resistance, an additional wire is used. Illustrations of different wire setups and their function will be discussed breifly below.[15] 2 wire connection[15]: Figure 24 Temperature transducer[21] In a two wire probe you will have a lead resistance over the wire and no compensation for it. The lead resistnance will be added to the sensor resistance. 3 wire connections[15]: In a three wire probe you will have three wires connected to the temperature transmitter where the third is compensating for the resistance over the wire. 45
47 7. Discussion 4 wire connections[15]: A four wire probe is used when a higher accuracy is wanted. You will here have a lead resistance compensation on both sides of of the Pt100 sensor. The temperature transmitter has a similar process as the one for pressure, see block diagram below. The Pt100 element detect a change in resistance due to temperature change and sends it to the analog/digital converter. The CPU unit processes the resistance against the max and min range set for the transmitter and the process continues as for the pressure transmitter. A short summary of the accuracies related to the equipment used will be described in the next section. The full technical specification can be found in Attachement IV. Upstream choke where we have high pressure, clamp-on transmitters are used. This is a more secure way to measure temperature since no probe need to be inserted in a dataheader. As the name implies is this transmitter clamped around the pipe. The PT100 element is placed on the inside of the clamp, and changes in temperature of the fluid is transferred through the metal and gives a resistance change at the Pt100 element. It works exactly like the transmitter described above and has the same accuracies. 46
48 7. Discussion Temperature transmitters use by Expro: 1. Rosemount 644H Table 6 Temp. transmitter specification 1[36] Accuracy Sensor option Sensor reference Input range Recommended min. span Digital accuracy 2-,3-,4-wire RTDs C F C F C F Pt100 IEC 751, to 1995(α= ) to Pt100 JIS 1604, 1981 (α= ) Sensor option -200 to to 1193 Ambient temperature effect Sensor reference Temp. Effect per 1.0 C Range (1.8 F) change in ambient temperature 2-,3-,4-wire RTDs Pt100 IEC 751, 1995(α= ) Pt100 JIS 1604, 1981 (α= ) D/A accuracy ±0.15 ±0.27 ±0.03% of span ±0.15 ±0.27 ±0.03% of span C ( F) Entire Sensor input range C ( F) Entire Sensor input range D/A Effect 0.001% of span 0.001% of span 2. Rosemount 3144P Table 7 Temp. transmitter specification 2[37] Accuracy Sensor option Sensor reference Input range Recommended min. span Digital accuracy 2-,3-,4-wire RTDs C F C F C F Pt100 IEC 751, to 1995(α= ) to Pt100 JIS 1604, 1981 (α= ) Sensor option -200 to to 1193 Ambient temperature effect Sensor reference Temp. Effect per 1.0 C Range (1.8 F) change in ambient temperature 2-,3-,4-wire RTDs Pt100 IEC 751, 1995(α= ) Pt100 JIS 1604, 1981 (α= ) D/A accuracy ±0.10 ±0.18 ±0.02% of span ±0.10 ±0.18 ±0.02% of span C Entire Sensor input range C Entire Sensor input range D/A Effect 0.001% of span 0.001% of span 47
49 7. Discussion Inaccuracies related to this measurement: The temperature transmitter for the temperature transmitter a lot of conversion will also be done before the correct value can be read from the software. We have similar block diagram as for the pressure transmitter and the accuracy for each transmitter takes into account all uncertanties from the PT100 element to the digital/analog converter. This is connected to the same logger as for the pressure transmitter, so the accuracy for the logger will be the same here. Procedure there is no procedure related to this measurement. The installation of the temperature transmitter is done by the data aquasition personnel. 48
50 7. Discussion BS&W BS&W stands for Base Sediment and Water. This is a measurement done to determine whether a clean-up is achieved or not. Equipment that is necessary is - Sample bottle - Centrifuge (mechanical- or hand-operated) The sample should be taken downstream choke. At this location there will be turbulent flow and the fluids will be well mixed. A sample should never be transfered to another container because this will leave some content in the original container, making the sample unrepresentative. A sample should be taken directly into a centrifuge for separation. The BS&W is expressed and recorded as the water content and sediment/solid content. Samples can also be taken from the oil line on the separator to indicate how much gas we have entrained in the oil. BS&W equipment used by Expro: 1. Samling cylinder 100 ml 250 ml 2. Centrifuge Figure 25 BS&W measurement Inaccuracies related to this measurement: Sampling cylinder normally a 100 ml conical sampling cylinder will be used. If you have fluids with foaming problems, a 250 ml sampling is used to make sure you have enough space in the cylinder to get 100 ml representative sample. If the level is above or below when you take the reading, calculations need to be done to get exact precentage reading of BS&W. Sampling point the BS&W can be taken several places in the well test system. It is important to have correct sampling point to make sure you have a good mixing of the fluids and the best conditions will be when you have turbulent flow. Condition of the fluids the phase of the fluid will have an impact on this measurement. For crude oil you will have the possibillity to take a sample of 100 ml, while for gas-condensate it might be more difficult. If you have a gas-condensate fluid, you would fill up the cylinder as best you can and take a reading from that. Since you do not have a full cylinder, calculations to find the right precentage have to be performed. Procedure the procedure that Expro has is similar to the one given by ASTM D e1. Both procedures state that toulene and demulsifier should be added to the sample to reduce interfacial tension between oil and water. A question was raised to offshore supervisors in Expro if this was something they acually add to the sample, and the answere was no. Normally special designed chemicals provided by customer areused if a field as fluids with separations problems. 49

51 7. Discussion Ph The ph measurement is commonly done if an acid job is done prior to a test or a clean-up. To find out if the acid has been washed out during the clean-up, we will measure the ph of the produced water. It is not important in the field to know what the exact ph value is, just if it is acidic or not. ph paper, or litmus paper, is a colour reacting paper. A colour scale indicates whether the water produced is neutral, acidic or alkali. 7 on the ph scale is nautral Anything below 7 is acidic Anything above 7 is alkali Figure 26 ph paper[11] Inaccuracies related to this measurement: No relevant unaccurasies the ph is only a rough measurement. The objectives is to identify acidic content of the fluids produced if an acid job has been done prior the the well test. With the use of ph paper we get color indication of which ph the fluid contain and that is the only information we need. 50

52 7. Discussion Salinity Salinity is a measurement taken of produced water. The purpose is to check if it is brine from drilling operations or formation water that is produced. In Expro a clean-up phase considered done when the BS&W is 0,1% or below. In some cases will this value not be reached, because formation water is produced. The salinity of the brine is known, so a refractometer is used to determine whether the produced water is brine or formation water. Figure 27 Refractometer A short summary of the accuracies related to the equipment used will be described in the next section. Refractometers used by Expro: Bellingham + Stanley Eclipse refractometer Table 8 Refractometer specification[38] Technical specification: industrial model Description Range Sacle division Salinity (%NaCl) Inaccuracies related to this measurement: No relevant inaccuracies salinity is also a rough measurement so no relevant unaccuracies is related to this measurement. The reading that is taken is to give an indication if it s formation water or brine that is produced. This can be of importancy in conjuction with the clean-up phase. A clean-up phase is considered done when the BS&W is less than 0.1%. If this can not be reached, the salinity can be tested to confim which type of water it is. 51

53 7. Discussion H 2 S and CO 2 H 2 S, hydrogen sulfide, is an hazardous, toxic compund found in crude oil and natural gas. It is a colorless, flammable gas that can be identified in relative low concentrations by the charactheristic rotten egg odor. At higher concentration the smells disappear because the gas paralysis the olfactory nerves in the nose, and it will affect respiratory tissues that can lead to death.[9] CO 2, carbon dioxid, is a slightly, odorless and colorless gas. At lower concentration the CO 2 affects the raspiratory- and central nervous system. Higher concentration will make it difficult to eliminate the CO 2 and it can accumulate in the body. This can in the worst case cause death.[9] Sampling and measurements for H 2 S and CO 2 should at least be conducted twice during a flow period. Equipment that is necessary is - Dräger pump/hand pump - Ampoules tubes (available in different sizes) There are different scales and types of the tubes and the understanding of the correct selection process is important for accurate measurement. Inside the tubes there is a paper coated with a chemical which reacts with the gas being measured. It can be measured in ppm or precentage. A short summary of the accurasies related to the equipment used, will be described in the next section. The full technical specification can be found in Attachement IV. H 2 S measure devices used by Expro: 1. Ampoules tubes by Dreager Table 9 Dreager tubes specification[39] Technical specification Hazardous Type Range Strokes Time for Standard Color change gas measurement deviation 0.5/a Approx. 6 min ± 5 10% White brown H 2 S ppm 5/b 5 60 ppm 10 Approx. 4 min ± 5 10% White brown 0.5 6/0.1 Approx %/a 1/5 CO 2 1.2% s/approx. 2.5 min ± 5 10% White violet 1%/a 1-20% 1 Approx. 30 s ± 5 10% White violet 2. Hand pumps by Dreager Figure 28 Dreager tubes 52
54 7. Discussion Inaccuracies related to this measurement: Tube selection when the content of a hazardous gas is to be measured, it is important to select the correct range. Normally the client will provide an estimate of what the expected content of that particular gas is, and the correct tube can be chosen. If a wrong tube is used, it can cause too low or high reading. Number of strokes each tube has a specified number of strokes that shall be applied by the handpump the tube is inserted to. The number of strokes shall be stamped on each tube, but can also be found in the specifications for each tube. It is important to apply the correct number of strokes since the scale on the tube is designed for a specific volume of gas sucked into the tube by the hand pump. Hand pump the hand pump should be checked for damage before use. If the bellow is damaged it will not suck in the correct volume of gas and it will giva a worng reading. Sampling compartment the measurement should be taken in a fairly closed chamber so it does not interfere with other gases. It is preferable to have the concentration as pure as possible to get most accurate reading. Since H 2 S and CO 2 are heavier gases than air, it is important to have continous flow from the separator to make sure they don t fall to the bottom of the compartment. The flow from the gas line on the separator should be controlled to make sure no condensate splashes into the compartment and goes into the ampoule tube. This will give worng reading. Table 10 Dreager fluids properties[23] GAS MOLECULE WEIGHT Air Carbon dioxide Hydrogen sulfide NTP - 20 C and 1 atm DENSITY(kg/m 3 ) Normal T and P Figure 29 H2S/CO2 sampling compartment Cross sensitivity some gases may interfere with the H 2 S or CO 2 and give wrong reading on the tube. The list of cases that may interfere can be found in the tube specifications in Attachement IV. Procedure the Expro procedure states that a gas balloon or a stainless steel cylinder should be used for measurement. This is not in conjuction with what is actually done offshore. Offshore supervisors use the method described above with continous flow into a fairly closed chamber. After asking the Expro fluids mananger what she recommended to use, she said that gas balloon and sampling cylinder should be avoided since the gas may absorbe and give wrong reading.[24] 53
55 7. Discussion Oil gravity The specific gravity of oil is calculated with reference to water. It is defined as the ratio of the density of the oil to the density to the water at a specific temperature and pressure.[13] To measure the specific gravity Expro uses thermohydrometers. This is an equipment measuring both specific gravity and temperature of the oil. A hydrometer only measures specific gravity and temperature needs to be measured separate with a thermometer. From now on both will be described as hydrometer. The hydrometers are made with various ranges and both API and SG scales. To convert from specific gravity to API gravity,or vice versa, we need to use the following formulas Figure 30 Hydrometer[22] Another device to measure oil gravity is densiometer. A densiometer works by a drive coil that forces a tube to vibrate at some natural frequency which is a function of the tube s mass per unit length. When a fluids flows through the tube, the resonant frequency varies with the density of the fluid[5]. A short summary of the accuracies related to the equipment used will be described in the next section. 54
56 7. Discussion Oil gravity devices used by Expro: 1. Thermohydrometer Table 11 Thermohydrometer specifications[40] Technical specification ASTM no. Range S.G. Accuracy 82H SP.GR 83H SP.GR 84H SP.GR 85H SP.GR 86H SP.GR 87H SP.GR 88H SP.GR 89H SP.GR 90H SP.GR Table 12 Aerometer specifications[41] Technical specification - Areometer Range S.G. (g/ml) 1,100 1,200 1,200 1,300 1,300 1,400 1,400 1, Cylinder Table 13 Cylider specification Plactic cyliders 250 ml 500 ml 1000 ml 3. Densiometer Table 14 Densiometer specification[42] Technical specification Density range Accuracy Temperature range Accuracy 55
57 7. Discussion Inaccuracies related to this measurement: Hydrometer selection it is important to select the right hydrometer when the measure of the oil gravity is to be performed. In Expro inventory two hydrometer types available. One is in conjuction with the ASTM standard, the other not. We see from the technical specification above that the ASTM hydrometer is in the range 0.05 while the other one is of range 0.1. With a larger scale range it can be assumed that the error will be larger since this is a reading done by the eye. There are no given accuracy from the manufacturer for these hydrometer. Cylinder there is requirement to the clearance between the cylinder bottom and walls when the hydrometer is installed. 1 between the hydrometerand the bottom of the cylinder and the ID of the cylinder shall be 1 greater than the OD of the hydrometer. A cylinder of appropriate size shall therefor be chosen. Corrections to standard condition The correction of the oil gravity to standard conditions is either done by the software used for data aquasition or can be quick checked by an Excel spreadsheet created internally in Expro. The input values are uncorrected specific gravity of oil, temperature of the oil in the cylinder when the S.G. of oil is read, and the oil line temperature when the sample was taken. The output values are k factor and corrected specific gravity. See Attachment I for formulas used for correction to standard conditions. Densiometer Densiometer has a lower accuracy than hydrometers and should not be used for oil gravity measurements. A reading with densiometer is done to spot check the reading of the hydrometer. A densiometer will also have problems with measuring the density if you have a light oil with gas bubbles. Offshore supervisors states that in a situation like this you will most likely not get a reading at all. Hydrometer should therefor allways be used. Procedure the procedure given by Expro is very brief compared to the ones given by ASTM D287-12b and ASTM D b. The ASTM standards recommend to take two measurements and have requirements about how small the variation in temperature should be. The Expro procedure does not say anything about this. 56
58 7. Discussion Gas gravity The specific gravity of gas is normally calculated with reference to air. It is defined as the ratio of the density of the gas to the density of the air, at a specific temperature and pressure.[10] To measure the specific gravity we use a Gas gravitometric method, a Ranarex. The Ranarex consists of two cylindrical, gas-tight measuring chambers, each having a separate inlet and outlet connection. In each chamber there is an impeller and an impulse wheel, both with axial vanes. These wheels are mounted on separate shafts, facing each other but not touching. An electrical motor and drive belt rotate the impellers at the same speed and in the same direction. The impellers draw continuous flow of gas sample into upper chamber, and reference air into the lower chamber. They spin the gas and air against the vanes of the corresponding impulse wheels. As the spinning gas and air impinge against the vanes, they create torque on the wheels that are proportional to the density of the gas and of the air. The torque is transmitted from the chambers to two external measuring wheels. A flexible tape is wrapped on the measuring wheels so that the torque creates two opposing forces as shown in the schematic below. The measuring wheels are restrained from continuous rotation, but a difference between the torque forces allows limited motion of the entire system. The measuring system divides the torque of the gas divided by the density of the air, and thereby measures specific gravity[31]. See schematic below. This description is taken from the Ranarex gravitometer datasheet. Figure 31 Ranarex meauring wheels schematics[32] At the inlet there is a compartment with silica gel to remove moisture in the gas before the specific gravity is measured. 57
59 7. Discussion A short summary of the accuracies related to the equipment used will be described in the next section. The full technical specification can be found in Attachement IV. Figure 32 Ranarex gravitometer[12] Gas gravity devices used by Expro: 1. Ranarex gravitometer Table 15 Ranarex specifications[31] Technical specification S.G range Dual scale: & Accuracy ± 0.5% of actual value 2. Gas bladder 58
60 7. Discussion Inaccuracies related to this measurement: Ranarex gravitometer the accuracy related to the specific gravity measurement of gas is the accuracy related to the gravitometer itself. The device measures the density of the gas related to the density of the air at same pressure and temperature. So temperature and pressure will have no effect on the reading. The gas bladder that is used for sampling do not hold pressure or temperature, so as soon the bladder is removed from the sampling point at the separator and carried to the lab container, the atmospheric conditions will in theory work upon the gas. Silica gel compartment the silica gel can only remove small amounts of moisture in the gas. If larger amounts of liquids in the gas enter the Ranarex the silica gel will not be able to handle the amount and the measurement will be wrong. In worst case it may damage the Ranarex gravitometer as well. This is especially related to wet gas and gas condensate systems. 59
61 7. Discussion Oil flow rate Oil rates are normally measured by turbine meters. The turbine meter normally consist of a moving part, an impeller held in place by high pressure, low drag bearings. A magnetic transducer is installed in the meter body to count revolutions as the flow passes. The pulses from the transducer are determined for a known volume passing through the meter. This factor can be in pulses per gallon or other desired unit volume[5]. A picture of the components in a turbine meter is shown below. Figure 33 Turbine meter internal components[5] Due to pressure loss from the turbine meter to the calibration tank, a meter factor needs to be taken. The pressure loss is created by the level control valve downstream the turbine meter and regular pressure drop in pipe. A decrease in pressure can cause changes in the oil and give precipitations of gas. The phase envelope below illustrates what happens when the pressure decreases for oil. Figure 34 Phase envelope[26] 60
62 7. Discussion The meter factor is given as the relationship between the volume that passes through the turbine meter and a measured volume in the calibration tank. These two readings need to be done at the same time. To be able to give the oil flow rate at standard condition a shrinkage factor need to be added. This is a measurement done in the calibration tank where you take a known volume of oil and bleed the pressure to zero and record the shrinkage of oil. The oil will shrink due to gas precipitation when the pressure decreases. The formula used to measure the oil rate is ( ) ( ) ( ) ( ) taken at the meter (also called k-factor) The formula above is given by the Expro procedure for manual calculations. Devices used by Expro to measure oil flow rate: 1. Cameron Nuflu turbin meters Table 16 Turbin meter specification[43] Flow meter size mm GPM M3/Hr BPD Nominal cal. factor Max. output frequency Pulses Gallon Pulses/sec ½ ¾ / ½ Expro calibration tank 3. Expro shrinkage tester 4. Software to calculate flowrate (IDEA or Edge-X) DP at max flow psi 61
63 7. Discussion Inaccuracies related to this measurement: Turbine meter for the turbine meter we will have the accuracy related to the meter. Table 17 Accuracies turbin meter[43] Meter grade Linearity Repeatability Industrial ±0.05 of reading ±0.02% Another small accuracy that might be mentioned, which in most cases has a very small impact on the reading, is the hydrostatic pressure from the separator and down to the pipe line where the meter is installed. If you have an oil that is at bubblepoint conditions in the separator, the pressure drop down to the meter might cause a release of solution gas that will contribute to higher meter reading. This effect is dependent on which type of oil you have. Dead oil will not have this effect, while light oil and condensate that is already at bubblepoint pressure in the separator, can start create small gas bubbles with a small decrease in pressure. Meter factor the meter factor is taken in two different ways in Expro. One regular meter factor and one combined meter and shrinkage factor. The combined meter and shrinkage factor is the most common today in Norwagian sector. Each method, and inaccuracies related to them, will be described below. 1. Meter factor Meter factor is determined by taking reading from the turbine meter and a reading from the tank at the same time. The calibration tank shall have a sideglass with a calibrated measuring scale on it. The duration can vary from 15 to 50 minuts, or for a fixed volume. Either way, it is important to note duration and volume. The meter factor is given by the following equation The meter factor is multiplied with the volume measured by the meter to give the corrected metered volme at separator conditions. 2. Combined meter and shrinkage factor A combined meter and shrinkage factor is the meter factor decribed above including the change in volume of a liquid phase caused by the release of solution gas and temperature expansion of the liquid. The equation for combined meter and shrinkage factor is given by the following equation ( ) It is important to have good communication between the person taking the reading at the meter and the person taking the reading at the tank to get the same start and finish time. For the combined meter and shrinkage factor it is important to give the oil in the tank sufficient time to settle and release gas. A more rare inaccuracy related to the meter factor, is installation of wrong sideglass on the calibration tank. Each calibration tank will have different diameter, hight and number of installed nozzles. That means that the sideglass with measuring scale is unique for that particular tank. Switching sideglasses on tanks due to small time frames or other issues shall never be done. 62
64 7. Discussion Shrinkage factor the shrinkage is describe as a decrease in volume of a liquid caused by the relase of solution gas due to thermal contraction of the liquid and reduction in pressure to standard pressure, 1 bar or 14,5 psi. The shrinkage can be measured in two different ways. 1. Shrinkage tester The shrinkage tester is installed at the separator and has one gas inlet and one oil inlet. A known volume of liquid is transferred to the shrinkage tester at separator pressure and de-pressurised. The gas can be vented under controlled conditions. An example is given below 2. Combined meter and shrinkage factor This is the same as described in the section for meter factor. The accuracies of the shrinkage tester are related to possibility to fill the shrinkage tester to the top of the scale. This might be a problem if you have a well with low liquid production. If high liquid level in the separator can t be obtained, then the shrinkage tester should be filled as high as possible and the shrinkage in procentage be calculated from that point. Another remark is not to vent off too quickly, as this can cause flash off of heavier components and give too great reduction in volume. Figure 35 Shrinkage tester It is most common to the shrinkage on the calibration tank and verify that shrinkage with the result from the shrinkage tester. Volume correction factor due to temperature a volume correction factor is the change in volume caused by change in temperature to standard, 15 C or 60 F. The calculation of a VCF requires three input variables - Final shrinkage temperature - Oil SG temperature - Oil SG In Expro the VFC calculated in the software is used with the variables mentioned above as input parameters. There is also an Excel spreadsheet provided to calculate the VCF and the specific gravity of oil at standard conditions. The formulas used for calculating the VCF in the Excel spreadsheet is given in Attachment I. During the investigation on how to calculate the volume correction factor various methods have come up. Calculations provided by Expro can be found in Attachment I- Expro procedures, while the one given by ASTM can be found in Attachment II New procedures and Attachement III Tables used for calculations. The different calculations for volume correction factor will be compared under the section 7.2 Field evaluation. 63
65 7. Discussion In Attachment III a table for volume correction factor from GPSA can also be found. Here are the factors given for each 10 th celsius with interpolation necessary to get a correct value. This method in not described in this thesis. Flow rate equation the flow equation will contain all uncertainties and inaccuracies related to the factors above. Since the volume correction factor is the factor that requires the greatest calculation, this will contribute to the largerst error. Since this factor is calculated by the software we can assume that the error related to this factor is reduced significantly. Still some inaccuracies related to the specific gravity measurement will be included since this valuis is a part of the VCF calculation. The BS&W can also be a factor that contributes to an error. Procedures that explain the flow rate calculation do not explain that this is the BS&W reading taken on the oil line. This is a measurement that is rarely taken on well tests Expro performs. In the software this factor is set as zero, and the BS&W from downstream choke is typed manually into the tables. Below are illustrations with three different methods on how to find the total volume correction factor for oil flow rate. The fewer steps to correct to standard conditions, the more accurate the total correction factor will be. Figure 36 Total volume correction factor 64
66 7. Discussion Figure 37 Meter factor method 1 In method 1 the first reading is taken at the turbine meter with oil line properties. A certain amount of oil flows through the meter for a period of time and is diverted to the calibration tank. The initial tank level before oil is diverted to tank needs to be known. The second reading is taken after the oil flow has been diverted back to the flare and the pressure in the calibration tank has been bled down to zero. The oil should get some time to settle before the second reading is taken. Even if the pressure is at standard conditions, the temperature might be above or below 15 degc. A correction for temperature needs to be added, and this is done by calculations. In Expro the temperature correction is included in the CMSF term, but this creates some confusion. I would like to use following terms Combined meter & shrinkage factor: Volume correction factor due to temperature: {[ ( ) ] } Total volume correction factor: 65
67 7. Discussion Figure 38 Meter factor method 2 In method 2 the first reading will also be at the turbine meter with a certain amount of oil flowing through the meter for a period of time. Immediately after the flow has been diverted back to the flare, is a reading taken at the tank. This reading divided by the meter reading gives the so-called meter factor After the intermediate reading is taken, the pressure in the tank is bled down to zero. The oil should settle for a time before the final tank reading is done. This is the combined meter and shrinkage factor as described in method 1 and these two factors shall in theory be similar. Since two calculations are done in this method to find the CMSF, compared to method 1, this will give a bigger error for method 2 than for method 1. The correction due to temperature will also need to be added to find total volume correction factor 66
68 7. Discussion Figure 39 Meter factor method 3 In method 3 the volume that passes through the meter is corrected for both pressure and temperature. No calibration tank and meter factors are measured. This is a theoretical method and not recommended. The best practice for use offshore will be to use a combination of method 1 and 3. With method 3 you will have an estimate of what the expected volume at standard conditions should be, while with method 1 you are measuring actual volume with only temperature correction as an error. We know for a fact that theory and practice not always are equal to each other, but they should at least be similar. 67
69 7. Discussion Gas flow rate Gas flow rate has normally been measured by a orifice meter, but coriolis meter has recently taken more and more over. Coriolis meter will be described briefly in the next section. An orifice meter is a fluid flow measuring device that gives a differential pressure due to a reduction in pipe size created by an orifice plate. The gas flow rate is given by the following equation. This equation is the one given by Expro procedure for manual calulation. ( ) Some of these factors require measurements to calculate while some can be found in tables. When calculating these factors it is important to know which units the formulas are given for. The factors described above is taken from the internal Expro manual calculation procedure based upon AGA 3. and costumary units is used. GPSA gives formulas and tables in Metric units, and these are only included in the comparison of factors in section 7.2. Below I will describe the orifice meter and which measurements are taken. In the section Inaccuracies related to these measurement I will describe each factor that is included in the calculation and the inaccuracies related to them. Today software is calculating most of the factors and giving the final flow rate. Under section 7.2 I will compare the factors and flow rate given by the software, with calculations done with equations given for each factor. A calculation based upon the GPSA is also included in section

70 7. Discussion Devices used by Expro to measure oil flow rate: 1. Orifice meter Daniels box The orifice meter consists of two pressure gauges connected to an orifice flange recording the static pressure and the differential pressure. The orifice meter is usually installed in the gas line at the separator. A orfice plate with a smaller ID then the pipe is lowered to form a differential pressure. The plate is held perpendicular to the flow by flanges. The thickness of the orfice plates depends on the nominal diameter of the pipe the orfice meter is installed in. The upstream face of the plate shall be flat and perpendicular to the axis of the pipe, while the downstream face shall have a chamfer between See picture below. Inlet and outlet should be Figure 40 Daniel box[5] stampled on the plate to indicate how it shall be installed. If this is not the case, then flat end is the inlet and the one with the chamfer the outlet[5]. Figure 41 Orfice plate[5] 2. Pressure transmitters Described in section Temperature transmitters Described in section Straightening vanes Straightening vanes should be installed upstream to the orfice meter to eliminate swirls and create laminar flow. The straightening vanes consists of a number of parallel passages of relative small transverse dimensions installed in the pipe. The vanes should not have an area greater than 1/16 of the cross section area of the inside of the pipe to give maximum efficiency[27]. Figure 42 Straightening vanes[5] 69
71 7. Discussion Inaccuracies related to this measurement: Pressures for the pressures used for static, differential and factor calculations the accuracies for Rosemount pressure transmitters and process described in section will be relevant. Temperature for temperature used to calculate factors the accuracies for Rosemount pressure transmitters and process described in section will be relevant Orfice plate any deformation to the edge in the orifice plate can cause an increase in the flow measurement inaccuracy. The plate should therefore be treated with care and be kept clean at all times. Meter tubes - meter tubes is the term for straight upstream and downstream pipe of the orifice meter. There are requirements on how the meter tubes should be when it comes to measuring the gas rate. For further explanations will A be the upstream pipe and B the downstream pipe. For upstream pipe it is a requirement that A should be at least 10 times the meter tube diameter. In elbows turbulent flow is created and sufficient length after an elbow and straightening vanes help to create laminar flow before the gas reaches the orifice meter. An orifice meter installed too close to an elbow will therfore create an inaccurate differental pressure, thus a wrong gas flow rate. Units it is important to insert data with correction unit into the different equations. The equations will vary depending if it is costumary units or metric units that are used. Orifice flow constant for the orifice flow constant I will describe each factor and the accuracies related to them. These equations is for costumary units. Full calculations for each can be found in Attachment VI. 1. F b Basic orifice factor The basic orifice factor can be found from a table given in Attachment III or by using the following equation Correct values on the ID of pipe and orfice need to be known to get an accurate basic orifice factor. There should also be mention if flanged or pipe taps orifice meter is used. In Expro flanged taps are most common, and for further factors this is the type that is evaluated. 2. F r Reynolds number factor The raynolds number factor can be found from a table given in Attachments III or by use of the following equation Any inaccuracy related to the pressure and differential pressure transmitter will give an inaccuracy in the reynolds number factor. 3. Y expansion factor The expansion factor can be found from a table given in Attachment III or by use of the equation for Y given in Attachment VI. The equation varies depending on flange or pipe taps meter and if the measurement of static pressure is taken upstream or downstream. 70
72 7. Discussion For the expansion factor correct value for ID s on pipe and orfice, differential pressure and flowing gas pressure are necessary to get a correct value. It should also be mentioned whether the static pressure is taken upstream or downstream of the orifice meter. 4. F pb Pressure base factor Pressure base factor is calculated by the following equation The base pressure is the standard pressure in customary units and is set to psi. In Norway the standard pressure is normally considered as 1 atm. 5. F tb Temperature base factor The temperature base factor is given by the following equation The base temperature is the standard temperature in costumary units and is set to 59 degf. In Norway the standard temperature is normally considered as 15 degc. 6. F tf Flowing temperature factor The flowing temperature factor is given by the following equation ( ) The inaccuracy will be related to the temperature transmitter installed in the orifice meter. 7. F gr Specific gravity factor The specific gravity factor is given by the following equation The inaccuracy will be related to the Ranarex gravitometer. 8. F pv Supercompressibility factor The supercompressibility factor is given by equations given in Attachment VI. The input data for the super compressibility factor is gas gravity, H 2 S, CO 2 and N 2 content. N 2 is not a measurement that is commonly taken, so this input falls out of the equation. The three other parameters can be measured and used in the calculations. As we can see from the 71
73 7. Discussion attachment there are several equations that are calculated before the compresibility, Z can be found. One of the parameters that needs to be calculated, and I consider as critical for the final compressibility, is the pseudocritical density. This value needs to be found by iteration, but the procedure does not give an acceptence value for when the interation can be considered done. The Expro procedure is based on the Dranchuk et al calculation, and I tried to get hold of this procedure to see if they had any acceptance criteria for the interation. I did not manage to find this. The procedure for gas calculations was based on the AGA. 3 standard, but the standard did not give the derivation of the supercompressibility factor either. Another method is to find the Z value from graphs, see Attachment IV. One graph is base on pseudocritical pressure and temperature. This will be the most accurate one, but for exploration wells the critical pressure and temperature are not normally known. In such case the other graphs that are based upon mole weights can be used. These graphs are only given for a few mole weights so unless you have the exact weight there will be an inaccuracy related to this factor. Orifice thermal expansion factor, F a in the GPSA handbook an additional factor is added to the equation, the orfice thermal expansion factor. This is a factor that is not included in the Expro manual calculation procedure. If this is a factor that is implemented in the software is unknown. The factor is given by the following equation in metric units ( ) This will be a small number with only changes in 3 rd decimal, but it will still contribute to a change in final flow rate. 72
74 7. Discussion Coriolis meter Coriolis meter measures mass flow, density and temperature of gas and liquids that pass through a process control pipe. This is an alternative to turbine meter and orifice meter. The mass flow rate is captured by sensing the vibrations of the tubes caused by the coriolis force on the medium that passes through the meter. For installation the orientation of the coriolis meter depends on which fluids are going to flow through it. A illustration is shown below Figure 43 Coriolis meter orientation Coriolis meter can measure both mass flow and volumetric flow. If volumetric flow is to be measured, the specific gravity of the fluid needs to be included. For Liquids the density can be measured by the coriolis, but this is not recommended for gas by manufacturers. Expro is therefor always measuring mass flow when coriolis meter is used. Below is a illustration of how the coriolis meter works Figure 44 Coriolis meter function 73
75 7. Discussion Coriolis meter used by Expro: Table 18 Coriolis meter specification[44] MicroMotion ELITE High Capacity flow and density meters Liquid flow performance Mass flow Zero stability Lb/min Metric Kg/h Lb/min tons/hr Maximum flow rate CMFHC CMFHC Mass flow accuracy ±0.10% of rate Repeatability ±0.05% of rate When flow rate is less then zero stability(0.001), [( ) ] of rate and [ ( ) ] Gas flow performance Massflow Zero stability Typical flowrates Lb/min Kg/hr Lb/min Air CMFHC CMFHC Natural gas CMFHC CMFHC Mass flow accuracy ±0.35% of rate Repeatability ±0.20% of rate When flow rate is less then zero stability(0.0035), [( ) ] of rate and [ ( ) ] Density performance (LIQUID ONLY) g/cm^3 Kg/m^3 Accuracy ± ±0.5 Repeatability ± ±0.2 Range Up to 5 Upt o 5000 Inaccuracies related to this measurement: Orientation the coriolis meter can be used to measure both oil rate and gas rate. Since liquid is heavier that air and gas lighter, the orientation needs to be different when the coriolis meter is installed. Density only density for liquids can be measured with a coriolis meter according to manufacturers data sheets. For gas density the gas gravitometer described earlier should be used. Flow rate equation the conversion from frequency of vibration to flow rate is a part of the software connected to the coriolis meter. There will be some uncertanties related to this, but since the software is a limitation, no inaccuracies are available to discuss. 74
76 7. Discussion 7.2 Evaluation of test data In this subchapter three different field cases will be investigated with the focus on flow rate calculations. Flow rates is one of the most important surface data that the client wants to collect. As mention above, most of these calulations are done by softwares today, but formulas implemented in softwares should come from an approved standard. Issues that came up when investigating real data compared to procedures and standards will also be discussed Case 1 - Gas well, DST The software that was used for handling data for this project was IDEA. WELL TEST SUMMARY Date Time Gas Q SM3/Day Flow period 1 xx.xx.xx 15: Initial flow 18: Flow period 2 xx.xx.xx 22: Cleanup flow 02: Flow period 3 xx.xx.xx 11: Main flow Flow period 4 Sampling flow 17:55 xx.xx.xx 00:00 06: C Gas V SM Oil Q SM3/Day C Oil V SM Sep P Bar Sep T Deg C GAS CALCULATION Date Time Gas DP Gas P Gas T Gas SG Hw Pf CO2% H2S mbar Bar Deg C wg Psia ppm Flow period 1 xx.xx.xx 18: Initial flow Flow period 2 xx.xx.xx 02: Cleanup flow Flow period 3 xx.xx.xx 17: , Main flow Flow period 4 xx.xx.xx 06: Sampling flow OIL CALCULATION Date Time 2 Oil Meter MF Flow period 1 Initial flow Flow period 2 Cleanup flow Flow period 3 Main flow Flow period 4 Sampling flow 3 Oil Meter MF Oil SG corr Oil SG uncorr ODCT Deg C BS&W % Shrink age % K factor xx.xx.xx 18: xx.xx.xx 02: xx.xx.xx 17: xx.xx.xx 06:
77 7. Discussion Below is a comparison of factors used in the gas equation calculated by the IDEA software and manual calculated factors. The equations are taken from Expro manual calculation procedure. This procedure was based upon AGA 3. Standard. The GPSA factors include both calculated and table values. The tables can be found in Attachment III and Mathcad calculations in Attachment VI. Remember that the GPSA calculates factors in metric unit, and this will of course give a difference in some of the factors. Software vs. manual gas calculations MEASURED VALUES Date Time Gas dp mbar GasP Bar GasT Deg C Gas SG Hw wg Pf Psia xx.xx.xx 20:30: ,1 Pipe OD Pipe ID Orfice size CALCULATED VALUES Fb Fpb Ftb Fg Ftf Fr Y Software AGA GPSA Fpv Fa Gas Q (scf/hour) Gas Q (Sm3/day) Software AGA Calculated with customary units GPSA Calculated with metric units From the results above can we see that the flowrate is higher for the values by AGA.3 and GPSA method than for the software. The super compressibility factor will have a hugh impact on the final result and we see that this is the factor that varies the most. The supercompressibility factor will be the most critical value in the flow equation. In the GPSA method only correlated tables based upon mole weights are given. In the Expro manual calculation procedure iterations is used, but no convergace criterion was given. The criterion that is given in the Mathcad file was taken from another Expro procedure, but this procedure had no references, thus not suited for use. Another method that would give a more accurate supercompressibility factor is to get the Z value from a chart based upon pseudo-reduced pressure and temperature, see Attachment III. These are calculated by the following equations where P c and T c are critical pressure and temperature. To find these values the composition must be known and for exploration wells this is not common information to have. If other wells have been drilled at the same field and the composition is know these critical values can be used. 76
78 7. Discussion Case 2 - Gas/condensate well, Clean-up The software that was used for handling data for this project was EDGE-X. WELL TEST SUMMARY Date Time Choke size 64th BHP Bara BHT Deg C WHP Barg WHT Deg C Standard conditioans Gas rate MMm3/ d Flow period 1 Cleanup flow xx.xx.xx 23:41 02:41 Flow period 2 xx.xx.xx 04:04 Multirate flow 06:10 Flow period 3 xx.xx.xx 06:20 Multirate flow 08:30 Flow period 4 xx.xx.xx 08:35 Multirate flow 16:00 WELL PARAMETERS EMISSIONS INFORMATION CO2(max) 2 % Metered gas MMm3 H2S(max) 4 Ppm Metered oil M3 Gas SG(average) Metered Water M3 Oil SG(average) C Injected MEG 2.8 M3 Slop returns 81 M3 Oil rate M3/d W rate M3/d In gas condensate field phase changes and two-phase flow will be the biggest issues. Measurements like BS&W, oil gravity, gas gravity, H 2 S and CO 2 can be affected if gas is dissolved in oil or oil dissolved in gas. For BS&W we might have too little condensate to be able to take a full sample of 100 ml. Here the outdated 15ml cylinders with hand operated cetrifuged might be of use. When oil samples are taken from the separator to measure oil gravity this oil will most likely be at the bubblepoint pressure. When the oil gravity is measured the pressure will be at atmospheric pressure. Before the reading is taken the oil should get sufficient time to settle and release disolved gas. If the measurement is done immideately after the sample is taken gas may still be disolved in oil and give a lighter oil gravity. For H 2 S and CO 2 measurements the statement mentioned in section about controlled flow from gas line to closed chamber compartment is important. Since reduction in pressure and temperature will create condensate we need to assure that no liquids splashes in the compartment and enter the dreager tube. The same will occur when you take samples for gas gravity measurement. If you have a heavy gas condensate system, a large liquid slug may be created in the gas bladder balloon. If this is held with the inlet down when you transport the balloon from the sampling point to the laboratoy container, the water will be collected at the inlet. This amount of liquid the silica gel at the inlet will not be able to handle and this may damage the Ranarex gravitometer. 77
79 7. Discussion Case 3 - Oil well, DST The software that was used for handling data for this project was IDEA. WELL TEST SUMMARY Date Time Choke size 64th BHP Bara BHT Deg C WHP Barg WHT Deg C Standard conditions Gas rate MMm3/ d DST1 Main flow period xx.xx.xx 10:00 10:00 DST2 Main xx.xx.xx 15:28 flow period 15:30 DST1 WELL PARAMETERS EMISSIONS INFORMATION CO2(max) 0.2 % Metered gas n/a MMm3 H2S(max) 0 ppm Metered oil M3 Gas SG(average) Metered Water 14.0 M3 Oil SG(average) F Injected MEG 0.8 M3 DST2 Oil rate M3/d n/a WELL PARAMETERS EMISSIONS INFORMATION CO2(max) 0.2 % Metered gas m3 H2S(max) 0 ppm Metered oil M3 Gas SG(average) Metered Water 10.6 M3 Oil SG(average) F Injected MEG 4.2 M3 W rate M3/d Below is a comparison of correction of oil density back to standard conditions. Calculations of these values can be found in Attachment VI. The calculations below is based upon the CMSF spreadsheet for this job in Attachment V. Oil calculations comparison MEASURED VALUES ON OIL LINE Date Time Meter Oil SG Oil SG T, C Oil line T, C xx.xx.xx 18:20: OIL DENSITY CALCULATED VALUES VCF OilAPIcorr OilSGcorr ASTM Excel Manual METER FACTOR CALCULATION mathcad files Attachment VI Tank1 Tank2 Oil line Shrink1 Shrink2 DegC VCF VCF VCF VCF - API
80 7. Discussion The volume correction factor includes in most cases only the temperature correction since all measurements and readings are taken at atmospheric pressure. As mentioned earlier the specific gravity of oil is corrected to standard conditions by the software used, but Excel calculations and manual calculation procedures are still available within Expro. From the oil temperature above we should expect a volume correction factor above 1 to correct the temperature up to 15 degc and a decrease in specific gravity. We see that this only occurs for the ASTM method. The Excel spreadsheet gives a decrease in specific gravity, but the correction factor is below one. In the Excel spreadsheet this is separately calculated. The correction factor that is calculated in the Excel spreadsheet is apparently the correction factor for the Oil line temperature. This Excel spreadsheet has no references attached to it and no named author. This is therefor not a reliable tool to calculate the corrected gravity and correction factor. The correction factor given by Expro manual calculation procedure has reference in ASTM D This standard has expired and the procedure should have been updated with the new ASTM standard D b and API All the output values from this procedure are opposite of what is expected, so this procedure should not be used as a reliable source for calculating VCF. A correction due to temperature is also neccesary when the combined meter & shrinkage factor is taken. There is no procedure given by Expro on how to measure the meter factor or how to correct it to standard conditions. Due to lack of procedures different methods have been used. The DAQ personel offshore have used an Excel spreadsheet created locally to calculate the final meter and shrinkage factor that is used to correct the flow rate measured at the turbine meter. In Attachment I a template of the excelsheet they use for calculation CMSF can be found. The yellow cells are for input values and red cells for output values. There is no protection on the red cells with formulas, so anybody can change the formulas if they want. When I checked one of the meter factors taken for Case 3, three different formulas for VCF were inserted in the spreadsheet. A document like this should be protected with only input cells open for changes. In the table above all correction factors for all the three formulas found in the spreadsheet have been calculated and VCF calculated according to API We see that the first two correction factors are wrong and the last is identical to the one given by API The formula for VCF3 is simple compared to the one given by API 11.1, and no reference about where the formula comes from is given. If this formula should be used in further calculation it needs to be approved by lead engineers in Expro. 79
81 7. Discussion 7.3 Plots In this last section history plots and critical flow plots for all case will be given. History plot are to illustrate how the job was performed. The critical flow plot are used to see if critical flow was maintained during the whole job. As mentioned earlier it is important to have critical flow throughout so that changes downstream of the choke don t effect upstream pressures and flowrates. In expro is a rule of tomb that the downstream pressure shall be at least half of upstream pressure or below. The theoretical value is 55 % of upstream pressure[33]. Both of these is illustrated in the critical flow check plot Case 1 Gas well, DST Initial flow/buildup Cleanup flow/buildup Main flow Main build-up Sampling flow/buildup No choke sizes given in data-listing for this well Shut-in at choke manifold Figure 45 Case 1 - History plot 80
82 7. Discussion Figure 46 Case 1 - Initial flow plot Figure 47 Case1 - Cleanup flow plot 81
83 7. Discussion Figure 48 Case1 - Main flow plot Figure 49 Case1 - Sampling flow plot 82
84 7. Discussion Figure 50 Case1 - Critical flow check plot Figure 51 Case1 - Critical flow check plot - Initial flow 83
85 7. Discussion Figure 52 Case1 - Critical flow check plot - Cleanup flow Figure 53 Case1 - Critical flow check plot - Main flow 84
86 7. Discussion Figure 54 Case1 - Critical flow check plot - Sampling flow The critical flow was not maintained during the whole test. 85
87 7. Discussion Case2 Gas/condensate well, clean up Cleanup flow/buildup Main flow/buildup zoom Figure 55 Case 2 - History plot Figure 56 Case 2 History plot - zoom 86
88 7. Discussion Figure 57 Case2 - Critical flow check plot Critical flow not maintained. Can affect downhole readings. Figure 58 Case2 - Critical flow check plot - zoom 87
89 7. Discussion Case3 Oil well, DST 1 Cleanup/main flow Main buildup Bottomhole shut-in WHP goes down Figure 59 Case3, DST1 - History plot Figure 60 Cas3, DST1 - Critical flow check plot This plot fluctuates a lot and in some sections is it difficult to see if critical flow is maintained or not. 88
90 7. Discussion Case3 Oil well, DST 2 zoom Initial cleanup/buildup Main flow/build-up Bottomhole shut-in Minifrac cycles from cement unit Figure 61 Case3, DST2 - History plot Figure 62 Case3, DST2 - History plot - zoom 89
91 7. Discussion Figure 63 Case3, DST2 - Critical flow check plot Critical flow almost maintained during the entire test. 90
92 8. References 8. References 1. Expro Internal documents 2. Final year project Overview & Selection of Well Testing Methods & Equipment, written by Sjur & Sigurd Hundsnes, Picture choke manifold cq_auoawovchmiijjc1iqwxwivy53bch2qwwew&biw=1920&bih=1009#imgrc=hdj4_y1q8osy cm%3a 4. Picture Expro calibration tank cq_auoawovchmipzfz3iuwxwivg2fbch2lxada&biw=1920&bih=1009#tbm=isch&q=calibration +tank+expro&imgrc=q90knn17r1m6wm%3a 5. GPSA Engineering Data Book 11 th Edition SI Volumes I & II 6. NPD FactPages and FactMaps 7. Oil fluid characteristics: 8. G Instruments - Understanding Error and Accuracy AN Facts H 2 S & CO 2 H2S.html 10. Engineering toolbox Picture ph Paper _AUoAWoVChMIkJya4rvHxwIVwT8aCh38gAXr&biw=894&bih=880#imgrc=i6qZ_cJPbmC_eM%3A 12. Ranarex picture 0CAcQ_AUoAWoVChMIhITh8L3HxwIVCdIaCh0fZA4C&biw=894&bih=880#tbm=isch&q=Ranarex &imgrc=ywy20p1yb-mkbm%3a 13. Specific gravity Pressure transducer Temperature transducer Piezoelectric effect Downhole memory gauges 91
93 8. References Picture Downhole memory gauge Pressure transducer technology Picture Piezoelectric effect CAcQ_AUoAWoVChMIk9PF_6TOyAIVyj8UCh3dUguo&biw=2144&bih=1127&dpr=0.9#tbm=isch& q=piezoelectric+effect&imgrc=e75agzhq8yzgwm%3a 21. Picture temperature transducer =isch&sa=x&ved=0cacq_auoamovchmi- Y2GmKbOyAIVyTgaCh0GwwXO&dpr=0.9#imgrc=Ekw6n0gExYKkVM%3A 22. Picture hydrometer UoAWoVChMImLWk26bOyAIVQlAaCh0HAwnH&biw=2144&bih=1127&dpr=0.9#imgrc=x1TrnMC DalWHHM%3A 23. Gas densities and molecular weight Dialoug with Expro fluids mananger, Wenche Knutsen 25. GPSA Engineering Data book 11 th Edition (Electronic) SI Volumes I & II 26. Picture Phase envelope 0CAcQ_AUoAWoVChMI1bnChu3xyAIVxJQeCh3iMQw&biw=1760&bih=925#imgrc=7r9PJxElbdTcaM%3A 27. Halliburton Well Test Manual 28. Picture Rosemount pressure transmitter m=isch&sa=x&ved=0ahukewjdryxql6hjahwcxrqkhcx3ce4q_auibygb&biw=1760&bih=888#i mgrc=9diznlp5abq-rm%3a 29. Schlumberger well test course material 30. Picture phase envelope overview UKEwiCkbvY0b_JAhXGOxQKHZvcC2sQ_AUIBygB&biw=1760&bih=925#imgrc=akYLh0k7EXQ4jM% 3A 31. Ranarex gravitometer Datasheet 32. Picture Ranarex measuring wheels 0CAcQ_AUoAWoVChMIhITh8L3HxwIVCdIaCh0fZA4C&biw=894&bih=880#tbm=isch&q=Ranarex &imgrc=q2xti36sljx_sm%3a 33. Critical flow SPARTEK Memory Gauges Datasheet 92
94 8. References 35. Rosemount 3051T Pressure Transmitter Datasheet 36. Rosemount 644H Temperature transmitter Datasheet 37. Rosemount 3144P Temperature transmitter Datasheet 38. Bellingham + Stanley Eclipse Refractometer Datasheet 39. Dreager tubes specification sheet 40. VWR international - Thermohydrometer specification sheet 41. VWR international - Aerometer specification sheet 42. Anton Paar Densiometer specification sheet 43. Camron Turbin meter Datasheet 44. Emerson Micro Motion Elite Coriolis Datasheet 93
95 Attachment I Attachment I Expro procedures Expro procedure for BS&W measurements Procedure: Pour 50ml of a solvent into a clean centrifuge tube Add 1-3 drops of demulsifier and shake tube until solvent and demulsifier are well mixed Shake sample container vigorously and pour in 50 ml of crude oil into centrifuge tube with the solvent and demulsifier (if used) Shake the centrifuge by hand, for several minutes to mix thoroughly the sample with demulsifier and solvent (if used) Repeat this procedure for a second centrifuge tube if enough collected sample If required, heat the centrifuge tubes until the sample temperature is 140 F Once the sample has been heated, shake well and place in the centrifuge NOTE: when shaking the sample, ensure that none of the sample is spilled Spin the sample for approximately 3-10 minutes Reand the BS&W content NOTE: Read to the nearest.05 ml (between 0.1 and 1 ml) and to the neares 0.1 ml when over 1 ml. If the two samples (for comparison) agree, or are very close, add the precentages together to achieve the true BS&W NOTE: If only one sample was taken then the result should be multiplied by two since halve the sample was solvent. If the sample was not cut with solvent (e.g. for light crude s or condensates) the precentage of BS&W should be read directly. If two samples were taken, the results should be added toghether and the combined total divided by two On comletion of the test, all equipment should be washed and cleaned ready for the next NOTE: On HPHT wells, no samples should be taken from upstream of the choke manufold apart from monophasic samples. On every well test we should always be aware of the potential dangers when taking samples from upstream of the choke manifold. The potential from problems (valve washouts etc.) increases in the following circumstances High flowing pressures Gas wells Rat hole at surface (mud) 94
96 Attachment I Expro procedure for ph measurements Expro procedure to measure ph: A sample from of produced water is separated from the oil ph paper is dipped into the fluid Compare colour reaction on the paper and ph scale on the packet that comes with the paper Roughly estimate ph value Expro procedure for salinity measurements Expro procedure for measure the salinity: Apply a drop of distilled water to the prism end of the refractometer and close lid While viewing towards a light source, use the zero adjustment screw to line up the base line with 0 on the scale Clean the prism and apply a drop of the produced water to the pricem and of the refractometer and close lid While viewing towards a light source, determine the point on the scale that a color change occurs. NOTE: using the refractometer s calibration table found inside the units box determine the ppm value of the salinity found in the produced water and report Expro procedure for H2S & CO2 measurements Procedure: Select tube of correct type and range Squeeze Dräger body to compress bellows and insert unbroken tube into valve aperture NOTE: If Bellows do not expand then integrity of bellows is assured and sampling can continue. If bellows expand then the bellows are leaking and false results will ensure of that tester is used. REPLACE the bellows unit. 95
97 Attachment I Collect gas sample in bladder/stainless stell cylinder NOTE: Ensure bladder/cylinder is purged adequately to obtain a representative sample The sample must be at atmpspheric pressure for the purpose of reading the Dräger tube, if the sample bladder contains pressure this will create an artificially high reading. Break open both ends of the Dräger tube Compress body to expel air from bellows and insert tube in valve aperture NOTE: Check arrow on tube side of correct end to install arrow indicates direction of flow (from sample to tester). Once tube secure in valve aperture, release bellow and allow chain to go taut NOTE: The chain MUST be allowed to go taut for a correct reading to be obtained. This is because the volume of the bellows is a calibrated amount which is related to the reagent used in the tubes and any differing volume wil cause errors. Repeat compression/relaxation sequence as required for n times NOTE: The value of n is indicated on the tube and will be dependant on the tube and scale used (for multi scale tube) Ince all compression/relaxation sequences completed, remove the bladder and tube from the valve aperture and read off the discoloration from tube against the relevant scale Once the sample has been sucked through the tube n times, the tube should be broken at the breaking point (between the two dots) so that the inner reagent ampoule breaks Shake out the content of the ampoule in the direction of the indicationg layer and suck the soltion through the layer NOTE: The indication layer should be completely wetted by the solution TAKE CARE THAT THE CONTENTS OF THE AMPOULE DOES NOT ENTER THE PUMP Read the off the discoloration against the scale in PPM 96
98 Attachment I Expro procedure for Oil gravity measurements Procedure: NOTE: the cylinder should have enough height to allow for a 1 clearance between the bottom og the hydrometer and the bottom of the measuring cylinder. The ID of the cylinder should be at least 1 greater that the OD of the hydrometer. Allow any foam on the top of the sample to settle (or skim off) and place the sample in an area free from air currents Lower the hydrometer carefully into the sample to a point 2 of the smallest divisions above that at which it will float. Release the hydrometer When the hydrometer comes to a rest, the gravity should be read at the point at which the surface of the sample cuts the scale NOTE: the hydrometer should not touch the side of the measuring cylinder, if the scale cannot be read properly, deduct 0.1 from the reading Take the temperature of the sample and note the results on the data sheet NOTE: it is preferable to use a hydrometer that combines the thermometer and hydrometer functions Expro procedure for Gas gravity measurements Expro procedure to measure Gas Gravity: Blow down gas sample line (normally taken from the top of the separator gas outlet) This will ensure that a representative sample is collected and any condensation etc, that has accumulated in the sample line is blown clear prior collection the gas sample Once sample line has been blown down, place bladder over fitting, or connect the sample bottle to the end of the sample line Open the isolationg valve on the sample line and fill the bladder or bottle NOTE: do not over-pressurise the bladder as it is not a pressure containing device and will rupture if excess pressure is applied Vent the gas in the bladder or bottle in order to purge the container Repeat the above so that at least three purge cycles have been completed 97
99 Attachment I Fill the bladder or bottle with gas and measure the specific gravity using the RANAREX gravitometer Purge through the oil sample line on the separator until the contents of the line has been displaced twice Collect a sample from the oil line on the separator into a measuring cylinder Expro excel sheet correction Oil SG to Standard Conditions Standard conditions: 1 atm and 15.0 C Input values: - Oil SG uncorrected - ODCT oil density cylinder temperature, C - Oil line temperature, C Fixed values: - - Calculated values: - Conversion from S.G. to API gravity ( ) - Conversion from C to F ( ) ( ) Notations:
100 Attachment I API equation: ( ) ( ) K-factor equation: 99
101 Attachment I Results:
102 Attachment II Attachment II New procedures - drafts: - BS&W - Salinity - H 2 S & CO 2 - Oil gravity - Gas gracity - Oil flow rate - Gas flow rate - Meterfactor spreadsheet 101
103 Document Number: Revision: <Document Number > B Product Line / Function Document Type: Title: Surface Well Test Procedure Level: <Classification> Basic Sediment & Water - (BS&W measurement) December 2015 by Expro - ALL RIGHTS RESERVED This document may not be reproduced, either wholly or in part, nor may it be used by, or its contents divulged to, any other person whosoever without written permission of Expro. Furthermore the Master Copy of this document is held and formally controlled within Insight. Hard copies may be printed but will not be updated. Please refer to Insight for the latest revision. Template No: INS-T-008 Rev 1
104 <Document Number > Rev. B Basic Sediment & Water - (BS&W measurement) Revision List Revision Date Prepared by Reviewed by Approved by A 29.Sep.2015 Kristian Sletthaug Revision Comment: First release B 27.Nov.2015 Revision Comment: Revision Comment: Revision Comment: Revision Comment: Page 2 of 8 Surface Well Test Procedure
105 Basic Sediment & Water - (BS&W measurement) <Document Number > Rev. B Table of Contents Section Page 1. Purpose Scope Responsibilities & Authorities References Apparatus Centrifuge tube Centrifuge Air operated centrifuge Hand operated centrifuge Solvent Toluene Demulsifier Step procedure... 8 Procedure Surface Well Test Page 3 of 8
106 <Document Number > Rev. B Basic Sediment & Water - (BS&W measurement) 1. Purpose The objective of this measurement is to find the percentage content of water and sediments produced from the well. 2. Scope This procedure describes the equipment used for this measurement and how to take the most accurate reading. 3. Responsibilities & Authorities All personnel that have passed the Well Test 1 Course are authorised to perform this kind of measurement. This procedure should be followed at all times. In the case of personnel which have not passed Well Test 1, the measurement should be done under supervision of the Well Test supervisor. This document originated as part of a master thesis that looked into data accuracy in association with well test operations. Expro s engineers in Norway have the authority to revise this procedure. 4. References ASTM D e1 Standard Test Method for Water and Sediment in Crude Oil by Centrifuge Method(Laboratory Procedure) Well Test Standard, section 4.4 Surface sampling Page 4 of 8 Surface Well Test Procedure
107 Basic Sediment & Water - (BS&W measurement) <Document Number > Rev. B 5. Apparatus 5.1 Centrifuge tube Centrifuge tube specification ASTM D e1 Standard test method for water and sediments in crude oil by the centrifuge method(laboratory procedure) Each tube shall be a 203 mm, cone shaped and be made of thoroughly tempered glass Graduation on tube shall be clear and distinct Accuracy of graduations on the tube shall be volumetrically verified before use of the tube Centrifuge tube calibration tolerance for 203 mm tube Range, ml Subdivision, ml Volume tolerance, ml ± ± ± ± ± ± ± ± ± ±1.00 Comment: even though this is a laboratory procedure, Expro employs the same tubes for offshore use Procedure Surface Well Test Page 5 of 8


108 <Document Number > Rev. B Basic Sediment & Water - (BS&W measurement) 5.2 Centrifuge Air operated centrifuge Expro uses air operated centrifuges for testing of BS&W in the field. Below are specifications on this piece of equipment, as given by ASTM. Centrifuge specifications ASTM D e1 Standard test method for water and sediments in crude oil by the centrifuge method(laboratory procedure) Be able to spin two or more filled cone shaped 203mm centrifuge tubes Revolving head, trunnion rings, and trunnion cups, including the cushions, shall all be constructed to withstand the maximum centrifugal force capable of being delivered by the power source. The centrifuge shall be heated and controlled thermostatically to avoid unsafe conditions. Shall be able to maintain the sample temperature during entire run at 60 ±3 C Hand operated centrifuge For smaller samples a hand operated centrifuge might be used. However, its use in the field has declined in later years. Page 6 of 8 Surface Well Test Procedure
109 Basic Sediment & Water - (BS&W measurement) <Document Number > Rev. B 5.3 Solvent Toluene Toluene is a reagent added to the system to lower the interfacial tension between oil and water, thus ensuring greater separation of the two. This facilitates a more accurate reading of the BS&W. WARNING Toluene is flammable. Keep away from heat, sparks and open flame. Other solvents might be used, but shall have following characteristics: Characteristics of reagents Assay(ingredient and quality) +99.5% Colour (APHA standard) 10 Boiling range (Recorded boiling point C) Residue after evaporation Substances darkened by H 2 SO 4 Sulphur compounds (as S) Water (H 2 O) 2.0 C max wt./wt. Pass test 0.003% max wt./wt. 0.03% max wt./wt Demulsifier The purpose of a demulsifier is to promote the separation of water from the sample and to prevent it clinging to the walls of the centrifuge tube. Recommended stock solution is 75% toluene and 25% demulsifier. A different ratio may be required for some crude oils. Procedure Surface Well Test Page 7 of 8
110 <Document Number > Rev. B Basic Sediment & Water - (BS&W measurement) 6. Step procedure 1. Pour 50 ml ±0.05mL of solvent into a clear centrifuge tube 2. Add 0.2 ml of demulsifier and shake tube until solvent and demulsifier are well mixed 3. Pour 50 ml of crude oil into centrifuge tube with the solvent and demulsifier. Note when shaking the sample, ensure that none of the sample is spilled. 4. Shake the tube by hand for several minutes to mix the sample with solvent and demulsifier. Note repeat this procedure for a second centrifuge tube if required. Note if required, heat the centrifuge tubes until the sample temperature is 140 F. 5. Place the tube in the centrifuge Note if only one sample is about to be centrifuged, make sure you have a tube with similar weight at the opposite side to ensure balance. 6. Spin the sample for approximately 3-10 minutes. 7. Read the BS&W content Note read to the nearest 0.05 ml between ml, and to the nearest 0.1 ml when over 1 ml. Note if only one sample is taken, the result needs to be multiplied by two since half of the sample consists of solvent. Note if two samples are taken, and they are very similar, add the percentages together to achieve the true BS&W. 8. On completion of the test, all equipment should be washed and cleaned ready for the next test Special cases: Light crudes and gas condensates for cases like this no solvent is used and 100 ml sample added instead. The percentage of BS&W can then be read directly on the tube. Note always be aware of the potential danger when taking samples from upstream of the choke manifold. This is to be avoided if possible, the samples should preferably be taken downstream of the choke manifold. Sampling point: There should be two valves in place with the inside valve fully open. The outside valve should be used when taking samples to control flow. If the outside valve is washed out, the inside valve should be immediately closed. To continue sampling another valve need to be added, alternatively, the sample point may be plugged. Page 8 of 8 Surface Well Test Procedure
111 Document Number: Revision: <Document Number > B Product Line / Function Document Type: Title: Surface Well Test Procedure Level: <Classification> Salinity determined by Refractometer December 2015 by Expro - ALL RIGHTS RESERVED This document may not be reproduced, either wholly or in part, nor may it be used by, or its contents divulged to, any other person whosoever without written permission of Expro. Furthermore the Master Copy of this document is held and formally controlled within Insight. Hard copies may be printed but will not be updated. Please refer to Insight for the latest revision. Template No: INS-T-008 Rev 1
112 <Document Number > Rev. B Salinity determined by Refractometer Revision List Revision Date Prepared by Reviewed by Approved by A 08.Sep.2015 Kristian Sletthaug Revision Comment: First release B 27.Nov.2015 Revision Comment: Revision Comment: Revision Comment: Revision Comment: Page 2 of 6 Surface Well Test Procedure
113 Salinity determined by Refractometer <Document Number > Rev. B Table of Contents Section Page 1. Purpose Scope Responsibilities & Authority References Apparatus Refractometer Additional equipment Step procedure... 6 Procedure Surface Well Test Page 3 of 6
114 <Document Number > Rev. B Salinity determined by Refractometer 1. Purpose The objective of this determination is to see whether any water produced during a clean-up phase is brine or formation water. The amount of salt mixed in the brine is often a known amount. By measuring the salt content of the water produced, it can be observed whether the salt content deviates from amount in the brine. This can help us determine if the clean-up phase is done or not. 2. Scope This procedure describes the equipment used for this measurement and how to take the most accurate reading. 3. Responsibilities & Authority All personnel that have passed the Well Test 1 Course are authorised to perform this kind of measurement. This procedure should be followed at all times. In the case of personnel which have not passed Well Test 1, the measurement should be done under supervision of the Well Test supervisor. This document originated as part of a master thesis that looked into data accuracy in association with well test operations. Expro s engineers in Norway have the authority to revise this procedure. 4. References ASTM D Standard Test Method for Pore Water Extraction and Determination of the Soluble Salt Content of Soils by refractometer PRODUCT DATASHEET refractometer, Bellingham + Stanley Ltd. EQUIPMENT DESCRIPTION - Page 4 of 6 Surface Well Test Procedure

115 Salinity determined by Refractometer <Document Number > Rev. B 5. Apparatus 5.1 Refractometer A handheld refractometer is an analogue instrument used to measure a liquid s refractive index. It works on the critical angle principle by which lenses and a prism project a shadow line onto a small glass reticule inside the instrument, which is then viewed by the user through a magnifying eyepiece. A sample drop is placed between the prism and a flap. Light travelling through the sample is either passed through the reticule or totally internally reflected. The net effect is that a shadow line forms between the illuminated area and the dark area. The reading is taken at the point where the shadowy line crosses the scale. Because refractive index is very temperature dependent, corrections for temperature need to be taken. A correction table for a sugar based sample is shown below. The procedure on how to correct for temperature can be found in the next section. 5.2 Additional equipment Distilled water or alcohol for cleaning Pipette Procedure Surface Well Test Page 5 of 6
116 <Document Number > Rev. B Salinity determined by Refractometer 6. Step procedure 1. Thoroughly wash the refractometer with distilled water and then dry the instrument. 2. Place one or two drops of liquid onto the semicircle of the white plastic area, which is held firmly against the glass platform. Only allow the liquid to escape under the white plastic area. 3. Hold the refractometer at a right angle to a light source and read the salinity. If the liquid is properly introduced, there should be a distinct black/white boundary. Read off the value where the bottom of the hairline touches the beginning of the black boundary. Round up or down to the nearest whole number. 4. After use, clean the prism and flap immediately with water or other suitable solvent and dry with a clean tissue. Note The prism surface can get damaged by strong alkaloids or acids if left in contact with it over long periods of time. Therefore, clean samples off of the prism as soon as possible. Wiping the prism surface occasionally with alcohol will remove any build-up of oils left from the sample. Note Salinity is given in parts per thousand parts (0/00). Salinity is the total amount of solids material, in grams, contained in 1 kg of sea water when all the carbonates has been converted to oxide, the bromine and iodine replaced by chlorine, and all organic matter completely oxidized Note Error in reading directly from the salinity scale is ±0.3 ppt. Note Actual sea water samples may have a black/yellow/white boundary when reading the refractometer. Readings are always taken at beginning of the black boundary. Two to three readings should always be taken to ensure accuracy and precision. Correcting the reading for temperature: The eclipse refractometer is calibrated to read correctly at 20 C. The refractive index of the measured sample will vary with temperature and the reading must be corrected to take account of this. Correction for sugar based samples measured on BRIX(%sucrose) scale are shown in the table in the previous section and can be used with the following method: 1. Stabilise the instrument at 20 C. 2. Apply a sample of known value to the prism and adjust to read correctly as described above. 3. Add/subtract factors from the table for measurements at other temperatures. Page 6 of 6 Surface Well Test Procedure
117 Document Number: Revision: <Document Number > B Product Line / Function Document Type: Title: Surface Well Test Procedure Level: <Classification> H2S and CO2 measured with Draeger tubes December 2015 by Expro - ALL RIGHTS RESERVED This document may not be reproduced, either wholly or in part, nor may it be used by, or its contents divulged to, any other person whosoever without written permission of Expro. Furthermore the Master Copy of this document is held and formally controlled within Insight. Hard copies may be printed but will not be updated. Please refer to Insight for the latest revision. Template No: INS-T-008 Rev 1
118 <Document Number > Rev. B H2S and CO2 measured with Draeger tubes Revision List Revision Date Prepared by Reviewed by Approved by A 23.Sep.2015 Kristian Sletthaug Revision Comment: First release B 27.Nov.2015 Revision Comment: Revision Comment: Revision Comment: Revision Comment: Page 2 of 7 Surface Well Test Procedure
119 H2S and CO2 measured with Draeger tubes <Document Number > Rev. B Table of Contents Section Page 1. Purpose Scope Responsibilities References Apparatus Measuring tube Hand pump Sampling compartment Step procedure... 7 Procedure Surface Well Test Page 3 of 7
120 <Document Number > Rev. B H2S and CO2 measured with Draeger tubes 1. Purpose The objective of this measurement is to find the content of H 2 S and CO 2 in the gas produced. These gases can be hazardous for both people and the environment. 2. Scope This procedure describes the equipment used for this measurement and how to take the most accurate readings. 3. Responsibilities All personnel that have passed the Well Test 1 Course are authorised to perform this kind of measurement. This procedure should be followed at all times. In the case of personnel which have not passed Well Test 1, the measurement should be done under supervision of the Well Test supervisor. This document originated as part of a master thesis that looked into data accuracy in association with well test operations. Expro s engineers in Norway have the authority to revise this procedure. 4. References Draeger website: Expro internal documents Pictures: Measuring tube Expro internal documents Handpump - CAcQ_AUoAWoVChMI0dOl6KWcyAIVBy4aCh25OwP8&biw=1376&bih=723#tbm=isch&q=dra eger+hand+pump&imgrc=k9mwbll_deq9pm%3a Page 4 of 7 Surface Well Test Procedure


121 H2S and CO2 measured with Draeger tubes <Document Number > Rev. B 5. Apparatus 5.1 Measuring tube These tubes are so-called short term tubes. They are intended for the measurement of momentary concentrations. The duration of a short term measurement is in the range of 10 seconds to 15 minutes. There are several types of short-term tubes: Tubes with a single indication layer Tubes with one or more pre-layers plus an indication layer Combinations of two tubes Tubes with connection hoses Tubes with a built-in reagent ampoule Tubes for simultaneous measurement Most common used in Expro is tubes with a built-in reagent ampoule. 5.2 Hand pump A Draeger tube hand pump draws in 100 ml per stroke. For measuring, the bellow is pressed together. The exhaust valve is closed during the opening phase of the bellow so that the gas sample flows through the connected Draeger tube into the pump. After complete opening of the pump body into its original position the suction process is finished. The end of stroke is visible by a pressure-controlled end of stroke indication, located in the pump head. Procedure Surface Well Test Page 5 of 7

122 <Document Number > Rev. B H2S and CO2 measured with Draeger tubes 5.3 Sampling compartment Page 6 of 7 Surface Well Test Procedure
123 H2S and CO2 measured with Draeger tubes <Document Number > Rev. B 6. Step procedure 1. Select tube of correct type and range. Note - there might be tubes with different scales and accuracies. If available, use the tubes with smallest subscaling since this gives most accurate reading. 2. Squeeze Draeger body to compress the bellows and insert unbroken tube into valve aperture. Note if the bellows do not expand then integrity of the bellows is assured and sampling can continue. If the bellows expand then the bellows are leaking and false results will be experienced if that tester is used. 3. Open flow from gas line to sampling compartment. Note make sure the flow is continuous and controlled. If condencate occure, make sure it not splashes into the compartment 4. Break open both ends of the Draeger tube. 5. Compress body to expel air from bellow and insert tube in valve aperture. Note - check arrow on tube side for correct end to install arrow indicates direction of flow (from sample to tester). 6. Insert the tube into the hole in the top off the sampling compartment 7. Once the tube is secure in the valve aperture, release bellows and allow chain to go taut. Note - the chain MUST be allowed to go taut for a correct reading to be obtained. This is because the volume of the bellows is a calibrated amount which is related to the reagent used in the tubes and any differing volume will cause errors. 8. Repeat compression/relaxation sequence as required for n times. Note - the value of n is indicated on the tube and will be dependent on the tube and scale used (for multi scale tubes). 9. Once all compression/relaxation sequences are completed, remove the bladder and tube from the valve aperture and read off the discoloration from tube against the relevant scale. 10. Once the sample has been sucked through the tube n times, the tube should be broken at the breaking point (between the two dots) so that the inner reagent ampoule breaks. 11. Shake out the contents of the ampoule in the direction of the indication layer and suck the solution through the layer. Note - the indication layer should be completely wetted by the solution. Note - take care that the contents of the ampoule do not enter the pump. 12. Read the off the discoloration against the scale on PPM or %. Procedure Surface Well Test Page 7 of 7
124 Document Number: Revision: <Document Number > B Product Line / Function Document Type: Title: Surface Well Test Procedure Level: <Classification> Specific Gravity of Crude Petroleum (Thermohydrometer & Hydrometer) December 2015 by Expro - ALL RIGHTS RESERVED This document may not be reproduced, either wholly or in part, nor may it be used by, or its contents divulged to, any other person whosoever without written permission of Expro. Furthermore the Master Copy of this document is held and formally controlled within Insight. Hard copies may be printed but will not be updated. Please refer to Insight for the latest revision. Template No: INS-T-008 Rev 1
125 <Document Number > Rev. B Specific Gravity of Crude Petroleum (Thermohydrometer & Hydrometer) Revision List Revision Date Prepared by Reviewed by Approved by A 09.Sep.2015 Kristian Sletthaug Revision Comment: First release B 27.Nov.2015 Revision Comment: Revision Comment: Revision Comment: Revision Comment: Page 2 of 13 Surface Well Test Procedure
126 Specific Gravity of Crude Petroleum (Thermohydrometer & Hydrometer) <Document Number > Rev. B Table of Contents Section Page 1. Purpose Scope Responsibilities & Authority References Apparatus Thermohydrometer Hydrometer Thermometers Hydrometer cylinder Step procedure Thermohydrometer Calculations Hydrometer & thermohydrometer Procedure Surface Well Test Page 3 of 13
127 <Document Number > Rev. B Specific Gravity of Crude Petroleum (Thermohydrometer & Hydrometer) 1. Purpose The objective of this procedure is to give guidance on how to measure the specific gravity of oil (API gravity) as accurately as possible with the equipment used in the field. Specific gravity is a measurement taken to describe the property of the oil produced from the reservoir. 2. Scope This procedure describes the equipment used for this measurement and how to take the most accurate reading. Since thermohydrometers are most commonly used in the field, the procedure on how to use this will be described step by step. If a hydrometer is used, the procedure is approximately the same, but the temperature readings are taken with a thermometer right before and after you have taken the hydrometer reading. 3. Responsibilities & Authority All personnel that have passed the Well Test 1 Course are authorised to perform this kind of measurement. This procedure should be followed at all times. In the case of personnel which have not passed Well Test 1, the measurement should be done under supervision of the Well Test supervisor. This document originated as part of a master thesis that looked into data accuracy in association with well test operations. Expro s engineers in Norway have the authority to revise this procedure. Page 4 of 13 Surface Well Test Procedure
128 Specific Gravity of Crude Petroleum (Thermohydrometer & Hydrometer) <Document Number > Rev. B 4. References ASTM D287-12b Standard Test Method for API Gravity of Crude Petroleum and Petroleum Products (Hydrometer Method) ASTM D b Test Method for Density, Relative Density, or API Gravity of Crude Petroleum and Liquid Petroleum Products by Thermohydrometer Method The standard below is similar to ASTM D B but covers laboratory measurements with hydrometers. Since themohydrometers are recommended for field testing, it is the procedure for these that is described in this document. ASTM D b Test Method for Density, Relative Density, or API Gravity of Crude Petroleum and Liquid Petroleum Products by Hydrometer Method Step 5 in the calculations is verified by Master thesis Data accuracy from well test operations. Pictures: Hydrometer - CAcQ_AUoAWoVChMIxZXhuKGcyAIVSwgaCh2zPwfB&biw=1376&bih=723#imgrc=RstZ5FCb KMBmdM%3A Thermometer - CAcQ_AUoAWoVChMIxZXhuKGcyAIVSwgaCh2zPwfB&biw=1376&bih=723#tbm=isch&q=AS TM+thermometer&imgrc=Zgk4C787U0CzeM%3A Thermohydrometer - CAcQ_AUoAWoVChMIxZXhuKGcyAIVSwgaCh2zPwfB&biw=1376&bih=723#tbm=isch&q=AS TM+thermohydrometer&imgrc=Op47nKtuZLfP2M%3A Hydrometer cylinder - ch&sa=x&ved=0cayq_auoawovchminpqy7kkcyaivtniach13mwzy#tbm=isch&q=hydrom eter+cylinder&imgrc=p7maaqca0mrunm%3a Procedure Surface Well Test Page 5 of 13
129 <Document Number > Rev. B Specific Gravity of Crude Petroleum (Thermohydrometer & Hydrometer) 5. Apparatus 5.1 Thermohydrometer Thermohydrometer ASTM E100 - Standards Specification for ASTM Hydrometers Same specifications as regular hydrometer with some additional requirements: - The thermometer shall be of the mercury in glass type - When the thermometer scale is located in the stem of hydrometer, the scale shall be in red to distinguish it from the hydrometer scale. - Capillary stem shall be essentially parallel to the hydrometer axis In Expro, following thermohydrometers are accepted: Thermohydrometer No. Hydrometer dimensions and scale Thermometer scale ASTM Hydrometer No. Nominal Rel. Density range (Sp. Gr) Total length, mm to +65 Range, C 300H Body diam., mm to H Stem diam., mm to H Standard temp, C 15 Immersion Total 303H Subdivision, kg/m3 0.5 Subdivision, C H Short interm. line at, kg/m3 1 Intermediate lines at, C 5 305H Long interm. line at, kg/m3 5 Main lines at, C H Main lines at, kg/m3 10 Scale error at any point not to exceed, C H Scale error at any point not to exceed, kg/m3 0.5 Scale length, mm H Length of nominal scale, mm H Scale extension beyond nominal range limit, kg/m3 2.5 Page 6 of 13 Surface Well Test Procedure
130 Specific Gravity of Crude Petroleum (Thermohydrometer & Hydrometer) <Document Number > Rev. B 5.2 Hydrometer Hydrometer Specification ASTM E100 Standards Specification for ASTM Hydrometers Shall be of constant-mass, variable-displacement type and it shall be made of glass. The outer surface of the stem and body shall be symmetrical about the vertical axis and it shall always float with this axis in liquids. Shall be thoroughly dry on the inside when sealed. The glass shall be smooth, transparent, and free of bubbles, cracks, strain patterns, or other imperfections that might interfere with the use of the hydrometer. Graduation lines and inscriptions shall be in a permanent black marking material. Special Inscription: Standard temperature and reference temperature(ex. 60/60 F), hydrometer number( ex. 1H). In Expro, the following hydrometers are accepted: Light liquids Heavy liquids ASTM Hydrometer No. Nominal Rel. Density range (Sp. Gr) ASTM Hydrometer No. Nominal Rel. Density range (Sp. Gr) 82H H H H H H H H H H H H H H H H H H H Comment: Expro mostly use hydrometers for light liquids Procedure Surface Well Test Page 7 of 13
131 <Document Number > Rev. B Specific Gravity of Crude Petroleum (Thermohydrometer & Hydrometer) Specification related to design: Standard temp. F 60/60 Subdivisions Intermediate lines at Main lines at Scale error at any point not to exceed Total length, mm Length of nominal scale, mm Scale extension beyond nominal range limits, max Body diameter, mm Stem diameter min, mm 5.0 Recommended Hydrometers by ASTM ASTM D B Standard Test Method for Density, Relative Density, or API Gravity of crude Petroleum an Liquid Petroleum Products by Hydrometer Method Units Range Scale Meniscus Total Each unit Interval Error Correction Density, Kg/m3 at 15 C ± ± ± Rel. density, 60/60 F ± ± ± ± API gravity -1 to ± Comment: Expro uses hydrometers marked in blue. Page 8 of 13 Surface Well Test Procedure

132 Specific Gravity of Crude Petroleum (Thermohydrometer & Hydrometer) <Document Number > Rev. B 5.3 Thermometers Thermometers ASTM E1 Specification for ASTM Liquid-in-glass Thermometers Specifications to come -20 to +65 L Range, C 0 to +85 M +20 to +105 H Immersion Total Subdivision, C 1.0 Intermediate lines at, C 5 Main lines at, C 10 Scale error at any point not to exceed, C 1.0 Scale length, mm Procedure Surface Well Test Page 9 of 13
133 <Document Number > Rev. B Specific Gravity of Crude Petroleum (Thermohydrometer & Hydrometer) Recommended Thermometers ASTM D B Standard Test Method for Density, Relative Density, or API Gravity of crude Petroleum an Liquid Petroleum Products by Hydrometer Method Scale Range Graduation Interval Scale Error C -1 to ±0.1 C -20 to ±0.15 F -5 to ±0.25 Page 10 of 13 Surface Well Test Procedure
, section 6.")
134 Specific Gravity of Crude Petroleum (Thermohydrometer & Hydrometer) <Document Number > Rev. B 5.4 Hydrometer cylinder Hydrometer cylinder ASTM D B Standard Test Method for API Gravity of Crude Petroleum and Petroleum Products(Hydrometer Method), section 6.3 Shall be of clear glass, plastic or metal Comment: plastic cylinder shall be resistant to discoloration or attack by oil samples and shall not affect the material being tested. Inside diameter of cylinder shall be at least 25 mm greater than the outside diameter of the hydrometer. Height shall be such that the appropriate hydrometer floats in the test position with at least 25 mm clearance between the bottom of the hydrometer and bottom of cylinder Procedure Surface Well Test Page 11 of 13
135 <Document Number > Rev. B Specific Gravity of Crude Petroleum (Thermohydrometer & Hydrometer) 6. Step procedure Thermohydrometer WARNING EXTREMELY FLAMMABLE 1. Test temperature should be between -18 C and 90 C (0 F and 195 F) Note the density will be most accurate at or near reference temperature of 15 C(60 F) 2. Transfer a sample into a clean hydrometer cylinder without splashing. Note the hydrometer cylinder shall be at approximately the same temperature as the sample to be tested. 3. Place the cylinder containing the sample in a vertical position in a location free from air current. Note take precautions to prevent the temperature of the sample from changing during the time necessary to complete the test. The temperature of the surrounding medium should not change more than 3 C(5 F). Note - Let the oil settle for a period of time to let gas dissolved in the oil evaporate. A sampling cabinet shall be used if the measurement is done inside the laboratory container. 4. Lower and raise the thermohydrometer no more than two scale division in the sample cylinder. Note - Keep the rest of the stem dry, as unnecessary liquid on the stem changes the effective weight of the instrument. Note Allow sufficient time for the hydrometer to come to rest, usually 3 to 5 min. 5. Read and record the thermohydrometer scale reading with meniscus correction to the nearest 0.5 kg/m3 and the thermometer reading to the nearest 0.5 C(1.0 F). Note - The correct reading is that point on the hydrometer scale at which the surface of the liquid cuts the scale. Determine this point by placing the eye slightly below the level of the liquid and slowly raising it until the surface, first seen as a distorted ellipse, appears to become a straight line cutting the hydrometer scale 6. Two successive determinations of density and gravity need to be taken to ensure temperature of the thermohydrometer and liquid has stabilized. The two successive corrected values should be within 0.5 kg/m3. If this cannot be obtained, the temperature may not have stabilized, or loss of light hydrocarbons may be occurring. Take a new reading when temperature has stabilized. Page 12 of 13 Surface Well Test Procedure
136 Specific Gravity of Crude Petroleum (Thermohydrometer & Hydrometer) <Document Number > Rev. B 7. Calculations Hydrometer & thermohydrometer 1. Apply any relevant thermometer corrections to the temperature readings and record the average of those two temperature to the nearest 0.1 C. 2. Apply any hydrometer correction identified in a calibration certificate to the observed reading and record the correct hydrometer scale to the nearest 0.1 kg/m3 for density( g/ml, kg/l or rel. density, or 0.1 API). Step 1 Convert the correct hydrometer scale reading to density in kg/m3 if necessary ( ) ( ) Step 2 Calculate hydrometer thermal glass expansion correction factor using appropriate equation Correction for a Base Temperature T b of 15 C: [ ( )] [ ( ) ] Correction for a Base Temperature T b of 60 F: [ ( )] [ ( ) ] Alternative equation: Correction for a Base Temperature T b of 20 C: [ ( )] [ ( ) ] Step 3 Multiply density from Step 1 with correction of base temperature ( ) ( ) Step 4 Convert densities to relative densities R.D. ( ) Step 5 Correct the density for liquid temperature to selected base temperature ( ) Step 6 Corrected density ( ) ( ) Procedure Surface Well Test Page 13 of 13
137 Document Number: Revision: <Document Number > B Product Line / Function Document Type: Title: Surface Well Test Procedure Level: <Classification> Gas Specific Gravity with Ranarex Gravitometer December 2015 by Expro - ALL RIGHTS RESERVED This document may not be reproduced, either wholly or in part, nor may it be used by, or its contents divulged to, any other person whosoever without written permission of Expro. Furthermore the Master Copy of this document is held and formally controlled within Insight. Hard copies may be printed but will not be updated. Please refer to Insight for the latest revision. Template No: INS-T-008 Rev 1
138 <Document Number > Rev. B Gas Specific Gravity with Ranarex Gravitometer Revision List Revision Date Prepared by Reviewed by Approved by A 14.Sep.2015 Kristian Sletthaug Revision Comment: First release B 27.Nov.2915 Revision Comment: Revision Comment: Revision Comment: Revision Comment: Page 2 of 7 Surface Well Test Procedure
139 Gas Specific Gravity with Ranarex Gravitometer <Document Number > Rev. B Table of Contents Section Page 1. Purpose Scope Responsibilities & Authority References Apparatus Ranarex Gravitometer Other Equipment Step procedure... 7 Procedure Surface Well Test Page 3 of 7
140 <Document Number > Rev. B Gas Specific Gravity with Ranarex Gravitometer 1. Purpose The objective of this measurement is to find the specific gravity of the gas. This value is used by oil companies to perform various task and simulations, but is also used during well testing to calculate flow rate for gas. 2. Scope This procedure describes the equipment used for this measurement and how to take the most accurate reading. 3. Responsibilities & Authority All personnel that have passed the Well Test 1 Course are authorised to perform this kind of measurement. This procedure should be followed at all times. In the case of personnel which have not passed Well Test 1, the measurement should be done under supervision of the Well Test supervisor. This document originated as part of a master thesis that looked into data accuracy in association with well test operations. Expro s engineers in Norway have the authority to revise this procedure. 4. References ASTM D (Reapproved 2010) Standard Test Method for Relative Density of Gaseous Fuels Product datasheet RANAREX Gas Gravitometers Pictures: Gas bladder source=lnms&tbm=isch&sa=x&ved=0cayq_auoawovchmi96wcikccyaivsdgach3wjq5t#t bm=isch&q=gas+sampling+bladder&imgrc=uqpa-tjk3k2unm%3a Gas sampling bottle - source=lnms&tbm=isch&sa=x&ved=0cayq_auoawovchmi96wcikccyaivsdgach3wjq5t#i mgrc=5v9m_nbvdhskdm%3a Ranarex measuring wheels schematics - d=0cacq_auoawovchmihith8l3hxwivcdiach0fza4c&biw=894&bih=880#tbm=isch&q=ra narex&imgrc=q2xti36sljx_sm%3a Page 4 of 7 Surface Well Test Procedure
141 Gas Specific Gravity with Ranarex Gravitometer <Document Number > Rev. B 5. Apparatus 5.1 Ranarex Gravitometer The principles and design behind a Ranarex gravitometer are simple. The gravitometer contains two cylindrical, gas-tight measuring chambers with each having a separate inlet and outlet connection. Each chamber contains an impeller and an impulse wheel, both with axial vanes. These wheels are mounted on separate shafts, facing each other but not touching. An electrical motor and drive belt rotate the impellers at the same speed and in the same direction. The impellers draw continuous flow of gas sample into upper chamber, and reference air into the lower chamber. They spin the gas and air against the vanes of the corresponding impulse wheels. As the spinning gas and air impinge against the vanes, they create torque on the wheels that are proportional to the density of the gas and of the air. The torque is transmitted from the chambers to two external measuring wheels. A flexible tape is wrapped on the measuring wheels so that the torque creates two opposing forces as shown in the schematic below. The measuring wheels are restrained from continuous rotation, but a difference between the torque forces allows limited motion of the entire system. The measuring system divides the torque of the gas divided by the density of the air, and thereby measures specific gravity. Ranarex measuring wheels schematic. Procedure Surface Well Test Page 5 of 7


142 <Document Number > Rev. B Gas Specific Gravity with Ranarex Gravitometer Ranarex Gravitometer Model specification: Accuracy - ±0.5% of actual value Readings indicating only Sample flow rate scf/h Specific gravity range 0.52 to 1.03 and 0.97 to 1.90 Ambient Air Reference dryer Silica Gel 5.2 Other Equipment Gas bladder Stainless steel sample bottle Note if sample bottles are to be used, they should have an approved pressure rating and third party certification. They are not commonly used in the Norwegian sector. Page 6 of 7 Surface Well Test Procedure
143 Gas Specific Gravity with Ranarex Gravitometer <Document Number > Rev. B 6. Step procedure Preparation 1. Dried air standard Install a drier at the air inlet. The instrument must use air at normal CO 2 content as the reference standard 2. Temperature The air and the gas should be at the same temperature. The installation of a sample line of reasonable length relative to diameter, will allow sufficient rapid heat transfer for the gas sample to reach ambient temperature before it is drawn into the reference chamber. 3. Pressure reduce the gas sample to atmospheric pressure. The reference air is also at atmospheric pressure. 4. Power supply by maintaining the voltage and line frequently between the limits specified in the manufacturer s manual, the speed of the electric motor remains sufficiently constant that minor variations have no effect on measurements. Measurement 1. Blow down gas sample line (normally taken from the top of the separator gas outlet) Note this will ensure that a representative sample is collected and any condensation etc. that has accumulated in the sample line is blown clear prior collecting the gas sample. 2. Once sample line has been blown down, place bladder over fitting, or connect the sample bottle to the end of the sample line 3. Open the isolation valve on the sample line and fill the bladder or bottle. Note do not over pressurise the bladder as it is not a pressure containing device and will rupture if excess pressure is applied. 4. Vent the gas in the bladder in order to purge the container. 5. Repeat the above so that at least three cycles have been completed. 6. Fill the bladder and measure the specific gravity using the RANAREX gravitometer Note - Prior to connection the instrument to gas, turn on the motor and check the zero point when the Ranarex contains only air. Note If large amounts of condencate may be formed in the bladder, make sure to held the inlet of the balloon upward to keep it free from liquids. Notes more than one reading should be done for wet gas or gas/condensate system to ensure correct reading. Large amounts of liquids in the gas, may give wrong reading of gas gravity and may damage Ranarex gravitometer. Procedure Surface Well Test Page 7 of 7
144 Document Number: Revision: <Document Number > B Product Line / Function Document Type: Title: Surface Well Test Procedure Level: <Classification> Oil flow rate - Measurements and calculations December 2015 by Expro - ALL RIGHTS RESERVED This document may not be reproduced, either wholly or in part, nor may it be used by, or its contents divulged to, any other person whosoever without written permission of Expro. Furthermore the Master Copy of this document is held and formally controlled within Insight. Hard copies may be printed but will not be updated. Please refer to Insight for the latest revision. Template No: INS-T-008 Rev 1
145 <Document Number > Rev. B Oil flow rate - Measurements and calculations Revision List Revision Date Prepared by Reviewed by Approved by A 16.Sep.2015 Kristian Sletthaug Revision Comment: First release B 27.Nov.2015 Revision Comment: Revision Comment: Revision Comment: Revision Comment: Page 2 of 10 Surface Well Test Procedure
146 Oil flow rate - Measurements and calculations <Document Number > Rev. B Table of Contents Section Page 1. Purpose Scope Responsibilities References Equipment Measurements Calculations Total volum correction factor Corrected meter reading Meter Proving Reports Procedure Surface Well Test Page 3 of 10
147 <Document Number > Rev. B Oil flow rate - Measurements and calculations 1. Purpose The objective of this procedure is to give guidance on how to perform all tests and measurements necessary to find an accurate oil flow rate. 2. Scope This document will describe which tests and readings which are required to calculate an accurate oil flow rate. 3. Responsibilities These days, all oil and gas flow rates are determined by the use of advanced software. However, oil rates require that a correction to standard conditions are taken into account. This document is meant to provide guidance to the factors and equations which lie behind the calculation of the oil flow rate. 4. References GPSA Engineering Data book 11 th Edition (Electronic) SI Volumes I & II Page 4 of 10 Surface Well Test Procedure
148 Oil flow rate - Measurements and calculations <Document Number > Rev. B 5. Equipment Turbine meters A turbine meter normally consists of one moving part, which is an impeller held in place by high pressure, low drag bearings. A magnetic transducer installed in the meter body is used to count revolutions as a medium passes through the meter body. The pulses from the transducer are determined for a known volume passing through the meter to develop a factor in pulses per litre, or any other desired volumetric unit. A schematic of a typical turbine meter and its components are shown below An expected accuracy of 0.25% can be attained where proper stream conditions are maintained and the meter is installed correctly. Things to consider regarding installation of turbine meters: Different meters are only applicable for certain flow ranges, make sure the right meter for the expected flow rate is used. Upstream strainers should be installed to protect meter internals from foreign materials (sand, debris and solids) Expected pulsation and vibration of the meter should be considered Proper upstream flow conditioning Significant rate changes can damage the meter Change in flow temperature, pressure and density should be considered Minimum back-pressure: 2 times the pressure drop across meter, plus 1.25 times separator pressure is the minimum recommended back pressure. This is often not a practical solution in well testing, which is why a calibration tank etc. is used to correct the readings acquired through the meter. Separate equipment to prove the meter (i.e. calibration tank, shrinkage tester) Procedure Surface Well Test Page 5 of 10

149 <Document Number > Rev. B Oil flow rate - Measurements and calculations Meter prover system (Calibration tank) A calibration tank is used to correct the oil flow measurement through the meter. The act of calibration consists of verifying how much gas goes through the meter and what the shrinkage to standard conditions are. A picture of a calibration tank is shown below. A calibration tank should have a known volume and sight glasses with calibrated volume measurement strips on it. NOTE: Each tank shall have a unique measuring strip for that specific tank. Sight glasses should never be removed and put on another tank. This will give the wrong volume reading. It is also required to have pressure and temperature gauges installed on the calibration tank, in order to be able to make corrections to standard conditions. The standard requirements to a prover system is listed below: All prover vessels should be calibrated by qualified personnel using test measures certified by the U.S Bureau of Standards and be issued a Certificate of Calibration. All meter prover systems should be equipped with a thermometer and pressure gauges located near the meter. Prover vessel shall have pressure gauges and thermometers on the inlet and outlet. Gauges and thermometers should be checked periodically against a deadweight tester and certified thermometer to verify accuracy. All valves in the proving system which affect the accuracy of the proving should provide for observation of valve integrity, e.g., double block and bleed valves. Proving conditions should approximate operating conditions. Page 6 of 10 Surface Well Test Procedure
150 Oil flow rate - Measurements and calculations <Document Number > Rev. B Shrinkage tester The shrinkage tester is used to verify that the shrinkage measured by using the calibration tank is within an acceptable range. A shrinkage tester works by receiving oil/condensate at separator pressure, the tester is then isolated from the separator and slowly bled off to atmospheric pressure. The shrinkage is the decrease in volume of a liquid phase caused by the release of solution of gas and/or the thermal contraction of the liquid and is expressed as a percentage Procedure Surface Well Test Page 7 of 10
151 <Document Number > Rev. B Oil flow rate - Measurements and calculations 6. Measurements Meter reading 1. Note oil line temperature 2. Take meter reading at time 0 3. Allow a known amount of volume pass through the meter. Alternatively, allow a certain volume pass through the meter for a known amount of time NOTE: if it is decided to take a meter reading for a certain length of time, make sure the tank has the capacity to handle the volume expected during this time. 4. Note oil line temperature when reading is finished 5. Calculate volume passing through the meter 6. Proceed with calculating the corrected meter reading Calibration tank reading 1. Take initial tank reading and temperature reading 2. Open inlet valve to tank 3. Divert fluid flow to tank using oil manifold 4. Take reading as and when it is required (at the same time as for meter reading) from the sight glass over timed periods 5. At the end of the flow period, divert flow from tank to burner using oil manifold 6. Close tank inlet valve 7. Note pressure and temperature in tank 8. Note intermediate level at tank compartment. 9. Bleed off tank slowly to atmospheric pressure 10. Note temperature at atmospheric pressure 11. Note final level in tank at atmospheric pressure 12. Calculate shrinkage 13. Proceed with calculations for correction for temperature Page 8 of 10 Surface Well Test Procedure
152 Oil flow rate - Measurements and calculations <Document Number > Rev. B Shrinkage tester 1. Level in the separator should be higher the top scale on the shrinkage tester. NOTE: if the separator has a low liquid level, calculate shrinkage from the point the liquid level reaches in the sight glass. 2. With the shrinkage tester empty, open the gas equalising line from separator to pressure the shrinkage tester to separator pressure. 3. Open liquid inlet line slowly to allow the shrinkage tester to fill with oil NOTE: be careful when approaching the top mark on the scale, so the tester is not overfilled. 4. Once sample is at zero level, close oil and gas line 5. Record pressure and temperature of sample in tester NOTE: time to bleed sample to atmospheric should be ± 30 minutes 6. Open bleed-off valve slowly 7. Once the sample is at atmospheric pressure, record reduction from scale 8. Repeat operation as required to obtain the average 9. When completed, close bleed-off valve and open gas line to enable the tester to reach separator pressure 10. Open drain valve to blow down level via drain line Procedure Surface Well Test Page 9 of 10
153 <Document Number > Rev. B Oil flow rate - Measurements and calculations 7. Calculations 7.1 Total volum correction factor 1. Calculate combined meter and shrinkage factor Note final tank reading is the reading after pressure is bled to zero and the oil has been settled for a period of time. 2. Correct for temperature deviation from standard temperature [ ] 3. Total volume correction factor 7.2 Corrected meter reading 8. Meter Proving Reports A meter proving report shall as a minimum contain the information stated below: Prover report number Date and time Meter owner Company of person responsible for proving Fluid used Fluid specific gravity Fluid vapour pressure (at operation pressure) Meter size Totalizer pulses Prover size Pulses per unit volume Uncorrected prover volume Temperature of fluid at meter and prover Pressure of fluid at meter and prover Operator s name and signature Page 10 of 10 Surface Well Test Procedure
154 Document Number: Revision: <Document Number > B Product Line / Function Document Type: Title: Surface Well Test Procedure Level: <Classification> Gas flow rate - Measurements & Calculations December 2015 by Expro - ALL RIGHTS RESERVED This document may not be reproduced, either wholly or in part, nor may it be used by, or its contents divulged to, any other person whosoever without written permission of Expro. Furthermore the Master Copy of this document is held and formally controlled within Insight. Hard copies may be printed but will not be updated. Please refer to Insight for the latest revision. Template No: INS-T-008 Rev 1
155 <Document Number > Rev. B Gas flow rate - Measurements & Calculations Revision List Revision Date Prepared by Reviewed by Approved by A 15.Sep.2015 Kristian Sletthaug Revision Comment: First release B 27.Nov.2015 Revision Comment: Revision Comment: Revision Comment: Revision Comment: Page 2 of 14 Surface Well Test Procedure
156 Gas flow rate - Measurements & Calculations <Document Number > Rev. B Table of Contents Section Page 1. Purpose Scope Responsibilities References Apparatus Measurements Calculation Tables... 6 Procedure Surface Well Test Page 3 of 14
157 <Document Number > Rev. B Gas flow rate - Measurements & Calculations 1. Purpose The objective of this document is to give guidance on which measurements that are necessary to be able to calculate the gas flow rate, additionally, the equation behind the flow rate will be outlined. 2. Scope This document describes which measurements are needed to calculate the gas flow rate, where the measurements should be taken, factors that need to be calculated, and the tables which have to be used. Important note: all measured inputs shall be in metric units. If measured values is in imperial units they need to be converted before the can be used in the following equations in this document. 3. Responsibilities These days, all oil and gas flow rates are determined by use of advanced software. This document is meant to provide guidance to the factors and equations which lie behind the calculation of the gas flow rate. 4. References GPSA handbook Measurement 5. Apparatus 1. Pressure transmitter 2. Temperature transmitter 3. Ranarex Gravitometer Page 4 of 14 Surface Well Test Procedure
158 Gas flow rate - Measurements & Calculations <Document Number > Rev. B 6. Measurements h w - Differential pressure, inch water Pressure transmitter at Daniel box P f - Static pressure, kpa Pressure transmitter at Daniel box P b Base pressure, kpa Pressure in separator T f Flowing temperature, C Temperature transmitter on separator T b Base temperature, C Temperature in separator Gas S.G specific gravity of gas Ranarex Gas Gravitometer 7. Calculation F b - Basic orifice factor Table F bp Pressure base factor F tb Flowing temperature factor F tf Flowing temperature factor F pv Supercompressibility factor Z from Table F g Relative density factor F r Reynolds Number Table Y Expansion factor Table F a Orifice thermal expansion Gas flow rate: ( ) Procedure Surface Well Test Page 5 of 14

159 <Document Number > Rev. B Gas flow rate - Measurements & Calculations 8. Tables Page 6 of 14 Surface Well Test Procedure
160 Gas flow rate - Measurements & Calculations <Document Number > Rev. B Procedure Surface Well Test Page 7 of 14

161 <Document Number > Rev. B Gas flow rate - Measurements & Calculations Page 8 of 14 Surface Well Test Procedure
162 Gas flow rate - Measurements & Calculations <Document Number > Rev. B Procedure Surface Well Test Page 9 of 14

163 <Document Number > Rev. B Gas flow rate - Measurements & Calculations Page 10 of 14 Surface Well Test Procedure

164 Gas flow rate - Measurements & Calculations <Document Number > Rev. B Procedure Surface Well Test Page 11 of 14
165 <Document Number > Rev. B Gas flow rate - Measurements & Calculations Page 12 of 14 Surface Well Test Procedure
166 Gas flow rate - Measurements & Calculations <Document Number > Rev. B Procedure Surface Well Test Page 13 of 14
167 <Document Number > Rev. B Gas flow rate - Measurements & Calculations Page 14 of 14 Surface Well Test Procedure


168 Client: Example Field: Example Well: Example Date: Example TOTAL VOLUME CORRECTION FACTOR - OIL Details Choke size n/a /64ths Start time n/a Hrs Separator pressure n/a Barg Finish time n/a Hrs Separator temperature n/a C Final reading time n/a Hrs Meter used n/a Observed oil gravity 0,860 VCF 0,996 Oil gravity 20 C Oil SC 0,857 Meter reading Initial meter reading 2 m³ Oil line temperature 50 C Final meter reading 10 m³ Volume through meter 8 m³ Tank reading Initial tank reading 2 m³ Intermediate tank reading 9,8 m³ Initial tank temperature 15 C Intermediate tank temperature 30 C Final tank reading 9 m³ Time allowed for shrinkage 157 mins Final tank temperature 10 C Shrinkage factor Tank shrinkage Shrinkage tester Intermediate tank reading 9,8 m³ Initial reading 100 % Final tank reading 9 m³ Final reading 91,59 % Shrinkage factor 8,16 % Shrinkage factor 8,41 % Total volume correction factor VCF - Pressure 0,875 Total volume correction factor 0,91875 VCF - Temperature 1,05 Volume through SC 7,35 Sm³ MF 0,975 Standard conditions P 14,5037 psi CMSF 0,875 T 15 C TVCF 0,919 Use total volume correction factor marked green VCF = 1 - (((9/5)*T C+32)-60)* Date & Signature:
169 Attachment III Attachment III Tables used for calculations - API GPSA Engineering Data book 11 th edition (Electronic) 168
170 Attachment III 169
171 Attachment III 170
172 Attachment III 171
173 Attachment III 172
174 Attachment III 173
175 Attachment III 174
176 Attachment III 175
177 Attachment III 176
178 Attachment III 177
179 Attachment III 178
180 Attachment III 179
181 Attachment III 180
182 Attachment III 181

183 Attachment III 182
184 Attachment III 183
185 Attachment III 184
186 Attachment III 185
187 Attachment III 186
188 Attachment III 187
189 Attachment III 188

190 Attachment III 189
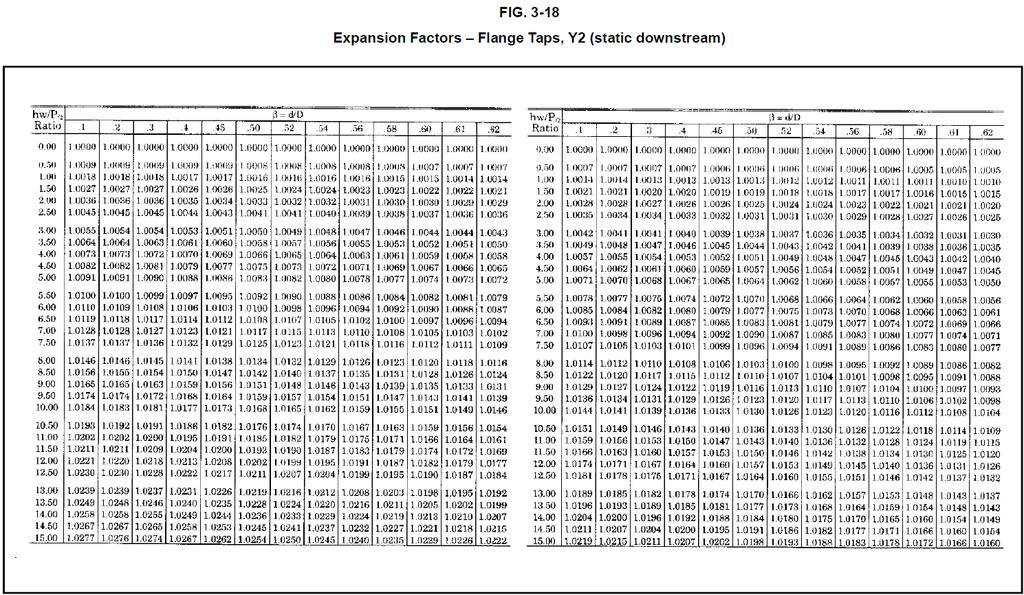
191 Attachment III 190
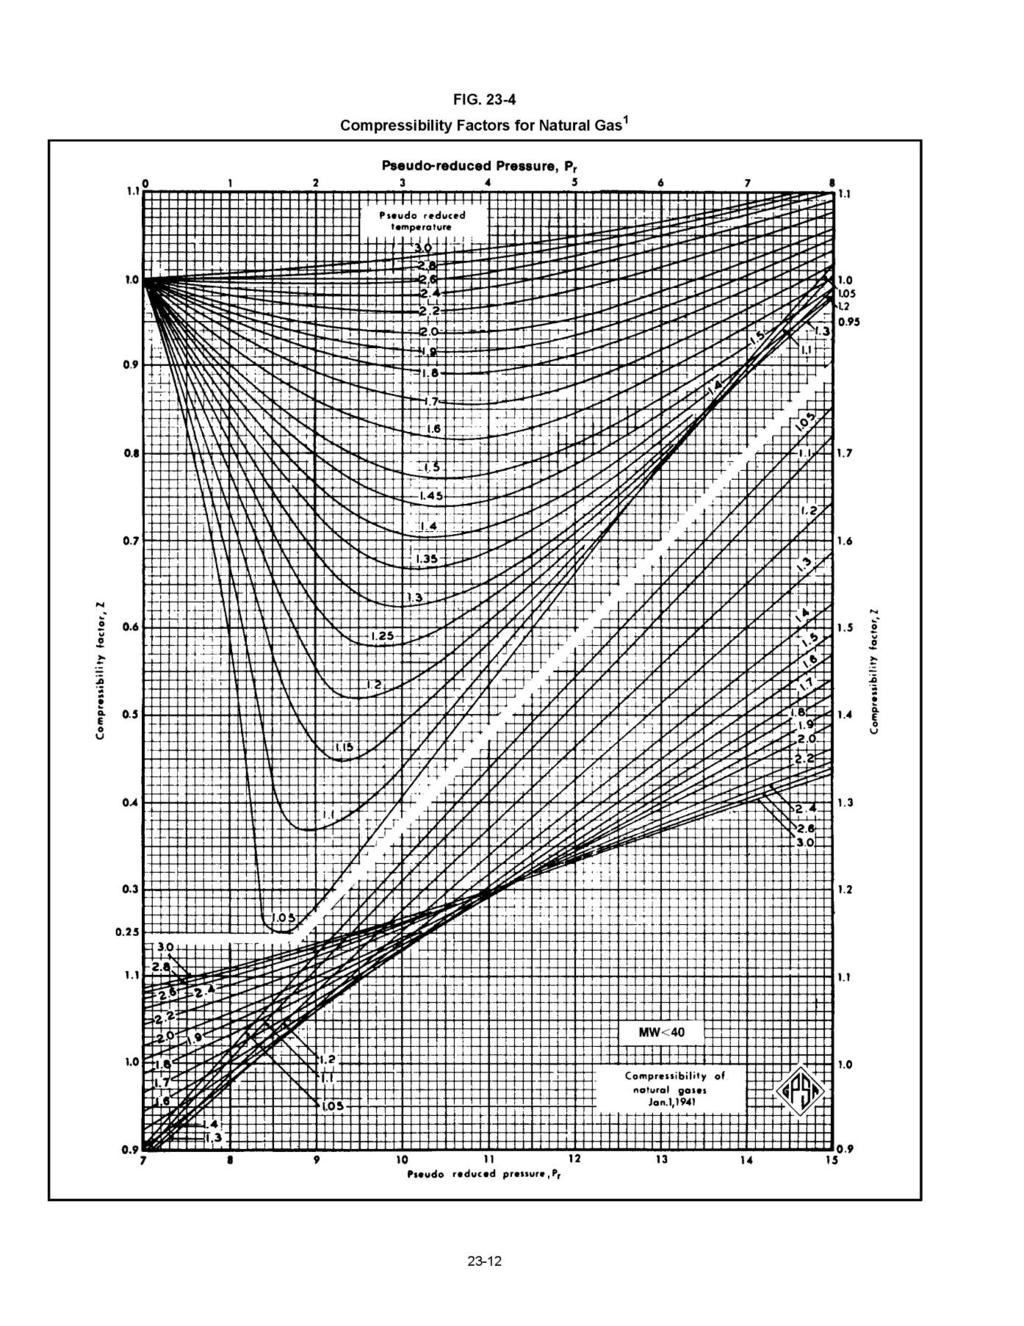
192 Attachment V 191
193 Attachment V 192
194 Attachment V 193
195 Attachment V 194
196 Attachment V 195
197 Attachment V 196
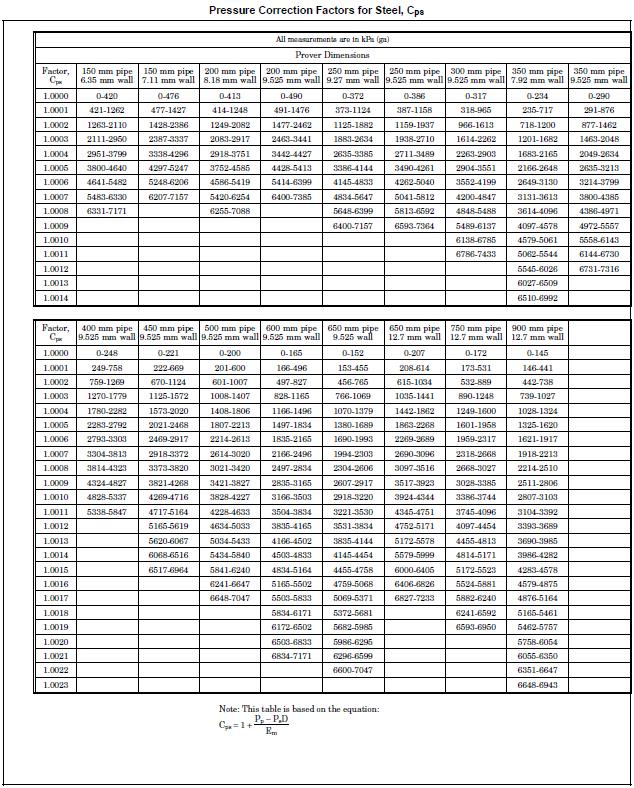
198 Attachment V 197
199 Attachment V Attachment IV Technical specifications - Expro memory gauges - SPARTEK memory gauges - Rosemount 3051T - Rosemount Rosemount Dreager Dreager CH Dreager CH Dreager CH Oil densiometer - Ranarex gravitometer 198
200 Attachment V Expro Memory Gauges Specifications Technical specification CT1000 MT 1000 HT 1000 Pressure sensor Shear Quartz Digital shear quartz Digital shear quartz Resonator resonator resonator Pressure range 0-16,000 psi 0-16,000 psi 0-20,000 psi Accuracy ± 3.2 psi ± 3.2 psi ± 3.2 psi Transducer resolution psi psi psi Stability (per month) 0.1 psi 0.1 psi 0.1 psi Temperature sensor Quartz crystal Digital Quartz crystal Digital Quartz crystal Temperature range F (0-177 C) F (0-177 C) F (0-200 C) Accuracy =/- 1.8 F =/- 1.8 F =/- 1.8 F Resolution 0.09 F (0.05 C) 0.09 F (0.05 C) 0.09 F (0.05 C) Memory type Non-volatile flash Non-volatile flash Non-volatile flash Memory capcity 1 million data sets 1 million data sets 800,000 data set Fastest sample rate 0.1 seconds 1 second 1 second Programmable intervals Length c/w battery pack 60 (1524mm) 30.5 (775mm) 30.5 (775mm) Outside diameter 1.25 (2.8mm) or1.5 (38mm) 1.25 (32mm) 1.25 (32mm) Weight 5.5kg (12lb) 5.0kg (11lb) 5.0kg (11lb) SPARTEK Memory Gauge Specifications Technical spesification - Quartz gauge SS5063 SS5067 SS5200 Pressure sensor Quartz Quartz Quartz Pressure range 10,000 16,000 psi 10,000 25,000 psi 16,000 25,000 psi 30,000 35,000 psi 30,000 35,000 psi Accuracy (% FS) % % % % % Resolution % FS % FS % FS Stability (per year) <0.020 % FS/year <0.020 % FS/year <0.020 % FS/year Temperature range 77 F F (25 C - 77 F F (25 C C) 77 F F (25 C C) 200 C) Accuracy 0.9 F (0.5 C) 0.9 F (0.5 C) 0.9 F (0.5 C) Resolution <0.009 F (0.005 C) <0.009 F (0.005 C) <0.009 F (0.005 C) Power requirements Voltage (min) 3 V 3 V 3 V Current (sleep) 0.2 ma 0.2 ma 4 ma Current (sample) 7 ma 7 ma 10 ma 199
201 Attachment V Data acquisition Pressure Pressure Pressure Channels Temperature Temperature Temperature Time Time Time Fastest sample rate 10 sample/sec 10 sample/sec 1 sample/sec Memory capacity 2,000,000 samples 2,000,000 samples 2,000,000 samples *Optional 4,000,000 samples* 4,000,000 samples* Redundant Memory 2x, 4x 2x, 4x 2x, 4x Gauge Material Inconel 718-NACE/17- Inconel 718-NACE MP35N Inconel 718-NACE MP35N 4PH MP35N (as req.) (as required) (as required) Diameter (inch) (19 mm) 1.27 (32.3 mm) 1.27 (32.3 mm) Length Varies with configuration Varies with configuration Varies with configuration Seal configuration 2x O-ring/Backup Metal C-Ring, 2x O- Metal C-Ring, 2x O- ring/backup ring/backup Communications RS 232/USB RS 232/USB RS 232/USB Software compatibility Windows 8/7/Vista/XP/NT/2000 Surface readout yes yes yes Technical spesification - Sapphire SS2300 SS2500 SS2700 Pressure sensor Sapphire Sapphire Sapphire Pressure range 750, 1500, 3k, or 6k psi 10k, 15k, or 20k* 10k, 15k, or 20k* Accuracy (% FS) 0.3 psi or 0.03 % 0.3 psi or 0.03 % 0.3 psi or 0.05 % Resolution % FS % FS % FS Stability (per year) < 0.03 % FS/year < 0.03 % FS/year < 0.03 % FS/year Temperature range F (135 C) F (150 C) F (170 C) Power requirements Voltage (min) 3 V 3 V 3 V Current (sleep) 0.10 ma 0.10 ma 0.20 ma Current (sample) 4.50 ma 4.50 ma 4.80 ma Data acquisition Pressure Pressure Pressure Channels Temperature Temperature Temperature Time Time Time Fastest sample rate 1 sample/sec 1 sample/sec 1 sample/sec Memory capacity 2,000,000 samples 2,000,000 samples 2,000,000 samples *Optional 4,000,000 samples 4,000,000 samples 4,000,000 samples Pressure Trigger yes yes yes Redundant Memory 2x, 4x 2x, 4x 2x, 4x Gauge Material 17-4 PH 17-4 PH 17-4 PH Options* Inconel 718-NACE Inconel 718-NACE Inconel 718-NACE Diameter (inch) 0.75, 1.00, or , 1.00, or , 1.00, or
202 Attachment V Length Varies with configuration Varies with configuration Varies with configuration Communications RS 232/USB RS 232/USB RS 232/USB Software compatibility Windows 8/7/Vista/XP/NT/2000 Surface readout yes yes yes * - 20k only with 1.0 or 1.25 OD Rosemount 3051T specifications Range and sensor limit Range Minimum Span Upper (URL) Lower (LRL) Lower Gauge (LRL) psi (20.6 mbar) 30 psi (2.07 bar) 0 psi (0 bar) psig (-1.01 barg) psi (0.103 bar) 150 psi (10.3 bar) 0 psi (0 bar) 14.7 psig (-1.01 barg) 3 8 psi (0.55 bar) 800 psi (55.2 bar) 0 psi (0 bar) 14.7 psig (-1.01 barg) 4 40 psi (2.76 bar) 4000 psi (257.8 bar) 0 psi (0 bar) 14.7 psig (-1.01 barg) psi (137.9 bar) psi (689.4 bar) 0 psi (0 bar) 14.7 psig (-1.01 barg) Total performance Range 2 4 Note - For ±50 F (28 C) temperature changes, up to 1000 psi (6,9 MPs) line pressure, from 1:1 to 5:1 range down Long term stability Range 1 4 Reference accuracy - standard Range 1 4 For spans less than 10:1 Range 5 For spans less than 10:1 [ ] [ ] Reference accuracy - high Range 2 4 For spans less that 5:1 [ ] Dynamic Performance total response time (T d + T c 75 F (24 C) 201
203 Attachment V 4 20 ma (HART protocol) Fieldbus protocol Total response time (T d + T c 75 F (24 C) 100 ms 152 ms Dead time (T d ) 45 ms (nominal) 97 ms Update Rate 22 times per second 22 times per second Ambient Temperature Effect per 50 F (28 C) Range 1 Range 2 4 Range 5 Rosemount 644 specifications Accuracy Sensor option Sensor reference Input range Recomendend min. span Digital Accuracy D/A Accuracy 2-,3-,4-wire RTDs C F C F C F Pt100 IEC 751, -200 to to ±0.15 ±0.27 ±0.03% of span 1995(α= ) Pt100 JIS 1604, to to ±0.15 ±0.27 ±0.03% of span (α= ) Ambient Temperature Effect Sensor Sensor reference option 2-,3-,4-wire RTDs Pt100 IEC 751, 1995(α= ) Pt100 JIS 1604, 1981 (α= ) Temp. Effect per 1.0 C (1.8 F) change in ambient temp Range D/A Effect C ( F) Entire Sensor input range 0.001% of span C ( F) Entire Sensor input range 0.001% of span 202
204 Attachment V Rosemount 3144 specifications Accuracy Sensor option Sensor reference Input range Recomendend min. span Digital Accuracy D/A Accuracy 2-,3-,4-wire RTDs C F C F C F Pt100 IEC 751, -200 to to ±0.10 ±0.18 ±0.02% of span 1995(α= ) Pt100 JIS 1604, to to ±0.10 ±0.18 ±0.02% of span (α= ) Ambient Temperature Effect Sensor Sensor reference option 2-,3-,4-wire RTDs Pt100 IEC 751, 1995(α= ) Pt100 JIS 1604, 1981 (α= ) Temp. Effect per 1.0 C (1.8 F) change in ambient temp Range D/A Effect C Entire Sensor input range 0.001% of span C Entire Sensor input range 0.001% of span 203
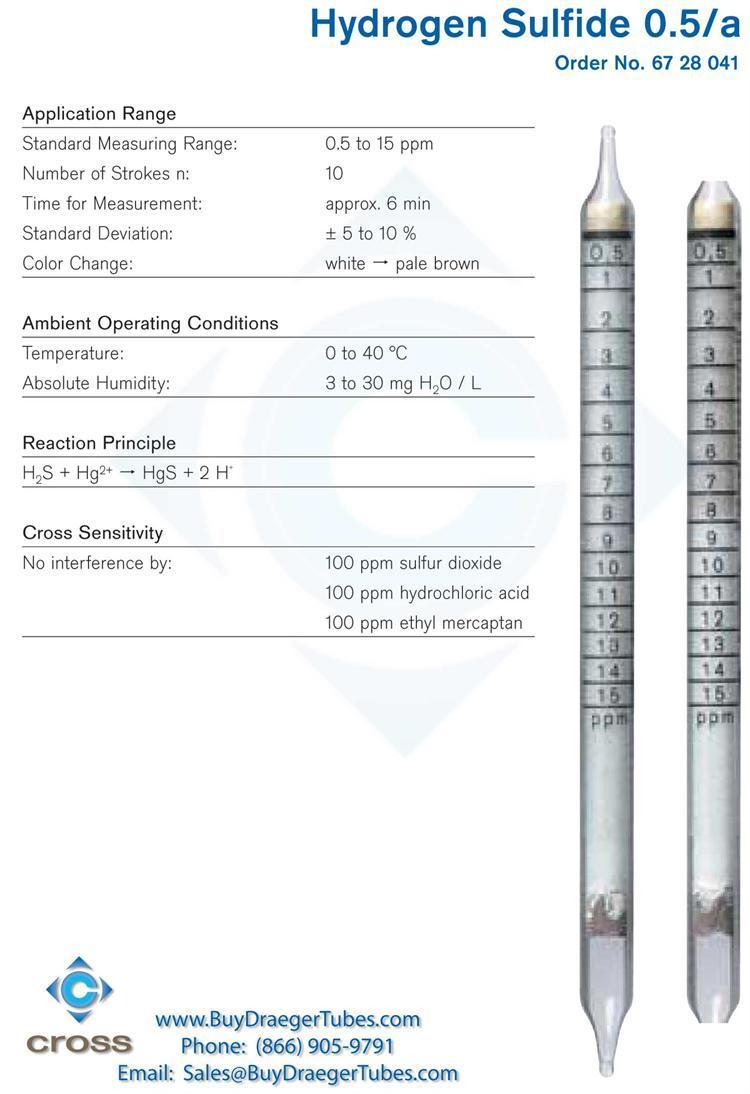
205 Attachment V 204
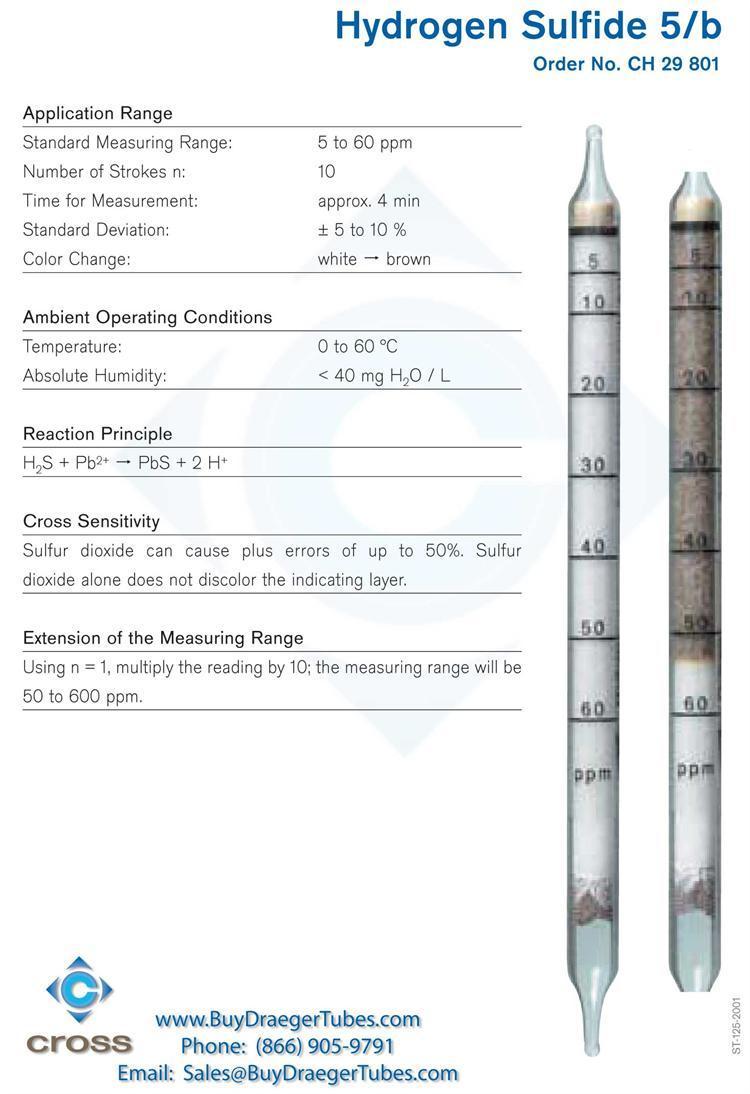
206 Attachment V 205
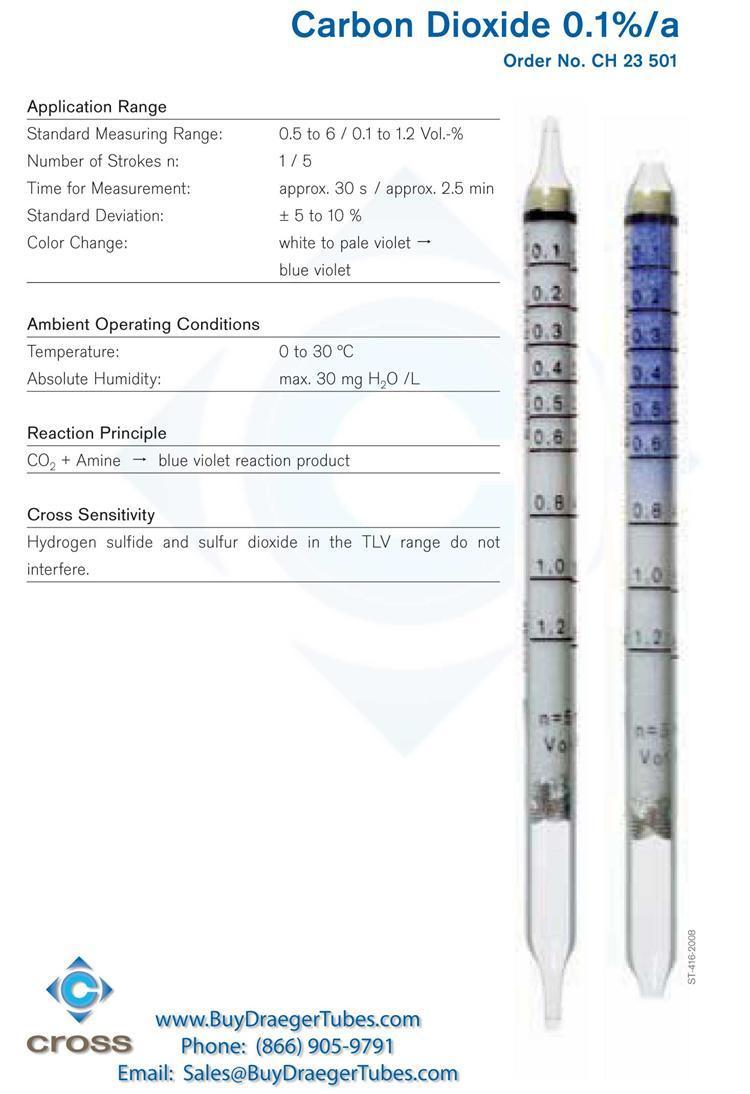
207 Attachment V 206
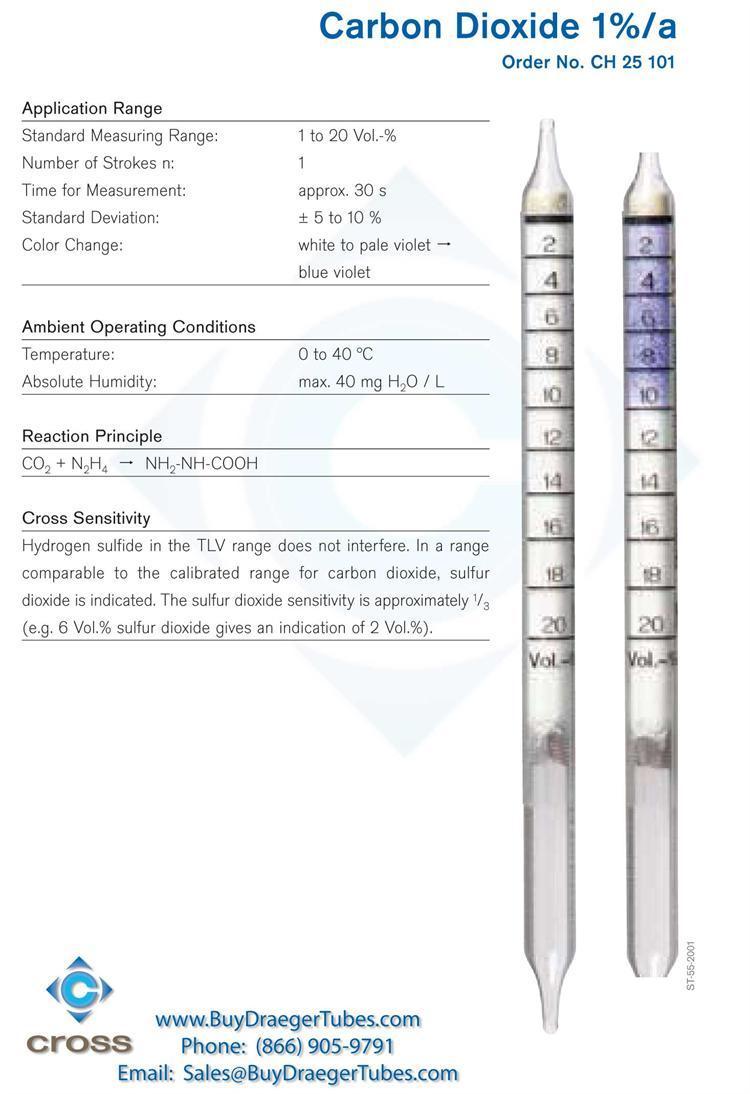
208 Attachment V 207
CHE Well Testing Package/Service:
 CHE Well Testing Package/Service: CHE delivers well testing package And services, trailer mounted well testing package and offshore/onshore well testing services with over 10 years experience. Our testing
Captains Meeting 2009 Introduction to Well Testing- Expro. Edwin Schoorl
 Captains Meeting 2009 Introduction to Well Testing- Expro Edwin Schoorl Agenda Oil and Gas presence Well construction Well testing Welltest System Welltest Equipment Welltest Video Questions Oil and gas
Drilling Efficiency Utilizing Coriolis Flow Technology
 Session 12: Drilling Efficiency Utilizing Coriolis Flow Technology Clement Cabanayan Emerson Process Management Abstract Continuous, accurate and reliable measurement of drilling fluid volumes and densities
Subsea Safety Systems
 Subsea Safety Systems The ELSA-HP has been developed to service the high pressure horizontal tree completion and intervention market. With systems designed and qualified up to 15,000 psi, 250 degf and
IWCF Equipment Sample Questions (Combination of Surface and Subsea Stack)
") IWCF Equipment Sample Questions (Combination of Surface and Subsea Stack) 1. Given the volumes below, how much hydraulic fluid will be required to carry out the following operations (no safety margin)?
IWCF Equipment Sample Questions (Combination of Surface and Subsea Stack) 1. Given the volumes below, how much hydraulic fluid will be required to carry out the following operations (no safety margin)?
Best Practices - Coiled Tubing Deployed Ball Drop Type Perforating Firing Systems
 Best Practices - Coiled Tubing Deployed Ball Drop Type Perforating Firing Systems As a result of a recent job incident utilizing a Ball Drop Type firing system deployed on coiled tubing, the following
W I L D W E L L C O N T R O L FLUIDS
 FLUIDS Fluids Learning Objectives You will learn about different fluids that can be used in well control. You will become familiar with the characteristics and limitations of fluids. You will learn general
IWCF Equipment Sample Questions (Surface Stack)
") IWCF Equipment Sample Questions (Surface Stack) 1. During a well control operation 4000 psi was shut in below the middle pipe rams. Ram type BOP data: Model: Cameron U type Rated Working Pressure: 15000
IWCF Equipment Sample Questions (Surface Stack) 1. During a well control operation 4000 psi was shut in below the middle pipe rams. Ram type BOP data: Model: Cameron U type Rated Working Pressure: 15000
New Developments and Special Experiences in Geoinform s Well Testing Services
 New Developments and Special Experiences in Geoinform s Well Testing Services Peter Baranyi Chief Engineer, GEOINFORM Ltd. Services provided by Geoinform, Well Testing Technologies Surface WT: standard
Dynamic Underbalance (DUB)
") Dynamic Underbalance (DUB) Perforating Cam Le Perforating Product Champion Agenda Overview DUB Software Tools Case histories 2011 HALLIBURTON. ALL RIGHTS RESERVED. 2 Dynamic Underbalance Software Dynamic
Dynamic Underbalance (DUB) Perforating Cam Le Perforating Product Champion Agenda Overview DUB Software Tools Case histories 2011 HALLIBURTON. ALL RIGHTS RESERVED. 2 Dynamic Underbalance Software Dynamic
Blowout during Workover Operation A case study Narration by: Tarsem Singh & Arvind Jain, OISD
 1. Introduction An incident of gas leakage from a well took place during workover operations. Subsequently, the gas caught fire on the fourth day in which twelve persons were injured. Two contract workers,
Hard or Soft Shut-in : Which is the Best Approach?
 HARD - SOFT shut-in? Hard or Soft Shut-in : Which is the Best Approach? March '93 INTRODUCTION There is now reasonable acceptance through-out the industry for the use of a hard shut-in procedure following
On-Off Connector Skirt
 On-Off Connector Skirt Retrievable Packers & Accessories The On-Off Connector Skirt is compact, reliable, fully sealing, J-type tubing disconnect device that automatically engages and releases with a small
Completion Workover Riser System. Enabling efficient operations by reducing interface complexities and minimizes operational risk
 Completion Workover Riser System Enabling efficient operations by reducing interface complexities and minimizes operational risk Well integrity with fatigue management were key drivers for our system design
Next Generation Quartz Pressure Gauges
 Next Generation Quartz Pressure Gauges Rick Puccio, Ph.D. Senior Scientist Quartzdyne Houston, TX March 2, 2016 Outline Quartz Pressure Gauge Introduction Gauge Size Reduction Long Term Pressure Drift
The key to connectivity
 The key to connectivity Kerry Daly, Global BD Manager, Tubing Conveyed Perforating (TCP) First published by Oilfield Technology, November 2015 Connecting oil or gas-bearing formations with the wellbore
Perforating Options Currently Available in Horizontal Shale Oil and Gas Wells. Kerry Daly, Global BD Manager- DST TCP
 MENAPS 2013 Perforating Options Currently Available in Horizontal Shale Oil and Gas Wells Kerry Daly, Global BD Manager- DST TCP MENAPS 13-17 WELL FLOW MANAGEMENT TM Scope/ Contents: MENAPS 13-17 Study
OCEAN DRILLING PROGRAM
 BIH OCEAN DRILLING PROGRAM www.oceandrilling.org Scientifi c Application Packers A packer is an inflatable rubber element that inflates to seal the annular space between the drill string and the borehole
Restoring Fluid Flow in Tubing Strings
 Restoring Fluid Flow in Tubing Strings Andrew Roth, Product Manager Fike Corporation Fike Hydraulic Tubing Drains (HTD) for use with deep hole drilling tools, downhole devices and other oil and off shore
Coal Bed Methane (CBM) Permeability Testing
 Permeability Testing") Coal Bed Methane (CBM) Permeability Testing WTN Network Meeting April 28-29, 2011 ExxonMobil Exploration / Well Testing Team CBM Flow Characteristics Flow mechanism Gas desorbs when pressure drops below
Coal Bed Methane (CBM) Permeability Testing WTN Network Meeting April 28-29, 2011 ExxonMobil Exploration / Well Testing Team CBM Flow Characteristics Flow mechanism Gas desorbs when pressure drops below
AUTOMATIC HOSE TEST UNIT, TYPE SPU
 VALVES AND FITTINGS UP TO 14,000 BAR TEST AND CONTROL EQUIPMENT H IGH PRESSURE TECHNOLOGY AUTOMATIC HOSE TEST UNIT, TYPE SPU Pressure range from 1 up to 10,000 bar User-friendly touch panel operation HIGH-PRESSURE
ONSITE PROVING OF GAS METERS. Daniel J. Rudroff WFMS Inc West Bellfort Sugar Land, Texas. Introduction
 ONSITE PROVING OF GAS METERS Daniel J. Rudroff WFMS Inc. 13901 West Bellfort Sugar Land, Texas Introduction With the increased use of Natural Gas as a fuel, and higher natural gas prices buyers and sellers
Perforating Center of Excellence TESTING SERVICES OVERVIEW
 Perforating Center of Excellence TESTING SERVICES OVERVIEW Jet Research Center (JRC) is the leader in energetic research and testing for the oil and gas industry. Since introducing jet perforators for
W I L D W E L L C O N T R O L PRESSURE BASICS AND CONCEPTS
 PRESSURE BASICS AND CONCEPTS Pressure Basics and Concepts Learning Objectives You will be familiarized with the following basic pressure concepts: Defining pressure Hydrostatic pressure Pressure gradient
Testing Services Overview
 2 Jet Research Center JRC Jet Research Center Perforating Center of Excellence Testing Services Overview API RP19B Testing Advanced Testing Operational Testing API RP19B Testing The American Petroleum
Successful Deployment of a Long Gun String Via Intelligent Coiled Tubing
 Successful Deployment of a Long Gun String Via Intelligent Coiled Tubing Parry Hillis: Technical Manager BakerHughes David Ayre: BP Well Perforation Specialist Jim Gilliat: TCP/DST Business Development
TECHNICAL BENEFITS OF CJS / RAISE HSP. Technical Advantages
 TECHNICAL BENEFITS OF CJS / RAISE HSP Technical Advantages The HSP is designed for low- to mid- volume applications at flow rates of 1 cubic meter to 30 c. m per day. The benefits are in the details. The
Colorado Oil and Gas Conservation Commission
 Colorado Oil and Gas Conservation Commission http://cogcc.state.co.us/ FORM 5A Completed Interval Report INDUSTRY TRAINING Denver, Colorado November 27, 2012 Form 5A Completed Interval Report Introduction
Cased-Hole Logging Environment
 Cased-Hole Logging Environment 2 Planning a Production Logging Job Planning is an important part of a production logging job. Frequently these jobs can only be done in safety during daylight. Thus, the
Air Operated Hydraulic Pumping Systems to 50,000 psi
 High Pressure Equipment Air Operated Hydraulic Pumping Systems to 50,000 psi PS-10: 10,000 psi PS-20: 20,000 psi PS-30: 30,000 psi PS-40: 40,000 psi PS-50: 50,000 psi PS-90: 90,000 psi High Pressure air
RPSEA UDW Forum June 22 & 23, Secure Energy for America
 RPSEA UDW Forum June 22 & 23, 2010 Secure Energy for America PROJECT TEAM RPSEA Operator Advisory Committee Anadarko Chevron Shell ConocoPhillips Subcontractors IntecSea NOV CTES General Marine Contractors
Inflatable Packer Single & Double. Single & Double Packer Dimension. Wireline Packer. Water Testing Packer (WTP) Packer
 Packer") Inflatable Packer Single & Double Single & Double Packer Dimension Wireline Packer Water Testing Packer (WTP) Packer Packer Working Pressure & Depth Chart Packer Water Hand Pump Packer Air Driven Pump
Inflatable Packer Single & Double Single & Double Packer Dimension Wireline Packer Water Testing Packer (WTP) Packer Packer Working Pressure & Depth Chart Packer Water Hand Pump Packer Air Driven Pump
1. The well has been shut in on a kick and the kill operation has not started.
 Well Control Methods Day 2 1. The well has been shut in on a kick and the kill operation has not started. Shut in drill pipe pressure Shut in casing pressure 500 psi 700 psi After stabilization, both pressures
FAQs about Directive PNG017: Measurement Requirements for Oil and Gas Operations
 FAQs about Directive PNG017: Measurement Requirements for Oil and Gas Operations General Is it acceptable to report no gas production? All associated gas (gas produced from an oil well) or non-associated
TAM Single SeT inflatable
 TAM Single SeT inflatable ReTRievAble PAckeRS Sets with pressure only Releases with straight pull or rotate Ideal for horizontal applications Sets in casing or open hole Runs on tubing, coiled tubing,
WILD WELL CONTROL WARNING SIGNS OF KICKS
 WARNING SIGNS OF KICKS Warning Signs of Kicks Learning Objectives You will learn the warning signs that indicate the well may be kicking: Warning signs of kicks False kick indicators You will also learn
The Discussion of this exercise covers the following points:
 Exercise 3-2 Orifice Plates EXERCISE OBJECTIVE In this exercise, you will study how differential pressure flowmeters operate. You will describe the relationship between the flow rate and the pressure drop
Worked Questions and Answers
 Worked Questions and Answers A Learning Document for prospective Candidates For the Rotary Drilling Well Control Test Programme Copyright, IWCF June 2000 Revision No.1, November 2000 IWCF 2000 page 1 of
DB Bridge Plug. Features. Benefits. Applications
 DB Bridge Plug The WELLFIRST Premium Cast Iron Bridge Plug designed to run on electric line. Rated between 2000-10000-psi differential, and 300 F from above and below. Features Field Proven Design Constructed
1 Scope... 2 Functions of cementing float equipment... 3 Definitions... 4 Calibration... 5 Test Categories... 6 General...
 American Petroleum Institute Contents Page 1 Scope... 2 Functions of cementing float equipment... 3 Definitions... 4 Calibration... 5 Test Categories... 6 General... 7 Apparatus and Materials... 8 High-temperature/high-pressure
WellCAP IADC WELL CONTROL ACCREDITATION PROGRAM
 WellCAP IADC WELL CONTROL ACCREDITATION PROGRAM WELL SERVICING OPERATIONS (WIRELINE, COILED TUBING & SNUBBING) CORE CURRICULUM AND RELATED FORM WCT-2WSI INTRODUCTORY LEVEL For information on how an course
OIL AND GAS INDUSTRY
 This case study discusses the sizing of a coalescer filter and demonstrates its fouling life cycle analysis using a Flownex model which implements two new pressure loss components: - A rated pressure loss
Operational Settings:
 instrucalc features more than 70 routines associated with control valves, ISO flow elements, relief valves and rupture disks, and calculates process data at flow conditions for a comprehensive range of
Instructions for SMV 3000 Multivariable Configuration (MC) Data Sheets
 Data Sheets") Instructions for SMV 3000 Multivariable Configuration (MC) Data Sheets Similar to the TC option for ST 3000 transmitters, the MC option for the SMV 3000 provides a service to our customers which results
Instructions for SMV 3000 Multivariable Configuration (MC) Data Sheets Similar to the TC option for ST 3000 transmitters, the MC option for the SMV 3000 provides a service to our customers which results
FAQs about Directive 017
 FAQs about Directive 017 General What measurement points are covered in this directive? The requirements in this directive cover all measurement points required by the Oil and Gas Conservation Regulations
LPG DRIVER ATTENDED TRANSPORT LOADING
 November 1993 Prepared By: Ken A. Steward. P.E. Linco-Electromatic, Inc. 4580 West Wall Street Midland, Texas 78703 LPG DRIVER ATTENDED TRANSPORT LOADING INTRODUCTION The safest and most accurate method
OLGA. The Dynamic Three Phase Flow Simulator. Input. Output. Mass transfer Momentum transfer Energy transfer. 9 Conservation equations
 서유택 Flow Assurance The Dynamic Three Phase Flow Simulator 9 Conservation equations Mass (5) Momentum (3) Energy (1) Mass transfer Momentum transfer Energy transfer Input Boundary and initial conditions
Engineered solutions for complex pressure situations
 SPECIAL SERVICES Engineered solutions for complex pressure situations Cudd Energy Services (CES) delivers custom engineered solutions to resolve complex pressure situations resulting from equipment failure
PROPOSED NEW SUB- CODE 1 RIG UP AND TEAR. Possibly Fits into Existing Code. 7/26/2018 Review PROPOSED NEW CODE EXISTING OPERATION
 NW NW 1 RIG UP AND TAR 1 no sub-code RIG UP AND TAR DOWN Start: Rig released from previous well, nd: Rig fully rigged up, acceptance tests successfully completed, and signed off. DOWN 1 1 Rig Under Tow
ECD Reduction Tool. R. K. Bansal, Brian Grayson, Jim Stanley Control Pressure Drilling & Testing
 ECD Reduction Tool R. K. Bansal, Brian Grayson, Jim Stanley Control Pressure Drilling & Testing Drilling Engineering Association, Fourth Quarter Meeting November 20, 2008 1 Presentation outline Description
Cover Page for Lab Report Group Portion. Pump Performance
 Cover Page for Lab Report Group Portion Pump Performance Prepared by Professor J. M. Cimbala, Penn State University Latest revision: 02 March 2012 Name 1: Name 2: Name 3: [Name 4: ] Date: Section number:
SPECIFICATIONS. Approximate Weight: 10 oz. Surface Finish: Ra micro inch or less MATERIALS OF CONSTRUCTION
 DIFFUSION-RESISTANT, DIAPHRAGM SEAL, EXCESS FLOW SHUT-OFF VALVES (FS SERIES) FS Series Excess Flow Shut-Off Valves are designed to automatically shut-off the delivery of gas in a line if the flow exceeds
Understanding pressure and pressure
 CHAPTER 1 1-1 PRESSURE BASICS Remember to think downhole. The concepts provided in this section cover the foundations for good well control. Understanding pressure and pressure relationships is important
The Discussion of this exercise covers the following points:
 Exercise 5-3 Wet Reference Leg EXERCISE OBJECTIVE Learn to measure the level in a vessel using a wet reference leg. DISCUSSION OUTLINE The Discussion of this exercise covers the following points: Measuring
Design criteria, planning critical for successful deepwater well testing in HPHT developments
 Design criteria, planning critical for successful deepwater well testing in HPHT developments By Hercilio P.S. Filho, Petrobras; Edgar Almanza and Alejandro Salguero, Halliburton CONDITIONS IN DEEPWATER
SPECIFYING MOTIONLESS MIXERS
 SPECIFYING MOTIONLESS MIXERS The operating cost for the energy necessary to mix fluids with a motionless mixer is usually far lower than for any competitive mixing technique. An extruder which melts, mixes
DRILLING HOSE SOLUTIONS
 DRILLING HOSE SOLUTIONS HIGH PRESSURE FLEXIBLE LINES FOR A WIDE RANGE OF DRILLING APPLICATIONS HIGH QUALITY - HIGH STANDARD WE DELIVER ACCORDING TO THE HIGHEST LEVELS OF SPECIFICATIONS AND STANDARDS WITH
Lab 1c Isentropic Blow-down Process and Discharge Coefficient
 058:080 Experimental Engineering Lab 1c Isentropic Blow-down Process and Discharge Coefficient OBJECTIVES - To study the transient discharge of a rigid pressurized tank; To determine the discharge coefficients
FLOW COMPONENT TESTING FACILITIES API SAFETY VALVE VALIDATION TESTING
 FLOW COMPONENT TESTING FACILITIES API SAFETY VALVE VALIDATION TESTING ID-08-FCTF 1 of 7 Revision 1 API SAFETY VALVE VALIDATION TESTING SOUTHWEST RESEARCH INSTITUTE (SwRI ) FLOW COMPONENT TESTING FACILITIES
White Paper. Electrical control valve actuators on oil and gas production separators
 White Paper Electrical control valve actuators on oil and gas production separators Electrical control valve actuators on oil and gas production separators White Paper 18 th August 2014 Electrical control
AN ANALYSIS ON HIGH PRESSURE DYNAMIC CALIBRATORS USED IN THE DEFENSE AREAS
 AN ANALYSIS ON HIGH PRESSURE DYNAMIC CALIBRATORS USED IN THE DEFENSE AREAS Sung Soo HongPresenter Agency for Defense Development, Taean, 357-942, South Korea sungsoo@add.re.kr Abstract Up to now, there
VortexFlow DX (Downhole) Tool Installation Instructions
 Tool Installation Instructions") VortexFlow DX (Downhole) Tool Installation Instructions www.vortextools.com Page 1 of 10 The VortexFLOW tools are based upon Technology that is a result of U.S.A. patents 6,151,751; 6,659,118; 6,749,374;
VortexFlow DX (Downhole) Tool Installation Instructions www.vortextools.com Page 1 of 10 The VortexFLOW tools are based upon Technology that is a result of U.S.A. patents 6,151,751; 6,659,118; 6,749,374;
Standard Operating and Maintenance Instructions for Pumping System Model PS-90
 Standard Operating and Maintenance Instructions for Pumping System Model PS-90 High Pressure Equipment Company 2955 West 17th Street, Suite 6 PO Box 8248 Erie, PA 16505 USA 814-838-2028 (phone) 814-838-6075
Level MEASUREMENT 1/2016
 Level MEASUREMENT 1/2016 AGENDA 2 A. Introduction B. Float method C. Displacer method D. Hydrostatic pressure method E. Capacitance method G. Ultrasonic method H. Radar method I. Laser method J. Level
Date of Issue: July 2016 Affected Publication: API Specification 16C, Choke and Kill Equipment, Second Edition, March 2015 ADDENDUM 1
 Date of Issue: July 2016 Affected Publication: API Specification 16C, Choke and Kill Equipment, Second Edition, March 2015 ADDENDUM 1 Page 16, Section 4.6, delete the entire section and renumber all subsequent
Gas Measurement Fundamentals Certification. Curriculum
 Gas Certification Institute, LLC P.O. Box 131525 Houston, Texas 77219-1525 281-598-7200 Phone 281-598-7199 Fax contact@gascertification.com www.gascertification.com Curriculum Copyright 2007-2012 Gas Certification
Multiphase MixMeter. MixMeter specification. System Specification. Introduction
 System Specification Multiphase MixMeter Introduction The MixMeter is unique in applying proper homogenization techniques to multiphase measurement. In so doing the MixMeter avoids the requirement for
2007 Gas-Lift Workshop
 2007 Gas-Lift Workshop Field Application of Automation and Control Equipment by Cleon Dunham Oilfield Automation Consulting 2/11/2007 2007 Gas-Lift Workshop 1 Gas-Lift Automation & Control Equipment Outline
Fluid Machinery Introduction to the laboratory measurements
 Fluid Machinery Introduction to the laboratory measurements Csaba H s (csaba.hos@hds.bme.hu) Ferenc Hegedus (hegedusf@hds.bme.hu) February 21, 2014 1 Requirements related to the measurement part of the
MEASUREMENT BEST PRACTICES FORIMPROVEDREFINERY SAFETY, AVAILABILITY & EFFICIENCY
 MEASUREMENT BEST PRACTICES FORIMPROVEDREFINERY SAFETY, AVAILABILITY & EFFICIENCY Mark Menezes, PlantWeb Marketing Manager Rosemount Inc. Eric Wickberg, Pressure Applications Marketing Manager Rosemount
ONSITE PROVING OF GAS TURBINE METERS Daniel J. Rudroff Invensys Metering Systems
 ONSITE PROVING OF GAS TURBINE METERS Daniel J. Rudroff Invensys Metering Systems 1322 Foxwood, Houston, Texas 77008 INTRODUCTION With the increased use of Natural Gas as a fuel, higher natural gas prices,
PETROLEUM & GAS PROCESSING TECHNOLOGY (PTT 365) SEPARATION OF PRODUCED FLUID
 SEPARATION OF PRODUCED FLUID") PETROLEUM & GAS PROCESSING TECHNOLOGY (PTT 365) SEPARATION OF PRODUCED FLUID Miss Nur Izzati Bte Iberahim Introduction Well effluents flowing from producing wells come out in two phases: vapor and liquid
PETROLEUM & GAS PROCESSING TECHNOLOGY (PTT 365) SEPARATION OF PRODUCED FLUID Miss Nur Izzati Bte Iberahim Introduction Well effluents flowing from producing wells come out in two phases: vapor and liquid
ACCURATE PRESSURE MEASUREMENT FOR STEAM TURBINE PERFORMANCE TESTING
 ACCURATE PRESSURE MEASUREMENT FOR STEAM TURBINE PERFORMANCE TESTING Blair Chalpin Charles A. Matthews Mechanical Design Engineer Product Support Manager Scanivalve Corp Scanivalve Corp Liberty Lake, WA
Rig Math. Page 1.
 Page 1 The Calculator and Main Keyboard Display Numerical 10-key pad used for entering numerical values Trigonometric Functions These keys will be used where wellbore angle is an issue These are the keys
Well Testing Plan. New York Marginal Well Study. Introduction. I. Tests to be Conducted. II. Testing Procedures
 Well Testing Plan New York Marginal Well Study Introduction The Independent Oil and Gas Association of New York, Inc. (IOGANY) has been awarded funding for a Marginal Well Testing Program from the New
Casing Design. Casing Design. By Dr. Khaled El-shreef
 Casing Design By Dr. Khaled El-shreef 1 Casing Design CONTENTS Function of Casing Casing Types & Tools Strength Properties Casing Specification Casing Design 2 1 RUNNING AND CEMENTING CASING Reasons for
Coiled Tubing string Fatigue Management in High Pressure Milling Operation- Case Study
 Coiled Tubing string Fatigue Management in High Pressure Milling Operation- Case Study Abstract: Paper Presenter: Ebrahim Rabbani 1 e.rabbani@mehranservices.com Ebrahim Rabbani, Danial Davoodi 2, Fatemeh
NORSOK Standard D-010 Rev 4, August 2012
 Foreword 2 Introduction 2 1 Scope 4 2 Normative and informative references 4 2.1 Normative references 4 2.2 Informative references 5 3 Terms, definitions and abbreviations 5 3.1 Terms and definitions 6
Pressure and/or Temperature Pilot Operated Steam Regulators Series 2000
 Hoffman Specialty Regulators Regulators Pressure and/or Temperature Operated Regulators Series 2000 The Hoffman Specialty Series 2000 consists of main valves, pilot valves, wells and hardware kits. They
Chapter 8: Reservoir Mechanics
 PTRT 1472: Petroleum Data Management II Chapter 8: Reservoir Mechanics - Reservoir drives Types of Natural Gas Reservoir Fluids Natural gas is petroleum in a gaseous state, so it is always accompanied
BACK PRESSURE / SUSTAINING
 In many liquid piping systems, it is vital that line pressure is maintained within relatively narrow limits. This is the function of the 108 Pressure Relief / Back Pressure Series of the OCV control valves.
The ERCB Directive 017 Overview
 The ERCB Directive 017 Overview November 4, 2009 By Bill Cheung Why measure and report production, flaring, and venting? Public Safety and Environment Understand and monitor emissions Reservoir Engineering
Study Guide IADC WellSharp Driller and Supervisor
 Times to Flow Check: Before pulling out of the hole Before pulling BHA into the BOP When bit is pulled into the casing Increase in cuttings at shakers with same ROP On connections Upon abnormal trip tank
AC : MEASUREMENT OF HYDROGEN IN HELIUM FLOW
 AC 2010-2145: MEASUREMENT OF HYDROGEN IN HELIUM FLOW Randy Buchanan, University of Southern Mississippi Christopher Winstead, University of Southern Mississippi Anton Netchaev, University of Southern Mississippi
Installation Operation Maintenance. Bermad Level Control Valve with Modulating Horizontal Float Pilot valve One Way Flow IOM.
 Bermad Level Control Valve with Modulating Horizontal Float Pilot valve One Way Flow Model: FP 450-80 Installation Operation Maintenance PAGE 1 OF 5 1. Safety First BERMAD believes that the safety of personnel
Advanced Applications of Wireline Cased-Hole Formation Testers. Adriaan Gisolf, Vladislav Achourov, Mario Ardila, Schlumberger
 Advanced Applications of Wireline Cased-Hole Formation Testers Adriaan Gisolf, Vladislav Achourov, Mario Ardila, Schlumberger Agenda Introduction to Cased Hole Formation tester Tool specifications Applications
Cover Page for Lab Report Group Portion. Head Losses in Pipes
 Cover Page for Lab Report Group Portion Head Losses in Pipes Prepared by Professor J. M. Cimbala, Penn State University Latest revision: 02 February 2012 Name 1: Name 2: Name 3: [Name 4: ] Date: Section
August 21, Deepwater MPD / PMCD
 August 21, 2011 Deepwater MPD / PMCD Managed Pressure Drilling (MPD) Pressure held on top of riser while drilling. Drill in overbalance condition Pressurized Mud Cap Drilling (PMCD) Pressure of mud column
Exercise 2-3. Flow Rate and Velocity EXERCISE OBJECTIVE C C C
 Exercise 2-3 EXERCISE OBJECTIVE C C C To describe the operation of a flow control valve; To establish the relationship between flow rate and velocity; To operate meter-in, meter-out, and bypass flow control
Hydro-Mech Bridge Plug
 Manual No: 0620000303 Revision: F Approved By: Quality Engineer Date: 2014-9-9 Hydro-Mech Bridge Plug DESCRIPTION: Map Hydro-Mech Bridge Plug is hydraulically actuated and mechanically set. Compact, with
GP1 & GP2. Electropneumatic Regulators FOR PRESSURE CONTROL TO 1,000 PSI
 GP1 & GP2 Electropneumatic Regulators FOR PRESSURE CONTROL TO 1, PSI GP1 & GP2 Functional Description The GP series control valve is an electronic pressure regulator designed to precisely control the pressure
GEOTHERMAL WELL COMPLETION TESTS
 GEOTHERMAL WELL COMPLETION TESTS Hagen Hole Geothermal Consultants NZ Ltd., Birkenhead, Auckland, New Zealand. ABSTRACT This paper reviews the measurements that are typically made in a well immediately
INSTRUMENTS A THERMAL MASS FLOW SENSOR USING A CONSTANT DIFFERENTIAL TEMPERATURE ABOVE THE AMBIENT GAS TEMPERATURE
 TELEDYNE HASTINGS TECHNICAL PAPERS INSTRUMENTS A THERMAL MASS FLOW SENSOR USING A CONSTANT DIFFERENTIAL TEMPERATURE ABOVE THE AMBIENT GAS TEMPERATURE Proceedings of FEDSM 98 1998 ASME Fluids Engineering
FUNDAMENTALS OF PRESSURE REGULATORS ROBERT BENNETT MANAGER OF TRAINING ELSTER AMERICAN METER
 FUNDAMENTALS OF PRESSURE REGULATORS ROBERT BENNETT MANAGER OF TRAINING ELSTER AMERICAN METER SUPPLY = DEMAND FUNCTION OF A REGULATOR A regulator may be defined as a "mechanism for controlling or governing
Inflatable Packers for Grouting 11/10/00
 Introduction Inflatable Packers for Grouting 11/10/00 Inflatable packers are frequently used for grout injection in geotechnical applications for structural reinforcement and/or water-proofing of foundations,
SUPPLEMENT Well Control for Drilling Operations Workover & Completion for Supervisors Core Curriculum and Related Learning Objectives
 SUPPLEMENT Well Control for Drilling Operations Workover & Completion for Supervisors Core Curriculum and Related Learning Objectives Form WSP-02-DO-SU-WOC-S Revision 0 13 February 2015 DC 2015 COPYRGHT
Cash Valve TYPE KP PILOT OPERATED BACK PRESSURE VALVE. ISSUED - DECEMBER 2000 CAVMC-0518-US-0208 ISO 9001 Certified
 Cash Valve PILOT OPERATED BACK PRESSURE VALVE ISSUED - DECEMBER 2000 CAVMC-0518-US-0208 ISO 01 Certified KP HIGH CAPACITY PILOT OPERATED BACK PRESSURE VALVE DESCRIPTION The Cash Valve Type KP is a pilot
Truck-mounted Mass Flow Metering for LPG Delivery
 Truck-mounted Mass Flow Metering for LPG Delivery Itron, Inc. 1310 Emerald Rd. Greenwood, SC 29646 Introduction The mathematician Gustave De Coriolis first described the Coriolis Effect, which is an inertial
SINGLE VALVE WITH LOW-FLOW BYPASS
 CONTROL VALVES Pressure Reducing Valve Sizing Guide Sizing pilot operated reducing valves is not a complicated process. It starts with determining requirements and following these guidelines in valve size
SPE The paper gives a brief description and the experience gained with WRIPS applied to water injection wells. The main
 SPE 102831 Online Water-Injection Optimization and Prevention of Reservoir Damage Bjørn Øyvind Bringedal, Svein Arne Morud, Nicolas Alexander Hall, ABB; Gary Huseman, Shell Copyright 2006, Society of Petroleum