Experimental Study of Two-Phase Flow in a Liquid Cross-Flow and an Effervescent Atomizer
|
|
|
- Piers Cox
- 5 years ago
- Views:
Transcription

1 Western University Electronic Thesis and Dissertation Repository September 2014 Experimental Study of Two-Phase Flow in a Liquid Cross-Flow and an Effervescent Atomizer Mona Hassanzadeh Jobehdar The University of Western Ontario Supervisor Dr. Kamran Siddiqui The University of Western Ontario Graduate Program in Mechanical and Materials Engineering A thesis submitted in partial fulfillment of the requirements for the degree in Doctor of Philosophy Mona Hassanzadeh Jobehdar 2014 Follow this and additional works at: Part of the Mechanical Engineering Commons Recommended Citation Hassanzadeh Jobehdar, Mona, "Experimental Study of Two-Phase Flow in a Liquid Cross-Flow and an Effervescent Atomizer" (2014). Electronic Thesis and Dissertation Repository This Dissertation/Thesis is brought to you for free and open access by Scholarship@Western. It has been accepted for inclusion in Electronic Thesis and Dissertation Repository by an authorized administrator of Scholarship@Western. For more information, please contact tadam@uwo.ca.
2 EXPERIMENTAL STUDY OF TWO-PHASE FLOW IN A LIQUID CROSS-FLOW AND AN EFFERVESCENT ATOMIZER (Thesis format: Integrated-Article) by Mona Hassanzadeh Jobehdar Graduate Program in Engineering Science Department of Mechanical and Materials Engineering A thesis submitted in partial fulfillment of the requirements for the degree of Doctor of Philosophy The School of Graduate and Postdoctoral Studies The University of Western Ontario London, Ontario, Canada Mona Hassanzadeh Jobehdar 2014
3 Abstract Effervescent atomization uses the internal gas-liquid mixture to produce spray. The behavior of two-phase flow inside the atomizer influences the spray characteristics and is dependent on the atomizer internal geometry and operating conditions. The present study is conducted in two parts; study of the bubble formation from a novel submerged nozzle in a liquid crossflow and investigation of the internal and external two-phase flows in an effervescent atomizer. The present study investigated the performance of a novel nozzle developed by Gadallah and Siddiqui (2013) in the liquid cross-flow. The impact of the nozzle shape, its configurations and orientations was experimentally investigated. The results showed that the novel nozzle generates smaller bubbles at higher detachment frequency for all cases compared to the standard nozzle. It is found that the rebound of the bubble from a side hole plays a key role in the early bubble detachment. For the effervescent atomizer study, the influence of various operating and geometric parameters of the atomizer on the internal flow and spray droplet characteristics were studied along with a design improvement to the atomizer internal geometry. The results demonstrated that a conical base aerator tube and shorter mixing zone length provide more uniform bubbles in smaller size. A new type of bubble breaker was designed and tested in an effervescent atomizer. The results show that both internal and external two-phase flows in the atomizer were strongly influenced by bubble breaker configurations (diameter and number of holes). It was found that the liquid shear stress is the dominant force causing the bubble elongation and its eventual breakup. Keywords Two-Phase flow; Novel nozzle; Effervescent atomizer; Liquid cross-flow; Bubbly flow; Spray droplets; Bubble breaker; High-speed imaging. ii
4 Co-Authorship Statement I hereby declare co-authorship in the chapters listed below: Chapter 2: Bubble formation process from a novel nozzle design in a liquid cross-flow Authors: M. Hassanzadeh, K. Siddiqui, A. H. Gadallah, W. Chishty Status: It has been submitted to International Journal of Multiphase Flow. Experimental work and data analysis were performed by M. Hassanzadeh. A. H. Gadallah provided some consultation on the experimental design. The manuscript was written by M. Hassanzadeh and reviewed by K. Siddiqui, A. H. Gadallah and W. Chishty. Chapter 3: Investigation of two-phase flow in an effervescent atomizer Authors: M. Hassanzadeh, K. Siddiqui, A. H. Gadallah, W. Chishty Status: It will be submitted for publication. Experimental work and data analysis were performed by M. Hassanzadeh. A. H. Gadallah provided some consultation on the experimental design. The manuscript was written by M. Hassanzadeh and reviewed by K. Siddiqui, A. H. Gadallah and W. Chishty. Chapter 4: Effect of bubble breaker on the effervescent atomization process Authors: M. Hassanzadeh, K. Siddiqui, A. H. Gadallah, W. Chishty Status: It will be submitted for publication. Experimental work and data analysis were performed by M. Hassanzadeh. A. H. Gadallah provided some consultation on the experimental design. The manuscript was written by M. Hassanzadeh and reviewed by K. Siddiqui, A. H. Gadallah and W. Chishty. iii
5 Preface Research is to see what everybody else has seen and to think what nobody else has thought Albert Szent-Gyorgyi To my parents and my husband iv
6 Acknowledgments First and foremost, I would like to gratefully and sincerely thank my supervisor, Dr. Kamran Siddiqui for his inspiration, incomparable assistance and invaluable guidance. Without his guidance and persistence help this dissertation would not have been possible. I would like to thank the National Research Council Canada (NRC), Natural Sciences and Engineering Research Council of Canada (NSERC) and the University of the Western Ontario for the financial support. I would like to acknowledge the faculty and staff of Mechanical and Materials Engineering Department for their education and support. I would also like to thank all of my colleagues and friends for their assistance and encouragement. I would like to express my sincere thanks to Dr. Alireza Daemi for his support during the past several years and helping me to develop my background in Fluid Mechanics. My special thanks to my husband for his patience, encouragement and endless love. He was always there cheering me up and stood by me through the good times and bad. Finally, the greatest thanks of all must go to my wonderful parents for their unconditional love and moral support. Words cannot express my gratitude for everything they have done for me. Although my time in Canada was not easy for them, they always supported me in my dreams and goals. I owe them everything in my life and I appreciate and love them more than words can say. v
7 Table of Contents Abstract... ii Co-Authorship Statement... iii Acknowledgments... v Table of Contents... vi List of Tables... ix List of Figures... x List of Appendices... xviii List of Abbreviations, Symbols, Nomenclature... xix Chapter Atomizers Introduction Effervescent atomizer Bubble formation in a liquid cross-flow Motivation Objective Experimental measurement techniques Bubble characteristics computation Droplet characteristics computation Thesis layout References Chapter Bubble formation process from a novel nozzle design in a liquid crossflow Introduction vi
8 2.2 Experimental setup Results and Discussion Bubble detachment mechanism Glass nozzle Four side-holes configuration Conclusion References Chapter Investigation of two-phase flow in an effervescent atomizer Introduction Experimental setup and techniques Effervescent atomizer Aerator tubes Experimental setup Visualization and measurement technique Results and Discussion Internal flow External flow (Spray) Conclusion References Chapter Effect of bubble breaker on the effervescent atomization process Introduction Experimental setup and techniques Effervescent atomizer Aerator tube vii
9 4.2.3 Bubble breakers Experimental setup Visualization and measurement technique Results and Discussion Effect of bubble breaker single-hole diameter Effect of number of holes in the bubble breaker Conclusion References Conclusions and Recommendations Overall Conclusions Recommendations for future work Contributions Appendices Appendix A Appendix B Curriculum Vitae viii
10 List of Tables Table 2-1: Selected gas and liquid flow rates and corresponding average velocities ix
11 List of Figures Figure 1-1: Schematic of an effervescent atomizer and atomization process Figure 1-2: Three different flow regimes inside the effervescent atomizer (a) bubbly flow, (b) slug flow, (c) annular flow Figure 1-3: Different flow regimes caused by injection of gas into a liquid stream. (a) Individual bubbly flow (b) Bubbly flow with bubble-bubble interaction (c) Jet flow Figure 1-4: Governing force acting on the bubble (a) During formation, (b) After detachment Figure 1-5: Image processing of the bubble formation to measure bubbles characteristics (a) original image (b) image after adjustment and converting into the binary image (c) image after inverting and dilation (d)image after filling the holes and erosion(e) image after removing the noise (f) image after selecting the only detached bubble Figure 1-6: Image processing of spray droplets to measure droplet characteristics (a) original image (b) image after adjustment and converting into the binary image (c) image after inverting (d) image after erosion, dilation and filling the holes and erosion(e) image after removing the noise (f) image after selecting the only detached droplets Figure 2-1: Experimental setup; (a) Schematic and (b) photograph Figure 2-2: Nozzle designs and orientations with respect to the flow direction used in the experiments. (a) Standard nozzle, (b) Novel nozzle, 2 side-holes in-line orientation, (c) Novel nozzle, 2 side-holes perpendicular orientation. hs=1.6mm Figure 2-3: Governing force acting on the bubble (a) During formation, (b) After detachment x
12 Figure 2-4: Bubble detachment frequency (f B ) versus average liquid velocity (V L ) for the standard nozzle at three different gas flow rates. Error bars (based on the standard error of the mean) are smaller than the size of the symbols Figure 2-5: Bubble detachment frequency (f B ) versus average liquid velocity (V L ) at gas velocity of (cm/s). Error bars (based on the standard error of the mean) are smaller than the size of the symbols Figure 2-6: Bubble diameter (D B ) versus average liquid velocity (V L ) at a gas flow rate of (cm/s). Error bars (based on the standard error of the mean) are smaller than the size of the symbols Figure 2-7: Bubble detachment frequency (f B ) versus average gas velocity (V g ) at a liquid velocity of 9.85 (cm/s). Error bars (based on the standard error of the mean) are smaller than the size of the symbols Figure 2-8: Bubble diameter (D B ) versus gas velocity (V g ) at a liquid velocity of 9.85 (cm/s). Error bars (based on the standard error of the mean) are smaller than the size of the symbols Figure 2-9: Strouhal number (St) versus GLR. Error bars (based on the standard error of the mean) are smaller than the size of the symbols Figure 2-10: Mean bubble diameter to inner nozzle diameter ratio (D B /D N ) versus gas to liquid flow rate ratio (GLR). Error bars are (based on standard error of the mean) smaller than the size of bullets Figure 2-11: Image sequences showing the effect of liquid cross-flow on the dynamic gas-liquid interface motion during bubble formation from the novel nozzle with sidehole diameter of 0.7 mm at a gas flow rate of 0.28 cm 3 /s. (a) Standard nozzle at liquid flow rate of 255 cm 3 /s (Δt=4ms). (b), (c) Novel nozzle in-line and perpendicular orientation at stagnant liquid flow (Δt=1ms). (d), (e) Novel nozzle in-line and perpendicular orientation at liquid flow rate of 255 cm 3 /s (Δt=1ms) xi
13 Figure 2-12: Image sequences showing the bubble formation from different side-hole diameters of in-line novel nozzle at a gas flow rate of cm 3 /s and liquid velocity of 9.85 cm/s (a) novel nozzle with side-hole of 0.5 mm ( t =5 ms), (b) novel nozzle with side-hole of 0.7 mm ( t =4 ms) and (c) novel nozzle with side-hole of 0.82 mm ( t =4 ms). The liquid stream is from right to left Figure 2-13: Sequence of bubble formation from the standard nozzle at gas flow rate of 826 cm 3 /s, liquid flow rate of 395 cm 3 /s, t=1.1ms Figure 2-14: Sequence of bubble formation from the novel nozzle at a gas flow rate of 826 cm 3 /s and liquid flow rate of 395 cm 3 /s, t=0.8 ms Figure 2-15: Different stages of the bubble formation and detachment at liquid flow rates of 255 cm 3 /s, 395 cm 3 /s and 535 cm 3 /s. t=0 is considered for the previous bubble detachment. (a) Expansion stage (b) Collapse stage (c) Pinch-off Figure 2-16: Reference coordinate system Figure 2-17: Evolution of gas volume in X and Y direction during the bubble formation process from two side-holes at a gas flow rate of 826 cm 3 /s and liquid flow rate of 255 cm 3 /s Figure 2-18: Evolution of gas volume in X and Y direction during the bubble formation process from two side-holes at a gas flow rate of 826 cm 3 /s and liquid flow rate of 535 cm 3 /s Figure 2-19: Four side-holes nozzle configurations used in the study. (a) Regular four side-holes, Configuration B. (b) Four side-holes with different distance between holes, Configuration C. h s =1.6mm, h u =0.8 mm, h s =2.1mm Figure 2-20: Bubble detachment frequency (f B ) versus average liquid velocity (V L ) at a gas flow rate of (cm 3 /s). Error bars (based on the standard error of the mean) are smaller than the size of the symbols xii
14 Figure 2-21: Bubble diameter (D B ) versus average liquid velocity (V L ) at a gas flow rate of (cm 3 /s). Error bars (based on the standard error of the mean) are smaller than the size of the symbols Figure 2-22: Strouhal number (St) versus GLR. Error bars (based on the standard error of the mean) are smaller than the size of the symbols Figure 2-23: Mean bubble diameter to inner nozzle diameter ratio (D B /D N ) versus GLR. Error bars (based on the standard error of the mean) are smaller than the size of the symbols Figure 3-1: Schematic of the effervescent atomizer used in the study (not to scale) Figure 3-2: Schematic of the aerator tubes configurations used in the study, (a) with 4 mm distance between holes (b) 8 mm distance between holes. Aerator tube of identical hole configuration with (c) conical base and (d) flat base Figure 3-3: (a) Schematic and (b) Photograph of the experimental setup using two cameras. (c) Photograph of the experimental setup using one camera Figure 3-4: Image sequences showing the bubble formation from AR-4 at a GLR of 0.53 ( t=0.45ms). (a) Side view (b) Plan view Figure 3-5: Effect of distance between holes at three different GLRs, Figure 3-6: Image sequences showing the transition from aeration zone to the mixing zone. (a) GLR=0.53, t=22.2 ms), (b) GLR=0.79, t=20 ms), (c) GLR=3.17, ( t=16.5 ms), (d) GLR=9.55, ( t=5 ms) Figure 3-7: Effect of different GLRs on the two-phase flow behavior inside the mixing zone. The mixing zone length is 52 mm. The aerator tube is the standard tube. (a) The images of internal two-phase flow at different GLRs (b) Probability Density Functions of the bubble diameter (D B ). (c) Mean bubble diameter versus GLR. Error bars (based on the standard error of the mean) are smaller than the size of the symbols xiii
15 Figure 3-8: Effect of aerator tube base configuration on the flow behavior inside the atomizer at different GLRs. The length of the mixing zone is 52 mm Figure 3-9: Effect of the aerator tube with and without cone on the bubble size. (a), (b) Probability Density Function (PDF) of the bubble diameter (D B ) at GLR=0.53 and GLR=3.17, respectively. (c) Mean bubble diameter versus GLR. Error bars (based on the standard error of the mean) are smaller than the size of the symbols Figure 3-10: Effect of mixing zone length on the flow behavior in the mixing zone at different GLRs. (a) GLR=0.53, (b) GLR=3.17, (c) GLR= Figure 3-11: Effect of different mixing zone lengths on the bubble size (a), (b) Probability Density Function (PDF) of the bubble diameter (D B ) at GLR=0.53 and GLR=3.17, respectively. (c) Mean bubble diameter versus GLR. Error bars are smaller than the size of bullets Figure 3-12: Probability Density Function (PDF) of (a) the droplet diameter (D p ) and (b) droplet velocity (V p ) at different GLRs. The mixing zone length is 52mm Figure 3-13: Effect of the aerator tube with and without cone on the droplet diameter (D p ) in form of (a) Probability Density Function (PDF) at GLR=0.53. (b) Mean droplet diameter versus GLR. The mixing zone length is 52mm. Error bars (based on the standard error of the mean) are smaller than the size of the symbols Figure 3-14: Effect of the aerator tube with and without cone on the droplet velocity in the form of (a) Probability Density Function (PDF) at GLR=0.53. (b) Normalized droplet velocity (V p /V La ) versus GLR. The mixing zone length is 52mm. Error bars (based on the standard error of the mean) are smaller than the size of the symbols Figure 3-15: Effect of the different mixing zone length on the droplet diameter in the form of (a) Probability Density Function (PDF) at GLR=0.53 (b) Mean droplet diameter versus GLR. The aerator tube has the conical base. Error bars (based on the standard error of the mean) are smaller than the size of the symbols xiv
16 Figure 3-16: Effect of the different mixing zone length on the droplet velocity in the form of (a) Probability Density Function (PDF) at GLR=0.53, (b) Normalized droplet velocity (V p /V La ) versus GLR. The aerator tube has the conical base. Error bars (based on the standard error of the mean) are smaller than the size of the symbols Figure 4-1: Schematic of the effervescent atomizer used in the study (not to scale) Figure 4-2: Schematic of the bubble breaker used in the study (a) Single-hole bubble breakers, (b) Multi-hole bubble breakers Figure 4-3: (a) Schematic and (b) photograph of the experimental setup to investigate the internal two-phase flow. (c) Photograph of the experimental setup to investigate the external two-phase flow (spray droplets) Figure 4-4: Effect of bubble breaker on the flow behavior in the mixing zone upstream the exit orifice at different GLRs (a) GLR=0.53, (b) GLR=3.17, (c) GLR=9.55. In each image pair, left image presents the case with breaker and right image presents the case without breaker Figure 4-5: Effect of bubble breaker hole diameter at different GLRs (a) GLR=0.53, (b) GLR=3.17, (c) GLR= Figure 4-6: Image sequences showing the mechanism of bubble breakup in single-hole bubble breaker. (a) First type of bubble fragmentation at the entrance, GLR=0.53, t=0.75 ms, (medium hole). (b) Second type of small-size bubble fragmentation inside the bubble breaker, GLR=0.53, t=0.2 ms (large hole) (c) Double breakup, GLR=0.53, t=0.25ms (medium hole) Figure 4-7: Effect of bubbles breakers with different single-hole diameters on the bubble size. Probability Density Function (PDF) of the bubble diameter (D B )at (a) GLR=0.53, (b) GLR=3.17 and (c) GLR=9.55. (d) Mean bubble diameter (D B ) inside the bubble breakers versus GLR. Error bars (based on the standard error of the mean) are smaller than the size of the symbols xv
17 Figure 4-8: Effect of bubbles breakers with different single-hole diameters on the droplet size. Probability Density Function (PDF) of the droplet diameter (D p ), at (a) GLR=0.53, (b) GLR=3.17 and (c) GLR=9.55. (d) Mean droplet diameter versus GLR. Error bars (based on the standard error of the mean) are smaller than the size of the symbols Figure 4-9: Effect of bubbles breakers with different single-hole diameters on the droplet velocity. Probability Density Function (PDF) of the droplet velocity (V p ), at (a) GLR=0.53, (b) GLR=3.17 and (c) GLR=9.55. (d) Normalized mean droplet velocity (V p /V La ) versus GLR. Error bars (based on the standard error of the mean) are smaller than the size of the symbols Figure 4-10: Effect of number of holes in the bubble breakers at different GLRs, (a) GLR=0.53, (b) GLR=3.17, (c) GLR= Figure 4-11: Bubble breakup mechanism in the multi-hole bubble breakers. (a) Penetration and fragmentation of a bubble into two holes for the three-hole bubble breaker (b) Penetration and breakup of bubbles either from one hole or number of holes in the five-hole bubble breaker. (c) Bubble fragmentation inside the bottom convergent section. GLR= Figure 4-12: Effect of bubbles breakers with different numbers of hole on the bubble size inside the holes. Probability Density Function (PDF) of the bubble diameter (D B ) at (a) GLR=0.53, (b) GLR=3.17 and (c) GLR=9.55. (d) Mean bubble diameter (D B ) inside the bubble breaker versus GLR. Error bars (based on the standard error of the mean) are smaller than the size of the symbols Figure 4-13: Effect of number of bubble breaker holes on the spray droplet size. Probability Density Function (PDF) of the droplet diameter (D p ) at (a) GLR=0.53, (b) GLR=3.17 and (b) GLR=9.55, (d) Mean droplet diameter versus GLR. Error bars (based on the standard error of the mean) are smaller than the size of the symbols Figure 4-14: Effect of number of bubble breaker hole on the spray droplet velocity. Probability Density Function (PDF) of droplet velocity (V p ) at (a) GLR=0.53, (b) GLR=3.17 and (c) GLR=9.55, (d) Normalized mean droplet velocity (V p /V La ) versus xvi
18 GLR. Error bars (based on the standard error of the mean) are smaller than the size of the symbols xvii
19 List of Appendices Appendix A: Effervescent atomizer Appendix B: Bubble breakers xviii
20 List of Abbreviations, Symbols, Nomenclature Abbreviations GLR SMD PDF Gas to Liquid flow rate ratio Sauter Mean Diameter Probability Density Function Nomenclature f B Bubble detachment frequency D B Bubble diameter, mm D N Inner nozzle diameter, mm Q g Gas flow rate, cm 3 /s Q L Liquid flow rate, cm 3 /s V g Gas velocity, cm/s V L Liquid velocity in the channel, cm/s St Strouhal number F s Surface tension force, dyn F B Buoyancy force, dyn F M Gas momentum flux force, dyn F p Pressure force, dyn F I Inertial force, dyn xix
21 F L Lift force, dyn F D Drag force, dyn t t Time, ms Time interval, ms D p Droplet diameter, mm V p Liquid velocity, m/s V La Liquid velocity in the atomizer, m/s V p /V La Normalized droplet velocity xx
22 1 Chapter 1 1 Atomizers 1.1 Introduction Atomization of liquid into the spray is crucial in wide range of industrial processes such as; coating [1], spray drying, pharmaceutical [2, 3], chemical reactors [4, 5] and combustion [6]. There are different types of atomizers. Based on the required energy to form spray, the common atomizer types are categorized into pressure atomizer, rotary atomizer, electrostatic, ultrasonic atomizer or twin-fluid atomizer [7]. In an industrial application, the desired droplet size, the spray shape and the properties of the liquid are the key parameters to choose a specific type of atomizer [7]. In a pressure atomizer, the pressurized liquid is discharged from an orifice at high velocity. Due to the requirement of pressurized liquid, the pressure atomizers typically use low-viscosity liquids. This type of atomization has some limitations such as; large droplet size and low liquid flow rate [6]. In a rotary atomizer, a rotating surface is located in front of the liquid jet and the liquid spreads out and forms droplets due to the centrifugal force. In this type of atomizer, the external mechanical energy is required to rotate the surface. The electrostatic atomizers and ultrasonic atomizers utilize electrical and acoustic energies to produce spray. In ultrasonic atomizers, the ultrasound transducers are used to produce a resonance acoustic wave, which results in disintegration of the liquid jet and formation of the spray. In electrostatic atomizers, the liquid accelerated by an electrical charge results in a tiny liquid jet which further breaks into small-size droplet in small quantities [6, 7]. In twin-fluid atomizer, the kinetic energy of the pressurized gas used to interact with the liquid results in the liquid phase break up and formation of the spray. Twin-fluid atomizers usually use air as the driving fluid to produce spray. They are divided into air-blast, air-assist and effervescent atomizers. This type of atomizer has two subcategories based on the location of the two-phase flow
23 2 mixing; external mixing and internal mixing [6, 7, 8]. In air-blast and air-assist atomizers, air at very high velocity is introduced into already established jet or sheet of liquid before the exit orifice [6]. A basic limitation of these atomizers is the "low bubble growth rate", i.e. although the gas is the dissolved phase into the liquid, to enhance the spray quality, it is necessary for the gas phase to emerge from the liquid jet. To avoid this limitation, Lefebvre et al. [6, 9] designed an effervescent atomizer in which gas does not impart kinetic energy to the flowing liquid. In an effervescent atomizer, the low-velocity gas is injected into the liquid flow, upstream of the exit orifice and this injected gas in the form of bubbles inside the liquid provides a good atomization Effervescent atomizer Among all conventional atomization techniques, effervescent atomization is known as a twin-fluid atomization. Effervescent atomization or "aerated-liquid atomization" was designed and developed by Lefebvre and his colleagues in 1980s and categorized into the internal two-phase flow mixing [9-12]. Compared to other forms of twin-fluid atomizer, effervescent atomizer uses low velocity gas injection into the liquid to form bubbly flow in the liquid stream. The gas-liquid mixture then moves downstream towards the exit orifice. The presence of bubbles inside the liquid flow enhances the atomization process by decreasing the fraction of the liquid passing through the exit orifice and by the expansion of the bubbles inside the liquid after ejection from the orifice. This expansion of bubbles forms thin ligaments and small droplets due to a sudden pressure drop [8]. There are several advantages for the effervescent atomizers over common atomizers. These include, excellent atomization at very low gas pressures, significantly smaller gas flow rates compared to those injected in the most forms of twin-fluid atomizers, and smaller drop sizes for any given injection pressure [6, 9, 11, 12]. The exit orifice diameters of the effervescent atomizers are larger in comparison with other types of atomizers at a similar flow rate [6, 10, 13-15]. The larger exit orifice mitigates the problems of clogging and hence, the atomization of impure liquids becomes possible [16, 17, 18]. Furthermore, for combustion applications, the air inside the liquid fuel enhances the combustion efficiency and reduces the pollutants such as NOx emissions [9, 16]. The
24 3 effervescent atomizer provides reliability and simplicity which results in easy maintenance and low cost [6]. Like other forms of twin-fluid atomizers, the effervescent atomizer also requires a source of pressurized gas, which is considered as its main drawback. However, this necessity can often be satisfied easily, since the effervescent atomization requires low gas pressure and low gas flow rate [8, 6]. Each effervescent atomizer, in terms of the gas injection configuration, is either "outside-in" or "inside-out". In the "outside-in" configuration, liquid stream flows inside a tube while gas is injected from the outside (i.e. peripheral region) into the liquid. Hence, the liquid flows in a large area due to the configuration of the gas injection [19]. This configuration has been well investigated previously [13, 18, 20-33]. The other gas configuration is "inside-out", in which gas is injected from aerator tube in the middle of the atomizer through the aeration holes into the liquid stream flowing in the peripheral region. While the "outside-in" configuration has a limitation of geometry change, the "inside-out" configuration is more flexible to geometry variation and allows changes in the dimensions of the atomizer components [34]. This configuration has also been studied by some researchers [12, 19, 34, 35, 36]. An inside-out effervescent atomizer is composed of gas and liquid inlets, mixing chamber, aerator tube and the exit orifice (see Figure 1-1). Each effervescent atomizer is also divided into different zones; bubble formation zone (or aeration zone) where the gas is bubbled into the liquid stream through aeration holes; the mixing zone where the bubbly-gas phase and the liquid phase are mixed, interact and flow downstream. The mixing zone includes parts of the atomizer, which are (i) the mixing chamber downstream of the aerator tube, (ii) the convergent section and (iii) the exit orifice. When the bubbles flow downstream, due to a pressure drop in the convergent section, the gas phase expands and if the length of exit orifice is large enough, the gas bubbles break up into smaller bubbles. After the ejection of gas-liquid mixture through the exit orifice due to a sudden pressure drop, bubbles (gas phase) further expand and thin liquid ligaments and small droplets are formed (see Figure 1-1) [8, 37]. This bubble expansion and breakup that occurs near the exit orifice is called the primary atomization. The unstable liquid droplets may collide, coalesce or further breakup in the turbulent spray after the
25 4 primary breakup. This further breakup of the droplets away from the exit orifice is called the secondary atomization [38]. Breakup is a process by which a bubble/droplet splits into two or more bubbles/droplets. Surface tension always acts to maintain the surface of the fluid particle stable while the shear forces acts to destroy it. Once the shear forces become large enough, the surface tension is no longer able to retain the gas-liquid interface stable and the breakup occurs [39]. In the bubble formation zone, gas is injected through the holes into the liquid cross-flow and forms bubbles. In relation to the effervescent atomization process, the formation of small-size bubbles in a large number is desirable. The liquid cross-flow has been reported to generate small bubbles [11, 12]. The number and size of aeration holes are also reported to have an effect on the bubble size and hence the spray droplet size [19, 40-42]. Wang et al. [12], Roesler and Lefebvre [11, 41] and Roesler [40] found that the droplet size distribution becomes narrower when an aerator tube with multiple holes is used instead of a single hole with a constant hole area. Whereas, Ghaemi [42] used porous media as an aerator tube and compared the results with that of the multi-hole aerator and found that the porous media produces smaller bubbles and improves spray stability. Few studies have used a perforated sheet (as a bubble breaker) located before the exit orifice of an effervescent atomizer and found that it reduces the droplet size and increases the droplet velocity [35, 43, 44]. However, none of them showed the effect of perforated sheet on the internal two-phase flow and the bubble breakup mechanism.
26 5 Figure 1-1: Schematic of an effervescent atomizer and atomization process. As mentioned earlier, effervescent atomizer is an internal-mixing atomizer in which gas in the form of bubbles is mixed with the liquid. The two-phase flow regimes formed inside the atomizer could be bubbly flow, slug flow or annular flow [45]. The bubbly

27 6 flow is present at low gas to liquid flow rates ratio (GLR). As the GLR increases, the mixture regime changes to the slug flow and then to the annular flow. In the bubbly flow, the gas forms the discrete phase while the liquid is the continuous phase, i.e. bubbles are injected into the liquid and dispersed. In the bubbly flow, small individual or coalesced bubbles flow inside the liquid stream. With an increase in the GLR, the size of bubbles increase and reaches the size of the inner diameter of the mixing chamber whereby, the bubbly flow transforms into slug flow. With a further increase in the GLR, the gas flows in the center of mixing chamber surrounded by an annular film of liquid on the mixing chamber wall. Under such condition, the flow regime is considered as the annular flow. Figure 1-2 depicts these flow regimes inside the mixing zone of an effervescent atomizer. (a) (b) (c) Figure 1-2: Three different flow regimes inside the effervescent atomizer (a) bubbly flow, (b) slug flow, (c) annular flow. The effervescent atomization process and consequently the characteristics of the resulting spray are dependent on the atomizer internal geometry [19, 30, 46] and GLR [19, 37, 47]. It has been reported that an increase in the GLR reduces the mean droplet size [19, 22,
28 7 47]. However, with an increase in the GLR, the internal flow changes from bubbly to slug flow, which increases the instability of the spray [18, 42]. The slug flow due to the presence of larger bubbles approaching the exit orifice causes significant spray pulsation and unsteadiness [18, 48], which is not desirable in the majority of industrial applications. Although the annular flow produces the smallest droplets, the requirement of the large volume of pressurized gas and unstable internal flow makes it not a preferable choice. Hence, the bubbly flow has been suggested as a better solution for a steady spray [47]. The internal mixture flow is dependent on the mixing zone cross-sectional area and the shape of the mixing zone [8, 19]. Furthermore, in the previous studies the effect of convergent angle [36], the exit orifice diameter [9, 17, 22, 32], the length of the exit orifice [36, 23] and the exit orifice shape [36, 29, 35] on the droplet size were investigated. Mostafa et al. [43] and Jedelsky et al. [30] reported that the mixing zone length affects the radial distribution of the spray droplet size and velocity while, Sher et al. [23] argued that the best mixing zone length for the effervescent atomization depends on the GLR Bubble formation in a liquid cross-flow As mentioned earlier, the generation of small-size bubbles in large quantity is desirable for the effervescent atomization process and the bubble formation in a liquid cross-flow has shown to be an effective way to achieve this goal. Although the main focus of the present study is to investigate the dynamics of the internal and external two-phase flow in an effervescent atomizer, however, to gain a better insight into the fundamental bubble formation process in a liquid cross flow, the research has also been conducted to investigate the bubble formation and detachment process from a novel nozzle in a liquid cross-flow that in the future could potentially be used in the effervescent atomizer or other industrial applications. The bubble formation through the gas injection into a liquid cross flow has several applications including effervescent atomization, chemical plants [49], waste water treatment and bio- and nuclear-reactors [50, 51]. In these applications, an important parameter is the total area of the gas-liquid interface, which influences the bubble
29 8 expansion in an effervescent atomizer or the reactivity and/or mass transport in chemical and biological processes. A larger total surface area of bubbles can be achieved by generating small-size bubbles at a higher detachment rate Gas can be injected into a liquid stream in the co- or cross-flow configurations. Previous studies have shown that the liquid cross-flow generates smaller bubbles at a higher detachment rate compared to the liquid co-flow [52], which is likely due to a higher shear. The angular orientation, size and shape of the nozzle as well as the GLR influence the bubble formation and detachment process in a liquid cross-flow. Furthermore, in the cross-flow configuration, the chances of bubble coalescence are lower as compared to that in a stagnant liquid because the bubbles are continuously moved away from the surrounding area of the nozzle or orifice [53, 54]. Coalescence is the phenomenon in which two or more bubbles or droplets are combined through the contact surface to make a single bubble or droplet. Since the coalescence phenomenon increases the bubble diameter, the gas-liquid interface and the uniformity of bubbles distribution are reduced. When the gas is injected into a liquid stream, the two-phase flow may result in one of the following forms; 1) Formation and advection of individual bubbles into the liquid stream, i.e. no coalescence and no mutual interactions (see Figure 1-3(a)). 2) Formation and advection of bubbles into the liquid stream that may interact and may result in coalescence (see Figure 1-3(b)). 3) The injection of gas into the liquid stream in the form of a jet i.e. no individual bubble formation (see Figure 1-3(c)) [16]. When the two-phase flow is comprised of individual and non-interacting bubbles, the bubbles are smaller in size and/or far apart from each other. As the gas flow rate increases, the bubble size increases and the individual bubbly flow regime is transitioned into the interacting bubbly regime. In this regime, bubbles could easily deform and the bubble collision and coalescence may also occur. A further increase in the gas flow rate results in the jet flow regime. Although no bubbles are formed at the orifice or nozzle, the
 (b) (c) Figure 1-3: Different flow regimes caused by injection of gas into a liquid stream. (a) Individual bubbly flow (b) Bubbly flow with bubble-bubble interaction (c) Jet flow.")
30 9 jet may breakdown into bubbles or ligaments further downstream. The above described two-phase flow regimes in the liquid cross-flow are illustrated in Figure 1-3. (a) (b) (c) Figure 1-3: Different flow regimes caused by injection of gas into a liquid stream. (a) Individual bubbly flow (b) Bubbly flow with bubble-bubble interaction (c) Jet flow. When the gas is injected into a liquid to generate bubbles, several forces act on the bubble. Figure 1-4 shows the main forces acting on the gas bubble during its growth and after detachment under these conditions. During the bubble growth, once the bubble is attached to the nozzle, these forces are, surface tension (F s ), buoyancy (F B ), gas momentum flux (F M ), pressure (F p ), inertial (F I ), lift (F L ) and drag forces (F D ) [55]. However, once the bubble detaches from the nozzle the governing forces on the bubble reduce to buoyancy, lift and drag forces. The role of different forces is described as follows: The pressure force is caused by the difference between the gas pressure at the nozzle tip and the liquid pressure. This force acts in the upward direction during the bubble growth. The relative motion between the bubble and the liquid resulted in the exertion of friction force on the bubble as well as the net pressure force due to the change in the liquid pressure as it goes around the bubble. These forces have drag and lift
31 10 components in the direction parallel and perpendicular to the relative motion, respectively. Buoyancy force is generated due to the difference in the densities of gas and liquid. It acts in the upward direction and its magnitude increases with an increase in the bubble size. Hence, it contributes to the growth and detachment of the bubble. The role of the surface tension force is to keep the bubble attached to the nozzle. It has two components; the horizontal component acts against the liquid drag while the vertical component acts against the buoyancy force. As the bubble grows, the magnitude of the surface tension force increases. Inertial force also has two components in x and y direction. The growing bubble displaces and accelerates liquid surrounding the bubble which adds mass to the bubble [55]. Gas momentum flux force through the nozzle is a detaching upward force and increases with an increase in the gas velocity or gas density. (a)
32 11 (b) Figure 1-4: Governing force acting on the bubble (a) During formation, (b) After detachment. The bubble formation into the liquid cross-flow from a submerged gas injector has been studied experimentally, numerically and theoretically. Several parameters influence the bubble dynamics, which include, size, location and shape of the bubbles, their rate of detachment and the GLR. Several studies have investigated these parameters for example, the characterization of the bubble size [56-58], the bubble detachment frequency, the bubble trajectory in the liquid stream [59, 60], the bubble formation stages [57, 61] and the mode [62, 63], and the effects of gas flow rate and liquid velocity on the bubble formation [42, 55, 56, 58, 59, 64]. 1.2 Motivation As discussed earlier, effervescent atomizer has several advantages compared to other atomizers. However, due to the interaction of gas and liquid flows, the internal two-phase flow structure in the effervescent atomizer is more complex than that in single-fluid atomizers. Despite several studies, the flow inside an effervescent atomizer is not well understood. This is attributed to the complexities such as bubble-bubble interaction, gasliquid mixing, gas-liquid flow through variable cross-sections and bubble deformation at
33 12 various locations inside the atomizer. Previous literature has shown that there is a strong dependence of the unsteadiness in the effervescent sprays on the atomizer internal twophase flow. However, there is a lack of studies directly investigating the internal twophase flow and its impact on the spray characteristics. Therefore, a thorough study of this internal two-phase flow, the parameters that control it and its relation with the spray characteristics such as droplet size is required to improve and control the spray quality. The performance of the effervescent atomizer depends on the bubble formation inside the aeration zone, flow behaviour inside the mixing zone and the gas-liquid flow approaching the exit orifice. Hence, to optimize the effervescent atomization process, understanding of the two-phase flow dynamics in each section is crucial. Moreover, the study of a novel submerged nozzle in a liquid cross-flow and the investigation of the underlying physical process of bubble formation from it, would lead the potential utilization of this nozzle in an effervescent atomizer and other related applications. 1.3 Objective Hence, the objectives of the present study are to: 1- Investigate the effect of a novel nozzle design on the dynamics and size of the bubbles inside a liquid cross-flow and explore the underlying phenomenon. 2- Improve understanding of the two-phase flow structure inside an effervescent atomizer and its characterization. 3- Quantify the relation between the atomizer internal two-phase flow and the spray characteristics. The present study is based on an experimental research that is conducted using state-ofthe-art measurement techniques. The methodology to meet the above listed objectives is described below.
34 13 To improve the knowledge of the bubble formation in an effervescent atomizer, first the impact of the nozzle configuration on the bubble formation in a liquid cross-flow is investigated using high speed imaging technique. The same high speed imaging technique is used to study the influence of atomizer internal two-phase flow over a wide range of operating conditions to meet the second objective. The specific methodology includes: Detailed investigation of the mechanics of bubble formation from the holes of the aerator into a pressurized confined cross-flow. The specific focus is on the influence of aeration holes on the bubble size under different inlet conditions of gas and liquid flows. Detailed investigation of the two-phase flow regime, bubble deformation and bubble-bubble interaction inside the mixing zone. It includes bubble breakup using bubble breakers, and the final division into finer bubbles at the exit orifice. The flow regime inside the nozzle has a great influence on the spray behavior and the atomization process. The two-phase flow structure reaching the exit orifice has a direct influence on the near-nozzle liquid break-up and is a key feature that influences the spray characteristics. Thus, understanding the behavior of gas and liquid flow inside the mixing zone is crucial to understand and improve spray characteristics. The third objective, which is focused on quantifying the relation between the atomizer internal two-phase flow and the spray characteristics, is essential for the performance improvement of the effervescent atomizer. This allows researchers to appropriately select the effervescent atomizer design parameters and the operating conditions that would lead to the desired spray characteristics. This objective is achieved by measuring the droplet size and velocity of the spray produced over a wide range of operating conditions using high speed imaging system.
35 Experimental measurement techniques Different methods have been used in the past to investigate bubble formation inside the effervescent atomizer and to characterize spray droplets generated by the effervescent atomizers. Liu and Zheng [60] used Particle Image Velocimetry (PIV) technique to investigate the bubble behavior and surrounding liquid in a stagnant flow. Ghaemi et al. [42] applied Shadow-PIV/PTV technique to investigate the mechanism of bubble formation in a liquid cross-flow. They also used particle tracking velocimetry (PTV) and StereoPIV techniques to characterize spray droplets generated by the effervescent atomizer. High speed imaging system has also been used to study and quantify the bubble size inside the effervescent atomizer [37, 44, 47, 65, 66] and the spray shape and droplet breakup process [42, 66, 67]. Some studies have used phase-doppler particle Analyzer (PDPA) to measure spray droplet size and velocity [19, 30, 47, 68]. It should be noted that both droplet diameter and velocity are important parameters to characterize a spray [42]. Among all the methods to measure the droplet velocity, an image-based technique provides more accurate results for the spray droplets particularly when the droplets are non-spherical in shape [69-72]. The high speed imaging technique used for bubble or droplet measurements often employed backlit shadowgraphy technique to enhance the signal-to-noise-ratio. In this technique, a light source along with a diffusion screen is placed behind the measurement region to provide a uniform brighter background in the image that corresponds to the liquid domain. This generates a good contrast between the bubbles and the background liquid hence makes the bubble identification easy and accurate. For example, Ghaemi [42], Sen et al [65] and Gadgile [66] have used diffused light source to illuminate the background along with high-speed imaging system to capture the images of the gas-liquid two-phase flow. As mentioned earlier, the experiments in this research mainly involve the visualization and quantification of two-phase flow within a channel with liquid cross-flow, inside an effervescent atomizer, as well as the spray structures. The details of the state-of-the-art measurements techniques used in this research are provided below. The high-speed
36 15 imaging is conducted using a high-speed camera. This allowed tracking each individual bubble and droplet and quantifying various bubble and droplet characteristics. Backlit shadowgraphy with light source to illuminate the background was used during the experiments. The experiments were conducted for various configurations under different operating conditions and images were acquired at different sampling rates depending on the region of interest and the configuration Bubble characteristics computation The acquired images were processed using various in-house image analysis algorithms developed in the Matlab environment (for example see Siddiqui and Chishty [59]). The code automatically detects and tracks the bubble once it is detached from the nozzle, and computes various bubble characteristics such as the bubble trajectory in the liquid flow, detachment frequency, velocity, cross-sectional area and equivalent diameter. The main steps of the image-processing algorithm are step-by-step shown in Figure 1-5. A sample original image used as a reference is shown in Figure 1-5(a). The improvement of the signal-to-noise ratio is the first step of the image-processing algorithm, which is achieved by rescaling the gray-values based on the maxima and minima. The image is segmented into a binary image in the next step by applying a threshold based on the gray-value distribution. Figure 1-5(b) shows the corresponding image after segmentation. After image segmentation, a series of morphological operations are performed on the binary image that include image inversion, dilation, filling the holes and erosion, which are illustrated in Figures 1-5(c) and (d). The noise is removed in the next step, and in the final step, the bubbles chopped by the image edges are excluded (see Figures 1-5(e and f)) and each bubble is detected. For each detected bubble, different properties such as area, center of bubble, equivalent diameter and perimeter are calculated and stored in a three-dimensional array. To compute the detachment frequency, a different algorithm was used. In this algorithm, a region of interest was defined in the vicinity of the nozzle rim. The signal-to-noise ratio of the image was improved next. This is followed by the removal of noise. The algorithm continuously monitors the bubble while it is attached to the nozzle and records a signal as soon as the bubble detaches from the nozzle and
37 16 computes the equivalent bubble diameter. The recorded signal is used to compute bubble detachment frequency Droplet characteristics computation An in-house algorithm in the MATLAB environment was used to automatically detect and track the droplets and to quantify their characteristics such as droplet velocity, crosssectional area, perimeter and corresponding equivalent diameter. The main steps of the image-processing algorithm are illustrated in Figure 1-6. A sample original image is shown in Figure 1-6(a). Similar to the bubble detection, the first step of the image processing is rescaling the gray-values based on the maxima and minima to improve the signal-to-noise ratio. In the next step, by applying a threshold based on the gray-value distribution the image is segmented into a binary image. Figure 1-6(b) illustrates image after adjustment and conversion into the binary image. Figure 1-6(c) and (d) show a series of morphological operations (image inversion, dilation, filling the holes and erosion) performed on the binary image. In the next step, the noise is removed (see Figure 1-6(e)). Then the droplets chopped by the image edges are excluded and hence only those droplets that are fully visible in the image are detected in the final step (see Figure 1-6(f)). Then different properties of droplets such as center of each droplet, crosssectional area, equivalent diameter and perimeter are computed and the statistical data of the droplets was stored in a three-dimensional array. The x- and y-coordinate of the center of each bubble in two consecutive images was used to calculate the displacement of each droplet. The displacement of the droplet and the time interval between two consecutive images were used to compute the velocity of the each droplet. The data in the three-dimensional array was used to compute the droplets size and velocity in the form of mean and distribution.
 original image (b) image after adjustment and converting into")
 image after removing the noise (f) image after selecting the only detached")
38 17 (a) (b) (c) (d) (e) (f) Figure 1-5: Image processing of the bubble formation to measure bubbles characteristics (a) original image (b) image after adjustment and converting into the binary image (c) image after inverting and dilation (d)image after filling the holes and erosion(e) image after removing the noise (f) image after selecting the only detached bubble.


 image after selecting the only")
39 18 (a) (b) (c) (d) (e) (f) Figure 1-6: Image processing of spray droplets to measure droplet characteristics (a) original image (b) image after adjustment and converting into the binary image (c) image after inverting (d) image after erosion, dilation and filling the holes and erosion(e) image after removing the noise (f) image after selecting the only detached droplets.
40 Thesis layout First chapter provides an introduction to the various atomization techniques and the fundamental foundation of the effervescent atomizer. The effervescent atomization technique with its main advantages and drawbacks are discussed. A short introduction of two-phase flow inside the effervescent atomizer and its effect on the atomization (spray) are also provided. Afterwards, to gain a better insight into the fundamental two-phase flow inside the effervescent atomizer, a brief introduction of bubble formation process in a liquid cross-flow is presented. Then the motivation and the objective of the present study are described. A brief description of the measurement and data processing techniques used in this study is provided at the end. Second chapter investigates the process of bubble formation inside a liquid cross-flow from a novel submerged nozzle. A detailed study of the effect of gas and liquid flow rates and nozzle configuration on the process of bubble formation, bubble size and detachment frequency is provided. An image-base analysis is also used to describe and investigate the bubble formation and detachment process. Third chapter focuses on the investigation of the atomization process in an effervescent atomizer. A detailed investigation of the two-phase flow behavior inside the atomizer under various atomizer internal geometries and operating conditions is presented. The impact of the internal flow on the spray droplet size and velocity is investigated next. These results are used to choose the optimal internal atomizer design for the forth chapter. Forth chapter focuses on the investigation of the effervescent atomization process using a novel bubble breaker. A detailed discussion of the bubble fragmentation process using different type of bubble breakers inside the atomizer and the corresponding spray behavior is also provided. Fifth chapter summarizes the conclusions of each chapter and presents an understanding of the two-phase flow in an effervescent atomizer and lists some future recommendations.
41 References [1] Tricou, C., Knasiak, K., "Development of a high transfer efficiency painting technology using effervescent atomization", (Institute for Liquid Atomization and Spray Systems) ILASS-Americas 18 th Annual Conference on Liquid Atomization and Spray Systems, Irvine, CA, [2] Petersen, F. J., Worts, O., Schaefer, T., Sojka, P.E., "Effervescent atomization of aqueous polymer solutions and dispersion", Pharmaceutical Development and Technology, 2001: 6, No. 2, [3] Petersen, F. J., Worts, O., Schaefer, T., Sojka, P.E., "Design and atomization properties for an inside-out type effervescent atomizer", Drug Development and Industrial Pharmacy, 2004: 30, No. 3, [4] Marshall, S. H., "Air bubble formation from an orifice with liquid cross-flow", Ph.D. thesis, University of Sydney, Australia, [5] Deckwer, W.D.,"Bubble column reactors", Wiley, [6] Lefebvre, A. H., "Atomization and Sprays." New York, Hemisphere, [7] Crowe, C. T., Michaelides, E., Schwarzkopf, J. D., "Multiphase flow handbook", Taylor & Francis Group, [8] Sovani, S. D., Sojka, P. E., Lefebvre, A. H., "Effervescent atomization", Progress in Energy and Combustion Science, 2001: 27, [9] Lefebvre, A. H., Wang, X. F., Martin, C. A., "Spray characteristics of aerated-liquid pressure atomizers", AIAA Journal Propulsion and Power 1988: 4(4), [10] Lefebvre, A. H., "A novel method of atomization with potential gas turbine application", Indian Defense Science Journal, 1988: 38,
42 21 [11] Roesler, T. C., Lefebvre, A. H., "Studies on aerated-liquid atomization", International Journal of Turbo & Jet-Engines 1989: 6, [12] Wang, X. F., Chin, J. S., Lefebvre, A. H., "Influence of gas injector geometry on atomization performance of aerated-liquid nozzles", International Journal of Turbo & Jet- Engines, 1989: 6, [13] Ferreira, M. E., Martins, J. J. G., Teixeira, J. C. F., "Optimization of an effervescent atomizer to the combustion of residue Oils", (American Society of Mechanical Engineers) ASME 2005, Heat Transfer: Volume 1, San Francisco, California, USA, July 17 22, 2005 [15] Luong, J. K., Sojka, P. E., "Unsteadiness in effervescent sprays", Atomization and Sprays, 1999: 9, [14] Loebker, D., Empie, H. J., "Effervescent spraying of a medium to high viscosity Newtonian liquid at high mass flow rates", Submitted to Atomization and Sprays, [16] Sovani, S. D., Chou, E., Sojka, P.E., Gore, J.P., Eckerle, W. A., Crofts, J. D., "High pressure effervescent atomization: effect of ambient pressure on spray cone angle", Fuel, 2001: 80(3), [17] Catlin, C. A., Swithenbank, J., "Physical processes influencing effervescent atomizer performance in the slug and annular flow regimes", Atomization and Sprays, 2001:11(5) [18] Chen, S. K., Lefebvre, A. H., Rollbuhler, J., "Influence of ambient air pressure on effervescent atomization", Journal of Propulsion and Power, 1993: 9(1), [19] Jedelsky, J., Jicha, M., Slama, J., Otahal, J., "Development of an effervescent atomizer for industrial burners" Energy Fuels, 2009: 23, [20] Schmidt, F., Lorcher, M., Mewes, D. "Measured velocity profile inside a twin-fluid atomizer generating a suspension spray", Proc. International Conference on Liquid Atomization and Spray Systems, ICLASS 2006, Aug 27- Sep 1, 2006, Kyoto, Japan.
43 22 [21] Liu, M., Duan, Y., Zhang, T., Xu, Y., "Evaluation of unsteadiness in effervescent atomizer sprays by analysis of droplet arrival statistics-the influence fluids properties and atomizer internal design", Experimental thermal and fluid science, 2011:35, [22] Whitlow, J. D., Lefebvre, A. H., "Effervescent atomizer operation and spray characteristics", Atomization and Sprays 1993: 3, [23] Sher, E., Koren, M., Katoshewski, D., Kholmer, V., "Energy consideration and experimental study of effervescent atomizers", Proc. (Institute for Liquid Atomization and Spray Systems) ILASS-Europe 2000, Paper II.7, Sep 11-13, Darmstadt, Germany. [24] Jedelsky, J., Jicha, M., " Effervescent atomizer Temporal and sptial variation of spray structure", International Conference on Liquid Atomization and Spray Systems, ICLASS-2006, Aug.27-Sept.1, 2006, Kyoto, Japan. [25] Geckler, S. C. Sojka, P. E., " Effervescent Atomization of Viscoelastic Liquids: Experiment and Modeling", Journal of Fluids Engineering, June 2008, Vol. 130, [26] Karnawat, J., Kushari, A., "Controlled atomization using a twin-fluid swirl atomizer", Experiments in Fluids 2006: 41(4), [27] Santangelo, P. J., Sojka, P. E., "A holographic investigation of the near nozzle structure of an effervescent atomizer produced Spray", Atomization and Sprays 1995: 5, [28] Ferreira, M. E., Teixeira, J. C. F., Bates, C. J., Bowen, P. J., "Detailed investigation of the influence of fluid viscosity on the performance characteristics of plain-orifice effervescent atomizers", Atomization and Sprays 2001, 11 (2). [29] Panchagnula, M. V., Kuta, T. J., Sojka, P. E., Plesniak, M. W., "Modifying entrainment in ligament-controlled effervescent atomizer produced sprays", Proc. (Institute for Liquid Atomization and Spray Systems) ILASS-Americas 1997: 35 39, May , Ottawa, Ontario, Canada.
44 23 [30] Jedelsky, J., Landsmann, M., Jicha, M., Kuritka, I., "Effervescent atomizer: influence of operation conditions and internal geometry on spray structure; study using PIV-PLIF", (Institute for Liquid Atomization and Spray Systems) ILASS08, 2008, 1-10, Sep 8-10, 2008, Como Lake, Italy. [31] Jedelsky, J., Jicha, M., Slama, J., "Characteristics and behaviour of multi-hole effervescent atomizers", Proc. (Institute for Liquid Atomization and Spray Systems) ILASS-Europe 2004: , 2004, Nottingham, United Kingdom. [32] Wade, R. A., Weerts, J. M., Sojka, P. E., Gore, J. P., Eckerle, W. A., "Effervescent atomization at injection pressures in MPa range", Atomization and Sprays 1999: 9(6), [33] Schroder, J., Schlender, M., Sojka, P. E., Gaukel, V., Schuchmann, H. P., "Modeling of drop sizes from effervescent atomization of gelatinized starch suspensions ", (Institute for Liquid Atomization and Spray Systems) ILASS Europe 2010, 23rd Annual Conference on Liquid Atomization and Spray Systems, Brno, Czech Republic, September [34] Otahal, J., Fiser, J., Jicha, M., "Performance of pressure and effervescent atomizer", Colloquium Fluid dynamics 2007, Institute of Thermomechanics AS CR, v. v. i. (Academy of Sciences of the Czech Republic), Prague, October 2007: [35] Sutherland, J. J., Sojka, P. E. and Plesniak M. W., "Entrainment by ligamentcontrolled Effervescent atomizer-produce spray", International Journal of Multiphase Flow., 1997: 23(5), [36] Chin, J. S., Lefebvre, A. H., "A design procedure for effervescent atomizers", (American Society of Mechanical Engineers) ASME Journal of Engineering for Gas Turbines Power 1995: 117, [37] Lorcher, M., Schmidt, F., Mewes, D., "Flow field and phase distribution inside effervescent Atomizers" 9 th International Conference on Liquid Atomization and Spray Systems, ICLASS, Sorrento, Italy, 2003.
45 24 [38] LiJuan, Q., JianZhong, L., "Modeling on effervescent atomization: A review", Science China Physics, Mechanics & Astronomy, December 2011: 54(12), [39] Kolev, N. I., "Multiphase Flow Dynamics 2, Thermal and Mechanical Interactions", Springer-Verlag Berlin Heidelberg, [40] Roesler, T. C., "An experimental study of aerated-liquid atomization", PhD thesis, Purdue University, [41] Roesler, T. C., Lefebvre, A. H., "Photographic studies on aerated liquid atomization, combustion fundamentals and applications", Proceedings of the Meeting of the Central States Section of the Combustion Institute, Indianapolis, Indiana, Paper 3, [42] Ghaemi, S., "Investigation of Effervescent Atomization Using Laser-Based Measurement Techniques", Thesis in University of Alberta, [43] Mostafa, A., Fouad, M., Enayet, M., Osman, S., "Measurements of spray characteristics produced by effervescent atomizers". AIAA/ASME/SAE/ASEE Joint Propulsion Conference and Exhibit, July 11-14, 2004, Fort Lauderdale, Florida. [44] Gomez, J., Fleck B., Olfert J., McMillan J., " Characterization of a horizontal twophase spray from an effervescent atomizer", (Institute for Liquid Atomization and Spray Systems) ILASS-Europe 2010, 23rd Annual conference on Liquid Atomization and Spray Systems, Brno, Czech Republic, September [45] Kleinstreuer, C., "Two-Phase Flow Theory and Application." New York: Taylor&Francis [46] Jedelsky, J. and Jicha, M.,"Novel modifications of twin-fluid atomizers: performance, advantages and drawbacks", (Institute for Liquid Atomization and Spray Systems) ILASS Europe 2010, 23 rd Annual Conference on Liquid Atomization and Spray Systems, Brno, Czech Republic, September [47] Huang, X., Wang, X., and Liao, G. "Visualization of two phase flow inside an effervescent atomizer", Journal of Visualization, 2008: 11,
46 25 [48] Lecuona, A., Sosa, P. A., Rodriguez, P. A., Zequeira, R. A., "Volumetric characterization of dispersed two phase flows by digital image analysis", Measurment Science and Technology, 2000: 11, [49] Kawamura, T., Takahashi, M., Hayashi, M., Murayama, K., Gotoh, N. "Synchronized vibrations of a circular cylinder in cross flow at supercritical Reynolds Numbers." Journal of Pressure Vessel Technology, 2003: 125, [50] Kim, J., Lee, C., Chang, I., "Effect of pump shear on the performance of a crossflow membrane bioreactor", Water Research, 2001: 35, [51] Takemoto, M., Sahai, S., Wakai, K., Sumida, I., Kondou, T., and Inatomi, T., "Investigation of two-phase flow mixing between two sub-channels", Heat Transfer - Asian Research, 2000: 29, [52] Tsuge, H., Tanaka, Y., Terasaka, K., Matsue, H., "Bubble formation inflowing liquid under reduced gravity", Chemical Engineering Science, 1997: 52, [53] Kulkarni, A. A. and Joshi, J. B., "Bubble formation and bubble rise velocity on gasliquid systems", a review, Industrial and Engineering Chemistry Research 2005: 44, [54] Tan, R. B. H., Chen, W. B. and Tan, K. H., "A non-spherical model for bubble formation with liquid cross-flow", Chemical Engineering Science, 2000: 55, [55] Nahra, H. K., Kamotani, Y., "Bubble formation from wall orifice in liquid crossflow under low gravity", Chemical Engineering Science, 2000: 55, [56] Bai H., Thomas, B. G., "Bubble formation during horizontal gas injection into downward-flowing liquid", Metallurgical Material. Transaction. 2001: B 32, [57] Zhang, W., Tan, R. B. H., "A model for bubble formation and weeping at a submerged orifice with liquid cross-flow", Chemical Engineering Science, 2003: 58,
47 26 [58] Ghaemi, S., Rahimi, P., Nobes, S., "The effect of gas-injector location on bubble formation in liquid cross-flow", Physics of Fluids, 2010: 22, , [59] Siddiqui, K., Chishty, A., "The influence of channel orientation and flow rates on the bubble formation in a liquid cross-flow", (American Society of Mechanical Engineers) ASME rd Joint US-European Fluids Engineering Summer Meeting and 8th International Conference on Nanochannels, Microchannels, and Minichannels, Montreal, Canada. [60] Liu, Z., Zheng, Y., "PIV study of bubble rising behavior", Powder Technology, 2006: 168, [61] Tsuge, H., Hibino, S., "Bubble formation from an orifice submerged in liquids", Chemical Engineering Communications, 1983: 22, [62] Nabavi, M., Siddiqui, K., Chishty, W. A., "3D Simulation of the bubble formation from a submerged orifice in liquid cross-flow", (American Society of Mechanical Engineers) ASME 2009 Fluids Engineering Division Summer Meeting, Colorado, USA. [63] Nabavi, M., Siddiqui, K., Chishty, W. A. "Effects of liquid cross-flow conditions on the bubble formation from a submerged gas orifce", (Canadian Society for Mechanical Engineers) CSME Forum, Ottawa, [64] Forrester, S. E., Rielly, C. D., "Bubble formation from cylindrical, flat and concave sections exposed to a strong liquid cross-flow", Chemical Engineering Science, 1998: 53, [65] Sen, D., Balzen, M. A., Nobes, D. S., "Bubble formation and flow instability in an effervescent atomizer", Journal of Visualization 2014: 17, [66] Gadgil, H. P., Raghunandan, B. N., "Some features of spray breakup in effervescent atomizers". Experiments in Fluids. 2010: 50, [67] Shepard, T. G., "Bubble size effect on effervescent atomization", PhD thesis in the University of Minnesota, Jun 2011.
48 27 [68] Liu, M., Duan, Y., Zhang, T., "Evaluation of effervescent atomizer internal design on the spray unsteadiness using a Phase/Doppler Particle analyzer" Experimental thermal and fluid science, 2010: 34, [69] Ariyapadi, S., Berruti, F., Briens, C., Knapper, B., Skwarok, R., Chan, E., "Stability of horizontal gas-liquid sprays in open-air and in a gas-solid fluidized bed", Powder Technology, 2005, 155(3): [70] Kashdan, J., Shrimpton, J., and Whybrew, A., "Two-phase flow characterization by automated digital image analysis. part 1: Fundamental principles and calibration of the technique", Particle and Particle Systems Characterization, 2003: 20, [71] Zama, Y., Kawahash, M., and Hirahara, H. "Simultaneous measurement of droplet size and three-components of velocity in spray", Optical Review, 2004: 11(6), [72] Gomez, J., "Influence of bubble size on an effervescent atomization", M.Sc. Thesis, University of Alberta, Fall 2010.
49 28 Chapter 2 2 Bubble formation process from a novel nozzle design in a liquid cross-flow 2.1 Introduction Gas injection into a liquid stream and the dispersion of gas-liquid mixture into the spray have great importance in several industrial processes such as combustion [1, 2], food processing [3], metal casting [4], bubble column reactors [5, 6] and wastewater treatment [7]. In such applications, the gas-liquid interfacial area is a critical parameter, which affects chemical/biological reactivity of two phases as well as heat and mass transport. The larger surface area of gas bubbles per unit volume of liquid implies larger gas-liquid interfacial contact, which is achieved through smaller bubbles in numerous quantities than fewer large size bubbles. That is, the generation of smaller size bubbles at higher detachment frequency. The generation of smaller bubbles at higher detachment rate can be achieved by injecting the gas in the liquid cross-flow [8-14]. The liquid motion affects the bubble formation in two ways: (i) Flowing liquid induces drag force on the bubble attached to the gas injector. The shearing effect of the liquid drag force causes an early detachment of bubbles from the gas injector, which leads to the generation of smaller bubbles [11]. (ii) Flowing liquid also forces bubbles to move away from the gas injector reducing the possibility of bubbles coalescence, which increases and randomizes the bubble size hence affects the bubble size distribution [12]. The injection of gas into a liquid stream may result in three regimes of two-phase flow: 1) flow of individual bubbles (no coalescence and no mutual interactions), 2) bubbly flow where bubbles could interact and may result in coalescence, 3) jet flow [15]. In individual bubbly flow, the bubbles are smaller in size and/or far apart from each other. An increase in the gas flow rate results in the transition of individual bubbly flow regime into the interacting bubbly regime. The bubble size in this regime is relatively large compared to
50 29 the individual bubbly regime and bubbles could easily deform. Furthermore, bubble collision and coalescence may also occur in this regime. This regime also is considered as a transition mode from the bubbly flow to the jet flow [15]. Eventually at very high gas flow rates, jet flow regime becomes dominant where a continuous jet of gas forms within the liquid stream. However, further downstream, this jet may break up into bubbles of different sizes [8, 16]. The bubble dynamics are characterized by many parameters such as, bubble size, detachment frequency, velocity, trajectory and formation mode. A number of computational and experimental studies have investigated the bubble formation in the liquid cross-flow. A large number of experimental studies utilized imaging techniques for bubble visualization [4, 8, 17-22]. Siddiqui and Chishty [19] experimentally studied the effect of channel orientation at various gas and liquid flow rates on the bubble detachment frequencies and trajectories. They conducted the experiments in a twodimensional Plexiglas channel using high-speed imaging and image processing to investigate the effect of gas to liquid flow rates ratio (GLR) on the bubble detachment frequency. They also investigated the impact of channel inclination angle on the bubble trajectories. They observed that an increase in the channel inclination angle results in steeper bubble trajectories. They also found a linear relationship between bubble detachment frequency and GLR at low inclination angles of the channel which becomes nonlinear at higher inclination angles. Ghaemi et al. [21] experimentally studied the influence of nozzle length on the bubble characteristics in a liquid cross-flow. They investigated the bubble size, shape, location and velocity at various gas and liquid flow rates for four injector lengths; one with zero length (i.e. a wall orifice) and the others with the nozzle length equal to 1, 2 and 3 mm of the channel dimension. They found that with an increase in the liquid flow rate, the bubble size decreased and detachment frequency increased. They also argued that at higher gas flow rates and lower liquid flow rates, the probability of coalescence occurrence increases. Marshal [5] experimentally investigated that three bubble formation modes appear in the liquid cross-flow:"single bubbling", "pulse bubbling" and "jetting". They also found that the bubble formation mode is influenced by gas and liquid velocity
51 30 and nozzle diameter. Tsuge and Hibino [23] studied the bubble formation in the liquid cross-flow both experimentally and theoretically. They used high-speed imaging and photo-transistor to detect the bubble detachment frequency. They investigated the influence of gas physical properties, orifice diameter and surrounding liquid velocity. They observed an increase in the bubble size with a reduction in the gas density. They concluded that at the constant operating conditions, the bubble size increases with an increase in the orifice diameter while higher liquid velocity produces smaller bubbles. Nahra and Kamotani experimentally [18] and theoretically [24] investigated the effect of liquid cross-flow on the bubble formation. They conducted experiments under normal and reduced gravity and found that wall orifice diameter, gravity, liquid velocity and gas flow rates affect the bubble formation process. Bai and Tomas [4] numerically and experimentally studied the bubble formation from a wall orifice into the liquid cross-flow in a vertical channel. Volume of fluid (VOF) method and high-speed imaging were used for numerical simulation and experimental observation, respectively. They concluded that the gas compositions (air, helium and argon) and orifice diameter have relatively insignificant effects on the bubble size and that the bubble size reduces by increasing liquid velocity and/or decreasing gas flow rate. Forrester and Rielly [8] conducted an experiment study on the bubble formation from various shapes of submerged blades in liquid cross-flow and found that liquid cross-flow, gas velocity and blade shape influence the bubble size and bubble formation regime. Iguchi et al. [22] experimentally investigated the bubble detachment frequency for different nozzle diameters in a rotating water tank using high-speed imaging. Five nozzles with different inner and outer diameters were used during the experiments. They concluded that when the ratio of the outer to inner diameters of the nozzle was lower than 3.5, the outer diameter of the nozzle has a weak effect on the bubble detachment frequency. As the above literature review shows, the bubble characteristics in liquid cross-flow have been extensively studied in the past. However, there is a scarcity of studies investigating the impact of the shape of the nozzle on the bubble formation in the liquid cross-flow. Recently, Gadallah and Siddiqui [25] developed a novel nozzle design that significantly increases the bubble detachment frequency and generates smaller bubbles. They tested
52 31 the nozzle in the stagnant liquid under various gas flow rates and observed that over a given range of gas flow rates, the novel nozzle increases the bubble detachment frequency by 58% and reduces the bubble diameter by 25%. The present study is focused on investigating the bubble formation process in a liquid cross-flow from this novel nozzle with some modifications, and studying the characteristics over a range of gas and liquid flow rates and comparing them with the standard nozzle. 2.2 Experimental setup The experiments were conducted in a channel with square cross-section (5 cm 5 cm), 100 cm long. Air and water were used as the gas and liquid mediums, respectively. The channel was made of acrylic. A honeycomb was placed near the upstream end of the channel to straighten the flow and remove flow disturbances. Water was circulated through the channel via a magnetic pump (Little Giant, 5 MD) from a 60 gallon reservoir (see Figure 2-1). Water flow rates were adjusted using a rotameter (FP 1-35-G-10/83, F&P Co) which was installed downstream of the pump. The pressurized air was injected into the liquid stream in the channel via a nozzle to generate bubbles. To maintain steady supply of air, the compressed air from the main supply line was first passed through a 0.16 m 3 tank, which served as a settling chamber, to remove pressure fluctuation. The air from the settling chamber then passed through a needle valve into a long capillary tube that was connected to the nozzle. The needle valve was used to control the air flow rate, which was measured by a rotameter located upstream of the needle valve (see Figure 2-1). The nozzle was located 70 cm downstream of the channel inlet. A prior set of experiments in the channel using Particle Image Velocimetry (PIV) technique confirmed that the channel flow was fully developed at the nozzle location. The uncertainties in liquid and gas flow rates based on the rotameters used were ±3 and ±0.08 cm 3 /s. As mentioned earlier, a novel nozzle design developed by Gadallah and Siddiqui [25] was used in this study. The unique feature of this nozzle design was the presence of side holes near the main nozzle rim, which generates small bubbles with higher detachment frequency. Two side-holes nozzles are referred to as Configuration A. Two orientations of the novel nozzle were considered in the study. In the first orientation (I), the side holes
53 32 were aligned with the liquid flow direction and in the second orientation (II), the nozzle was rotated by 90 o thus, the side holes were located perpendicular to the liquid flow direction, hereinafter referred to as Configuration A-I and A-II (see Figure 2-2). A standard nozzle was also considered which served as a reference case. Both novel and standard nozzles have inner diameter of 0.82 mm and outer diameter of 1.62 mm and were made from brass tube. Three diameters of the side-holes were considered in this study, which were 0.5, 0.7 and 0.82 mm. Experiments were conducted at four liquid flow rates and three gas flow rates for each nozzle. Table 2-1 summarizes the gas and liquid flow rates and the corresponding velocities. A high-speed camera (Photron SA5) with a 60 mm lens was used to capture bubble image. The camera has the resolution of pixels up to 7500 frames per second. The camera resolution decreases with a further increase in the frame rate. The camera was connected to a PC and was operated via Photron FASTCAM Viewer software. The camera has a built-in memory card that allowed direct image recording. These images were later transferred to the hard drive. Back-lit shadowgraphy technique was used to illuminate the background for bubble identification. For this purpose, a 500 W halogen lamp was placed behind a diffusion screen to generate a uniform light. The images were captured at a rate of 1000 frames per second, and 2500 images were acquired and processed for each case. An in-house Matlab algorithm developed by Siddiqui and Chishty [19] was used to detect bubbles and to quantify various bubble parameters. Once a bubble is detached from the nozzle, the code automatically detects and tracks the bubbles and computes various bubble characteristics such as the bubble trajectory, detachment frequency, velocity, cross-sectional area and equivalent diameter. The uncertainty of detecting the bubble boundaries was within ±2 pixels, which correspond to the uncertainty of ±0.06 mm that translated into bubble diameter uncertainly of ±0.13 mm. The experimental procedure used in this study is described as follows. The first set of experiments was conducted for stagnant liquid and varied the gas flow rates from to cm 3 /s, as mentioned earlier (see Table 2-1). In the following sets of experiments, the liquid flow rate was set and for the given liquid flow rate, the gas flow rate changed
54 33 from a minimum to a maximum value. At each condition, the image acquisition started 10 minutes after setting the gas flow rate to reach the steady state. (a)
 0 255 395 535 Water velocities (cm/s) 0 9.85 15.")
55 34 (b) Figure 2-1: Experimental setup; (a) Schematic and (b) photograph. Table 2-1: Selected gas and liquid flow rates and corresponding average velocities Water flow rates (cm 3 /s) Water velocities (cm/s) Gas flow rates (cm 3 /s) Gas velocities (cm/s)
56 35 Figure 2-2: Nozzle designs and orientations with respect to the flow direction used in the experiments. (a) Standard nozzle, (b) Novel nozzle, 2 side-holes in-line orientation, (c) Novel nozzle, 2 side-holes perpendicular orientation. hs=1.6mm. To visualize the bubble formation and detachment mechanism and to study the gas behavior inside and outside the nozzle during bubble formation, a second set of the experiments was conducted using glass nozzles. Both standard and novel nozzles were made from glass tubes with inner and outer diameters of 0.99 mm and 1.28 mm, respectively. The novel nozzle had a side-hole diameter of 0.86 mm. Due to the difficulty in exactly matching the diameters of commercially available brass and glass tubes, the glass nozzles has slightly different dimensions compared to the brass tubes. However, they served the purpose of visualizing the underlying phenomenon. For the glass nozzle study, the experiments were conducted at the same liquid flow rates described earlier and one gas flow rate (0.881 cm 3 /s). To accurately capture the underlying phenomenon, the frame rate for the glass nozzle experiments was set at 10,000 frames per second. At each condition, the image acquisition started 20 minutes after setting the liquid flow rate to reach the steady state. For each case, 5,000 images were acquired.
57 Results and Discussion In the present study, the bubble formation was investigated during vertical gas injection through a submerged nozzle into a cross-flowing liquid stream. Figure 2-3 shows the main forces acting on the gas bubble during its growth and after detachment under these conditions. During the bubble growth, once the bubble is attached to the nozzle, these forces are, surface tension (F s ), buoyancy (F B ), gas momentum flux (F M ), pressure (F p ), inertial (F I ), lift (F L ) and drag forces (F D ) [18, 24]. However, once the bubble detaches from the nozzle the governing forces on the bubble reduce to buoyancy, lift and drag forces. The role of different forces is described as follows: Difference between the gas pressure at the nozzle tip and the liquid pressure causes an upward pressure force on the growing bubble. The relative motion between the bubble and the liquid resulted in the exertion of friction force on the bubble as well as the net pressure force due to the change in the liquid pressure as it goes around the bubble. These forces have drag and lift components in the direction parallel and perpendicular to the relative motion, respectively. Buoyancy force is the upward force, which promotes bubble growth and detachment. The magnitude of this force also increases with an increase in the bubble size. Surface tension force has two components, both of which act to keep the bubble attached to the nozzle. The horizontal component acts against the liquid drag while the vertical component acts against the buoyancy force. The surface tension force increases with the bubble growth and deformation. Inertial force also has two components in x and y directions. The growing bubble displaces and accelerates liquid surrounding the bubble, which adds mass to the bubble [18]. Gas momentum flux force through the nozzle is a detaching upward force and increases with an increase in the gas velocity or gas density.
58 37 (a) (b) Figure 2-3: Governing force acting on the bubble (a) During formation, (b) After detachment. In the present study the bubble formation were investigated during vertical gas injection through a submerged nozzle into a cross-flowing liquid stream. The bubble formation from the standard nozzle in the liquid cross-flow occurs in two stages. When gas injects through the nozzle, bubble starts to grow. At this growing stage, since the bubble size is small, the drag force induced by the liquid cross-flow is negligible. The shape of bubble at this stage is assumed to be spherical. In the second stage or elongation stage, the bubble is still growing and attached to the nozzle but the shearing effect from the liquid cross-flow due to the friction drag elongates the bubble in the liquid flow direction [4].
59 38 Figure 2-4 shows the bubble detachment frequency (f B ) as a function of the average liquid velocity (V L ), for the standard nozzle at three gas flow rates. These results show the dependency of bubble detachment frequency on the gas flow rate. As expected, at a given gas velocity, the detachment frequency increased with an increase in the liquid velocity and at a given liquid velocity, the detachment frequency increased with an increase in the gas flow rate. As mentioned earlier, the drag force induced by the liquid cross-flow pushes the bubbles to move away from the nozzle. Thus, the rate of bubble detachment increases with an increase in the liquid velocity due to the increase in the drag force. Similarly, as the gas flow rate increases, the bubble grows faster and hence the buoyancy force pushes the bubble up. This rapid growth of bubble also increases the liquid drag force. Both of these forces lead to the bubble detachment. Figure 2-4: Bubble detachment frequency (f B ) versus average liquid velocity (V L ) for the standard nozzle at three different gas flow rates. Error bars (based on the standard error of the mean) are smaller than the size of the symbols.
60 39 Figure 2-5 compares the bubble detachment frequency of all nozzles as a function of liquid velocity at the gas velocity of cm/s. The results clearly show that the bubble detachment frequency significantly enhances using the novel nozzle design. For the standard nozzle at a given gas flow rate, an increase in liquid flow rate causes an increase in the bubble detachment frequency. However, for the novel nozzle at the given side-hole diameter used in this study, the liquid flow rates have a weak effect on the bubble detachment frequency. This shows some clear advantages of novel nozzle particularly at lower liquid flow rates because for the standard nozzle, the detachment frequency decreases with a decrease in the liquid flow rate, whereas for the novel nozzle it still maintains high detachment rate. For example, at the lowest liquid flow rate, the bubble detachment frequency of the novel nozzle is 2-3 times higher than that of the standard nozzle. This difference decreases with an increase in the liquid velocity and becomes almost negligible at the highest liquid velocity. It is also observed that the bubble detachment frequency is a function of the side-hole diameter. The results show that with an increase in the size of the side-hole, the bubble detachment frequency increased at first and then decreased. This trend specifies that the bubble detachment frequency could be maximized with an optimal side-hole diameter.
61 40 Figure 2-5: Bubble detachment frequency (f B ) versus average liquid velocity (V L ) at gas velocity of (cm/s). Error bars (based on the standard error of the mean) are smaller than the size of the symbols. Figure 2-6 shows the impact of new nozzle design and its orientation on the bubble diameter as a function of liquid velocity at a gas velocity of cm/s. Note that the bubble diameter was measured immediately after its detachment from the nozzle since the bubbles are approximately spherical at that stage. The results from the standard nozzle are also plotted for comparison. For the standard nozzle, as expected, the results show a monotonic decrease in the bubble diameter with an increase in the liquid velocity, at a given gas velocity. The results for the novel nozzle show no dependency of the bubble diameter on the liquid velocities at any orientation. In addition, the novel nozzle produced smaller bubbles than that generated by the standard nozzle. This difference decreased with an increase in the liquid velocity, similar to that observed for the bubble
62 41 detachment frequency (see Figure 2-5). In the stagnant liquid, the bubbles generated by the novel nozzle were on average 30% smaller than those generated by the standard nozzle. This difference reduced to about 8% at the highest liquid velocity. The results also show the bubble size decreased with an increase in the side-hole diameter for both orientations of the novel nozzle. This difference however, reduced with an increase in the liquid velocity. For example, in the stagnant liquid, the size of the bubble generated by nozzle with 0.82 mm diameter side-hole was about 15% and 11% smaller than that from the 0.5 mm diameter side-hole for perpendicular and inflow orientations, respectively. This difference reduced to 1% and 8%, respectively, at the highest liquid velocity. Furthermore, the results also indicate that there is no significant effect of the nozzle orientation on the bubble diameter. The results in Figure 2-6 are presented for one gas velocity, similar trends were observed at other gas velocities (not shown here). The results in Figure 2-5 and 2-6 demonstrate that the novel nozzle with the side-holes generated smaller bubbles with higher detachment frequency compared to that of the standard nozzle over a range of liquid velocities. The results also show that for the novel nozzle, both the bubble diameter and the detachment frequency are not dependent on the liquid velocity, unlike the standard nozzle, in which both of these parameters are heavily dependent on the liquid velocity. Both the bubble diameter and the bubble detachment frequency play an important role in the effective interaction of liquid and gas phases. Smaller bubbles in large numbers are desirable in applications involving gas-liquid reactivity as they increase the overall surface area of the gas-liquid interface. Based on the above results, we can conclude that the novel nozzle has substantially better performance than the standard nozzle especially at low liquid velocities or in the stagnant liquid.
63 42 Figure 2-6: Bubble diameter (D B ) versus average liquid velocity (V L ) at a gas flow rate of (cm/s). Error bars (based on the standard error of the mean) are smaller than the size of the symbols. Figure 2-7 shows the bubble detachment frequency as a function of gas velocity at a constant liquid velocity of 9.85 cm/s. The plot shows that the detachment frequency increased with an increase in the gas velocity for all nozzles and orientations. It is also observed that at a given gas velocity, the detachment frequency of the novel nozzle is substantially higher than that for the standard nozzle. On average, the bubble detachment frequency from the novel nozzle was 2.5 times higher than the standard nozzle. The results also show that the increase in the detachment frequency with the gas velocity is more rapid for the novel nozzle (i.e. steeper slop) compared to the standard nozzle. Figure 2-7 however, did not show a monotonic change in the detachment frequency with the side-hole diameter. That is, the detachment frequency first increased when the side-
64 43 hole diameter was increased from 0.5 mm to 0.7 mm and then decreased with a further increase in the side-hole diameter. The nozzle orientation did not show a distinct trend for the bubble detachment frequency. Figure 2-7: Bubble detachment frequency (f B ) versus average gas velocity (V g ) at a liquid velocity of 9.85 (cm/s). Error bars (based on the standard error of the mean) are smaller than the size of the symbols. The change in the bubble diameter as a function of gas velocity is shown in Figure 2-8 at a constant liquid velocity of 9.85 cm/s. The results show that at a given liquid velocity, the bubble diameter increased with an increase in the gas velocity, as expected. Comparison shows that the rate of increase in the bubble diameter with respect to the gas velocity is in general, comparable for both standard and novel nozzles, however, at a given gas velocity, the bubble diameter is on average, 30% smaller than the standard nozzle. The change in the side-hole diameter as well as the nozzle orientation did not
65 44 show a clear trend on the bubble diameter. The results in Figure 2-8 are presented for one liquid velocity, similar trends were observed at other liquid velocities and for the stagnant liquid (not shown here). Figure 2-8: Bubble diameter (D B ) versus gas velocity (V g ) at a liquid velocity of 9.85 (cm/s). Error bars (based on the standard error of the mean) are smaller than the size of the symbols. The results in Figures 2-7 and 2-8 are presented for specific gas and liquid velocities to investigate the trends of bubble detachment frequency and bubble diameter by varying either the liquid velocity or the gas velocity. To present the general trends, the bubble detachment frequency and flow rates are expressed in non-dimensional forms in terms of the Strouhal number (St) and the gas to liquid flow rates ratio (GLR), respectively. The
66 45 Strouhal number, based on the inner diameter of the nozzle (D N ) and the average liquid velocity (V L ) is defined as, St=f B D N /V L (1) Where f B is the bubble detachment frequency. The results are presented in Figure 2-9. The results show that in general, the Strouhal number increased with an increase in GLR. The results clearly distinct the Strouhal number trend for the novel nozzle from that of the standard nozzle i.e. the Strouhal number for the novel nozzle, increased more rapidly with GLR compared to the standard nozzle. Furthermore, the Strouhal number values for the novel nozzle are in general higher than the standard nozzle and this difference increased with an increase in the GLR. Figure 2-9: Strouhal number (St) versus GLR. Error bars (based on the standard error of the mean) are smaller than the size of the symbols.
67 46 Figure 2-10 presents the relationship between the bubble diameter and the flow rates in a non-dimensional form, which shows a general trend of increasing bubble diameter with GLR. The bubbles generated from the novel nozzle were in general, smaller than that generated from the standard nozzle. Figure 2-10: Mean bubble diameter to inner nozzle diameter ratio (D B /D N ) versus gas to liquid flow rate ratio (GLR). Error bars are (based on standard error of the mean) smaller than the size of bullets.
68 Bubble detachment mechanism The results in the preceding section provide clear evidence that the novel nozzle with side-holes generate smaller and numerous bubbles than the standard nozzle in a liquid cross-flow under a very wide range of operating conditions. In this section, the underlying mechanism that led to the formation of smaller bubbles at higher rate will be discussed. The image sequences captured to quantify bubble size and detachment frequency can be used to qualitatively describe the bubble formation process from the novel nozzle. Image sequences showing the bubble formation and detachment process from the standard and novel nozzle for two side-hole orientations are illustrated in Figure The images for the standard nozzle (Figure 2-11(a)) show the classical behavior of the bubble formation as described earlier. Figure 2-11(b) and (c) show the bubble formation process from the novel nozzle in stagnant liquid showing the side-holes from two perpendicular angles. It is observed that the presence of the side-holes in novel design affects the bubble generation process. Figures show that after the detachment of the previous bubble, once the gas reaches to the side-holes, it expands through side-holes first. Once gas expands through the side-hole, gas-liquid interface stretches and stores energy. This stored energy increases, since the gas continues to expand through the sideholes. This stage is considered as the expansion stage. During the expansion stage, the gas also expands through the main nozzle hole. When the bubble size increases, at a certain stage, the buoyancy force becomes large enough to push the growing bubble. Furthermore, the higher liquid hydrostatic pressure force at the side-holes pushes back the gas into the nozzle. Meanwhile, the stored energy in the gas-liquid interface converts into kinetic energy of gas which further supports this push back. This stage is considered as the collapse stage. The dynamic motion of the gas volume shown in collapse stage is referred to the gas-liquid interface motion. Similar to the elasticity of a solid material, which tends to return a defamed shape to the original shape, surface tension tends to maintain the bubble-liquid interface stable. The push back of the gas into the nozzle due to the combined effect of the interface motion and the liquid hydrostatic pressure force, leads to the shearing of the gas volume inside the nozzle. Ultimately, this shearing effect
69 48 results in an earlier bubble detachment considered as the pinch-off stage. This consequently results in the formation of smaller bubbles at higher frequency. Figure 2-11(d) and (e) shows the effect of cross-flow on the bubble formation process for the novel nozzle with side-holes oriented in-line and perpendicular to the liquid flow, respectively. A quick comparison between Figure 2-11(d) and (b) shows that due to the effect of drag force from cross-flowing liquid, the expansion stage changes to collapse stage earlier than that in the stagnant liquid and the size of windward bubble decreases. Therefore, an increase in the liquid velocity hence an increase in the drag force results in a decrease in the gas-liquid interface rebound force due to a decrease in the stored potential energy in the smaller windward bubble. Thereby with an increase in the liquid velocity, the combined effect of the liquid drag force and the rebound force remains almost the same. Therefore, the novel nozzle shows almost no dependency of the liquid velocity on the bubble characteristics. The shearing effect inside the nozzle is clearly evident in Figure 2-11(e) which shows the undisturbed view of the side-hole. Note that this shearing effect is caused solely due to the presence of the side-holes.
 Standard nozzle at liquid flow rate of 255 cm 3 /s (Δt=4ms). (b), (c) Novel nozzle in-line and perpendicular orientation at stagnant liquid flow (Δt=1ms).")
70 49 Figure 2-11: Image sequences showing the effect of liquid cross-flow on the dynamic gas-liquid interface motion during bubble formation from the novel nozzle with side-hole diameter of 0.7 mm at a gas flow rate of 0.28 cm 3 /s. (a) Standard nozzle at liquid flow rate of 255 cm 3 /s (Δt=4ms). (b), (c) Novel nozzle in-line and perpendicular orientation at stagnant liquid flow (Δt=1ms). (d), (e) Novel nozzle inline and perpendicular orientation at liquid flow rate of 255 cm 3 /s (Δt=1ms).
71 50 Results in Figure 2-12 show that the size of the side-hole has an impact on the bubble diameter and detachment frequency. However, there was not a specific trend over the entire range of GLRs considered. We further investigated this issue to obtain a better understanding for this variation in the trend. The results are presented in Figure 2-12 which illustrates the bubble formation and detachment process from nozzles with different side-hole diameters. It is observed that for the case with the smallest side-hole diameter, the bubbles are always formed and detached from the main top nozzle. While by increasing the side-hole diameter to 0.82 mm bubbles are always formed and detached from side-holes. Figure 2-12: Image sequences showing the bubble formation from different sidehole diameters of in-line novel nozzle at a gas flow rate of cm 3 /s and liquid velocity of 9.85 cm/s (a) novel nozzle with side-hole of 0.5 mm ( t =5 ms), (b) novel nozzle with side-hole of 0.7 mm ( t =4 ms) and (c) novel nozzle with side-hole of 0.82 mm ( t =4 ms). The liquid stream is from right to left.
72 Glass nozzle The image sequences shown earlier in Figures 2-11 provide a good perception about the overall bubble formation and detachment process from the novel nozzle design compared to the standard nozzle. The results indicate that the gas at the side-hole undergoes expansion and collapse stages resulting in an gas-liquid interface motion, which eventually pinches off the gas in the nozzle leading to the early bubble detachment. This process of expansion, collapse and pinch off is the key for the higher detachment rate and hence the smaller bubble size. Due to the opaque nature of the brass tube used as nozzles, the crucial stages of collapse and pinch off are not clearly visible. To get a better insight into this process, both standard and novel nozzles from glass tube were manufactured and used to study this process. As mentioned in the experimental setup section, due to the mismatch in the internal diameter of commercially available glass and brass tubes, the internal and side-holes diameters of glass nozzles were slightly different from the brass nozzle (see experimental setup section for details). Consequently, the gas flow rate used for the glass nozzle study was slightly higher than that used for brass nozzle study. Figure 2-13 shows that bubble formation and detachment process in the standard glass nozzle subjected to the liquid cross-flow which is considered as a reference. The image sequence shows one complete cycle of bubble formation and detachment. As the images show, the bubble continues to grow from the nozzle with time. Initially, the bubble is spherical in shape however, under the influence of drag force exerted by the cross-flowing liquid, the bubble elongates in the liquid flow direction as it grows. The bubble is still attached to the nozzle due to the surface tension force but the buoyancy force tends to pull the bubble in the upward direction. As the bubble grows, the buoyancy and drag forces become dominant and their pulling effect results in the formation of a neck at the nozzle rim (see Figure 2-13 (q)). This pulling effect reduces the width of the neck, which in turn reduces the air supply to the bubble. Eventually, the pull due to buoyancy and drag forces cuts the bubble neck and the bubble detaches from the nozzle.
73 52 (a)t=0 ms (b)t=1.1 ms (c)t=2.2 ms (d)t=3.3 ms (e)t=4.4 ms (f)t=5.5 ms (g)t=6.6 ms (h)t=7.7 ms (i)t=8.8 ms (j)t=9.9 ms (k)t=11 ms (l)t=12.1 ms (m)t=13.2 ms (n)t=14.3 ms (p)t=15.4 ms (q)t=16.5 ms (r)t=17.6 ms (s)t=18.7 ms (u)t=19.8 ms (v)t=20.9 ms Figure 2-13: Sequence of bubble formation from the standard nozzle at gas flow rate of 826 cm 3 /s, liquid flow rate of 395 cm 3 /s, t=1.1ms.
74 53 Figure 2-14 shows the bubble formation and detachment process from the novel nozzle under identical conditions as for the standard nozzle shown in Figure As mentioned earlier, the bubble formation and detachment process from the novel nozzle comprised of these stages; expansion, collapse and pinch off. In the following, the bubble formation and detachment process over one complete cycle is described based on these three stages. Figure 2-14 shows that after the previous bubble detachment, the gas moves upward until it reaches the side-holes. Since the gas reaches the side-holes before the main nozzle hole, it starts to expand through both side-holes (see Figure 2-14(e-h)). In the present orientation, the side-holes are in-line with the liquid cross-flow. Hence, the bubble growing from the windward side-hole is directly exposed to the liquid drag, whereas, the bubble growing from the leeward side-hole lies in the low-pressure wake of the nozzle and also partially exposed to the liquid drag. The windward bubble grows at a slower rate compared to the leeward bubble. During its growth, the windward bubble expands against the liquid drag force (comprised of both friction and pressure drag) and hence this work is stored at the gas-liquid interface in the form of potential energy. After reaching a certain size, the windward bubble cannot overcome the liquid drag, which then compresses the windward bubble, which is referred to as the collapse stage. During the collapse stage, the stored potential energy in the gas-liquid interface is released and converted into kinetic energy. This kinetic energy acts on the gas volume in form of the rebound force. This rebound force along with the liquid drag force assists the compression of the windward bubble during collapse stage. The compression of the windward bubble increases the internal pressure and hence the air mass in the windward bubble rapidly moves to the leeward bubble. This increases the growth rate of the leeward bubble. During the collapse stage as the air mass from the windward bubble transfers to the leeward bubble, the liquid push back continues and the liquid enters the nozzle from the windward side-hole (see Figure 2-14(n) and (p)). As the leeward bubble grows, the buoyancy effects become significant. The combined effect of buoyancy, liquid drag from the windward side-hole and the hydrostatic pressure from the nozzle top hole form the neck of the bubble, which cuts off shortly after due to the increased effect of these forces (see Figure 2-14(q)). This stage is the pinch off stage. Note that during the neck formation and pinch off stages, the bubble is still attached to the upper section of the
75 54 leeward side-hole likely due to the surface tension (see Figure 2-14(p-r)). After pinch off, the bubble tends to rise and move downstream under the influence of buoyancy and liquid drag but due to its attachment at the upper section of the nozzle, it undergoes a slight rotation about the attachment point and then completely detaches from the nozzle. Figures 2-13 and 2-14 also show the time from the previous detachment in each image, which provides a better idea of the associated timescales. Figure 2-13 shows that the time between two bubble detachments is about 20.9 ms, whereas, for the novel nozzle in Figure 2-14, the time reduces to 15.2 ms under the same operating conditions. Figure 2-14 also allows quantifying the timescales of different stages of bubble formation process in the novel nozzle described earlier. As figure shows, the expansion stage takes about 4 ms (t = 3.2 ms to 7.2 ms, see Figures 2-14(e-j)). The collapse stage takes about 3.2 ms (t = 7.2 ms to 10.4 ms, see Figures 2-14(j-n)). The pinch off stage takes about 2.2 ms (t = 10.4 ms to 12.8 ms, see Figures 2-14 (n-r)). The time fraction of each stage relative to the total time period between two detachments is about 26%, 21% and 14%, for the expansion, collapse and pinch off stages, respectively.
76 55 (a)t=0 ms (b)t=0.8 ms (c)t=1.6 ms (d)t=2.4 ms (e)t=3.2 ms (f)t=4 ms (g)t=4.8 ms (h)t=5.6 ms (i)t=6.4 ms (j)t=7.2 ms (k)t=8 ms (l)t=8.8 ms (m)t=9.6 ms (n)t=10.4 ms (p)t=11.2 ms (q)t=12 ms (r)t=12.8 ms (s)t=13.6 ms (u)t=14.4 ms (v)t=15.2 ms Figure 2-14: Sequence of bubble formation from the novel nozzle at a gas flow rate of 826 cm 3 /s and liquid flow rate of 395 cm 3 /s, t=0.8 ms.
77 56 The image sequence in Figure 2-14 has shown the complete cycle of bubble formation and detachment from the novel nozzle. The results showed that the liquid drag force has a significant influence on the bubble expansion, collapse and pinch off. The impact of the change in liquid flow rate on these stages is shown qualitatively in Figure The figure shows the end of each stage at three liquid flow rates. As observed, with an increase in the liquid flow rate, the timescale of the expansion process decreases and the size of the windward bubble reduces (see Figure 2-15(a)). This is likely due to the reason that an increase in the liquid drag due to the increase in the flow rate resists the expansion of the windward bubble. As the liquid flow rate increased by a factor of 2.1, i.e. from 255 cm 3 /s to 535 cm 3 /s, the expansion time reduced by 4% but the windward bubble size reduced by 40%. For the collapse stage, the figure clearly shows the effect of liquid flow rate on the windward bubble collapse. It is observed that the liquid drag pushes the windward bubble inward (see Figure 2-15(b)). At the lowest liquid flow rate, the liquid drag is relatively low but high enough to push the bubble inward. At this stage, the liquid hydrostatic force from the top hole of the nozzle also supports this pushback. As the liquid flow rate increases, the contribution of the liquid drag from the side-hole becomes dominant, which is clearly evident in the image at the highest liquid flow rate. It shows that the liquid drag not only pushed the bubble back but also was strong enough to let the bubble expand upward against the liquid hydrostatic force. The time history shows that the time interval of the collapse stage also reduces with an increase in the liquid flow rate. It is observed that the collapse stage time interval decreased by 50% when the liquid flow rate increased from 255 cm 3 /s to 535 cm 3 /s. The pinch-off time is shown in Figure 2-15(c). As observed the time at which the bubble pinches off from the side-hole does not change with an increase in the liquid flow rate.
 t=7.1 ms t=7 ms t=6.8 ms (b) t=10.")


78 57 Q l =255 cm 3 /s Q l =395 cm 3 /s Q l =535 cm 3 /s (a) t=7.1 ms t=7 ms t=6.8 ms (b) t=10.7 ms t=10.3 ms t=8.6 ms (c) t=12.5 ms t=12.1 ms t=10.4 ms Figure 2-15: Different stages of the bubble formation and detachment at liquid flow rates of 255 cm 3 /s, 395 cm 3 /s and 535 cm 3 /s. t=0 is considered for the previous bubble detachment. (a) Expansion stage (b) Collapse stage (c) Pinch-off.

79 58 Figure 2-15 shown above, depicted the impact of liquid flow rate on different stages of the bubble formation and detachment. To quantify this transient process, the bubble movement was tracked over one complete bubble formation and detachment cycle. The movement was tracked horizontally and vertically. Figure 2-16 shows the schematic of the coordinates used to track the bubble movement. As illustrated, the upper edge of the nozzle was used as the reference for the coordinate system. The edges of the bubbles (windward and leeward) relative to the mid position of the side-holes was used to quantify the horizontal extent of bubbles while the upper edge of the gas rising in the nozzle was used to quantify the vertical movement. Figure 2-16: Reference coordinate system. Figure 2-17 shows the time history of these coordinates for the novel nozzle at the lowest liquid flow rate. As observed, immediately after the previous bubble detachment the gas rises in the main nozzle until it reaches the side-holes (marked with A in the figure). Once it reached the side-holes, both windward and leeward bubbles start to grow. As discussed earlier, the windward bubble undergoes the expansion phase, which ends around 7.5 ms (see B ), followed by a collapse stage which ends around 10.5 ms (see C ). The leeward bubble continues to grow until the pinch-off at approximately 13 ms (see G ). The vertical movement of the gas in the main nozzle is linked with the movement of the windward bubble. The gas in the main nozzle continues to rise during the early stages of the expansion phase of the windward bubble, reaches a maximum value (see D ) and then starts to fall. The fall of the gas height becomes more rapid after the beginning of the collapse stage (see E ). The gas level in the main nozzle continued to fall until the pinch off.
80 59 Figure 2-17: Evolution of gas volume in X and Y direction during the bubble formation process from two side-holes at a gas flow rate of 826 cm 3 /s and liquid flow rate of 255 cm 3 /s. The time history of bubble coordinates for the novel nozzle at the highest liquid flow rate is depicted in Figure The plot shows that the gas rises in the main nozzle for about 4 ms before reaching the side-holes (see A ). This time is approximately 50% longer than that at the lowest liquid flow rate. The windward bubble undergoes the expansion stage, which ends around 7 ms (see B ), which is a shorter time interval compared to that at the lowest flow rate, as discussed earlier. The collapse stage is relatively short (see C ) and then the horizontal position remains almost constant for about 4 ms. The vertical movement of the gas in the main nozzles show a relatively different trend compared to that at the lowest flow rate. The gas level continues to rise until the end of
81 60 the collapse stage (see D ) and stays almost constant for about 2 ms. Note that the continues rise of the gas level during the collapse stage is due to the strong pushback by the liquid drag which causes the gas to expand vertically up against the hydrostatic force as discussed earlier. The vertical level of the gas then drops sharply from F and continues until almost the pinch-off ( G ). The leeward bubble shows a similar trend i.e. the continuous growth until the pinch-off at about 13 ms. Figure 2-18: Evolution of gas volume in X and Y direction during the bubble formation process from two side-holes at a gas flow rate of 826 cm 3 /s and liquid flow rate of 535 cm 3 /s.
82 Four side-holes configuration In the preceding section, the influence of two side-holes in a standard nozzle, on the bubble formation and detachment was investigated in detail. The results show that a nozzle with two side-holes produces more bubble with small size compared to the standard nozzle particularly at low GLRs. In this section, the influence of four side-holes nozzle is investigated. Two different configurations were considered. In the first configuration, hereinafter referred to as Configuration B, four side holes 90 o apart were created in a brass tube. The distance of these holes from the nozzle rim was constant and same as that considered for two side-holes nozzle (1.6 mm) (see Figure 2-19(a)). In the second configuration, hereinafter referred to as Configuration C, two opposite side-holes were at a distance of 0.8 mm from the rim and the other two holes were at a distance of 2.1 mm from the rim (see Figure 2-19(b)). For Configuration B, two different side-hole diameters were considered which were 0.5 mm and 0.82 mm. For Configuration C, the side-hole diameter was set at 0.5 mm. Furthermore, for Configuration C, two orientations of the nozzle were considered. In the first orientation (I), the upper side-holes (0.8 mm from the nozzle rim) were aligned with the liquid flow direction and in the second orientation (II), the nozzle was rotated by 90 o, thus, the lower side-holes (2.1 mm from the nozzle rim) were aligned with the liquid flow direction. All nozzles were made from brass tube with the inner diameter of 0.82 mm and outer diameter of 1.62 mm (same as those used earlier for two side-holes and standard configurations). The procedure, instrumentation and operating conditions in this set of experiments were same as those for the two side-holes nozzle.
83 62 D o D o DN h s D s hu D s hd DN t t (a) (b) Figure 2-19: Four side-holes nozzle configurations used in the study. (a) Regular four side-holes, Configuration B. (b) Four side-holes with different distance between holes, Configuration C. h s =1.6mm, h u =0.8 mm, h s =2.1mm. Figures 2-20 and 2-21 show the influence of the four side-holes nozzle design and its orientation on the bubble detachment frequency and the bubble size as a function of liquid velocity at a given gas velocity, respectively. The results from the standard nozzle are also plotted for comparison. Similar to the two side-holes nozzle, the results illustrate that the four side-holes nozzle significantly improves the bubble detachment frequency and decreases bubble size. As mentioned earlier, for the standard nozzle with an increase in liquid velocity, the bubble detachment frequency increases. Whereas, for the four sideholes nozzle, the liquid velocity has a weak effect on both the bubble detachment frequency and the bubble size. As shown in figures, at the lowest liquid velocity, four side-holes nozzles have the bubble detachment frequency 2 times higher and the bubble size about 30% smaller than that of the standard nozzle at low liquid velocities. This effect reduces with an increase in the liquid velocity, however, at the maximum liquid velocity, the four side-holes nozzle still shows relatively higher bubble detachment frequency and smaller bubble size compared to the standard nozzle. Similar to the two
84 63 side-holes nozzle, the results show that the side-hole diameter has an influence on the bubble detachment frequency. It is observed that with an increase in the size of the sidehole, the bubble detachment frequency increases and the bubble size decreases. The influence of the gas flow rate on the bubble detachment frequency and bubble size in four side-holes nozzles at a given liquid velocity was also investigated. The results (not shown here) indicate a trend similar to that observed for the two side-holes nozzles. That is, the bubble detachment frequency and bubble size increased with an increase in the gas velocity but at any given gas velocity, the bubble detachment frequency was greater and bubble size was smaller than that for the standard nozzle. Figure 2-20: Bubble detachment frequency (f B ) versus average liquid velocity (V L ) at a gas flow rate of (cm 3 /s). Error bars (based on the standard error of the mean) are smaller than the size of the symbols.
85 64 Figure 2-21: Bubble diameter (D B ) versus average liquid velocity (V L ) at a gas flow rate of (cm 3 /s). Error bars (based on the standard error of the mean) are smaller than the size of the symbols. Figure 2-22 compares the bubble detachment frequency from two side-holes and four side-holes nozzles for all common cases in a non-dimensional form. The overall trend is the same as expected i.e. the Strouhal number increased with GLR. The results also did not show a distinct difference in the bubble detachment frequency from the four sideholes and two side-holes nozzles for the given range of GLR as well as the side-hole diameter. The normalized bubble diameter for the same cases is presented in Figure Again, the results did not indicate any clear difference among the nozzles. These results indicate that for the given range of GLR and the nozzle dimensions, the performance of two side-holes and four side-holes nozzles is very similar. There are several parameters involved in the process which include the main nozzle and side-hole diameters, distance of the side-hole from the nozzle rim, side-holes orientation relative to the liquid flow,
86 65 GLR, contact angle, etc. Variation in one or more of these parameters may distinguish the performances of two and four side-holes nozzles. Such investigation is beyond the scope of the present work. Nevertheless, the results presented in this study clearly demonstrate that the presence of side-holes in the nozzle significantly improves its performance compared to the standard nozzle, particularly at low GLRs. Figure 2-22: Strouhal number (St) versus GLR. Error bars (based on the standard error of the mean) are smaller than the size of the symbols.
87 66 Figure 2-23: Mean bubble diameter to inner nozzle diameter ratio (D B /D N ) versus GLR. Error bars (based on the standard error of the mean) are smaller than the size of the symbols. 2.4 Conclusion An experimental study was conducted to investigate the bubble formation from a novel nozzle design in a liquid cross-flow over a range of gas-to-liquid flow rate ratios that varied from to Different configurations (number, size and location of side holes) and orientations of the novel nozzle design were considered. High speed imaging with back-lit shadowgraphy was used to image the bubble formation process. An in-house algorithm was used to detect bubbles and compute various characteristics. The results show that smaller bubbles at higher detachment frequency are generated from the
88 67 novel nozzle for all configurations and orientations considered, compared to the standard nozzle over the given range of GLRs. The results also showed that unlike the standard nozzle in which both the bubble diameter and the detachment frequency are heavily dependent on the liquid velocity, for the novel nozzle, both of these parameters were almost independent of the liquid velocity. It is observed that the detachment frequency increased with an increase in the gas velocity for all nozzle configurations and orientations. It is found that in comparison with the standard nozzle, the two and four side-holes nozzles generated bubbles 30% smaller in size at a detachment frequency 2-3 times higher than that of the standard nozzle at low liquid velocities. The results also indicated that for a given range of GLRs and the nozzle configurations and orientations, the performance of two side-holes and four side-holes nozzles is very similar. The indepth investigation of the bubble formation process in the novel nozzle subjected to liquid cross-flow was conducted in a glass nozzle for better visual access. It is observed that the rebound of the bubble from a size hole under the influence of liquid drag force and hydrostatic pressure plays a key role in the early bubble detachment. It is concluded that the novel nozzle design in the liquid cross-flow exhibits significantly better performance compared to the standard nozzle especially at low GLRs.
89 References [1] Lefebvre, A. H., "Atomization and Sprays" Combustion: An International Series CRC, Boca Raton, FL, [2] Roesler, T. C., Lefebvre, A. H., "Photographic studies on aerated-liquid atomization, combustion fundamentals and applications", Proceedings of the Meeting of the Central States Section of the Combustion Institute, Indianapolis, Indiana, Paper 3, [3] Campbell C. M., Mougeot E., "Creation and characterization of aerated food products", Trans in Food Science & Technology, 1999: 10, [4] Bai, H., Thomas, B. G., "Bubble formation during horizontal gas injection into downward-flowing liquid", Metallurgical Material Transaction 2001: B 32, [5] Marshall, S. H., "Air bubble formation from an orifice with liquid cross-flow", Ph.D. thesis, University of Sydney, Australia, [6] Deckwer, W. D.,"Bubble column reactors", Wiley, [7] Kim, J., Lee, C., and Chang, I., "Effect of pump shear on the performance of a crossflow membrane bioreactor", Water Research, 2001: 35, [8] Forrester, S. E., Rielly, C. D., "Bubble formation from cylindrical, flat and concave sections exposed to a strong liquid cross-flow", Chemical Engineering Science, 1998: 53, [9] Loubiere, K., Castaignede, V., Hebrard, G., Roustan, M., "Bubble formation at flexible orifice with liquid cross-flow", Chemical Engineering Science, 2004: 43, [10] Tan, R.B.H., Chen, W.B., Tan, K.H., "A non-spherical model for bubble formation with liquid cross-flow", Chemical Engineering Science, 2003: 58(1),
90 69 [11] Ghosh, A. K. and Ulbrecht, J. J., "Bubble formation from a sparger in polymer solutions II. Moving liquid", Chemical Engineering Science, 1989: 44, [12] Oguz, H. N. and Prosperetti, A., "Dynamics of bubble growth and detachment from a needle", Journal of Fluid Mechanics 1993: 257, [13] Maier, C. G., "Producing small bubbles of gas in liquids by submerged orifices", U.S. Bureau of Mines Bulletin, 1927: 260, [14] Tsuge, H., Tanaka, Y., Terasaka, K., Matsue, H., "Bubble formation inflowing liquid under reduced gravity", Chemical Engineering Science, 1997: 52, [15] Sovani, S.D., "High pressure gas-liquid Flow inside an effervescent diesel injector and its affect on spray characteristics", Ph.D. Thesis, Purdue University, West Lafayette, IN, [16] Silberman, E., "Production of bubbles by the disintegration of gas jets in liquids", Proceedings of the 5 th Midwestern Conference on Fluid Mechanics, 1957: [17] Lorcher, M., Schmidt, F., Mewes, D., "Flow field and phase distribution inside effervescent Atomizers", 9 th International Conference on Liquid Atomization and Spray Systems, ICLASS, Sorrento, Italy, [18] Nahra, H. K., Kamotani, Y., "Bubble formation from wall orifice in liquid crossflow under low gravity", Chemical Engineering Science, 2000: 55, [19] Siddiqui, K., Chishty, A., "The influence of channel orientation and flow rates on the bubble formation in a liquid cross-flow", (American Society of Mechanical Engineers) ASME rd Joint US-European Fluids Engineering Summer Meeting and 8th International Conference on Nanochannels, Microchannels, and Minichannels, Montreal, Canada. [20] Nabavi, M., Siddiqui, K., Chishty, W. A., "3D Simulation of the bubble formation from a submerged orifice in liquid cross-flow", (American Society of Mechanical Engineers) ASME 2009 Fluids Engineering Division Summer Meeting, Colorado, USA.
91 70 [21] Ghaemi, S., Rahimi, P., Nobes, S., "The effect of gas-injector location on bubble formation in liquid cross-flow", Physics of Fluids, 2010: 22, , [22] Iguchi, M., Terauchi, Y., Yokoya, S., "Effect of cross-flow on the frequency of bubble formation from a single-hole nozzle", Metallurgical and Materials Transactions B, 1998: 29B, [23] Tsuge, H., Hibino, S., "Bubble formation from an orifice submerged in liquids", Chemical Engineering Communications, 1983: 22, [24] Nahra, H. K., Kamotani, Y., "Prediction of bubble diameter at detachment from a wall orifice in liquid cross-flow under reduced and normal gravity conditions", Chemical Engineering Science, 2003: 58, [25] Gadallah, A. H., Siddiqui, K., "A Novel Nozzle Design for Reducing Bubble Size Generated in Stagnant Liquid", (American Society of Mechanical Engineers) ASME 2013 Fluids Engineering Summer Meeting, FEDSM2013, July 7-11, 2013, Incline Village, Nevada.
92 71 Chapter 3 3 Investigation of two-phase flow in an effervescent atomizer 3.1 Introduction Several industrial processes require dispersion of liquid into small droplets and/or spray in a gaseous atmosphere. The spray applications have a wide range depending on the desired velocity and droplet size distribution, which in turn is related to a specific range of gas and liquid flow rates and a particular application. These applications include combustion [1], chemical industry [2, 3], spray painting [4] and various pharmaceutical, agricultural and spray drying. Several spray devices have been developed as atomizers. One atomization techniques based on the aerated-liquid atomization is called effervescent atomization, which is used in a number of applications such as gas turbines [5, 6], internal combustion engines [7], furnaces and burners [8], and pharmaceutical sprays [9, 10]. Effervescent atomizer is a twin-fluid atomizer in which gas is injected into a liquid stream resulting in a two-phase bubble-liquid flow inside the atomizer. As this two-phase mixture exits through the orifice, the bubbles expand due to the pressure drop and the coexiting liquid forms ligaments. These ligaments, due to the further bubble expansion along with the liquid velocity, break into small droplets [1]. The nature of the internal two-phase flow plays an important role in the atomization process and hence, the performance of an effervescent atomizer could be optimized by controlling the characteristics of the internal two-phase flow. The main components of an effervescent atomizer are gas and liquid inlets, a mixing chamber and an exit orifice. The bubble formation mode in the aeration zone of the atomizer is heavily dependent on the gas-toliquid flow rates ratio (GLR). At low GLR, the formation mode is bubbly, which changes to jetting with an increase in the GLR, In the bubbly mode, each bubble has enough time
93 72 to become mature and detach from the injection hole while, in the jetting mode a gas jet is ejected into the liquid stream, which may breakup into bubbles further downstream [8, 11]. The internal gas-liquid flow in the mixing chamber of an atomizer has been classified into three main categories; bubbly flow, slug flow and annular flow [12-15]. At low GLR, the bubbly flow is present, which changes to the slug flow and then to the annular flow as the GLR continues to increase. In the bubbly flow, the liquid is the continuous phase whereas the gas forms the discrete phase, i.e. bubbles are dispersed and surrounded by liquid. With an increase in the GLR, the bubbly flow transforms into slug flow in which the size of bubble reaches the mixing chamber inner diameter. With a further increase in GLR, the internal flow changes to the annular flow in which gas flows in the center of mixing chamber surrounded by an annular film of liquid on the mixing chamber wall. The slug flow, due to the presence of larger bubbles approaching the exit orifice, causes significant spray pulsation and unsteadiness [16, 17]. The annular flow produces the smallest size of spray droplets compared to the other internal flow regimes [15]. However, its drawback is the requirement of the large volume of pressurized gas [13, 18] and also an unstable internal two-phase flow [15, 19]. As mentioned earlier, the behavior of the two-phase flow inside the atomizer influences the spray characteristics. Thus, the understanding of the flow regime inside the atomizer is crucial to improve the spray quality. The spray characteristics are dependent on the physical properties of gas and liquid [20, 21], operating conditions or GLR [15, 20, 22-24] shape, location and size of the aerator holes [8] and atomizer internal geometry [15, 20, 25]. A detailed review of the effervescent atomizer performance has been presented by Sovani et al. [26] for a wide range of operating conditions, liquid properties and atomizer design. Several studies have reported a decrease in the mean droplet size with an increase in the GLR [15, 20, 23, 24, 27-32]. The inherent unsteady nature of the effervescent atomization process, which is an undesirable feature, needs to be minimized. It has been reported that this unsteadiness is strongly linked to the atomizer s internal two-phase flow [20]. Luong [31] and Jedelsky
94 73 et al. [33, 34] studied the influence of operating conditions on the spray unsteadiness and observed higher spray unsteadiness when the nozzle operated in the slug flow regime, and lower spray unsteadiness when the internal two-phase flow is either bubbly or annular. Gadgil et al. [35] observed the occurrence of single- and two-phase flows intermittently inside the orifice at low airflow rates. They also concluded that these intermittent flow structures have a strong influence on the spray unsteadiness. Huang et al. [15] experimentally investigated the influences of gas and liquid flow rates on the internal two-phase flow and spray droplet size in an outside-in effervescent atomizer. They used high-speed imaging technique to characterize the two-phase internal flow and LDV/PDA system to characterize the spray droplets. They found that an increase in the water flow rate and/or decrease in the operating pressure (lower gas flow rate), increases the droplet mean diameter and decreases the mean droplet velocity. Jedelsky et al. [36] found that the droplet size and velocity of the spray are dependent on the fluid injection pressure and GLR. They also observed that an increase in the pressure and/or GLR, decreases the droplet Sauter Mean Diameter (SMD). They also found that at the edge of spray, the droplets have higher SMD and lower velocity. They also reported that the droplet velocity distribution has a symmetric log-normal distribution at the center of the spray. Gomez et al. [37] conducted an experimental study using a horizontal gasliquid spray nozzle. They observed that with an increase in the GLR, the droplet velocity increases and the unimodal droplet velocity distribution become more flat. Whereas, an increase in the liquid flow rate results in a narrow velocity distribution. Jedelsky et al. [20] experimentally studied the impact of various internal geometric parameters and operating conditions on the spray droplet size in an outside-in effervescent atomizer. They performed the spray measurement using PDPA at the axial distance of 150 mm from the exit orifice which is a distance recommended in the previous studies [28, 38], as the spray becomes fully developed at 150 mm. They observed that in a mixing chamber with a single row of aeration holes, an increase in the relative length ratio of the mixing zone (the distance between the last row of the aeration holes and the exit orifice to the inner diameter of the mixing chamber) from 2.5 to 4.6, results in the smaller droplet size. This dependency decreases with an increase in the
95 74 number of aeration hole rows, and for the case of five rows of aeration holes, they did not observe any distinct trend. They argued that since larger number of aeration holes provides almost well mixed two-phase flow inside the mixing zone, longer mixing zone may not have considerable effect on the development of the two-phase flow. Their results also indicated higher spray unsteadiness in the longer mixing zone. They also observed that the best atomization occurred for five rows of aeration holes with a 3.5 relative length ratio of the mixing zone. Jedelsky et al. [39] investigated the effect of mixing zone length on the spray droplet velocity at different radial distances from the center of the spray. They considered four different lengths of the mixing zone and observed that along the radial length (except at the spray centre), shortest mixing zone has overall largest spray velocity magnitudes (relative length ratio of 2.4). For the two middle mixing zone lengths (relative length ratios of 3.8 and 5.9), the radial distribution of the spray velocity magnitudes was almost identical. The longest mixing zone (relative length ratio of 7.4) has almost the same velocity distribution as the two middle cases except at the spray center. At the spray center, the three shorter mixing zones have the same spray velocity magnitude and the longest mixing zone has smaller spray velocity. Mostafa et al. [29] experimentally investigated the effect of internal geometries and GLR of the effervescent atomizer on the spray droplet size. They conducted experiments using an inside-out effervescent atomizer. They found that the droplets size increased with the radial distance from the spray center and that trend increased with a decrease in the mixing zone length. They also observed that away from the spray center, the droplet size decreased with an increase in the mixing zone length. However, near and at the spray center, the droplets size is almost the same for different mixing zone lengths but showed the opposite trend i.e. a slight increase in the droplets size with an increase in the mixing zone length. Liu et al. [40, 41] experimentally studied the effect of different internal geometric parameters of an outside-in effervescent atomizer as well as the influence of operating conditions on the spray unsteadiness and droplet size and velocity. Liu et al. [40]
96 75 observed that at low GLR, the effect of mixing zone length on the spray unsteadiness is negligible while at higher GLR, longer mixing zone length shows relatively lower spray unsteadiness, which is not in agreement with Jedelsky et al. [25, 42]. They argued that this disagreement could be due to the differences in the operating conditions and the system design. They also investigated the effect of two different lengths of the mixing zone at a GLR of 0.1 and found that shorter mixing zone results in the smaller spray droplet with higher velocity but observed higher spray unsteadiness at the center of the spray. Liu et al. [41] conducted experiments at a GLR of 0.15 and also found that the mixing zone length has almost negligible effect on the overall radial distribution of the droplet size and velocity. While, in the central region of the spray, they observed that the longer mixing zone length provides larger size of droplets with lower velocity. However, Mostafa et al. [29] and Jedelsky et al. [39] show the strong dependency of the radial distribution of the droplet size and velocity on the mixing zone length and Sher et al. [43] argued that the optimum length of mixing zone for the atomization relies on the GLR. The previous studies showed that gas and liquid flow rates, fluid pressure and the atomizer design strongly influence the internal flow behavior and the spray characteristics. The atomizer internal flow behavior has also been found to influence the spray characteristics. There are relatively few studies that investigated the internal flow behavior and its impact on the spray characteristics. The focus of the present research is to conduct a detailed investigation of the two-phase flow in different zones of an insideout effervescent atomizer which has a flexible internal geometry. The high speed imaging technique allowed us to investigate the two-phase flow inside the aeration and mixing zones. This contributed to a better understanding of the process of bubble formation, their movement and/or coalescence in the aeration zone, which is not well-reported in the literature. Also there is a scarcity of detailed investigation of the internal annular flow unsteadiness inside both aeration and mixing zones. In the present study, a detailed investigation of the influence of different geometric and operating parameters on the internal and external flow behavior in an effervescent atomizer has been conducted.
97 Experimental setup and techniques Effervescent atomizer An effervescent atomizer has been designed and fabricated. It has full optical access, which enabled direct visualization of the two-phase flow inside the atomizer. Figure 3-1 shows the schematic of the atomizer, which is comprised of gas and liquid inlets, atomizer body, an aerator tube, and an exit orifice. The atomizer body was made of 3 mm thick acrylic tube with the inner diameter of 9.6 mm. An aerator tube was inserted inside the atomizer body, which allowed the gas to exit from the aerator holes and generate bubbles in the annular region where the liquid was flowing (i.e. an inside-out effervescent configuration). The annular region was 1.6 mm thick. The bubbles generated through the aerator holes, travel downstream with the liquid cross-flow into the mixing zone. This bubble-liquid mixture then passed through a 90 o convergent section and exited through the bottom orifice to produce spray. The diameter and length of the bottom orifice were 1.27 mm and 6.35 mm, respectively (see Appendix A for the detailed drawings of the atomizer). Since the atomizer body has circular cross-section, any attempt to directly image the flow would result in significant image distortion. To offset the atomizer body s curvature effect, it was placed inside a 1.5 mm thick square acrylic tube 25.4 mm 25.4 mm in cross-section. The space between the atomizer tube and the square channel was filled with water to compensate for the image distortion. The lower portion of the mixing zone and the convergent section was machined directly into an acrylic block with square crosssection. The designed effervescent atomizer has the flexibility to replace the aerator tube as well as vary its position inside the atomizer body, which in turn allows changing the length of the mixing zone.
98 77 Figure 3-1: Schematic of the effervescent atomizer used in the study (not to scale) Aerator tubes In the present study, four different aerator tube configurations were considered to investigate the effect of vertical distance between aeration holes as well as the end-shape of the tube. In the first case, the aerator tube has two columns of aerator holes (9 in each column), 180 degrees apart. Two sets of aerator tubes of this configuration were built; one with the distance of 4 mm between the holes (hereinafter referred to as AR-4) and in
) and other with a conical base (see")
99 78 the other with the distance of 8 mm between the holes (hereinafter referred to as AR-8), see Figures 3-2 (a) and (b), respectively. For the second case that was focused on investigating the effect of end-shape of the tube, two aerator tubes were built; one with the flat base (see Figure 3-2(c)) and other with a conical base (see Figure 3-2(d)). Both of these aerator tubes have four columns of aerator holes, 90 degrees apart. The holes were offset by 4 mm in adjacent columns. All four configurations of the aerator tubes were made from brass tube with inner diameter of 5.3 mm, the outer diameter of 6.3 mm and the holes diameter of 0.52 mm. (a) (b) (C) (d) Figure 3-2: Schematic of the aerator tubes configurations used in the study, (a) with 4 mm distance between holes (b) 8 mm distance between holes. Aerator tube of identical hole configuration with (c) conical base and (d) flat base.
100 Experimental setup The schematic of the experimental setup used in this study along with its photograph are shown in Figure 3-3. The atomizer was mounted on a stand made from steel bars. Water and air were used as liquid and gas phases, respectively. A rotameter (FL-4205, Omega Engineering) which was installed upstream of the inlet valve of the atomizer was used to control and measure the water flow rate. Compressed air from the main supply line was used as the supply air. To avoid pressure fluctuations and maintain a uniform air pressure at the atomizer inlet, the air from the main supply line first passed through a settling chamber to dampen any line pressure fluctuations, and then through a narrow tube to the atomizer. The air flow rate was controlled and measured by a rotameter (FL-1448-G, Omega Engineering) installed upstream of the atomizer (see Figure 3-3). The uncertainties in liquid and gas flow rates based on the rotameters used were ±0.03 and ±0.035 lpm, respectively. Pressure gauges were mounted downstream of the respective rotameters to monitor the inlet pressures of water and air Visualization and measurement technique Internal flow The optical access into the atomizer allowed the visualization of internal two-phase flow. A high speed imaging system was used to capture the images of flow regime inside the atomizer. It comprised of high-speed cameras (Photron SA5) with 60 mm lenses. The imaging system was connected to a PC and controlled via Photron FASTCAM Viewer software. To improve the image quality, back-lit shadowgraphy technique was used, which was comprised of a 500W halogen lamp and a diffusion screen which was placed behind the atomizer (see Figure 3-3). For the experiments focused on the distance between the aerator holes (AR-4 and AR-8), the liquid flow rate ranged from to lpm and the gas flow rate ranged from 0.6 to 3.5 lpm. The gas-to-liquid flow rates ratio (GLR) ranged from 0.53 to 5.84 Whereas for the rest of the configurations, the liquid flow rate ranged from to lpm and the gas flow rate ranged from 0.6 to 4.82 lpm (GLR ranged from 0.53 to 9.55). For all configurations, images were
101 80 captured at a rate of 20,000 frames per second at each GLR. At this frame rate, the resolution of the camera was For the set of experiments focused on the investigation of bubble formation at the aerator tube, two high speed cameras were used that were placed 90 degrees apart to capture the three-dimensional extent of the bubbles (see Figure 3-3(b)). Both cameras were synchronized to ensure simultaneous recording of the bubble movement. For the rest of experiments, one camera was used (see Figure 3-3(c)). An In-house algorithm was developed in the Matlab environment to measure the size of each bubble and compute bubble size distribution. The uncertainty of detecting the bubble boundaries was within ±1 pixels which correspond to the uncertainty of ±0.09 mm External flow (Spray) To capture the images of the spray droplets, the same imaging system was used. However, a 12X zoom lens was used instead of the 60 mm lens. The field of view for the droplet measurements was set to 143 pixel 255 pixel corresponding to 3.1 mm 5.6 mm. The camera frame rate was set at 150,000 frames per second. Due to a smaller field of view and higher frame rate, a continuous Diode-Pumped Solid-State laser (LRS-0532, Laser Glow Technologies) was used as a light source for back-lit shadowgraphy. The laser output was connected to a conical lens via a fibre optic cable, which produced a light cone. The measurements were made at an axial location of 150 mm downstream from the exit orifice, where the spray was fully developed [20]. At each GLR, to break any interference effects in the spray and randomize the spray pattern, 10 sets of measurements were made at different times. In each set, 5000 spray images were captured. An in-house algorithm in the Matlab environment was used for droplet detection and quantification. The code automatically detects and tracks spray droplets and computes various droplet characteristics such as the droplet cross-sectional area, perimeter and corresponding equivalent diameter, and velocity. The uncertainty of detecting the droplets was within ±2 pixels which correspond to the uncertainty of ±0.04 mm.
")
102 81 (a) (b)
103 82 (C) Figure 3-3: (a) Schematic and (b) Photograph of the experimental setup using two cameras. (c) Photograph of the experimental setup using one camera.
104 Results and Discussion Internal flow In this section, the impact of aerator tube configurations and mixing zone length, on the two-phase flow behavior inside the effervescent atomizer at different GLRs are presented and discussed Aeration zone The aeration zone comprised of the annular region from the most upstream aeration hole to the end of the aerator tube. As mentioned earlier, two cameras were used to image the bubble movement from the aeration holes. These cameras were positioned in a way that one camera was capturing the bubble images from a side view while the other camera was capturing the images of the same bubbles from the plan view. Figure 3-4 (a) shows an image sequence of bubble formation from the aeration holes and their advection in the annular region of the atomizer from a side view at the lowest GLR of The process corresponds to the bubble formation in a liquid cross-flow. The image sequence corresponds to a complete cycle from one bubble detachment to the next from the most upstream aeration hole. The plan view of the same image sequence acquired from the second camera is shown in Figure 3-4 (b). The downward movement of the bubbles is influenced by several force components which are (i) liquid pressure drag force from the top, (iii) liquid skin friction drag from the sides, (iii) skin friction drag due to the aerator exterior surface and the atomizer body inner surface, and (iv) buoyancy force. Any changes in these force components affect the local advection velocity of the bubbles. The bubbles formed from the most upstream aeration hole are generally distinct. They typically start to move with a relatively constant velocity. However, as they advect downward, another bubble is formed from the same aeration hole upstream. The low-pressure wake formed by the earlier (downstream) bubble, increases the velocity of the new (upstream) bubble. Furthermore, when the bubble passes over a downstream aeration hole, it may interact and coalesce with the bubble forming from that hole or the gas may be inject directly into that bubble. In either
105 84 case, the bubble size grows. It should be noted that the vertical extent of the bubbles was limited due to the fixed thickness of the annular region of the aeration zone and hence the only growth option was in the lateral as well as streamwise directions. The images in Figure 3-4(b) confirm that the bubble size continued to increase in the lateral-streamwise plane in the downstream direction. As the bubble grows in the lateral-streamwise plane, the magnitudes of all force components increase, which cause a reduction in the advection velocity of the bubble (likely due to the relatively larger increase in the buoyancy and surface friction drag). These processes continue as the chain of bubbles advects downward, and as a result, the distance between the bubbles continues to decrease and eventually, the bubbles start to interact with each other and cause further bubble coalescence. The interaction and coalescence of the bubbles is evident in Figure 3-4. The images also show some meandering of the bubble chain, which is likely due to the change in the liquid flow conditions due to bubble growth. At the end of the aerator tube, these bubbles enter the mixing zone.
. (a) Side view (b) Plan view.")
106 85 Figure 3-4: Image sequences showing the bubble formation from AR-4 at a GLR of 0.53 ( t=0.45 ms). (a) Side view (b) Plan view.
107 86 The effect of the distance between aeration holes is shown in Figure 3-5 at three different GLRs. The results illustrate that at a given GLR, larger bubbles are present when the distance between the aeration holes was large. This could be due to the reason that the length of the aeration zone at the end of the aerator tube is larger for the AR-8 case (72 mm) compared to that for the AR-4 case (40 mm). Therefore, the hydrostatic pressure upstream of the aeration zone is higher for the AR-4 and hence, the liquid drag force on the bubble formed at the upstream holes in AR-4 would be higher than that for the AR-8. This would result in higher net downward force that would cause higher bubble advection velocity. This was further confirmed by a detailed visual inspection of the image sequences that show relatively higher bubble advection velocities for AR-4. The higher advection velocity and shorter distance of the aeration zone do not allow much time for bubbles to grow and undergo multiple coalescence before exiting the aeration zone. This phenomenon is clearly visible in the images at the low GLR. An increase in GLR (i.e. an increase in the gas flow rate and/or a decrease in the liquid flow rate) increases the bubble size and the chances of bubble coalescence further increases regardless of the holes distance. Thus, the effect of the aeration-hole distance on the bubble coalescence decreases, which is evident in the images at the high GLR.
 Plan view. The dashed line indicates the location of the aeration holes.")
108 87 Figure 3-5: Effect of distance between holes at three different GLRs, (a) Side view (b) Plan view. The dashed line indicates the location of the aeration holes.
109 Transition from aeration zone to the mixing zone The image sequences in Figure 3-6 illustrate the transition of bubbles from the aeration zone to the mixing zone over a range of GLRs. Figure 3-6(a) shows the process at the lowest GLR of As discussed earlier, at low GLR, smaller bubbles are generated in the aeration zone which then enter the mixing zone. As mentioned in the Experimental setup section, the standard aerator tube has a flat base, which causes a flow separation leading to the formation of a large separation bubble in the wake region. As the figure shows, the bubbles generated in the aeration zone are relatively small and hence when they enter the mixing zone, they interact with the separation bubble. Such interaction could take various forms, which are (i) causing the separation bubble to meander, (ii) coalescence of smaller bubbles with the separation bubble, (iii) collision of the smaller bubbles with the separation bubble without coalescence (iv) coalescence of smaller bubbles and the interaction of coalesced bubble with the separation bubble, and (v) deformation and breakup of the separation bubble. These forms are clearly evident in Figure 3-6(a). As the GLR increased, relatively larger bubbles are formed in the aeration zone. These bubbles interacted with the separation bubble as they entered the mixing zone. Similar interactions as mentioned above are also observed but the extent is different since the gas flow is relatively large compared to that of the liquid flow. With a further increase in GLR, the bubble size further increased and stronger interaction with the separation bubble is observed which caused its breakdown. At the highest GLR, the flow is almost annular and hence a continuous gas core is established in the middle of the mixing zone. The results in Figure 3-6(d) also indicate the unsteadiness of the annular flow in the mixing zone. This could be due to the reason that in the annular flow, gas core occupies the major portion of the cross-sectional area of the mixing zone that leads to a reduction in the liquid velocity and an increase in the upstream liquid pressure. The reduction in the liquid velocity influences the bubble formation mode in the aeration zone i.e. the slug bubble formation that creates unsteadiness in the mixing zone. The upstream pressure buildup after certain magnitude pushes the liquid flow down that changes the bubble formation from slug to smaller bubbles that restores the smooth annular flow. Huang et
![89 al. [15] also reported unsteadiness in the annular flow regime in an effervescent atomizer. Otahal et al.](/docs-images/83/88586250/images/110-0.jpg "[19] also reported similar behavior and classified them as either (i) classical annular flow with middle air core and smooth interface or (ii) churn flow with wavy interface.")
110 89 al. [15] also reported unsteadiness in the annular flow regime in an effervescent atomizer. Otahal et al. [19] also reported similar behavior and classified them as either (i) classical annular flow with middle air core and smooth interface or (ii) churn flow with wavy interface. The analysis of the data showed that this unsteadiness occurs frequently and causes instability in the spray.

111 90

112 91 Figure 3-6: Image sequences showing the transition from aeration zone to the mixing zone. (a) GLR=0.53, t=22.2 ms), (b) GLR=0.79, t=20 ms), (c) GLR=3.17, ( t=16.5 ms), (d) GLR=9.55, ( t=5 ms) Flow dynamics inside the mixing zone The effect of GLR on the two-phase flow inside the mixing zone for the standard aerator tube is shown in Figure 3-7. The results show that an increase in the GLR changes the flow regime inside the mixing zone. At low GLR, the regime is bubbly flow, which then changes to the slug flow and then to the annular flow as GLR continues to increase due to an increase in the gas flow rate or decrease in liquid flow rate. The bubbly flow was observed at GLRs of 0.53, which at GLR of 3.17, transformed into the slug flow where big bubbles of almost the same size as the inner diameter of the atomizer body were present. At GLR of 9.55, the internal flow changed to the annular flow in which gas flow was observed in the center and an annular liquid flow on the mixing chamber wall.
113 92 The above results provide a qualitative comparison and a clear perception about the nature of the two-phase flow and the associated flow regimes in the mixing zone. For a better comparison, the results are quantified in terms of the bubble size distribution under various regimes. As mentioned earlier in the experimental setup section, an in-house code was used for this purpose. The code provided the information about the vertical extent of each bubble, which is considered as the characteristic size of the bubbles. The bubble size distributions in the mixing zone for the same conditions as in Figure 3-7(a), are presented in Figure 3-7(b) in the form of Probability Density Function (PDF). The results show that at low GLR, the bubble size is distributed in a narrow band, implying more uniformity in the bubble size. Note that the distribution tail on the right side is associated with the separation bubbles present in the mixing zone as mentioned in the previous section. Note that at the GLR of 0.53, the long annular separation bubble was neglected in the bubble size distribution since it could significantly bias the statistical results of bubble size in the mixing zone. The results also show that with an increase in the GLR, the size distribution bandwidth became wider and also the distribution peak shifted towards right. At the highest GLR, the flow was annular and hence the bubble size corresponds to the height of the annular bubbles. Figure 3-7(c) shows the mean bubble diameter (D B ) as a function GLR for the same cases as in Figures 3-7(a) and (b). The results show that the mean bubble diameter increased with an increase in the GLR, as expected. The increase in the bubble diameter from GLR of 0.53 to 3.17 is gradual i.e. bubbly flow regime to slug flow regime. However, with a further increase of the GLR from 3.17 to 9.55 the mean bubble diameter increased sharply due to the formation of slug and annular flow inside the mixing zone. As illustrated in Figure 3-7(c), the bubble diameter inside the mixing zone increased by 46% as the GLR increased from 0.53 to 3.17.
114 93 GLR 0.53 GLR 3.17 GLR 9.55 (a) (b)
115 Mean bubble diametre (mm) mm GLR (c) Figure 3-7: Effect of different GLRs on the two-phase flow behavior inside the mixing zone. The mixing zone length is 52 mm. The aerator tube is the standard tube. (a) The images of internal two-phase flow at different GLRs (b) Probability Density Functions of the bubble diameter (D B ). (c) Mean bubble diameter versus GLR. Error bars (based on the standard error of the mean) are smaller than the size of the symbols Effect of the aerator tube end shape As shown earlier in Figure 3-6, the standard aerator tube with the flat-base, induces a separation bubble whose size is influenced by the GLR, the size of bubbles exiting the aeration zone and the local interactions of these bubbles with the wake. This separation bubble has a direct impact on the bubble-liquid mixture in the mixing zone, which in turn affects the spray behavior. The impact of the aerator tube base shape on the bubble-liquid mixture in the mixing zone was investigated for two configurations of the aerator tube geometry. In the first configuration standard aerator tube with the flat-base (as discussed
116 95 earlier) was considered while in the second configuration, a cone was added to the bottom end of the aerator tube to eliminate the wake formation and hence the separation bubble. Figure 3-8 presents images illustrating the two-phase flow inside the mixing zone for the two aerator tube base configurations at three different GLRs. At the lowest GLR (0.53) for the standard case, the wake induced a large separation bubble immediately downstream of the bottom end of the aerator tube (see Figure 3-8(a)). This separation bubble often detaches from the tube end (as seen earlier in Figure 3-6) and advects into the mixing zone. This separation bubble as it advects into the mixing zone, normally deforms and interacts with the bubbles entering the mixing zone from the aeration zone. These interactions contribute to the non-uniformity of the bubble size as well as the flow unsteadiness in the mixing zone (see Figure 3-6). However, when the conical insert was attached to the bottom face of the aerator tube, it streamlined the flow and hence the wake formation was suppressed, thus, no separation bubble was formed. This resulted in more bubble size uniformity and flow steadiness (see Figure 3-8(a)). As the GLR increased, for the standard aerator tube, larger bubbles are formed in the aeration zone that have stronger interaction with the separation bubble that often led to the breakdown of the separation bubble. However, with the conical-base aerator tube, no such interaction was present and the only interaction was among the bubbles entering the mixing zone from the aeration zone (see Figure 3-8(b)). The overall size of the bubbles in the mixing zone is relatively large, as expected due to the increase in the bubble size with GLR in the aeration zone. Although the number of bubbles in the mixing zone reduced, the bubble size uniformity is still better for the conical-base case. At the highest GLR, the flow typically becomes annular in the aeration zone, i.e. the gas occupies most of the flow region and the liquid flow is mainly restricted to the outer surface as thin liquid film [15]. As a result, the aerator tube end normally lies in the gas flow and hence, the effect of the tube-end shape becomes almost irrelevant to the flow regime inside the mixing zone (see Figure 3-8(c)). It should also be noted that the presence of the cone reduces the early coalescence of bubbles as they enter the mixing zone. The results in Figure 3-8 are presented for three GLRs which depict different flow regimes, and compared the two aerator configurations. The results show that for all flow regimes, the new aerator base
.")
117 96 configuration with a conical bottom maintained smaller bubbles and bubble size uniformity. The blunt edge at the bottom end of the standard aerator causes the formation of the separation bubble immediately downstream of the aerator tube in the mixing zone (see Figure 3-8). A detailed inspection of the image sequences also revealed that at certain GLRs, the separation bubble often stretches more than half way through the mixing zone, which is likely due to the skin friction drag induced by the liquid flow and the surface tension force. Often this big bubble detaches from the end of the tube and flows downward through the mixing chamber and significantly affects the flow uniformity in the mixing zone and leads to the spray unsteadiness. The results in Figure 3-8 show that for all flow regimes, the new aerator configuration with a conical base maintained smaller bubbles and bubble size uniformity. Low GLR 0.53 Medium GLR 3.17 High GLR 9.55 without cone with cone without cone with cone without cone with cone (a) (b) (c) Figure 3-8: Effect of aerator tube base configuration on the flow behavior inside the atomizer at different GLRs. The length of the mixing zone is 52 mm.
118 97 The effect of aerator tube base configuration on the bubble size distribution is shown in Figure 3-9 at two GLRs (0.53 and 3.17). At low GLR (Figure 3-9(a)), the results show that the bubble size distribution has a narrower band with the conical-base aerator compared to the standard flat base aerator. It is also observed that in the presence of the conical-base, the bubble diameter ranged from 0.5 mm to 4.5 mm while for the flat-base, the bubble diameter ranged from 1 mm to 6.5 mm (see Figure 3-9(a)). The overall mean diameter of bubbles for the conical-base is 2.3 mm which is about 20% smaller than the mean bubble diameter of 2.9 mm for the flat-base (see Figure 3-9(a)). These results indicate that the aerator tube with the conical-base generates more uniform bubbles, smaller in size compared to the standard flat-base aerator particularly in the low GLR range. As the GLR increased (see Figure 3-9(b)), the effect of cone decreased as discussed earlier, however, the cone prevented the formation of very large bubbles in the mixing zone. These large bubbles for the flat-base are most likely associated with the stronger interaction of the separation bubble with the bubbles entering from the aeration zone that increased coalescence and more frequent breakdown of the separation bubble. The results at this GLR also show that for the conical-base case, the bubble diameter ranged from 1 mm to 6 mm while the flat-base case, the bubble diameter ranged from 1 mm to 13 mm. Figure 3-9(c) shows the mean bubble size for the conical-base aerator tube and the standard aerator tube with the flat-base. It is observed that the conical-base case generates smaller bubble size for all the GLRs. It is observed that at these GLRs, the bubble size in the presence of a conical-base aerator tube is on average, 11% smaller than that for the flat-base aerator tube.
119 98 (a) (b)
120 99 Mean bubble diameter (mm) GLR with cone without cone (c) Figure 3-9: Effect of the aerator tube with and without cone on the bubble size. (a), (b) Probability Density Function (PDF) of the bubble diameter (D B ) at GLR=0.53 and GLR=3.17, respectively. (c) Mean bubble diameter versus GLR. Error bars (based on the standard error of the mean) are smaller than the size of the symbols Effect of the mixing zone length The effect of mixing zone length on the bubble-liquid flow behavior inside the mixing zone is depicted in Figure 3-10 for three mixing zone lengths (32 mm, 52 mm and 75 mm) at three different GLRs. The images show that a decrease in the length of the mixing zone resulted in smaller bubble with more uniformity inside the mixing chamber. The presence of smaller bubble is likely due to the reason that the long mixing zones increase the chances of bubbles coalescence, which form large bubbles [39]. Furthermore, due to the randomness of the coalescence occurrence, the long mixing zones also contribute to the non-uniformity in the bubble size. Hence, shorter mixing zone could generate steady

 and")

121 100 spray at GLRs higher than that for the longer mixing zones. For instance, the results show that the flow regime inside the 75 mm long mixing zone became slug flow at the medium GLR of 3.17, while at the same GLR, the flow in a 32 mm mixing zone shows almost bubbly flow (see Figure 3-10 (a) and (b)). The results show that at high GLR, flow inside the 75 mm mixing zone becomes unsteady while the lower mixing zone length still shows relatively stable behavior. Low GLR 0.53 Medium GLR 3.17 High GLR 9.55 (a) (b) (C) Figure 3-10: Effect of mixing zone length on the flow behavior in the mixing zone at different GLRs. (a) GLR=0.53, (b) GLR=3.17, (c) GLR=9.55.
122 101 The bubble size distribution for different mixing zone lengths is shown in Figure 3-11(a) and (b) at GLRs of 0.53 and 3.17, respectively. At the low GLR (Figure 3-11(a)), the results show a clear effect of mixing zone length on the bubble size distribution. It is observed that for the shortest mixing zone, the bubble size distribution is relatively narrow banded and the bandwidth increased with an increase in the mixing zone length and shifted towards the right. Bubble size ranged from mm, mm and mm for 32 mm, 52 mm and 75 mm mixing zone lengths, respectively. At the higher GLR (Figure 3-11(b)), the effect of mixing zone length becomes less significant for longer mixing zones. Bubble size ranged from mm, mm and mm for 32 mm, 52 mm and 75 mm mixing zone lengths, respectively. Figure 3-11(c) shows the mean bubble size for the three mixing zone lengths at different GLRs. It is observed that for the mixing zone with 32 mm length, bubble diameter has a linear relation with the GLR which becomes nonlinear at larger mixing zone lengths. The results show that at the GLRs of 0.53 and 3.17, the average bubble size in 32 mm long mixing zone is 32% smaller than that in the 75 mm mixing zone External flow (Spray) In the preceding section, the effects of various parameters on the bubble-liquid two-phase flow inside the effervescent atomizer are presented and discussed. The variation in the internal two-phase flow has an impact on the spray characteristics. In this section, the effect of the change in the two-phase flow behavior due to the variation in the GLR, aerator tube configuration and mixing zone length, on the spray characteristics are presented and discussed.
123 102 (a) (b)
124 Mean bubble diameter (mm) mm 52 mm 32 mm GLR (c) Figure 3-11: Effect of different mixing zone lengths on the bubble size (a), (b) Probability Density Function (PDF) of the bubble diameter (D B ) at GLR=0.53 and GLR=3.17, respectively. (c) Mean bubble diameter versus GLR. Error bars are smaller than the size of bullets Effect of GLR As Figure 3-7(a) shows, GLR has an impact on the bubble-liquid two-phase flow inside the atomizer. It is observed that as the GLR increases, the bubble-liquid mixture mode changes from bubbly to slug to annular. In the bubbly flow mode, the bubbles inside the mixing zone are smaller and relatively uniform in size. With an increase in GLR, the bubbles become larger and their size distribution becomes wider (see Figures 3-7 (b) and (c)). Figure 3-12 shows the spray characteristics (i.e. the droplet size and droplet velocity distributions) correspond to the internal flow cases shown in Figures 3-7(a) and (b). Figure 3-12(a) shows the mean diameter of the spray droplets. As mentioned earlier in the experimental setup section, the spray measurements were made at a distance of 150
125 104 mm from the exit orifice, where the spray was fully developed [20]. The droplet size distribution is relatively wider at the low GLR, which becomes narrower with an increase in the GLR. The results also show that at higher GLR, the spray has more number of smaller droplets. This trend is consistent with previous studies that showed that the overall droplet size decreases with an increase in the GLR [15, 20, 24, 28-31]. As earlier results show, the internal flow at high GLR is annular which implies that in the mixing zone, the gas flow covers almost the entire cross-sectional area with the liquid flow in the form of film along the mixing zone wall. In such case, the droplet formation is almost in a continuous mode. The higher amount of gas flow allows better atomization [15]. However, the downside of operating at high GLRs under annular flow mode is that the atomizer needs significantly large flow rate of pressurized gas, which could be an issue in various applications [1, 27, 31]. Similarly, at high GLR, the liquid flow rate is relatively very low and hence the delivery of required amount of liquid droplets may be an issue. At low GLR, the flow regime inside the mixing zone is the bubbly flow. When this flow exits the orifice, the individual bubbles shatter and form the liquid droplets [1]. Any spatial gap between the two bubbles filled with liquid and hence, between the two consecutive bubble shattering, pure liquid discharges from the orifice, which results in larger droplets or liquid ligaments. If the time difference between the two bubbles shattering is large, it also causes pulsation and instability in the near-field spray [35]. Furthermore, with an increase in the GLR, the bubble coalescence increases and the slug bubbles are formed in which the difference in the size of approaching bubbles to the exit orifice also results in pulsation in the spray [16, 34]. Figure 3-12(b) shows the corresponding droplet velocity distribution. As the figure shows, the velocity distribution is unimodal, which is consistent with previous studies [36, 37]. The results show that the velocity distribution is narrow-banded at the low GLR and becomes wider with an increase in the GLR. This trend is consistent with [36]. The peak velocity magnitude does not show a specific trend over the given GLR range [37].
126 Effect of cone The results in the preceding section show that the flat-end aerator tube causes the flow separation and forms a separation bubble, which affects the bubble dynamics in the mixing zone, particularly at low GLRs. It has also been shown that by adding a conical base to the aerator tube, the flow separation and hence the separation bubble is suppressed which resulted in more uniform bubble size distribution. Figure 3-13(a) shows the droplet size distribution for the low GLR of 0.53 with and without the cone (corresponding to the same case as for the internal flow shown in Figure 3-9(a)). The figure show that the conical base of the aerator tube results in a slightly larger number of smaller droplets as well as slightly narrower distribution. The distributions at the higher GLRs (not shown here) indicate that the droplet size distribution with and without cone remains relatively similar however, the aerator with the flat base generated slightly larger number of smaller droplets. Figure 3-13(b) summarizes the results in the form of mean droplet diameter. It is observed that at low GLR, the conical base caused a reduction in the mean droplet size, which as discussed earlier, could be due to the suppression of the separation bubble and relatively uniform bubble distribution inside the mixing zone. At higher GLRs, the mean droplet diameter was found to be smaller for the flat-base aerator tube case. As shown earlier, with an increase in the GLR, the liquid flow rate decreases and hence the flow separation effect becomes insignificant. Figure 3-14(a) shows the distribution of droplet velocity for the GLR of 0.53 with and without the cone. The results show that the droplet velocity distribution is relatively narrow-banded without the cone. It is also observed that velocity distribution with the cone is shifted to the right indicating that the droplet velocities are relatively higher in this case. At higher GLRs (not shown here) the droplet velocity distributions with and without cone were similar with a slight shift of velocity distribution to the right in the presence of cone. Figure 3-14(b) summarizes the results in the form of mean droplet velocity. The mean droplet velocity is normalized by V La, where V La is the liquid velocity in the liquid inlet of the atomizer. The results show very similar trend for the cases with and without the cone but the normalized droplet velocity magnitude is slightly higher in the presence of the conical-base aerator tube.
127 106 (a) (b) Figure 3-12: Probability Density Function (PDF) of (a) the droplet diameter (D p ) and (b) droplet velocity (V p ) at different GLRs. The mixing zone length is 52mm.
128 Mean droplet diameter (mm) 107 (a) effect of cone with cone 52 without cone GLR (b) Figure 3-13: Effect of the aerator tube with and without cone on the droplet diameter (D p ) in form of (a) Probability Density Function (PDF) at GLR=0.53. (b) Mean droplet diameter versus GLR. The mixing zone length is 52mm. Error bars (based on the standard error of the mean) are smaller than the size of the symbols.
129 108 (a) V p /V La effect of cone GLR 52 with cone 52 without cone (b) Figure 3-14: Effect of the aerator tube with and without cone on the droplet velocity in the form of (a) Probability Density Function (PDF) at GLR=0.53. (b) Normalized droplet velocity (V p /V La ) versus GLR. The mixing zone length is 52mm. Error bars (based on the standard error of the mean) are smaller than the size of the symbols.
130 Effect of mixing zone length The influence of mixing zone length on the internal bubble-liquid two-phase flow is presented in Figures 3-10 and As discussed earlier, at low GLR, the bubble size is relatively small and uniform in the shorter mixing zone and an increase in the mixing zone length severely affects the mixing of the bubbly flow due to the increases in the bubble coalescence [39]. Figure 3-15(a) shows the droplet size distribution for the lowest GLR of 0.53 for the three mixing zone lengths. The results show that the number of smaller droplets is largest for the shortest mixing zone length, which decreases with an increase in the mixing zone length. The rest of the distributions are almost identical for all cases. As the GLR increases to 3.17, the two-phase flow inside the 52 mm and 75 mm length shows the slug flow and almost similar bubble size distribution (see Figures 3-10 and 3-11(a) and (b)). This effect is manifested in the droplet size distribution for that GLR in Figure 3-15(a). Figure 3-15(b) shows the mean droplet diameter for different mixing zone lengths over a range of GLRs. At the low GLR, there is a decreasing trend of droplet diameter with a decrease in the mixing zone length however, the trend changes with an increase in the GLR. At the medium GLR, the two-phase flow inside the 52 mm and 75 mm long mixing zones shows the slug flow which resulted in the larger and almost same mean bubble size (see Figure 3-11(c)). Similar effect is observed in the spray droplet size as well. At the high GLR, the mean droplet size for the 32 mm and 52 mm mixing zones were almost the same while the 75 mm mixing zone has larger mean droplet size. As mentioned earlier, at this GLR, the flow for all three mixing length cases was annular and hence, the impact of bubble size was irrelevant. The larger droplet size observed in 75 mm mixing zone length is likely due to the unsteadiness of the internal flow as discussed earlier.
131 110 (a) (b) Figure 3-15: Effect of the different mixing zone length on the droplet diameter in the form of (a) Probability Density Function (PDF) at GLR=0.53 (b) Mean droplet diameter versus GLR. The aerator tube has the conical base. Error bars (based on the standard error of the mean) are smaller than the size of the symbols.
132 111 The distribution of droplet velocity for three mixing zone length at the GLR of 0.53 is shown in Figure 3-16(a). The results show variation in the distribution however, the distribution trends are not monotonic. The droplet velocity distribution trends for the shortest and longest mixing zones are very similar with the exception that the velocity distribution for the shortest mixing zone is slightly sifted towards right i.e. slightly larger velocity. The middle mixing zone showed relatively larger droplet velocity and relatively wider distribution. Figure 3-16(b) shows the normalized droplet velocity for different mixing zone lengths at various GLRs. The results show an increase in the droplet velocity with GLR for all cases. The comparison among different cases shows very similar trends with slightly lower velocity for 75 mm long mixing zone. These results indicate that the mixing zone length does not have a distinct impact on the droplet velocity. The variations observed in the magnitudes for different mixing zone lengths could be due to experimental uncertainties or the spray unsteadiness. As mentioned in the literatures, Jedelsky et al. [39] observed that at the spray center, the three shorter mixing zones have the same spray velocity magnitude and the longest mixing zone has smaller spray velocity. Liu et al. [40] also observed that at the central region of the spray, the length of mixing zone has small effect on the droplet velocity. However, the longer mixing zone length provides lower droplets velocity.
133 112 (a) V p /V La Effect of length GLR 32 mm 52 mm 75 mm (b) Figure 3-16: Effect of the different mixing zone length on the droplet velocity in the form of (a) Probability Density Function (PDF) at GLR=0.53, (b) Normalized droplet velocity (V p /V La ) versus GLR. The aerator tube has the conical base. Error bars (based on the standard error of the mean) are smaller than the size of the symbols.
134 Conclusion An experimental study was conducted to investigate the effect of atomizer internal geometry on the internal and external two-phase flows in an effervescent atomizer using high-speed imaging system. The bubble formation process and the impact of the distance between holes inside the aeration zone were investigated. The results illustrate that at a given GLR, larger bubbles are present when the distance between the aeration holes was large. The impact of the aerator tube configurations and mixing zone length on the twophase flow regime, the size of bubbles inside the mixing zone and the spray droplet characteristics at different GLRs was also studied. It was observed that an increase in the GLR leads to transition the internal two-phase flow from bubbly to slug and then to annular flow. In addition, the results illustrated a reduction in the spray droplet size with an increase in GLR. The results also show that the droplet velocity distribution is narrow banded at the low GLR and becomes wider with an increase in the GLR and the normalized droplet velocity increases with an increase in the GLR. It was observed that the end-shape of the aerator tube has an impact on the two-phase flow behavior in the atomizer. An aerator tube with the conical end-base was manufactured and tested. The results show that the separation bubble at the trailing edge is suppressed by this configuration and results in more uniform and smaller bubbles compared to the standard aerator tube with flat base. It was observed that at low GLR, the conical base caused a reduction in the mean droplet size. While, at higher GLRs, the mean droplet size was found to be smaller for the flat-base aerator tube case. This is likely due to the reason that with an increase in the GLR, the liquid flow rate decreases and hence the flow separation effect becomes negligible. So the effect of conical base is significant on the internal flow and it improves the atomization when the internal twophase comprised of the bubbly flow. The results of the mean droplet velocity for the aerator with and without conical base show very similar trends for both cases, but the normalized droplet velocity magnitude is slightly higher in the presence of the conicalbase aerator tube.
135 114 The length of the mixing zone was found to have an impact on the bubble size distribution inside the mixing zone. The results show that shorter mixing zone length generates more uniform and smaller bubbles. This is likely due to the reason that the shorter mixing zones support the suppression of the bubble coalescence. It was observed that smaller mean droplet size is produced with shorter mixing zone at low GLRs when the internal flow is in the bubbly regime. It was also illustrated that the longest mixing chamber (75 mm) results in larger droplet size compared to the other mixing zone lengths (32 mm and 52 mm). The results of the normalized droplet velocity for different mixing zone lengths show very similar trend for all cases. However, the normalized droplet velocity is slightly lower for the longest mixing zone. It is concluded that a conical-base aerator tube and a reduction in the mixing zone length results in an improvement of the spray steadiness and the atomization process.
136 References [1] Lefebvre, A. H., "Atomization and Sprays" New York, Hemisphere, [2] Chamberlin, R. R., Skarman, J. S., "Chemical spray deposition process for inorganic films " Journal of the Electrochemical Society, 1966: 113(1), [3] Deckwer, W. D., "Bubble Column Reactors", Wiley, [4] Hines, R. L., "Electrostatic atomization and spray painting", Journal of Applied Physics, 1966: 37(1), [5] Wang, X. F., Chin, J. S., Lefebvre, A. H., "Influence of gas injector geometry on atomization performance of aerated-liquid nozzles" International Journal of Turbo & Jet- Engines, 1989: 6, [6] Chin, J. S., Lefebvre, A. H., "A design procedure for effervescent atomizers" Journal of Engineering Gas Turbines Power, 1995: 117, [7] Rehman, S., Zaidi, K., "Design and Fabrication of the High Pressure Effervescent Spray Combustion System ", International Journal of Advance Research and Innovation, 2014: 1, [8] Sovani, S. D., Chou, E., Sojka P. E., Gore, J. P., Eckerle, W. A., Crofts, J. D., "High pressure effervescent atomization: Effect of ambient pressure on spray Cone Angles" Fuel, 2000: 80, [9] Petersen, F. J., Worts, O., Schaefer, T., Sojka, P. E., "Effervescent atomization of aqueous polymer solutions and dispersions." Pharmaceutical Development Technology, 2001: 6, [10] Petersen, F. J., Worts, O., Schaefer, T., Sojka, P. E., "Design and atomization properties for an inside-out type effervescent atomizer", Drug Development and Industrial Pharmacy, 2004: 30(3),
137 116 [11] Sen, D., Balzen, M. A., Nobes, D. S., "Bubble formation and flow instability in an effervescent atomizer", Journal of Visualisation, 2014, 17, [12] Kleinstreuer, C., "Two-phase flow theory and application" New York: Taylor & Francis, [13] Konstantinov, D., Marsh R., Bowen P., Crayford A., "Effervescent atomization for industrial energy-technology review" Atomization and Sprays, 2010, 20(6), [14] Kim, J. Y., Lee S. Y., "Dependence of spraying performance on the internal flow pattern in effervescent atomizers" Atomization and Sprays, 2001: 11, [15] Huang, X., Wang, X., Liao, G., "Visualization of two phase flow inside an effervescent atomizer" Journal of Visualization, 2008: 11, [16] Chen, S. K., Lefebvre, A. H., Rollbuhler, J., "Influence of ambient air pressure on effervescent atomization", Journal of Propulsion and Power, 1993: 9(1), [17] Lecuona, A., Sosa, P. A., Rodriguez, P. A., Zequeira, R. A., "Volumetric characterization of dispersed two phase flows by digital image analysis", Measurement Science and Technology, 2000: 11, ,. Accessed 11 Jan [18] Lefebvre, H., "Some recent developments in twin-fluid atomization" Particle and Particle System Characterization, 1996: 13, [19] Otahal, J., Hampel, U., Schleicher, E., Jicha, M., "Two-phase flow characteristics in the mixing chamber of the effervescent atomizer", (Institute for Liquid Atomization and Spray Systems) ILASS08-1-9, Como Lake, Italy, [20] Jedelsky, J., Jicha, M., Slama, J., Otahal, J., "Development of an Effervescent Atomizer for Industrial Burners" Energy Fuels, 2009: 23, [21] Lund, M. T., Jian, C. Q., Sojka, P. E., Gore, J. P., Panchagnula, M. V., "The influence of atomizing gas molecular weight on low mass flow rate effervescent
138 117 atomization", (American Society of Mechanical Engineers) ASME Journal of Fluids Engineering, [22] Lorcher, M., Schmidt, F., Mewes, D., "Flow field and phase distribution inside effervescent atomizers" 9th International Conference on Liquid Atomization and Spray Systems, ICLASS, Sorrento, Italy, [23] Ochowiak, M., Broniarz-Press L., "Atomization performance of effervescent atomizers with gas-liquid internal mixing", Polish Journal of Chemical Technology, 2008: 10(3), [24] Jedelsky, J. and Jicha, M., "Novel modifications of twin-fluid atomizers: Performance, advantages and drawbacks", (Institute for Liquid Atomization and Spray Systems) ILASS Europe 2010, 23 rd Annual Conference on Liquid Atomization and Spray Systems, Brno, Czech Republic, September [25] Jedelsky, J., Jicha, M., Slama, J., Otahal, J., "Influence of some geometrical parameters on the characteristics of effervescent atomization", (Institute for Liquid Atomization and Spray Systems) ILASS, Zaragoza, [26] Sovani, S. D., Sojka, P. E., Lefebvre, A. H., "Effervescent Atomization." Progress in Energy and Combustion Science, 2001: 27, [27] Whitlow, J. D., Lefebvre, A. H., "Effervescent atomizer operation and spray characteristics", Atomization and Sprays, 2008: 3, [28] Huang, X., Wang, X. S., Liao, G. X., "Characterization of an effervescent atomization water mist nozzle and its fire suppression tests", Proceeding of the Combustion Institute, [29] Mostafa, A., Fouad, M., Enayet, M., Osman, S., "Measurements of spray characteristics produced by effervescent atomizers", Presented at the AIAA/ASME/SAE/ASEE Joint Propulsion Conference and Exhibit, July 11-14, 2004, Fort Lauderdale, Florida.
139 118 [30] Ghaemi S., "Investigation of effervescent atomization using laser-based measurement techniques", Thesis in University of Alberta, [31] Luong, J. T. K., "Unsteadiness in effervescent sprays" Atomization and Sprays, 1999: 9, [32] Qian, L. J., Lin, J. Z., Xiong, H. B., "Modeling of non-newtonian suspension plasma spraying in an inductively coupled plasma torch", International Journal of Thermal Science, 2011: 50, [33] Jedelsky, J., Jicha, M., "Effervescent atomizer-temporal and spatial variations of spray structure." Proceedings 10 th International Congress on Liquid Atomization and Spray Systems ICLASS, 1-8, International Standard Book Number, ISBN , [34] Jedelsky, J., Jicha, M., "Unsteadiness in effervescent sprays: A new evaluation method and the influence of operational conditions." Atomization and Sprays, 2008: 1, [35] Gadgil, H. P., Raghunandan, B. N., " Some features of spray breakup in effervescent atomizers" Experiment in Fluids, 2011: 50, [36] Jedelsky, J., Jisha, M., Slama, J., "Characteristics and behaviour of multi-hole effervescent atomizers", 19 th (Institute for Liquid Atomization and Spray Systems) ILASS-Europe , 2004, Nottingham, United Kingdom. [37] Gomez, J., Fleck B., Olfert J., McMillan J., " Characterization of a horizontal twophase spray from an effervescent atomizer", ILASS-Europe 2010, 23 rd Annual conference on Liquid Atomization and Spray Systems, Brno, Czech republic, September [38] Sutherland, J. J., Sojka, P. E. and Plesniak M. W., "Entrainment by ligamentcontrolled Effervescent atomizer-produce spray", International Journal of Multiphase Flow, 1997: 23, no. 5,
140 119 [39] Jedelsky, J., Landsmann, M., Jicha, M., Kuritka, I., "Effervescent atomizer: influence of operation conditions and internal geometry on spray structure; study using PIV-PLIF", (Institute for Liquid Atomization and Spray Systems) ILASS08, 2008, [40] Liu, M., Duan, Y., Zhang, T., "Evaluation of effervescent atomizer internal design on the spray unsteadiness using a Phase/Doppler Particle analyzer", Experimental Thermal and Fluid Science, 2010: 34, [41] Liu, M., Duan, Y., Zhang, T., Xu, Y., "Evaluation of unsteadiness in effervescent atomizer sprays by analysis of droplet arrival statistics-the influence fluids properties and atomizer internal design", Experimental Thermal and Fluid Science, 2011:35, [42] Jedelsky, J., Beinstein, Z., Jicha, M., "Unsteadiness in effervescent sprays: influence of operational conditions and atomizer design", in 11 th Triennial International Annual Conference on Liquid Atomization and Spray Systems, Vail, Colorado USA, [43] Sher, E., Koren, M., Katoshewski, D., Kholmer, V., "Energy Consideration and Experimental Study of Effervescent Atomizers", Proc. (Institute for Liquid Atomization and Spray Systems) ILASS-Europe 2000, Sep 11-13, Darmstadt, Germany.
141 120 Chapter 4 4 Effect of bubble breaker on the effervescent atomization process 4.1 Introduction One type of the twin-fluid atomizers is the effervescent atomizer, which through the bubbling of gas into the liquid stream substantially improves the atomization process in terms of the finer spray [1]. The spray applications are fully dependent on the desired spray velocity and droplet size, where for each application and a specific range of operating conditions, a particular spray mechanism is suitable. To design an atomizer, the spray droplet size is a crucial parameter. To produce fine spray, the effervescent atomization technique is used in several applications such as gas turbines [2, 3], internal combustion engines [4], furnaces and burners [5], and pharmaceutical sprays [6]. The main components of an effervescent atomizer are gas and liquid inlets, a mixing chamber and an exit orifice. The injection of gas into the liquid stream through the holes in the aerator tube forms bubbles in the liquid stream [7, 8]. The gas-liquid mixture flows downstream and then exits from the orifice. Due to a high-pressure drop at the exit orifice, the gas expands suddenly and forms small droplets [8]. The internal two-phase flow plays a significant role in the performance of the atomizer in terms of spray properties [9]. Gas-liquid flow inside the effervescent atomizer and the exit orifice has been categorized into three flow regimes; bubbly flow, slug flow and annular flow [7, 10, 11]. Gas injection and bubble formation from the aerator tube as well as bubble dynamics in the mixing zone affect the bubble size as they move towards the exit orifice [12]. From the mixing zone, bubbles reach the convergent section, where the bubbly flow accelerates and the pressure reduces. A reduction in the pressure results in the bubble expansion [13-
142 121 15]. The length to diameter ratio (l/d) of the exit orifice may cause further fragmentation of bubbles [13]. Gas and liquid flow rate or gas to liquid flow rates ratio (GLR) influence the bubble formation from the aeration holes. With an increase in the gas flow rate, bubble formation from the inlet holes changes from the bubbly mode to the jetting mode [4], while the flow inside the mixing zone changes from the bubbly flow to the annular flow [12, 16, 17]. GLR also plays an important role in the spray mean droplets size [7, 8, 16, 18-21], where the latter decreases with an increase in GLR [8, 16, 18-21]. The bubbly flow is present at low GLR, and with an increase in the GLR, the bubbly flow changes to the slug flow and then to the annular flow. In the bubbly flow, the liquid and gas are the continuous and discrete phases, respectively, i.e. bubbles are dispersed in the liquid stream. As the GLR increases, the bubbly flow transforms into the slug flow. In the slug flow regime, the size of bubble reaches the mixing chamber inner diameter. When the GLR further increases, the internal flow changes to the annular flow. In the annular flow regime, the gas flows in the center of mixing chamber surrounded by an annular film of liquid on the mixing chamber wall. The slug flow causes significant spray pulsation and unsteadiness due to the presence of larger bubbles approaching the exit orifice. The bubbly flow has been reported to produce a steady spray [16]. The annular flow inside the mixing chamber produces small-size droplets compared to the other two flow regimes [1, 16]. However, the generation of annular flow requires a high gas flow rate, which may be an issue in some applications. Since the gas phase is a crucial parameter to produce fine spray, the bubbles size inside the mixing zone and bubble distribution approaching the exit orifice have a significant effect on the spray droplet size [21]. One of the most important spray characteristics is droplet size which is dependent on the atomizer internal geometry [19, 22-25] and operating condition [16, 18-21, 24, 25]. An experimental study to evaluate the influence of operational conditions and several geometric parameters on the droplet size in the effervescent atomizer spray has been conducted by Jedelsky et al. [19]. The size and number of aerator holes, their location,
143 122 and the diameter of the mixing chamber were the parameters considered by the study. They reported that smaller aeration holes in larger numbers led to a decrease in the spray droplet size. The influence of internal gas-liquid flow on the axial mean velocity and size of the spray droplets was experimentally investigated by Huang et al. [16] who used high-speed imaging technique to characterize the two-phase internal flow and LDV/PDA system to characterize the spray droplets. They observed an increase in the droplet mean diameter and a decrease in the mean droplet velocity with an increase in the liquid flow rate. The flow regime inside the exit orifice plays an important role in the stability of the spray. Maldonado et al. [26] observed better spray stability with a bubbly flow inside the exit orifice compared to an intermittent flow of gas-liquid. Sen et al. [15] experimentally investigated the injection of gas into the liquid cross-flow inside a horizontal effervescent atomizer. They used flow visualization to study the bubble formation and breakup inside the atomizer. They found that the choking of the exit orifice by large bubbles generates a pressure pulse towards the upstream flow and concluded that the generated pressure pulse results in the breakup of the gas jet in the mixing chamber and causes fragmentation and deformation of the bubbles approaching the exit orifice. As mentioned earlier, the bubbly flow approaching the exit orifice is crucial for atomization and spray steadiness. To produce small-size bubbles at a given GLR, an easier way is to retain the bubbly flow inside the mixing chamber by bubble fragmentation (breakup) mechanism. The bubble fragmentation or breakup is a process by which a bubble splits into two or more bubbles i.e. the disintegration of a large bubble into smaller bubbles. Surface tension always acts to maintain the bubble-liquid interface stable while the shear forces (disruptive force) acts to destroy it. Once the shear forces become large enough, the surface tension is not able to retain the bubble-liquid interface stable and the breakup occurs [27]. There are different processes that cause the bubble breakup, which include breakup in stagnant flow or turbulent flow, breakup due to the resonance, velocity gradients, shock or sound waves, electrical forces or impingement effect [28]. Jagannathan et al. [29] experimentally studied the effect of ultrasound on the bubble disintegration inside a horizontal effervescent atomizer using high-speed imaging. They
144 123 observed that the acoustic pressure difference results in the change of bubble shape from spherical to ellipsoid. The bubble then elongates and a ligament shape is formed which further breaks into smaller bubbles to maintain the surface tension. They reported the breakup of bubbles from 5-10 mm range into 2 mm or less, depending on the ultrasonic power input. They concluded that the ultrasound is an effective way to produce small bubbles. Bubble breakers in which the bubbles are forced to divide into two or more bubbles have been used in different devices such as effervescent atomizers [11, 21, 24] and chemical bubble column reactors [30-32] to produce uniform small-size bubbles. Bubble column reactors in which bubbles are disintegrated by a perforated sheet inside the column has been investigated previously [30-32] and has been found as an effective way to break bubbles. Ghaemi et al. [33] experimentally investigated the effect of aeration system on the flow inside and outside an effervescent atomizer. The first aeration system was an aerator tube with multi injection hole and the other was a porous media. They found that at the same GLR, the bubble size approaching the exit orifice decreases in the presence of the porous media, which results in a more steady spray with slightly smaller droplet size compared to the multi-hole injector. Gomez et al. [21] experimentally studied the impact of GLR and bubble breaker on the internal flow and spray in a horizontal effervescent atomizer using shadowgraphy. They also performed the experiments using two metal plates with different sizes of holes located upstream of the mixing chamber. They found that the bubble breaker produces finer bubbles inside the atomizer. They concluded that at a constant GLR, smaller bubble size leads to the generation of small droplets due to an increase in the void fraction. They also found that an increase in GLR decreases the droplet size. They also observed better performance of atomizer using a bubble breaker, which results in smaller droplet size at higher GLR compared to the atomization without a bubble breaker. They indicated that the size of the bubble breaker orifice affects the bubble size inside the mixing chamber. They observed that the smaller hole diameter of the bubble breaker results in smaller bubble size at higher GLR however, the bubble sizes were comparable for both size of bubble breakers at low GLR. Mostafa et al. [24]
145 124 experimentally investigated the effect of effervescent atomizer internal geometries and GLR on the spray droplet size. They conducted their experiment using an inside-out effervescent atomizer. They reported that the spray droplet size depends on the GLR, which decreases with an increase in the GLR. They also investigate the effect of a perforated insert on the droplet size and velocity, over a range of GLR from 0.1 to 0.6 and found that the perforated plate results in a reduction in the droplet size and an increase in the droplet velocity. Sutherland et al. [11] used a perforated sheet inside an effervescent atomizer at a GLR of about 0.02 and found that the perforated sheet leads to smaller droplet size. As the above literature review shows, the performance of an Effervescent atomizer is dependent on the nature of the two-phase flow inside the atomizer. The bubbly flow inside the atomizer has been reported to provide spray steadiness, while slug flow contributes to the pulsation and unsteadiness in the spray. Bubble breakers are effective devices to break large bubbles into smaller ones. The bubble breakers used previously in the effervescent atomizer are porous media and perforated inserts. The present study is focused on investigating the influence of a new type of bubble breaker in an effervescent atomizer. The specific focus will be on the effect of bubble breaker and its various configurations, on the internal two-phase flow and the spray characteristics over a range GLRs. 4.2 Experimental setup and techniques Effervescent atomizer An effervescent atomizer with full optical access was designed and fabricated for this study, which enabled direct visualization of the two-phase flow inside the atomizer. The atomizer comprised of gas and liquid inlets, atomizer body, an aerator tube, and an exit orifice, as shown schematically in Figure 4-1. The atomizer body was made of 3 mm thick acrylic tube with the inner diameter of 9.6 mm. The configuration of the Effervescent atomizer was inside-out, i.e., an aerator tube was placed inside the atomizer
146 125 body, which allowed the gas to exit from the aerator holes and generate bubbles in the annular region (1.6 mm thick) where the liquid was flowing. The bubbles generated through the aerator holes, travel downstream with the liquid cross-flow into the mixing zone. This bubble-liquid mixture then passed through a 90 o convergent section and exited through the bottom orifice to produce spray. The diameter and length of the bottom orifice were 1.27 mm and 6.35 mm, respectively (see Appendix A for the detailed drawings of the atomizer). Due to the circular cross-section of the atomizer body, direct imaging of the flow would result in significant image distortion. Thus, the atomizer was placed inside a 1.5 mm thick square acrylic tube 25.4 mm 25.4 mm in cross-section to offset atomizer body s curvature effect. To compensate for the image distortion, the space between the atomizer tube and the square channel was filled with water. The lower portion of the mixing zone and the convergent section were machined directly into an acrylic block with square cross-section. The designed effervescent atomizer has the flexibility to replace the aerator tube as well as vary its position inside the atomizer body, which in turn allows changing the length of the mixing zone Aerator tube In the present study, the aerator tube with multi holes was considered to investigate the effect of bubble breakers. The aerator tube was built with a conical base. It has four columns of aerator holes, 90 degrees apart. The holes were offset by 4 mm in adjacent columns. The aerator tube was made from brass tube with inner diameter of 5.3 mm, the outer diameter of 6.3 mm and the holes diameter of 0.52 mm.
147 Figure 4-1: Schematic of the effervescent atomizer used in the study (not to scale). 126
148 Bubble breakers To improve the size and distribution of the bubbles approaching the exit orifice, bubble breakers were used inside the mixing zone upstream of the exit orifice. Five bubble breaker inserts with different hole configurations were considered which allowed to investigate the impact of the size and number of holes on the bubbles fragmentation and consequently the spray quality. All breakers were made from acrylic and have a cylindrical shape with the outer diameter and length of 9.5 mm and 10 mm, respectively. The effect of the size of the breaker hole on the bubble fragmentation was investigated for breaker with a single-hole at the center. Three breakers of this configuration were built with the hole-diameter of 2 mm, 3.18 mm and 5 mm, (see Figure 4-2(a)). For the investigation of the impact of number of holes, three breakers were considered with one, three and five holes with the hole-diameter of 3.18 mm, 1.83 mm and 1.42 mm, respectively (see Figure 4-2(b)). Note that, the total flow area for each of these breakers were the same (see Appendix B for the detailed drawings of bubble breakers). (a) Figure 4-2: Schematic of the bubble breaker used in the study (a) Single-hole bubble breakers, (b) Multi-hole bubble breakers. (b)
149 Experimental setup Figure 4-3 shows the schematic and photograph of the experimental setup used in this study. The atomizer was mounted on a stand made from steel bars. In the present study, water and air were used as liquid and gas phases, respectively. The flow rate of water was measured and controlled by a rotameter (FL-4205, Omega Engineering) which was installed upstream of the inlet valve of the atomizer. Compressed air from the main supply line was used as the supply air. To avoid pressure fluctuations and maintain a uniform air pressure at the atomizer inlet, the air from the main supply line first passed through a settling chamber to dampen any line pressure fluctuations, and then through a narrow tube to the atomizer. A rotameter (FL-1448-G, Omega Engineering) installed upstream of the atomizer was used to measure and control the air flow rate (see Figure 4-3(a)). The uncertainties in the measurement of liquid and gas flow rates were ±0.03 and ±0.035 lpm, respectively. Water and air pressures were measured via pressure gauges mounted downstream of the respective rotameters. (a)

150 129 (b) (C) Figure 4-3: (a) Schematic and (b) photograph of the experimental setup to investigate the internal two-phase flow. (c) Photograph of the experimental setup to investigate the external two-phase flow (spray droplets).
151 Visualization and measurement technique Internal flow The transparency of the atomizer and the correction for the curvature effects allowed the visualization of the internal two-phase flow. A high speed imaging system was used to capture the images of the flow regime inside the atomizer, which was comprised of a high-speed camera (Photron SA5) with 60 mm lenses. The imaging system was controlled via Photron FASTCAM Viewer software through a PC. Back-lit shadowgraphy technique was used for imaging, which was comprised of a 500W halogen lamp and a diffusion screen placed behind the atomizer (see Figure 4-3(a) and (b)). In the present study, the liquid flow rate ranged from to lpm and the gas flow rate ranged from 0.6 to 4.82 lpm (GLR ranged from 0.53 to 9.55). For all configurations, images were captured at a rate of frames per second at each GLR. At this frame rate, the resolution of the camera was corresponding to 40 mm 30 mm. An In-house algorithm developed in the Matlab environment was used to measure the bubble size and compute bubble size distribution. The uncertainly in measuring the bubble size is within ±1 pixels, which correspond to the uncertainty of ±0.05 mm External flow (Spray) The same imaging system was used to capture the images of the spray droplets. However, the 60 mm lens was replaced by a 12X zoom lens. Due to the high velocity of the droplets, the camera frame rate was set at 150,000 frames per second. At this frame rate, the camera resolution was reduced to , corresponding to the field of view of 3.1 mm 5.6 mm. Due to a smaller field of view and higher frame rate, a continuous Diode- Pumped Solid-State laser (LRS-0532, Laser Glow Technologies) was used for back-lit shadowgraphy (see Figure 4-3(c)). The laser output was connected to a conical lens via a fibre optic cable, which produced a light cone. The measurements were made at an axial location of 150 mm downstream from the exit orifice, where the spray was fully developed [19]. To break any interference effects in the spray and randomize the spray pattern at each GLR, 10 sets of measurements were made at different times spray
152 131 images were captured in each set. An in-house algorithm in the Matlab environment was used for droplet detection and quantification, which automatically detects and tracks the spray droplets and computes various droplet characteristics such as the droplet crosssectional area, perimeter and corresponding equivalent diameter, and velocity. The uncertainty of detecting the droplets was within ±2 pixels, which correspond to the uncertainty of ±0.04 mm. 4.3 Results and Discussion Figure 4-4 illustrates the impact of the new insert (bubble breaker) on the bubble size in the mixing zone of the atomizer by qualitatively comparing the two-phase flow with the atomizer without a bubble breaker, for three different GLRs. The results show a clear impact of the breaker on the bubble size reduction. For the case without the bubble breaker, the results show the classical two-phase flow regimes inside the mixing zone of the atomizer. That is, at the low GLR, bubbly flow is observed and with an increase in the GLR, it changes to the slug flow at the medium GLR and then to the annular flow at the high GLR. The bubble size also increased with an increase in the GLR. When a singlehole breaker is placed, it influenced the bubble size not only inside the breaker but also in the area upstream of the breaker. It is observed that the bubble breakup already started in the upstream zone and was further extended when these bubbles entered the breaker. At the lowest GLR of 0.53 (Figure 4-4(a)), the results show that most of the bubbles were already broken to a size smaller than the diameter of the bubble breaker hole and hence relatively fewer bubbles underwent further breakup. These bubbles were significantly smaller in size compared to those present in the mixing zone without the breaker. The sudden contraction of the flow at the bubble breaker causes a local increase in the velocity and also velocity gradients. This shear flow of the liquid is likely the dominant mechanism for the upstream bubble breakup [34]. The presence of the conical base of the aerator tube also plays a role in streamlining the flow and causing the bubble stretching which further supports the bubble breakdown.
153 132 Figure 4-4(b) shows the flow behavior in the atomizer with and without the bubble breaker at the GLR of For the case without the breaker, the image shows large bubbles and some of those were of the same size as the mixing zone diameter. For larger bubbles, the impact of the liquid acceleration in the converging section upstream of the bubble breaker became more prominent. That is, the bubbles started to elongate in that region due to the strong liquid shear. The sudden contraction also induced a liquid velocity component in the horizontal direction immediately above the bubble breaker. As the elongated bubbles try to negotiate sudden contraction, they further stretched and formed a neck at the bubble breaker entrance. This neck often breaks due to the sharp edge at the entrance or due to the horizontal liquid velocity component. Hence, the bubbles normally started to break as they enter the breaker. The small-size bubbles that enter the insert without breaking could break inside the insert due to the interaction of shear and surface tension forces. Comparison the bubble size at this GLR clearly shows that the bubble breaker effectively broke large bubbles into smaller sizes. At the highest GLR of 9.55, the flow is predominantly annular in the absence of the bubble breaker. When the bubble breaker is placed inside the mixing zone, the flow behavior changed significantly in the region upstream of the bubble breaker. The liquid film that is formed on the outer wall of the atomizer hit the bubble breaker and hence, diverted. This diversion of the liquid interacts with the core gas flow and changes the structure of the two-phase flow. It is observed that bubbles are formed in this region as well as the unsteady fluctuations of the gas-liquid interface. The flow then enters the breaker hole and induces highly unsteady slug-annular flow that often breaks into a mixture of deformed bubbles with different sizes. The above results clearly demonstrate that the given breaker facilitate the bubble breakup over the given range of GLRs.
 GLR=9.55. In each image pair, left image presents the case with breaker and right image presents the case without breaker. 4.3.")


154 133 (a) (b) (c) Figure 4-4: Effect of bubble breaker on the flow behavior in the mixing zone upstream the exit orifice at different GLRs (a) GLR=0.53, (b) GLR=3.17, (c) GLR=9.55. In each image pair, left image presents the case with breaker and right image presents the case without breaker Effect of bubble breaker single-hole diameter The results in the preceding section compare the two-phase flow with and without the bubble breaker. In this section, the influence of the size of the bubble breaker hole on the two-phase flow behaviour is compared. Figure 4-5 shows the results for three different single-hole diameters (opening area) of the bubble breaker at three different GLRs. It is observed that at a given GLR, the size of the breaker hole has an impact on the bubble breakup. At the low GLR of 0.53 (Figure 4-5(a)), the bubbly flow is observed upstream of the bubble breaker while it is fragmented into smaller-size bubbles through the breakers for all three sizes of the breaker hole. A quick comparison shows that a decrease in the size of the breaker hole leads to the generation of smaller bubbles in numerous quantities. This is due to the reason that with a reduction in the cross-section area of the flow, the velocity and the velocity gradient increase which enhance the bubble breakup
155 134 frequency and result in smaller size of bubbles. It is also observed that a reduction in the breaker-hole diameter results in a large number of small bubbles homogeneously distributed in the convergent section approaching the exit orifice. This contributes to the reduction in the unsteadiness of the internal two-phase flow in the convergent section (bottom of the mixing zone) that arises due to the presence of liquid or gas-liquid flow in the exit orifice. This unsteadiness in the flow approaching the exit orifice results in the pulsation and large ligament formation in the spray, which leads to inefficient atomization [14]. As the GLR increased, the size of bubbles upstream of the bubble breaker increases and hence, the size of bubbles inside the bubble breaker also increases (see Figure 4-5(b)). The smaller bubble breaker hole still shows more effective bubble breakup compared to the larger size of breaker hole. At this GLR, the regime is the slug flow in the absence of the bubble breaker (see Figure 4-4(b)). In the presence of bubble breaker, the slug flow is still observed inside the bubble breakers of all three diameters. However, the size of the bubbles is controlled by the diameter of the bubble breaker hole. The behavior in the convergent section is similar to that at the low GLR for the three bubble breaker diameters. However, the overall size of the bubbles is increased at this GLR. The results also indicates that with an increase in the size of the bubble breaker hole, the chances of the presence of liquid-only-phase inside the convergent section and the exit orifice increase, which result in spray pulsation. At the highest GLR shown in Figure 4-5(c), the flow in the absence of the bubble breaker is the annular flow. In the presence of the bubble breaker, the flow upstream of the bubble breaker tends to form bubbles however, this effect diminishes with an increase in the breaker-hole diameter. The flow inside the small-diameter bubble breaker is at a high velocity and the flow features are not clearly evident. However, the bubble breakup is still observed in the entrance region of the bubble breaker. With an increase in the size of breaker hole (medium diameter case), the unsteady slug-annular flow is observed inside the hole which often changes into bubbly flow due to breakdown of the pressure balance at the gas-liquid interface and hence, effect the flow structure. The bubble fragmentation is still observed at the entrance of the breaker-hole while, the size of the fragmented
 results in an unsteady annular flow inside the bubble breaker.")

156 135 bubbles are larger compared to the small-diameter hole, as expected. A further increase in the size of the breaker-hole (large diameter case) results in an unsteady annular flow inside the bubble breaker. In the convergent section, bubbles were observed for the small and medium breaker-hole diameter cases indicating that the slug-annular flow breaks down to the bubbles. For the largest breaker-hole case however, an almost continuous annular flow is observed from the upstream of the bubble breaker to the exit orifice. A detailed inspection of the images for these cases indicates that the flow unsteadiness upstream of the bubble breaker induces interfacial waves that when enter the bubble breaker hole, causes the annular flow to deformed and disintegrated into many bubbles. Low GLR 0.53 Medium GLR 3.17 High GLR 9.55 small medium large small medium large small medium large (a) (b) (c) Figure 4-5: Effect of bubble breaker hole diameter at different GLRs (a) GLR=0.53, (b) GLR=3.17, (c) GLR=9.55.
157 136 As mentioned earlier, the bubble fragmentation or breakup is a process by which a bubble splits into two or more bubbles i.e. the disintegration of a large bubble into many smaller bubbles. Surface tension always acts to maintain the bubble-liquid interface stable while the shear and pressure forces (disruptive force) acts to deform and disrupt it. Once the shear and/or pressure forces become large enough, the surface tension is not able to retain the bubble-liquid interface stable and the breakup occurs [27]. In the present study, the presence of single-hole bubble breaker results in two different types of bubble breakups. In the first type, the bubble fragmentation occurs at the entrance of the bubble breaker primarily due to the dominant effect of the shear stress from the liquid flow. To obtain a better insight into the bubble breakup process of this type, a sequence of images are shown in Figure 4-6(a) to illustrate the process as a function of time. As the figure shows, in the region upstream of the breaker, the flow converges and strong velocity gradients are introduced. The sudden area change also causes pressure losses and hence introduces additional pressure gradient. The shear drag, which is the dominant force elongates the bubble and often forms a neck, as seen in Figure 4-6(a). The pressure drag does not contribute to the elongation of the bubble and hence, it is expected that its contribution is limited to pushing the bubbles along the liquid stream. The image sequence also indicates that the bubble neck breaks when the breaker-hole has fewer bubbles. As the number of bubbles inside the hole increases, the bubble elongates but the neck does not break. This could be due to the reason that an increase in the number of bubbles inside the breakerhole increases the liquid blockage, which causes a local pressure rise, which reduces the local drag force on the bubble. At the lowest GLR, for the smallest size of the bubble breaker, most of the bubbles are fragmented at the entrance due to the high shear stress. However, with an increase in the diameter of the bubble breaker hole, the shear stress decreases and hence the rate of bubble breakup reduces. It is also observed that as the hole-diameter increases, bubbles larger than the breaker-hole elongate into the hole and a neck is formed which further fragments at the entrance or inside the hole. The results also show that for the mediumand large-hole breakers, bubbles with the smaller size than the size of bubble breaker hole normally do not fragment at the entrance of the hole. This could be due to the reason
158 137 that as the bubble size reduces, the magnitude of shear stress acting on it also decreases and hence, the elongation effect diminishes. The second type of breakup occurs inside the bubble breaker, when the size of bubbles is relatively small compared to the diameter of the bubble breaker hole. Figure 4-6(b) depicts this breakup process for two bubbles (marked with dashed outline) in the bubble breaker hole. As the image sequence shows, these bubbles deformed and broke into a group of smaller bubbles. Some bubbles completely detached from the group, while some independent small bubbles coalesced with the group. The shear drag force still plays a major role in the bubble breakup. It should also be noted that the sharp edge of the bubble breaker-hole causes a flow separation into the breaker-hole, which likely induces vortex shedding. These shedded turbulent vortices also contribute the bubble breakup [35]. Further downstream, this group of bubbles when entering the convergent section is often disintegrated due to the velocity gradients. The detailed analysis of the data also shows that the same bubble may undergo these two types of bubble breakups. Figure 4-6(c) illustrates this double breakup process. As seen in the figure, a bubble elongates and breaks at the entrance region and then it undergoes further breakup during its passage through the bubble breaker hole. The data analysis also shows that if a long slug bubble or annular flow inside the bubble breaker becomes unsteady, gas-liquid interface starts to fluctuate and causes the breakup. The slug bubble may choke the hole of the bubble breaker and the exit orifice at the same time, which results in a sudden closing. The sudden closing of the single-hole bubble breaker leads to a sudden velocity reduction and a pressure pulse upstream causing the bubble deformation and fragmentation. Similar trend has been observed in a previous study for the two-phase flow approaching the exit orifice [15].
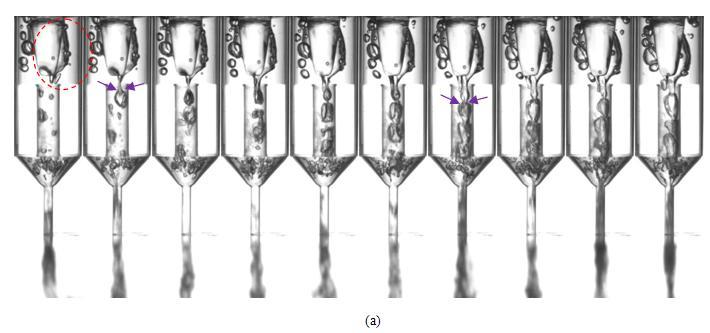

159 138
 Second type of small-size bubble fragmentation inside the bubble breaker, GLR=0.53, t=0.2 ms (large hole) (c) Double breakup, GLR=0.53, t=0.25ms (medium hole).")
160 139 Figure 4-6: Image sequences showing the mechanism of bubble breakup in singlehole bubble breaker. (a) First type of bubble fragmentation at the entrance, GLR=0.53, t=0.75 ms, (medium hole). (b) Second type of small-size bubble fragmentation inside the bubble breaker, GLR=0.53, t=0.2 ms (large hole) (c) Double breakup, GLR=0.53, t=0.25ms (medium hole). Figures 4-4, 4-5 and 4-6 qualitatively provide the depiction of the bubble breakup processes for the single-hole bubble breaker and the influence of the breaker-hole diameter on the bubble size as well as the visual comparison of the two-phase flow in the mixing zone with and without the breaker. To obtain quantitative estimates, the size of individual bubbles was measured. As mentioned in the Experimental setup section, an algorithm was developed to measure the vertical extent of each bubble, which is considered as the characteristics bubble size. The bubble size distribution inside the breaker-hole for different hole diameters is shown in Figure 4-7(a) and (b) at the GLR of 0.53 and 3.17, respectively, under the same operating condition as in Figure 4-5. Note that the data for the reference (without the bubble breaker) case is based on the bubbles present in the entire mixing zone. The bubble size distribution is presented in the form of Probability Density Function (PDF).
161 140 At the low GLR, it is observed that the smallest hole-diameter results in a narrower band of bubble size compared to the other two diameters. With an increase in the size of the hole, the bubble size distribution bandwidth increases. The bubble distribution tail on the right side represents the longer bubbles, which are associated with the vertical elongation of bubbles inside the breaker hole. In comparison with the reference case (without the bubble breaker), the results show that the overall bubble size distribution shifts to the right without the bubble breaker, i.e. larger bubbles, as observed qualitatively in Figure 4-4. The bubble size distribution at the GLR of 3.17 is shown in Figure 4-7(b). The results show that the distribution trends are similar to that at the low GLR, however, the distributions in general, are shifted to the right. The small-hole bubble breaker has the narrowest distribution, while the presence of elongated bubbles increased with an increase in the breaker-hole diameter. Figure also shows that the bandwidths of the bubble size distribution at the mid height of the distribution are 1.1 mm, 1.7 mm, 2 mm and 2.4 mm for small, medium, large size breaker-holes and for the case without bubble breaker, respectively. This indicates that the bubble size range decreased by 54%, 30% and 17% for the small, medium and large size breaker-hole compared to the reference case without breaker, respectively. The results also show a more distinct shift of the bubble size distribution to the right in the absence of the bubble breaker, compared to that at the low GLR. Figure 4-7(c) shows the bubble size distribution at the high GLR of It is observed that the slug-annular region is formed within the bubble breaker hole (see Figure 4-4(c) and 4-5(c)). Thus, the bubble size distribution bandwidth increases and a longer tail on the right side of the distribution is formed almost for all cases. The results also show that the small-hole bubble breaker, at this GLR also has the narrowest bubble distribution bandwidth similar to that for the low and medium GLRs, as mentioned earlier. The results also illustrate that with an increase in the size of the bubble breakerhole, the bubble size distribution bandwidth increases and the peak shifts towards the right i.e. the bubble size increases. The mean bubble size for the three breaker-hole diameters at different GLRs is shown in Figure 4-7(d). The results show that the novel bubble breakers generate smaller bubble at all GLRs. It is also observed that with an increase in the GLR, the mean bubble size increases for all cases. However, the rate of increment of the bubble size in the presence
162 141 of bubble breaker is less than that for the case without the bubble breaker. The average size of bubbles inside the bubble breakers at GLRs of 0.53, 3.17 and 9.55, are 1.35 mm, 1.98 mm and 2.36, respectively, which are 24%, 34% and 61% smaller than the mean bubble size relative to the case without the breaker. It is found that at GLRs of 0.53, 3.17 and 9.55, the mean bubble size in the smallest bubble breaker hole is 18%, 26% and 27% smaller than the overall average bubble size in the medium- and large-hole bubble breakers, respectively. The results show that the presence of the single-hole bubble breaker promotes the bubbly flow inside the atomizer by generating small bubbles. (a)
163 142 (b) (c)
164 Mean bubble diameter (mm) Effect of area GLR Small hole medium hole large hole reference (d) Figure 4-7: Effect of bubbles breakers with different single-hole diameters on the bubble size. Probability Density Function (PDF) of the bubble diameter (D B )at (a) GLR=0.53, (b) GLR=3.17 and (c) GLR=9.55. (d) Mean bubble diameter (D B ) inside the bubble breakers versus GLR. Error bars (based on the standard error of the mean) are smaller than the size of the symbols. Earlier results have shown that the single-hole bubble breaker effectively breaks large bubbles into small ones. It has also been illustrated that by decreasing the breaker-hole diameter, more uniform and smaller bubbles are produced. Since the end product is the spray, it is important to investigate the impact of these single-hole bubble breakers on the spray quality. As mentioned in the Experimental setup section, the spray behavior is characterized based on the droplet size and velocity obtained from the analysis of the image data of the spray using an in-house algorithm. Figures 4-8 and 4-9 illustrate the spray characteristics (i.e. droplet size and droplet velocity in the form of mean and distribution) correspond to the same cases that illustrate the internal two-phase flow behavior in Figure 4-5 (qualitatively) and Figure 4-7 (quantitatively). Figure 4-8(a) shows the distribution of the droplet size at low GLR of 0.53 for different sizes of the bubble breaker hole and the reference case without the breaker. The figure indicates that the atomization process with and without the bubble breaker results in a relatively similar
165 144 droplet size distribution at low GLR. As the GLR increases to 3.17, the results show that the smallest size of bubble breakers produces slightly narrower droplet size distribution (see Figure 4-8(b)). At the higher GLR of 9.55 (see Figure 4-8(c)), a clear effect of breaker-hole size on the droplet size is observed. It is illustrated that with a reduction in the size of the bubble breaker hole, the droplet size distribution band tends to become narrower. Figure 4-8(d) summarizes the results in the form of mean droplet diameter for all cases. The results show that an increase in the GLR results in smaller droplets size, which is consistent with previous studies [16, 19, 21]. It is also observed that over the given range of GLRs, the atomizer with the bubble breaker is able to produce smaller droplet size compared to the case without a bubble breaker. The effect is more prominent for the small breaker-hole, where on average, the droplet sizes are 7% smaller than that for the case without the bubble breaker for the given GLR range. For the medium and large breaker-holes, the droplet sizes are quite comparable but still lower than that for the case without the bubble breaker, on average by 4% over the given GLR range. (a)
166 145 (b) (c)
167 Mean droplet diameter (mm) 146 Effect of area small hole medium hole large hole reference GLR Figure 4-8: Effect of bubbles breakers with different single-hole diameters on the droplet size. Probability Density Function (PDF) of the droplet diameter (D p ), at (a) GLR=0.53, (b) GLR=3.17 and (c) GLR=9.55. (d) Mean droplet diameter versus GLR. Error bars (based on the standard error of the mean) are smaller than the size of the symbols. (d) Figure 4-9 shows the spray behavior in the form of mean and distribution of the droplet velocity for the atomizer with and without the bubble breaker (corresponding to the results shown in Figure 4-8). The results show a unimodal distribution of droplet velocity for all cases, which is expected and reported in previous studies [21, 36]. At the lowest GLR of 0.53 (Figure 4-9(a)), it is observed that with a decrease in the size of bubble breaker-hole, the velocity distribution is shifted to the right except for the largest breakerhole diameter, which has similar distribution as for case without the bubble breaker. This trend indicates that the droplet velocities increased with a reduction in the hole-diameter of the bubble breaker. At higher GLRs (see Figure 4-9(b) and (c)) similar trends were observed. However, at the highest GLR of 9.55 the droplet velocity distributions for the
168 147 medium- and small-size hole were similar. Figure 4-9(d) shows the summarized results in the form of normalized mean droplet velocity. The mean droplet velocity is normalized by V La which is the liquid velocity in the liquid inlet of the atomizer. The results illustrate that small and medium breaker-holes increase the mean drop velocity compared to the case without the bubble breaker. At the lowest GLR, the mean droplet velocity for small and medium holes is about 10% higher than the case without the bubble breaker, which increased to 13% at the highest GLR. The results however, show that the mean droplet velocities for the largest breaker hole are comparable with that for the case without the bubble breaker. (a)
169 148 (b) (c)
170 149 V p /V La Effect of area GLR small hole medium hole large hole reference (d) Figure 4-9: Effect of bubbles breakers with different single-hole diameters on the droplet velocity. Probability Density Function (PDF) of the droplet velocity (V p ), at (a) GLR=0.53, (b) GLR=3.17 and (c) GLR=9.55. (d) Normalized mean droplet velocity (V p /V La ) versus GLR. Error bars (based on the standard error of the mean) are smaller than the size of the symbols Effect of number of holes in the bubble breaker In the previous section, a bubble breaker with a single hole in the middle was considered and the influence of the hole-diameter was investigated. In this section, bubble breakers with multiple holes are considered and the influence of the number of holes on the bubble breakup process and spray quality is investigated. The bubble breaker inserts with three and five holes are considered, with the hole-diameters of 1.83 mm and 1.42 mm, respectively. The configurations of these holes in the bubble breakers are shown in Figure 4-2(b). The reference single-hole bubble breaker considered for comparison has the hole-
171 150 diameter of 3.18 mm. Note that the total cross-sectional area of hole openings (i.e. the total flow area) for all three configurations was kept the same. Figure 4-10 shows the effect of number of breaker holes and the holes configuration on the bubble fragmentation at different GLRs. At the low GLR of 0.53 (see Figure 4-10(a)), the bubbly flow is observed in the region upstream of the bubble breaker for all three breakers. However, the comparison shows that the configuration of the bubble breaker influences the upstream two-phase flow behavior. The size of upstream bubbles was smallest for the single-hole breaker, which increased for the five-hole breaker and the largest upstream bubbles were observed for the three-hole breaker. A plausible explanation for this trend is that for the single-hole breaker, the hole was in the middle and aligned with the conical base of the aerator tube. Hence, the flow was streamlined and accelerated through the middle-hole with strong velocity gradients. As mentioned earlier, these strong velocity gradients are responsible for the upstream bubble breakup due to the rupturing of the bubbles by the shear. Thus, small bubbles are generated in this configuration. For the five-hole bubble breaker, the middle-hole aligned with the conical base of the aerator tube while the four other holes were in the peripheral region (see Figure 4-2(b)). This influenced the flow pattern in the upstream region, which include the flow diversions. The flow through the middle-hole was still streamlined with high velocity gradients but the flow diverted to the peripheral holes was expected to have relatively small velocity gradients due to the flow diversions. This is confirmed by a careful inspection of the image for this case, which shows that in the upstream region close to the hole, the flow near the center has smaller bubbles compared to those in the peripheral regions. Furthermore, the hole-diameter was much smaller in this configuration which caused the flow acceleration locally in the immediate vicinity of the hole-opening and the bulk of the upstream flow was not significantly affected. That is, the high shear was produced in the close vicinity of the hole-entrances. This effect is also clearly evident in the image. For the three-hole breaker, no hole was located in the middle and hence the flow was diverted and hence the velocity gradients were smaller. Thus, the weak shear in the bulk flow was not very effective to break upstream bubbles. The local flow
172 151 acceleration and strong shear in the close vicinity of the hole-entrances is evident in the corresponding image. Although the multiple holes in the breaker were not very effective in breaking the upstream bubbles, the results show that these breakers however, generated smaller bubbles inside the breaker holes. As mentioned above, the multi-hole breaker produced strong shear at the entrance of each hole, which effectively contributed to the bubble rupture and breakdown at the hole-entrance. Hence, despite being unbroken in the upstream region, these bubbles were effectively broken at the hole-entrance, which is clearly visible in the images that highlights the stretching of bubbles at the hole entrance. The strong local shear produced at the hole-entrance is also a function of the holediameter, which decreased with an increase in the number of holes. Hence, the breakup of the bubbles was more effective for the five-hole breaker, which has the smallest holediameter. In addition, the smaller hole-diameter also restricts the lateral extent of the bubbles as they flow through the holes. As GLR increases to 3.17, the size of bubbles upstream of the breaker increases, which increases the size of the bubbles inside the bubble breaker as well. However, the trends were similar to that observed at the low GLR (see Figure 4-10(b)). The results show that slug bubbles are observed inside the breaker-holes for all cases. Similar to the low GLR case, the five-hole bubble breaker due to smaller size of holes was found to be more effective in the bubble breakup. The results also show that the chances of the bubbles coalescence inside the holes increases with an increase in the GLR for both multi-hole breakers. With a further increase in the GLR (see Figure 4-10(c)), the influence of multihole configurations on the upstream bubble breaker tends to diminish. The flow inside the the bubble breakers (single-hole and multi-hole) changes to the slug-annular flow. The results show that the unsteady annular region observed in the single-hole breaker is also observed in the multi-hole breakers. However, the rate of unsteadiness slightly decreased in the multi-hole breakers compared to the single-hole breaker. This is likely due to a decrease in the chances of the blockage of the bubble breaker holes and the exit orifice by the bubbles, with an increase in the number of holes and a decrease in the size of bubbles inside the convergent section.
 (b) (c) Figure 4-10: Effect of number of holes in the bubble")


173 152 Low GLR 0.53 Medium GLR 3.17 High GLR 9.55 one three five one three five one three five (a) (b) (c) Figure 4-10: Effect of number of holes in the bubble breakers at different GLRs, (a) GLR=0.53, (b) GLR=3.17, (c) GLR=9.55. The above results show that multi-hole breakers lead to the generation of smaller fragmented bubbles compared to the single-hole breaker (medium size). It is also observed that the size of bubbles inside the mixing zone is larger than the diameter of the multi-hole bubble breakers and the strong shear at the entrance causes the bubble fragmentation into small bubbles or a chain of small bubbles whose sizes are controlled by the hole-diameter. The chain of bubbles may further fragment into many smaller bubbles or coalesce and form elongated bubbles. The elongated bubbles typically have wavy interface, which promotes further breakup inside the convergent section at the bottom of the mixing zone.
174 153 As discussed earlier, the primary mechanism of bubble fragmentation in multi-hole breakers is the strong shear at the hole-entrance and smaller hole-diameter. Sequences of images for the three-hole and five-hole bubble breakers are shown in Figure 4-11 (a) and (b), respectively, that depict this mechanism with a better insight. The further breakup of small bubble inside the hole found in the single-hole breaker (see Figure 4-6(b)) is not observed in the multi-hole breaker, which is likely due to the smaller size of fragmented bubble. Figure 4-11(c) illustrates the further breakdown of the bubbles into the convergent section after passing through the breaker holes. Once the bubble inside the hole exits the breaker, it experiences lower liquid velocity so the shape of bubble changes to the spherical form due to the liquid drag force (pressure drag force). Then due to the effect of the liquid shear force inside the convergent section, the bubble elongates into the flow direction and fragments into small-size bubbles. The results show that for the fivehole breaker, more bubble elongations in the convergent section through the exit orifice are observed for the bubbles that exit from the peripheral holes compared to those that exit from the central hole. This is likely due to the longer distance between the bottom of the hole and the exit orifice and correspondingly higher shear stress due to the wall effects, which results in further bubble elongation causing more bubble fragmentations.
")

175 154 (a) (b)
 Penetration and fragmentation of a bubble into two holes for the three-hole bubble breaker (b) Penetration and breakup of bubbles either from one hole or number of holes in the five-hole bubble")
176 155 Figure 4-11: Bubble breakup mechanism in the multi-hole bubble breakers. (a) Penetration and fragmentation of a bubble into two holes for the three-hole bubble breaker (b) Penetration and breakup of bubbles either from one hole or number of holes in the five-hole bubble breaker. (c) Bubble fragmentation inside the bottom convergent section. GLR=0.53. (c) Results presented earlier in the section provide a qualitative description of the bubble breakup process in multi-hole breakers in comparison with a single-hole breaker. The bubble size was measured in the images for these cases using the algorithm mentioned earlier. Figure 4-12 illustrates the bubble size inside the bubble breakers correspond to the cases shown in Figure The bubble size distributions for breaker with different number of holes (same total opening area) and the case without the bubble breaker are shown in Figure 4-12(a), (b) and (c) at GLRs of 0.53, 3.17 and 9.55, respectively. Plots clearly show the effect of number of breaker holes on the bubble size distribution for all
A Computational Assessment of Gas Jets in a Bubbly Co-Flow 1
 A Computational Assessment of Gas Jets in a Bubbly Co-Flow 1 Melissa Fronzeo*, 1 Michael Kinzel 1 The Pennsylvania State University, University Park, PA, USA Abstract In this effort, Computational Fluid
The Bubble Dynamics and Pressure Field Generated by a Seismic Airgun
 The Bubble Dynamics and Pressure Field Generated by a Seismic Airgun Katrina L. de Graaf B.Eng(Naval Architecture)(Hons) National Centre for Maritime Engineering and Hydrodynamics Australian Maritime College
Ermenek Dam and HEPP: Spillway Test & 3D Numeric-Hydraulic Analysis of Jet Collision
 Ermenek Dam and HEPP: Spillway Test & 3D Numeric-Hydraulic Analysis of Jet Collision J.Linortner & R.Faber Pöyry Energy GmbH, Turkey-Austria E.Üzücek & T.Dinçergök General Directorate of State Hydraulic
Bioreactor System ERT 314. Sidang /2011
 Bioreactor System ERT 314 Sidang 1 2010/2011 Chapter 2:Types of Bioreactors Week 4 Flow Patterns in Agitated Tanks The flow pattern in an agitated tank depends on the impeller design, the properties of
Flow and Mixing in the Liquid between Bubbles
 Excerpt from the Proceedings of the COMSOL Conference 2009 Boston Flow and Mixing in the Liquid between Bubbles Bruce A. Finlayson, Professor Emeritus of Chemical Engineering Department of Chemical Engineering,
Numerical Investigation of Air Bubbles Evolution and Coalescence from Submerged Orifices Based on OpenFOAM
 Numerical Investigation of Air Bubbles Evolution and Coalescence from Submerged Orifices Based on OpenFOAM Pan Feng, He Ying, Li-zhong Mu 2018-7-6 Dalian University of Technology, China Outline Background
The Effect Of Mesh-Type Bubble Breakers On Two-Phase Vertical Co-Flow
 Western University Scholarship@Western Electronic Thesis and Dissertation Repository August 2016 The Effect Of Mesh-Type Bubble Breakers On Two-Phase Vertical Co-Flow Alan Kalbfleisch The University of
Numerical Simulations of a Train of Air Bubbles Rising Through Stagnant Water
 Numerical Simulations of a Train of Air Bubbles Rising Through Stagnant Water Hong Xu, Chokri Guetari ANSYS INC. Abstract Transient numerical simulations of the rise of a train of gas bubbles in a liquid
The Effect of a Seven Week Exercise Program on Golf Swing Performance and Musculoskeletal Screening Scores
 The Effect of a Seven Week Exercise Program on Golf Swing Performance and Musculoskeletal Screening Scores 2017 Mico Hannes Olivier Bachelor of Sport Science Faculty of Health Sciences and Medicine Bond
Experimental Analysis on Vortex Tube Refrigerator Using Different Conical Valve Angles
 International Journal of Engineering Research and Development e-issn: 7-067X, p-issn: 7-00X, www.ijerd.com Volume 3, Issue 4 (August ), PP. 33-39 Experimental Analysis on Vortex Tube Refrigerator Using
Air Bubble Departure on a Superhydrophobic Surface
 Air Bubble Departure on a Superhydrophobic Surface A. Kibar 1, R. Ozbay 2, C.H. Choi 2 1 Department of Mechanical and Material Technologies, Kocaeli University, 41285, Kocaeli, Turkey 2 Department of Mechanical
Free Surface Flow Simulation with ACUSIM in the Water Industry
 Free Surface Flow Simulation with ACUSIM in the Water Industry Tuan Ta Research Scientist, Innovation, Thames Water Kempton Water Treatment Works, Innovation, Feltham Hill Road, Hanworth, TW13 6XH, UK.
Walking with coffee: when and why coffee spills
 Walking with coffee: when and why coffee spills Hans C. Mayer and Rouslan Krechetnikov Department of Mechanical Engineering University of California at Santa Barbara February 20-24, 2012 Page 1/25 Motivation
INTERACTION BETWEEN WIND-DRIVEN AND BUOYANCY-DRIVEN NATURAL VENTILATION Bo Wang, Foster and Partners, London, UK
 INTERACTION BETWEEN WIND-DRIVEN AND BUOYANCY-DRIVEN NATURAL VENTILATION Bo Wang, Foster and Partners, London, UK ABSTRACT Ventilation stacks are becoming increasingly common in the design of naturally
Investigation of Suction Process of Scroll Compressors
 Purdue University Purdue e-pubs International Compressor Engineering Conference School of Mechanical Engineering 2006 Investigation of Suction Process of Scroll Compressors Michael M. Cui Trane Jack Sauls
FORMATION AND DEVELOPMENT OF SUBMERGED AIR JETS
 Formation and Development of Submerged Air Jets 137 FORMATION AND DEVELOPMENT OF SUBMERGED AIR JETS Sultana R. Syeda* and Ashfaq M. Ansery Department of Chemical Engineering Bangladesh University of Engineering
Injector Dynamics Assumptions and their Impact on Predicting Cavitation and Performance
 Injector Dynamics Assumptions and their Impact on Predicting Cavitation and Performance Frank Husmeier, Cummins Fuel Systems Presented by Laz Foley, ANSYS Outline Overview Computational Domain and Boundary
Computer Simulation Helps Improve Vertical Column Induced Gas Flotation (IGF) System
 System") JOURNAL ARTICLES BY FLUENT SOFTWARE USERS JA187 Computer Simulation Helps Improve Vertical Column Induced Gas Flotation (IGF) System Computer simulation has helped NATCO engineers make dramatic improvements
JOURNAL ARTICLES BY FLUENT SOFTWARE USERS JA187 Computer Simulation Helps Improve Vertical Column Induced Gas Flotation (IGF) System Computer simulation has helped NATCO engineers make dramatic improvements
Visual Observation of Nucleate Boiling and Sliding Phenomena of Boiling Bubbles on a Horizontal Tube Heater
 Proceedings of the 2 nd World Congress on Mechanical, Chemical, and Material Engineering (MCM'16) Budapest, Hungary August 22 23, 216 Paper No. HTFF 146 DOI:.11159/htff16.146 Visual Observation of Nucleate
Effect of Argon Gas Distribution on Fluid Flow in the Mold Using Time-Averaged k-ε Models
 Effect of Argon Gas Distribution on Fluid Flow in the Mold Using Time-Averaged k-ε Models B. G. Thomas, T. Shi and L. Zhang Department of Materials Science &. Engineering University of Illinois at Urbana-Champaign
Development of High-speed Gas Dissolution Device
 Development of High-speed Gas Dissolution Device Yoichi Nakano*, Atsushi Suehiro**, Tetsuhiko Fujisato***, Jun Ma**** Kesayoshi Hadano****, Masayuki Fukagawa***** *Ube National College of Technology, Tokiwadai
EXPERIMENTAL CHARACTERIZATION OF A EJECTOR PUMP
 EXPERIMENTAL CHARACTERIZATION OF A EJECTOR PUMP Capela, N. J. S. Department of Mechanical Engineering, Instituto Superior Técnico, Av. Rovisco Pais, 1049-001, Lisbon, Portugal, 2012 ABSTRACT The option
Chapter 3 EXPERIMENTAL: EQUIPMENT, SET-UP, AND PROCEDURE
 Chapter 3 EXPERIMENTAL: EQUIPMENT, SET-UP, AND PROCEDURE 72 3.0 Introduction The experimental work was carried out in three stages. First stage: a laboratory scale single nozzle horizontal jet ejector
Figure 2: Principle of GPVS and ILIDS.
 Summary Bubbly flows appear in many industrial applications. In electrochemistry, bubbles emerge on the electrodes in e.g. hydrolysis of water, the production of chloride and as a side-reaction in metal
Drilling Efficiency Utilizing Coriolis Flow Technology
 Session 12: Drilling Efficiency Utilizing Coriolis Flow Technology Clement Cabanayan Emerson Process Management Abstract Continuous, accurate and reliable measurement of drilling fluid volumes and densities
ANNUAL REPORT UIUC, August 16, Bubble Formation, Breakup and Coalescence in Stopper-rod Nozzle Flow and Effect on Multiphase Mold Flow
 ANNUAL REPORT 202 UIUC, August 6, 202 Bubble Formation, Breakup and Coalescence in Stopper-rod Nozzle Flow and Effect on Multiphase Mold Flow POSTECH: Seong-Mook Cho, Seon-Hyo Kim, Hyoung-Jun Lee, Dae-Woo
Influence of rounding corners on unsteady flow and heat transfer around a square cylinder
 Influence of rounding corners on unsteady flow and heat transfer around a square cylinder S. K. Singh Deptt. of Mech. Engg., M. B. M. Engg. College / J. N. V. University, Jodhpur, Rajasthan, India Abstract
STALLING BEHAVIOUR OF A CONTRA-ROTATING AXIAL COMPRESSOR STAGE
 STALLING BEHAVIOUR OF A CONTRA-ROTATING AXIAL COMPRESSOR STAGE by YASHPAL JAIN Thesis submitted in fulfilment of the requirements for the degree of DOCTOR OF PHILOSOPHY Department of Mechanical Engineering
Investigation on Divergent Exit Curvature Effect on Nozzle Pressure Ratio of Supersonic Convergent Divergent Nozzle
 RESEARCH ARTICLE OPEN ACCESS Investigation on Divergent Exit Curvature Effect on Nozzle Pressure Ratio of Supersonic Convergent Divergent Nozzle Shyamshankar.M.B*, Sankar.V** *(Department of Aeronautical
IMPROVING PLANT AERATION USING GAS INFUSION TECHNOLOGY
 IMPROVING PLANT AERATION USING GAS INFUSION TECHNOLOGY AERATION IN WASTEWATER Municipal sewer collection systems-odor Mgmt. Lift and transfer stations Lagoons / Retention Ponds BOD / COD treatment Enhanced
OPTIMIZATION OF SINGLE STAGE AXIAL FLOW COMPRESSOR FOR DIFFERENT ROTATIONAL SPEED USING CFD
 http:// OPTIMIZATION OF SINGLE STAGE AXIAL FLOW COMPRESSOR FOR DIFFERENT ROTATIONAL SPEED USING CFD Anand Kumar S malipatil 1, Anantharaja M.H 2 1,2 Department of Thermal Power Engineering, VTU-RO Gulbarga,
Predicting and Controlling Bubble Clogging in Bioreactor for Bone Tissue Engineering
 Predicting and Controlling Bubble Clogging in Bioreactor for Bone Tissue Engineering Marina Campolo, Dafne Molin, Alfredo Soldati Centro Interdipartimentale di Fluidodinamica e Idraulica and Department
Computational Analysis of Oil Spill in Shallow Water due to Wave and Tidal Motion Madhu Agrawal Durai Dakshinamoorthy
 Computational Analysis of Oil Spill in Shallow Water due to Wave and Tidal Motion Madhu Agrawal Durai Dakshinamoorthy 1 OUTLINE Overview of Oil Spill & its Impact Technical Challenges for Modeling Review
Aerodynamic Analysis of a Symmetric Aerofoil
 214 IJEDR Volume 2, Issue 4 ISSN: 2321-9939 Aerodynamic Analysis of a Symmetric Aerofoil Narayan U Rathod Department of Mechanical Engineering, BMS college of Engineering, Bangalore, India Abstract - The
Cavitation Bubbles in a Starting Submerged Water Jet
 CAV21:sessionA7.5 1 Cavitation Bubbles in a Starting Submerged Water Jet K.Nakano, M.Hayakawa, S.Fujikawa and T.Yano Graduate School of Engineering, Hokkaido University, Sapporo, Japan Abstract The behavior
Quantification of the Effects of Turbulence in Wind on the Flutter Stability of Suspension Bridges
 Quantification of the Effects of Turbulence in Wind on the Flutter Stability of Suspension Bridges T. Abbas 1 and G. Morgenthal 2 1 PhD candidate, Graduate College 1462, Department of Civil Engineering,
Water Treatment: Fundamentals and Practical Implications of Bubble Formation
 Water Treatment: Fundamentals and Practical Implications of Bubble Formation Paolo Scardina Thesis submitted to the Faculty of the Virginia Polytechnic Institute and State University In partial fulfillment
A Research on the Airflow Efficiency Analysis according to the Variation of the Geometry Tolerance of the Sirocco Fan Cut-off for Air Purifier
 A Research on the Airflow Efficiency Analysis according to the Variation of the Geometry Tolerance of the Sirocco Fan Cut-off for Air Purifier Jeon-gi Lee*, Choul-jun Choi*, Nam-su Kwak*, Su-sang Park*
Bubble Coalescence and Breakup in Gas-Liquid Stirred Tank Reactors
 Bubble Coalescence and Breakup in Gas-Liquid Stirred Tank Reactors Rahman Sudiyo Background Stirred tank reactors are widely used in chemical, pharmaceutical and biochemical industries. Mass transfer between
Bubble-bubble interactions and wall pressures/temperatures produced by the collapse of a bubble pair near a rigid surface
 Bubble-bubble interactions and wall pressures/temperatures produced by the collapse of a bubble pair near a rigid surface Abstract Shahaboddin A. Beig*; Eric Johnsen; Mechanical Engineering Department,
Application of CFD for Improved Vertical Column Induced Gas Flotation (IGF) System Development
 System Development") Application of CFD for Improved Vertical Column Induced Gas Flotation (IGF) System Development Chang-Ming Lee and Ted Frankiewicz NATCO Group, Inc., 2950 North Loop West, Suite 750, Houston, TX 77092 Prepared
Application of CFD for Improved Vertical Column Induced Gas Flotation (IGF) System Development Chang-Ming Lee and Ted Frankiewicz NATCO Group, Inc., 2950 North Loop West, Suite 750, Houston, TX 77092 Prepared
Dynamics of the bubble near a triangular prism array
 Dynamics of the bubble near a triangular prism array 1,2 Yuning Zhang*; 1,2 Shida Li; 1,2 Yongxue Zhang; 3 Yuning Zhang 1 College of Mechanical and Transportation Engineering, China University of Petroleum-Beijing,
ZIN Technologies PHi Engineering Support. PHi-RPT CFD Analysis of Large Bubble Mixing. June 26, 2006
 ZIN Technologies PHi Engineering Support PHi-RPT-0002 CFD Analysis of Large Bubble Mixing Proprietary ZIN Technologies, Inc. For nearly five decades, ZIN Technologies has provided integrated products and
The Mechanism Study of Vortex Tools Drainage Gas Recovery of Gas Well
 Advances in Petroleum Exploration and Development Vol. 7, No. 1, 214, pp. 62-66 DOI:1.3968/j.aped.1925543821471.1931 ISSN 1925-542X [Print] ISSN 1925-5438 [Online] www.cscanada.net www.cscanada.org The
Technical Note. Determining the surface tension of liquids by measurements on pendant drops
 Technical Note Pendant Drop Measurements Technical note: TN316e Industry section: all Author: FT, TW Date: 12/2010 Method: Drop Shape Analyzer DSA100 Keywords: Methods, surface tension, interfacial tension,
Argon Injection Optimization in Continuous Slab Casting
 Argon Injection Optimization in Continuous Slab Casting Tiebiao Shi and Brian G. Thomas Department of Mechanical Engineering University of Illinois at Urbana-Champaign March 25, 2001 University of Illinois
Section 2 Multiphase Flow, Flowing Well Performance
 Section 2 Multiphase Flow, Flowing Well Performance Multiphase Vertical Flow When producing an oil or gas well, the flow of the fluids up the tubing will be in most cases be 2 phase, liquid and gas. The
COMPUTATIONAL FLOW MODEL OF WESTFALL'S LEADING TAB FLOW CONDITIONER AGM-09-R-08 Rev. B. By Kimbal A. Hall, PE
 COMPUTATIONAL FLOW MODEL OF WESTFALL'S LEADING TAB FLOW CONDITIONER AGM-09-R-08 Rev. B By Kimbal A. Hall, PE Submitted to: WESTFALL MANUFACTURING COMPANY September 2009 ALDEN RESEARCH LABORATORY, INC.
SPECIFYING MOTIONLESS MIXERS
 SPECIFYING MOTIONLESS MIXERS The operating cost for the energy necessary to mix fluids with a motionless mixer is usually far lower than for any competitive mixing technique. An extruder which melts, mixes
An analysis of the air-jet yarn-texturing process part 5: the eect of wetting the yarns
 Loughborough University Institutional Repository An analysis of the air-jet yarn-texturing process part 5: the eect of wetting the yarns This item was submitted to Loughborough University's Institutional
The Usage of Propeller Tunnels For Higher Efficiency and Lower Vibration. M. Burak Şamşul
 The Usage of Propeller Tunnels For Higher Efficiency and Lower Vibration M. Burak Şamşul ITU AYOC 2014 - Milper Pervane Teknolojileri Company Profile MILPER is established in 2011 as a Research and Development
The Study of Bubbly Gas-Water Flow Using
 The Study of Bubbly Gas-Water Flow Using Displacement Current Phase Tomography Chris Zuccarelli 1, Benjamin Straiton 1, Joshua Sines 1, Qussai Marashdeh 1 1 Tech4Imaging, 1910 Crown Park Court, Columbus,
Transverse waves cause particles to vibrate perpendicularly to the direction of the wave's motion (e.g. waves on a string, ripples on a pond).
.") Waves Introduction A vibration must be the source of a wave. Waves in turn also cause vibrations. They are intrinsically connected. Waves transmit energy. There are different ways in which waves can be
Waves Introduction A vibration must be the source of a wave. Waves in turn also cause vibrations. They are intrinsically connected. Waves transmit energy. There are different ways in which waves can be
The Estimation Of Compressor Performance Using A Theoretical Analysis Of The Gas Flow Through the Muffler Combined With Valve Motion
 Purdue University Purdue e-pubs International Compressor Engineering Conference School of Mechanical Engineering The Estimation Of Compressor Performance Using A Theoretical Analysis Of The Gas Flow Through
Submitted to Metallurgical and Materials Transactions B, on May 26, BUBBLE FORMATION DURING HORIZONTAL GAS INJECTION
 Submitted to Metallurgical and Materials Transactions B, on May 26, 2000 1 BUBBLE FORMATION DURING HORIZONTAL GAS INJECTION INTO DOWNWARD FLOWING LIQUID Hua Bai and Brian G. Thomas Hua Bai, Senior research
Workshop 1: Bubbly Flow in a Rectangular Bubble Column. Multiphase Flow Modeling In ANSYS CFX Release ANSYS, Inc. WS1-1 Release 14.
 Workshop 1: Bubbly Flow in a Rectangular Bubble Column 14. 5 Release Multiphase Flow Modeling In ANSYS CFX 2013 ANSYS, Inc. WS1-1 Release 14.5 Introduction This workshop models the dispersion of air bubbles
Flow Visualisation Studies - I
 Note DAPPLE - EnFlo xx May, 2004 Flow Visualisation Studies - I Alan Robins, Hong Cheng, Paul Hayden, Tom Lawton EnFlo, Surrey This note presents and discusses some preliminary flow visualisation studies
Undertow - Zonation of Flow in Broken Wave Bores
 Nearshore Circulation Undertow and Rip Cells Undertow - Zonation of Flow in Broken Wave Bores In the wave breaking process, the landward transfer of water, associated with bore and surface roller decay
Irrigation &Hydraulics Department lb / ft to kg/lit.
 CAIRO UNIVERSITY FLUID MECHANICS Faculty of Engineering nd Year CIVIL ENG. Irrigation &Hydraulics Department 010-011 1. FLUID PROPERTIES 1. Identify the dimensions and units for the following engineering
Experimental study on path instability of rising bubbles
 Experimental study on path instability of rising bubbles V. MOTURI, D. FUNFSCHILLING, J. DUSEK ICube, UMR 7357 Mécanique des fluids,2 rue Boussingault,67000,Strasbourg,France. viswa-maitreyi.moturi@etu.unistra.fr
Observed in Gas Injection
 Characteristics into Liquid* of Jetting Observed in Gas Injection By Yasuhisa OZAWA** and Kazum i MOR I * * Synopsis The present study is concerned with jetting behavior of gas jets injected into water
Impact of imperfect sealing on the flow measurement of natural gas by orifice plates
 Impact of imperfect sealing on the flow measurement of natural gas by orifice plates Rubens Silva Telles 1, Kazuto Kawakita 2 1 IPT Instituto de Pesquisas Tecnológicas, São Paulo, Brazil, rtelles@ipt.br
Improving Conventional Flotation Methods to Treat EOR Polymer Rich Produced Water
 Improving Conventional Flotation Methods to Treat EOR Polymer Rich Produced Water Authors: Frank A. Richerand, Frank Richerand II Yoosef Peymani www.envirotechsystems.com OBJECTIVES Compare IGF and DGF
Structure of Mechanically Agitated Gas-Liquid Contactors
 Structure of Mechanically Agitated Gas-Liquid Contactors 5 2 Structure of Mechanically Agitated Gas-Liquid Contactors 2.1 The vessel geometry The most commonly adopted geometry of a stirred gas-liquid
Fluid-Structure Interaction Analysis of a Flow Control Device
 Abaqus Technology Brief Fluid-Structure Interaction Analysis of a Control Device TB-06-FSI-2 Revised: April 2007. Summary The Vernay VernaFlo flow controls are custom-designed fluid flow management devices
Results of mathematical modelling the kinetics of gaseous exchange through small channels in micro dischargers
 Journal of Physics: Conference Series PAPER OPEN ACCESS Results of mathematical modelling the kinetics of gaseous exchange through small channels in micro dischargers Related content - The versatile use
New power in production logging
 New power in production logging Locating the zones where fluids enter the wellbore in a producing or injecting well is an important aspect of production logging. It is relatively straightforward to establish
the asset can greatly increase the success rate of Coriolis technology in this application. 3 Coriolis measurement in multiphase flow
 A Method for Identifying and Reducing Errors in Wet Gas Measurement with Coriolis Meters Justin Hollingsworth Emerson Automation Solutions 7070 Winchester Circle Boulder, CO 80301, USA 1 Introduction Effective
Combustion Characteristics of Pressurized Swirling Spray Flame and Unsteady Two-Phase Exhaust Jet
 Combustion Characteristics of Pressurized Swirling Spray Flame and Unsteady Two-Phase Exhaust Jet Martin B. Linck *, Ashwani K. Gupta, Guillaume Bourhis, and Ken Yu** The Combustion Laboratory University
Proceedings of Meetings on Acoustics
 Proceedings of Meetings on Acoustics Volume 9, 2010 http://acousticalsociety.org/ 159th Meeting Acoustical Society of America/NOISE-CON 2010 Baltimore, Maryland 19-23 April 2010 Session 1pBB: Biomedical
Experimental studies on the effect of the number of stages on the performance of an electrical submersible pump in two-phase flow conditions
 Fluid Structure Interaction VII 227 Experimental studies on the effect of the number of stages on the performance of an electrical submersible pump in two-phase flow conditions E. Salehi, J. Gamboa & M.
Air-Water Ring in the Vaneless Gap of a Reversible Pump-Turbine Operating in Condenser Mode
 Air-Water Ring in the Vaneless Gap of a Reversible Pump-Turbine Operating in Condenser Mode Introduction Elena Vagnoni *1, Loïc Andolfatto 1, Renaud Guillaume 2, Pierre Leroy 2 and François Avellan 1 Abstract
Analyzing a Malfunctioning Clarifier with COMSOL s Mixture Model
 Excerpt from the Proceedings of the COMSOL Conference 2008 Hannover Analyzing a Malfunctioning Clarifier with COMSOL s Mixture Model Arie C. de Niet,1, Arjen F. van Nieuwenhuijzen 1, and Arthur J. Geilvoet
Simulation of Gas Holdup in a Bubble Column with a Draft Tube for Gas Dispersion into an Annulus
 Simulation of Gas Holdup in a Bubble Column with a Draft Tube for Gas Dispersion into an Annulus Fukuji Yamashita Dept. of Applied Bioscience, Kanagawa Institute of Technology, Atsugi 243-292, Japan, yamasita@bio.kanagawa-it.ac.jp
CFD Analysis and Experimental Study on Impeller of Centrifugal Pump Alpeshkumar R Patel 1 Neeraj Dubey 2
 IJSRD - International Journal for Scientific Research & Development Vol. 3, Issue 2, 21 ISSN (online): 2321-613 Alpeshkumar R Patel 1 Neeraj Dubey 2 1 PG Student 2 Associate Professor 1,2 Department of
Numerical Analysis of Two Phase Flow Patterns in Vertical and Horizontal Pipes
 Numerical Analysis of Two Phase Flow Patterns in Vertical and Horizontal Pipes MOHAMMED A. ABDULWAHID, HASANAIN J. KAREEM, MUJTABA A. ALMUDHAFFAR Thermal Mechanical Engineering, Southern Technical University,
Flow transients in multiphase pipelines
 Flow transients in multiphase pipelines David Wiszniewski School of Mechanical Engineering, University of Western Australia Prof. Ole Jørgen Nydal Multiphase Flow Laboratory, Norwegian University of Science
Computation of Flow Behind Three Side-by-Side Cylinders of Unequal/Equal Spacing
 Computation of Flow Behind Three Side-by-Side Cylinders of Unequal/Equal Spacing H. K. Virahsawmy 1, L. Chen 2, I. R. MacGillivray 2, J. Tu 1 and Y. Zhou 3 1. School of Aerospace, Mechanical and Manufacturing
Applied Fluid Mechanics
 Applied Fluid Mechanics 1. The Nature of Fluid and the Study of Fluid Mechanics 2. Viscosity of Fluid 3. Pressure Measurement 4. Forces Due to Static Fluid 5. Buoyancy and Stability 6. Flow of Fluid and
An Experimental Performance Study of Vortex Tube Refrigeration System
 An Experimental Performance Study of Vortex Tube Refrigeration System Sankar Ram T. Department Of Industrial Refrigeration and Cryogenics T. K. M. College of Engineering Karicode, Kollam, Kerala sankarram9@gmail.com
EFFECT OF CORNER CUTOFFS ON FLOW CHARACTERISTICS AROUND A SQUARE CYLINDER
 EFFECT OF CORNER CUTOFFS ON FLOW CHARACTERISTICS AROUND A SQUARE CYLINDER Yoichi Yamagishi 1, Shigeo Kimura 1, Makoto Oki 2 and Chisa Hatayama 3 ABSTRACT It is known that for a square cylinder subjected
Oxygen mass transfer in a bubble column with non-newtonian fluids
 Scuola Politecnica e delle Scienze di Base Department of Civil, Architectural & Environmental Engineering Master Thesis in Environmental Engineering Oxygen mass transfer in a bubble column with non-newtonian
CFD SIMULATIONS OF GAS DISPERSION IN VENTILATED ROOMS
 CFD SIMULATIONS OF GAS DISPERSION IN VENTILATED ROOMS T. Gélain, C. Prévost Institut de Radioprotection et de Sûreté Nucléaire (IRSN), Saclay, France Abstract In order to better understand the risks due
AIR EJECTOR WITH A DIFFUSER THAT INCLUDES BOUNDARY LAYER SUCTION
 Engineering MECHANICS, Vol. 20, 2013, No. 3/4, p. 213 220 213 AIR EJECTOR WITH A DIFFUSER THAT INCLUDES BOUNDARY LAYER SUCTION Václav Dvořák* The article deals with axial-symmetric subsonic air-to-air
Návrh vratného kanálu u dvoustupňového kompresoru Return channel design of the two stage compressor
 Návrh vratného kanálu u dvoustupňového kompresoru Return channel design of the two stage compressor J. Hrabovský, J. Vacula, M. Komárek L. K. Engineering, s.r.o C. Drápela, M. Vacek, J. Klíma PBS Turbo
CFD for Ballast Water & Bio-fouling Management
 CFD for Ballast Water & Bio-fouling Management Vivek V. Ranade Catalysis, Reactors & Separation Unit (CReST) Chemical Engineering Division National Chemical Laboratory Pune 411008 vv.ranade@ncl.res.in
Copyright 1993 by ASME A DESIGN PROCEDURE FOR EFFERVESCENT ATOMIZERS
 THE AMERICAN SOCIETY OF MECHANICAL ENGINEERS 345 E. 47th St., New York, N.Y. 10017 93-GT-337 C The Society shall not be responsible for statements or opinions advanced in li papers or discussion at meetings
Hydrogen Bubble Seeding for Particle Image Velocimetry
 Hydrogen Bubble Seeding for Particle Image Velocimetry Benjamin T. Hillier 1 and Mitchell A. Schram. 2 The University of Melbourne, Melbourne, Victoria, 3010, Australia Dr. Jason P. Monty 3 The University
Development of Fluid-Structure Interaction Program for the Mercury Target
 Chapter 4 Epoch Making Simulation Development of Fluid-Structure Interaction Program for the Mercury Target Project Representative Chuichi Arakawa Authors Chuichi Arakawa Takuma Kano Ryuta Imai Japan Atomic
A. M. Dalavi, Mahesh Jadhav, Yasin Shaikh, Avinash Patil (Department of Mechanical Engineering, Symbiosis Institute of Technology, India)
") IOSR Journal of Mechanical and Civil Engineering (IOSR-JMCE) ISSN(e) : 2278-1684, ISSN(p) : 2320 334X, PP : 45-49 www.iosrjournals.org Modeling, Optimization & Manufacturing of Vortex Tube and Application
IOSR Journal of Mechanical and Civil Engineering (IOSR-JMCE) ISSN(e) : 2278-1684, ISSN(p) : 2320 334X, PP : 45-49 www.iosrjournals.org Modeling, Optimization & Manufacturing of Vortex Tube and Application
Pressure Drop of Two-Phase Flow Through Horizontal Channel with Smooth Expansion
 Purdue University Purdue e-pubs International Refrigeration and Air Conditioning Conference School of Mechanical Engineering 2012 Pressure Drop of Two-Phase Flow Through Horizontal Channel with Smooth
Aerodynamic Analysis of Blended Winglet for Low Speed Aircraft
 , July 1-3, 2015, London, U.K. Aerodynamic Analysis of Blended Winglet for Low Speed Aircraft Pooja Pragati, Sudarsan Baskar Abstract This paper provides a practical design of a new concept of massive
EWGAE 2010 Vienna, 8th to 10th September
 EWGAE 2010 Vienna, 8th to 10th September Acoustic Emission for monitoring two-phase flow Shuib HUSIN, A. ADDALI, David MBA Cranfield University, School of Engineering, Cranfield, Bedfordshire, M43 0AL,
World Academy of Science, Engineering and Technology International Journal of Mechanical and Mechatronics Engineering Vol:6, No:1, 2012
 Perfect Plastic Deformation of a Circular Thin Bronze Plate due to the Growth and Collapse of a Vapour Bubble M.T. Shervani-Tabar, M. Rezaee and E. Madadi Kandjani Abstract Dynamics of a vapour bubble
Optimization of Ejector's Performance With a CFD Analysis. Amanda Mattos Karolline Ropelato Ricardo Medronho
 Optimization of Ejector's Performance With a CFD Analysis Amanda Mattos Karolline Ropelato Ricardo Medronho 2 Introduction Ejectors Equipment industrially used and based on the Venturi phenomena; With
Development of a Simulation Model for Swimming with Diving Fins
 Proceedings Development of a Simulation Model for Swimming with Diving Fins Motomu Nakashima 1, *, Yosuke Tanno 2, Takashi Fujimoto 3 and Yutaka Masutani 3 1 Department of Systems and Control Engineering,
Efficiency Improvement of Rotary Compressor by Improving the Discharge path through Simulation
 Purdue University Purdue e-pubs International Compressor Engineering Conference School of Mechanical Engineering 2014 Efficiency Improvement of Rotary Compressor by Improving the Discharge path through
Investigation of Quasi-detonation Propagation Using Simultaneous Soot Foil and Schlieren Photography
 25 th ICDERS August 2 7, 2015 Leeds, UK Investigation of Quasi-detonation Propagation Using Simultaneous Soot Foil and Schlieren Photography Mark Kellenberger and Gaby Ciccarelli Queen s University, Kingston,
NUMERICAL INVESTIGATION OF THE FLOW BEHAVIOUR IN A MODERN TRAFFIC TUNNEL IN CASE OF FIRE INCIDENT
 - 277 - NUMERICAL INVESTIGATION OF THE FLOW BEHAVIOUR IN A MODERN TRAFFIC TUNNEL IN CASE OF FIRE INCIDENT Iseler J., Heiser W. EAS GmbH, Karlsruhe, Germany ABSTRACT A numerical study of the flow behaviour
System REITHER A Patented Venturi Scrubber
 System REITHER A Patented Venturi Scrubber Demonstrated efficiencies with fine particles, aerosols, mists and gases. ALTECH Technology Systems Inc. 12 Banigan Drive, Toronto, Ontario, Canada M4H 1E9 Tel: