WAV Level 2 Stream Monitoring Program
|
|
|
- Brittany Price
- 5 years ago
- Views:
Transcription


1 WAV Level 2 Stream Monitoring Program For all program logistics, equipment repair, and other questions, please contact: Ilana Haimes WAV Level 2 Coordinator E: ilana.haimes@wisconsin.gov P: Wisconsin DNR Mailing Address: WDNR WY/3 101 S. Webster St. Madison, WI 53703
2
3 Contents Project Background... 1 What is the importance of Level 2 stream monitoring?... 1 Volunteer Monitor Responsibilities... 1 Volunteer Qualifications... 2 Creating a Sampling Plan... 2 Forming a Monitoring Team... 3 Choosing Monitoring Sites... 3 Safety... 4 Your Role in Ensuring Quality Data... 5 Using the SWIMS database... 6 Data Summary Reports... 6 Stream Condition Assessment... 7 YSI Model 550a Dissolved Oxygen (DO) Meter... 8 YSI 550a DO Meter Calibration Procedure... 9 YSI 550a DO Meter Monitoring Procedure Oakton Acorn ph 5 and 5+ Meter Cal. procedure - ph 5 meter with original software and original outside casing Cal. procedure - ph 5 meter with updated software, but original outside casing Cal. procedure - ph 5+ meter with updated software and updated outside casing Oakton Acorn ph Meter Monitoring Procedure Transparency Tube Transparency Tube Monitoring Procedure Continuous Temperature Monitoring Procedure Launching the thermistor Deploying your thermistor in the stream During the field season Retrieving your thermistor from the stream Thermistor Logs Viewing your Thermistor Data Preventing the Spread of Aquatic Invasive Species Ways you can help prevent the spread of AIS Appendix A - WAMS, SWDV, and SWIMS Instructions How to Get a WAMS User ID and Password Requesting a Monitoring Station Finding New Site Locations using Surface Water Data Viewer Entering Monitoring Data into SWIMS Viewing or Editing your Monitoring Data in SWIMS Appendix B Datasheets and Calibration Logs Monitoring Datasheet DO Meter Calibration Log ph Meter Calibration Log Thermistor Log... 53
4 [This page was intentionally left blank] Water Action Volunteers - Level 2 Monitoring Protocol January 2016


5 Project Background Wisconsin Department of Natural Resources (WDNR) biologists monitor streams on a regular basis for a variety of parameters including: dissolved oxygen, air and water temperature, ph, and transparency. Your participation in the Water Action Volunteers (WAV) Level 2 monitoring effort will provide valuable data to the WDNR in order to supplement monitoring already being conducted by WDNR staff at other monitoring sites or in other streams around the state. What is the importance of Level 2 stream monitoring? Water quality and habitat assessment are high priority activities that the WDNR undertakes to document and monitor the status and trends of water resources throughout the state. Accomplishing this objective is an enormous task because of the magnitude of the state s water resources, the limited number of staff hours available to collect the data, and limited financial resources. Volunteer monitors can assist this effort by providing valuable data about waters of Wisconsin, but also by playing an essential role in helping to protect Wisconsin s natural resources as advocates for streams. Volunteers participating in the WAV Level 2 program follow WDNR stream monitoring methodologies and use WDNR approved equipment to monitor streams around the state. Level 2 stream monitoring began in 2006, and has ever since then provided a significant way for citizens to take an active role in collecting water quality data in partnership with the WDNR. If you carefully follow the methods and quality assurance procedures laid out in the following pages, your data are considered to be of high quality and will be entered into the WDNR s water quality database, Surface Water Integrated Monitoring System or SWIMS, for use by WDNR staff when evaluating stream health and making management decisions. Volunteer Monitor Responsibilities Volunteers who are new participants of the program must: Attend a scheduled training session, which will have both field and classroom components, to learn the monitoring protocol. Collect dissolved oxygen, air and water temperature, ph and transparency data at least one time per month from April October. Adhere to a predetermined monitoring schedule. Record data results in SWIMS (the WDNR water quality database) following each monitoring event. 1
6 Volunteer Qualifications To participate in the WAV Level 2 program, volunteers must meet the following qualifications: Must have one season of monitoring experience (e.g. with Water Action Volunteers, Level 1 monitoring program). Ability to walk along riverbanks and enter the water to access a monitoring site. Enjoyment of the outdoors. No science background is needed, as training will be provided to those who are interested and able to meet the defined responsibilities. Creating a Sampling Plan WDNR biologists will recommend sites that could be useful to have monitored based on needs to acquire information regarding water quality status or long-term trends, or other types of monitoring that may be a priority. WDNR methods dictate that status and trends monitoring are completed at consistent intervals. This type of monitoring places an emphasis on consistency, rather than monitoring only when it s convenient for the volunteer. Therefore, we ask that you monitor on a regular, predetermined schedule. Guidelines for scheduling monitoring events include: Plan to monitor at least once per month from April through October. Space monitoring dates apart by roughly 30 days. o For instance, plan to monitor on the second Tuesday of each month or on the 22 nd of each month in order to stay consistent. Schedule a Primary date and a Safety date for each month. o Monitor on your Safety date only if either an electrical storm or flooding keep you from monitoring on your Primary date. Safety dates are also predetermined dates and are typically scheduled a couple of days or one full week after your Primary date. o If you are unable to monitor on your Primary or Safety date, then monitor when possible and record Other (O) on your datasheet. o The only reasons we ask you not to sample on a primary date is due to safety concerns about being at the stream site (e.g., tornado, lightning, dangerously high flows), or a true family emergency (a Hex hatch doesn t count!). Try to schedule monitoring events in the morning to when stream s oxygen levels are at their lowest. This provides biologist with a worst case scenario. If you are unable to monitor in the morning, please try to be consistent as to the time of day that you go out sampling as water quality parameters fluctuate diurnally. Once you are done with your monitoring activities each moth, it is important that you make time to enter your monitoring data into the SWIMS database by the end of each month to ensure that the data can be reviewed for any inconsistencies. The WAV coordinator is responsible for answering any questions you may have about entering monitoring data into the database so be sure to use them as a resource when needed. All data must be entered into the SWIMS database at the conclusion of each monitoring season (by November 1 at the latest) so that a final quality assurance check can be done and 2
7 monitoring reports can be created. All volunteers must turn in their equipment at the end of each season, though considerations can be made if necessary. Some equipment is available for further use once data have been downloaded and equipment has received any necessary maintenance. Please inquire with the WAV program coordinator. Forming a Monitoring Team Monitoring in teams can make tasks easier and more enjoyable. Some things citizen monitors will want to keep in mind when forming a team of people to complete monitoring: Each member of the team must fill out a Volunteer Liability Waiver and return it to the WAV program coordinator. This information also helps us to track how many volunteers are involved in the program. Not everyone on a team needs to register with SWIMS; one person can be in charge of data entry for the team. The larger your team, the more sites you can monitor. Please remember to be realistic about the time commitment and try not to overextend yourselves. Having several people on your team helps to ensure that you are able to stick to your scheduled monitoring dates. Monitoring with a team can easily turn into a social event! Experienced volunteers have found all sorts of ways to couple monitoring with fishing, brewing beer, paddling, or other such fun! Choosing Monitoring Sites You are free to choose stream sites that you or your group wishes to monitor. While this situation places no requirements on the location of your monitoring, we ask that you consider any monitoring site requests made by WDNR biologists, county staff, or other agency staff persons when selecting your sites. Sites should be monitored for 3-5 years at a minimum, as the goal of the Level 2 Program is to collect data pertaining to status and long-term trends in water quality, and thus an extended period of monitoring is required. Data collected at all locations are important. There are two ways to look at selecting monitoring sites. First, your data may very well be more useful to the WDNR and/or other agencies when taking into account the recommendations of natural resource managers. Second, your monitoring might be more valuable to you if you or your group has a good idea how you would like to use the data. Where agency staff persons might choose to place you depends on both short-term and longterm monitoring goals. Sometimes, long-term (8-10 years) data collecting at set locations will be most useful to the ongoing work, and in other cases, changing your monitoring locations to complement short-term (1-3 years) studies may be most useful to ongoing work. For every new monitoring station that you or your group plan to monitor at, you will be asked to provide the geographic information necessary to allow the WAV coordinator or DNR Data Manager to create a new monitoring station ID in the SWIMS database. To request a new monitoring station with the WAV program, please see the Requesting a Monitoring Station section on page 36 of this manual. 3

8 Safety Safety precautions of a general nature should be recognized at all times. Your safety while monitoring should be your highest priority, so please remember to be careful and be mindful of changing stream and weather conditions! Stream monitoring in extremely hot and humid weather carries the risk of dehydration and heat stroke. Never sample during electrical storms or high wind events. For general safety consideration, a first aid kit should always be carried with you when in the field. Be aware of stream velocity, water depth, and bottom conditions at your stream-monitoring site. Do not attempt to perform monitoring responsibilities if water velocity appears to be fast enough to knock you down when you are working in the stream. If you are unsure of water depth across the width of the stream, be sure to proceed with caution as you move across the stream, or choose an alternate point from which to monitor. If you are not comfortable with the stream conditions, do not monitor at this time. Your safety is important! Volunteers under the age of 16 must be accompanied by a parent or group leader who will be responsible for their actions if part of a group volunteer activity. Volunteers under 18 must have written permission from a parent or legal guardian to participate. A completed Parent Permission and Acknowledgement Form or similar written permission should be submitted prior to participation. Please contact the WAV coordinator if you have any questions! 4
9 Your Role in Ensuring Quality Data The data are only as good as the care taken in collecting and recording them. It is of ultimate importance to follow standard procedures when monitoring and entering data into SWIMS. What do you need to do to help out with quality assurance and quality control? 1. Calibrate Instruments Each month that you monitor, please follow the instructions for calibrating both the dissolved oxygen (DO) and ph meters, step by step. This includes completely filling out the calibration logs for each meter every time you calibrate the meters. Good record keeping assures us that the meters are well maintained and functioning properly. 2. Fill Out Calibration Logs and Your Data Recording Form Completely Be sure to complete all entries on your calibration logs and monitoring datasheet and add any comments that may assist others in understanding your data. Return all monitoring datasheets and calibration logs to the WAV coordinator at the end of the season. 3. Datasheets submitted to the WAV coordinator without the monitor/monitoring group s name, date and time of the monitoring event, and the monitoring location (name and station ID#) will be omitted from review. This information is crucial for the WAV coordinator to use when reviewing the data for quality assurance purposes. 4. Address Abnormal Results If a measurement is outside the expected range (as indicated on your datasheet), please repeat the measurement. If it s still outside the expected range, please recalibrate and then repeat the measurement. If you are finding an abnormally low or high value, then call the WAV coordinator or your local WDNR biologist as soon as possible. 5. Enter Data in a Timely Fashion Follow the instructions for entering data into the SWIMS database, and pay close attention to the numbers you are entering, as well as the placement of those decimal points. If you find results out of range, please report those results immediately. Otherwise, please complete your data entry to SWIMS by the end of each month. 6. Review your Data Check to make sure that you entered the data correctly. To do so, see the instructions for entering and viewing data in the database (page 39). Also, when entering your data, please keep in mind that you should skip over all parameters that you did not monitor. SWIMS will recognize all 0 entries as data and they will be analyzed as such. 7. Participate in Side-by-Side Sampling Each year, the WAV coordinator or your local coordinator will visit with many citizen monitors in the field. During this visit, the coordinator will monitor side-by-side with the volunteer, using their own equipment. This is done to check equipment function and protocol consistency. The coordinators keep annual records on the results of the side-byside sampling. 5
10 Using the SWIMS database SWIMS is the acronym for the Wisconsin Department of Natural Resources (WDNR) Surface Water Integrated Monitoring System database. This database is available to biologists across the state of Wisconsin and is an integral part of how the WAV stream monitoring data are communicated to those individuals working on various water quality issues on rivers and streams in Wisconsin. After each stream monitoring event, someone (only one person, please) must enter your team s data in SWIMS. It is encouraged that all WAV members view and explore the data available in SWIMS and learn more about the meaning of the data they are observing and recording. Any WAV volunteer who wishes to enter, edit, or view data in SWIMS must take the following steps in order to gain access to the SWIMS database: 1. Obtain a Wisconsin Access Management User ID (WAMS ID). a. See Appendix A - How to Get a WAMS User ID and Password 2. the following information to the WAV program staff: a. WAV member name (first and last) b. Organization name (if applicable) i. The first two steps only have to be done once to setup your account c. WAMS username d. List of monitoring site(s) (station name and number) 3. You may have to apply to have new sites registered in SWIMS (if needed). Contact the WAV coordinator for instructions as to how to register new sites. a. See Appendix A - Finding New Site Locations using Surface Water Data Viewer 4. Wait for WAV program staff to be in touch with you that you are set to enter data in SWIMS (or send a gentle reminder or call them if it s been more than two weeks since you sent in your information). More information can be found about how to properly enter and review your water quality monitoring data in the SWIMS database online in Appendix A of this protocol and on the WAV website: Data Summary Reports WAV makes data reports available to all citizen monitors participating in the Level 2 stream monitoring program. You can obtain station specific and/or regional data summary reports or continuous temperature graphs for a site from the SWIMS database by following directions posted at: 6

11 Stream Condition Assessment Tips for assessing if water level is high, normal or low This is something that you will feel more comfortable with assessing the more you visit your stream site. Some things to look for when you first visit your monitoring site to help you evaluate the condition of the stream include: Look to see if terrestrial vegetation along banks is submerged. The terrestrial vegetation will end at the normal high water mark. Look for water stains on rocks or bridge abutments. Water will stain rocks if it flows over or by them for an extended period of time. If you see stains above the level of water in the stream during you visit, the level is likely low. This assessment should be conducted immediately upon arriving at your monitoring location as the results may impact your other monitoring activities. The results from your assessment should be recorded in the Current Stream Condition row near the top of the datasheet. If the stream condition is found to be unsafe (flooding or frozen) or not ideal for monitoring activities (dry or stagnant) when you arrive at your monitoring location, please be sure to still enter a fieldwork event into the SWIMS database, indicating as to why you were unable to complete your monitoring activities. Understanding why monitoring data was not collected at any given time (especially due to the condition of the stream) is still an important record to keep track of in the database. 7

12 YSI Model 550a Dissolved Oxygen (DO) Meter The YSI 550a Dissolved Oxygen (DO) meter needs to be calibrated before being used in the field each and every time you monitor. Once calibrated, the meter must be left on until you/your team is done with monitoring activities for the day at all monitoring locations. In order to avoid damaging the meter, do not let sponge inside the probe chamber dry. Maintaining a damp environment in the chamber will help to ensure that your meter has high quality performance throughout the field season. Keep sponge moist by re-wetting it, at least bi-weekly, if not more frequently. If the sensor membrane becomes damaged, you will need to replace it (contact the WAV coordinator for assistance) and then wait at least 1 hour before calibrating and using the meter to monitor at your stream site. Get to know your YSI 550A DO meter Innssttrruumeenntt I ddi issppl laayy: displays temperature in either C or F and dissolved oxygen in either mg/l (milligrams per liter) or % air saturation. Power button: powers the unit on or off. Backlight button: turns the display backlight on or off. The light will turn off automatically after two minutes of non-use. Mode button: allows the user to select between % and mg/l during calibration process. When monitoring, pushing Mode switches the instrument display between DO %, DO mg/l, and salinity calibration. Arrow keys: increases or decreases the value during calibrations. : enter button Probe: use to monitor water temp and dissolved oxygen content. Clean the probe with DI water after each monitoring event and store in the calibration chamber when not in use. Maintaining your YSI 550A DO meter Verify that the sensor membrane is in good condition by removing the sensor from the storage chamber and check that the sponge is damp, if there are holes or tears in the membrane, and for air bubbles beneath the membrane. If air bubbles or damage to the membrane is evident, replace the membrane housing and solution. Ensure that membrane housing has been filled with KCl solution for at least 1 hour before calibration and first use. Training videos for how to calibrate the YSI 550A meter and monitor with it are available on the WAV website ( Please contact your local coordinator or the WAV coordinator if you have any questions! 8
 **The numbers along the top of the calibration log")


13 YSI 550a DO Meter Calibration Procedure *Before calibrating your meter at the beginning of the field season, please fill out the top portion of the calibration log with the following information: Your name as well as that of any other team members Your organization name The serial number for your meter (located on the back of the meter) **The numbers along the top of the calibration log correspond to the steps in the protocol. 1. Turn on the meter and allow at least 15 minutes of warm up time before calibration. Be sure to note the time that you turned on the meter as this information will be important during the calibration process. 2. Verify that the sensor membrane is in good condition by removing the sensor from the calibration/storage chamber and doing the following: Check that the sponge is damp (rewet if necessary). Shake or blow off excess water on the sensor. Check for holes or tears in the membrane. Check for air bubbles beneath the membrane. 3. Reinsert the sensor into the calibration/storage chamber at the back of the meter. 4. On the calibration log, record the date, time, name of analyst (who is calibrating the meter), and the altitude (in feet) at which the calibration is taking place. You can find your local altitude by using a Wisconsin Atlas and Gazeteer or a USGS topographic map. i. Elevations may appear in meters, but you can convert meters to feet by multiplying the meter value by Record the number of minutes of warm up time on the DO calibration log. 6. Record the stabilized probe temperature ( C) on the DO calibration log (red box). 7. Record the stabilized pre-calibration D.O. (mg/l) on the DO calibration log (orange box). Press the MODE button to change from % saturation to mg/l. 9


 in feet.")


.")
.")
14 8. Press and release both the UP ARROW and DOWN ARROW keys at the same time to enter the calibration menu. The meter will say CAL on the screen in large letters and CAL in small letters in the lower left corner. This will stay on the screen until the calibration process is done. 9. Press ENTER on the meter to show a value for altitude (x100) in feet. For example, enter a 9 here indicates 900 ft and a 12 indicates 1200 ft. 10. Adjust the altitude with the up and down arrow buttons for the elevation where the calibration is taking place and press ENTER. The % saturation value is now showing on the meter display. 11. Allow the % saturation value (red box) to stabilize on the screen This may take a minute or two to happen 12. Press ENTER (orange box). The salinity of the water samples is now on the screen. 13. Press ENTER again to accept 0 (the salinity of fresh water). The calibrated % saturation value is now on the screen (red box) and the small CAL is no longer visible in the lower left corner. 14. Press the MODE key (orange box) to switch to mg/l. (This key is used to toggle between mg/l and % saturation.) 10
 and the altitude (x-axis) and record the corresponding D.O. (mg/l) value as the calibration chart D.O. on the calibration log.")
15 15. Record the post-calibration D.O. (mg/l) on the calibration log. 16. Look up the calibration chart D.O. value (mg/l) from the table (available on the next two pages of this manual and as a laminated sheet in the monitoring kit). To read the table, find the probe temperature (y-axis) and the altitude (x-axis) and record the corresponding D.O. (mg/l) value as the calibration chart D.O. on the calibration log. If the difference between the post-calibration D.O. and the calibration chart D.O. is greater than 0.3 (mg/l), re-calibrate the meter before using in the field. 17. Record any comments about the calibration process in the Comments field on the log. 18. Conduct a post-calibration drift test to verify accuracy of your calibration If unsuccessful, check on the condition of the probe tip and contact the WAV coordinator for further instructions. **Post Calibration Drift This quality control step must be performed to insure the collection of accurate data. After calibration, check the meter for drift. This is a check as to how well the meter is holding the calibration. Leave the meter where you calibrated it (this step is important to insure a stabilized temperature) and walk away for 5 minutes. Upon returning, the DO percent saturation value should be within a couple of percent of the calibrated percent saturation value you recorded. If it has drifted more than a couple of percent, you must remove the cap membrane to check the condition of the probe. If necessary, refurbish the probe tip according to your instrument s manual, and change the solution and membrane (contact the WAV coordinator for further instructions. Once the refurbishment process is completed, wait one hour before repeating the calibration procedures listed above (Steps 1-18). 19. After completing a successful calibration and post-calibration drift test, the DO meter should be left on until the last reading of the day is completed. 20. Once monitoring is complete, moisten the sponge in the calibration chamber and turn the meter off before storing it in the monitoring kit until the next field event. Note: If you notice your meter is not calibrating properly, please check for bubbles or tears in the membrane and replace if necessary. If replacing the membrane does not work, try cleaning the probe by following instructions in the instrument s manual (located in the pocket of your meter case) or contact the WAV coordinator for further instructions or to inquire about a replacement new meter. 11
16 Dissovled Oxygen Saturation (mg/l) Based on Elevation or Ambient Barometric Pressure (Station Pressure) Temp Elevation Feet Above Sea Level/Equivalent Un-Corrected 1 Barometric Pressure mm Hg C F Elv: * -200 Press:
17 Dissovled Oxygen Saturation (mg/l) Based on Elevation or Ambient Barometric Pressure (Station Pressure) *Dissolved oxygen saturation at 760 mm Hg derived from the tables of Benson & Kuause (1980), from C.M. Mortimer The oxygen content of air-saturated fresh waters over ranges of temperature and atmospheric pressure of limnological interest. Mitt. Int. Ver. Limnol. No. 22. Stuttgart, Germany. Temp Elevation Feet Above Sea Level/Equivalent Un-Corrected 1 Barometric Pressure mm Hg C F Elv: * -200 Press: Dissolved oxygen saturation values based on elevation due not account for TRUE station pressure. For more accurate dissolved oxygen saturation values use un-corrected pressure measurements. Uncorrected barometric pressure values = National Weather Service Barometric Pressure in mm Hg x (Equivalent elevation pressure/760) Source: J. Sullivan, WDNR-LaCrosse, March 2006
, the station name, and the station ID #, as well as the date and time of the monitoring event.")
18 YSI 550a DO Meter Monitoring Procedure Before going out to your stream site to monitor dissolved oxygen (or any parameter), please remember to fill out the top portion of the monitoring datasheet with your name (s), the station name, and the station ID #, as well as the date and time of the monitoring event. It is also important that you indicate what type of equipment was used to monitor for dissolved oxygen. In this case, you will circle the YSI 550A Meter option on your datasheet. To measure dissolved oxygen (DO) in the stream: 1. With the DO meter in hand, enter the stream downstream from your monitoring location (as to not disturb the bottom sediment as you move towards the site). a. You can also monitor dissolved oxygen from a bridge overpass as to not disturb the bottom sediment. 2. Remove the probe from its chamber and insert it into the water to be measured. a. Continuously stir or move the probe through the water (especially when monitoring in very still water) while taking the measurement. 3. Allow the temperature and dissolved oxygen readings to stabilize. a. This should take anywhere from 2 to 5 minutes. 4. Observe and record the water temp and the DO values on the monitoring datasheet. 5. Press the MODE button to change the instrument display. 6. Observe and record the % saturation value on the monitoring datasheet. 7. Rinse the probe with distilled water after each use, and return it to the storage chamber. 8. Before storing the meter in the carrying case, moisten the probe sponge by soaking with distilled water. 9. Press the green button on the meter to turn if off at the conclusion of the day s monitoring effort. 14
 3. ph 5+ (updated software and updated outside casing) ph 5 meter ph 5+ meter Which ph meter do I have?")

19 Oakton Acorn ph 5 and 5+ Meter WAV volunteers currently use one of three different ph meters: 1. ph 5 (original software and original outside casing) 2. ph 5 (updated software, but original outside casing) 3. ph 5+ (updated software and updated outside casing) ph 5 meter ph 5+ meter Which ph meter do I have? Before calibrating your ph meter, you will first need to ascertain which meter version you are using. This information is important to know because the calibration protocol is varies slightly between the different software versions. The only way to tell if you have meter version #1 or #2 is by going through the calibration process and seeing what happens between the calibration with the ph 7 buffer solution calibration and the calibration with the ph 10 buffer solution. The original software tells the meter to exit calibration mode and return to measurement mode upon completion of the first calibration point. This means that you will complete two one point calibrations as you have to re-enter calibration mode in order to complete the ph 10 calibration. The software update on the newer meters keeps the meter in calibration mode throughout the calibration process (the values on the screen will continue to blink). This means that you will complete a two point calibration when calibrating the meter. For all meters used by WAV volunteers Both the Oakton Acorn ph 5 and the 5+ meters need to be calibrated before being used in the field each and every time you monitor throughout the field season. Once calibrated, the ph meter can be turned on and off between monitoring events if you monitor at multiple locations in one day (unlike the DO meter). When calibrating your meter, please use both the ph 7 and ph 10 buffer solutions (NIST) provided in order to calibrate the meter. Do not reuse the buffer solutions following the calibration as contaminants in the solution can impact the accuracy of the calibration and the field measurements. 15
20 In order to avoid damaging the meter, be sure to keep the ph electrode (specifically the bulb at the end of the probe) wet when not in use. Store the electrode in the electrode soaker bottle and keep it filled with electrode storage solution. Refresher storage solution can be found in your monitoring kit. Contact the WAV coordinator if you need more solution. If you notice your meter is not calibrating properly, try cleaning the probe by following the instructions in the instrument s manual (located in the pocket of your meter case) or contact the WAV coordinator for directions. *Before calibrating your meter at the beginning of the field season, please fill out the top portion of the calibration log with the following information: Your name, as well as that of any other team members The name of your organization The serial number for your meter (located on the back of the meter) The type of meter that you are using o This can be recorded after the first calibration is completed 16
21 Cal. procedure - ph 5 meter with original software and original outside casing This calibration process will be completed by conducting two one-point calibrations. This means that the meter will complete a single point calibration and then exit calibration mode each time. You will have to restart the calibration process when using the ph 10 buffer solution by pressing the CAL button. 1. Connect ph and temperature probes to meter. a. Ensure that the ph probe connecter snaps into place. 2. Turn the meter on by pushing the On/Off button on the face of the meter. 3. Record the date, time, and the name of analyst performing the calibration on the calibration log. 4. Remove the ph electrode from the electrode soaker bottle. 5. Rinse the ph electrode with distilled water and shake the excess water off of the electrode. 6. Click the MODE button to find the temperature reading and record value on the calibration log. 7. Click the MODE button again to return to the ph screen on the meter. 8. Press the CAL button on the meter in order to start the calibration process (blinking). 9. Place the electrode and temperature sensors into the ph buffer solution and submerge the glass bulb completely in the solution. 10. Wait for the reading to stabilize and record the Stabilized ph value on the calibration log. 11. Press the ENTER key once and record the Calibrated ph value (the meter is now out the calibration mode and in measuring mode). 12. Check that the Calibrated ph value is within 0.2 of the ph buffer standard (7 or 10). a. If the value is more than 0.2 higher or lower than its ph buffer value (compare values in the grey columns, outlined in blue), recalibrate the meter (new line). b. Record the new results on the next line of the ph meter calibration log. 13. Remove the electrode from the buffer solution (refill if necessary), rinse with distilled water and shake off the excess water from the electrode. 14. To finish the calibration, repeat steps 6 through 12 for the ph 10 buffer solution. 15. Replace the ph probe in the electrode soaker bottle (refill if necessary), turn the meter off, and head out to the field to complete your monitoring activities. 17

. 1. Connect the ph and temperature probes to meter. a. Ensure that the ph probe connecter snaps into place. 2.")
22 Cal. procedure - ph 5 meter with updated software, but original outside casing The updated software version in the ph 5 allows for you to complete a two-point calibration without ever leaving the calibration mode. After you press ENTER following the first calibration, the value on the screen will continue to blink, indicating that it is still in calibration mode (unlike the old version that stopped blinking after you hit ENTER and went into measuring mode). 1. Connect the ph and temperature probes to meter. a. Ensure that the ph probe connecter snaps into place. 2. Turn the meter on by pushing the On/Off button on the face of the meter. 3. Record the date, time, and the name of analyst performing the calibration on the calibration log. 4. Remove the ph electrode from the electrode soaker bottle. 5. Rinse the ph electrode with distilled water and shake the excess water off of the electrode. 6. Click the MODE button to find the temperature reading and record value on the calibration log. 7. Click the MODE button again to return to the ph screen on the meter. 8. Press the CAL button on the meter in order to start the calibration process. 9. Place the electrode and temperature sensors into the ph 7 buffer solution and submerge the glass bulb completely in the solution. 10. Wait for the reading to stabilize and record the Stabilized ph value on the calibration log. 11. Press the ENTER key once and record the Calibrated ph value 12. Check that the Calibrated ph value is within 0.2 of the ph 7 buffer standard. a. If the value is more than 0.2 higher or lower than its ph buffer value (compare values in the grey columns, outlined in blue), recalibrate the meter. b. Record the new results on the next line of the ph meter calibration log. 13. Remove the electrode from the ph 7 buffer solution, rinse with distilled water and shake off the excess water from the electrode. 14. Place the electrode and temperature sensors directly into the ph 10 buffer solution and submerge the glass bulb completely in the solution 18
 so that you remember that you can t fill in")
23 **With the software update, the meter stays in calibration mode between buffer solutions in order to complete the two-point calibration. This means that you will not be able to record the temperature for the ph 10 buffer solution either leave the space blank or scribble out the column ( ) so that you remember that you can t fill in this column. 15. Wait for the reading to stabilize and record the Stabilized ph value on the calibration log. 16. Press the ENTER key once and record the Calibrated ph value a. The ph reading on the screen will stop blinking as the meter should have exited calibration mode and entered measurement mode. 17. Check that the Calibrated ph value is within 0.2 of the ph 7 buffer standard. a. If the value is more than 0.2 higher or lower than its ph buffer value (compare values in the grey columns, outlined in blue), recalibrate the meter. b. Record the new results on the next line of the ph meter calibration log. 18. (the value on the screen will stop blinking as the meter should have exited calibration mode and entered measurement mode). 19. Remove the electrode from the ph 10 buffer solution, rinse with distilled water and shake off the excess water from the electrode. 20. Replace the ph probe in the electrode soaker bottle (refill if necessary), turn the meter off, and head out to the field to complete your monitoring activities. Cal. procedure - ph 5+ meter with updated software and updated outside casing For the ph 5+ meter, the updated software version from the ph 5 is all wrapped up in a brand new package! The updated version allows for you to complete a two-point calibration without ever leaving the calibration mode. After you press ENTER following the first calibration, the value on the screen will continue to blink, indicating that it is still in calibration mode (unlike the old version that stopped blinking after you hit ENTER and went into measuring mode). Follow the calibration procedure list above (page 19) for the ph 5 meter with the updated software, but original outside casing in order to properly calibrate your ph 5+ meter. Please contact your local coordinator or the WAV coordinator if you have any questions about how to properly calibrate any of the meters! 19
24 Oakton Acorn ph Meter Monitoring Procedure Before going out to your stream site to monitor ph (or any parameter), please remember to fill out the top portion of the monitoring datasheet with your name (s), the station name, and the station ID #, as well as the date and time of the monitoring event. To measure ph in the stream: 1. Connect any electrodes to the ph meter and turn the meter on by pushing the On/Off button on the face of the meter. a. The meter does not have to be left on following the calibration process. 2. Remove the electrode from the electrode soaker bottle. a. Place the electrode soaker bottle to the side. 3. Rinse off the electrode with distilled water and shake off any excess water. 4. Wade into the middle of the stream from a safe access location a. Walk upstream from the access point (downstream of monitoring location) as to not disturb the bottom substrate. 5. Place ph and temperature probes into the stream and gently stir the probes. 6. Wait 2-3 minutes for ph reading to stabilize. 7. Record the ph reading on the monitoring datasheet. 8. Rinse the electrode with distilled water and shake off the excess water. 9. Place the electrode back in the electrode soaker bottle. a. Refresh storage solution if necessary. 10. Turn the meter off using the On/Off button on the face of the meter. 11. Disconnect the electrodes from the meter and store the meter and electrodes in the carrying case until the next monitoring event. A refresher video for how to monitor ph with the Oakton Acorn ph meter is available on the WAV website ( Please contact your local coordinator or the WAV coordinator if you have any questions! 20
25 Transparency Tube Sample Collection Collect the sample away from the stream bank in the main flow (well-mixed) area. Be careful not to disturb the stream bottom when you collect the water sample. If you get sediment from bottom disturbances, dump out the sample, move upstream (away from the disturbed area) and try again. For the observer, consistency is the key. If you initially wear your eyeglasses when you take the reading, then always wear your eyeglasses to take this measurement. However, you should never wear sunglasses when you take this reading. Before going out to your stream site to monitor transparency (or any parameter), please remember to fill out the top portion of the monitoring datasheet with your name (s), the station name, and the station ID #, as well as the date and time of the monitoring event. It is also important that the length of the transparency tube is recorded on the monitoring datasheet for each monitoring event as this information will be used when the data is evaluated as part of the quality assurance process. In Stream 1. Make sure that the clamp on the drain tube is closed 2. Walk into the water at an access point downstream from the sampling location. a. Be careful not to stir up the bottom sediment upstream of your sampling location. 3. Face upstream (into the current) in the middle of the stream or in a well-mixed area offshore. 4. Collect your water sample by plunging your bucket or transparency tube 8-12 inches beneath the surface or halfway down from the surface. a. If using a bucket, scoop away from your body and into the current. 5. Cover the top of the transparency tube after you have filled it with water and return to shore to take the reading. From Shore To collect a sample while standing on the shore, use a bucket or sample bottle attached to a pole so that you can reach the water from your on shore location. Scoop from below the surface in the upstream direction and be careful not to stir up the sediment upstream of your sample. Pour the water into the transparency tube in order to take the transparency measurement. Collect additional samples if more water is needed to fill the transparency tube all the way to the top. 21

 disc on the bottom of tube. a. If disc is visible, record the length of the tube (e.g., 60, 100, or 120 cm) on the datasheet. 5.")
26 Transparency Tube Monitoring Procedure 1. Remove large objects from the water sample. a. If necessary, filter through a nylon stocking. 2. If the sample has settled, use a stirring stick to stir the sample, or pour the sample into a clean bucket and back into the transparency tube to suspend all materials. 3. Stand out of direct sunlight and remove sunglasses if you are wearing them. a. If you cannot get to a shady place, use your body to cast a shadow on the tube. 4. Looking into the transparency tube for the target (black and white) disc on the bottom of tube. a. If disc is visible, record the length of the tube (e.g., 60, 100, or 120 cm) on the datasheet. 5. If target disc is not visible, have your partner let water out a little at a time using the valve at the bottom until disc is just visible. a. Have them stop letting water out immediately when you can just see the contrast between black and white on the disc at the bottom of the tube. 6. Read the level of water in the tube using the measuring tape on the side of the tube. a. Measurement will be in centimeters. 7. Record the measurement on your monitoring datasheet in the appropriate column. 8. Dump contents of tube on ground. 9. Collect a new sample and repeat steps 1 through 8 in order to complete a second trial. 10. Record the second measurement in cm on your monitoring datasheet. A refresher video for how to monitor water clarity with a transparency tube is available on the WAV website ( Please contact your local coordinator or the WAV coordinator if you have any questions! 22
27 Continuous Temperature Monitoring Procedure **Revised for WAV from Wisconsin DNR Apr 2010 Standard Operating Procedures Background Information Temperature has an important influence on ph, density, specific conductance, the rate of chemical reactions, and solubility of constituents in water. The biological activity and species composition of a water body is largely determined by water temperature as well. As part of the WAV program, continuous temperature data will be collected using continuous temperature monitoring devices called thermistors. One thermistor is available for each Level 2 sampling site. If your group is interested in placing thermistors at additional locations, contact the WAV coordinator to see if extra thermistors are available. Collecting continuous water temperature data on all sizes and types of streams small, medium, and large; warm, cool and cold; and across the range of stream classifications - is incredibly useful when making management decisions. Long-term water temperature data are useful for interpreting temporal variations in a stream or river. The continuous temperature data collected by WAV volunteers can be used to: Document baseline water temperatures. Determine a stream's temperature category - cold, cool, or warm water. Aid in documenting and determining the effects of thermal discharges on aquatic biota. Aid in location of groundwater influence to streams. Document point source and nonpoint source storm-water effects on streams. Document thermal impacts of structural dams and beaver dams to cold water streams. Distinguish brown trout streams from potential native brook trout streams. Document changes in stream temperatures after installation of agricultural and urban best management practices. Aid in development of a model using landscape factors to predict stream temperatures. Assess the impact of climate change. Temperature ranges for cold, cool and warm water stream (as per John Lyons, WDNR research scientist) are as follows: Cold = maximum summer daily mean temperature <22 C (<72 F) Cool = maximum summer daily mean temperature 22 to 25 C (72 to 77 F) Warm = maximum summer daily mean temperature >25 C (>77 F) These classes of streams support different types of fish species. The best quality coldwater streams have relatively few species of fish as compared to warm water streams. Salmonids, such as brook trout, dominate the fish populations in the best quality coldwater streams, while brown trout, an exotic salmonid species, dominate coldwater streams that have slightly less pristine water quality. Bass, darter, and sucker species are more prevalent in warmwater streams than in coldwater streams. See the figure on the following page for a visual representation of temperature requirements for different aquatic species. 23
.")
28 The thermistors will be set to record temperature at one hour intervals to assess thermal extremes and to help determine stream temperature classifications (cold, cool, or warm). It is expected that volunteers will check on the thermistors at least once a month to ensure that they are in place and submerged in the stream (not covered by silt or vegetation). Launching the thermistor Thermistors will be launched by the WAV coordinator and distributed to volunteer monitors and/or local coordinators to be deployed at stream monitoring locations across the state. New in 2016 volunteers are being asked to leave the thermistors installed at their stream monitoring site throughout the winter months (instead of pulling them in fall). Each spring, the WAV coordinator will send out a schedule directing you as to when your thermistor should be pulled the following year so that a replacement thermistor can be sent to you before your current thermistor is pulled so that little to no data is missed during the retrieval process. Following the schedule, volunteers are to retrieve the thermistors and return them to the WAV coordinator for data retrieval and uploading into SWIMS. 24

29 Contact the WAV coordinator if you believe that the thermistor should be pulled in the fall due to concerns about vandalism or loss of thermistor during spring snowmelt (high flow). Whenever possible, it is best to leave the thermistor in the stream as to collect the winter temperature data, but there will be cases in which the thermistor should be pulled. Deploying your thermistor in the stream Please consider these key points when selecting the location for deploying your thermistor: a. Temperature data should be collected from an area that is representative of the stream reach (well-mixed horizontally and vertically) b. The thermistor must remain submerged for the whole season c. Avoid having the thermistor get buried by sediment or debris as this may alter the thermistors ability to accurately record water temperature d. Secure the thermistor so that it will not be lost during the monitoring season o i.e. following heavy rain events, vandalism, etc Installation near a riffle or run is preferred to being installed in a pool. Whenever possible, sensors should be deployed 6 inches (<0.5 ft) above the stream bottom, though there may be situations (i.e. when deploying thermistors in shallow streams) where there is no choice but to place a sensor near the stream bottom so that it remains submerged during low flows. Seek shade so as to minimize any radiant heat from the sun, but a deep run or riffle in the sun would be acceptable. Be sure to consider the safety of others using the stream and try your best to install your thermistor in a location where it is unlikely people will run into it. Volunteers will be provided with the following: Thermistor (deployed) and thermistor log Metal identification tag o The WAV coordinator will supply all volunteers with metal identification tags for the volunteers to attach to the thermistors before deployment. The ID tags have the contact information for the WAV program coordinators (phone numbers for DNR and UWEX) and should be attached to the thermistor using thin wire (jewelry wire works). PVC tube o The purpose of the PVC tube is to serve as a radiation shield in order to prevent direct solar radiation from hitting the thermistor. Multiple holes are drilled into the sides of the tube so that the thermistor can be attached to the tube and the tube to whatever device is being used to secure the thermistor in the stream Before deploying the thermistor at your stream monitoring site, check to see if the light on the face of the thermistor is blinking (the light is located in the upper left hand corner next to OK ). FYI - you may need to shield the device to see it if the light is faint. If your device is not blinking, it may not be logging data. Contact the WAV coordinator before deploying if you do not see the blinking light. 25
.")

 so that both ends can be pounded into the streambed in order to secure it.")
30 When deploying the thermistor at the stream monitoring site, the thermistor must be secured to weighted item (such as a rebar or railroad plate) to ensure that the thermistor is stable and secure throughout the monitoring season (especially during high flow events). It is recommended that volunteers use two zip ties, or one zip tie and some wire (in case one of the zip ties fails) in order to secure the thermistor and PVC tube to the rebar. A zip tie around the rebar above the thermistor can also help the thermistor/pvc tube from sliding off the end of the rebar. Alternatively, weld something to the top of the rebar or bend the top of the rebar 90 degrees to keep the thermistor/pvc tube from sliding off. A third suggestion would be to bend the rebar into a U-shape (picture at right) so that both ends can be pounded into the streambed in order to secure it. Pound the rebar into the streambed with a sledge type hammer, and orient the rebar with the flow of the water to help keep it clear of debris. As mentioned before, make sure the thermistor is installed at least six inches above the stream bottom. If you are using a railroad plate, wedge the plate into the stream bottom. Connect to rebar with zipties and pound rebar into the stream bed. Connect to PVC tube with zip ties and attach to railroad plate or rebar. Wedge plate or pound rebar into streambed. To avoid someone pulling up your thermistor keep the rebar below water level. Undercut banks work great to keep the rebar out of the way of stream users and protect it from getting washed away. The stream type and size may determine which deployment method is most likely to keep the thermistor submerged and free of sediment during the deployment period. Many people have developed their own solution for their particular stream so be sure to speak with your local coordinator or the WAV program coordinator if you have any questions or concerns. Following the deployment of your thermistor, take an accurate GPS reading, photographs, and/or make detailed notes about where you placed the thermistor in the stream so you can find it again. Photographs should be taken from different perspectives (i.e. facing upstream and downstream from the monitoring location) and should include at least one shot with a visual marker (such as a bridge or large tree). Record this information, along with the device serial number, date, and time you placed the thermistor in the stream on your thermistor log (see Appendix B for a copy of the thermistor log). 26
31 During the field season Monthly checks on the thermistor during your regular monitoring activities are incredibly important, especially if your stream is shallow or experiences low flow throughout the monitoring season. Check on the thermistors each month and be sure to note the dates of your checks on the thermistor log. Check that the thermistor is not covered by sediment or vegetation and that it is still under the water. If possible, check that your thermistor is secure before any anticipated high water events during which the thermistors could become dislodged. Retrieving your thermistor from the stream At the end of the monitoring season, pull up the rebar or railroad plate to which the thermistor is attached. Note the date and time that the thermistor came out of the water on your thermistor log. This is important since the thermistor will continue to log data even after it is out of the stream, however we don t want the temperature of your car and house to be included in the final data set that is uploaded to SWIMS. Thermistors owned by the WAV program should be returned to the WAV coordinator for data downloading at the conclusion of the monitoring season. The WAV coordinator will also upload the processed data into SWIMS. Groups that own their thermistors and software can download the data themselves and send the raw files via to the WAV coordinator in order to have the data uploaded into SWIMS. Rebar and railroad plates do not need to be returned each winter. If able and willing, please store them for next year. If you will not be placing thermistors at a stream site next year, please contact the WAV coordinator to see if someone else in your area can use them. Thermistor Logs Once launched, the thermistors begin to constantly log temperature data at one-hour intervals. When the data are downloaded, the WAV coordinator will need to delete all readings from when the thermistor was not in the water (pre and post deployment, as well as any low water events that left the thermistor suspended above the water). Carefully and completely filled out Thermistor Logs are essential for determining what data to cut out. Be sure to include the date and time that the thermistor was deployed and retrieved from the stream! Contact your local coordinator or the WAV program coordinator if you have any questions about what to put on the thermistor log. **Thermistor data turned into the WAV coordinator at the end of the season without a thermistor log (or a completed log) will not be entered into SWIMS. Viewing your Thermistor Data Once the WAV coordinator has uploaded your continuous temperature data into SWIMS, you will be able to view the data in SWIMS. Instructions as to how to access continuous temp data in SWIMS can be found here: 27
 from one")
 and animal species (e.g.")


 were identified in benthic")


32 Preventing the Spread of Aquatic Invasive Species Since WAV Level 2 stream monitoring equipment kits are often shared between multiple stream sampling sites, it is important to do what we can to prevent spreading of aquatic invasive species (AIS) from one stream to the next. Besides the well-known invasive plant (e.g., curly leaf pondweed, hydrilla, Eurasian water milfoil) and animal species (e.g., zebra mussels, faucet snails, Chinese mystery snail), we are also concerned about spreading viral hemorrhagic septicemia, more commonly known as VHS. VHS has been found in both the Lake Winnebago System and in Lake Michigan. VHS is an invasive fish disease that is not harmful to people, but VHS can kill or injure many types of game fish, such as muskies, walleye, trout, bluegill, smallmouth bass, and northern pike. It is unknown how the virus first entered Wisconsin s waters in 2007, but moving fish or water from one water body to another can spread the disease. AIS to lookout for: Zebra mussels Rusty crayfish Round Goby Asian clams Eurasian Watermilfoil New Zealand Mudsnails Hydrilla Faucet Snails AIS Updates In October 2013, New Zealand mudsnails (Potamopyrus antipodarum) were identified in benthic macroinvertebrate samples collected in 2012 from Black Earth Creek near the Village of Cross Plains. This is one of the first known occurrences of this clone of these snails in the Mississippi River Watershed (a different clone is found in the Great Lakes). New Zealand mudsnails are a non-native invasive species that can have negative impacts in Wisconsin waters. They compete with native invertebrates for space and food and might displace the native benthic community and alter food chains. Their small size makes them easily transported and since they can live out of water in a cool, damp environment for up to 26 days, properly cleaning and disinfecting your equipment is critical. Please be on the lookout for these small snails (no more than 4-6 mm in length) when you are out in the field. Water Action Volunteers Level 2 Manual 28 Updated January 2016
33 Round Goby Update The round goby (Neogobius melanostomus) was first discovered in the Great Lakes region in In September, round goby populations were found in the Lower Fox River. The round goby is a non-native species that threatens native fish populations. This fish eats the eggs and young of deepwater dwelling fish. The round goby also feeds on zebra mussels, eating up to 78 in one day. They are able to outcompete native populations by surviving in low quality waters and spawning multiple times per season (up to once every 20 days). Round gobies have an appearance similar to the the native sculpin; they are gray at a young age and develop black and brown splotches as they age. However, unlike the sculpin, round gobies have a single, fused pelvic fins, whereas the sculpin has two separate fins. Round gobies can grow up to 10 inches long, but are usually about 5-6 inches. Please keep an eye out for this invasive fish while you are out conducting your monitoring activities. AIS Fact Sheets In 2015, the WAV program created fact sheets (with the help of UWEX graphic artists) for three AIS that are of particular interest to volunteers: New Zealand mudsnail, Asian clam, and rusty crayfish. Volunteers are currently being directed to look for all three species while completing their biotic index monitoring, but please be vigilant whenever you are in a stream and keep an eye out for these species. Fact sheets are available for download on the WAV website: What do I do if I find an AIS? While completing your monitoring activities, be sure to be on the lookout for the AIS mentioned above. If you think that you have found an AIS, double check that the suspected invasive species has not been previously found on the waterbody. If not, take a digital photo of the animal in the setting where it was found (if possible) and then collect up to five specimens. Place in a jar with water; put on ice and transport to refrigerator. Transfer specimen to a jar filled with rubbing alcohol (except for jellyfish leave in water and fill out the WAV Aquatic Invasive Species Reporting form. Contact your local DNR Aquatic Invasive Species (Contacts) and deliver the specimens, report and digital photo (if available). Please do this as soon as possible; no later than 4 days after you discover the animal. Contact your local coordinator, WAV program coordinator, DNR Water Quality Biologist, Fisheries Biologist or County Aquatic Invasive Species Coordinator if you have any questions about possible sightings! 29
, and rinse other equipment such as transparency tubes, nets, trays, buckets and waders or boots with clean tap water")
 for collecting water at each site Dry your equipment This method")

34 Ways you can help prevent the spread of AIS Rinse your equipment After use, inspect and clean your equipment with a stiff brush to remove any encrusted sediment or attached plants and animals. Rinse the dissolved oxygen and ph probes with deionized or distilled water (DI), and rinse other equipment such as transparency tubes, nets, trays, buckets and waders or boots with clean tap water (no need to use DI water for this equipment). If you sample at more than one site, rinse all monitoring equipment between sites or bring additional equipment (buckets or bottles) for collecting water at each site Dry your equipment This method will work for some volunteers who only monitor one site per day. Transparency tubes, buckets, and boots/waders should initially dry and then remain dry for 5 consecutive days before being used again in the water. Disinfect your equipment If you are a volunteer who monitors multiple sites per day and thus cannot allow equipment to dry for five consecutive days in between site visits, you can disinfect your boots or waders, tubes, buckets and other non-electronic equipment with a dilute bleach solution (that is, one tbsp. of bleach per gallon of water). The cleaning solution must remain on the surface of the equipment for 10 minutes to be effective. The solution can easily be applied using a spray bottle. After 10 minutes, rinse the cleaning solution from the surface of the equipment with tap water. DO NOT use this solution on your dissolved oxygen or ph meters or other electronic equipment as it can damage them. 30
35 A video for how to disinfect your monitoring equipment and other gear is available on the WAV website ( Please contact your local coordinator or the WAV coordinator if you have any questions! **Note: ph and DO probes should NOT be bleach cleaned or dried out. This will affect the proper function of the probes. Instead, thoroughly rinse them with deionized or distilled water after each use. **Something to consider - AIS can easily move downstream, but they need your help to move upstream! When developing your monitoring plan (especially if you are a volunteer who monitors multiple sites in a single day), please keep in mind that AIS need assistance to move upstream or from one water body to the next. Plan your monitoring strategy accordingly and monitor the most upstream sites first, before moving downstream to the other locations. This way, if there are any AIS still attached to your gear after the disinfection process, their reintroduction at the downstream stream site will be lessened or even negligible because the AIS can most likely already be found there! For more information about aquatic invasive species here in Wisconsin and what you can do to help stop the spread, check out the following resources: Wisconsin DNR - dnr.wi.gov/topic/invasives/ Invasive Species Rule (NR 40) - dnr.wi.gov/topic/invasives/classification.html WDNR Boat Transportation and Bait Laws - dnr.wi.gov/topic/invasives/boat.html Protect You Waters - protectyourwaters.net/ 31
 to allow access by authorized individuals to State forms and databases available through the Internet.")
36 Appendix A - WAMS, SWDV, and SWIMS Instructions How to Get a WAMS User ID and Password Volunteers need a User ID and Password to enter and edit data using the SWIMS database on an internet-connected computer. The State of Wisconsin established the Wisconsin Web Access Management Systems (WAMS) to allow access by authorized individuals to State forms and databases available through the Internet. The simple self-registration procedure creates a personal Wisconsin Login Account ID that allows you access to SWIMS. If you already have a WAMS ID, you can use this ID to access the SWIMS database. If you do not already have a WAMS ID, follow the directions below. NOTE: Your web browser should be Microsoft Internet Explorer version 5.5 or higher. 1. Access the on.wisconsin.gov website a. Click open your Microsoft Internet Explorer browser and type in the URL: 2. Access WAMS a. Use the vertical scroll bar on the righthand of the screen to move down the page if necessary. b. Click on the Self-Registration (Request a Wisconsin User ID and Password) link as shown below. 3. Accept User Acceptance Agreement a. The next screen is the WAMS Self-Registration screen. i. The screen explains the WAMS registration process. b. Scroll down and read the State of Wisconsin Web Access Management System User Acceptance Agreement. c. Click on the Accept button at the bottom of the page to move to the next screen. 32

, and your personal e-mail address.")
37 4. Complete the Profile Information a. Fill in your name and in the Profile Information section. NOTE: Only fields with a red * next to them are required. There is a bug with entering postal addresses. We suggest leaving the address blank. Addresses for volunteers are kept separately in the SWIMS database system. We will have your address in the SWIMS database if you have already given it to us (during your training, for instance). 5. Create your User ID and Password a. Enter the requested information in the Account Information section including a User ID and Password (both of which you pick), and your personal address. NOTE: You can click on the printer icon on your tool bar to print out a copy of this screen if you wish to retain a record of your User ID and Password for future reference. Be sure to record your User ID and Password, and keep this information in a handy but secure location. b. Click on the Submit button. 6. Open Your Personal Account and Log In a. Check personal for a message from Wisconsin.gov thanking you for registering with the State of Wisconsin Web Access Management System (WAMS). b. Open the and click on the link in the . i. You must complete this final step within four days of receiving the message, or you will need to repeat the registration process. 33


38 7. Log-in to WAMS with Your New User ID and Password When you click on the Web link in the message from Wisconsin.gov, it will take you back to the WAMS web site. You will see the WAMS Account Activation - Final Step screen. Log in your User ID and Password again in the Account Activation Screen, and click on the Login button. You will receive your final message that your selfregistration is complete. Now you have completed the WAMS registration process and you can exit the WAMS web site. 8. Troubleshooting WAMS issues The WAMS site is not operated by the WDNR, so if you are having issues with your ID, you ll need to use the links on their page to get help. A common problem is that many of us already have WAMS IDs for one purpose or another, but have forgotten then. In some case, go to the Help link on the WAMS page ( and find the Account Recovery section for more information. If that doesn t work, go to the Frequently Asked Questions (FAQ) link or click on the Help Wisconsin Support link at the bottom of the page. The WAMS team is very helpful and efficient at troubleshooting any issues with registration. 9. Use your WAMS ID to register for SWIMS access Now that you have your WAMS ID, it s time to visit the SWIMS page to complete your monitoring registration for SWIMS access. a. Go to: i. Enter your WAMS User ID and Password and click the "Sign In" button 34
. 3.")
39 ii. iii. iv. v. vi. vii. viii. ix. x. xi. xii. xiii. xiv. xv. xvi. xvii. xviii. This form will appear: 1. Fill in the boxes at the top with your first and last name and address. 2. Next, check any and all boxes that apply to the type of monitoring projects you are currently involved in (e.g., Citizen Lake Monitoring, Project Riverine Early Detectors, etc.). 3. In the box outlined in purple, enter the name(s) and the Station ID of your monitoring site(s), if known 5. Hit Request SWIMS Access. 4. In the Other Comments box at the bottom, enter your responses to these two questions: 1). Are you a WAV volunteer monitor or a WAV local coordinator? And 2). Are you doing WAV Level 1, 2 AND/OR 3? Note: You cannot enter data until a WAV staff member finalizes your registration. You will receive an from them when your registration is finalized. Please allow at least one week for your registration to be processed. **Troubleshooting: If the form does not pop up automatically on your first log in, please the WAV coordinator or your local coordinator for assistance. Requesting a Monitoring Station In order to request a new monitoring station, please go to the database webpage on the WAV website ( and use the online form to submit a station request. Please be sure to provide your name, monitoring group, and contact information so that the WAV coordinator can contact you with any questions. If it is a new monitoring location, be sure to submit a proposed station name as well as site coordinates (use the directions on the following page to use the Surface Water Data Viewer to identify your monitoring site and record the coordinates). If it is a pre-existing site (with or without a WAV project), please submit the station name and station ID #. 35


. a.")

40 Finding New Site Locations using Surface Water Data Viewer To locate your station and obtain latitude/longitude information necessary for WAV staff to set your station up in SWIMS, please use the DNR Surface Water Data Viewer (SWDV). 1. To access the SWDV go to: and it will take you to the screen shown below: 2. To zoom in on the general area of you monitoring site - click on the Zoom In button along the top menu bar (highlighted in orange). a. Use your mouse to zoom in to the location where you monitor by holding down the mouse button and dragging the mouse to form a box around the area of interest. i. You can also click your mouse anywhere on the map (no dragging to create a box) to zoom in to that location. b. Repeat this process until you have zoomed in to where your stream site is located. Found it!! 36
. b. Use the Point Identify button (blue arrow) to show station details by right clicking on the triangle of interest.")
 as you will need it to register your monitoring site with your")

41 3. To see if there is already a monitoring station where you would like to sample, click on Show Layers icon in the menu bar at the top, then click on the + next to the Monitoring Sites & Data operational layer. a. Check the Monitoring Station Points box. i. Already established stations show up as triangles (pending stations have the star symbology). b. Use the Point Identify button (blue arrow) to show station details by right clicking on the triangle of interest. c. A Results window will appear to the left of the map with information about the monitoring site (station name, creek name, county) d. Record the station name, creek name, county in your monitoring materials (as well as the nearby road crossing or point of interest) as you will need it to register your monitoring site with your local coordinator and the WAV program coordinator. 4. If there is no established monitoring station at the location you d like to sample at, click on the Plot Coordinates button at the top of the screen, and then click on the location where you intend to monitor. a. Latitude and longitude will be displayed in a black callout box next to the site. b. Remember the latitude and longitude as you will need it to register your monitoring site with your local coordinator and the WAV program coordinator. 5. Submit your new monitoring station request to the WAV coordinator by using the online submission form available on the WAV website ( You will be asked to provide the following information: a. Your full name and address b. Site Description (stream name and road crossing) and County c. Latitude and Longitude (decimal degrees) d. Station ID (if registering new volunteers for an existing site) 6. The WAV coordinator will contact you once the monitoring station and associated WAV project is set up in SWIMS and you can begin entering data. 37


42 Entering Monitoring Data into SWIMS NOTE: Your web browser should be Microsoft Internet Explorer version 5.5 or higher. 1. Use Internet Explorer and navigate to 2. Enter your WAMS User ID and Password and click Sign In 3. Click the Submit Data tab along the menu bar at the top of the screen. 4. Click the Add New button on the left side of the screen 38

.")

![[If necessary] Create a new data collector group: **This step is only necessary once for each group of collectors.](/docs-images/89/98825148/images/43-3.jpg "After the group has been created, it will be available via the dropdown box. i. Click the binoculars icon (to the right of the Data Collectors field) ii.")
43 5. Select your monitoring site from the Project dropdown list a. Selecting the project SHOULD automatically select the monitoring station. i. Please double check that the project and the station match when entering your monitoring data. b. If your monitoring location is not listed in the drop down Project list, please do not enter your data at this time. i. Contact local coordinator or the program coordinator to get your SWIMS account assigned to the correct station(s). 6. Select your group of Data Collectors (single individual or multiple people) using the down arrow to the right of the name field. If the correct list of data collectors is not in the list, create a new group by following the instructions below: a. [If necessary] Create a new data collector group: **This step is only necessary once for each group of collectors. After the group has been created, it will be available via the dropdown box. i. Click the binoculars icon (to the right of the Data Collectors field) ii. To create a New Collector Group from the volunteers already attached to the project, click Add (to the left of the names) for each volunteer 39


 that you did your data collection work a.")
44 iii. To add a new person to the collector group, search their name in the Search People/Groups field at the top of the window iv. Once complete, select Create and use this collector group to return to the main data entry screen 7. Confirm that the monitoring Station is same as Project a. If there is more than one station listed or the correct station is not listed, please do not enter your data at this time. DO NOT USE THE BINOCULARS TO SELECT A STATION THAT DOES NOT MATCH THE PROJECT FIELD. i. Report missing or incorrect station information to the WAV Data Manager and wait until the correct project and station information are available before entering your monitoring data. 8. Click the Show Map button to confirm the location of your monitoring site. Notify the data manager if the location is incorrect. 9. Enter the Start Date (mm/dd/yyyy) that you did your data collection work a. A calendar window will pop up as well that you can use 10. Enter the Time that you started your data collection work a. We require the start time information for all monitoring data. Be sure to enter AM or PM, also. Note: 12 noon is 12:00 PM. 40


45 11. Select the WAV Stream Monitoring 2015 form a. The WAV Stream Monitoring 2015 form should be selected automatically. If it is not, select it from the drop down list. b. If it is not available, you will need to contact the program coordinator to correct this before you will be able to enter your monitoring data. 12. DO NOT ENTER the Latitude and Longitude a. The location of your monitoring site is already established in SWIMS. If you wish to check the location of your monitoring site, click the Show Map button as described in Step Enter the End Date and Time for when you completed your monitoring work. a. These fields will autofill so you will need to update it accordingly. 41


46 14. Enter additional data in Comments a. Please, record any information that might help characterize your data. For instance, include information on any activity occurring upstream that may be affecting water quality, as well as observations you made regarding current weather, wildlife at the site, upcoming storms, etc. 15. Click Next to go to the field work data entry screen 16. Enter your monitoring data from the red and purple boxes in the Result column a. Enter the values recorded for each measured parameter. If you did not monitor the parameter, LEAVE IT BLANK! Entering a 0 into SWIMS does not indicate that you did not monitor it; it indicates that you got a result of 0! b. Use the dropdown menus when available to record your response. 17. Click Save to save data. a. You will now see the result for the transparency average (grey line). 18. To continue entering your monitoring results: a. Click Next Date and Next Station to return to the initial Create Monitoring Data screen to begin entering data for a different station or for a different date b. Click Save and Return to List to view your recently updated monitoring data c. Click Save and Next to move to the next data entry screen. 42

47 19. This page is for entering streamflow data (green box) and monitoring equipment calibration information (orange box). a. If you did not monitor the streamflow, answer No to the Was streamflow monitored? question at the top of the page and LEAVE THE REST BLANK! b. Use the dropdown menus to indicate if you meters were calibrated or not. i. If you did not monitor for road salt, leave the ECTestr line blank. 20. If you entered streamflow data, click Save to save the data. a. You will now see the calculated results for streamflow (grey lines). b. If not, skip this step and continue to Step To continue entering your monitoring results: a. Click Next Date and Next Station to return to the initial Create Monitoring Data screen to begin entering data for a different station or for a different date b. Click Save and Return to List to view your recently updated monitoring data c. Click Save and Next to move to the next data entry screen. 43
. i.")

48 22. This page is for entering thermistor (continuous temperature monitoring device) data (blue box) on the back of the datasheet. a. Use the dropdown menus (when available) to record your responses b. Please remember to enter the time of deployment or retrieval of the thermistor (be sure to enter AM or PM using the dropdown menu to the right). i. If you are doing the monthly check, LEAVE THOSE BLANK! 23. To continue entering your monitoring results: a. Click Next Date and Next Station to return to the initial Create Monitoring Data screen to begin entering data for a different station or for a different date. b. Click Save to save data. c. Click Save and Return to List to view your recently updated monitoring data. d. Click Save and Next to move to the next data entry screen. 24. This page is for entering biotic index data (red box) from the back of the datasheet. 44
. b. If not, skip this step and continue to Step 26.")

49 a. Enter the values recorded for each measured parameter. If you did not monitor the parameter, LEAVE IT BLANK! b. Use the dropdown menus when available to record your response. 25. If you entered biotic index data, click Save to save the data. a. You will now see the results for the calculated fields (grey lines). b. If not, skip this step and continue to Step To continue entering your monitoring results: a. Click Next Date or Next Station to return to the initial Create Monitoring Data screen to begin entering data for a different station or for a different date b. Click Save and Return to List to view your recently updated monitoring data c. Click Save and Next to move to the next data entry screen. 27. This page is for entering habitat data for streams <10m wide (separate data sheet). a. Enter the values recorded for each measured parameter. If you did not monitor the parameter, LEAVE IT BLANK! b. Use the dropdown menus when available to record your response. 28. If you entered habitat data for streams <10m wide, click Save to save the data. a. You will now see the results for the calculated fields (grey lines). b. If not, skip this step and continue to Step To continue entering your monitoring results: a. Click Next Date or Next Station to return to the initial Create Monitoring Data screen to begin entering data for a different station or for a different date b. Click Save and Return to List to view your recently updated monitoring data c. Click Save and Next to move to the next data entry screen. 30. This page is for entering habitat data for streams >10m wide (separate data sheet). a. Enter the values recorded for each measured parameter. If you did not monitor the parameter, LEAVE IT BLANK! b. Use the dropdown menus when available to record your response. 45


50 31. If you entered habitat data for streams >10m wide, click Save to save the data. a. You will now see the results for the calculated fields (grey lines). b. If not, skip this step and continue to Step To continue entering your monitoring results: a. Click Next Date or Next Station to return to the initial Create Monitoring Data screen to begin entering data for a different station or for a different date b. Click Save and Return to List to view your recently updated monitoring data c. Click Save and Next to move to the next data entry screen. 33. Congratulations! You re done entering data for this monitoring event!!! Viewing or Editing your Monitoring Data in SWIMS NOTE: Your web browser should be Microsoft Internet Explorer version 5.5 or higher. 1. Use Internet Explorer and navigate to 2. Enter your WAMS User ID and Password and then click Sign In. 3. Click the Submit Data tab along the menu bar at the top of the screen. 4. Click the View List button on the left side of the screen. 46

, you will need to select the correct data entry form before moving to the next screen.")
51 5. On this screen, you will be able to view all of the monitoring data that you recently updated or helped to collect (you were listed as a Data Collector) 6. Click the magnifying glass to view previously entered data or click on the pencil to edit previously entered monitoring data. 7. Once you ve edited your entries on the Edit Monitoring Data screen (station, data collectors, start date/time or end date/time, comments), click Save and Return to save your changes and view other fieldwork event. 8. To edit previously entered monitoring data (streamflow, weather, biotic index, etc), you will need to select the correct data entry form before moving to the next screen. **When you enter the data initially, all of the forms are linked, but when editing they are separated so you have to select them one at a time. a. Qualit Fish Habitat Less than 10 M separate habitat form (Step 27) b. Qualit Fish Habitat More than 10 M separate habitat form (Step 30) c. WAV Stream Monitoring 2015 red and purple boxes on the front page of the monitoring datasheet (Step 16) 47
52 d. WAV Citizen Monitoring Biotic Index - red box on the back page of the monitoring datasheet (Step 24) e. WAV Streamflow - green and orange boxes on the front page of the monitoring datasheet (Step 19) f. WAV_Thermistors - blue box on the back page of the monitoring datasheet (Step 22) 9. Click Next to edit the results on the next screen. a. Clicking Save will save your changes, but the screen will not change. 10. Once you have made the necessary changes to the data form, click Save and Return to view your recently updated monitoring data. Please contact the WAV program coordinator if you have any questions or concerns about entering or viewing you monitoring data in SWIMS! 48

53 Appendix B Datasheets and Calibration Logs Monitoring Datasheet 49
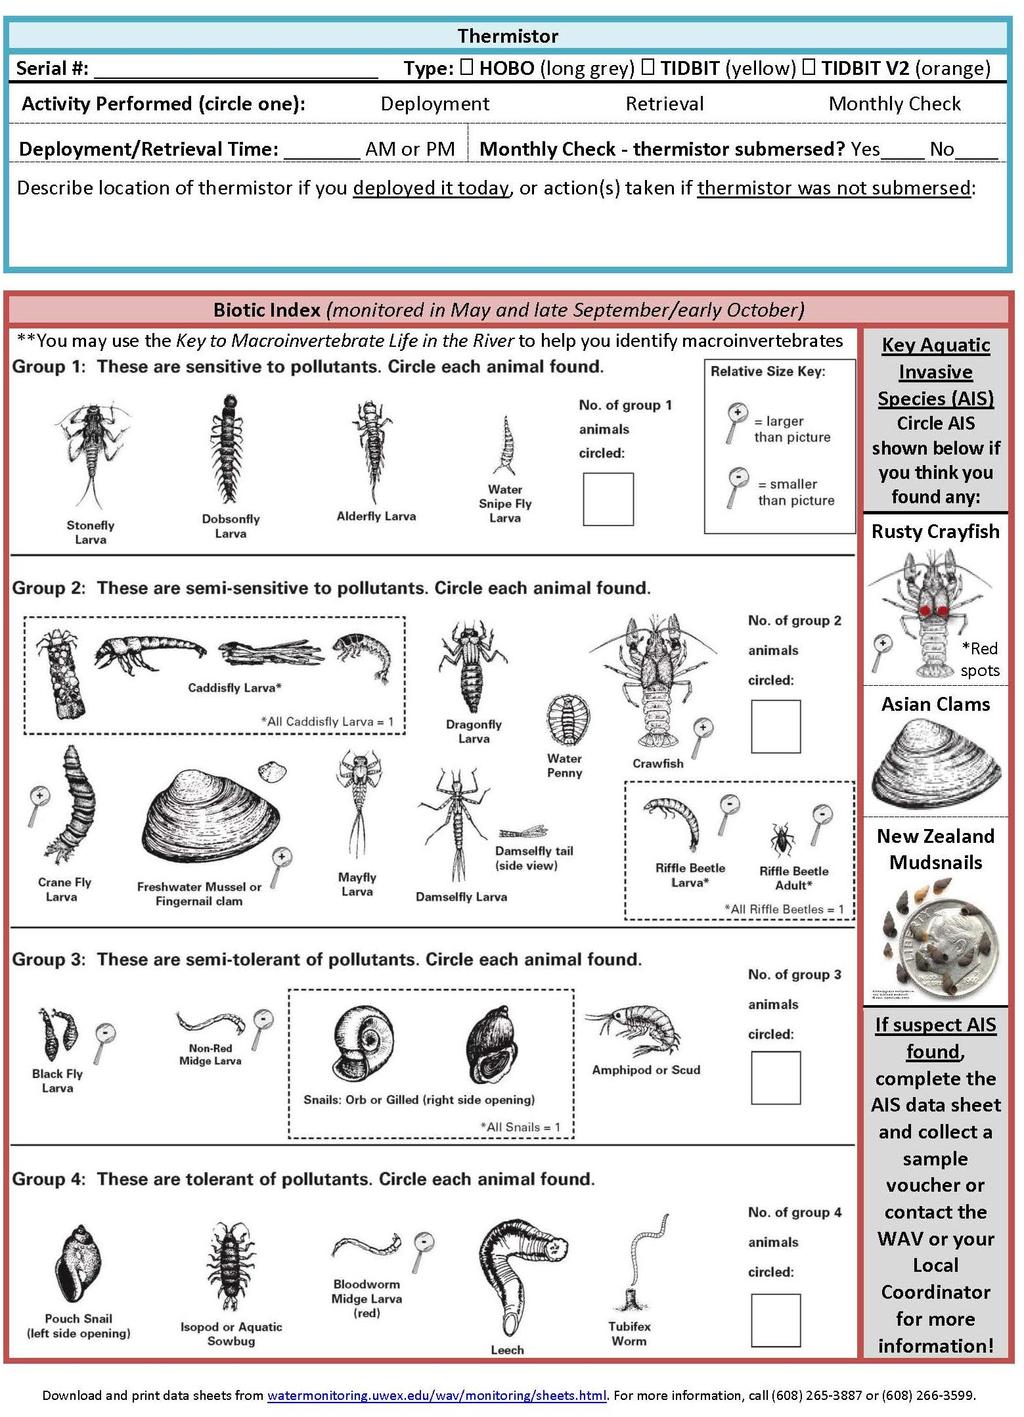
54 50

55 DO Meter Calibration Log 51

56 ph Meter Calibration Log 52

57 Thermistor Log 53
YSI Model 550a Dissolved Oxygen (DO) Meter
 Meter") YSI Model 550a Dissolved Oxygen (DO) Meter The YSI 550a Dissolved Oxygen (DO) meter needs to be calibrated before being used in the field each and every time you monitor. Once calibrated, the meter must
YSI Model 550a Dissolved Oxygen (DO) Meter The YSI 550a Dissolved Oxygen (DO) meter needs to be calibrated before being used in the field each and every time you monitor. Once calibrated, the meter must
Dissolved Oxygen in Water. Evaluation copy. Table 1. Temperature Range ( C) Trout Smallmouth bass Caddisfly larvae
 Trout Smallmouth bass Caddisfly larvae") Dissolved Oxygen in Water Computer 12A Although water is composed of oxygen and hydrogen atoms, biological life in water depends upon another form of oxygen molecular oxygen. Oxygen is used by organisms
Dissolved Oxygen in Water Computer 12A Although water is composed of oxygen and hydrogen atoms, biological life in water depends upon another form of oxygen molecular oxygen. Oxygen is used by organisms
Aerobic Respiration. Evaluation copy
 Aerobic Respiration Computer 17 Aerobic cellular respiration is the process of converting the chemical energy of organic molecules into a form immediately usable by organisms. Glucose may be oxidized completely
QUICK START GUIDE TO DRINKING WATER MONITORING
 APPENDIX F QUICK START GUIDE TO DRINKING WATER MONITORING Introduction: This Quick Start guide is designed to allow users who are already familiar with the basic use of YSI 6-series sondes for surface
Evaluation copy. Interdependence of Plants and Animals. computer OBJECTIVES MATERIALS
 Interdependence of Plants and Animals Computer 14 Plants and animals share many of the same chemicals throughout their lives. In most ecosystems, O 2, CO 2, water, food and nutrients are exchanged between
Water Quality Monitoring Using a Handheld Sonde for in situ Measurements Date Prepared: 11/17/2017
 PARTNERSHIP FOR THE DELAWARE ESTUARY Science Group Water Quality Monitoring Using a Handheld Sonde for in situ Measurements Date Prepared: 11/17/2017 Prepared By: Kurt Cheng Suggested Citation: Cheng,
Bante820 Portable Dissolved Oxygen Meter Instruction Manual
 Bante820 Portable Dissolved Oxygen Meter Instruction Manual BANTE INSTRUMENTS CO., LTD Bante820 Portable Dissolved Oxygen Meter 1 Introduction Thank you for selecting the Bante820 portable dissolved oxygen
PRODUCT SHEET. Order probe only as RXPROBE02
 SS69L DISSOLVED OXYGEN PROBE TRANSDUCER Order probe only as RXPROBE02 Order interface only as BSL-TCI16 SS69L Components The SS69L transducer measures dissolved oxygen. The SS69L includes a dissolved oxygen
SS32L Dissolved O 2 Probe
 BIOPAC WWW.biopac.com Systems, Inc. Application Note PH-185 SS32L Dissolved O 2 Probe SS32L Dissolved O 2 Probe BIOPAC Software SS32L Specifications BSL PRO v. 3.6.6 BIOPAC Hardware SS32L Dissolved O 2
Measuring Flow with. Centre County PaSEC. QC Team July P a g e
 Measuring Flow with Centre County PaSEC QC Team July 2018 1 P a g e Safety Considerations We are responsible for our own safety, but we also need to be ready to assist our teammates. Safety measures and
COOPERATIVE LAKES MONITORING PROGRAM TRAINING FOR. Dissolved Oxygen and Temperature
 COOPERATIVE LAKES MONITORING PROGRAM TRAINING FOR Dissolved Oxygen and Temperature Marcy Knoll Wilmes MiCorps DEQ Biologist DEQ, Water Resources DEQ/Water Resources Division PO Box 30458 Lansing, Michigan
Bante821 Portable Dissolved Oxygen Meter Instruction Manual
 Bante821 Portable Dissolved Oxygen Meter Instruction Manual BANTE INSTRUMENTS CO., LTD Bante821 Portable Dissolved Oxygen Meter 1 Introduction Thank you for selecting the Bante821 portable dissolved oxygen
Bante810 Benchtop Dissolved Oxygen Meter Instruction Manual
 Bante810 Benchtop Dissolved Oxygen Meter Instruction Manual BANTE INSTRUMENTS CO., LTD Bante810 Benchtop Dissolved Oxygen Meter 1 Introduction Thank you for selecting the Bante810 benchtop dissolved oxygen
Before you start sampling, be sure to read
 6. DISSOLVED OXYGEN MONITORING: MONITORING: Using the Titration Method Before you start sampling, be sure to read the following pages to familiarize yourself with the equipment and the procedures that
Experiment C-6 Gas Solubility
 1 Experiment C-6 Gas Solubility Objectives To measure dissolved oxygen in water by using an oxygen sensor. To learn about physical factors that influence oxygen solubility in water. To examine the dissolved
DOscan10 Pocket Dissolved Oxygen Tester Instruction Manual
 DOscan10 Pocket Dissolved Oxygen Tester Instruction Manual BANTE INSTRUMENTS CO., LTD DOscan10 Pocket Dissolved Oxygen Tester 1 Thank you for selecting the DOscan10 pocket dissolved oxygen tester. This
User's Manual. Heavy Duty Dissolved Oxygen Meter. Model
 User's Manual Heavy Duty Dissolved Oxygen Meter Model 407510 Introduction Congratulations on your purchase of Extech's Heavy Duty Dissolved Oxygen / Temperature Meter which simultaneously displays Dissolved
Instruction Sheet. Important Note: Information that requires special emphasis. Note: Information that supplements points in the main text.
 Hach LDO Sensor Instruction Sheet 00745589 Safety Precautions Please read this entire instruction sheet before operating this sensor. Pay particular attention to all danger and caution statements. Failure
#LZ400 LEAKALYZER. Water Loss Sensor INSTRUCTION MANUAL Country Dr. #190 St. Paul, MN
 #LZ400 LEAKALYZER Water Loss Sensor INSTRUCTION MANUAL 2885 Country Dr. #190 St. Paul, MN 55117 800-348-1316 www.leaktools.com Your Partner in Swimming Pool Water Conservation Product Purpose: 2 The Leakalyzer
Relative Humidity Calibration Kit
 Revised 1.4.11 Relative Humidity Calibration Kit For Calibrating All RH Measuring Kestrel Meters Model Numbers 3000, 3500, 4000, 4100, 4200, 4250, 4300, 4500 While the calibration process is very simple,
Euclid Creek Volunteer Watershed Monitoring Program Directions for Performing Physical/Chemical Tests
 Euclid Creek Volunteer Watershed Monitoring Program Directions for Performing Physical/Chemical Tests DISSOLVED OXYGEN (DO) - HACH HQ 40d Attach the probe to the unit and secure the connection Turn on
BI-680 Online Dissolved Oxygen Controller Instruction Manual
 BI-680 Online Dissolved Oxygen Controller Instruction Manual BANTE INSTRUMENTS CO., LTD BI-680 Online Dissolved Oxygen Controller 1 Introduction Thank you for selecting the BI-680 online dissolved oxygen
Three Lakes Association Hydrolab for Dummies. Table of Contents:
 Three Lakes Association Hydrolab for Dummies 1 Table of Contents: 1. Know before you start:...2 a-introduction b-unpacking c-general use d-be careful 2. Calibration:...3 a-step by step guide 3. Using the
NEULOG OXYGEN LOGGER SENSOR GUIDE
 NeuLog oxygen logger sensor NUL-205 The oxygen sensor can be used for any science experiment or activity where oxygen levels, dissolved or gaseous, are required. Some fields of study include Chemistry,
Heavy Duty Dissolved Oxygen Meter
 User's Manual Heavy Duty Dissolved Oxygen Meter Model 407510 Test Equipment Depot - 800.517.8431-99 Washington Street Melrose, MA 02176 FAX 781.665.0780 - TestEquipmentDepot.com Introduction Congratulations
A180 DO/BOD/OUR/SOUR Meter Instruction Manual
 A180 DO/BOD/OUR/SOUR Meter Instruction Manual BANTE INSTRUMENTS CO., LTD A180 DO/BOD/OUR/SOUR Meter 1 Introduction Thank you for selecting the A180 multiparameter dissolved oxygen meter. This manual provides
Instruction Manual HI Portable Waterproof Dissolved Oxygen Meter.
 Instruction Manual HI 9142 Portable Waterproof Dissolved Oxygen Meter www.hannainst.com 1 Dear Customer, Thank you for choosing a Hanna Instruments Product. Please read this instruction manual carefully
FIELD PROCEDURE: WATER CHEMISTRY
 FIELD PROCEDURE: WATER CHEMISTRY EQUIPMENT NEEDED: Note: Don t leave this equipment out in freezing temperatures unless you re using it. If air temperatures are just below freezing, keep the turbidity
The Oxygen Sensor can be connected to all types of einstein Tablets, einstein LabMate, and einstein LabMate +.
 The Oxygen sensor is a maintenance- free galvanic oxygen electrode capable of measuring Oxygen in solutions. With built-in temperature compensation, this sensor provides an easy way for students to receive
OxyScan Graphic. Operating Instructions. UMS Micro-oxygen sensor 501. Microprocessor instrument
 OxyScan Graphic Operating Instructions UMS Micro-oxygen sensor 501 Microprocessor instrument Introduction Thank you for choosing the UMS Micro Oxygen Sensor 501 - a highly advanced product! Please read
DISSOLVED OXYGEN SENSOR BT34i
 DISSOLVED OXYGEN SENSOR BT34i USER S GUIDE CENTRE FOR MICROCOMPUTER APPLICATIONS http://www.cma-science.nl Short description The CMA Dissolved Oxygen (DO) sensor BT34i measures the concentration of dissolved
Refillable ORP/Redox Probe: Model MTC30101 or MTC30103
 User Manual Refillable ORP/Redox Probe: Model MTC30101 or MTC30103 DOC022.53.80026 Safety information Precautionary labels Read all labels and tags attached to the instrument. Personal injury or damage
Cover Page for Lab Report Group Portion. Head Losses in Pipes
 Cover Page for Lab Report Group Portion Head Losses in Pipes Prepared by Professor J. M. Cimbala, Penn State University Latest revision: 02 February 2012 Name 1: Name 2: Name 3: [Name 4: ] Date: Section
Operator Quick Guide ORBISPHERE 3654
 Operator Quick Guide ORBISPHERE 3654 Revision H - 14/03/2008 Operating Information About this Guide The information in this guide has been carefully checked and is believed to be accurate. However, Hach
Oxygen Sensor with Electrode
 imagine explore learn Oxygen Sensor with Electrode Product Number: ENOXY-A222 Overview The Oxygen sensor is a maintenance-free galvanic oxygen electrode, capable of measuring Oxygen both in the air and
CCPaSEC. Procedure for the Quality Control Yearly Equipment Check. July 2018 CCPaSEC Quality Control Team
 CCPaSEC Procedure for the Quality Control Yearly Equipment Check July 2018 CCPaSEC Quality Control Team 1 ph and Conductivity Equipment Check. Battery check: replace the batteries. Inspect the conductivity
Instruction Sheet. Calibration of Multiple 1720 and FT660 Turbidimeters
 Instruction Sheet 26596-89 Calibration of Multiple 1720 and FT660 Turbidimeters Overview This instruction sheet describes the calibration of up to eight 1720C, 1720D, or 1720E turbidimeters, or up to three
YSI ProDSS calibration and routine maintenance rev 5/29/2018
 YSI ProDSS calibration and routine maintenance rev 5/29/2018 General info 1 Pressure (Barometer) calibration 4 Conductivity calibration 5 DO calibration 7 ph calibration 11 Turbidity calibration 14 Temperature
Vinmetrica Dissolved Oxygen System User Manual
 Vinmetrica Dissolved Oxygen System User Manual The Vinmetrica dissolved Oxygen system provides a simple, accurate and affordable way to determine oxygen concentrations in wine and other samples. Materials
Instruction Manual DO 6. Economy Hand-held Dissolved Oxygen Meter. 68X Rev 2 Apr 08. Technology Made Easy... Part of Thermo Fisher Scientific
 Instruction Manual DO 6 Economy Hand-held Dissolved Oxygen Meter Technology Made Easy... 68X243622 Rev 2 Apr 08 Part of Thermo Fisher Scientific Preface This manual serves to explain the use of the DO
OPERATOR S MANUAL Ar-Gone Weld Gas Analyzer
 July 2011 OPERATOR S MANUAL Ar-Gone Weld Gas Analyzer WARNING! Before operating this product, read and understand this Operator s Manual. Become familiar with the potential hazards of this unit. Contact
Simple, Robust, Reliable Measures ph Doses either acid (lower) or alkali (raise) Displays ph, Total Dose Count (DCT) and Dose Count per hour (DC/h)
 or alkali (raise) Displays ph, Total Dose Count (DCT) and Dose Count per hour (DC/h)") Simple, Robust, Reliable Measures ph Doses either acid (lower) or alkali (raise) Displays ph, Total Dose Count (DCT) and Dose Count per hour (DC/h) Integrated peristaltic dosing pump When using automatic
Simple, Robust, Reliable Measures ph Doses either acid (lower) or alkali (raise) Displays ph, Total Dose Count (DCT) and Dose Count per hour (DC/h) Integrated peristaltic dosing pump When using automatic
Transpiration. DataQuest OBJECTIVES MATERIALS
 Transpiration DataQuest 13 Water is transported in plants, from the roots to the leaves, following a decreasing water potential gradient. Transpiration, or loss of water from the leaves, helps to create
D-Opto Dissolved Oxygen Sensor Operation Manual for the D-Opto 4-20mA
 D-Opto Dissolved Oxygen Sensor Operation Manual for the D-Opto 4-20mA Software version 2.6 Table of contents 1 Introduction...3 1.1 Optical Sensor Technology...3 1.2 Installation...4 1.3 Operation...5
Dissolved Oxygen/Temp Waterproof Tester
 User's Guide AM-DO-01 Battery Compartment Cap Main Display Dissolved Oxygen/Temp Waterproof Tester Lanyard Connection old/max/min Button Function Mode Button Power / Calibration Button Probe Coller Probe
Mass Spec will not Autotune
 Mass Spec will not Autotune Applies to 5973A/N MSD What could be the problem? There could be several things that would cause your Mass Spec not to Autotune. The most common, easily corrected Autotune problems
D-Opto. Dissolved Oxygen Sensor. Operation Manual (Software Version 1.0)
") D-Opto Dissolved Oxygen Sensor Operation Manual (Software Version 1.0) Table of contents 1 Introduction...3 1.1 Optical Sensor Technology...3 2 Software...4 2.1 Installation...4 2.2 Operation...4 3 Operation...9
D-Opto Dissolved Oxygen Sensor Operation Manual (Software Version 1.0) Table of contents 1 Introduction...3 1.1 Optical Sensor Technology...3 2 Software...4 2.1 Installation...4 2.2 Operation...4 3 Operation...9
SOLUBILITY OF A SOLID IN WATER
 1516L Experiment 1 SOLUBILITY OF A SOLID IN WATER Objectives In this experiment you will determine the solubility of potassium nitrate (KNO 3 ) in water at various temperatures. You will prepare a plot
QC CHECKS OF DATA SHEETS FROM QUARTERLY MONITORING Rev. 6/11/18
 QC CHECKS OF DATA SHEETS FROM QUARTERLY MONITORING Rev. 6/11/18 Definitions of levels of monitoring events, for Streamkeepers quarterly stream-teams: o Episode: entire quarterly monitoring set o Tour:
Dissolved Oxygen Study Manual
 Dissolved Oxygen Study Manual Table of Contents Introduction 3 Safety Precautions 7 Analytical Techniques 8 Procedure 9 Data Sheet 15 Volunteer Schedule 17 Appendix A: Maps A-1 Appendix B: Fact Sheet
Air Ball! Evaluation copy
 Air Ball! Computer 24 Do you ever wonder how the National Basketball Association (NBA) decides how much air should be in the basketballs used during a game? The NBA measures the pressure inside the ball
LogIT Dissolved Oxygen Probe
 LogIT Dissolved Oxygen Probe INTRODUCTION The LogIT Dissolved Oxygen Probe (DO2) has been designed especially for LogIT and is easy to set up and use. It features simple single control calibration and
MARTINI. instruments. THANK YOU FOR CHOOSING. Sales and Technical Service Contacts:
 THANK YOU FOR CHOOSING MARTINI instruments Sales and Technical Service Contacts: Milwaukee Electronics Kft. Alsókikötő sor 11. 6726, Szeged, Hungary Tel: +36-62-428-050 Fax: +36-62-428-051 e-mail: sales@milwaukeeinst.com
Armfield Distillation Column Operation Guidelines
 Armfield Distillation Column Operation Guidelines 11-2016 R.Cox Safety SAFETY GLASSES ARE REQUIRED WHEN OPERATING THE DISTILLATION COLUMN Wear gloves when mixing alcohol feedstock The column will become
Constant Pressure Inlet (CCN) Operator Manual
 Operator Manual") Constant Pressure Inlet (CCN) Operator Manual DOC-0125 Revision J 2545 Central Avenue Boulder, CO 80301-5727 USA C O P Y R I G H T 2 0 1 1 D R O P L E T M E A S U R E M E N T T E C H N O L O G I E S, I
Constant Pressure Inlet (CCN) Operator Manual DOC-0125 Revision J 2545 Central Avenue Boulder, CO 80301-5727 USA C O P Y R I G H T 2 0 1 1 D R O P L E T M E A S U R E M E N T T E C H N O L O G I E S, I
CTG Certification Protocol -- Version 3.0 SUMMARY
 Date of Test: Test Report Number: SUMMARY Date of Prior Certification: Certified by: Re-certification Due Date: Unit Description: Make : Model: Serial Number: Location: CERTIFIER INFORMATION Name: Client
ISE-730 Oxygen Electrode and DO2-100 Currentto-Voltage
 Technical Note ISE-730 and DO2-100 Overview In 1954, Dr. Leland Clark invented the first membrane-covered electrode designed to measure the concentration of oxygen in blood, or solution. This electrode
MASSACHUSETTS STATE POLICE CRIME LABORATORY. Certificate of Calibration Procedure for the Alcotest 9510
 MASSACHUSETTS STATE POLICE CRIME LABORATORY Certificate of Calibration Procedure for the Alcotest 9510 Effective Date: May 10, 2017 Page 1 of 23 TABLE OF CONTENTS 1 INTRODUCTION... 3 2 ABBREVIATIONS...
INSTRUCTION MANUAL. 840 Transmitter. Loop Powered Dissolved Oxygen Transmitter
 INSTRUCTION MANUAL Loop Powered Dissolved Oxygen Transmitter Contents Contents...2 Introduction...3 Range and Display Settings...4 Installation...5 Electrical Installation...6 Calibration...7 EasyCal...8
UsER manual for Watersens ph -REDOX
 UsER manual for Watersens -REDOX Cl 8 1 2 6 3 3 7 7 4 4 4 4 Parts List 1 Redox Probe 1 x 2 PH Probe 1 x 5 Tube Weight 2 x 6 Connection Valve 1 x chlorine 3 Chlorine and Pumps 2 x 7 Dosing Valve 2 x 5 5
DeFelsko PosiTector CMM IS Probe
 Management Procedure 2566 Revision: A Date Issued: January 23, 2018 Date Revised: Calibration Procedure DeFelsko PosiTector CMM IS Probe Table of Contents 1 Introduction and UUC Performance Requirements...
TAC-100A DIVER NAVIGATION BOARD OPERATIONS MANUAL. RJE International, Inc. RJE International, October 20, TAC-100A Revision 3
 TAC-100A DIVER NAVIGATION BOARD OPERATIONS MANUAL RJE International, Inc. YOUR SOURCE FOR DIVER NAVIGATION AND UNDERWATER RELOCATION EQUIPMENT RJE International, October 20, 2010 12 TAC-100A Revision 3
FIELD TIP SHEET. Mark the bag with black permanent marker before filling it with water.
 Maine Healthy Beaches Program Field Methods Esperanza Stancioff March 2007 FIELD TIP SHEET When taking a sample, be sure to: Mark the bag with black permanent marker before filling it with water. Mark
The HumiSys. RH Generator. Operation. Applications. Designed, built, and supported by InstruQuest Inc.
 The HumiSys RH Generator Designed, built, and supported by InstruQuest Inc. Versatile Relative Humidity Generation and Multi-Sensor System The new HumiSys with single or dual RH probes capabilities is
Bante904 Benchtop Conductivity/Dissolved Oxygen Meter Instruction Manual
 Bante904 Benchtop Conductivity/Dissolved Oxygen Meter Instruction Manual BANTE INSTRUMENTS CO., LTD Bante904 Benchtop Conductivity/Dissolved Oxygen Meter 1 Introduction Thank you for selecting the Bante904
DIVER NAVIGATION BOARD
 RJE International, May 14, 2015 12 TAC-100A Revision 4 DIVER NAVIGATION BOARD RJE International, Inc. YOUR SOURCE FOR DIVER NAVIGATION AND UNDERWATER RELOCATION EQUIPMENT RJE International, Inc. 15375
Notebooks or journals for drawing and taking notes
 Title: Have to Have a Habitat Grade Level: 5 th -8 th grade Topic: Trout Habitat Background: The following chart lists the ideal conditions for trout habitat. Dissolved Oxygen: > 7 mg/l ph: 5.5-7 Next
12mm Dissolved Oxygen Sensor Care and Use Instructions
 12mm Dissolved Oxygen Sensor Care and Use Instructions How Dissolved Oxygen Sensors Work Your Dissolved Oxygen (DO) Probe is a galvanic electrochemistry device; i.e. it does not require power from your
[USING THE VITROBOT April 9, Using the Vitrobot
 Using the Vitrobot The Vitrobot Mk 3 (aka Mark III, Mark 3, etc.) can control both the local temperature and the local humidity during the process of plunge-freezing a grid for cryoem. It does require
reported in stream flow.
 Chicago River Field Trip Activity Summary Students will calculate flow rate and stream flow of a local river. Background Flow rate measures the speed at which water in a river is travelling down the river
Relative Humidity Calibration Kit
 Relative Humidity Calibration Kit For calibrating the following Kestrel Meters Model Numbers 3000, 3500, 4000, 4200, 4250, 4300, 4400, 4500, 4600 (Not to be used for calibrating Kestrel 5 Series units
Alan Davis Field Trip Activities
 Alan Davis Field Trip Activities Establish your sampling group. Groups should be no larger than four students. Obtain an assigned sampling region and a bucket with a variety of tools for sampling. Other
Revision: 23 March 2008 (nk)
") CCAP Air Monitoring Protocol #01 Secondhand Smoke Drift Between Apartment Units Version 1.0 California Clean Air Project March 2008 CCAP AIR MONITORING PROTOCOL #01 SECONDHAND SMOKE DRIFT BETWEEN APARTMENTS
CCAP Air Monitoring Protocol #01 Secondhand Smoke Drift Between Apartment Units Version 1.0 California Clean Air Project March 2008 CCAP AIR MONITORING PROTOCOL #01 SECONDHAND SMOKE DRIFT BETWEEN APARTMENTS
MISSOURI STREAM TEAM VOLUNTEER WATER QUALITY MONITORING PROGRAM Standard Operating Procedure
 MISSOURI STREAM TEAM VOLUNTEER WATER QUALITY MONITORING PROGRAM Standard Operating Procedure ORIGINAL EFFECTIVE DATE: January 30, 2018 RECERTIFICATION DATE: SOP TITLE: MoST-VWQM-SOP: Dissolved Oxygen Measurement
Chromat Calibration Updated October 27th, 2017
 Chromat Calibration Updated October 27th, 2017 Calibrating the Chromatograph Performing the Chromat Calibration is highly recommended when starting a new well. The MLogger already has a default calibration
REASONS FOR NATURAL VARIATIONS IN DISSOLVED OXYGEN LEVELS
 Period Date LAB. THE PHYSICAL PROPERTIES OF WATER: DISSOLVED OXYGEN In an aquatic environment, oxygen must be in a solution in a free state (O 2 ) before it is available for use by organisms (bioavailable).
Intelligent SUNTEX DC-5310(RS) Dissolved Oxygen Transmitter
 Dissolved Oxygen Transmitter") Intelligent SUNTEX DC-5310(RS) Dissolved Oxygen Transmitter Overview C % ppm 4~20mA Analog Output ppb Power Supply 100~240 VAC mg/l Dimensions 96 x 96 x 132mm RS-485 Digital Output (for DC-5310-RS only)
Intelligent SUNTEX DC-5310(RS) Dissolved Oxygen Transmitter Overview C % ppm 4~20mA Analog Output ppb Power Supply 100~240 VAC mg/l Dimensions 96 x 96 x 132mm RS-485 Digital Output (for DC-5310-RS only)
Calibration Procedure
 Management Procedure 2557 Revision: B Date Issued: September 20, 2016 Date Revised: March 13, 2018 Calibration Procedure PosiTector SST Soluble Salt Tester Table of Contents 1 Introduction and UUC Performance
Optical Dissolved Oxygen Meter
 Optical Dissolved Oxygen Meter HI764113 Rugged Optical Dissolved Oxygen Probe for Fresh and Saltwater Applications Digital, weighted probe No membranes No electrolytes No oxygen consumption No flow dependence
Overview. Learning Objectives
 0 Overview This module: Reviews the selection of a GLOBE hydrology site Reviews the water sampling technique used in GLOBE hydrology protocols Provides a step by step introduction of the protocol method
v /07/17 Page 1 of 18
 A. PURPOSE AND SCOPE Details the on-site measurement of free and total chlorine in water samples using the Palintest DPD,GP/HR and HACH DPD methods. B. CONTENTS A. PURPOSE AND SCOPE... 1 B. CONTENTS...
DeFelsko PosiTector Dew Point Meter DPM & DPMD Probes
 Management Procedure 2581 Revision: D Date Issued: November 9, 2007 Date Revised: April 19, 2017 Calibration Procedure DeFelsko PosiTector Dew Point Meter DPM & DPMD Probes Table of Contents 1 Introduction
Calcium Reactor. CalcFeeder PRO. User Manual 1.1a. Model. CalcFeeder AC1 PRO CalcFeeder AC2 PRO CalcFeeder AC3 PRO CalcFeeder AC4 PRO
 Calcium Reactor CalcFeeder PRO User Manual 1.1a Model CalcFeeder AC1 PRO CalcFeeder AC2 PRO CalcFeeder AC3 PRO CalcFeeder AC4 PRO Page 1 Dear Customer, Thank you for purchasing an Pacific Sun CalcFeeder
TABLE OF CONTENTS INTRODUCTION 3 SAFETY PRECAUTIONS 3 PACKAGE CONTENTS 4 DEVICE OVERVIEW 4 BUTTON OPERATION SUMMARY 5 BASIC OPERATION 6
 TABLE OF CONTENTS INTRODUCTION 3 SAFETY PRECAUTIONS 3 PACKAGE CONTENTS 4 DEVICE OVERVIEW 4 BUTTON OPERATION SUMMARY 5 BASIC OPERATION 6 CURRENT TIME MODE 7 FUNCTIONAL DISPLAY 7 WEATHER FORECAST FEATURE
Portable Gas Monitor GX User Maintenance Manual (H4-0050)
") H4E-0050 Portable Gas Monitor GX-8000 User Maintenance Manual (H4-0050) Need of Maintenance and Servicing This gas monitor must be maintained in a normal state at all times to prevent accidents due to
H4E-0050 Portable Gas Monitor GX-8000 User Maintenance Manual (H4-0050) Need of Maintenance and Servicing This gas monitor must be maintained in a normal state at all times to prevent accidents due to
FLOW MEASUREMENT (SEMI-SUBMERGIBLE OBJECT METHOD)
") Page 83 of 232 OKLAHOMA CONSERVATION COMMISSION WATER QUALITY DIVISION STANDARD OPERATING PROCEDURE FLOW MEASUREMENT (SEMI-SUBMERGIBLE OBJECT METHOD) Page 84 of 232 1.0 PROCEDURAL SECTION 1.1 Scope and
Page 83 of 232 OKLAHOMA CONSERVATION COMMISSION WATER QUALITY DIVISION STANDARD OPERATING PROCEDURE FLOW MEASUREMENT (SEMI-SUBMERGIBLE OBJECT METHOD) Page 84 of 232 1.0 PROCEDURAL SECTION 1.1 Scope and
DURRIDGE STAINLESS STEEL SOIL GAS PROBE
 DURRIDGE STAINLESS STEEL SOIL GAS PROBE CONTENTS 1. Introduction... 3 2. Placement... 3 3. Connection... 4 4 Measurement... 4 4.1 GRAB Protocol... 5 4.2 Continuous Monitoring... 6 4.3 Thoron Protocol...
Introduction This section includes suggestions on how to use this guide, an overview of course philosophy and goals.
 Oceanic OC1 Computer Diver DISTINCTIVE SPECIALTY INSTRUCTOR OUTLINE Introduction This section includes suggestions on how to use this guide, an overview of course philosophy and goals. How to Use this
Introduction This section includes suggestions on how to use this guide, an overview of course philosophy and goals.
 Cressi Leonardo Computer Diver DISTINCTIVE SPECIALTY INSTRUCTOR OUTLINE Introduction This section includes suggestions on how to use this guide, an overview of course philosophy and goals. How to Use this
Mix 920 ml of 87% glycerol (on shelf) with 1080 ml of Isoton II (in cabinet), stir in a flask until homogenized (the glycerol will sink).
 with 1080 ml of Isoton II (in cabinet), stir in a flask until homogenized (the glycerol will sink).") Instructions for the care and use of the Multisizer 3 The Multisizer is intended for quantifying either cells or spheres. We are in possession of two apertures: one with a 100-µm diameter opening and the
Instructions for the care and use of the Multisizer 3 The Multisizer is intended for quantifying either cells or spheres. We are in possession of two apertures: one with a 100-µm diameter opening and the
Swing Labs Training Guide
 Swing Labs Training Guide How to perform a fitting using FlightScope and Swing Labs Upload Manager 3 v0 20080116 ii Swing labs Table of Contents 1 Installing & Set-up of Upload Manager 3 (UM3) 1 Installation.................................
TQC Bresle Chloride test 2008
 TQC Bresle Chloride test 2008 SP7310 MANUAL See also : ISO8502-6 ISO8502-9 1 DETERMINATION OF SOLUBLE CONTAMINANTS ON SURFACES IN CONFORMITY WITH ISO 1.1 PREPARATION With this system very low concentrations
YSI-85_maint-cal Lab Version Page 1 of 13
 STANDARD OPERATING PROCEDURE MAINTENANCE/CALIBRATION CHECKS OF DISSOLVED OXYGEN PROBES INTRODUCTION The YSI-85 multimeter is a hand-held field meter that measures oxygen, conductivity, salinity and temperature
YSI Model 52 Dissolved Oxygen Meter
 YSI Model 52 Dissolved Oxygen Meter Operations Manual CONTENTS SECTION 1 INTRODUCTION... 1 1.1 PRINCIPLES OF OPERATION... 1 1.2 DISPLAY AND FUNCTION KEYS... 2 1.3 FUNCTION SWITCH... 2 1.4 POWER ON SELF-TEST...
STANDARD OPERATING PROCEDURE MAINTENANCE/CALIBRATION CHECKS OF DISSOLVED OXYGEN PROBES
 STANDARD OPERATING PROCEDURE MAINTENANCE/CALIBRATION CHECKS OF DISSOLVED OXYGEN PROBES INTRODUCTION The YSI-85 multimeter is a hand-held field meter that measures oxygen, conductivity, salinity and temperature
D-Opto Dissolved Oxygen Sensor Operation Manual
 D-Opto Dissolved Oxygen Sensor Operation Manual Software version 2.6 Contents 1. Introduction..... 1 Optical Sensor Technology.... 1 Features...... 1 2. D-Opto Specifications. 2 Specifications... 2 3.
TANK MANAGER FOR TWO TANKS OPERATING MANUAL. 10/31/11 C-More T6C L color touch panel
 TANK MANAGER FOR TWO TANKS OPERATING MANUAL 10/31/11 C-More T6C L color touch panel 1 TABLE OF CONTENTS GENERAL...3 INSTALLATION...4 STONE TEST PROCEDURE...7 OPERATIONAL SUMMARY...7 AUTO CARBONATION...10
Appendix D: SOP of INNOVA 1412 Photoacoustic Multi-Gas Monitor. Description and Principle of Operation
 Page 1 of 19 : SOP of INNOVA 1412 Photoacoustic Multi-Gas Monitor Description and Principle of Operation The photoacoustic multi-gas monitor (INNOVA 1412, Innova AirTech Instruments, Denmark) is a highly
Low-Flow Purging Procedure with MicroPurge basics Equipment. MP10 Bladder Pump Controller MP15 Control. MP30 Drawdown Meter.
 Low-Flow Purging Procedure with MicroPurge basics Equipment MP10 Bladder Pump Controller MP15 Control and Power Pack MP20 Flow Cell MP30 Drawdown Meter P.O. Box 326 Ann Arbor, MI 48106-326 USA 1-800-624-2026
Air Ball! LabQuest Vernier Gas Pressure Sensor Vernier Motion Detector basketball stopper with needle, stopper stem and tubing attached meter stick
 Air Ball! LabQuest 24 Do you ever wonder how the National Basketball Association (NBA) decides how much air should be in the basketballs used during a game? The NBA measures the pressure inside the ball