THE EPIDEMIOLOGY OF TRAUMATIC BRAIN INJURIES IN NEW YORK STATE
|
|
|
- Paul York
- 5 years ago
- Views:
Transcription
1 THE EPIDEMIOLOGY OF TRAUMATIC BRAIN INJURIES IN NEW YORK STATE Michael Bauer, Sarah Sperry, Kainan Sun, Susan Hardman New York State Department of Health, Bureau of Injury Prevention

2 What is Traumatic Brain Injury? Damage to the brain that results from: Violent shaking Striking a stationary object Being struck by a moving object Prevention is the ONLY cure!
3 Injuries are not Accidents Traumatic Brain Injuries are not random, uncontrollable acts of fate but rather occur: In highly predictable patterns With recognizable risk factors Among identifiable populations A TBI is a predictable and preventable event! This presentation will demonstrate some of these patterns in NYS.
4 Traumatic Brain Injury TBI data is like an iceberg. Death data is just the tip of the problem Hospitalization Discharge Data Emergency Department (ED) Visit Data Other medical treatment, or Untreated?

5 Traumatic Brain Injury New York State, Deaths 11.1/100,000 New Yorkers Hospitalizations 96.2/100,000 New Yorkers Average stay of 7 days Average charge of $37,839 ED Visits 425.4/100,000 New Yorkers Average charge of $1,909 µ = mean annual frequency


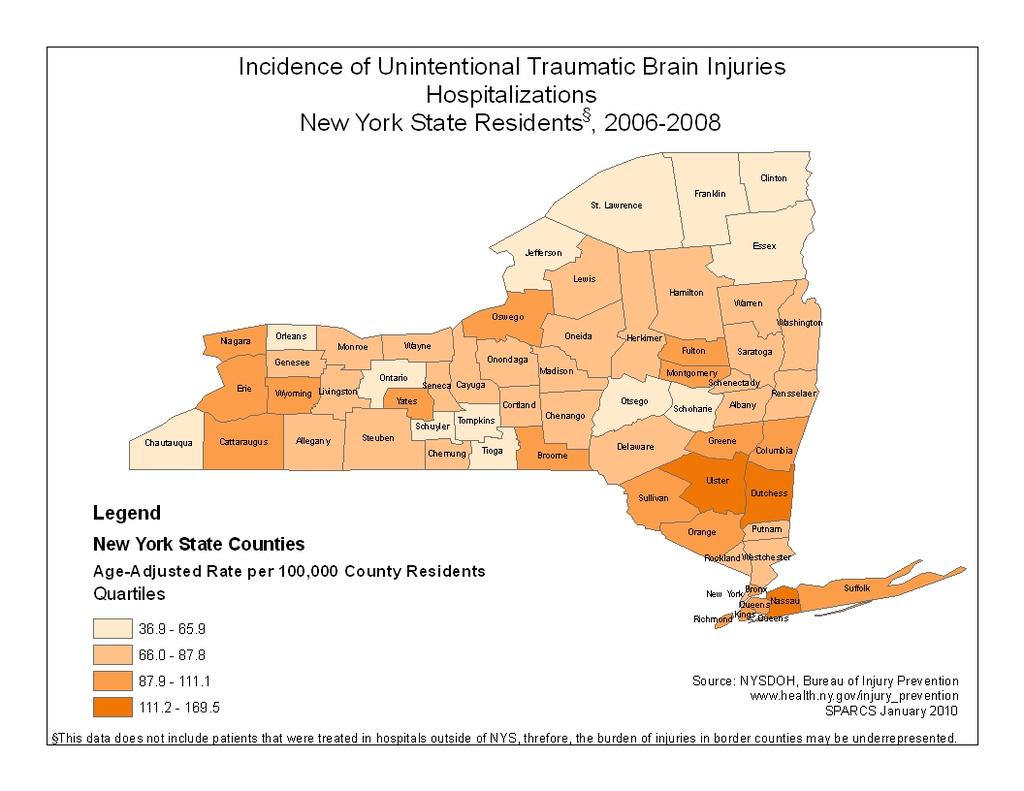
6 Traumatic Brain Injury - Hospitalizations New York State Residents, The rate of TBI hospitalizations have been increasing over time.

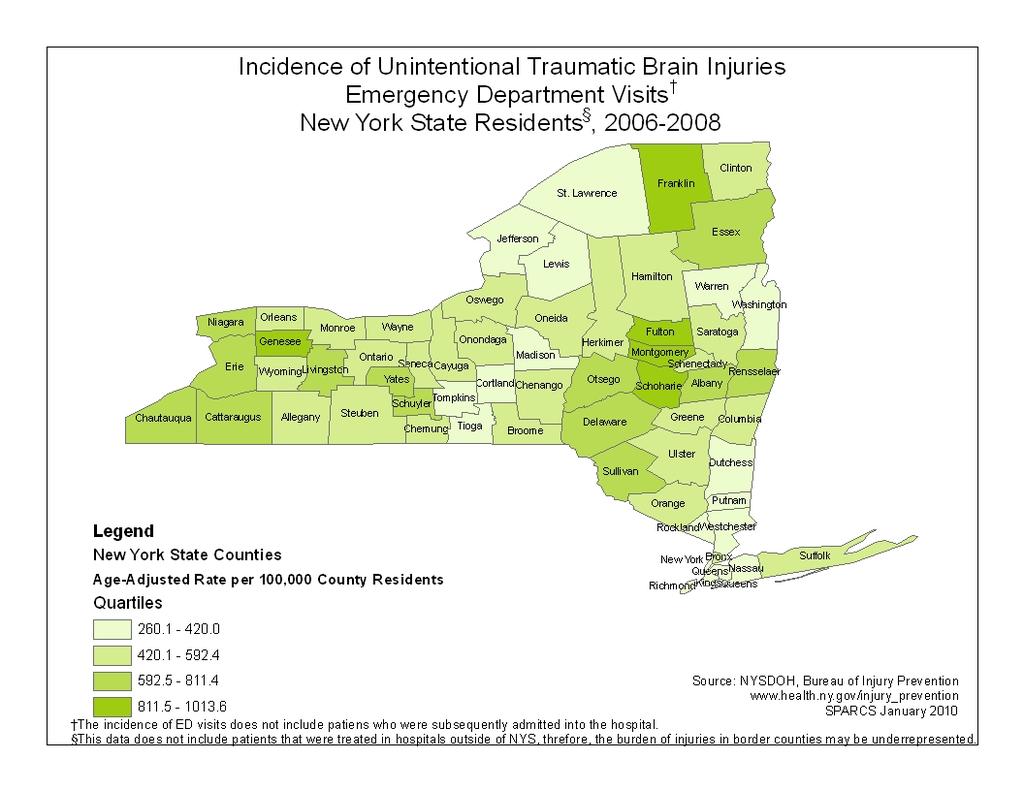
7 Traumatic Brain Injury - ED Visits New York State Residents, The rate of TBI ED Visits have increased each year since the data has been collected.
8 Gender Differences with TBI 73% of deaths were males Mean annual frequency male = 1,569 (16.7 per 100,000) Mean annual frequency female = 585 (5.9 per 100,000) 62% of hospitalized TBI patients were male Mean annual frequency male = 11,526 (122.7 per 100,000) Mean annual frequency female = 7,103 (71.2 per 100,000) 55% of ED Visits TBI patients were male Mean annual frequency male = 45,190 (481.1 per 100,000) Mean annual frequency female = 37,192 (373.0 per 100,000)
9
10
11 Traumatic Brain Injury- Charge Information New York State, Mean charge for hospitalizations = $37,839 Mean charge for non-tbi hospitalizations = $28,502 Mean length of stay = 7 days Yearly average hospitalization charges = $700 Million Mean charge for ED Visits = $1,909 Mean charge for non-tbi ED Visit = $1,044 Yearly average ED charges = $160 Million

12 Traumatic Brain Injury - Deaths New York State Residents, Early twenties and adults older than 65 have the highest rates.

13 Traumatic Brain Injury - Hospitalizations New York State Residents, Children less than one and adults older than 65 have the highest rates.


14 Traumatic Brain Injury - ED Visits New York State Residents, Children 0-4 and have the highest rates.
15 TBIs Disproportionately Impact Vulnerable New Yorkers: Older Adults Highest death rate 30.5/100,000 Death rate is 3x higher than any other age group! Highest rate of hospitalization (266.3/100,000) Children Children less than one have the second highest hospitalization rate (179.7) Children less than 1 and 1-4 have the highest ED treatment rates (1,447.0 & /100,000, respectively)
16 Deaths Due to Traumatic Brain Injury Leading Causes by Age Group New York State Residents, µ = Mean Annual Frequency Rank < Homicide µ=9 Homicide µ=9 * Homicide µ=3 Homicide µ=30 Homicide µ=54 Suicide µ=146 Suicide µ=152 µ=504 2 * µ=3 * * µ=20 µ=34 Homicide µ=126 µ=118 Suicide µ=98 3 * * * * µ=19 Suicide µ=31 µ=45 Homicide µ=51 µ=53 4 * * * * Suicide µ=16 µ=21 µ=43 µ=40 µ=22 5 * * * * µ=6 µ=9 Motorcyclist µ=38 µ=25 µ=21 6 * * * * µ=4 µ=8 µ=31 µ=24 Homicide µ=17 7 * * * * µ=3 Motorcyclist µ=7 µ=25 Motorcyclist µ=18 µ=6 8 * * * * * Transport, µ=3 Transport, µ=8 µ=12 Struck by / Against µ=3 9 * * * * * * µ=6 Poisoning µ=10 * 10 * * * * * * Pedal Cyclists µ=6 Transport, µ=8 * Unintentional MVT Other Unintentional Intentional MVT^ = Motor Vehicle Traffic * Means less than 3 are not reported Source: NYSDOH, Bureau of Injury Prevention Vital Statistics Death Files May 2010
17 Hospitalizations Due to Traumatic Brain Injury Leading Causes by Age Group New York State Residents, µ = Mean Annual Frequency Rank < µ=316 µ=282 µ=149 µ=161 µ=435 µ=432 µ=862 µ=1,879 µ=5,762 2 Assault µ=59 Struck By, Against µ=52 µ=67 µ=120 Assault µ=306 Assault µ=307 µ=830 µ=597 µ=407 3 Struck By, Against µ=22 µ=29 Struck By, Against µ=42 Struck By, Against µ=75 µ=179 µ=181 Assault µ=760 Assault µ=399 µ=224 4 µ=22 µ=26 µ=35 Assault µ=67 µ=120 µ=99 µ=263 µ=299 Struck By, Against µ=93 5 µ=9 Assault µ=15 Pedal Cyclist, µ=25 µ=56 Struck By, Against µ=96 Motorcyclist µ=74 Motorcyclist µ=186 Motorcyclist µ=133 µ=74 6 * µ=9 Pedal Cyclist µ=14 Pedal Cyclist, µ=54 Transport, µ=72 Transport, µ=41 Struck By, Against µ=114 Struck By, Against µ=106 Assault µ=70 7 * Transport, µ=5 Transport, µ=13 Pedal Cyclist µ=51 Pedal Cyclist µ=42 Struck By, Against µ=35 Transport, µ=106 Pedal Cyclist, µ=72 Transport, µ=37 8 *, µ=3 Assault µ=8 Transport, µ=26 Motorcyclist µ=37 Pedal Cyclist µ=28 Pedal Cyclist µ=73 Transport, µ=69 µ=25 9 * Pedal Cyclist, µ=2, µ=3 µ=6 Pedal Cyclist, µ=36 Pedal Cyclist, µ=18 Pedal Cyclists, µ=52 Pedal Cyclist µ=69 Pedal Cyclist, µ=17 10 * Natural, Environmental µ=2 * Motorcyclist µ=5 µ=14 Unintentional MVT Other Unintentional Intentional µ=12 µ=43 µ=66 Pedal Cyclist µ=15 MVT^ = Motor Vehicle Traffic *Means less than 2 are not reported Source: NYSDOH, Bureau of Injury Prevention SPARCS January 2010
18 ED Visits Due to Traumatic Brain Injury Leading Causes by Age Group New York State Residents, µ = Annual Frequency Rank < µ=2,998 µ=6,762 µ=2,749 Struck By, Against µ=2,486 Struck By, Against µ=2,893 Assault µ=1,899 µ=4,463 µ=5,791 µ=10,529 2 Struck By, Against µ=394 Struck By, Against µ=1,897 Struck By, Against µ=1,737 µ=2,357 Assault µ=2,151 µ=1,438 Assault µ=3,751 Struck By, Against µ=1,848 Struck By, Against µ=755 3 µ=80 µ=192 µ=272 Assault µ=793 µ=2,147 µ=1,336 Struck By, Against µ=3,127 µ=1,464 µ=517 4 µ=35 µ=150 Pedal Cyclist, µ=216 Pedal Cyclist, µ=351 µ=1,467 Struck By, Against µ=1,233 µ=2,597 Assault µ=1,370 µ=301 5 Assault µ=18 Pedal Cyclist, µ=80 µ=108 µ=293 Transport, µ=235 µ=165 µ=491 µ=371 Assault µ=151 6 Transport, µ=6 µ=46 Assault µ=102 Transport, µ=147 Pedal Cyclist, µ=212 Transport, µ=140 Transport, µ=286 µ=181 µ=108 7 µ=4 Transport, µ=30 µ=69 µ=130 µ=196 µ=81 µ=211 Transport, µ=180 Transport, µ=51 8 Natural, Environmental µ=2 Cut/Pierce µ=29 Transport, µ=68 µ=90 µ=101 Pedal Cyclist, µ=76 Pedal Cyclist, µ=190 Pedal Cyclist, µ=164 µ=37 9 Overexertion µ=2 Assault µ=26 Cut/Pierce µ=21 Pedal Cyclist µ=45 µ=68 µ=73 µ=182 µ=104 Pedal Cyclist, µ=29 10 Pedal Cyclist, µ=2, µ=16 Pedal Cyclist µ=19 Overexertion µ=18 Pedal Cyclist µ=57 Motorcyclist µ=56 Motorcyclist µ=124 Motorcyclist µ=77 Cut/Pierce µ=23 The incidence of Emergency Department visits does not include patients that were subsequently admitted into the hospital. Unintentional MVT Other Unintentional Intentional MVT^ = Motor Vehicle Traffic *Means less than 2 are not reported Source: NYSDOH, Bureau of Injury Prevention SPARCS January 2010


19 Percent of Deaths by Intent with Traumatic Brain Injury New York State Residents, All Ages,


20 Percent of Hospitalizations by Intent with Traumatic Brain Injury New York State Residents, All Ages,


21 Percent of ED Visits* by Intent with Traumatic Brain Injury New York State Residents, All Ages, *Does not include patients admitted into hospital
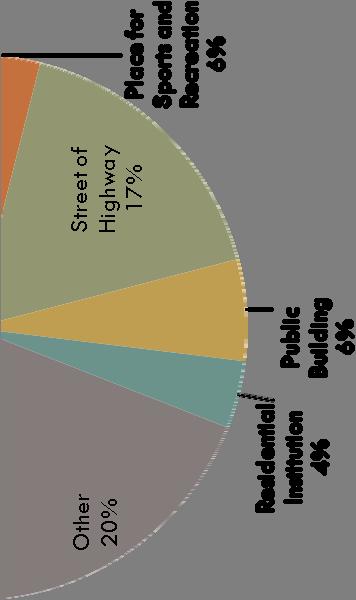

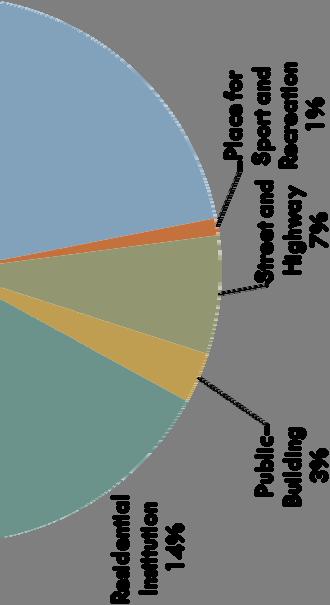
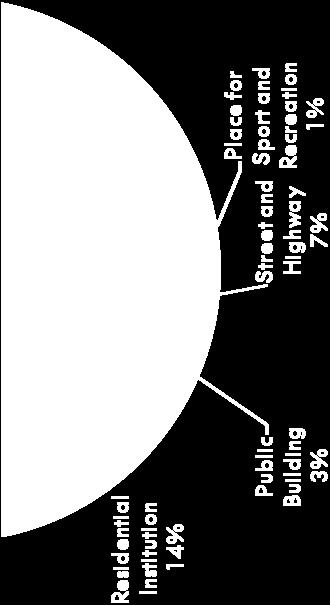
22 TBI Hospitalizations - Place of Injury NYS Residents, Ages 0-64 Years Ages 65+ Years


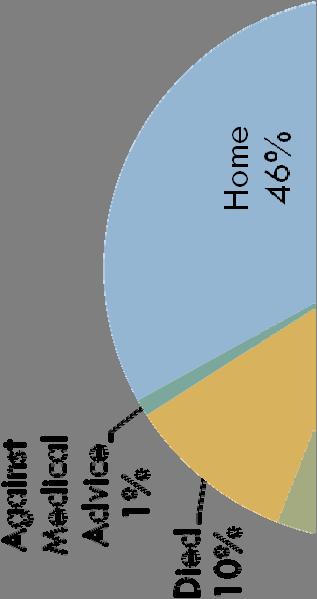
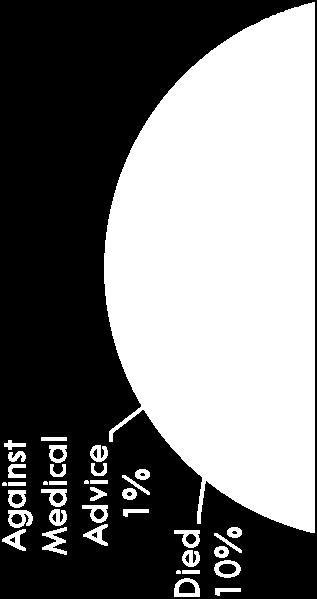
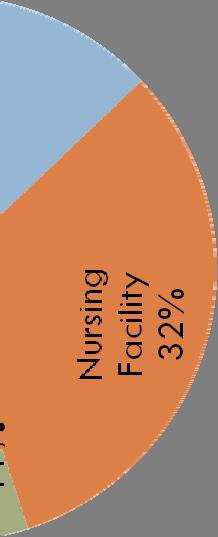
23 TBI Patient Hospital Discharge Location NYS Residents, Ages 0-64 Years Ages 65+ Years
24 Leading Causes of TBI in Older Adults, 65+ New York State, Deaths Hospitalizations ED Visits* µ=504 Suicide µ=98 µ=53 µ=22 µ=21 µ=5,762 µ=407 µ=224 Struck By, Against µ=93 µ=74 µ=10,529 Struck By, Against µ=755 µ=517 µ=301 Assault µ=151 Unintentional MVT Other Unintentional Intentional *Does not include patients admitted into hospital


25 Percent of Deaths Due to Injury with Traumatic Brain Injury New York State Residents, Ages 65+,

26 Incidence of Injuries Percent of Hospitalizations with Traumatic Brain Injury New York State Residents, Ages


27 Incidence of Injuries Percent of ED Visits* with Traumatic Brain Injury New York State Residents, Ages *Does not include patients admitted into hospital
28 TBI Deaths Due to MVT Injuries NYS Residents, Gender Males: Yearly Average of 342 rate of 3.6 per 100,000 residents Females: Yearly Average of 148 rate of 1.5 per 100,000 residents 490 New Yorkers died as a result of a MVT-related TBI An average of over 1 death per day!
29 NYS DOH, BIP Injury Surveillance System Crash Outcome Data Evaluation System (CODES) is a linked database Matches individual records from Accident Information System data to Pre-Hospital Care Report data Matches individual records from Accident Information System data to Hospital Discharge and Emergency Department data


30 Percent of TBI Hospitalizations Following a Traffic Crash New York State Residents, * *Data based on frequencies of less than six are not reported.
31 Hospitalizations Due to MVT Injuries on NYS Roadways, 2008 Gender Males: 7,523 hospitalizations 31.8% diagnosed with TBI while hospitalized Females: 4,664 hospitalizations 27.7% diagnosed with TBI while hospitalized 12,187 people were injured severely enough to require hospitalization 30.2 % were diagnosed with a TBI An average of over 33 people hospitalized, including 11 TBI each day!


32 Percent of TBI ED Visits Following a Traffic Crash New York State Roadways, 2008
33 Emergency Department Visits Due to MVT Injuries on NYS Roadways, 2008 Gender Males: 72,545 ED Visits 6.9% diagnosed with TBI while being treated Females: 68,257 ED Visits 7.1% diagnosed with TBI while being treated 140,816 people were injured severely enough to require treatment at EDs 7.0 % were diagnosed with a TBI An average of over 386 people treated at EDs, including 27 TBIs every day!
34 Selected Risk Factors Crash Types and Contributing Factors Type of Crash or Contributing Factor Total Number of People Involved Number of People Hospitalized TBI (Percent of Hospitalizations ) Alcohol-Related 20,255 1, % Speed-Related 68,762 2, % Driver Distraction 132,251 1, % Failure to Yield 106,273 1, % Following Too Closely Passing / Lane Violations Traffic Control Disregarded 116, % 51, % 31, %
35 Selected Risk Factors Traffic Injuries Role Types Type of Crash or Contributing Factor Total Number of People Involved Number of People Hospitalized TBI (Percent of Hospitalizations ) Bicyclists 5, % Motorcyclists 5,845 1, % Motor Vehicle s 719,548 8, % s 16,415 1, % Other 35, % NYS Helmet Laws: Bicyclists under the age 14 must wear an approved helmet All motorcycle riders (drivers and passengers) must wear a DOTapproved helmet
36 Selected Risk Factors Traffic Injuries Restraint Use Type of Crash or Contributing Factor Total Number of People Involved Number of People Hospitalized TBI (Percent of Hospitalizations ) No Restraint Used 24,357 1, % Restraint Used 563,621 6, % Unknown 131,570 1, % s that did not use restraints: Were almost 4 times more likely to require hospitalization The average hospital charge was over $20,000 higher! Were almost 3 times more likely to be diagnosed with a TBI NYS seat belt law: Every occupant in the front seats, the driver and each passenger must wear a seat belt. Every occupant of a motor vehicle being operated by the holder of a Learner Permit, or Junior Driver License must be restrained by a safety restraint. Each passenger under age 16 must wear a seat belt or use an appropriate child safety restraint system.
37 Conclusions Annually in NYS, TBIs result in: 2,100 deaths 18,500 hospitalizations 82,000 emergency department visits $860 million in hospital charges Motor vehicle crashes, falls, and assaults are the leading causes of TBI
38 Conclusions Who is at greatest risks: Males are more likely to sustain a TBI. Adults 65 years and older have the highest rate of TBI deaths. Children under the age of one and adults 65 years and older are most likely to sustain a TBI severe enough to require hospitalization; year olds have the third highest rate. Children four years and younger are the most likely to be treated in an emergency department for a TBI; year olds have the third highest rate.
39 Conclusions While it is difficult to grasp the extent of TBI incidence and prevalence, the data does show patterns in the occurrence of TBI. Continued surveillance efforts will increase our knowledge of TBI occurrence. Prevention programs focused on evidence-based strategies and best practices will help to prevent traumatic brain injuries among New Yorkers!
40 Questions? For additional questions please contact me: Michael Bauer, M.S. Data Manager Bureau of Injury Prevention 150 Broadway, 3 rd Floor West Menands, NY (518) mjb13@health.state.ny.us
Community of Practice on Traumatic Brain Injury
 Community of Practice on Traumatic Brain Injury Second Meeting October 15, 2013, 3:00-4:00 PM ET For audio, please call 866-835-7973. Your phone line is currently muted. Today s Agenda Overview of TBI
MTCF. Michigan Traffic Crash Facts FACT SHEETS
 FACT SHEETS This page left intentionally blank GENERAL FACTS The driver, the roadway, and the motor vehicle contribute in some measure to every crash. A preponderance of evidence, however, points to driver
MTCF. Michigan Traffic Crash Facts FACT SHEETS
 FACT SHEETS This page left intentionally blank GENERAL FACTS The driver, the roadway, and the motor vehicle contribute in some measure to every crash. A preponderance of evidence, however, points to driver
2014 QUICK FACTS ILLINOIS CRASH INFORMATION. Illinois Emergency Medical Services for Children February 2016 Edition
 2014 QUICK FACTS ILLINOIS CRASH INFORMATION February 2016 Edition Illinois Emergency Medical Services for Children www.luhs.org/emsc Illinois Emergency Medical Services for Children TABLE OF CONTENTS
2012 QUICK FACTS ILLINOIS CRASH INFORMATION. Illinois Emergency Medical Services for Children September 2014 Edition
 2012 QUICK FACTS ILLINOIS CRASH INFORMATION September 2014 Edition Illinois Emergency Medical Services for Children www.luhs.org/emsc Illinois Emergency Medical Services for Children TABLE OF CONTENTS
Alberta. Traffic Collision Statistics. Office of Traffic Safety Transportation Services Division May 2017
 Traffic Collision Statistics Office of Traffic Safety Transportation Services Division May 217 This page was intentionally left blank. 2 Table of Contents Traffic Collisions... 4 Traffic Collision Rates...
Deaths/injuries in motor vehicle crashes per million hours spent travelling, July 2007 June 2011 (All ages) Mode of travel
 Mode of travel") Cyclists CRASH STATISTICS FOR THE YEAR ENDED 31 DECEMBER 211 Prepared by the Ministry of Transport CRASH FACTSHEET 212 Cyclists have a number of risk factors that do not affect car drivers. The main risk
Cyclists CRASH STATISTICS FOR THE YEAR ENDED 31 DECEMBER 211 Prepared by the Ministry of Transport CRASH FACTSHEET 212 Cyclists have a number of risk factors that do not affect car drivers. The main risk
Motor Vehicle Related Fatalities 10-year Statistics for British Columbia Research and Data Unit Policy and Strategic Initiatives Branch
 Motor Vehicle Related Fatalities 1-year Statistics for British Columbia 27-216 Research and Data Unit Website: www.gov.bc.ca/roadsafetybc Twitter: http://twitter.com/ Contents Contents... 2 Introduction
People killed and injured per million hours spent travelling, Motorcyclist Cyclist Driver Car / van passenger
 Cyclists CRASH FACTSHEET 27 CRASH STATISTICS FOR THE YEAR ENDED 31 DEC 26 Prepared by Strategy and Sustainability, Ministry of Transport Cyclists have a number of risk factors that do not affect car drivers.
the Ministry of Transport is attributed as the source of the material
 Cyclists 2015 Disclaimer All reasonable endeavours are made to ensure the accuracy of the information in this report. However, the information is provided without warranties of any kind including accuracy,
2015 Victorian Road Trauma. Analysis of Fatalities and Serious Injuries. Updated 5 May Page 1 of 28. Commercial in Confidence
 2015 Victorian Road Trauma Analysis of Fatalities and Serious Injuries Updated 5 May 2016 Page 1 of 28 Commercial in Confidence VICROADS_n3445896_2015_Victorian_Trauma_Report_- _updated_may_2016.docx 2015
Figure 1. Indiana fatal collisions by young driver involvement,
 INDIANA TRAFFIC SAFETY FACTS YOUNG DRIVERS 2016 MAY 2017 ISSUE 17-C06 IN 2016: In 2016, 13.4 percent of all drivers involved in Indiana collisions were young drivers. Young drivers were involved in 105
Safety and Active Transport. Dr. Maureen Carew, Medical Officer of Health Renfrew County and District Health Unit May 30, 2014
 Safety and Active Transport Dr. Maureen Carew, Medical Officer of Health Renfrew County and District Health Unit May 30, 2014 Active Transport Vision Increase levels of walking and cycling Reduce vehicle
CDRT. Child Death Review Team Dallas County. Brief Report Traffic-related Child Deaths OVERVIEW
 Dallas County CDRT Child Death Review Team 2013 Brief Report Traffic-related Child Deaths 2006-2011 OVERVIEW In Dallas County, traffic-related injury death rates among children are typically less than
Draft Report: Traffic Crashes in the Denver Region
 Click to edit Master title style Click to edit Master title style Draft Report: Traffic Crashes in the Denver Region Presented by: Steve Cook Board Nov. 16, 2016 Click Report Click to to edit on edit Master
Sydney, AUSTRALIA Beijing, CHINA Hyderabad, INDIA London, UK. Affiliated with the University of Sydney
 Sydney, AUSTRALIA Beijing, CHINA Hyderabad, INDIA London, UK Affiliated with the University of Sydney Road Traffic Injuries in Asia Professor Rebecca Ivers 2 Major causes of death 3 Million people 2 1.8
road safety issues 2001 road toll for Gisborne district July 2002 Road user casualties Estimated social cost of crashes*
 GISBORNE DISTRICT road safety issues July 22 The Land Transport Safety Authority (LTSA) has prepared this Road Safety Issues Report. It is based on reported crash data and trends for the 1997 21 period.
Traffic Safety Facts 2007 Data
 Traffic Safety Facts 2007 Data Bicyclists and Other Cyclists DOT HS 810 986 Bicyclists and other cyclists include riders of two-wheel nonmotorized vehicles, tricycles, and unicycles powered solely by pedals.
A review of 2015 fatal collision statistics as of 31 December 2015
 A review of fatal collision statistics as of 31 December This report summarises the main trends in road fatalities that have emerged in. This has been prepared by the Road Safety Authority following analysis
Retrospective Study of Juvenile Motor Vehicle Deaths
 Retrospective Study of Juvenile Motor Vehicle Deaths Karin Wells, BA Michelle A. Jorden, MD Santa Clara County Medical Examiner-Coroner s Office Why this study? Dr. Jorden is Chair of the Child Death Review
The Statistics. Tips for Parents
 The Statistics In 2001, the most recent statistics for Texas, 985 children, age 0-14, were injured in crashes with motor vehicles. For that same period of time and age range, 9 children died and 66 percent
Traffic Safety Facts. State Traffic Data Data. Overview
 Traffic Safety Facts 2015 Data June 2017 DOT HS 812 412 State Traffic Data Key Findings Traffic fatalities increased by 7 percent from 2014 to 2015 (32,744 to 35,092) for the United States. The fatality
Toward Zero Deaths: Proactive Steps for Your Community
 Est. Dec. 2014 Toward Zero Deaths: Proactive Steps for Your Community Presented by: Brian Roberts, P.E., National Association of County Engineers Marie Walsh, Ph.D., Louisiana Local Technical Assistance
Analysis of Pennsylvania Crash Statistics Data
 Analysis of Pennsylvania Crash Statistics Data By: Louis Pesci, Ph.D., Jeffrey Grim, P.T.P, Lucas Tatarko and Joseph Franze Indiana University of Pennsylvania May 2017 Executive Summary In 2015, 1,200
Napier City road trauma for Napier City. Road casualties Estimated social cost of crashes* Major road safety issues.
 ISSN 1176-841X July 25 Land Transport New Zealand has prepared this road safety issues report. It is based on reported crash data and trends for the 2 24 period. The intent of the report is to highlight
SECTION 1. The current state of global road safety
 SECTION 1 The current state of global road safety The number of road traffic deaths each year has not increased but remains unacceptably high at 1.24 million per year. Many countries have successfully
Review of Fatal Collisions
 Review of Fatal Collisions January to July 1 st 16 Review of 16 fatal collision statistics as of 1st July 16 Overview This report summarises the main trends in road fatalities that have emerged up to the
Risk on the Road. Pedestrians, Cyclists and Motorcyclists August 2015
 Risk on the Road Pedestrians, Cyclists and Motorcyclists August 215 Contents Key Facts... 4 Pedestrians... 5 Pedestrian risk by time of day and age... 8 Cyclists... 11 Motorcyclists... 14 Glossary... 17
European facts and Global Status Report on Road Safety 2013
 European facts and Global Status Report on Road Safety 2013 Francesco Mitis WHO Regional Office for Europe Rome, 20 December 2013 mit@euro.who.int Monitoring a Decade UN GA resolution 54/255 in 2010 called
the Ministry of Transport is attributed as the source of the material
 Pedestrians 216 Disclaimer All reasonable endeavours are made to ensure the accuracy of the information in this report. However, the information is provided without warranties of any kind including accuracy,
Post-neonatal mortality (28 days to 1 year)
") Figure A1: Infant, neonatal and post-neonatal mortality rate (per 1000 live births), 1979 2003 14 12 10 Deaths per 1000 live births 8 6 4! N ZHIS CYMRC # 2 0 1979 1980 1981 1982 1983 1984 1985 1986 1987
Figure A1: Infant, neonatal and post-neonatal mortality rate (per 1000 live births), 1979 2003 14 12 10 Deaths per 1000 live births 8 6 4! N ZHIS CYMRC # 2 0 1979 1980 1981 1982 1983 1984 1985 1986 1987
Cambridgeshire and Peterborough Road Safety Partnership Handbook
 and Peterborough Road Safety Partnership Handbook ANNUAL STATISTICS SUMMARY 2015 3941 CCC_Road Safety HBook.indd 1 19/08/2016 14:59 Contents Introduction 2 Key points 3 Summary table 4 Overall trends 4
2003 road trauma for. Wairoa District. Road casualties Estimated social cost of crashes* Major road safety issues WAIROA DISTRICT JULY 2004
 WAIROA DISTRICT JULY 24 T he Land Transport Safety Authority (LTSA) has prepared this road safety issues report. It is based on reported crash data and trends for the 1999 23 period. The intent of the
WEEK 3 DRIVING SAFETY
 WEEK 3 DRIVING SAFETY Driving Safe starts before the engine. Most drivers are aware of the affect that things like drinking and cell phone use have on their driving safety, while giving little consideration
Road Safety Partnership
 Cambridgeshire and Peterborough Road Safety Partnership Cambridgeshire and Peterborough Road Safety Partnership Introduction Road accidents can have a devastating impact not only for the people directly
Protecting our Children and Youth. The Life Saving Benefits of Child Safety Seats, Boosters, and Seat Belts
 Protecting our Children and Youth The Life Saving Benefits of Child Safety Seats, Boosters, and Seat Belts The Problem Motor vehicle crashes are the leading cause of death among children ages 3 and over.
Unintentional injuries
 Unintentional injuries Key points In 1998 451 children aged less than 15 years were admitted to hospital with burns from hot objects or substances, caustic or corrosive substances, and steam. In 1998 the
Factors Leading to Older Drivers Intersection Crashes
 Factors Leading to Older Drivers Intersection Crashes APHA Annual Meeting 2007 Washington, DC November 7, 2007 Keli A. Braitman Bevan B. Kirley Neil K. Chaudhary Projections of population and licensure
This Workbook has been developed to help aid in organizing notes and references while working on the Traffic Safety Merit Badge Requirements.
 This Workbook has been developed to help aid in organizing notes and references while working on the Traffic Safety Merit Badge Requirements. Visit www.scoutmasterbucky.com for more information SCOUT S
the Ministry of Transport is attributed as the source of the material
 Disclaimer All reasonable endeavours are made to ensure the accuracy of the information in this report. However, the information is provided without warranties of any kind including accuracy, completeness,
Louisiana Traffic Records Data Report 2017
 Louisiana Traffic Records Data Report 2017 crashdata.lsu.edu Dr. Helmut Schneider September 2018 Overview Trends in crashes, fatalities & injuries Findings from the Occupant Protection Survey of 2018 Driving
ROAD SAFETY ANNUAL REPORT 2018 ISRAEL
 ROAD SAFETY ANNUAL REPORT 2018 ISRAEL ISRAEL Israel recorded 321 road fatalities in 2017, representing a 3.9% decrease when compared to 2016. The mortality rate is 3.6 deaths per 100 000 population. Since
MEMORANDUM. City Constituents. Leilani Schwarcz, Vision Zero Surveillance Epidemiologist, SFDPH
 MEMORANDUM TO: FROM: CC: City Constituents Leilani Schwarcz, Vision Zero Surveillance Epidemiologist, SFDPH Megan Wier, Co-Chair, San Francisco Vision Zero Task Force, SFDPH Commander Ann Mannix, Traffic
NEW JERSEY LAW ENFORCEMENT LIAISON NEWSLETTER
 NEW JERSEY LAW ENFORCEMENT LIAISON NEWSLETTER SEPTEMBER 2017/12 WWW.NJSACOP.ORG DRIVE SOBER OR GET PULLED OVER NJ DIVISION OF HIGHWAY TRAFFIC SAFETY The mission of the Division of Highway Traffic Safety
The burden of road crashes on the health system in Asia Pacific
 The burden of road crashes on the health system in Asia Pacific Professor Peter F.M. Choong Sir Hugh Devine Professor of Surgery, University of Melbourne Department of Surgery Director of Orthopaedics,
Road safety status in the WHO South-East Asia Region, 2013
 Road safety status in the WHO South-East Asia Region, 2013 2013 (1) (2) (3) Key facts at a glance Road traffic crashes accounted for 334 815 deaths in the South-East Asia Region during 2010, with the rate
Traffic Collision Statistics Report
 Traffic Collision Statistics Report 2016 Prepared by Tahir Hameed, M.Eng, P.Eng, PTOE Traffic Safety Engineer Debbie Rawson, M.Sc. Transportation Integration and Safety Advisor Transportation Planning
officer Traffic Safety National Law Enforcement Officers Memorial Fund September 2012
 officer Traffic Safety National Law Enforcement Officers Memorial Fund September 2012 Did you know? On average, a law enforcement officer is killed somewhere in the U.S. every 54 hours There are some 60,000
Alabama Observational Survey of Occupant and Child Restraint Use 2010
 Alabama Observational Survey of Occupant and Child Restraint Use 21 Contact Information: Alabama Department of Public Health Bureau of Health Promotion & Chronic Disease Injury Prevention Branch RSA Tower,
Lane Area Transportation Safety and Security Plan Vulnerable Users Focus Group
 Lane Area Transportation Safety and Security Plan Vulnerable Users Focus Group Agenda 1. Planning Process Review 2. What are Emphasis Areas? 3. Your Role Today 4. Data Review 5. Small group discussion
Injury Mortality in Ireland, Northern Ireland and Britain
 Injury Mortality in Ireland, Northern Ireland and Britain INIsPHO Lunchtime Seminar December 2007 Steve Barron Research Analyst INIsPHO@IPH Injury mortality in Ireland, Northern Ireland and Britain Method
EGYPT: a national decade of action for road safety
 EGYPT: a national decade of action for road safety 2011 2020 Egypt EGYPT Population: 75 497 913 Income group: Middle Gross national income per capita: $1 580 INSTITUTIONAL FRAMEWORK Lead agency Funded
Mission: The mission of FARS is to make vehicle crash information accessible and useful so that traffic safety can be improved
 Mission: The mission of FARS is to make vehicle crash information accessible and useful so that traffic safety can be improved NHTSA created FARS in 1975 National Center for Statistics and Analysis (NCSA)
Traffic Safety Basic Facts Main Figures. Traffic Safety Basic Facts Traffic Safety. Main Figures Basic Facts 2015.
 Traffic Safety Basic Facts 2013 - Main Figures Traffic Safety Basic Facts 2015 Traffic Safety Main Figures Basic Facts 2015 Main Figures EU road safety targets The European Commission set the ambitious
BICYCLE SAFETY: A PARENT S GUIDE
 BICYCLE SAFETY: A PARENT S GUIDE Thank you for partnering with the Newport Beach Police Department to help make your child a safer bicyclist. BE A ROLL MODEL LEARN. As a parent, it is important that you
MODULE 1 ROAD SAFETY QUIZ - KEYS4LIFE ONLINE
 MODULE 1 ROAD SAFETY QUIZ - KEYS4LIFE ONLINE Questions and Answers Question 1 If you are travelling in a lane that has a left-turn arrow marked on the road, can you drive straight ahead? Yes, if no other
Maine Highway Safety Facts 2016
 Maine Highway Safety Facts 216 216 MAINE HIGHWAY SAFETY FACTS The Bureau of Highway Safety and the Maine Department of Transportation are pleased to present the 216 edition of Maine Highway Safety Facts.
Alberta. Traffic Collision Statistics
 Alberta Traffic Collision Statistics 2002 Alberta Traffic Collision Statistics 2002 For further information contact: Alberta Transportation Driver Safety, Research and Traffic Safety Initiative 1st Floor,
Grade 2-3 MATH Traffic Safety Cross-Curriculum Activity Workbook
 Grade 2-3 MATH Tra fic Safety Cross-Curriculum Activity Workbook Note to Teachers The AAA Traffic Safety Education Materials present essential safety concepts to students in Kindergarten through fifth
A Critical Review of International Road Safety Databases
 A Critical Review of International Road Safety Databases George Yannis, Eleonora Papadimitriou, Katerina Folla National Technical University of Athens, Greece, Department of Transportation Planning and
COLLISION STATISTICS May Engineering Services Box 5008, th Avenue Red Deer, AB T4N 3T4
 COLLISION STATISTICS 2016 2016 Red Deer Annual Motor Vehicle Collision Report May 2017 Engineering Services Box 5008, 4914 48th Avenue Red Deer, AB T4N 3T4 engineering@reddeer.ca RCMP GRC Red Deer City
Working for a world free of road crash death and injury
 Working for a world free of road crash death and injury Presentation Outline What makes a road user vulnerable? Who is a Vulnerable Road User? What can be done to protect Vulnerable Road Users? Goal 3:
Occ c u c pa p n a t pro r t O ec e t c i t O i n
 Occupant Protection Occupant Protection Introduction Buckling up or being buckled in is the most effective protection during a car crash. The simple truth is that the great majority of people ejected from
Crashes of older Australian riders
 CRICOS No 00213J Crashes of older Australian riders Prof Narelle Haworth, CARRS-Q Christine Mulvihill, MUARC Outline Motorcycle crash trends and rates Types of older riders Survey method Survey results
An Overview of Traffic Records. April 15, 2016 John Riemer
 An Overview of Traffic Records April 15, 2016 John Riemer What is traffic records? The traffic records office is required by state statue to maintain a database of motor vehicle crashes that occur on all
Northland Region road trauma for Northland Region. Road casualties Estimated social cost of crashes* Major road safety issues
 ISSN 1176-841X July 26 Land Transport has prepared this road safety issues report. It is based on reported crash data and trends for the 21 25 period. The intent of the report is to highlight key road
Road Safety Annual Report 2016 OECD/ITF Chapter 26. Morocco
 Road Safety Annual Report 2016 OECD/ITF 2016 Chapter 26 Morocco This chapter presents 2014 road safety data for Morocco along with provisional data from 2015. It looks at trends in traffic and road safety
Alberta. Traffic Collision Statistics
 Alberta Traffic Collision Statistics 2015 Alberta Traffic Collision Statistics 2015 For further information contact: Alberta Transportation Office of Traffic Safety Main Floor, Twin Atria Building 4999
Police Recorded Injury Road Traffic Collisions and Casualties Northern Ireland. Detailed Trends Report 2015
 Police Service of Northern Ireland Police Recorded Injury Road Traffic Collisions and Casualties Northern Ireland Detailed Trends Report 2015 Annual Bulletin Published 30 th June 2016 Contact: Traffic
Long-term consequence of injury on self-rated health
 Long-term consequence of injury on self-rated health Bjarne Laursen SAFETY2010, London September 23, 2010 Bjarne Laursen, Hanne Møller, Anne Mette Hornbek Toft National Institute of Public Health Background
Prevention Routière Internationale. Study design for measurment of behavioural indicators
 Prevention Routière Internationale Study design for measurment of behavioural indicators March, 2016 1 1. Brief description of the project There is a high consensus among scientist community, researchers
Cyclist Safety in Australia
 Cyclist Safety in Australia From BITRE Trauma Statistical Summary, August 218 http://www.bitre.gov.au/publications/ongoing/road_deaths_australia_annual_summaries.aspx Trends in cyclist trauma numbers These
Cambridgeshire and Peterborough Road Safety Partnership Handbook
 and Peterborough Road Safety Partnership Handbook ANNUAL STATISTICS SUMMARY- 2016 Contents Introductions 1 Key points 2 Summary table 3 Overall trends 3 Casualties by prevailing speed limit 4 Casualties
2012 TOWN OF CASTLE ROCK MOTOR VEHICLE ACCIDENT FACTS PREPARED BY THE PUBLIC WORKS DEPARTMENT
 ATTACHMENT A 2012 TOWN OF CASTLE ROCK MOTOR VEHICLE ACCIDENT FACTS PREPARED BY THE PUBLIC WORKS DEPARTMENT ACKNOWLEDGEMENTS This report was assembled from data provided by the Castle Rock Police Department
Analyses and statistics on the frequency and the incidence of traffic accidents within Dolj County
 UNIVERSITY OF PITESTI SCIENTIFIC BULLETIN Faculty of Mechanics and Technology AUTOMOTIVE series, year XXIV, no. 28 Analyses and statistics on the frequency and the incidence of traffic accidents within
EMS professionals face many risks exposure to infectious diseases, violence, hazardous scenes, and oncoming traffic, to name a few.
 EMS professionals face many risks exposure to infectious diseases, violence, hazardous scenes, and oncoming traffic, to name a few. However, none of these risks compares to the potential for death and
Part 1 Road Transport
 Part 1 Road Transport Chapter 1 Road Traffic Accident Trends I Outline of Present Situation Title 1 Land Transport 1 Long-Term Transition of Road Traffic Accidents Traffic fatalities are reduced in 1 consecutive
For further information contact: Alberta Infrastructure and Transportation Office of Traffic Safety Main Floor, Twin Atria Building Avenue
 Alberta Traffic Collision Statistics 2006 Alberta Traffic Collision Statistics 2006 For further information contact: Alberta Infrastructure and Transportation Office of Traffic Safety Main Floor, Twin
Truck Tractor Trailer Crash Analysis
 Building Tribal Traffic Safety Capacity Truck Tractor Trailer Crash Analysis Arizona Department of Transportation (ADOT) Motor Vehicle Crash (MVC) Data ITCA, Inc. 04/18/06 Truck Tractor Trailer Crash Analysis
9/17/2014. Accessing and Using Data for Planning Complete Streets Projects. Welcome! Webinar Guidelines
 Accessing and Using Data for Planning Complete Streets Projects NYS Prevention Agenda Webinar Series September 19, 2014 Welcome! Today you will hear a presentation and have the opportunity to ask questions
INFORMATION TOOL KIT
 CANADA ROAD SAFETY WEEK 2017 INFORMATION TOOL KIT Thank you for being involved in Canada Road Safety Week. With your participation, we can spread the word about this special week and why it is an important
Strategies for Sharing the Road with Other Users
 Idaho Driver Education and Training Strategies for Sharing the Road with Other Users M15-1 Sharing the Road Introduction Idaho law requires motorists to operate their vehicles in a careful and prudent
Characteristics of Fatal Pedestrian Crashes on Freeways. Kay Fitzpatrick Texas A&M Transportation Institute
 Characteristics of Fatal Pedestrian Crashes on Freeways Kay Fitzpatrick Texas A&M Transportation Institute Transportation Short Course Design Session October 15, 2013 Project Background (0-6702) Motivation:
Western Bay of Plenty/ Tauranga Area
 ISSN 1176-841X July 5 Land Transport New Zealand has prepared this report. It is based on reported crash data and trends for the 4 period. The intent of the report is to highlight the key and provide partners
Road Safety Annual Report 2016 OECD/ITF Chapter 31. Norway
 Road Safety Annual Report 2016 OECD/ITF 2016 Chapter 31 Norway This chapter presents 2014 road safety data for Norway along with provisional data from 2015. It looks at trends in traffic and road safety
BIA INDIAN HIGHWAY SAFETY PROGRAM FY2016 LAW ENFORCEMENT OVERTIME GRANT
 SECTION A: General Information. This section must be completed for all applicants. Name of Tribe: Click here to enter text. Address : Click here to enter text. City: Click here to enter text. State: Click
Officer Safety on our Roadways
 Lifesavers 30th National Conference on Highway Safety Priorities Officer Safety on our Roadways June 15, 2012 Craig W. Floyd Chairman & CEO National Law Enforcement Officers Memorial Fund Memorial Fund
DOES A TOWBAR INCREASE THE RISK OF NECK INJURY IN REAR-END COLLISIONS?
 DOES A TOWBAR INCREASE THE RISK OF NECK INJURY IN REAR-END COLLISIONS? A STUDY BASED ON A MERGER OF DANISH ADMINISTRATIVE REGISTRIES ANNE VINGAARD OLESEN H A R R Y L A H R M A N N T H E T R A F F I C RESEARCH
Study on fatal accidents in Toyota city aimed at zero traffic fatality
 Study on fatal accidents in Toyota city aimed at zero traffic fatality Toru Kiuchi, Yoshihisa Kanno, Makoto Shiota Toyota Motor Corporation, 1 Toyota-cho, Toyota-shi, Aichi 471-8571, Japan Abstract - Since
For further information contact: Alberta Transportation Office of Traffic Safety Main Floor, Twin Atria Building Avenue Edmonton, Alberta T6B
 Alberta Traffic Collision Statistics 2009 Alberta Traffic Collision Statistics 2009 For further information contact: Alberta Transportation Office of Traffic Safety Main Floor, Twin Atria Building 4999
THE OFFICIAL GUIDE TO CYCLING SAFELY IN PHILADELPHIA
 B IKE NICE THE OFFICIAL GUIDE TO CYCLING SAFELY IN PHILADELPHIA A partnership of the City of Philadelphia and the Bicycle Coalition of Greater Philadelphia ABOUT VISION ZERO & BIKE NICE It s a great day
Grade 2-3 SPELLING Traffic Safety Cross-Curriculum Activity Workbook
 $1.39 Grade 2-3 SPELLING Tra fic Safety Cross-Curriculum Activity Workbook Note to Teachers The AAA Traffic Safety Education Materials present essential safety concepts to students in Kindergarten through
ITARDA INFORMATION. No.128. Special feature
 ITARDA INFORMATION No.128 Special feature Special feature Accidents when four-wheel vehicles are reversing ~ Drivers must thoroughly check behind them, especially in parking lots! ~ Introduction You may
AAA ON THE ISSUES
 AAA ON THE ISSUES 2 0 1 7 TABLE OF CONTENTS Introduction About AAA Traffic Safety Distracted Driving Impaired Driving Occupant Protection Steer It, Clear It Automated Enforcement Infrastructure Autonomous
Road safety in the Eastern Mediterranean Region
 Road safety in the Eastern Mediterranean Region Facts from the Global Status Report on Road Safety 2013 Road safety in the Eastern Mediterranean Region Introduction In 2004, the World Health Organization
Table of Content. Cyclist Injury Crashes APPENDIX GIS Heat Maps by Municipality P a g e
 Table of Content INTRODUCTION... 5 ALCOHOL... 6 Impaired Driving - Fatalities... 6 Youth Alcohol... 11 Youth Impaired Driving - Fatalities... 11 Alcohol-Impaired Driving Injury crashes... 16 SPEEDING &
Florida Class E Knowledge Exam Road Rules Practice Questions
 1. If you are being followed too closely while driving, you should: A. Drive closer to the car in front of you. B. Speed up to increase the distance between you and the following vehicle. C. Slow down
A Study of Road Traffic Accident (RTA) Deaths in a Teaching Hospital in Ahmedabad from January 2014 to June 2014 classified according to ICD-10
 Deaths in a Teaching Hospital in Ahmedabad from January 2014 to June 2014 classified according to ICD-10") Original Article Healthline Journal Volume 6 Issue 2 (July - December 2015) A Study of Road Traffic Accident (RTA) Deaths in a Teaching Hospital in Ahmedabad from January 2014 to June 2014 classified according
Original Article Healthline Journal Volume 6 Issue 2 (July - December 2015) A Study of Road Traffic Accident (RTA) Deaths in a Teaching Hospital in Ahmedabad from January 2014 to June 2014 classified according
Ride-On Mower Injuries in Children
 Committee on Accident and Poison Prevention Ride-on mowers or lawn tractors are common lawn and field mowing vehicles used in the United States. An estimated 7.65 million such mowers are in operation annually.
To lane-split or not lane-split: Can the UC Berkeley Study help me decide?
 To lane-split or not lane-split: Can the UC Berkeley Study help me decide? Authors note: I wrote the initial draft of this article shortly after reading the June 2, 2015 AMA news release referenced. I