Traffic Collision Statistics Report
|
|
|
- Brooke Carr
- 5 years ago
- Views:
Transcription
1 Traffic Collision Statistics Report 2016 Prepared by Tahir Hameed, M.Eng, P.Eng, PTOE Traffic Safety Engineer Debbie Rawson, M.Sc. Transportation Integration and Safety Advisor Transportation Planning and Engineering Department Strathcona County
2 Table of Contents Table of Contents Collision Quick Facts... 3 Section 1: Introduction About This Report About Strathcona County... 4 Section 2: Historical Collision Statistics Overall: All Roads within County Borders County Roads Only (Excluding Provincial Hwys) County Owned Rural vs Urban Collision Trends Provincial Highways Collision Trends Section 3: 2016 Collision Statistics and Trends Overview Cost of Collisions Major and Fatal Collisions Collision Causes Temporal Analysis Intersection-Related Collisions Neighbourhood Collisions Animal Collisions Demographics Vulnerable Road User Collisions Pedestrian Collisions Bicycle Collisions Motorcyclists Commercial Vehicle Collisions Alcohol Related Collisions Appendix- Glossary of Terms P age
3 As a Result of Collisions in 2016: The estimated direct cost of collisions in 2016 in Strathcona County was $56 Million 2 P age
4 2016 Collision Quick Facts 2,178 collisions occurred on public roadways; 35% of these collisions happened on provincial highways 5 fatal collisions occurred on public roads; all were males over 25 years old 558 injury collisions occurred on public roadways; these resulted in 64 major injuries requiring hospitalization and 709 minor injuries to road users Individuals aged were the most likely to be injured in a collision 12% of major injury collisions (7) in 2016 took place on residential roads 49% of all collisions occurred at intersections Followed Too Close was the most common cause of collisions in 2016 The highest number of fatal and injury collisions took place in June. Property damage only collisions were most common in January. Collision primetime is Friday between 5:00 and 6:00 pm. 14.5% of all reported collisions were animal related. Collision Comparisons from 2015 to 2016 Statistic % Change All Roads Within County Total Collisions Fatal Collisions Major Injury Collisions Minor Injury Collisions PDO Collisions Collisions per 1,000 population Injury Collisions* per 1,000 population Collision Injuries* Collision Injuries* per 1,000 population Pedestrian Collisions Fatal and Major Pedestrian Injuries Bicycle Collisions Fatal and Major Cyclist Injuries Motorcycle Collisions Fatal and Major Motorcyclist Injuries Intersection Collisions Animal Collisions Alcohol Related Collisions % Commercial Vehicle Collisions County Owned Roads Total Collisions Fatal Collisions Major Injury Collisions Minor Injury Collisions PDO Collisions Injury Collisions* per 1,000 population *Includes Fatal, Major Injury and Minor Injury 3 P age
5 Section 1: Introduction 1.1 About This Report This report provides a summary of motor vehicle collisions reported from January 1, 2016 to December 31, 2016 within Strathcona County. Strathcona County maintains a database, Traffic Crash Location System (TCLS), which contains all reportable collisions that occur on public roadways within County boundaries (both County-owned and Provincial). The information is collected from the provincial report form, which is completed by members of the Royal Canadian Mounted Police (RCMP) either on paper at the scene of the collision or electronically at the front counter of the detachment. The database reflects all reported collisions on public roadways that resulted in property damage of CAD $2,000 or greater (since 2011, and CAD $1,000 prior to 2011), as well as any collision that resulted in a major or minor injury or fatality. The information presented in this report is based upon reportable incidents at the time of printing. Due to continuing police investigations, some numbers presented in this report may be subject to revision. Significance of Collisions Statistics At the heart of the Safe System Approach is the need to make data driven decisions to improve road safety. Collision data is used to develop, establish, and implement initiatives using all of the 5 E s of traffic safety: engineering, enforcement, education, evaluation and engagement. Some of the major tasks are: Developing road safety projects and programs such as education, enforcement, and communication campaigns; Identifying and investigating high risk road safety situations and establishing countermeasures and priorities to correct the identified hazards or potential hazards; Identifying safety and communication needs of special user groups, such as older drivers, pedestrians, bicyclists, motorcyclists, and commercial vehicles; Facilitating budget planning; Determining collision reduction targets and monitoring our progress towards these targets. 1.2 About Strathcona County Set in the centre of Alberta s energy and agricultural heartland, Strathcona County is a thriving community of more than 98,000 residents. Strathcona County is made up of the urban area of Sherwood Park and a large rural area of farms, acreages and eight smaller hamlets. 4 P age

6 Strathcona County is a large municipality, covering 1,262 km 2, with a variety of land uses. Table 1: Land use by area in Strathcona County Agricultural Industrial Commercial Residential Urban village* Park/recreation/natural Other: airports, water bodies, roads, road rights-of-way 87,502 hectares 9,052 hectares 2,078 hectares 18,542 hectares 66 hectares 3,701 hectares 5,679 hectares * New zoning type added for 2016 includes mix of residential and commercial Geographical Location Strathcona County lies to the east of the City of Edmonton, Alberta, Canada, and is part of the Edmonton Metropolitan Region. Figure 1: The Edmonton Metropolitan Region 5 P age
7 1.2.2 Roadway Network There are 1,943 km of public roadways in Strathcona County, including: 232 km of Provincially-maintained highways; 403 km of County-maintained urban roads; 1,308 km County-maintained rural roads Traffic Signals Strathcona County operates approximately 115 signalized devices. There are also four signals operated by the City of Edmonton on our western border. In addition, signals on provincial highways are operated by Alberta Transportation. Figure 2: Urban Traffic Signal Locations 6 P age
8 1.2.4 Demographic Information Population Strathcona County is a fast growing community, experiencing an 18.8% population increase between 2006 and The majority of this growth has taken place in Sherwood Park, which has grown by 24% during this timeframe. Table 2: Strathcona County Population ( ) Year Sherwood Park **Rural Strathcona Total Strathcona County * ,845 25,666 82, ,409 26,112 85, ,660 26,338 87,998 * ,733 27,757 92, ,465 26,938 92, ,782 26,815 95,597 * ,618 27,426 98,044 *Census of Canada ** acreages, farms, rural hamlets Age According to the 2016 Canadian Census, the average age in Strathcona County is 39.2 years. This is higher than the Alberta average of 37.8, but lower than the Canadian average of Table 3: Strathcona County Population Breakdown by Age (from 2016 Canadian Census data) Age Group Percent of Population 14 and under and older 14.0 Total Population (All Ages) Strathcona County has 3% fewer seniors and 3% more children under 15 than the Canadian average. Travel Habits Residents of Strathcona County are heavily dependent on personal vehicles for travel. Use of personal vehicles for the journey to work is much higher in the County than the provincial and national average. 7 P age

 Registered Vehicles and Licensed Drivers According to Alberta Transportation, Sherwood Park had")


9 Table 4: Mode of Commuting for County Residents vs Alberta and Canada Main Mode of Commuting Strathcona Alberta* Canada* County* Car, truck, van- as driver Car, truck, van- as passenger Public Transit Walk Bicycle Other method *as a percentage of the employed labour force aged 15 and over (from 2016 Canadian Census data) Registered Vehicles and Licensed Drivers According to Alberta Transportation, Sherwood Park had 70,517 1 licensed drivers in No data is available for Strathcona County, but given that this number exceeds the population of Sherwood Park, it likely reflects all or most of the County. Similarly, Alberta Transportation reports there are 84,667 2 motorized vehicles for highway use registered in Sherwood Park. This amounts to 1.2 vehicles per licensed driver, again reflecting the vehicle-dependent nature of Strathcona County School Zones/Playground Zones/Residential Speed Limits Strathcona County utilizes both school zones/areas and playground zones/areas. Strathcona County utilizes default playground and school zone effective times as established by the province under Alberta s Use of Highway and Rules of the Road Regulation. School and playground areas are indicated by advisory signs only without a black and white speed sign. They are warnings to alert drivers to be cautious of children, but the speed limit does not change from the previously posted limit. A playground zone has a black and white 30 km/h sign below the yellow sign. Playground zone times are in effect starting at 8:30 a.m. and ending one hour after sunset daily. A school zone has a black and white 30 km/h sign attached below the green school sign. The school zone speed limit is 30 km/h, and is in effect the following times on school days: 8 a.m. to 9:30 a.m.; 11:30 a.m. to 1:30 p.m.; and 3 p.m. to 4:30 p.m P age
10 With the exception of school and playground zones (during specified times), all collector and local roads within the County operate at 50 km/h unless otherwise posted. Section 2: Historical Collision Statistics 2.1 Overall: All Roads within County Borders Over the last 10 years, total reported collisions in the County have dropped slightly despite significant population growth. Total collision rates and property damage only (PDO) collision rates are down significantly between (20% and 23% respectively). In 2011, the minimum for collision reporting increased from $1000 to $2000, which likely accounts for at least part of this decrease. In the last 10 years the rate of minor injury collisions has also decreased 15%; however, rates recorded from 2010 through 2014 were significantly lower. Rates of major injury collisions have increased 29% since 2007, and more than doubled since our lowest recorded rates in Fatal collision rates are very low, and do not lend themselves to comparison. Table 5: All Collisions by Consequence within County Borders Year Fatal Major* Minor** PDO*** Total *One or more persons required hospitalization **One or more persons injured ***Property Damage Only 9 P age
11 Table 6: Collision Rates per 100,000 Population on All Roads Within the County Year Fatal Major* Minor** PDO*** Total *One or more persons required hospitalization **One or more persons injured ***Property Damage Only Figure 3 combines fatal and injury collision statistics in order to better assess the incidence of our most serious collisions. Figure 3: Crash Rates for Fatal/Major Injuries Combined All Roads Within County Crash Rate (Fatal and Major Injury Crashes) per 100,000 Population Year 10 P age
12 2.2 County Roads Only (Excluding Provincial Hwys) Similar collision trends can be seen when Provincial highways are excluded from the analysis. Table 7: All Collisions by Consequence on County Roads (Excluding Provincial Hwys) Year Fatal Major* Minor** PDO*** Total *One or more persons required hospitalization **One or more persons injured ***Property Damage Only Despite decreasing collision rates for minor injury, PDO and total collisions, the major injury collision rate on County owned roads has increased by 55% between 2007 and Rates have more than tripled from lows recorded in 2011 and Table 8: Collision Rates per 100,000 Population on County Roads Only Year Fatal Major* Minor** PDO*** Total *One or more persons required hospitalization **One or more persons injured ***Property Damage Only 11 P age
13 Figure 4: Crash Rates for Fatal/Major Injuries Combined County Owned Roads Crash Rate (Fatal and Major Injury Crashes) per 100,000 Population Year 2.3 County Owned Rural vs Urban Collision Trends Looking at the data from from an urban vs rural perspective, we can see that the collision trends have not been the same across the County. There has been a large increase in fatal and major injury collisions in both the urban and rural area, although the trend has been stronger in the urban area. 12 P age
14 Figure 5: Fatal/Major Collisions Urban vs Rural County Owned Roads ( ) Minor injury collisions have remained fairly constant over the last five years in the rural areas, while there has been an increase of about 30% in the urban area. Figure 6: Minor Injury Collisions Urban vs Rural County Owned Roads ( ) Minor Injury Collisions Collisions Urban Rural Property damage only collisions have dropped substantially in the urban area, while at the same time increasing in rural areas. 13 P age
15 Figure 7: PDO Collisions Urban Roads ( ) Property Damage Only - Urban Collisions Year Figure 8: PDO Collisions Rural County Owned Roads ( ) Property Damage Only - Rural Collisions Year 14 P age
16 2.4 Provincial Highways Collision Trends Historically, the majority of fatal crashes in the County take place on provincial highways. This is not surprising given these are the highest speed roads in the County. This was also the case in 2016 with four of five fatal crashes happening on highways. Table 9: Provincial Highways Collision Trends Year Fatal Major Injury Minor Injury PDO Total A significant number of major injury crashes also tend to take place on the highways. Similar to the trend on County owned roads, the number of major injury collisions on the highways increased from However, the rate of increase was not as high, and the proportion of major injury crashes on provincial highways fell 12% between 2014 and Table 10: Provincial Highway Collisions as a Percentage of Total County Collisions Year Fatal Major Injury Minor Injury PDO Total % 52% 40% 35% 37% % 44% 33% 37% 36% % 40% 34% 35% 35% 15 P age


17 Section 3: 2016 Collision Statistics and Trends Section 3 provides a deeper analysis of 2016 collision statistics and trends. 3.1 Overview As a result of traffic collisions in Strathcona County in 2016: 5 People Lost Their Lives 1 Vehicle Passenger 2 Motorcyclists 1 Pedestrian 1 Cyclist 64 People Sustained Major Injuries Requiring Hospitalization 42 Drivers 10 Passengers 5 Motorcyclists 5 Pedestrians 2 Cyclists 709 people sustained minor injuries 16 P age
18 3.2 Cost of Collisions The 2017 Collision Cost Study 3 quantifies the costs that are associated with motor vehicle collisions within the Capital Region using local data. It is estimated that collisions in 2016 in Strathcona County cost local taxpayers just over $56 million. This estimate considers only direct costs, not including human costs, such as pain, suffering and grief. Table 11: Direct Cost of Collisions in Strathcona County 2016 Level of Injury Estimated Cost Number of Total Cost of per Collision Victims Collisions Fatality $204,848 5 $1,024,240 Major Injury $122, $7,814,592 Minor Injury $33, $24,091,111 Property Damage Only $14, $23,146,180 Total Direct Cost of Collisions in Strathcona County* $56,076,123 *Direct costs include costs for property damage, emergency response, health care services, travel delay, legal costs and short-term productivity loss. They do not include any costs for discounted future earnings, pain, suffering or grief. 3.3 Major and Fatal Collisions In keeping with Strathcona County s Traffic Safety Strategic Plan (TSSP), our goal is to specifically reduce the kind of collisions that cause serious injury and death. The following two maps illustrate the location of fatal and major injury crashes in Strathcona County as a whole, and specifically in the Urban Service Area. Detailed analysis of these crashes is included throughout the report, as a deeper understanding of the events and conditions that resulted in these failures of our Safe System is important to help determine the most appropriate engineering, education, enforcement or engagement related countermeasure to reduce the probability of another similar crash. 3 Collision Cost Study Update, 2017, Paul de Leur, available at 17 P age
19 18 P age
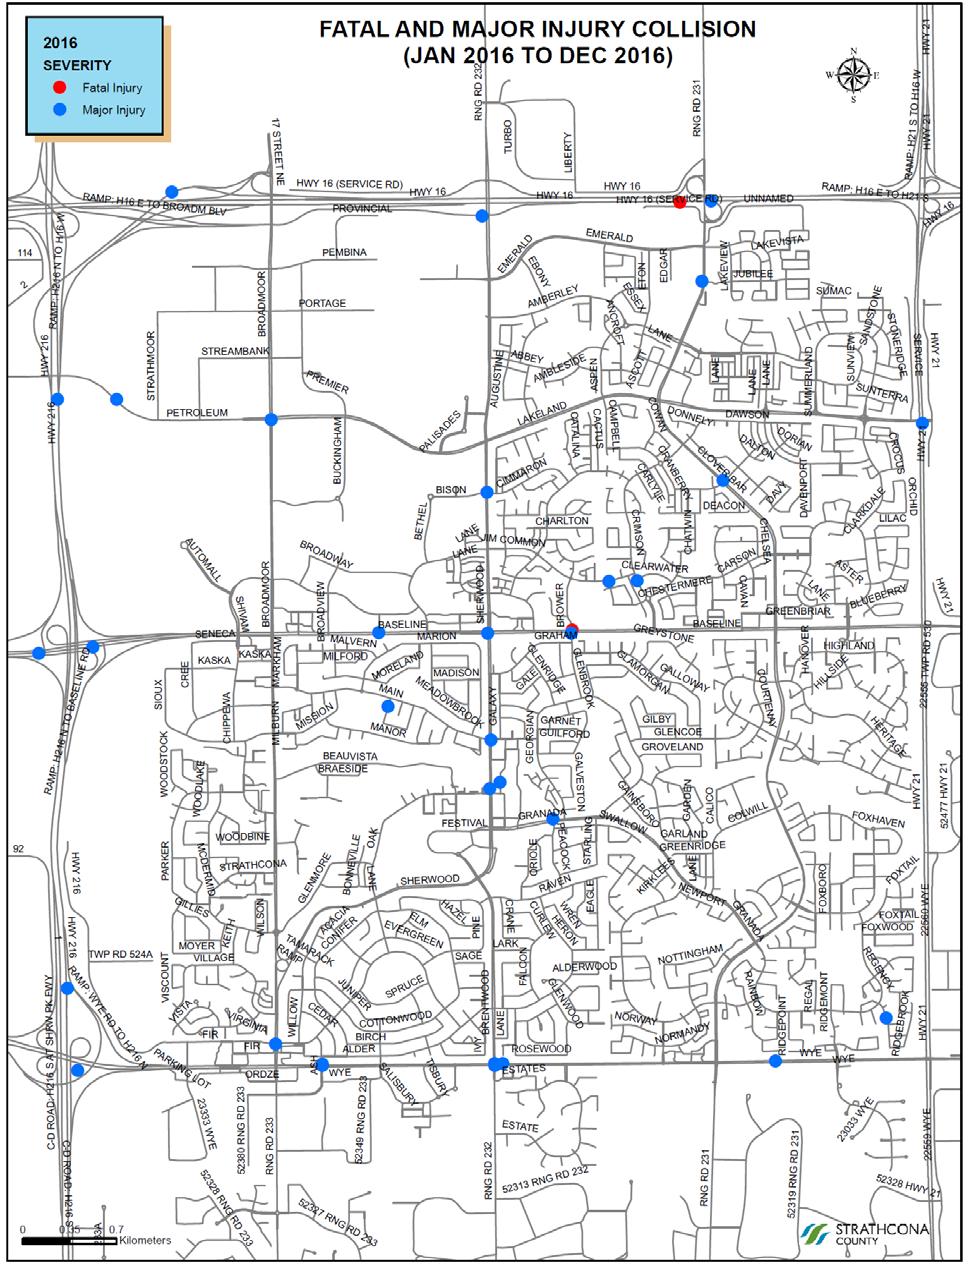
20 19 P age
21 3.4 Collision Causes Followed Too Close was the most common overall cause of collisions in For fatal and injury (including major and minor injury) the top eight causes of collision were: 1. Followed Too Close/Rear-Ended 2. Left Turn Across Path 3. Lost Control 4. Failied to Proceed in Safety 5. Disobey Traffic Signal 6. Ran-Off-Road 7. Animal Accident 8. Failed to Stop For collisions that involved only property damage, the top eight causes of collision were: 1. Followed Too Close/Rear-Ended 2. Animal Accident 3. Lost Control 4. Hit and Run 5. Ran-Off-Road 6. Side Swiped 7. Back Unsafely 8. Left Turn Across Path Side Impact (T-Bone, left-turn-across path, right angle) collisions are the most dangerous kind of collision for vehicle occupants, as serious injury or death is increasingly likely for speeds greater than 50 km/h. Not surprisingly, the causes of injury collisions were more likely to be the kind of collision that results in a 90 degree side impact than those recorded in PDO collisions. 20 P age
22 3.5 Temporal Analysis Month The highest number of fatal and injury collisions took place in June Generally, the most serious collisions occurred from May to July as well as in December and January. PDO collisions were most common in January Generally, PDO collisions were high in the winter months and lowest in the summer. Figure 9: Fatal and Injury Collisions by Month 2016 DECEMBER NOVEMBER OCTOBER SEPTEMBER AUGUST JULY JUNE MAY APRIL MARCH FEBRUARY JANUARY Figure 10: Property Damage Only (PDO) Collisions by Month 2016 DECEMBER NOVEMBER OCTOBER SEPTEMBER AUGUST JULY JUNE MAY APRIL MARCH FEBRUARY JANUARY P age
23 Day of the Week Friday was the most common day of the week for all kinds of collisions in Figure 11: Fatal and Injury collisions by Day of the Week 2016 SUNDAY SATURDAY FRIDAY THURSDAY WEDNESDAY TUESDAY MONDAY Figure 12: Property Damage Only (PDO) collisions by Day of the Week 2016 SUNDAY SATURDAY FRIDAY THURSDAY WEDNESDAY TUESDAY MONDAY P age
24 Time of Day On weekdays, all types of crashes were most likely between 5:00 and 6:00 pm. Generally, weekday crashes are highest in the afternoon peak time, with a less marked increase during the morning peak hours. Figure 13: Fatal and Injury Collisions by Time of Day Weekdays 11 PM - 12 AM 10 PM - 11 PM 9 PM - 10 PM 8 PM - 9 PM 7 PM - 8 PM 6 PM - 7 PM 5 PM - 6 PM 4 PM - 5 PM 3 PM - 4 PM 2 PM - 3 PM 1 PM - 2 PM 12 PM - 1 PM 11 AM - 12 PM 10 AM - 11 AM 9 AM - 10 AM 8 AM - 9 AM 7 AM - 8 AM 6 AM - 7 AM 5 AM - 6 AM 4 AM - 5 AM 3 AM - 4 AM 2 AM - 3 AM 1 AM - 2 AM 12 AM - 1 AM P age
25 Figure 14: Property Damage Only Collisions by Time of Day Weekdays 11 PM - 12 AM 10 PM - 11 PM 9 PM - 10 PM 8 PM - 9 PM 7 PM - 8 PM 6 PM - 7 PM 5 PM - 6 PM 4 PM - 5 PM 3 PM - 4 PM 2 PM - 3 PM 1 PM - 2 PM 12 PM - 1 PM 11 AM - 12 PM 10 AM - 11 AM 9 AM - 10 AM 8 AM - 9 AM 7 AM - 8 AM 6 AM - 7 AM 5 AM - 6 AM 4 AM - 5 AM 3 AM - 4 AM 2 AM - 3 AM 1 AM - 2 AM 12 AM - 1 AM On weekends, collisions generally peak in the early afternoon. This is most marked with fatal and injury collisions, which are most likely to happen between 2:00 and 3:00 pm. 24 P age
26 Figure 15: Fatal and Injury Collisions by Time of Day Weekends 10 PM - 11 PM 8 PM - 9 PM 6 PM - 7 PM 4 PM - 5 PM 2 PM - 3 PM 12 PM - 1 PM 10 AM - 11 AM 8 AM - 9 AM 6 AM - 7 AM 4 AM - 5 AM 2 AM - 3 AM 12 AM - 1 AM Figure 16: Property Damage Only Collisions by Time of Day Weekends 10 PM - 11 PM 8 PM - 9 PM 6 PM - 7 PM 4 PM - 5 PM 2 PM - 3 PM 12 PM - 1 PM 10 AM - 11 AM 8 AM - 9 AM 6 AM - 7 AM 4 AM - 5 AM 2 AM - 3 AM 12 AM - 1 AM P age
27 3.6 Intersection-Related Collisions In 2016, almost half of all collisions in Strathcona County were intersection-related. About 2/3 of injury collisions happen at intersections saw an increasing trend towards intersection-related collisions over Table 12: Intersection-Related Collisions as a Percentage of Total Collisions % change All Collisions PDO Minor Injury Major Injury Fatal The top three intersections for collision frequency are the highest volume intersections in Sherwood Park. Five of the top collision frequency locations are on Sherwood Drive, and five are on Baseline Road. Table 13: Top 10 Intersections for Collision Frequency 2016 RANK PRIMARY STREET INTERSECTING STREET FATAL MAJOR MINOR PDO TOTAL BROADMOOR 1 BASELINE RD BLVD SHERWOOD DR BROADMOOR BLVD BASELINE RD SHERWOOD DR WYE RD BRENTWOOD BLVD BASELINE RD CLOVER BAR RD LAKELAND DR SHERWOOD DR GLENBROOK BLVD BASELINE RD BRENTWOOD BLVD SHERWOOD DR BASELINE RD SHIVAM RD/CHIPPEWA RD SHERWOOD DR MAIN/GATEWOOD P age
28 The top 3 intersections for frequency of rear-end collisions are the highest volume intersections in Sherwood Park. Five of the top collision frequency locations are on Sherwood Drive, and four are on Baseline Road. Table 14: Top 10 Intersections for Rear End Collisions 2016 RANK PRIMARY STREET INTERSECTING STREET REAR END 1 BASELINE RD BROADMOOR BLVD 32 2 SHERWOOD DR BROADMOOR BLVD 19 3 BASELINE RD SHERWOOD DR 17 4 WYE RD BRENTWOOD BLVD 14 5 LAKELAND DR SHERWOOD DR 13 6 BASELINE RD CLOVER BAR RD 13 7 BRENTWOOD BLVD SHERWOOD DR 12 8 BASELINE RD SHIVAM RD/CHIPPEWA RD 12 9 SHERWOOD DR MAIN/GATEWOOD HWY 21 WYE RD 8 The top three intersections for side impact collisions are lower volume intersections. Table 15: Top 10 Intersections for Left-Turn Across Path (LTXP)/Right Angle Collisions 2016 NUMBER PRIMARY STREET INTERSECTING STREET LTXP + RIGHT ANGLE 1 GLENBROOK BLVD BASELINE RD 10 2 SHERWOOD DR FIR ST 10 3 WYE RD ASH ST 9 4 WYE RD SHERWOOD DR 8 5 LAKELAND DR SHERWOOD DR 6 6 HWY 21 WYE RD 6 7 BASELINE RD SHERWOOD DR 5 8 WYE RD BRENTWOOD BLVD 5 9 BASELINE RD CLOVER BAR RD 4 10 BASELINE RD 17 ST 4 Since the number of pedestrian and bicycle collisions are relatively low, collisions are included in this analysis for 10 years ( ). Sherwood Drive/Granada Boulevard intersection has almost double the incidence of any other location. 27 P age
29 The following two tables are based on 10 year data in order to identify trends. Four of the top 12 intersections for fatal/major injury collision are located on Wye Road, four are on Sherwood Drive and three are on Highway 21. Table 16: Top 12 intersections for Frequency of Fatal/Major Injury Collisions ( ) RANK PRIMARY ST INTERSECTING STREET FATAL MAJOR TOTAL 1 WYE RD BRENTWOOD BLVD BASELINE RD 17 ST WYE RD HWY SHERWOOD DR MAIN/GATEWOOD BLVD HWY 16 RNG RD WYE RD ASH ST SHERWOOD DR FIR ST WYE RD SHERWOOD DR LAKELAND DR SHERWOOD DR LAKELAND DR BROADMOOR BLVD RNG RD 542 HWY TWP RD 540 HWY Table 17: Top 10 Intersections for Pedestrian and Bike Collisions ( ) PRIMARY ST INTERSECTING ST FATAL MAJOR MINOR PDO TOTAL SHERWOOD DR GRANADA BLVD BROADMOOR BLVD BROADWAY BLVD SHERWOOD DR MAIN/GATEWOOD CLOVER BAR RD DAVIDSON DR CLOVER BAR RD GRANADA BLVD BROADMOOR BLVD SIOUX RD BASELINE RD CLOVER BAR RD BASELINE RD SHERWOOD DR GRANADA BLVD GEORGIAN WAY SHERWOOD DR BETHEL DR SHERWOOD DR OAK ST BROADMOOR BLVD BEAUVISTA DR P age
30 3.7 Neighbourhood Collisions Approximately 12% of major injury collisions in 2016 took place on residential roads. No fatal collisions occurred in residential areas in the County. Table 18: Residential Collisions as a Percentage of Major Injury and Fatal Collisions MAJOR INJURY CRASHES FATAL CRASHES RESIDENTIAL 5.08% 11.66% 0% 0% ARTERIAL 94.92% 88.34% 100% 100% Table 19: Major Injury and Fatal Collisions 2015/2016 by location FATAL MAJOR FATAL MAJOR URBAN RESIDENTIAL RURAL RESIDENTIAL ARTERIAL HIGHWAYS Animal Collisions In 2016, 14.5% of all reported collisions were animal related. Most animal collisions are not serious for vehicle occupants, with 93% of those reported causing only property damage. Overall, there was a 7.16% increase in the number of animal collisions from 2015 to Table 20: 2015/2016 Animal Collisions in Strathcona County SEVERITY % CHANGE FATAL INJURY 0 0 N/A MAJOR INJURY 0 3 N/A MINOR INJURY % PDO % TOTAL % 29 P age
31 3.9 Demographics Individuals aged were the most likely to be injured in a motor vehicle collision in All fatalities were male; none were under 25 years of age. Table 21: Fatalities and Injuries as a Result of 2016 Collisions by Age AGE GROUP FATAL MAJOR MINOR TOTAL UNKNOWN Of the six individuals sustaining major injuries who were 18 and under, four were motor vehicle occupants and two were pedestrians. Table 22: Fatalities and Injuries as a Result of 2016 Collisions by Gender GENDER FATAL MAJOR MINOR TOTAL FEMALE MALE P age
32 3.10 Vulnerable Road User Collisions Pedestrian Collisions There were a total of 16 pedestrian collisions in Strathcona County in One of these resulted in a fatality, and five pedestrians sustained major injuries. Table 23: Pedestrian Collisions 2015/2016 by Severity SEVERITY % CHANGE FATAL 0 1 N/A MAJOR % MINOR % PDO % TOTAL % Ten pedestrian collisions took place on the County s arterial roads, and two happened in a residential area. Table 24: Location of Pedestrian Collisions 2016 LOCATION ARTERIAL HIGHWAY PARKING LOT RESIDENTIAL FATAL MAJOR MINOR PDO TOTAL % of pedestrians involved in collisions were male. No pedestrians 10 and under were involved in a collision. Three pedestrians were seniors. 31 P age
33 Table 25: Fatalities and Injuries as a Result of 2016 Pedestrian Collisions by Age and Gender AGE GENDER SEVERITY 11 M Major 13 M Minor 16 M Major 17 M Minor 27 M Minor 28 M Fatal 33 M Minor 34 M Minor 40 F Minor 54 M Minor 65 M Major 78 M Major 89 F Major Table 26: Causes of Pedestrian Collision 2016 CAUSE TYPE FATAL MAJOR MINOR PDO TOTAL BACK UNSAFELY DISOBEY TRAFFIC SIGNAL FAILED TO PROCEED IN SAFETY FAILED TO YIELD HIT AND RUN OTHER Bicycle Collisions There were a total of nine bicycle collisions in Strathcona County in One of these resulted in a fatality, and two involved major injuries. Table 27: Bicycle Collisions 2015/2016 by Severity SEVERITY % CHANGE FATAL 0 1 N/A MAJOR % MINOR % PDO % TOTAL % 32 P age
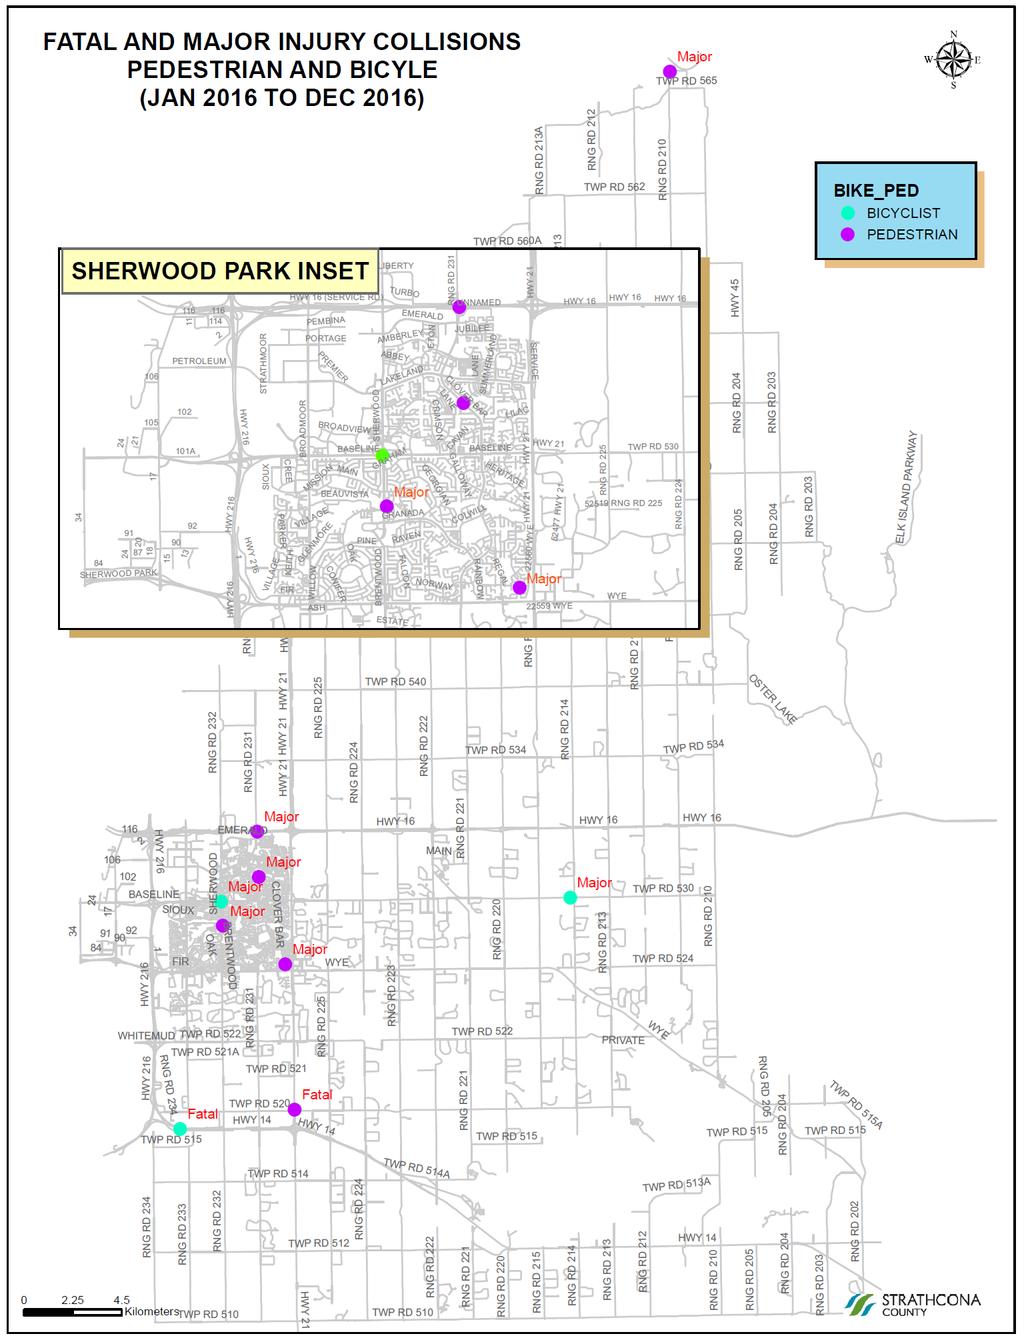
34 Five bicycle collisions took place on the County s arterial roads, and one happened in a residential area. All cyclists involved in collisions were male. One cyclist was 14, and all others were adult. Two cyclists were seniors. Table 28: Location of Bicycle Collisions 2016 LOCATION ARTERIAL HIGHWAY RESIDENTIAL FATAL MAJOR MINOR PDO TOTAL Table 29: Causes of Bicycle Collisions 2016 CAUSE TYPE FATAL MAJOR MINOR PDO TOTAL BACK UNSAFELY DISOBEY TRAFFIC SIGNAL FAILED TO PROCEED IN SAFETY FAILED TO YIELD HIT AND RUN LEFT TURN ACROSS PATH LOST CONTROL SIDESWIPED Table 30: Fatalities and Injuries as a Result of 2016 Bicycle Collisions by Age and Gender AGE GENDER SEVERITY 14 M Minor 23 M Minor 27 M Major 27 M Minor 36 M Minor 58 M Minor 61 M Fatal 67 M Minor 73 M Major The following map illustrates the locations of all fatal and major injury pedestrian and bicycle collisions in Strathcona County. 33 P age
35 34 P age
36 Motorcyclists There were a total of 20 motorcycle collisions in Strathcona County in Two of these resulted in a fatality, and six involved major injuries. Table 31: Motorcycle Collisions 2015/2016 by Severity SEVERITY % CHANGE FATAL % MAJOR % MINOR % PDO % TOTAL % Table 32: Actions of Motorcyclists Killed or Injured in Collisions 2016 DRIVER ACTION FATAL MAJOR MINOR TOTAL DISOBEY TRAFFIC SIGNAL DRIVING PROPERLY FOLLOWED TOO CLOSE LOST CONTROL RAN OFF ROAD UNSAFE SPEED Commercial Vehicle Collisions Commercial vehicles include trucks >4500 kg, buses and tractor trailers. 11.7% of major injury collisions in Strathcona County in 2016 involved a commercial vehicle. Table 33: Commercial Vehicle Collisions 2015/2016 by Severity SEVERITY % CHANGE FATAL 0 0 N/A MAJOR % MINOR % PDO % TOTAL % 35 P age
37 3.12 Alcohol Related Collisions Alcohol was involved in 34 collisions in 2016, including one fatal pedestrian collision. Table 34: Alcohol Related Collisions 2015/2016 by Severity SEVERITY % CHANGE FATAL 0 1 N/A MAJOR % MINOR % PDO % TOTAL % 36 P age
38 4.0 Appendix- Glossary of Terms Definitions of terms used in this report: Rear-end Two vehicles in a position of one behind the other and collide, regardless of what movement(s) either vehicle was in the process of making with the exception of one or both vehicles backing. Sideswipe - Same Direction Two vehicles moving alongside each other and collide, with at least one of the vehicles being struck on the side. This type would include a collision resulting from one of the vehicles making an improper turn such as a left from the right lane or vice-versa or turning right from the appropriate outside lane and striking a vehicle passing on the right shoulder. Right Angle Two vehicles approaching from non-opposing angular directions collide, typically resulting as one vehicle failed to either stop or yield right of way from a Stop or Yield sign, ran a red light, or was not cleared from the intersection upon the onset of the conflicting movement's green signal. Head-on Two vehicles approaching opposite directions and intending to continue in opposite directions collide in a frontal or angular manner as a result of one or both vehicles crossing the painted or unpainted centerline or divided median of the roadway. This includes a collision resulting from one vehicle traveling the wrong way down a divided highway. Sideswipe Opposite Direction Two vehicles approaching opposite directions and intending to continue in opposite directions collide in a sideswiping manner as a result of one or both vehicles crossing the painted or unpainted centerline or divided median of the roadway. This also includes a collision resulting from one vehicle traveling the wrong way down a divided highway. Left Turn Across Path Two vehicles approaching from opposite directions collide as a result of at least one vehicle attempting to make a left or U turn in front of the opposing vehicle. 37 P age
39 Backing Any multi-vehicle collision when at least one vehicle was in the act of backing. Rollover A collision in which a vehicle rolls over on or off the roadway without first having been involved in some other type single or multiple vehicle crash. This includes motorcycle collision in which the operator loses control of and drops bike, but had not initially struck another motor vehicle, fixed or non-fixed object, animal, pedacyclist or pedestrian. Struck Object A collision in which the primary collision involved a single vehicle and a fixed object. Animal A collision involving a vehicle striking any animal, including a deer. Pedestrian A collision involving a vehicle and pedestrian in which the collision between the two is the primary event and also took place within the road proper. This type includes a vehicle colliding with someone walking their bicycle in the roadway. Bicyclist A collision involving a vehicle and a bicycle that is in the act of being ridden or stopped in the roadway, but currently mounted by the cyclist. Minor Injury Any injuries such as bruises, abrasions, limping, etc., whether visible or selfreported. Major Injury A person(s) was admitted to the hospital as a result of injuries sustained in the collision. Fatal Collision A traffic collision that results in one or more fatalities within thirty days of the collision. 38 P age
40 PDO Property damage only collision. Vulnerable Road User Road users who are in an unprotected state or have less external protection, i.e., pedestrian, motorcyclist or bicyclist. Vulnerable Road User Collision A collision involving a vehicle that collides with either a pedestrian, motorcyclist or bicyclist. Icons within this report were downloaded from the Noun Project P age
COLLISION STATISTICS May Engineering Services Box 5008, th Avenue Red Deer, AB T4N 3T4
 COLLISION STATISTICS 2016 2016 Red Deer Annual Motor Vehicle Collision Report May 2017 Engineering Services Box 5008, 4914 48th Avenue Red Deer, AB T4N 3T4 engineering@reddeer.ca RCMP GRC Red Deer City
Alberta. Traffic Collision Statistics. Office of Traffic Safety Transportation Services Division May 2017
 Traffic Collision Statistics Office of Traffic Safety Transportation Services Division May 217 This page was intentionally left blank. 2 Table of Contents Traffic Collisions... 4 Traffic Collision Rates...
2015 Victorian Road Trauma. Analysis of Fatalities and Serious Injuries. Updated 5 May Page 1 of 28. Commercial in Confidence
 2015 Victorian Road Trauma Analysis of Fatalities and Serious Injuries Updated 5 May 2016 Page 1 of 28 Commercial in Confidence VICROADS_n3445896_2015_Victorian_Trauma_Report_- _updated_may_2016.docx 2015
2014 QUICK FACTS ILLINOIS CRASH INFORMATION. Illinois Emergency Medical Services for Children February 2016 Edition
 2014 QUICK FACTS ILLINOIS CRASH INFORMATION February 2016 Edition Illinois Emergency Medical Services for Children www.luhs.org/emsc Illinois Emergency Medical Services for Children TABLE OF CONTENTS
2012 QUICK FACTS ILLINOIS CRASH INFORMATION. Illinois Emergency Medical Services for Children September 2014 Edition
 2012 QUICK FACTS ILLINOIS CRASH INFORMATION September 2014 Edition Illinois Emergency Medical Services for Children www.luhs.org/emsc Illinois Emergency Medical Services for Children TABLE OF CONTENTS
Alberta. Traffic Collision Statistics
 Alberta Traffic Collision Statistics 2002 Alberta Traffic Collision Statistics 2002 For further information contact: Alberta Transportation Driver Safety, Research and Traffic Safety Initiative 1st Floor,
For further information contact: Alberta Infrastructure and Transportation Office of Traffic Safety Main Floor, Twin Atria Building Avenue
 Alberta Traffic Collision Statistics 2006 Alberta Traffic Collision Statistics 2006 For further information contact: Alberta Infrastructure and Transportation Office of Traffic Safety Main Floor, Twin
For further information contact: Alberta Transportation Office of Traffic Safety Main Floor, Twin Atria Building Avenue Edmonton, Alberta T6B
 Alberta Traffic Collision Statistics 2009 Alberta Traffic Collision Statistics 2009 For further information contact: Alberta Transportation Office of Traffic Safety Main Floor, Twin Atria Building 4999
Alberta. Traffic Collision Statistics
 Alberta Traffic Collision Statistics 2015 Alberta Traffic Collision Statistics 2015 For further information contact: Alberta Transportation Office of Traffic Safety Main Floor, Twin Atria Building 4999
Enclosure 1. Crimson Drive Traffic Safety and Calming Review Report
 Enclosure 1 Crimson Drive Traffic Safety and Calming Review Report Prepared by: Tahir Hameed, P.Eng. Traffic Safety Engineer Planning Engineering and Safety Transportation Planning and Engineering Date:
MTCF. Michigan Traffic Crash Facts FACT SHEETS
 FACT SHEETS This page left intentionally blank GENERAL FACTS The driver, the roadway, and the motor vehicle contribute in some measure to every crash. A preponderance of evidence, however, points to driver
MTCF. Michigan Traffic Crash Facts FACT SHEETS
 FACT SHEETS This page left intentionally blank GENERAL FACTS The driver, the roadway, and the motor vehicle contribute in some measure to every crash. A preponderance of evidence, however, points to driver
Deaths/injuries in motor vehicle crashes per million hours spent travelling, July 2007 June 2011 (All ages) Mode of travel
 Mode of travel") Cyclists CRASH STATISTICS FOR THE YEAR ENDED 31 DECEMBER 211 Prepared by the Ministry of Transport CRASH FACTSHEET 212 Cyclists have a number of risk factors that do not affect car drivers. The main risk
Cyclists CRASH STATISTICS FOR THE YEAR ENDED 31 DECEMBER 211 Prepared by the Ministry of Transport CRASH FACTSHEET 212 Cyclists have a number of risk factors that do not affect car drivers. The main risk
motor vehicle collisions
 motor vehicle collisions 2017 2017 QUICK FACTS City of Edmonton motor vehicle collisions 2017 legal note The City of Edmonton provides this information in good faith but gives no warranty, nor accepts
Napier City road trauma for Napier City. Road casualties Estimated social cost of crashes* Major road safety issues.
 ISSN 1176-841X July 25 Land Transport New Zealand has prepared this road safety issues report. It is based on reported crash data and trends for the 2 24 period. The intent of the report is to highlight
People killed and injured per million hours spent travelling, Motorcyclist Cyclist Driver Car / van passenger
 Cyclists CRASH FACTSHEET 27 CRASH STATISTICS FOR THE YEAR ENDED 31 DEC 26 Prepared by Strategy and Sustainability, Ministry of Transport Cyclists have a number of risk factors that do not affect car drivers.
A review of 2015 fatal collision statistics as of 31 December 2015
 A review of fatal collision statistics as of 31 December This report summarises the main trends in road fatalities that have emerged in. This has been prepared by the Road Safety Authority following analysis
the Ministry of Transport is attributed as the source of the material
 Cyclists 2015 Disclaimer All reasonable endeavours are made to ensure the accuracy of the information in this report. However, the information is provided without warranties of any kind including accuracy,
DEPARTMENT OF ENVIRONMENTAL SERVICES. North Harrison Street (Lee Highway to Little Falls Road) Comparative Analysis. Prepared for:
 Comparative Analysis. Prepared for:") DEPARTMENT OF ENVIRONMENTAL SERVICES North Harrison Street (Lee Highway to Little Falls Road) Comparative Analysis Prepared for: Arlington County Department of Environmental Services 2100 Clarendon Boulevard,
DEPARTMENT OF ENVIRONMENTAL SERVICES North Harrison Street (Lee Highway to Little Falls Road) Comparative Analysis Prepared for: Arlington County Department of Environmental Services 2100 Clarendon Boulevard,
Transportation and Public Works Annual Motor Vehicle Collision Report
 Transportation and Public Works 22 Annual Motor Vehicle Collision Report Table of Contents Table of Contents.. 2 Introduction.. 3 22 Collision Summary. 4 Demographics 5 Collisions by Severity.. 5 Personal
Safer Cycling: How the City of Vancouver is Proactively Improving Cycling Safety
 Safer Cycling: How the City of Vancouver is Proactively Improving Cycling Safety Brian Patterson, MCIP, RPP Urban Systems 2015 Canadian Association of Road Safety Professionals (CARSP) Conference Session
PRELIMINARY DRAFT FIRST AMENDMENT TO VISION 2050: A REGIONAL LAND USE AND TRANSPORTATION PLAN FOR SOUTHEASTERN WISCONSIN
 PRELIMINARY DRAFT FIRST AMENDMENT TO VISION 2050: A REGIONAL LAND USE AND TRANSPORTATION PLAN FOR SOUTHEASTERN WISCONSIN ESTABLISHING TARGETS FOR FEDERAL PERFORMANCE MEASURES: HIGHWAY SAFETY SOUTHEASTERN
Traffic Safety Plan Traffic Safety Plan 2015
 Traffic Safety Plan 2015 Purpose Airdrie s last Traffic Safety Plan was created in 2011. The 2015 Traffic Safety Plan is a revised model of the traffic operations for the City of Airdrie. The purpose of
City of Toronto Pedestrian Collision Study. Transportation Services Division Traffic Data Centre and Safety Bureau
 City of Toronto Pedestrian Collision Study Transportation Services Division Traffic Data Centre and Safety Bureau January 2007 EXECUTIVE SUMMARY Pedestrian safety is a primary concern for the city of
For Information Only. Pedestrian Collisions (2011 to 2015) Resolution. Presented: Monday, Apr 18, Report Date Tuesday, Apr 05, 2016
 Resolution. Presented: Monday, Apr 18, Report Date Tuesday, Apr 05, 2016") Presented To: Operations Committee For Information Only Pedestrian Collisions (0 to 0) Presented: Monday, Apr 8, 06 Report Date Tuesday, Apr 0, 06 Type: Correspondence for Information Only Resolution For
Presented To: Operations Committee For Information Only Pedestrian Collisions (0 to 0) Presented: Monday, Apr 8, 06 Report Date Tuesday, Apr 0, 06 Type: Correspondence for Information Only Resolution For
PEDESTRIAN/BICYCLIST CRASH ANALYSIS 2015
 PEDESTRIAN/BICYCLIST CRASH ANALYSIS 2015 Central Arkansas Regional Transportation Study Table of Contents Executive Summary... 3 CARTS Pedestrian/Bicycle Crash Analysis... 3 Report Format... 3 Results...
Cambridgeshire and Peterborough Road Safety Partnership Handbook
 and Peterborough Road Safety Partnership Handbook ANNUAL STATISTICS SUMMARY 2015 3941 CCC_Road Safety HBook.indd 1 19/08/2016 14:59 Contents Introduction 2 Key points 3 Summary table 4 Overall trends 4
Vision Zero Task Force February 28, Collision Landscape Analysis
 Vision Zero Task Force February 28, 2017 Collision Landscape Analysis Welcome! What happened since our last Task Force meeting: City Council adopted the Vision Zero Resolution Applied for an OTS grant
road safety issues 2001 road toll for Gisborne district July 2002 Road user casualties Estimated social cost of crashes*
 GISBORNE DISTRICT road safety issues July 22 The Land Transport Safety Authority (LTSA) has prepared this Road Safety Issues Report. It is based on reported crash data and trends for the 1997 21 period.
Pinellas County Metropolitan Planning Organization (MPO) 2014 Crash Data Report
 2014 Crash Data Report") Pinellas County Metropolitan Planning Organization (MPO) 2014 Crash Data Report MPO Board July 8, 2015 2 Crash Data Collection Motorcycle drove between stopped cars, ran a red light and collided with a
Pinellas County Metropolitan Planning Organization (MPO) 2014 Crash Data Report MPO Board July 8, 2015 2 Crash Data Collection Motorcycle drove between stopped cars, ran a red light and collided with a
TRAFFIC CRASHES involving BICYCLISTS
 The Office of the Chief of Police in Berlin BERLIN TRAFFIC CRASHES involving BICYCLISTS A special research project concerning bicycle crashes in West Berlin in the years 1981 through 1985 Police Analyst
LAGUNA BEACH POLICE DEPARTMENT MEMORANDUM
 LAGUNA BEACH POLICE DEPARTMENT MEMORANDUM TO: FROM: Christa Johnson, Assistant City Manager Jason C. Kravetz, Captain DATE: January 16, 2015 SUBJECT: Laguna Canyon Road Collision Analysis Within the last
North Carolina. Bicycle Crash Facts Prepared for
 North Carolina Bicycle Crash Facts 2006-2010 Prepared for The North Carolina Department of Transportation Division of Bicycle and Pedestrian Transportation Prepared by The University of North Carolina
EXECUTIVE SUMMARY March 2013
 EXECUTIVE SUMMARY March 2013 An Application of Safe System Approach to Intersections in the Capital Region Progress Report Introduction The Capital Region Intersection Partnership (CRISP) was founded in
Lane Area Transportation Safety and Security Plan Vulnerable Users Focus Group
 Lane Area Transportation Safety and Security Plan Vulnerable Users Focus Group Agenda 1. Planning Process Review 2. What are Emphasis Areas? 3. Your Role Today 4. Data Review 5. Small group discussion
Bike to the Future c/o Portage Avenue. Winnipeg, MB. R3B 2B2 Fax:
 January 9, 2006 Bike to the Future c/o 3 330 Portage Avenue Winnipeg, MB R3B 2B2 Fax: 989-8476 biketothefuture@gmail.com www.biketothefuture.org Honourable Kerri Irvin-Ross Minister of Intergovernmental
2012 TOWN OF CASTLE ROCK MOTOR VEHICLE ACCIDENT FACTS PREPARED BY THE PUBLIC WORKS DEPARTMENT
 ATTACHMENT A 2012 TOWN OF CASTLE ROCK MOTOR VEHICLE ACCIDENT FACTS PREPARED BY THE PUBLIC WORKS DEPARTMENT ACKNOWLEDGEMENTS This report was assembled from data provided by the Castle Rock Police Department
Review of Fatal Collisions
 Review of Fatal Collisions January to July 1 st 16 Review of 16 fatal collision statistics as of 1st July 16 Overview This report summarises the main trends in road fatalities that have emerged up to the
Post impact trajectory of vehicles at rural intersections
 Post impact trajectory of vehicles at rural intersections Doecke SD., Woolley JE. and Mackenzie JR. Centre for Automotive Safety Research Abstract This report describes the path of vehicles after a collision
Safety and Active Transport. Dr. Maureen Carew, Medical Officer of Health Renfrew County and District Health Unit May 30, 2014
 Safety and Active Transport Dr. Maureen Carew, Medical Officer of Health Renfrew County and District Health Unit May 30, 2014 Active Transport Vision Increase levels of walking and cycling Reduce vehicle
Bicycle Crashes. Number of Bike Crashes. Total Bike Crashes. are down 21% and severe bike crashes down 8% since 2013 (5 years).
.") Bicycle Crashes The City of Fort Collins is well known for its bike culture, and there is a strong focus on encouraging increased riding. Bike safety is an important component of supporting these efforts.
Bicycle Crashes The City of Fort Collins is well known for its bike culture, and there is a strong focus on encouraging increased riding. Bike safety is an important component of supporting these efforts.
Characteristics of Traffic Accidents in Highway Work Zones
 Characteristics of Traffic Accidents in Highway Work Zones A DETAILED ANALYSIS OF WORK ZONE ACCIDENTS REPORTED ON NEW YORK STATE DEPARTMENT OF TRANSPORTATION CONSTRUCTION PROJECTS ESTABLISHED THE PREDOMINANT
Maine Highway Safety Facts 2016
 Maine Highway Safety Facts 216 216 MAINE HIGHWAY SAFETY FACTS The Bureau of Highway Safety and the Maine Department of Transportation are pleased to present the 216 edition of Maine Highway Safety Facts.
MEMORANDUM. City Constituents. Leilani Schwarcz, Vision Zero Surveillance Epidemiologist, SFDPH
 MEMORANDUM TO: FROM: CC: City Constituents Leilani Schwarcz, Vision Zero Surveillance Epidemiologist, SFDPH Megan Wier, Co-Chair, San Francisco Vision Zero Task Force, SFDPH Commander Ann Mannix, Traffic
2017 Annual Traffic Safety Report
 2017 Annual Traffic Safety Report City of Santa Cruz Public Works Department I. Introduction The purpose of the 2017 City of Santa Cruz Traffic Safety Report is to provide an overview of traffic safety
Cycling and risk. Cycle facilities and risk management
 Cycling and risk Cycle facilities and risk management Failure to recognize possibilities is the most dangerous and common mistake one can make. Mae Jemison, astronaut 6/11/2010 York Regional Council Cycling
APPENDIX C. Systems Performance Report C-1
 APPENDIX C Systems Performance Report C-1 System Performance Report & Requirements According to the FAST Act, a long range transportation plan needs to include a system performance report and subsequent
Cyclist Safety in Australia
 Cyclist Safety in Australia From BITRE Trauma Statistical Summary, August 218 http://www.bitre.gov.au/publications/ongoing/road_deaths_australia_annual_summaries.aspx Trends in cyclist trauma numbers These
8. Collisions INTRODUCTION
 8. Collisions INTRODUCTION While traffic collisions can affect anyone, they have a disproportionate impact on bicyclists, who along with pedestrians are the most vulnerable users of the transportation
Figure 1. Indiana fatal collisions by young driver involvement,
 INDIANA TRAFFIC SAFETY FACTS YOUNG DRIVERS 2016 MAY 2017 ISSUE 17-C06 IN 2016: In 2016, 13.4 percent of all drivers involved in Indiana collisions were young drivers. Young drivers were involved in 105
City of Edmonton Office of Traffic Safety
 Overview About OTS About OTS Key Facts Speed Management Committee and Speed Management Plan Evidence on Speed and Speeding Complaint Process Data Collection Speed Surveys Collision Review Speed Management
Risk on the Road. Pedestrians, Cyclists and Motorcyclists August 2015
 Risk on the Road Pedestrians, Cyclists and Motorcyclists August 215 Contents Key Facts... 4 Pedestrians... 5 Pedestrian risk by time of day and age... 8 Cyclists... 11 Motorcyclists... 14 Glossary... 17
Analyses and statistics on the frequency and the incidence of traffic accidents within Dolj County
 UNIVERSITY OF PITESTI SCIENTIFIC BULLETIN Faculty of Mechanics and Technology AUTOMOTIVE series, year XXIV, no. 28 Analyses and statistics on the frequency and the incidence of traffic accidents within
Cambridgeshire and Peterborough Road Safety Partnership Handbook
 and Peterborough Road Safety Partnership Handbook ANNUAL STATISTICS SUMMARY- 2016 Contents Introductions 1 Key points 2 Summary table 3 Overall trends 3 Casualties by prevailing speed limit 4 Casualties
Road Safety Annual Report 2016 OECD/ITF Chapter 26. Morocco
 Road Safety Annual Report 2016 OECD/ITF 2016 Chapter 26 Morocco This chapter presents 2014 road safety data for Morocco along with provisional data from 2015. It looks at trends in traffic and road safety
Automated Traffic Enforcement Technology Guidelines
 Automated Traffic Enforcement Technology Guidelines Province of Alberta (September 2014) Revised Automated Traffic Enforcement Technology Guidelines Province of Alberta A. PREAMBLE Automated traffic enforcement
Bicycle Helmet Use Among Winnipeg Cyclists January 2012
 Bicycle Helmet Use Among Winnipeg Cyclists January 2012 By: IMPACT, the injury prevention program Winnipeg Regional Health Authority 2 nd Floor, 490 Hargrave Street Winnipeg, Manitoba, R3A 0X7 TEL: 204-940-8300
Speed Limits in the Hoddle Grid
 Speed Limits in the Hoddle Grid Recent History of speed limits March 2013 Docs # 7738485 1 Introduction Muncipalities have power to Erect speed limit signs BUT Municipalities DO NOT have the power to approve
City of Edmonton Office of Traffic Safety
 Overview About OTS Vision 0 Key Facts Speed Management Committee and Speed Management Plan Evidence on Speed and Speeding Complaint Process Data Collection Speed Surveys Collision Review Speed Management
Appendix A: Before-and-After Crash Analysis of a Section of Apalachee Parkway
 Appendix A: Before-and-After Crash Analysis of a Section of Apalachee Parkway 3 Safety Impacts of Median Conversion: A Case Study on Apalachee Parkway 1. Introduction (Prepared by FIU, 11/10/2011) The
CHAPTER 9: SAFETY 9.1 TRAFFIC SAFETY INTERSECTION COLLISIONS
 CHAPTER 9: SAFETY 9.1 TRAFFIC SAFETY Creating a transportation network that is not only efficient but also safe is a key objective of the General Plan and the WBCMP. To assess the current safety conditions
POLICY: TRAFFIC CALMING
 2006 MAY REFERENCE: COUNCIL APPROVED BY COUNCIL MAY 23, 2006 CITY OPERATIONS - NO. 608 POLICY: TRAFFIC CALMING A. All requests for traffic calming within the City shall be considered in accordance with
CHAIR AND MEMBERS CIVIC WORKS COMMITTEE MEETING ON APRIL 25, 2016
 TO: FROM: SUBJECT: CHAIR AND MEMBERS CIVIC WORKS COMMITTEE MEETING ON APRIL 25, 2016 JOHN BRAAM, P. ENG. MANAGING DIRECTOR, ENVIRONMENTAL & ENGINEERING SERVICES AND CITY ENGINEER SCHOOL ZONE SPEED LIMIT
THE EPIDEMIOLOGY OF TRAUMATIC BRAIN INJURIES IN NEW YORK STATE
 THE EPIDEMIOLOGY OF TRAUMATIC BRAIN INJURIES IN NEW YORK STATE Michael Bauer, Sarah Sperry, Kainan Sun, Susan Hardman New York State Department of Health, Bureau of Injury Prevention What is Traumatic
Road Safety Vademecum
 Road Safety Vademecum Road safety trends, statistics and challenges in the EU 2010-2013 March, 2014 European Commission DG for Mobility and Transport Unit C.4 Road Safety Contents Summary of findings...
Coolest Cities Results Summary
 Coolest Cities Results Summary About Coolest Cities Canada s six largest urban areas provide homes and jobs for almost 15 million people, nearly half of our population. Transporting these citizens to and
ITARDA INFORMATION. No.128. Special feature
 ITARDA INFORMATION No.128 Special feature Special feature Accidents when four-wheel vehicles are reversing ~ Drivers must thoroughly check behind them, especially in parking lots! ~ Introduction You may
Bicycle - Motor Vehicle Collisions on Controlled Access Highways in Arizona
 Bicycle - Motor Vehicle Collisions on Controlled Access Highways in Arizona Analysis from January 1, 1991 to June 30, 2002 Richard C. Moeur, PE Traffic Design Manager, Northern Region Michelle N. Bina
2003 road trauma for. Wairoa District. Road casualties Estimated social cost of crashes* Major road safety issues WAIROA DISTRICT JULY 2004
 WAIROA DISTRICT JULY 24 T he Land Transport Safety Authority (LTSA) has prepared this road safety issues report. It is based on reported crash data and trends for the 1999 23 period. The intent of the
2012 Petaluma Traffic Safety Report Collisions Rise for 2 nd Year in a Row
 NEWS RELEASE For Immediate Release/Broadcast Thursday, March 7, 2013 2012 Petaluma Traffic Safety Report Collisions Rise for 2 nd Year in a Row The 2012 annual review of traffic safety in Petaluma has
2013 Traffic Safety Report
 Traffic Safety Report Introduction Every year on the more than 1, miles of unincorporated Larimer County roadways, about 375 vehicular traffic crashes occur. Those crashes include about 75 severe crashes
Truck Tractor Trailer Crash Analysis
 Building Tribal Traffic Safety Capacity Truck Tractor Trailer Crash Analysis Arizona Department of Transportation (ADOT) Motor Vehicle Crash (MVC) Data ITCA, Inc. 04/18/06 Truck Tractor Trailer Crash Analysis
TRAFFIC IMPACT ANALYSIS
 TRAFFIC IMPACT ANALYSIS FOR THE CHAMPAIGN UNIT#4 SCHOOL DISTRICT PROPOSED HIGH SCHOOL (SPALDING PARK SITE) IN THE CITY OF CHAMPAIGN Final Report Champaign Urbana Urbanized Area Transportation Study 6/24/2014
1999 On-Board Sacramento Regional Transit District Survey
 SACOG-00-009 1999 On-Board Sacramento Regional Transit District Survey June 2000 Sacramento Area Council of Governments 1999 On-Board Sacramento Regional Transit District Survey June 2000 Table of Contents
Reduction of Speed Limit at Approaches to Railway Level Crossings in WA. Main Roads WA. Presenter - Brian Kidd
 Australasian College of Road Safety Conference A Safe System: Making it Happen! Melbourne 1-2 September 2011 Reduction of Speed Limit at Approaches to Railway Level Crossings in WA Radalj T 1, Kidd B 1
U NIVERSITY OF B RITISH C OLUMBIA. Fall 2010 Transportation Status Report
 U NIVERSITY OF B RITISH C OLUMBIA Fall 2010 Transportation Status Report 1 April 2011 U NIVERSITY OF B RITISH C OLUMBIA Fall 2010 Transportation Status Report Contents 1. INTRODUCTION... 1 1.1. Context...
Discover the Safe System Approach
 Discover the Safe System Approach Aim Take you on a journey of discovery Inform, engage, enthuse and share with you the Safe System approach to saving death and injury on our roads Change to less graphic
Active Transportation Infrastructure Investment A Business Case
 Active Transportation Infrastructure Investment A Business Case In 2016, the Real Estate Foundation awarded the Capital Regional District a $50,000 grant for Shifting Gears: Land Use Change through Active
CITY OF WEST KELOWNA COUNCIL POLICY MANUAL
 CITY OF WEST KELOWNA COUNCIL POLICY MANUAL Page 1 of 7 DEPARTMENT: Engineering Services SUBJECT: Traffic Calming Policy (Revised June 6, 2017) Policy Statement: The provision of traffic calming measures
We believe the following comments and suggestions can help the department meet those goals.
 The Honorable Secretary Anthony Foxx The Secretary of Transportation United States Department of Transportation 1200 New Jersey Avenue, SE Washington, DC 20590 August 30, 2013 Dear Secretary Foxx, Thank
road safety issues 2002 road trauma for TNZ Region Two July 2003 Road deaths Estimated social cost of crashes* Major road safety issues
 road safety issues July 23 22 road trauma for TNZ Region Two The Land Transport Safety Authority (LTSA) has prepared this road safety issues report. It is based on reported crash data and trends for the
UBC Vancouver Transportation Status Report Fall 2014
 UBC Vancouver Transportation Status Report Fall 2014 July 2015 1. Introduction... 1 1.1. Context... 1 1.2. Transportation Monitoring Program... 2 1.3. Changes at UBC Affecting Travel Patterns... 4 1.4.
2014 peterborough city and county. active. transportation. & health. indicators primer
 2014 city and county active transportation & health indicators primer executive summary Walking, cycling and transit are good for our personal health, our local economies, and the environment. Understanding
CITY OF OTTAWA ROADWAY MODIFICATION APPROVAL UNDER DELEGATED AUTHORITY
 RMA-2015-ATM-038 CITY OF OTTAWA ROADWAY MODIFICATION APPROVAL UNDER DELEGATED AUTHORITY DATE: April 22, 2015 SUBJECT Approval of Roadway Modifications Recommended through an Area Traffic Management Study
2011 Origin-Destination Survey Bicycle Profile
 TRANS Committee 2011 Origin-Destination Survey National Capital Region December 2012 TRANS Committee Members: City of Ottawa, including OC Transpo Ville de Gatineau Société de transport de l Outaouais
VISIONZEROPHL.COM #VISIONZEROPHL
 What is Vision Zero? What is Vision Zero? A policy that states clearly that traffic deaths are preventable and unacceptable. CORE PRINCIPLES: Human life takes priority over mobility; Human error is inevitable
Dear Fellow Nebraskans:
 Dear Fellow Nebraskans: In accordance with the provisions in the Safe, Accountable, Flexible, and Efficient Transportation Equity Act A Legacy for Users (SAFETEA LU), each state is required to develop
BUILDING CHINARAP. Zhang Tiejun Research Institute of Highway (RIOH) Beijing, China
 Beijing, China") BUILDING CHINARAP Zhang Tiejun Research Institute of Highway (RIOH) Beijing, China E-mail: tj.zhang@rioh.cn Greg Smith International Road Assessment Programme (irap) Beijing, China E-mail: greg.smith@irap.org
BUILDING CHINARAP Zhang Tiejun Research Institute of Highway (RIOH) Beijing, China E-mail: tj.zhang@rioh.cn Greg Smith International Road Assessment Programme (irap) Beijing, China E-mail: greg.smith@irap.org
Effects of Traffic Signal Retiming on Safety. Peter J. Yauch, P.E., PTOE Program Manager, TSM&O Albeck Gerken, Inc.
 Effects of Traffic Signal Retiming on Safety Peter J. Yauch, P.E., PTOE Program Manager, TSM&O Albeck Gerken, Inc. Introduction It has long been recognized that traffic signal timing can have an impact
Pedestrian and Bicycle Crashes
 Pedestrian and Bicycle Crashes Pedestrian and Bicycles Overview Pedestrian-related crashes represent 3.6% of the total reported traffic crashes; however, they account for 11.1% of all traffic crash deaths.
Appendix E: Bike Crash Analysis ( )
") Appendix E: Bike Crash Analysis (2009-2012) Davis Bicycle Crashes Analysis 2009-2012 December 2013 Ride Walk Davis Active Transportation Program City of Davis December 2013 Prepared by: Jimmy Fong Active
Appendix E: Bike Crash Analysis (2009-2012) Davis Bicycle Crashes Analysis 2009-2012 December 2013 Ride Walk Davis Active Transportation Program City of Davis December 2013 Prepared by: Jimmy Fong Active
EXECUTIVE SUMMARY OF CALEDON TRANSPORTATION NEEDS STUDY
 EXECUTIVE SUMMARY OF CALEDON TRANSPORTATION NEEDS STUDY The Caledon Transportation Needs Study has been undertaken as a joint project by the Town of Caledon and the Region of Peel to determine the existing
KANSAS STRATEGIC HIGHWAY SAFETY PLAN
 KANSAS STRATEGIC HIGHWAY SAFETY PLAN 214 Annual Dashboard Report Preliminary Statewide Fatality Analysis The accident data herein, as of February 19, 215, reflect the reporting officer s observations and
Pedestrian injuries in San Francisco: distribution, causes, and solutions
 Pedestrian injuries in San Francisco: distribution, causes, and solutions Presentation to the San Francisco Health Commission RAJIV BHATIA, MD, MPH DIRECTOR OF OCCUPATIONAL AND ENVIRONMENTAL HEALTH, SAN
Lincolnshire JSNA: Road Traffic Accidents
 Road Traffic Accidents What do we know? Summary A higher proportion of road traffic collisions in Lincolnshire result in death compared to other areas. This may be due to the types of road in the County
MEET IN THE STREET MOVING TO ZERO
 WE MEET IN THE STREET MOVING TO ZERO Tips for sharing the street Traffic deaths are preventable. We need your help getting the message out. 2 A NEW PLAN A NEW PLAN Philadelphia is proud to adopt Vision
SLOW DOWN A STUDY OF SPEEDING ON MCGUINNESS BLVD
 SLOW DOWN A STUDY OF SPEEDING ON MCGUINNESS BLVD ACKNOWLEDGEMENTS This report was prepared by Shawn Macias, in consultation with the McGuinness Boulevard Working Group. This report would not have been
CDRT. Child Death Review Team Dallas County. Brief Report Traffic-related Child Deaths OVERVIEW
 Dallas County CDRT Child Death Review Team 2013 Brief Report Traffic-related Child Deaths 2006-2011 OVERVIEW In Dallas County, traffic-related injury death rates among children are typically less than
Canadian Association of Chiefs of Police Association canadienne des chefs de police
 WHAT S IN THE KIT? Media Advisory Template To be used to invite the media to an event during Operation Impact. We suggest you reproduce this on your own police agency letterhead. News Release Template
Unit Six: Driving Faster with More Risk URBAN, SUBURBAN, AND RURAL DRIVING
 Unit Six: Driving Faster with More Risk URBAN, SUBURBAN, AND RURAL DRIVING What Is The Impact Of Distraction? Objectives For Unit Six Students will be able to describe the skills necessary to What safely