Dear Fellow Nebraskans:
|
|
|
- James Floyd
- 5 years ago
- Views:
Transcription


1
2
.")
3 Dear Fellow Nebraskans: In accordance with the provisions in the Safe, Accountable, Flexible, and Efficient Transportation Equity Act A Legacy for Users (SAFETEA LU), each state is required to develop and implement a strategic highway safety plan. On behalf of the Governor, I submit to you Nebraska s Strategic Highway Safety Plan (SHSP). This SHSP builds on the momentum of previous traffic safety collaborations in Nebraska. It cuts across the public and private sectors and all levels of government to reach for better results. The plan is data-driven, strategic and targeted, and it is designed to make significant progress towards Nebraska s goal of cutting fatal crashes by at least 80 per year by I and the directors of the Department of Motor Vehicles, Department of Health and Human Services, the Superintendent of the Nebraska State Patrol, the Nebraska League of Municipalities and the Nebraska Association of County Officials invite you to join us in implementing the strategies outlined in the SHSP. You may access the document at Remember, driving is dangerous. In fact, motor vehicle crashes are the leading cause of injuryrelated deaths in the state. Do not become complacent. Each of us is responsible for our own driving behavior. Please drive safely. John L. Craig Director
4
5 Table of Contents Nebraska Strategic Highway Safety Plan EXECUTIVE SUMMARY...i 1. INTRODUCTION AND BACKGROUND HIGHWAY SAFETY TRENDS AT THE NATIONAL LEVEL AND IN NEBRASKA RECENT NATIONAL GUIDANCE ON HIGHWAY SAFETY PREVIOUS HIGHWAY SAFETY EFFORTS COMPLETED BY NEBRASKA Formation of the Nebraska Interagency Safety Committee Preliminary Identification of the Critical Emphasis Areas NEBRASKA CRASH RECORDS SYSTEM SELECTION OF A SAFETY GOAL AND CONFIRMATION OF THE CRITICAL EMPHASIS AREAS IDENTIFICATION OF A STATEWIDE SAFETY GOAL REVIEW OF STATEWIDE FATAL CRASH DATA BY AASHTO S 22 EMPHASIS AREAS FINAL CONFIRMATION OF THE CEAS REVIEW OF FATAL CRASH INFORMATION FOR THE CEAS PRIORITIZATION OF SAFETY STRATEGIES STRATEGY SOURCES AND PRIORITIZATION METHODOLOGY HIGH PRIORITY STRATEGIES AND WORKSHOP VOTING RESULTS SELECTION OF CRITICAL STRATEGIES CRITICAL STRATEGY PLAN SUMMARIES LANE DEPARTURE CRITICAL STRATEGIES IMPAIRED DRIVING CRITICAL STRATEGIES UNBELTED VEHICLE OCCUPANT CRITICAL STRATEGIES INTERSECTION CRITICAL STRATEGIES YOUNG DRIVER CRITICAL STRATEGIES DEPLOYMENT PLAN OBJECTIVE SAFETY INVESTMENT ANALYSIS OVERVIEW OF FUNDING AVAILABLE FOR SAFETY PROGRAMS IMPLEMENTING, EVALUATING, REVISING, AND REPORTING ON THE NEBRASKA SHSP KEY CONCLUSIONS REFERENCES... R-2 APPENDIX I: SAFETY COUNTERMEASURES FOR SELECTED CRITICAL EMPHASIS AREAS APPENDIX II: HIGH PRIORITY STRATEGIES APPENDIX III: SUPPORTING INFORMATION FOR DEPLOYMENT PLAN MARCH 2007
6
7 Executive Summary Despite impressive improvements in highway traffic safety since the early 1970 s (a 45% decrease in fatalities and a 50% decrease in fatality rate), traffic related deaths and injuries continue to impose a massive burden on the residents of Nebraska. Traffic crashes are one of the leading causes of death and the annual economic cost of the 35,000 crashes that occurred during 2005 is estimated at almost $1.7 billion dollars. Traffic fatalities have fallen in Nebraska from a peak of 490 in 1970 to current levels of approximately 275 and over that same period of time road travel has increased by 80%. However, recent trends indicate that the rate of reduction in roadway related deaths and injuries has flattened and at the national level the number of fatalities has actually risen. This lack of progress in reducing the death toll on our Nation s highways led the American Association of State Highway and Traffic Officials (AASHTO) and the Federal Highway Administration (FHWA) to conclude that a new focus on and approach to traffic safety was necessary to address the documented increase in fatal and life changing injury crashes. Their vision for an improved safety planning and implementation process is contained in three key documents: AASHTO s Strategic Highway Safety Plan (SHSP) National Cooperative Highway Research Program Series 500 Reports (Guidance for Implementing AASHTO s Strategic Highway Safety Plan) FHWA s Strategic Highway Safety Plans: Guidance to Supplement SAFETEA-LU Requirements These documents encourage states to develop their own Strategic Highway Safety plans based on six guiding principles: 1. Comprehensive In order to be highly effective at reducing crashes, SHSPs need to be comprehensive in nature and include strategies that address education, enforcement, and emergency medical services, in addition to the more traditional engineering improvements (the Four Safety E s). The need to address safety in a comprehensive fashion is supported by a review of crash characteristics that found that the key contributing factor in over 60% of the serious crashes is driver behavior. 2. Systematic A short list of safety strategies should be developed using a process that first identifies a universe of potential strategies and then screens the strategies so that the final prioritized list directly links the improvements to the key factors that are contributing to high numbers of serious crashes. 3. Integrated Many state transportation departments have focused the implementation of engineering type improvements on the state highway system. The guiding principles suggest that to be more effective at reducing serious crashes, SHSPs need to be integrated across the state s entire system of roads and coordinated with all state and local agencies that address transportation safety issues. The need to address safety in an integrated fashion is supported by the crash characteristics that found 40 to 50% of serious crashes MARCH 2007 i
8 occurred on local roads and that local roads in rural areas usually have the highest fatality rates. 4. Stakeholder Involved Representatives of each element of the Four Safety E s should be involved in the process of developing and screening the safety strategies because they could be a key partner in implementing the strategies. 5. Data Driven SHSPs need to be driven by crash data so that the recommended improvement strategies are directly linked to the factors contributing to high frequencies of fatal and disabling injury crashes. Being able to access reliable and accurate data will help increase the overall effectiveness of the SHSP by directing safety resources to those strategies that will prevent the most crashes at the locations with the greatest needs. 6. Proactive Most recent safety plans have been primarily focused on reacting to locations identified as having unusually high crash frequencies. However, fatal and disabling crashes are often widely dispersed across the road system. Therefore, safety analyses that rely solely on crash frequency to select candidate locations for improvements have no guarantee of being able to predict which locations have a high probability of having a serious crash in the future. The most effective approach may include both a reactive component to deal with known locations with safety deficiencies and a proactive component to better address the random nature of serious crashes, especially those in rural areas. In addition to these guiding principles, FHWA has asked the states to address three key objectives in their plans first, set a safety goal; second, identify a short list of the highest priority safety strategies and finally, analyze your safety investment practices to determine the most effective way to achieve the adopted safety goal consistent with federal guidelines and state policies. In response to the direction provided at the national level, the Nebraska Department of Roads along with their partners on the Nebraska Interagency Safety Committee have worked together to develop the Nebraska Strategic Highway Safety Plan in order to address the frequency, rate and factors contributing to fatal and disabling injury crashes in Nebraska. The Plan is intended to serve as a guide for accomplishing the identified goals to provide a forum and process for engaging safety professionals in order to reduce the number of fatal and disabling injuries associated with traffic crashes in Nebraska. The Plan started with the guiding principles and then made adjustments based on Nebraska s crash characteristics and the input from a variety of safety partners at a workshop attended by approximately 90 safety professionals representing education, enforcement, engineering and emergency medical services. The key results of the SHSP development process include: Nebraska has adopted a safety goal of reducing the statewide fatality rate by 38%, from a rate of 1.6 fatalities per 100 million vehicle miles of travel (VMT) in 2003 to a rate of 1.0 in Achieving this reduction in fatality rate would result in 80 lives saved per year compared to the number of traffic fatalities forecasted for Nebraska crash records were used to identify the areas that are emphasized in the Plan based on the number of related fatal crashes the notion being that these emphasis areas represent the greatest opportunity for successfully reducing the number of severe crashes. MARCH 2007 ii
9 The Interagency Safety Committee then undertook a screening process that ultimately resulted in the selection of five areas of focus the Critical Emphasis Areas (CEAs) for the Plan: 1. Increasing Safety Belt Usage 2. Keeping Vehicles on the Roadway, Minimizing the Consequences of Leaving the Road, & Reducing Head-On and Across-Median Crashes 3. Reducing Impaired Driving 4. Improving the Design and Operation of Highway Intersections 5. Addressing the Over Involvement of Young Drivers The selection of the five CEAs focused the vision of the Plan from an initial universe of more than 500 alternative safety strategies to approximately 160 strategies that are directly related to the factors contributing to severe crashes in Nebraska. This reduced set of strategies was then further screened by the safety partners to a list of 20 Critical Strategies addressing the Four Safety E s. A summary of these Critical Strategies is illustrated in Figure ES.1. Most of the Critical Strategies dealing with engineering and emergency services can be implemented almost immediately, with cooperation of the responsible agency and the allocation of the necessary financial resources. However, several strategies dealing with enforcement and young drivers (a primary safety belt law, automated enforcement and a more comprehensive Graduated Drivers License program) would require new legislation before they could be implemented. The last step in the SHSP development process involved analyzing alternative safety investment options. The process for screening the safety strategies narrowed the focus of the Plan from hundreds of potential strategies to the twenty highest priority strategies. However, even after this prioritization there are still thousands of possible ways to invest safety dollars in different combinations of strategies. The analysis of alternative safety investment scenarios, using a specially developed spread sheet tool, identified six key characteristics that are associated with the most effective investment of safety dollars and therefore most likely to result in Nebraska achieving the adopted safety goal. Nebraska s six keys to safety investment include: 1. Invest in all four Safety E s. 2. Focus the safety investment in the few strategies that are associated with the largest pool of fatal and disabling injury crashes. 3. Invest heavily in strategies that have proven to produce crash reductions, have relatively high safety effectiveness ratios, are relatively low cost and therefore can be widely deployed across Nebraska s entire system of highways. 4. Find a balance between the traditional reactive approach to safety and a proactive approach that is expected to be more effective at addressing the few widely distributed serious crashes that are over represented in rural areas. 5. Develop a method to direct safety resources to local road systems, which account for almost 40% of the fatal crashes in Nebraska. 6. The enforcement and young driver strategies that require new legislation are linked to large pools of severe crashes that are susceptible to correction, have low to moderate MARCH 2007 iii
10 deployment costs and relatively high effectiveness ratios. As a result, the addition of these strategies to an overall safety plan would significantly increase Nebraska s ability to meet the adopted safety goal. FIGURE ES.1 Summary of Nebraska s Critical Strategies Note: Several Critical Strategies had multiple components and addressed more than one of the Four Safety E s. The strategies are based on material and guidance in the NCHRP Report 500 series, were prioritized by Safety Partners at a workshop on May 16, 2006 and with concurrence by the Nebraska Interagency Safety Committee. It should be noted that additional investments to improve data systems was not identified as being highly effective at reducing severe crashes. It appears that this is likely a function of the lack of research results at the national level as opposed to providing a true picture of the actual value of good data. In fact, traffic safety professionals in Nebraska consider improving the crash data system to be a high priority. Without accurate data, both from the perspective of crash location and integrated across a variety of state agencies, the task of identifying crash prone locations and linking causative factors to mitigation strategies becomes far too speculative. As a result, Nebraska chooses to include improvements to data systems as a key part of the SHSP and will continue to make the necessary investment of safety dollars in order to support the development of a crash records system that is highly accurate and integrated across the State s safety agencies. MARCH 2007 iv
11 Finally, the greatest challenge facing traffic safety professionals in Nebraska is the need to acknowledge that the effort to reduce fatal and life changing injuries is tied to implementing a new, more effective safety program that is different than what has been done in the past. The previous program is associated with a trend line for highway traffic fatalities that is increasing. The analysis of safety investment options proves that Nebraska can achieve the adopted safety goal of reducing the fatal crash rate to the national goal of 1.0, a 38% reduction. However, doing so will require doing things differently than what has been the practice in recent years. This includes investing in additional enforcement, education and emergency services, being more proactive, engaging the legislature to improve laws dealing with safety belts, electronic enforcement and young drivers, and focusing safety investments to the small subset of low cost strategies that are linked to large pools of severe crashes and that can be widely deployed across Nebraska. MARCH 2007 v
12
13 1. Introduction and Background 1.1 Highway Safety Trends at the National Level and in Nebraska From a peak in the 1970s, there have been significant reductions in the number of traffic-related fatalities in the U.S. Nebraska has experienced a decrease in the number of traffic fatalities similar to the national trend as illustrated in Figure 1.1 (1,2). After significant decreases up until the early 1980s, the number of traffic fatalities in Nebraska leveled off, with a slight upward trend in recent years. As indicated by the regression line in Figure 1.1, traffic fatalities in Nebraska are growing at an average rate of seven traffic fatalities every ten years. Trends in Nebraska and National Traff Fatalties 60, ,000 50,894 54, ,091 47,087 National Nebraska , , ,589 42, National (Number of Fatalities) 30, , Nebraska (Number of Fatalities) 20, Linear regression for number of traffic fatalities since , Year 0 FIGURE 1.1 Historic Number of Traffic Fatalities One reason the number of fatalities has been slightly increasing over the past 25 years is because the number of vehicles miles traveled (VMT) in Nebraska has increased steadily during the same time period; from 11.4 billion VMT in 1982, a 65% growth to 18.9 billion VMT in This trend is expected to continue and suggests the need to develop and implement more effective strategies if the goal of reducing the number of fatal and life-changing injury crashes is to be achieved. MARCH
14 When inspecting the trends in the fatality rates in Figure 1.2 (1,2), the national trend indicates a sharp decrease up until the early 1990 s, which has since been followed by a much slower decreasing trend. The trend in Nebraska has closely mirrored what has been occurring for the U.S. Given this trend, Nebraska s fatality rate would ultimately match the national safety goal of 1.0 fatalities per hundred million vehicle miles traveled at about 2015, because of the growth in VMT, not because of a decrease in the number of traffic fatalities. Trends in the Nebraska and National Traffic Fatality Rate Nebraska National Fatality Rate (100M VMT) National Safety Goal 1.0 Traffic fatality rate linear regression ( ) Year FIGURE 1.2 Historic Fatality Crash Rate 1.2 Recent National Guidance on Highway Safety The more recent trends in fatal crash statistics, such as an overall increase in the number of fatal crashes and a relatively flat fatality rate, have led the American Association of State Highway and Transportation Officials (AASHTO) and the Federal Highway Administration (FHWA) to conclude that a new focus on and approach to traffic safety is necessary to address the increases in fatal and injury crashes. Their vision for a new process is documented in the AASHTO Strategic Highway Safety Plan (3) and the National Cooperative Highway Research Program Report 501: Integrated Safety Management Process (4). In addition, the recently passed Federal transportation reauthorization bill (SAFETEA-LU) requires State Transportation Agencies to update their safety plans and the FHWA s Guidance (5) basically adopts the recommended safety process outlined in the AASHTO and NCHRP reports. This process is integrated with MARCH
15 the efforts of other agencies and organizations working to improve traffic safety and focuses on addressing fatal crashes on all levels of roadways; not just the Interstate and state highway system. Agencies are also encouraged to use a data driven approach to focus efforts on target areas where the greatest number of fatalities occur and therefore maximizing the allocation of limited resources to prevent severe crashes. This concept is illustrated by FHWA s decision to target resources in the following safety focus areas: roadway departures, intersections, and pedestrians (6). Finally, a state Strategic Highway Safety Plan (SHSP) is intended to be a guide for investing in safety strategies in order to be more effective at reducing traffic fatalities and serious injuries. In addition to requiring a State to prepare a SHSP, SAFETEA-LU also established the Safe Routes to School (SRTS) program. This is a $612 million program that creates a statewide program in each state, including a full-time coordinator. The SRTS program is intended to encourage children to walk or bike to school, and fosters this by ensuring that programs and projects are in place to make the trip as safe as possible. Improving safety for children will include traditional pedestrian engineering improvements, but public education and community outreach are expected to be an important component. A successful program will not only have the benefit of improving children s health by increasing their activity, but it will also help reduce traffic which will reduce fuel consumption, air pollution, and possibly even improve traffic safety. In response to the direction provided at the national level, the Nebraska Department of Roads along with numerous other Safety Partners are working together to develop the Nebraska Strategic Highway Safety Plan in order to address the frequency, rate and primary factors contributing to fatal and disabling injury crashes in Nebraska. 1.3 Previous Highway Safety Efforts Completed by Nebraska Formation of the Nebraska Interagency Safety Committee To help move Nebraska towards reducing traffic fatalities and serious injuries, a multi-agency committee has been formed, called the Nebraska Interagency Safety Committee. The Interagency Safety Committee had its initial meeting on October, The committee involves state, local and federal agencies with an interest in Nebraska s road safety programs. There are two parts to the Nebraska Interagency Safety Committee. The first is the Leadership Committee which can meet on a quarterly basis and will sponsor and oversee the general direction of the Nebraska SHSP. The Leadership Committee is currently comprised of directors from: Nebraska Department of Roads Nebraska Department of Motor Vehicles/Office of Highway Safety Nebraska Department of Health and Human Services Nebraska State Patrol Nebraska Association of County Officials Nebraska League of Municipalities MARCH
16 The second component of the Nebraska Interagency Safety Committee is the Working Committee. The Working Committee meets monthly to give guidance to the development of the Plan and help with making decisions on technical issues. The members of the Working Committee are currently: Nebraska Department of Roads Nebraska Department of Motor Vehicles/Office of Highway Safety Nebraska Department of Health and Human Services, EMS/Trauma Nebraska State Patrol American Traffic Safety Services Association Federal Highway Administration (federal advisor) National Highway Traffic Safety Administration (federal advisor) Federal Motor Carrier Safety Administration (federal advisor) The role of the Interagency Safety Committee in development of the Nebraska SHSP is to provide guidance, final approval of the document and help gain consensus at a high level among the many local, state and federal agencies with a stake in traffic safety. The Interagency Safety Committee will also play an important role to see that the recommendations in the Plan are implemented and that programs are evaluated and adjusted as needed Preliminary Identification of the Critical Emphasis Areas The national plan to improve roadway safety is based on AASHTO s SHSP which identifies 22 key emphasis areas that broadly address the Four Safety E s Education, Enforcement, Engineering and Emergency Medical Services (EMS). Each emphasis area targets a specific set of factors that contribute to a significant number of deaths on the nation s highways and also includes general strategies for reducing these fatalities. The 22 emphasis areas are grouped into the six parts (Drivers, Special Users, Vehicles, Highways, Emergency Medical Services, and Management) and are listed in Table 1.1. To help a state focus its highway safety efforts in areas where they can be the most effective, a widely accepted approach is to identify the emphasis areas where there is a relatively high number of fatalities and/or disabling injuries. These select emphasis areas are referred to as Critical Emphasis Areas (CEAs). In early meetings of the Working Committee, nine possible CEAs were identified. The nine emphasis areas being considered included: 1. Reducing Over Involvement of Young Drivers 2. Curbing Speeding 3. Reducing Impaired Driving 4. Increasing Safety Belt Usage 5. Making Truck Travel Safer 6. Keeping Vehicles on the Roadway 7. Improving the Design and Operation of Highway Intersections 8. Designing Safer Work Zones 9. Traffic Records The Working Committee then prepared a summary of fatal, disabling injury and visible injury crashes ( ) to gain a better understanding of the magnitude of the problem in each emphasis area (see Table 1.2). MARCH
17 TABLE 1.1 AASHTO s 22 Emphasis Areas Emphasis Areas Part 1: Drivers Instituting Graduated Licensing for Young Drivers Ensuring Drivers are Licensed and Fully Competent Sustaining Proficiency in Older Drivers Curbing Aggressive Driving Reducing Impaired Driving Keeping Drivers Alert Increasing Driver Safety Awareness Increasing Safety (Seat) Belt Usage and Improving Airbag Effectiveness Part 2: Special Users Making Walking and Street Crossing Safer Ensuring Safer Bicycle Travel Part 3: Vehicles Improving Motorcycle Safety and Increasing Motorcycle Awareness Making Truck Travel Safer Increasing Safety Enhancements in Vehicles Part 4: Highways Reducing Vehicle-Train Crashes Keeping Vehicles on the Roadway Minimizing the Consequences of Leaving the Road Improving the Design and Operation of Highway Intersections Reducing Head-On and Across-Median Crashes Designing Safer Work Zones Part 5: EMS Enhancing Emergency Medical Capabilities to Increase Survivability Part 6: Management Improving Information and Decision Support Systems Creating More Effective Processes and Safety Management Systems Source: AASHTO Strategic Highway Safety Plan Based on the results of the crash summary, the five CEAs below were identified for further consideration at the Critical Strategies Workshop on May 16, A later task during the development of the SHSP was to verify the selection of the CEAs. For more information about the final selection of the CEAs, refer to Chapter Reducing Impaired Driving 2. Reducing Over Involvement of Young Drivers 3. Increasing Safety Belt Usage 4. Improving the Design and Operation of Highway Intersections 5. Keeping Vehicles on the Roadway 1.4 Nebraska Crash Records System The Department of Roads maintains a sophisticated crash data system, which collects, categorizes, and analyzes crashes on all roads in Nebraska. This system was revised in 2002 to correspond with many of the data elements described in the Model Minimum Uniform Crash Criteria. Data from this system is used to identify safety problems, including those defined in the state s Highway Safety Plan and Highway Safety Improvement Program. In addition, crash MARCH
18 data from this system is integrated into the Motor Carrier Management Information System and Nebraska s Crash Outcomes Data Evaluation System. Nebraska has maintained a Traffic Records Coordinating Committee (TRCC) since 1995 which identifies and champions traffic records improvements. Many major improvements have been made during this time span and others are planned. The TRCC develops a Strategic Plan for Traffic Records which is updated annually. A Traffic Records Assessment was completed in August Future plans for improving the crash records system include allowing for the electronic submittal of accident reports and making crash data easily available through the web. One of the recent improvements to the crash records system was a new Hazardous Location Analysis tool. This system allows for the identification of high accident intersections, sections, and clusters on the state highway system. Crash rate by type and volume of roadway, accident frequency, and crash severity are all used in the formula to identify significant locations. Although local roads are excluded from this process because of a lack of traffic volume data, these roads are not ignored. They are analyzed using a different, although more cumbersome procedure. Local road crash data were studied from all 93 Nebraska counties for the initial High Risk Rural Roads program analysis. TABLE 1.2 AASHTO s 22 Emphasis Areas Potential Critical Emphasis Area Related Crashes* Reducing Over Involvement of Young Drivers 2,672 2,486 2,253 Curbing Speeding Reducing Impaired Driving Increasing Safety Belt Usage 2,497 2,172 1,894 Making Truck Travel Safer Keeping Vehicles on the Roadway 2,210 2,193 2,067 Improving the Design and Operation of Highway Intersections 3,797 3,655 3,447 Designing Safer Work Zones Traffic Records -- Not Applicable -- * All figures are fatal, disabling and visible injury crashes, with the exception of Increasing Safety Belt Usage, which is fatal, disabling and visible injuries to unbelted passengers. Source: Nebraska Interagency Safety Committee Working Committee MARCH
19 2. Selection of a Safety Goal and Confirmation of the Critical Emphasis Areas 2.1 Identification of a Statewide Safety Goal One of the first steps in the development of a SHSP is to establish a statewide safety goal. The national highway safety goal is to reduce by 33% the national fatality rate from 1.5 fatalities per 100 million vehicle miles [MVM] in 2003 to 1.0 fatalities per 100 MVM by 2008 (see Figure 2.1). Achieving this goal is expected to reduce the annual traffic fatalities by 5,000 to 7,000 (3). A necessary part of this goal to reduce the national fatality rate is that each individual state does its part to help. National Safety Goal A 33% reduction in the traffic fatality rate; expected to save 5,000 to 7,000 lives annually Nebraska Safety Goal To reach the national goal of 1.0, which is nearly a 38% reduction in the traffic fatality rate. Achieving this goal is expected to save 80 lives annually by Traffic Fatality Rate Actual Fatality Rate 1.0 National Goal Actual Fatality Rate 1.0 Adopt the National Goal of 1.0? Adopt Another Goal 1.1 Adopt the National Goal of a 33% Reduction FIGURE 2.1 National and Nebraska Traffic Safety Goals For Nebraska, a variety of alternative safety goals could have been adopted by the Interagency Safety Committee. Example safety goals may include (also illustrated in Figure 2.1): Reduce Nebraska s fatality rate to 1.0 fatality per 100 MVM by With this goal, the State would expect annual traffic fatalities to decrease from 275 ( average) to approximately 210 or fewer per year by Reduce Nebraska s fatality rate by 33%, consistent with the national goal. With this goal, the State would expect the fatality rate to decrease from 1.6 in 2003 to 1.07 by 2011, which would mean the annual traffic fatalities would decrease from approximately 275 to 225. NOTE: An x% reduction in the traffic fatality rate between 2003 and 2011 does not translate into an equal percent reduction in the number of fatalities since the State s VMT has grown steadily at a rate of 340 MVM per year (Source for VMT Forecast: Traffic Analysis Unit, Planning & Project Development Division, NDOR. Based on VMT data from ). MARCH
20 Adopt an absolute reduction in the number of traffic fatalities (i.e., 200 or fewer traffic fatalities per year by 2011). At a 2006 meeting of the Interagency Safety Committee, the alternatives were considered and the Leadership Committee adopted the national goal for Nebraska s statewide safety goal. Therefore, Nebraska s safety goal for the SHSP is to reduce the State s traffic fatality rate from 1.6 fatalities per 100 MVM in 2003 to 1.0 fatalities per 100 MVM by Based on the trend of increasing number of traffic fatalities in Nebraska, 290 traffic fatalities are expected in However, reversing the trend to achieve the goal would reduce traffic fatalities to approximately 210 and save approximately 80 lives each year in Nebraska. 2.2 Review of Statewide Fatal Crash Data by AASHTO s 22 Emphasis Areas As referenced in Chapter 1, Nebraska used AASHTO s 22 emphasis areas as the building blocks for this Plan. This included an evaluation of fatal, disabling injury and visible injury crashes. The second task in the SHSP development process involved reviewing the most current summary of Nebraska s fatal crashes ( ) associated with the 22 emphasis areas (see Table 2.1 and Figure 2.2) to reevaluate the initial selection of the CEAs. As seen in the fatal crash summary, the ten categories with the highest number of fatal crashes include: 1. Unrestrained vehicle occupants (59%) 2. Run-off the road crashes (41%) 3. Alcohol-related crashes (37%) 4. Intersection crashes (33%) 5. Involved a driver under 21 (26%) 2.3 Final Confirmation of the CEAs 6. Heavy vehicles (25%) 7. Involved a driver over 64 (19%) 8. Head-on and across median (12%) 9. Aggressive drivers (12%) 10. Pedestrian (5%) Following the review of Nebraska s fatal crash records, the Interagency Safety Committee met to discuss the selection of the CEAs. The breakdown of the fatal crash information showed that the original CEAs (see Section 1.3.2) still identified the top five categories based on the number of traffic fatalities. Since the original recommendation for CEAs did cover the top emphasis areas, the Interagency Safety Committee elected to stay with the original selection for Nebraska s CEAs. The only modification to the CEAs is that Keeping Vehicles on the Road will be expanded from run-off-road crashes to include all facets of lane departure crashes (i.e., adding Minimizing the Consequences of Leaving the Road and Reducing Head-on and Across-Median Crashes ). Therefore, the selected CEAs for the Nebraska SHSP are: 1. Increasing Safety Belt Usage 2. Keeping Vehicles on the Roadway, Minimizing the Consequences of Leaving the Road, & Reducing Head-On and Across-Median Crashes 3. Reducing Impaired Driving 4. Improving the Design and Operation of Highway Intersections 5. Addressing the Over Involvement of Young Drivers MARCH
21 TABLE 2.1 Summary of Nebraska s Fatal Crashes by Emphasis Area Emphasis Area Nebraska Fatal Crashes* Percent Part 1: Drivers Part 2: Special Users Part 3: Vehicles Part 4: Highways Part 5: EMS Part 6: Management Instituting Graduated Licensing for Young Drivers Ensuring Drivers are Licensed and Fully Competent Sustaining Proficiency in Older Drivers 352 fatalities involved a driver under the age of Not Available fatalities involved a driver over the age of 64 Curbing Aggressive Driving 164 fatalities listed speeding or reckless 12% action as a contributing factor Reducing Impaired Driving 501 fatalities were alcohol related 37% Keeping Drivers Alert 48 fatalities involved an inattentive driver Increasing Driver Safety Awareness -- Not Available -- Increasing Safety (Seat) Belt Usage and Improving Airbag Effectiveness 707 vehicle occupant fatalities (out of 1,204 vehicle occupant fatalities) were not using a restraint device Making Walking and Street Crossing Safer 65 pedestrian fatalities 5% Ensuring Safer Bicycle Travel 12 bicyclists fatalities 1% Improving Motorcycle Safety and Increasing Motorcycle Awareness 69 motorcyclists fatalities 5% Making Truck Travel Safer 345 fatalities involving heavy trucks 25% Increasing Safety Enhancements in Vehicles -- Not Available -- Reducing Vehicle-Train Crashes 31 fatalities involving a collision with a train 2% Keeping Vehicles on the Roadway 558 single vehicle run-off the road fatalities 41% Minimizing the Consequences of Leaving the Top 4 fatal run -off the road collisions: Road - Overturn - Collision with a ditch - Collision with a tree - Collision with an embankment Improving the Design and Operation of Highway Intersections 455 fatalities at an intersection 33% Reducing Head-On and Across-Median 167 head-on and across-median Crashes fatalities 12% Designing Safer Work Zones 35 work zone fatalities 3% Enhancing Emergency Medical Capabilities to Increase Survivability Improving Information and Decision Support Systems Creating More Effective Processes and Safety Management Systems 26% 19% 4% 59% In 2004, the average response time (time of crash to arrival hospital) was 44.7 minutes for 182 rural fatal crashes. For 47 urban fatal crashes, the average response time was 26.9 minutes -- Not Available Not Available -- * Source: Nebraska Crash Database ( ) NOTE: Between 2000 and 2004, there were 1,212 fatal crashes and 1,371 traffic fatalities in Nebraska. MARCH
22 275 Safety Goal Reducing the 2011 fatality rate to 1.0 will reduce the number of traffic fatalities by over 27% from the forecasted number of fatalities. 290 Based on trends from crash data dating back to All Others Pedestrians Aggressive Driving Head-On and Across Median Emphasis Areas Older Drivers Heavy Vehicles Young Drivers Intersections Impaired Driving Implementation of Mitigation Strategies 210 Ran-Off the Road Unbelted Average 2011 FIGURE 2.2 Illustration of How Nebraska s Fatalities Stack Up and the Needed Reduction to Meet the 2011 Safety Goal 2.4 Review of Fatal Crash Information for the CEAs Prior to the May, 2006 safety summit, Nebraska s fatal crash records ( ) were reviewed and summarized into fact sheets, which were then used by the participants to help identify major patterns or contributing factors when prioritizing the related strategies. A copy of these fact sheets has been provided at the end of this chapter for review. In addition, summaries of the key findings for each CEA identified during the crash review are provided below. Increasing Safety Belt Usage 85% of unbelted vehicle occupant fatalities occurred on rural roads. 44% of unbelted fatalities were located on local roads followed by US Highways with 26%. The top six counties for unbelted fatalities were Douglas (8%), Lancaster (7%), Buffalo (4%), Sarpy (3%), Hall (3%), and Gage (3%). The most common crash type in which an unbelted fatality occurred was a single vehicle run-off-the-road crash (55%) followed by angle collision (23%). MARCH
23 Males accounted for 67% of unbelted fatalities and 24% of the vehicle occupants killed were between the ages of 14 and 20. Over half of the unbelted fatalities occurred on Friday, Saturday and Sunday. Of vehicle occupant fatalities, unbelted vehicle occupants accounted for 59% of all deaths. However, the vehicle occupants not wearing safety belts and involved in the fatal crashes accounted for only 42% of the injured occupants and 17% of the uninjured vehicle occupants. Keeping Vehicles on the Roadway, Minimizing the Consequences of Leaving the Road, & Reducing Head-On and Across-Median Crashes There was a total of 725 fatalities from lane departure crashes, which is comprised of 558 fatalities from single vehicle run-off the road crashes, 100 fatalities from head-on crashes, and 67 fatalities from fatal sideswipe (opposite direction) crashes. 85% of lane departure fatalities happened on rural roads. 41% of fatalities occurred on local roads with 26% of fatalities on US Highways. The top five counties for lane departure fatalities were Lancaster (9%), Douglas (8%), Sarpy (4%), Buffalo (4%), and Dawson (3%). Alcohol involvement was reported in 46% of lane departure fatalities and 67% of the vehicle occupant fatalities were individuals not wearing safety belts. Of the drivers involved in a fatal lane departure crash, 72% were male and 21% were at most 20 years old. 53% of the fatalities happened in dark driving conditions. Friday, Saturday, and Sunday accounted for 54% of lane departure fatalities. Reducing Impaired Driving Alcohol-related fatalities were more likely in rural areas (76%). Most fatalities occurred on local roads (46%) with another 28% on US Highways. The top five counties for alcohol-related fatalities were Douglas (12%), Lancaster (12%), Sarpy (5%), Buffalo (3%), and Dawson (3%). Single vehicle run-off the road crashes accounted for 57% of all alcohol-related fatalities. Of drinking and drunk drivers; 18% were under the age of 21, 82% were male, and 57% were unbelted. Most alcohol-related fatalities occurred between 9:00 PM and 3:00 AM (53%) and 67% of alcohol-related fatalities occurred on Friday, Saturday, or Sunday. Improving the Design and Operation of Highway Intersections There were a total of 455 intersection fatalities. Of these, 129 could be identified as having occurred at an unsignalized intersection and 40 at a signalized intersection. 65% of fatalities occurred at a rural intersection. Intersections on local roads accounted for 41% of the fatalities and US Highways was second with 32% of intersection fatalities. The top five counties for intersection fatalities were Douglas (19%), Lancaster (14%), Hall (4%), Gage (4%), and Sarpy (3%). 60% of intersection fatalities were right angle collisions. MARCH
24 Alcohol involvement was reported in 30% of the fatalities and 49% of the vehicle occupant fatalities were not using safety belts. The leading contributing factor was failure to yield right of way. Only 29% of the intersection fatalities occurred during dark driving conditions. Of the drivers involved in a fatal intersection crash; 76% were male, 18% were in the age group, and 17% were in the age group. Addressing the Over Involvement of Young Drivers 78% of fatalities involving young drivers occurred on rural roads. 53% of fatalities were on local roads followed by US Highways with 27%. The top six counties for fatalities involving a young driver were Douglas (13%), Lancaster (11%), Gage (3%), Dawson (3%), Hall (3%), and Seward (3%). The most common crash type involving a young driver was single vehicle run-off-the-road crash (38%) followed by right angle collision (30%). Males accounted for 67% of young drivers involved in a fatal crash; 34% of young drivers had been drinking; and 56% of the young drivers were unbelted. 56% of the fatalities involving a young driver occurred on Friday, Saturday and Sunday. 37% of fatalities involving a young driver occurred between 9:00 PM and 3:00 AM. MARCH
25 Fatal Crashes Involving Unbelted Vehicle Occupants NEBRASKA STRATEGIC HIGHWAY SAFETY PLAN How Significant is the Problem? On Nebraska roadways, there were 707 unbelted vehicle occupant fatalities during , which is an average of 140 fatalities per year. This accounts for nearly 52% of all traffic fatalities during the five year period and approximately 59% of the all vehicle occupant fatalities (1,204) during the study period. During , reported safety belt usage in Nebraska ranged from a low of 69.7% in 2002 to a high of 79.2% in 2004 (2005: no change from the 2004 usage rate). What is the Nebraska Goal? Nebraska s goal is to reduce the traffic fatality rate to 1.0 fatality per 100 million VMT by 2011 (which is expected to save 80 lives annually). In order to achieve the goal, the number of annual unbelted vehicle occupant fatalities needs to be reduced by approximately 40. What are the Contributing Factors? Road and Area Type Unbelted vehicle occupant fatalities were more likely to occur in rural areas (598 of 707, 85%). Local roads accounted for the greatest number of unbelted fatalities (316 of 707, 44%). The jurisdiction with the second highest number of fatalities was US Highways with 26% (181 of 707). Only 10% (73 of 707) of young driver involved fatalities were on Interstate routes. Jurisdiction Classification Rural Urban Interstates 8% 2% US Highway 22% 4% State Highways 17% 2% Local Roads 37% 7% Total by Area Type 85% 15% Total 100% Location 29% (204 of 707) of unbelted vehicle occupant fatalities occurred at an intersection. The Top 6 counties represent only 28% (197 of 707) of unbelted vehicle occupant fatalities in Nebraska. Top 6 Counties Fatal Crashes Fatalities Douglas 51 (8%) 55 (8%) Lancaster 50 (8%) 52 (7%) Buffalo 25 (4%) 28 (4%) Sarpy 19 (3%) 24 (3%) Hall 18 (3%) 19 (3%) Gage 16 (2%) 19 (3%) Crash Type 55% (392 of 707) of unbelted fatalities occurred during a single vehicle run-off the road crash. Overall, single vehicle crashes accounted for 61% (433 of 707) and lane departure crashes (i.e., ROR plus head-on) were 65% (460 of 707). Angle crashes were the second most frequent crash type and accounted for 23% (164 of 707) of fatalities. Crash Type Single Vehicle: Run-off Road Unbelted Veh. Occ. Fatalities Total Fatalities 392 (55%) 558 (41%) Single Vehicle: Other 41 (6%) 137 (10%) Rear End and Sideswipe (Same) 33 (5%) 97 (7%) Head-On & Sideswipe (Opposite) 68 (10%) 167 (12%) Angle 164 (23%) 350 (26%) Left Turn (Leaving) 3 (<1%) 37 (3%) Other 6 (1%) 24 (2%) Of the single vehicle run-off the road fatalities: 59% were overturn, 14% were a collision with a ditch or embankment, 15% were a collision with a tree, utility pole, or sign support. PAGE 1 OF 2
26 The Passenger Men were 67% (475 of 707) of unbelted fatalities. Few passengers under 13 were killed in a crash while unbelted. The age range included the most unbelted fatalities (169 of 707, 24%). Between 21 and 65, the number of unbelted fatalities in each age group was fairly consistent, which then dropped for the age group and increased again for adults over 65. Age Group Male Female < 13 6 (1%) 10 (1%) (15%) 61 (9%) (11%) 29 (4%) (11%) 32 (5%) (10%) 37 (5%) (9%) 27 (4%) (3%) 12 (2%) (7%) 23 (3%) Unknown 2 (0%) 1 (0%) Totals by Gender 475 (67%) 232 (33%) Population Total 707 (100%) Alcohol was listed as a contributing factor in 47% (331 of 707) of unbelted fatalities. 64 (9%) of the unbelted fatalities were partially ejected from their vehicle and 331 (47%) were reported as being totally ejected. Role of Safety Belt in Injury Severity In the fatal crashes that occurred between 2000 and 2004, unbelted vehicle occupants were found to account for 59% of all vehicle occupant fatalities. Looking at the rest of the passengers involved in the fatal crashes, 42% of the injured occupants were unbelted and only 17% of the uninjured occupants were not wearing a safety belt. Time-of-Day & Day of Week Most unbelted vehicle occupant fatalities occurred between 9:00 PM 3:00 AM (244 of 707, 34%). 48% (341 of 707) of unbelted fatalities occurred during dark driving conditions (compared to 43% of all fatalities). There were noticeable peaks at 6:00 PM (6%), 11:00 PM (8%), and midnight (8%). Time of Day Fatalities Percentage Midnight to 02: % 3:00 to 05: % 6:00 to 08: % 9:00 to 11: % 12:00 to 14: % 15:00 to 17: % 18:00 to 20: % 21:00 to 23: % Unknown 19 3% 36% (152 of 707) of unbelted fatalities occurred on Saturday or Sunday. Another 17% (121 of 707) of the unbelted fatalities were on Friday. Day of Week Fatalities Percentage Sunday % Monday 74 10% Tuesday 80 11% Wednesday 98 14% Thursday 82 12% Friday % Saturday % Some Existing Safety Activities Periodic Statewide Enforcement Operations Click-It or Ticket & Buckle Up In Your Truck Rollover Demonstration Units Secondary Belt Law Multi-Media Belt Use Campaign Child Passenger Protection Program PAGE 2 OF 2
27 Fatal Lane Departure Crashes NEBRASKA STRATEGIC HIGHWAY SAFETY PLAN How Significant is the Problem? On Nebraska roadways, there were 645 fatal crashes during in which the crash was classified as lane departure (516 single vehicle runoff the road, 76 head-on, and 53 sideswipe opposite direction). These crashes resulted in a total of 725 fatalities (558 ROR, 100 HO, and 67 SSW), which is an average of 145 fatalities per year. This accounts for nearly 53% of all traffic fatalities during the five year period. What is the Nebraska Goal? Nebraska s goal is to reduce the traffic fatality rate to 1.0 fatality per 100 million VMT by 2011 (which is expected to save 80 lives annually). In order to achieve the goal, the number of annual fatalities in lane departure crashes needs to be reduced by approximately 40. What are the Contributing Factors? Road and Area Type Lane departure fatalities were primarily in rural areas (619 of 725, 85%). Combining rural and urban roadways, local roads accounted for the greatest number of lane departure fatalities (299 of 725, 41%). The jurisdiction with the second highest number of fatalities was US Highways with 26% (189 of 725). Jurisdiction Classification Rural Urban Interstates 13% 2% US Highway 23% 3% State Highways 16% 2% Local Roads 33% 8% Total by Area Type 85% 15% Total 100% Location Only 12% (84 of 725) of lane departure fatalities occurred at an intersection. The Top 5 counties represent only 28% (202 of 725) of lane departure fatalities in Nebraska. Top 5 Counties Fatal Crashes Fatalities Lancaster 57 (9%) 62 (9%) Douglas 53 (8%) 61 (8%) Sarpy 26 (4%) 31 (4%) Buffalo 22 (3%) 26 (4%) Dawson 21 (3%) 22 (3%) Crash Type A majority of single vehicle run-off road fatalities were overturned vehicles. Run-off Road Crashes Fatalities Percentage Overturned % Embankment 19 9% Tree 17 8% Ditch 17 5% Highway Traffic Sign Post 13 4% All Single Vehicle ROR % Contributing Factors Alcohol was reported as a contributing factor is 46% (337 of 725) of lane departure fatalities. 67% of the vehicle occupant fatalities in lane departure crashes were individuals not using safety belts. By gender, 69% of males and 63% of females killed were not belted. PAGE 1 OF 2
28 Weather A majority of lane departure fatalities were during good weather conditions. Weather Conditions Fatalities Percentage Clear or Cloudy % Rain 26 5% Snow 39 7% Sleet, hail, or freezing rain 28 5% Other 24 4% Time-of-Day & Day of Week 38% (174 of 725) lane departure fatalities occurred between 9:00 PM and 3:00 AM. Overall, 53% (384 of 725) of lane departure fatalities occurred in dark driving conditions (compared 43% of all fatalities). Time of Day Fatalities Percentage Midnight to 02: % 3:00 to 05: % 6:00 to 08: % 9:00 to 11: % 12:00 to 14: % 15:00 to 17: % 18:00 to 20: % 21:00 to 23: % Unknown 24 3% 39% (284 of 725) of lane departure fatalities occurred on Saturday or Sunday. An additional 15% (110 of 725) of the related fatalities were on Friday. Day of Week Fatalities Percentage Sunday % Monday 77 11% Tuesday 74 10% Wednesday 87 12% Thursday 93 13% Friday % Saturday % Road Surface Conditions A majority of lane departure fatalities occurred when the road surface was dry. Road Surface Conditions Fatalities Percentage Dry % Wet or Water 62 9% Snow, Ice or Slush 73 10% Other or Unknown 13 2% The Driver There were 779 drivers involved in a fatal lane departure crash. Of these, approximately 72% were male. 21% of drivers involved in a fatal lane departure crash were under the age of 21. Age Group Male Female Total < 20 18% 26% 21% % 10% 14% % 9% 16% % 21% 16% % 13% 15% % 6% 6% % 15% 11% The top driver contributing factors for lane departure crashes were: Top Contributing Factors Failure to keep in lane or running off road Number of Drivers 117 Driving too fast for conditions 46 Operating vehicle in erratic manner 36 Wrong side or wrong way 29 Over-correcting or over-steering 28 Exceeded authorized speed limit 27 Some Existing Safety Activities Hardware Inventory & Replacement Rural Road Design Training Centerline Rumble Strips Shoulder Rumble Strips Median Barriers PAGE 2 OF 2
29 Fatal Crashes Involving Alcohol Impairment NEBRASKA STRATEGIC HIGHWAY SAFETY PLAN How Significant is the Problem? On Nebraska roadways, there were 446 fatal crashes during in which the crash was classified as alcohol related. These crashes resulted in a total of 501 fatalities, which is an average of 100 fatalities per year. This accounts for approximately 37% of all traffic fatalities during the five year period. What is the Nebraska Goal? Nebraska s goal is to reduce the traffic fatality rate to 1.0 fatality per 100 million VMT by 2011 (which is expected to save 80 lives annually). In order to achieve the goal, the number of annual alcoholrelated fatalities needs to be reduced by 27. What are the Contributing Factors? Road and Area Type Alcohol-related fatalities were primarily in rural areas (379 of 501, 76%) and 82% were outside of Omaha and Lincoln. Combining rural and urban roadways, local roads accounted for almost half of all alcoholrelated fatalities (234 of 501, 46%). The jurisdiction with the second highest number of fatalities was US Highways with 28% (138 of 501). Only 8% (39 of 501) of alcohol-related fatalities were on Interstate routes. Location Jurisdiction Classification Rural Urban Interstates 6% 2% US Highway 22% 6% State Highways 15% 3% Local Roads 33% 13% Total by Area Type 76% 24% Total 100% 28% (138 of 501) of alcohol-related fatalities occurred at an intersection. The Top 5 counties represent 35% (175 of 501) of alcohol-related fatalities in Nebraska. Top 5 Counties Fatal Crashes Fatalities Douglas 55 (12%) 60 (12%) Lancaster 51 (11%) 60 (12%) Sarpy 21 (5%) 26 (5%) Buffalo 14 (3%) 16 (3%) Dawson 12 (3%) 13 (3%) Crash Type Over half of alcohol related fatalities occurred during a single vehicle run-off the road crash (285 of 501, 57%). Overall, single vehicle crashes accounted for 65% (326 of 501) and lane departure crashes (i.e., ROR plus head-on) were 67% (337 of 501). Angle crashes accounted for 17% (86 of 501) of fatalities. Crash Type Single Vehicle: Run-off Road Alcohol- Related Fatalities Total Fatalities 285 (57%) 558 (41%) Single Vehicle: Other 41 (8%) 137 (10%) Rear End and Sideswipe (Same) 21 (4%) 97 (7%) Head-On & Sideswipe (Opposite) 52 (10%) 167 (12%) Angle 86 (17%) 350 (26%) Left Turn (Leaving) 9 (2%) 37 (3%) Other 7 (1%) 24 (2%) A majority of alcohol-related run-off road fatalities were overturned vehicles. Run-off Road Crashes Fatalities Percentage Overturned % Embankment 19 7% Tree 17 6% Ditch 17 6% Highway Traffic Sign Post 13 5% Total % PAGE 1 OF 2
30 The Driver There were 607 drinking or drunk drivers involved in a fatal crash. Of these, just over 82% were male. 18% of drinking or drunk drivers were under the age of 21. Age Group Male Female Total < 20 18% 21% 18% % 14% 18% % 18% 19% % 24% 18% % 17% 17% % 3% 6% 66+ 4% 3% 3% Other than alcohol use, the top contributing factors for drinking or drunk drivers involved in a fatal crash were: Top Contributing Factors Failure to keep in lane or running off road Number of Drivers Operating vehicle in erratic manner 43 Disregarded traffic sign, signals, or road 38 markings Exceeded authorized speed limit 25 Wrong side or wrong way 20 Failure to yield right of way 16 Driving too fast for conditions 15 57% (345 of 607) of drinking or drunk drivers were not wearing a safety belt when involved in a fatal crash. Men represented 82% of the drivers that were unbelted and drinking when involved in a fatal crash. The Passenger There were 487 vehicle occupant fatalities from alcohol-related crashes. Of these, 331 or approximately 68% were unbelted (Statewide: 59% of occupant fatalities were unbelted). 81 Time-of-Day & Day of Week Most alcohol-related fatalities occurred between 6:00 PM 6:00 AM (392 of 501, 78%). Overall, 74% (370 of 501) of alcohol-related fatalities occurred in dark driving conditions (compared to 43% of all fatalities). Time of Day Fatalities Percentage Midnight to 02: % 3:00 to 05: % 6:00 to 08: % 9:00 to 11: % 12:00 to 14: % 15:00 to 17: % 18:00 to 20: % 21:00 to 23: % Unknown 22 4% 47% (236 of 501) of the alcohol-related fatalities occurred on Saturday or Sunday. An additional 20% (99 of 501) of the alcoholrelated fatalities were on Friday. Day of Week Fatalities Percentage Sunday % Monday % Tuesday % Wednesday 48 10% Thursday 52 10% Friday 99 20% Saturday % Some Existing Safety Activities Selective Overtime Enforcement Operations Conduct Sobriety Checkpoints (ave. 2 per month) Open Container & Repeat Offender laws Judicial & Prosecution Training Drug Recognition Expert Training Alcohol Server/Seller Training Administrative License Revocation Law 0.08 BAC and Zero Tolerance Laws. PAGE 2 OF 2
31 Fatal Crashes at Intersections NEBRASKA STRATEGIC HIGHWAY SAFETY PLAN How Significant is the Problem? At Nebraska s intersections, there were 403 fatal crashes during , resulting in a total of 455 traffic fatalities, which is an average of 91 fatalities per year. This accounts for approximately 33% of all traffic fatalities during the five year period. Of these intersection fatalities, 129 fatalities could be identified as occurring at an unsignalized intersection. Forty intersection fatalities were identified at a signalized intersection. With the remaining 286 intersection fatalities, the traffic control was not reported sufficiently such that the type of intersection could be identified. What is the Nebraska Goal? Nebraska s goal is to reduce the traffic fatality rate to 1.0 fatality per 100 million VMT by 2011 (which is expected to save 80 lives annually). In order to achieve the goal, the number of annual intersection fatalities needs to be reduced by approximately 25. What are the Contributing Factors? Road and Area Type Intersection fatalities were primarily in rural areas (294 of 455, 65%). Combining rural and urban roadways, local roads accounted for 41% (187 of 455) of intersection fatalities. The jurisdiction with the second highest number of fatalities was US Highways with 32% (145 of 455). Jurisdiction Classification Rural Urban Interstates 2% 4% US Highway 20% 12% State Highways 15% 5% Local Roads 27% 14% Total by Area Type 65% 35% Total 100% Location The Top 5 counties represent 44% (199 of 455) of intersection fatalities in Nebraska. Top 5 Counties Fatal Crashes Fatalities Douglas 79 (20%) 85 (19%) Lancaster 57 (14%) 63 (14%) Hall 18 (4%) 19 (4%) Sarpy 14 (3%) 14 (3%) Gage 13 (3%) 18 (4%) Crash Type 60% (273 of 455) of intersection fatalities occurred during an angle collision. Single vehicle run-off the road crashes were the second most frequent crash type and accounted for 15% (68 of 455) of fatalities. For fatalities at signalized intersections 45% were from left-turn crashes and 38% were from angle crashes. Of the unsignalized fatalities, 90% were in angle crashes. Crash Type Int. Fatalities Total Fatalities Single Vehicle: Runoff Road 68 (15%) 558 (41%) Single Vehicle: Other 24 (5%) 137 (10%) Rear End and Sideswipe (Same) 29 (6%) 97 (7%) Head-On & Sideswipe (Opposite) 16 (4%) 167 (12%) Angle 273 (60%) 350 (26%) Left Turn (Leaving) 37 (8%) 37 (3%) Other 8 (2%) 24 (2%) Weather A majority of intersection fatalities were during good weather conditions. Weather Conditions Fatalities Percentage Clear or Cloudy % Rain 19 4% Snow, sleet, hail, etc. 6 2% Other or Unknown % PAGE 1 OF 2
32 Road Surface Conditions A majority of intersection fatalities occurred when the road surface was dry. Road Surface Conditions Fatalities Percentage Dry % Wet or Water 36 8% Snow, Ice or Slush 9 2% Other or Unknown 7 1% The Driver There were 749 drivers involved in fatal intersection crashes. Of these, 76% were male. The most involved age group was 36 to 45 year olds. Drivers under the age of 21 were only the third highest driver age group. Age Group Male Female Total < 20 15% 21% 16% % 9% 11% % 14% 15% % 17% 18% % 14% 17% % 6% 9% % 19% 14% The top driver contributing factors for fatal intersection crashes were: Top Contributing Factors Number of Drivers Failure to yield right of way 96 Disregarded traffic signs, signal, and road markings 67 Failure to keep in lane or running off road 18 Operating vehicle in erratic manner 14 Contributing Factors Alcohol was reported as a contributing factor in 30% (138 of 455) of intersection fatalities. 49% (209 of 428) of the vehicle occupant fatalities in intersection crashes were not using safety belts. By gender, 52% of males and 43% of females killed were not belted. Time-of-Day & Day of Week Unlike the other four Critical Emphasis Areas, there was not an overrepresentation of intersection fatalities late at night or early morning. In fact, 63% (293 of 455) of intersection fatalities occurred between 9:00 AM and 9:00 PM. Overall, only 29% (130 of 455) of intersection fatalities occurred in dark driving conditions (compared to 43% of all fatalities). Time of Day Fatalities Percentage Midnight to 02: % 3:00 to 05: % 6:00 to 08: % 9:00 to 11: % 12:00 to 14: % 15:00 to 17: % 18:00 to 20: % 21:00 to 23: % Unknown 3 1% Unlike the other four Critical Emphasis Areas, there was not a noticeable weekend peak in intersection fatalities. Day of Week Fatalities Percentage Sunday 60 13% Monday 70 15% Tuesday 60 13% Wednesday 58 13% Thursday 69 15% Friday 73 16% Saturday 65 14% Some Existing Safety Activities Red Light Running Campaigns Roundabouts Advance Warning Detection Engineering Studies Upon Request by Law Enforcement Intersection Improvement Projects PAGE 2 OF 2
33 Fatal Crashes Involving Young Drivers NEBRASKA STRATEGIC HIGHWAY SAFETY PLAN How Significant is the Problem? On Nebraska roadways, there were 302 fatal crashes during in which a young driver (i.e., under the age of 21) was involved. These crashes resulted in a total of 352 fatalities, which is an average of 70 fatalities per year. This accounts for nearly 26% of all traffic fatalities during the five year period. What is the Nebraska Goal? Nebraska s goal is to reduce the traffic fatality rate to 1.0 fatality per 100 million VMT by 2011 (which is expected to save lives annually). In order to achieve the goal, the number of annual fatalities involving young drivers needs to be reduced by approximately 20. What are the Contributing Factors? Road and Area Type Fatalities where a young driver was involved occurred primarily in rural areas (274 of 352, 78%) and 84% were outside of Omaha and Lincoln. Combining rural and urban roadways, local roads accounted for just over half of all young driver involved fatalities (185 of 352, 53%). The jurisdiction with the second highest number of fatalities was US Highways with 27% (95 of 352). Only 6% (21 of 352) of young driver involved fatalities were on Interstate routes. Jurisdiction Classification Rural Urban Interstates 5% 1% US Highway 22% 5% State Highways 11% 3% Local Roads 41% 12% Total by Area Type 78% 22% Total 100% Location 38% (133 of 352) of young driver involved fatalities occurred at an intersection. The Top 6 counties represent 35% (123 of 352) of young driver involved fatalities in Nebraska. Top 6 Counties Fatal Crashes Fatalities Douglas 38 (13%) 44 (13%) Lancaster 30 (10%) 37 (11%) Gage 10 (3%) 12 (3%) Dawson 10 (3%) 11 (3%) Hall 9 (3%) 9 (3%) Seward 8 (3%) 10 (3%) Crash Type 38% (133 of 352) of young driver involved fatalities occurred during a single vehicle runoff the road crash. Overall, single vehicle crashes accounted for 43% (153 of 352) and lane departure crashes (i.e., ROR plus head-on) were 53% (185 of 352). Angle crashes were the second most frequent crash type and accounted for 30% (107 of 352) of fatalities. Crash Type Single Vehicle: Runoff Road Young Driver Involved Fatalities Total Fatalities 133 (38%) 558 (41%) Single Vehicle: Other 20 (6%) 137 (10%) Rear End and Sideswipe (Same) 20 (6%) 97 (7%) Head-On & Sideswipe (Opposite) 52 (15%) 167 (12%) Angle 107 (30%) 350 (26%) Left Turn (Leaving) 11 (3%) 37 (3%) Other 9 (3%) 24 (2%) Of the single vehicle run-off the road fatalities: 56% were overturn, 19% were a collision with a ditch or embankment, 8% were a collision with a tree, and 5% were a collision with a light support. PAGE 1 OF 2
34 The Driver There were 316 young drivers involved in a fatal crash. Of these, approximately two-thirds were male (213 of 316, 67%). There is a noticeable increase in the involvement on young drivers at the age of 16. Age Group Male Female Total 14 1% 2% 2% 15 4% 8% 5% 16 15% 21% 17% 17 15% 17% 15.5% 18 23% 17% 21% 19 16% 14% 15.5% 20 26% 22% 25% The top contributing factors for young drivers involved in a fatal crash were: Top Contributing Factors Failure to keep in lane or running off road Number of Drivers Failure to yield right of way 19 Exceeded authorized speed limit 16 Operating vehicle in erratic manner 15 Disregarded traffic sign, signals, or road markings 12 Driving too fast for conditions 11 Over-correcting or over-steering 10 Of young drivers involved in a fatal crash, 34% (106 of 316) had been drinking or were drunk. Males made up 85% (90 of 116) of the youngdrinking drivers. 56% (177 of 316) of young drivers involved in a fatal crash were not wearing safety belts. Of these, males represented 71% of the youngunbelted drivers. In comparison, 38% of drivers 21-years or older and involved in a fatal crash were not wearing safety belts. Further, safety belt non-use for all vehicle occupants had a range of 20% to 30% for the study period. 22 Time-of-Day & Day of Week Most young driver involved fatalities occurred between 9:00 PM 3:00 AM (132 of 352, 37%). Overall, 44% of fatalities where a young driver was involved happened during dark driving conditions (compared to 43% of all fatalities). There were also noticeable peaks in the morning when many young drivers may be heading to school and also peaks in the early afternoon right after school is dismissed. Time of Day Fatalities Percentage Midnight to 02: % 3:00 to 05: % 6:00 to 08: % 9:00 to 11: % 12:00 to 14: % 15:00 to 17: % 18:00 to 20: % 21:00 to 23: % Unknown 2 1% 40% (139 of 352) of young driver involved fatalities occurred on Saturday or Sunday. An additional 16% (56 of 352) of the young driver involved fatalities were on Friday. Day of Week Fatalities Percentage Sunday 66 19% Monday 39 11% Tuesday 35 10% Wednesday 44 13% Thursday 39 11% Friday 56 16% Saturday 73 21% Some Existing Safety Activities Special Selective Traffic Enforcement Graduated Licensing Law Monitor & Oversight of Driver Training Schools Enforcing Underage Drinking Laws Program Community Coalition Support Program PAGE 2 OF 2
35 3. Prioritization of Safety Strategies 3.1 Strategy Sources and Prioritization Methodology Identification of Nebraska s Critical Strategies followed the final confirmation of the Critical Emphasis Areas (CEAs). The Critical Strategies are a sub-set of safety strategies that are expected to effectively address the primary contributing factors leading to fatal crashes in the CEAs. The Critical Strategies address the Four E s (education, enforcement, engineering, and EMS) as well as issues with crash data systems and data management. A multi-disciplinary, iterative process was used in the selection of the critical strategies. This process began with the strategies listed in the NCHRP Report 500 series. The specific guides that were used to identify the possible strategies are listed in Table 3.1. In addition to the NCHRP series, the initial list included some strategies that had been previously documented in safety plans through FHWA s Lead State Initiative. TABLE 3.1 Primary Source for Initial Strategies Discussed at Safety Summit NCHRP Report 500 Series Volume Title Increasing Safety Belt Usage 11 A Guide for Increasing Seatbelt Use Keeping Vehicles on the Roadway, Minimizing the Consequences of Leaving the Road, & Reducing Head-On and Across-Median Crashes 3 A Guide for Addressing Collisions with Trees in Hazardous Locations 4 A Guide for Addressing Head-On Collisions 6 A Guide for Addressing Run-Off-Road Collisions 7 A Guide for Reducing Collisions on Horizontal Curves 8 A Guide for Reducing Collisions Involving Utility Poles Reducing Impaired Driving 16 A Guide for Reducing Alcohol-Related Collisions Improving the Design and Operation of Highway Intersections 5 A Guide for Addressing Unsignalized Intersection Collisions 12 A Guide for Reducing Collisions at Signalized Intersections Addressing the Over Involvement of Young Drivers Draft copy of the Young Driver guide; to be published by 2007 The strategies included in each of the NCHRP Report 500 series were initially developed by teams of safety experts and then reviewed and refined by panels of practitioners from across the MARCH
36 US prior to publication. Based on the recommendations of the expert panels, the guides only included strategies that were considered practicable for most agencies to implement. The panels also provided basic information on expected effectiveness (i.e., proven, tried, or experimental), cost to implement and operate (i.e., low, moderate, or high), and timeframe for implementation (i.e., short [<1 year], medium [1-2 years], or long [>2 years]). For the strategies taken from the various state safety plans, the information regarding effectiveness, cost, and timeframe was generated by the project team and then reviewed by the Working Committee. On May 16, 2006, a highway safety workshop was conducted with Nebraska s safety partners. The purpose of the safety summit was to review and prioritize the strategies associated with each of the CEAs. The safety summit was organized so that multi-disciplinary small groups were created to discuss, revise and prioritize the list of strategies for a specific CEA (see Figure 3.1). One of the strengths of the safety summit was the diversity of different agencies and organizations that participated in the summit, providing a truly comprehensive 4 E look at the strategies. The participants included state and local highway and law enforcement agencies, FHWA, NHTSA, University researchers and students, driver training, representatives from the emergency medical field and health care providers, and consultants. See Table 3.2 for a complete listing of the workshop participants. TABLE 3.2 Safety Workshop Participants May 16, 2006 Name Group 1: Increasing Safety Belt Usage Group 2: Preventing Lane Departure Crashes Agency Bob Corner (facilitator) Nebraska DMV Trooper Randy Bybee Nebraska State Patrol Noelie Sherdon Nebraska DMV Debbie Kuhn Metro Region EMS Bill Christian Metro Area Planning Agency (MAPA) Pat Polley National Safety Council (Omaha Chapter) Sergeant Eric Sellers Douglas County Sheriff s Office Dean Cole Health & Human Services, EMS Mark Lutjeharms Schemmer Associates Wesley Wahlgren Nebraska DOR District 4 Sherri Cannon NHTSA Manogna Kaluva MATC Craig Schiller MATC Justice Appiah MATC Rudy Umbs (facilitator) FHWA Dennis Smith Nebraska LTAP Center Mark Meisinger Felsburg, Holt & Ullevig Tim Carlson E & A Consulting Group Kylie Shannon National Safety Council (Omaha Chapter) Captain Chris Kolb Nebraska State Patrol Matt Gaffey Nebraska DOR Attorney General s Off. Glen Hansen Omaha Public Works Department Cindy Scott Winnebago Tribal Ambulance Service Monty Fredrickson Nebraska DOR Director s Office Jim Knott Nebraska DOR Roadway Design Mark Kovar Nebraska DOR District 8 Bill Brownell FHWA Kris Winter Nebraska DOR District 3 Bhaven Naik MATC Greg McKnight MATC MARCH
37 TABLE 3.2 Safety Workshop Participants May 16, 2006 Name Group 3: Reducing Impaired Driving Group 4: Improving the Design and Operation of Highway Intersections Group 5: Addressing the Over Involvement of Young Drivers Agency Simera Reynolds (facilitator) MADD Sergeant Dan Schmidt Lincoln Police Department Marcie Hagerty Lancaster County Attorney s Office Murthy Koti Kirkham Michael Scott Sandstrom MAPA Virendra Singh Lincoln Public Works Department Major A.K. Anderson Nebraska State Patrol Holly Warth Good Samaritan Health Systems Kurt Vosburg Nebraska DOR District 7 Jim Schurr Nebraska DOR Planning Diane Riibe Project Extra Mile Captain Andy Hall Fresno Police Department Michele Lewon Nebraska DOR Attorney General s Off. Rich Ruby Nebraska DOR District 1 Laura Lenzen Nebraska DOR Traffic Engineering Karen Amen (facilitator) Olsson Associates Lance Paulsen E & A Consulting Group Tim Weander Nebraska DOR District 2 Rich Uckert FHWA Matt Selinger HDR Doug Kluender Attorney General Craig Lind Nebraska DOR District 5 Lieutenant Tom Schwarten Nebraska State Patrol Dan Cady Nebraska LTAP Center Julia Walter National Safety Council (Omaha Chapter) Jeff Schroeder Nebraska DOR Attorney General s Off. Rick Haden Kirkham Michael Paul Mullen MAPA Randy Hoskins Lincoln Public Works Department Larry Wallace Panhandle Regional EMS Laurie Klosterboer- (facilitator) Nebraska Safety Council Todd Gilkison Lancaster County Medical Society/EMS Major Rhonda Lahm Nebraska State Patrol Steve McBeth Nebraska DOR Planning Scott Opfer Lincoln Public Works Department Bill Saxton Road-Ready Driver Training Ming Qu Health and Human Services Fred Zwonechek Nebraska Office of Highway Safety Peg Prasa-Ogea Health and Human Services Otto Villatoro MATC Brian Gardner MATC Tim Foss MATC MARCH
38 TABLE 3.2 Safety Workshop Participants May 16, 2006 Name Other Participants John Craig Randy Peters Bobbi Olson Bob Grant John Perry Beverly Neth John Nitzel Howard Preston Richard Storm Mike Piernicky Pat Phillips Brian Ray Peggy Shalla Devin Townsend Ryan Haas Agency Nebraska DOR Director s Office Nebraska DOR Traffic Engineering Nebraska DOR Traffic Engineering Nebraska DOR Highway Safety FHWA Nebraska DMV CH2M HILL CH2M HILL CH2M HILL Olsson Associates Nebraska DMV HWS Consulting Group All Road Barricades MATC MATC The workshop employed a data driven process since each participant was provided information on the expected effectiveness, implementation cost, and implementation timeframe for all strategies discussed by the task team. Further, participants were given a fact sheet that summarized the characteristics of fatalities associated with their CEA (see Chapter 2). Task teams were allowed to modify the list of strategies to add, delete, rewrite, or combine strategies if considered appropriate for Nebraska. At the end of the breakout group, each task team ranked their strategies as high, medium, or low (the edited list of all strategies with rankings is provided in Appendix I). The ranking given to the strategies reflect the task teams assessment of the relative importance and ability of each strategy to address the major factors contributing to traffic fatalities in Nebraska. 3.2 High Priority Strategies and Workshop Voting Results Following the breakout sessions, all participants listened to brief presentations from each of the task team leaders regarding the basis for the selection of the high priority strategies. Next, followed a voting exercise where each participant cast votes for the strategies they believed to have the greatest potential to reduce the number of Nebraska s traffic fatalities and achieve the 2011 safety goal. During the voting exercise, the participants were instructed to vote for only the high priority strategies identified by the small groups. This resulted in one of the key products from the safety summit; list of high priority strategies as well as stakeholder input (i.e., the voting results). This information reflects the professional opinions of the safety summit participants, indicating where they suggest the State should invest its safety resources in order to reduce the number of traffic fatalities. The 23 high priority strategies and voting results, organized by the CEAs, are summarized in Appendix II. MARCH
39 3.3 Selection of Critical Strategies Immediately following the safety summit, the Working Committee concentrated on identifying the top strategies that Nebraska will focus on to achieve the 2011 safety goal. This select group of strategies is known as the Critical Strategies. The process to identify the Critical Strategies was a multi-step process that first began with the safety summit prioritization and voting results, namely the 23 strategies ranked as a high priority by the workshop participants. This information acted as a guide for the Working Committee based on the safety partners recommendations regarding how resources should be invested and allocated. Additionally, the Working Committee elected to add the countermeasure of using cable guardrail in narrow medians and improving roadside guardrail to address lane departure crashes. Also added by the Committee was a countermeasure to perform more compliance checks of alcohol retailers to reduce the sale of alcohol to minors. Finally, the strategy to use roundabouts when and where appropriate was expanded to include other non-conventional geometric designs that may have applications in certain circumstances. The Working Committee made these additions and revisions with the purpose of filling in any areas not sufficiently addressed by the outcomes of the workshop and finally selected a total of 20 Critical Strategies. The selected Critical Strategies do not specifically include an EMS focused strategy. However, the Working Committee did identify that the EMS field can play important roles in the implementation of child and infant seat installation inspections. Specifically, EMS stations could be one location where parents could have a child seat installation inspected and emergency medical technicians could participate in events at community locations. A summary of the 20 Critical Strategies organized by the Four Safety E s is provided in Figure 3.1 while a full description of the strategies by the CEAs is in Table 3.3. It is important to remember that the purpose of the Critical Strategies is not to replace existing safety programs and activities. Instead, the purpose of identifying the Critical Strategies is to help Nebraska supplement existing safety activities/programs and to provide a coordinated, multi-agency focus for Nebraska s safety funds, including NDOR s Highway Safety Improvement Program funds. MARCH
40 FIGURE 3.1 Summary of Nebraska s Critical Strategies Note: Several Critical Strategies had multiple components and addressed more than one of the Four Safety E s The strategies are based on material and guidance in the NCHRP Report 500 series, were prioritized by Safety Partners at a workshop on May 16, 2006 and with concurrence by the Nebraska Interagency Safety Committee. MARCH
41 TABLE 3.3 Nebraska SHSP Critical Strategies 1 Relative Cost Objective Strategy to Implement Lane Departure Strategies Keep vehicles in their lane Keep vehicles from encroaching on the roadside Minimize the likelihood of crashing into an oncoming vehicle Reduce the severity of the crash Impaired Driving Strategies Enforce DUI laws Use cost effective treatments to keep vehicles in their lane. This may include: (1)centerline rumble strips for two-lane roads, (2) shoulder rumble strips on roads with paved shoulders, (3) edgeline profile marking, edgeline rumble strips or modified shoulder rumble strips on section with narrow or no paved shoulders, (4) profiled thermoplastic strips, raised pavement markers, or other methods for centerlines in order to provide better day, night, and wet visibility, and (5) enhanced pavement markings, such as 6 or 8 markings instead of 4 markings or improved day/night/wet visibility. Eliminate shoulder drop-offs by (1) paving shoulders, (2) widening substandard shoulders, and (3) maintaining gravel shoulders along pavement edges in order to keep vehicles from encroaching on the roadside. Assist drives with a safe recovery by (4) adding safety wedges to the edge of pavements. On divided roadways with a narrow-width median, high volumes, high speeds, and/or a combination of these factors, minimize the likelihood of a vehicle crossing the median and crashing into an oncoming vehicle by installing cable median barriers. For run-off-road crashes, reduce the crash severity by (1) improving/updating barriers and attenuation systems and/or (2) shielding roadside objects (such as trees, utility poles, light poles) and steep slopes. Use enforcement to reduce the number of alcohol-related crashes by increasing the number of highly publicized and coordinated (1) DUI checkpoints or (2) saturation patrols. Also enhance DUI enforcement through the use of (3) traditional traffic enforcement. (4) Form state and local law enforcement partnerships to provide greater coverage during enforcement campaigns and also work with regional safety partners help identify target locations, times, etc. for enforcement efforts. Low (Note: some DOTs consider these moderate if extensively applied ) Low Effectiveness Tried/ Experimental Experimental/ May be tried Typical Timeframe for Implementation Short (<1 yr.) to Medium (1-2 yrs.) Medium (1-2 yrs.) Moderate Tried Medium (1-2 yrs.) Moderate to High Proven/Tried Short (<1 yr.) to Medium (1-2 yrs.) Low to High Proven/Tried Short (<1 yr.) 1 The strategies are based on material and guidance in the NCHRP Report 500 series, were prioritized by Safety Partners at a workshop on May 16, 2006 and with concurrence by the Nebraska Interagency Safety Committee. MARCH
42 TABLE 3.3 Nebraska SHSP Critical Strategies 1 Relative Cost Objective Strategy to Implement Impaired Driving Strategies continued Enforce DUI laws Reduce excessive drinking and underage drinking Unbelted Vehicle Occupant Strategies Maximize use of occupant restraints by all vehicle occupants (1) Publicize and enforce zero tolerance laws for drivers under age 21. (2) Encourage parental involvement and attendance in programs/classes and emphasize education and training through the graduated licensing programs. To further discourage drinking and driving, (3) work with courts to discourage diversion programs and plea bargains to non-alcohol offenses (i.e., improve DUI process and conviction rate). (1) Encourage the use of required responsible beverage service policies and training for alcohol servers and retailers, (2) continue to educate the general public, business owners, and alcohol servers on the dangers of impaired driving, (3) consider public policies that would make parents accountable for minors who consume alcohol at their place and then drive, and (4) use targeted education techniques (such as billboards) to reduce excessive drinking and underage drinking. To reduce underage drinking (and driving), increase the number of wellpublicized compliance checks of alcohol retailers to reduce sales to underage persons. To increase safety belt use rate: (1) provide enhanced public information and education to population groups with lower than average restraint use rates, (2) conduct highly publicized enforcement campaigns, and (3) ensure that child and infant restraints are properly used by providing community locations for instruction in proper child restraint use and conducting high profile child restraint inspection events at multiple community locations (involving EMS personnel at inspection locations). To increase safety belt use rate, (1) support adoption of a primary safety belt law and/or (2) strengthen penalties for safety belt violations. Moderate Moderate to High Effectiveness Proven/Tried Proven/Tried Typical Timeframe for Implementation Short (<1 yr.) to Long (>2 yrs.) Short (<1 yr.) to Long (>2 yrs.) Low Tried Short (<1 yr.) Low to High Low Proven/Tried Proven/ Experimental Short (<1 yr.) to Medium (1-2 yrs.) Medium (1-2 yrs.) 1 The strategies are based on material and guidance in the NCHRP Report 500 series, were prioritized by Safety Partners at a workshop on May 16, 2006 and with concurrence by the Nebraska Interagency Safety Committee. MARCH
43 TABLE 3.3 Nebraska SHSP Critical Strategies 1 Relative Cost Objective Strategy to Implement Intersection Strategies Improve management of access near unsignalized intersections Improve sight distance at intersections Improve driver awareness of intersections on approaches Choose appropriate intersection traffic control to minimize crash frequency and severity Reduce operating speeds on intersection approaches Improve safety through data analysis and coordination with local agencies Near unsignalized intersections, use access management techniques to manage conflicts in the influence area of intersections. Improve sight distance at intersections by clearing sight triangles. Increase a driver awareness s when approaching an intersection; whether a STOP controlled, signalized, or thru approach. Techniques for consideration include (1) enhanced warning and guide signing, (2) street lighting, (3) dynamic mainline warning flashers, and (4) advance warning flashers for traffic signals on high speed roadways. At appropriate locations, choose non-conventional intersection designs, such as roundabouts or indirect left-turn treatments. Use targeted speed enforcement to reduce operating speeds on specific intersection approaches. Through crash analysis, identify intersections with a disproportionately large number of fatal and serious injuries crashes. As necessary, improve data collection to enhance analysis of intersection crashes. Effectiveness Typical Timeframe for Implementation Moderate Tried Medium (1-2 yrs.) Low to Moderate Low to Moderate Moderate to High Tried Proven/Tried Proven/Tried Short (<1 yr.) Medium (1-2 yrs.) Medium (1-2 yrs.) to Long (>2 yrs.) Moderate Proven Short (<1 yr.) Low Tried Short (<1 yr.) 1 The strategies are based on material and guidance in the NCHRP Report 500 series, were prioritized by Safety Partners at a workshop on May 16, 2006 and with concurrence by the Nebraska Interagency Safety Committee. MARCH
44 TABLE 3.3 Nebraska SHSP Critical Strategies 1 Relative Cost Objective Strategy to Implement Effectiveness Typical Timeframe for Implementation Young Driver Strategies Implement/improve Establish a more comprehensive graduated licensing system Low Proven/Tried Medium (1-2 yrs.) GDL systems Publicize, enforce, and adjudicate laws pertaining to young drivers Improve young driver training Employ community or school-based strategies Conduct more (1) public information and (2) enforcement campaigns pertaining to young drivers. (1) Require driver training for new drivers and (2) improve driver training materials. Develop community coalition programs focused on young drivers. Moderate to High Moderate to High Low to Moderate Proven/ Experimental Tried/ Experimental Tried Short (<1 yr.) Medium (1-2 yrs.) to Long (>2 yrs.) Short (<1 yr.) 1 The strategies are based on material and guidance in the NCHRP Report 500 series, were prioritized by Safety Partners at a workshop on May 16, 2006 and with concurrence by the Nebraska Interagency Safety Committee. MARCH
45 4. Critical Strategy Plan Summaries The data and information driven prioritization process described in Chapter 3 resulted in the identification of the 20 Critical Strategies that form the backbone of this Plan. These 20 strategies (summary list in Table 4.1) include elements that address all four of the safety Es and data management systems. Further, the Critical Strategies act as an investment guide to supplement existing safety activities in Nebraska and provide a framework for partnerships and coordination of multi-agency traffic safety efforts. The Critical Strategies are based on material and guidance contained in the NCHRP Report 500 series (Implementation of AASHTO s Strategic Highway Safety Plan). Input from Nebraska s Safety Partners was provided at the May 16, 2006 safety workshop with concurrence by the Nebraska Interagency Safety Committee. In order to aid implementation of this Plan, additional information related to that Critical Strategies has been collected. This information in the following plan summaries provides guidance on expected effectiveness, implementation costs, targets, and possible goals. Other information including existing activities, organizational issues, keys to success, responsible agency, and legislative needs, to name a few, was also summarized. The plan summaries for the 20 Critical Strategies have been organized by the five Critical Emphasis Areas. Further, throughout planning and implementation of the Critical Strategies, it is important to keep in mind that combination of strategies will often have the greatest effectiveness. For example, education and outreach can be used to supplement enforcement strategies or increasing enforcement levels to improve driver behavior are likely to have greater effectiveness than using engineering improvements alone. Some of the Critical Strategies rely on enabling legislation or policies in order to be deployed. While still other Critical Strategies may not need enabling legislation, but changes in current laws may aid in implementation or improve the expected outcome. The information regarding needed enabling legislation or desirable legislation is contained in the plan summaries, but a review is also provided in Table 4.1. TABLE 4.1 Summary of Nebraska Critical Strategies Critical Strategy 1 Lane Departure Strategies Page Number Enabling or Desirable Legislation Implement Cost Effective Improvements to Keep Vehicles in Their Lane Keep Vehicles from Encroaching on the Roadside 4-7 None identified None identified. 1 The strategies are based on material and guidance in the NCHRP Report 500 series, were prioritized by Safety Partners at a workshop on May 16, 2006 and with concurrence by the Nebraska Interagency Safety Committee. MARCH
46 TABLE 4.1 Summary of Nebraska Critical Strategies Critical Strategy 1 Lane Departure Strategies continued Page Number Enabling or Desirable Legislation 3. Minimize the Likelihood of Crashing into an Oncoming Vehicle 4-13 None identified. 4. Reduce the Severity of the Crash 4-15 None identified. Impaired Driving Strategies 5. Enforcement to Discourage Drinking & Driving 4-18 None identified. 6. Enforcement and Education to Discourage Underage Drinking and Driving 4-22 Stronger penalties for violating Zero Tolerance Laws would be beneficial in discouraging underage drinking and driving. 7. Broad Based Education Campaigns to Reduce Impaired Driving 4-26 The authority to mandate alcohol server training rests with the Nebraska Legislature and/or the Nebraska Liquor Control Commission. To enhance laws that address adults who allow minors to drink alcohol in their residence (and then drive afterwards), action by the Nebraska Legislature would be necessary. 8. Compliance Checks of Alcohol Retailers 4-29 Public policy initiatives may be necessary to enhance the penalties for selling to minors. Unbelted Vehicle Occupant Strategies 9. Education and Enforcement to Increase Safety Belt Use Among Target Populations 4-31 None identified. 10. Enhanced Laws to Encourage Safety Belt Use 4-35 Enacting a primary safety belt law or to strengthening penalties for not using a safety restraint device is within the authority of the Nebraska Legislature. Intersection Strategies 11. Follow the Principles of Access Management 4-38 A review of Nebraska state laws should be undertaken to identify if there are any gaps in roadway agencies authority to require access change. If gaps are identified, action might be required by Nebraska s Legislature. 12. Improve Sight Distance at Intersections 4-41 Legal authority of highway agencies to control sight obstructions on private property may need to be strengthened. 13. Improve Driver Awareness of Intersections on Approaches 4-43 None identified. 1 The strategies are based on material and guidance in the NCHRP Report 500 series, were prioritized by Safety Partners at a workshop on May 16, 2006 and with concurrence by the Nebraska Interagency Safety Committee. MARCH
47 TABLE 4.1 Summary of Nebraska Critical Strategies Critical Strategy 1 Intersection Strategies continued Page Number Enabling or Desirable Legislation 14. Use Non-Conventional Intersection Designs 4-45 None identified. 15. Targeted Speed Enforcement at Problem Intersections 4-48 Enabling legislation by the Nebraska Legislature is necessary to allow use of automated enforcement. 16. Work with Local Agencies to Identify Intersections with a Severe Crash Problem 4-52 None identified. Young Driver Strategies 17. Comprehensive Graduated Driver Licensing System 4-54 A more comprehensive GDL program would have to be established by the Nebraska Legislature. 18. Education and Enforcement of Laws Directed Towards Young Drivers 4-56 Stronger provisions (curfew and passenger restrictions) and penalties for violating the GDL law would be beneficial in education and enforcement efforts directed towards young drivers. 19. Required Driver Training and Improved Training Materials 4-59 A program requiring driver training relies on enabling legislation from the Nebraska Legislature. 20. Safe Community Coalitions 4-62 None identified. 1 The strategies are based on material and guidance in the NCHRP Report 500 series, were prioritized by Safety Partners at a workshop on May 16, 2006 and with concurrence by the Nebraska Interagency Safety Committee. Finally, it should be noted that the Goals section of each Plan Summary was revised after completion of the analysis of the alternative safety investment scenarios described in Chapter 5 (summaries provided in Table 4.2). Each of the revised Goals for the Critical Strategies is consistent with the outcome of the investment analyses, describes realistic expectations relative to possible crash reductions, documents likely synergies associated with combining strategies and identifies feasible implementation goals consistent with deployment costs and funding limitations. The combination of the details in the Plan summary for each Critical Strategy plus the results of the analyses of alternative safety investment scenarios (as documented in the next chapter) provides valuable insight about how Nebraska can best achieve the adopted safety goal 1.0 fatalities per 100 million vehicle miles of travel by This information suggests the need for a new approach to implement Nebraska s Safety Program more comprehensive (including education, enforcement, and EMS in addition to engineering strategies), more systematic (a focus on strategies that are more directly linked to crash causation), integrated (all roads) and with a balance between reactive and proactive components of the Plan. MARCH
48 TABLE 4.2 Overview of Goals for Critical Strategies Lane Departure Strategies Critical Strategy 1 Expected Crash Reduction Possible Implementation Goal 1. Implement Cost Effective Improvements to Keep Vehicles in Their Lane 5% to 35% reduction of lane departure crashes. None identified. 2. Keep Vehicles from Encroaching on the Roadside 5% to 15% reduction of lane departure crashes. None identified. 3. Minimize the Likelihood of Crashing into an Oncoming Vehicle 90% reduction in cross-median fatalities. None identified. 4. Reduce the Severity of the Crash Impaired Driving Strategies Reduce likelihood of a fatality by up to 90% in the event of a collision. None identified. 5. Enforcement to Discourage Drinking & Driving 10% to 15% reduction of alcoholrelated crashes. 15,000 additional hours of special overtime alcohol-related enforcement Sobriety checkpoints at least three times annually in each of the 10 most populated counties 6. Enforcement and Education to Discourage Underage Drinking and Driving 10% to 20% reduction of alcoholrelated crashes involving an underage drinking driver. 2,000 additional hours of special overtime alcohol-related enforcement for underage drivers Create a program that reaches at least 500 parents of newly licensed teens and educate the court systems in the most populated areas 7. Broad Based Education Campaigns to Reduce Impaired Driving 5% to 23% reduction of alcoholrelated crashes. Enhance policy regarding beverage server training by 2008 Create a program that reaches at least 500 parents of newly licensed teens and educate the court systems in the largest populated areas 8. Compliance Checks of Alcohol Retailers See Plan Summary for discussion. Increase the number of compliance checks by 25% 1 The strategies are based on material and guidance in the NCHRP Report 500 series, were prioritized by Safety Partners at a workshop on May 16, 2006 and with concurrence by the Nebraska Interagency Safety Committee. MARCH
49 TABLE 4.2 Overview of Goals for Critical Strategies Critical Strategy 1 Expected Crash Reduction Possible Implementation Goal Unbelted Vehicle Occupant Strategies 9. Education and Enforcement to Increase Safety Belt Use Among Target Populations See Plan Summary for discussion. 2,000 additional hours of special overtime enforcement for safety belts Increase public education campaigns so that message reaches an additional 10% of the population 10. Enhanced Laws to Encourage Safety Belt Use Reduction of up to 20 unbelted vehicle occupant fatalities. Adopted a primary safety belt law and/or enhance penalties by 2008 Intersection Strategies 11. Follow the Principles of Access Management Up to 30% reduction of accessrelated intersection crashes. None identified. 12. Improve Sight Distance at Intersections 20% reduction of sight distancerelated intersection crashes. None identified. 13. Improve Driver Awareness of Intersections on Approaches 5% to 25% of intersection crashes. None identified. 14. Geometric Improvements to Improve Intersection Safety 40% to 90% reduction of intersection crashes. Widespread as possible at locations that could benefit from these countermeasures 15. Targeted Speed Enforcement at Problem Intersections Nearly 30% reduction in speedingrelated crashes. Widespread as possible at locations that could benefit from speed enforcement 16. Work with Local Agencies to Identify Intersections with a Severe Crash Problem See Plan Summary for discussion Assist local agencies identify the top 10% of high crash locations 1 The strategies are based on material and guidance in the NCHRP Report 500 series, were prioritized by Safety Partners at a workshop on May 16, 2006 and with concurrence by the Nebraska Interagency Safety Committee. MARCH
50 TABLE 4.2 Overview of Goals for Critical Strategies Young Driver Strategies Critical Strategy 1 Expected Crash Reduction Possible Implementation Goal 17. Comprehensive Graduated Driver Licensing System Nearly 20% reduction in crashes involving young drivers. Enhance existing GDL program by Education and Enforcement of Laws Directed Towards Young Drivers See Plan Summary for discussion 2,000 additional hours of special overtime enforcement for underage drivers Increase public education campaigns so that an additional 10% of young drivers hear message 19. Required Driver Training and Improved Training Materials 5% reduction in crashes involving young drivers. 10% increase the number of teens that participate in a formal driver education course 20. Safe Community Coalitions 24% reduction in crashes involving young drivers. Initiate ten new safe community coalitions 1 The strategies are based on material and guidance in the NCHRP Report 500 series, were prioritized by Safety Partners at a workshop on May 16, 2006 and with concurrence by the Nebraska Interagency Safety Committee. MARCH
51 4.1 Lane Departure Critical Strategies Strategy 1. Implement Cost Effective Improvements to Keep Vehicles in Their Lane Definition Use cost effective treatments to keep vehicles in their lane. This may include: (1) centerline rumble strips for two-lane roads, (2) shoulder rumble strips on roads with paved shoulders, (3) edgeline profile marking, edgeline rumble strips (sometimes known as rumble stripes) or modified shoulder rumble strips on sections with narrow or unpaved shoulders, (4) profiled thermoplastic strips, raised pavement markers (RPM s), or other methods for centerlines in order to provide better day, night, and wet visibility, and (5) enhanced pavement markings, such as 6 or 8 wide markings instead of 4 wide markings for improved day/night/wet visibility. Technical Description This strategy employs a variety of low-cost treatments that are intended to assist drivers with staying in their lane to prevent run-off-road and head-on crashes. Some devices and applications are intended specifically for two-lane, two-way roadways (i.e., centerline rumble strips and enhanced centerline markings) while the remaining can also be deployed on multilane, divided facilities. Further, many of the treatments are relatively low-cost which allow for preventative deployment (i.e., all corridors) in addition to reactive deployment (i.e., along high-crash corridors or at problem locations). These strategies are intended to assist the drivers that unintentionally have left their lane and either entered the roadside or an opposing lane. This suite of treatments does not address head-on crashes where a driver intentionally entered the opposing lane to complete a passing maneuver. Target(s) Goal Responsive and Preventative Plans This strategy targets crashes involving a vehicle that ran-off the road or struck another vehicle head-on (including sideswipe crashes) when it entered the opposing lane. This strategy can be used to target crashes on either divided or undivided roadways and also on low or high speed facilities. The statewide safety goal is approximately a 27% reduction in the number of traffic fatalities forecasted to occur in Since the listed countermeasures are expected to be 5% to 35% effective, most of the state s roadway system would need to be improved in order to reach the statewide goal. Therefore, this strategy should be part of a comprehensive program to prevent lane departure fatalities. (Note: For example, a comprehensive program may also utilize enforcement to reduce drinking and driving or encourage passengers to wear safety belts in order to prevent lane departure fatalities.) Because the actual location of fatal and disabling injury crashes is considered to be random, deploying these strategies along short segments in reaction to one serious crash is unlikely to prevent a significant number of crashes. As a result, this strategy consists of both a responsive and preventative component. First, these strategies could be deployed responsively along an entire corridor that has a documented safety problem related to lane departures. The preventative component would be to implement the strategies at locations that have an increased probability of a fatal or disabling injury crash (based on facility type, cross-section, and volume), and possibly across the entire road network given enough time and resources. A prioritized plan for a system wide implementation should be based on facility design, crash history, functional classification, volume, or a combination of these or similar factors. MARCH
52 Strategy 1. Implement Cost Effective Improvements to Keep Vehicles in Their Lane Expected Effectiveness (Tried/Experimental) The effectiveness will depend upon the specific strategy chosen and on the specific locations selected for deployment. Also, combining strategies based on local conditions may prove to be more effective than selecting a single strategy, but it is important to remember the effectiveness ratios cannot simply be added together. Past studies have found varying results for most strategies, but some general guidance regarding expected effectiveness found in the NCHRP Report 500 series is provided below. Centerline rumble strips on two-lane roadways = 30 60% head-on crash reduction has been reported on roadways that were high crash sites. Note: treatment of only high crash sites does not account for regression to the mean, so the results may be slightly overstated. (Volume 4, Strategy 18.1 A1) Shoulder rumble strips = FHWA reports a 20 50% reduction in the number of ROR crashes on freeways. The effectiveness on two-lane roadways has been reported as unstudied. (Volume 6, Strategy 15.1 A1) Enhanced Pavement Markings = Results for wider pavement markings and use of RPM s is not definitive. Some studies have found no benefit from wider edge lines, while a New York study found 8 wide edgelines reduced total and injury crashes by an additional 5% and fixed object crashes by extra 15% when compared to installations with 4 wide edgelines. Studies in New Jersey, Ohio and New York have found RPM s generally effective when used at appropriate locations. New Jersey determined benefitcost ratios of 15 ranging up to over 25 for several projects. In Ohio, RPM s reduced crashes by 9.2% and injuries by 4.9%. And in New York, RPM s reduced crashes by 19% at high-crash locations. (Volume 6, Strategy 15.1 A6). For detailed information regarding the effectiveness for these treatments, more information is available in the NCHRP Report 500 series. Keys to Success Potential Difficulties Implementation along a corridor can be effective if a known, documented safety deficiency exists. However, implementation at a specific location or along a short segment in reaction to a fatal or high profile crash is unlikely to provide a significant safety benefit, especially in the short-term. After addressing crash locations that are significantly higher statistically than expected (responsive deployment), a prioritized systematic deployment should be more effective at preventing fatal and injury crashes (preventative deployment). Also, many of these strategies can be combined with routine roadway maintenance or added during roadway overlays in order to reduce the cost, allowing for a wider deployment across a system. A typical issue for many agencies is the maintenance associated with each strategy. Agencies need to consider the maintenance cost over time since pavement markings need to be replaced on a regular basis. Also, rumble strips may cause problems for bicyclists and motorcyclists, especially on roadways with narrow paved shoulders. For shoulder rumble strips, there is currently no proven design for roads with gravel shoulders or narrow paved shoulders (i.e, less than two feet). Another issue many agencies face is complaints by residents regarding the noise levels. Several states have encountered a few difficulties with RPM s placed in asphalt due to winter conditions. According to reports from these states, the asphalt deteriorates as it is apparently weakened by freeze-thaw cycles. If the pavement is not inspected and maintained, the devices may eventually come loose. No similar issues have been observed with RPM s placed in concrete pavement. MARCH
53 Strategy 1. Implement Cost Effective Improvements to Keep Vehicles in Their Lane Appropriate Measures and Data A process measurement for the listed treatments is the number of miles of roadway that are improved. Safety benefits of implemented treatments can be determined by monitoring crash data for run-off-road and head-on (including sideswipe opposite direction) crashes. The crash severity may also change for the roadway as head-on and run-off-road crashes have a large potential to result in a fatality or disabling injury. Because of the random nature and the relative low density of these kinds of crashes across a system, consideration should also be given to the review of other non-crash related performance measures, such as maintenance records for markings and sampling the navigational success of vehicles through curves with portable video cameras. Organizational and Institutional Champion Organizational, Institutional, and Policy Issues Issues Affecting Implementation Time Costs Involved Training and Other Personnel Needs Legislative Needs NDOR, county and city highway/roadway agencies. These treatments are relatively easy to implement and will typically not require coordination among multiple agencies. With respect to institutional and policy issues, state, county, and city highway/roadway agencies may want to review installation guidelines and criteria for consistency of application. Guidelines should also be reviewed to ensure that they do not prohibit deployment. For example, a policy that allows shoulder rumble strips only on paved shoulders with a minimum width of six feet could prevent many locations from receiving the improvement. However, using rumble stripes on roads with narrower shoulders may still provide similar safety benefits while at the same time accommodating other needs (such as bicyclists ). After guidelines are developed and/or revised, they should be periodically evaluated for consistency with the latest research findings. Most of these strategies are relatively easy to implement and could be implemented in as little as one or two years. Some treatments, such as wider pavement markings, could be instituted immediately into annual re-striping programs. The part of the process which may have the greatest potential to delay implementation is developing a prioritized list of locations for deployment. The per mile costs of these treatments is classified as low. However, large deployments of these treatments may total up to a moderate cost project. The per mile costs of all listed treatments is expected to be several thousand dollars per mile, or even less. Examples include: centerline rumble strips at $1000 per mile, edgeline rumble strips at $2000 per mile, and wide pavement markings at $500/mile. (Note: The costs are intended to represent an average expected cost for Nebraska and assumes the pavement is in relatively good condition.) The construction costs could possibly be even lower if combined with existing maintenance activities, such as an asphalt overlay. Most highway/roadway agencies could implement these strategies with existing staff, whether as stand alone safety projects or part of existing maintenance activities. At some agencies, a little training may be needed in the areas of design and implementation of these strategies. Also, engineers may need some training to improve their ability to identify the appropriate strategy (or combination of strategies) to deploy given the specific corridor conditions and crash history. None Identified. MARCH
54 Strategy 2. Keep Vehicles from Encroaching on the Roadside Definition Description Target(s) Goal Eliminate shoulder drop-offs by (1) paving shoulders, (2) widening substandard shoulders, and (3) maintaining gravel shoulders to pavement edges in order to keep vehicles from encroaching on the roadside. Assist drivers with a safe recovery by (4) adding safety wedges to the edge of pavements. Technical This strategy employs a variety of pavement edge drop-off treatments to reduce lane departure crashes. The primary target is run-off-road crashes; however, excessive pavement drop-offs can also lead to head-on crashes on undivided facilities if drivers over correct when trying to get back onto the roadway. Many of these treatments would involve upgrading facilities that currently have deficient shoulders or may not meet minimum standards. Therefore, many of the listed treatments would likely not be considered a lowcost project. Also, adding safety wedges to pavement edges does not eliminate or move the drop-off further from the travel lane (like the other treatments); instead it helps reduce tire scrubbing and assists the driver to safely re-enter the travel lane. The crash types targeted with this strategy include (1) crashes involving a vehicle that has run-off-the-road and struck a fixed object or overturned; and (2) head-on or sideswipe (opposing direction) crashes on undivided roadways. The statewide safety goal is approximately a 27% reduction in the number of traffic fatalities forecasted to occur in Since the listed countermeasures are expected to be 5% to 15% effective, the entire roadway system would need to be improved in order to help reach the statewide goal. Therefore, this strategy should be part of a comprehensive program to prevent lane departure fatalities. (Note: For example, a comprehensive program may also utilize enforcement to reduce drinking and driving or encourage passengers to wear safety belts in order to prevent lane departure fatalities.) Since some of the countermeasures are experimental, they should be part of a test deployment to document expected crash reductions using data derived in Nebraska. Responsive and Preventative Plans Expected Effectiveness The responsive plan would be to implement the strategies along corridors and at locations with a crash rate statistically significantly higher than the average (i.e., above the critical crash rate). The preventative plan would be to first implement the strategies at locations that have an increased probability of having a fatal or serious injury crash problem (based on variables such as traffic volume, crash history, existing shoulder type and condition, geometric alignment, and other factors that contribute to lane departure crashes). The second step of the preventative plan would be to implement and maintain the strategies over as much of the road network as possible as a part of 3R improvements, safety projects, or as resources allow. (Tried/Experimental) The effectiveness will depend upon the specific strategy chosen and on the specific locations selected for deployment. Also, combining strategies based on local conditions may prove to be more effective than selecting a single strategy, but it is important to remember the effectiveness ratios cannot simply be added together. Past studies have found varying results for most strategies, but some general guidance regarding expected effectiveness found in the NCHRP Report 500 series is provided below. Pave shoulders. The expected effectiveness varies depending on initial shoulder width and surface type; the highest expected reduction in related crashes (i.e., run-off road, head-on, sideswipe opposite direction) is approximately 12%. (Volume 6, Strategy 15.1 A8, Exhibit V- 18) MARCH
55 Strategy 2. Keep Vehicles from Encroaching on the Roadside Shoulder widening. The expected effectiveness varies depending on initial shoulder width, final shoulder width, shoulder surface type, and ADT; but at an ADT of over 2,000 vpd, a road with no shoulder that is widened to have an 8 shoulder would expect a 42% reduction in single vehicle run-off-road and multiple vehicle opposite-direction crashes (this is the greatest expected reduction). (Volume 6, Strategy 15.1 A8, Exhibit V-17) Maintain gravel shoulders. The quantifiable expected effectiveness is currently unknown. Safety wedge. The expected effectiveness is difficult to quantify because the percentage of lane departure or head-on crashes caused by overcorrection of vehicles that have first run off the road is unknown. Whatever the percentage, one study concluded that a 45- degree-angle asphalt fillet at the lane edge would virtually eliminate this type of crash, even in cases where the shoulder is unpaved and there is erosion adjacent to the pavement edge. (Volume 6, Strategy 15.1 A8) For additional information regarding the effectiveness for all strategies, refer to the NCHRP Report 500 series. Keys to Success Potential Difficulties Due to the random nature of crashes, implementation on a more system-wide basis will lead to greater success. After addressing crash locations that are significantly higher statistically than expected (responsive deployment), a prioritized systematic deployment will be more effective at preventing fatal and serious injury crashes (preventative deployment). Also, some of these strategies can be combined with routine roadway maintenance or 3R projects in order to reduce the cost and gain wider deployment across the system. For roadways with narrow top widths, additional right-of-way and regrading may be necessary to accommodate wider shoulders. In these cases, other strategies such as edgeline rumble strips may be more cost-effective. Wider paved shoulders that are added to high speed roadways with poor alignment and hazardous roadsides could possibly lead to higher speeds and resultant increases in crash frequency and severity. Monitoring of these types of roadways is advised. Some modifications to paving equipment and construction practices will be needed for implementation of safety wedges. Coordination with the construction industry is recommended. Appropriate Measures and Data A process measurement for the listed treatments is the number of miles of roadway that are improved. Safety benefits of implemented treatments can be determined by monitoring crash data for run-off-road and head-on (including sideswipe opposite direction) crashes. The crash severity may also change for the roadway as head-on and run-off-road crashes have a large potential to result in a fatality or disabling injury. Organizational and Institutional Champion Organizational, Institutional, and Policy Issues NDOR, county and city highway/roadway agencies. These strategies are relatively easy to implement and will typically not require coordination among multiple agencies. State, county, and city highway/roadway agencies may want to review their 3R and maintenance practices to determine if some of the strategies can be implemented and maintained as part of this work. Also guidelines may be helpful to designers for selecting the most appropriate treatment for a particular roadway. MARCH
56 Strategy 2. Keep Vehicles from Encroaching on the Roadside Issues Affecting Implementation Time Costs Involved Implementation of shoulder paving and shoulder widening could be started in a short period of time. Full implementation would be dependent on prioritization and funding of projects. Some treatments, such as maintaining gravel shoulders, could be implemented immediately into annual maintenance programs. Coordination with the construction industry would be needed before implementation of the safety wedge. The costs of this strategy range from low to medium, depending on the strategy chosen, the local conditions, and the size of the project. The following costs are intended to represent an average expected cost for Nebraska, but these costs could change substantially depending on issues such as the existing top width of the roadway, available right-of-way, etc. Maintaining gravel shoulders is estimated at several thousand dollars per mile. Once contractors have modified their equipment and construction practices, the cost of safety wedges when done in conjunction with 3R projects should be similarly low. Projects with costs in the medium range include paving shoulders at an estimated $100,000 per mile and widening shoulders at an estimated $200,000 per mile. Training and Other Personnel Needs Legislative Needs Most highway/roadway agencies could implement these strategies with existing staff. Some training would be useful to construction staff on any inspection issues associated with the safety wedge. Some training and guidelines would be helpful to designers for selecting appropriate treatments. None Identified. MARCH
57 Strategy 3. Minimize the Likelihood of Crashing into an Oncoming Vehicle Definition On divided roadways with a narrow-width median, high volumes, high speeds, and/or a combination of these factors, minimize the likelihood of a vehicle crossing the median and crashing into an oncoming vehicle by installing cable median barriers. Technical Description Where appropriate, install cable median barrier to prevent cross-median crashes on divided facilities. Recently, there have been improvements to these systems (i.e., four-strand, hightension systems) which are rated to bring heavy vehicles safely to a stop. Unlike the first two strategies, this treatment does not prevent a crash from happening, but instead has a purpose of preventing a crash from resulting in a fatality or serious injury. Target(s) Goal This strategy targets crashes where a vehicle crosses the median and collides with one or more vehicles traveling in the opposite direction. These types of crashes are normally very severe, involving head-on crashes at high speeds. The statewide safety goal is approximately a 27% reduction in the number of traffic fatalities forecasted to occur in The countermeasure is expected to be up to 90% effective at preventing a cross-median fatality, but there are relatively few across-median fatalities when compared to total lane departure fatalities. Therefore, this strategy should be part of a comprehensive program to prevent lane departure fatalities. (Note: For example, a comprehensive program may also utilize enforcement to reduce drinking and driving or encourage passengers to wear safety belts in order to prevent lane departure fatalities.) Roadway segments with the greatest number of across-median fatalities (or segments with similar volumes, speeds, and design) should be a primary focus. Responsive and Preventative Plans Expected Effectiveness Keys to Success The responsive component of the implementation plan would involve installation of cable barrier along highway segments where the crash history demonstrates an existing crossmedian crash problem. Due to the rare nature of cross-median crashes, identifying where clusters of crashes have occurred is an effective approach for identification of problem locations rather than focusing on crash rates. The preventative component would involve installation of cable barrier at locations where site conditions indicate an increased probability of cross-median crashes. Variables to consider would include median width, traffic volume (including peak volumes), crash history, speeds, geometric alignment, and proximity to interchanges or areas with a high degree of weaving and lane changing. Some states have established warrants for median barrier that are more aggressive than the guidelines in the AASHTO Roadside Design Guide. Warrants specific to Nebraska could be another part of the preventative plan. Less than 9% of crashes with weak-post barrier (cable barrier would be included in this category) resulted in an injury or fatality. (Volume 4, Strategy 18.1 B2) Not all vehicles that run off the road into the median will cross over into oncoming lanes. Not all vehicles that cross into oncoming lanes will collide with traffic. But, for cross-median crashes that would otherwise occur, impact with a cable median barrier will greatly reduce the probability that the outcome will be a fatality or serious injury. Installing cable median barrier at locations with an existing cross-median crash problem is a good first step, but due to the rare and random nature of these crashes, the preventative component of the plan is especially important. The roadway and traffic characteristics that contribute to an increased risk of cross-median crashes should be identified. This is then followed by a preventative program where cable median barrier is installed on a more system-wide basis on the highways that have these high-risk characteristics. MARCH
58 Strategy 3. Minimize the Likelihood of Crashing into an Oncoming Vehicle Potential Difficulties Appropriate Measures and Data Potential difficulties include: Concerns about the maintenance needs of cable median barrier, as well as mowing and weed control. Several proprietary cable systems have come on the market in recent years that are easier to maintain. Although crash severities will decrease, the introduction of barriers will increase crash frequency. Steep median slopes may be a limitation at some locations. Limited crash testing has been conducted with cable barriers installed on steep slopes. Some states have installed the barrier along the edge of the median shoulder, on one side or the other, when faced with this site constraint. The number of barrier impacts and the crash severity. Any penetrations of the barrier should be recorded. This type of data and some additional crash testing prompted North Carolina DOT to adjust the lateral placement of the cable barrier within the median. Organizational and Institutional Champion Organizational, Institutional, and Policy Issues Issues Affecting Implementation Time Costs Involved NDOR. The AASHTO Roadside Design Guide provides some general guidance on when cable barrier should be considered, based on traffic volumes and median widths. Several states have developed state-specific warrants or guidelines for where median barrier should be installed. Implementation time is short unless there are issues with median slopes, deflection space, or other site specific issues that make the use of cable median barrier more challenging. It is important that maintenance personnel are trained on how to maintain the system before it is installed. The cost of cable median barrier is approximately $80,000/mile (this does not include the costs of any median grading or paving). Annual maintenance costs such as mowing, post replacement, and general maintenance of the barrier should also be considered. Many states are using socketed systems to reduce repair time and cost. With these systems the posts are inserted into steel sleeves that are embedded in concrete. This allows posts damaged after an impact to be manually removed and replaced. Training and Other Personnel Needs Most highway/roadway agencies could implement this strategy with existing staff. Depending on how much additional barrier is added and how often it is impacted, there may be some additional needs for maintenance staff. Training may be needed for maintenance personnel if new barrier systems are being used. Some training and guidelines would also be useful for designers so that they understand barrier deflection requirements, placement location within the median and other design issues that influence both the barrier s safety performance and how it can most efficiently be maintained. Legislative Needs None Identified. MARCH
59 Strategy 4. Reduce the Severity of the Crash Definition For run-off-road crashes, reduce the crash severity by (1) improving/updating barriers and attenuation systems and/or (2) shielding roadside objects (such as trees, utility poles, light poles) and steep slopes. Technical Description Target(s) Goal Responsive and Preventative Plans Expected Effectiveness Keys to Success These treatments will not prevent a crash from occurring, but instead can reduce the severity and the likelihood of a fatality or serious injury resulting from the crash. This strategy first addresses the issue of replacing guardrail and impact attenuators that no longer meet current standards. This may be due to designs that are no longer considered acceptable, or systems that have aged or been damaged and may not perform sufficiently. Also guardrail or impact attenuators can be added at locations where such systems are needed but currently not in place. This strategy targets crashes involving a vehicle that runs off the road and strikes a fixed object or overturns. The statewide safety goal is approximately a 27% reduction in the number of traffic fatalities forecasted to occur in The countermeasures have high expected effectiveness (i.e., shielding a hazardous roadside object would reduce the likelihood of a fatality by up to 90% in the event of a collision); but the cost per mile would likely prohibit immediate system wide deployment. Therefore, this strategy should be part of a comprehensive program to prevent lane departure fatalities. (Note: For example, a comprehensive program may also utilize enforcement to reduce drinking and driving or encourage passengers to wear safety belts in order to prevent lane departure fatalities.) Because the location of fatal and disabling injury crashes is random, deploying these strategies along short segments or at spot locations in reaction to one serious crash is unlikely to prevent a significant number of crashes. As a result, this strategy consists of both a responsive and preventative component. First, these strategies could be deployed responsively along an entire corridor that has a documented safety problem related to lane departures. The preventative plan would be to first implement the strategies at locations that have an increased probability of having a fatal or serious injury crash problem (based on variables such as traffic volume, crash history, steep roadside slopes or a large number of fixed objects along the roadside, poor alignment, poor shoulders, and other factors that contribute to run-off-road crashes). The second step of the preventative plan would be to implement and maintain the strategies over as much of the road network as possible as a part of 3R improvements, safety projects, or as resources allow. (Tried/Experimental) Currently, there are limited studies on the effectiveness of upgrading out-of-date guardrail and other safety hardware. Effectiveness is based primarily on how the various systems performed under current crash test criteria. There are a variety of newer terminals on the market which have passed these crash tests, several of which have energy absorbing and redirective capabilities when impacted. Many states have observed that impacts with even older terminals (like turned-down and blunt-end terminals) can result in very severe crashes. Crash frequencies may increase with the installation of additional barrier, relatively close to the roadway, but crash severities should decrease as impacts with safety hardware are much less likely to result in a fatal or serious injury as compared to an unimpeded run-off-road crash. Implementation at a specific location or along a short segment in reaction to a fatal or high profile crash is unlikely to make a significant impact on the number of fatal and serious injury crashes. After addressing crash locations that are significantly higher statistically than expected (responsive deployment), a prioritized systematic deployment should be more effective at preventing severe crashes (preventative deployment). It may be possible to accomplish some of the simpler, lower-cost upgrades with maintenance work. Periodic upgrades to safety hardware and reevaluating where guardrail should and should not be installed can also be a part of safety improvements on 3R projects. MARCH
60 Strategy 4. Reduce the Severity of the Crash Potential Difficulties Appropriate Measures and Data Concerns about the maintenance needs of additional barrier maintenance of the barrier itself as well as mowing, weed control, and snow drifting. Some barrier may have been installed in the past where it is not needed and could be removed. Also, longer-term, more expensive projects such as slope flattening and removal/relocation of fixed objects may eliminate the need for barrier in some areas. Although crash severities will decrease, the introduction of barriers may increase crash frequency in some areas. For some features, such as upgrading impact attenuators and guardrail terminals, the best measure is the number of locations improved. For other features, such as barrier that has been upgraded or added, the length of improvements is a better measure. Effectiveness of the strategies can be determined by monitoring crash data for lane departure crashes and paying particular attention to crash severities, which are expected to decrease. Organizational and Institutional Champion Organizational, Institutional, and Policy Issues Issues Affecting Implementation Time Costs Involved NDOR, county and city highway/roadway agencies. These treatments are relatively easy to implement and will typically not require coordination among multiple agencies. Guidelines for maintenance and 3R projects should be reviewed to determine if some of these strategies could be implemented as a part of that work. This could decrease the timeframe needed for a more preventative, system-wide implementation, as well as establish a mechanism for ongoing monitoring and updating of systems. Projects to update or add safety hardware can be designed quickly and could be implemented in a short timeframe. The part of the process which may have the greatest potential to delay implementation is developing a prioritized list of locations for deployment. The cost of this strategy is classified as moderate. The following costs are intended to represent an average expected cost for Nebraska, but these costs will vary depending on specific site conditions, size of the project, and the type of safety feature selected: Impact attenuator: $20,000. Guardrail terminal: $1500. Guardrail transition (connection to bridges or concrete barrier): $1000. w-beam or cable guardrail: $75,000/mile. Training and Other Personnel Needs Highway/roadway agencies may be able to implement these strategies with existing staff. Depending on how much additional barrier is added and how often it is impacted, there may be some additional needs for maintenance staff. Also, if new safety features are being used, training for maintenance personnel on repair and on-going maintenance should be provided. Training and guidelines are recommended for designers so they understand the various systems how they function, where they are appropriate for use, and how they should be designed (issues such as length of barrier, deflection requirements, approach slopes, etc.). Legislative Needs None Identified. MARCH
61 4.2 Impaired Driving Critical Strategies Strategy 5. Enforcement to Discourage Drinking & Driving Definition Use enforcement to reduce the number of alcohol-related crashes by increasing the number of: (1) DUI checkpoints (2) Saturation patrols. Also enhance DUI enforcement through the use of (3) Enhanced traditional traffic enforcement. (4) Form state and local law enforcement partnerships to provide greater coverage during enforcement campaigns and also work with regional safety partners to help identify target locations, times, etc. for enforcement efforts. All of the enforcement efforts will be highly publicized and coordinated to achieve greater impact and success. Technical Description DUI checkpoints are predetermined locations where law enforcement officers stop passing motorists and then assess the driver s condition to ensure they are not impaired. A saturation patrol floods with patrols dedicated to traffic enforcement, in an area during a defined time frame with a focus on identifying, stopping, and arresting impaired drivers. Traditional traffic enforcement can also effectively reduce drinking & driving and thereby affect behaviors that result in crashes. An Indianapolis study cited in NCHRP Report 500, Volume 16 stated that most DUI arrests were persons stopped for speeding. So it is important that all officers are properly trained to be able to identify drivers that are under the influence of alcohol or drugs. This strategy advocates conducting DUI checkpoints and saturation patrols coordinated throughout Nebraska. The frequency, location and duration for statewide enforcement should be worked out cooperatively by state and local law enforcement agencies. However, these efforts should be carefully considered to achieve best results possible given available resources. This review can include a focus on areas with a high number of related crashes (engineers can assist with this) and/or past citations issued. Agencies should also consider using alternative enforcement methods to keep officers from becoming burned out and to keep the public from becoming accustomed to seeing one type of enforcement. Also, one of the keys to an effective enforcement program is increasing public awareness and visibility of the efforts. This includes highly publicizing the programs and the results (i.e., number of arrests and citations). Target(s) The real strength of DUI checkpoints and saturation patrols is deterring drinking and driving through increasing a driver s perception they will be caught. Achieving this outcome has been found to be effective at reducing drinking and driving. MARCH
62 Strategy 5. Enforcement to Discourage Drinking & Driving Goal The statewide safety goal is approximately a 27% reduction in the number of traffic fatalities forecasted to occur in Each countermeasure is expected to reduce alcohol-related crashes by 10% to 15% if deployed statewide; therefore, using more than just one program may be sufficient to achieve an overall 25% reduction in alcohol-related fatalities. (Note: The 2006 Nebraska CHSP set a goal to reduce alcohol-related fatal, disabling injury, and visible injury crashes by 4% while increasing the number of alcohol-related arrests 5%.) The optimum frequency, duration, and density of enforcement efforts should be determined through experience. However, an example of an initial implementation goal would be conducting enforcement operations that result in 15,000 additional hours of special overtime alcohol-related enforcement. As part of this additional enforcement, sobriety checkpoints could be conducted at least three times annually in each of the 10 largest populated counties in the state. Responsive and Preventative Plans Expected Effectiveness Highly publicized, statewide DUI checkpoints and saturation patrols should emphasize a preventative plan to reduce alcohol-related fatalities. This plan should be implemented by concentrating checkpoints and patrols along corridors or in areas that have a frequency or rate of alcohol-related crashes higher than expected. Using traditional traffic enforcement to enhance DUI detection, again, could be a preventative safety strategy. (Proven/Tried) As reported in NCHRP Report 500, Volume 16 (Strategy 5.1 B1), DUI checkpoints coupled with a public information program have been found to reduce alcoholrelated crashes by 10% - 30% in several studies. NHTSA has estimated that visible, routine use of DUI checkpoints will reduce alcohol-related fatalities by 15%. In the discussion of saturation patrols and traditional traffic enforcement (Strategy 5.1 B2), the authors reviewed a five year program from Massachusetts that was targeting drinking & driving, speeding, safety belt use, and other moving violations. At the end of the program, there was a 42% reduction in fatal alcohol-related crashes. Saturation patrols and DUI checkpoints are currently used in Nebraska. A summary of previous activities and effectiveness specific to Nebraska is provided below (from the Nebraska Office of Highway Safety). In 2005, the Nebraska Office of Highway Safety (NOHS) awarded a total of 137 minigrant contracts for overtime-selective alcohol enforcement to 56 different agencies. In addition to the Nebraska State Patrol and the Nebraska Game and Parks Commission, This includes 54 different county sheriffs offices and local police departments. A total of 14,989 hours of additional enforcement in the form of sobriety checkpoints, underage drinking law enforcements, and saturation patrols, was initiated. The Omaha Police Department initiated Project Night Life, with grant funding that targets 15 to 19 year old drivers between the hours of 12:00 a.m. and 6:00 a.m. During the project period, a total of 578 official citations were issued. This included 41 DWI s. To support the enforcement, the NOHS provided 233 preliminary breath testing instruments to a total of 58 different agencies. These aid in establishing breath alcohol presence at the time of arrest. The NOHS provided funding assistance to twenty local law enforcement agencies to purchase a total of 47 in-car camera systems to assist in documenting alcohol violation evidence. NOHS supported training related to alcohol enforcement activities. Training was provided to 192 officers in Standard Field Sobriety Training (SFST). A total of 139 officers were trained in the use of the in-car camera system to document DWI evidence and 15 other officers were provided with other alcohol enforcement related training. In 2005, Nebraska s alcohol crash rate per 100 million vehicle miles traveled declined from 10.3 in 2004 to 9.6 in Driving while intoxicated arrests increased from 14,148 in 2004 to 14,525 in DWI convictions increased from 11,016 in 2004 to 11,357 in MARCH
63 Strategy 5. Enforcement to Discourage Drinking & Driving In addition to addressing drinking & driving and alcohol-related crashes, special enforcement programs have the potential to address other areas (i.e., spill over effect). This is demonstrated by the number of citations and arrests for other violations, such as speeding, drug use and possession, operating with a suspended license, and other moving violations (information on citations and arrests available in press releases on the Nebraska State Patrol webpage). Keys to Success As indicated, a regular cycle of performing checkpoints should be maintained, but the location and frequency should be varied so that drivers can t predict when and where the checkpoints will occur. Also, a campaign to make certain the public knows that the State is conducting regular, statewide checkpoints and how many stops, citations, and arrests are made during each campaign will help improve the effectiveness of the strategy. Often overlooked in a safe checkpoint program is a careful determination of the areas where vehicles will be stopped, including advance warning of drivers to slow and stop ahead. This may require the assistance of highway agencies to make sure the checkpoints follow the principles of safe traffic control. As indicated, for saturation patrol and traditional traffic enforcement, a continuous and visible presence by law enforcement is needed. As well as publicizing the results. All officers must be trained to spot signs of impairment and perform field sobriety tests in order to successfully remove drunk drivers from the roads. Potential Difficulties Locating the funding and personnel needed to staff the checkpoints and saturation patrols on a consistent basis statewide is likely to be the largest challenge. Several Strategies mentioned in the NCHRP Report 500 series include using smaller teams (3-5 people) at each checkpoint and teaming with other agencies. The people responsible for writing and releasing information to the press will need to find ways to keep the information fresh and interesting as the program matures. After the newness has worn off the program, media outlets may no longer be interested in the information. State agencies will also have to coordinate to determine the best locations, frequency, and duration to conduct special enforcement. Available crash data can be used to help identify locations and time, but professional judgment should be exercised to determine the frequency and timing. Appropriate Measures and Data At each location and on an aggregate basis for the program, agencies should track data, such as the total number of stopped vehicles, number of field sobriety tests given, number of drivers found driving drunk, number of citations written, arrests made for other violations, and the number of agencies/officers that participated in the program. However, the real effectiveness should be realized over time as there will hopefully be a reduction in the number of alcohol-related crashes both statewide and in the communities where programs were located. Organizational and Institutional Champion Organizational, Institutional, and Policy Issues Nebraska Office of Highway Safety, Nebraska State Patrol and any local agency that provides law enforcement services. Getting the support and backing of prosecutors, judges, political officials, and law enforcement chiefs will be needed if the program is to reach its full potential. Potentially, many agencies (state, county, and city) will have to be working together in order to develop a comprehensive statewide program. MARCH
64 Strategy 5. Enforcement to Discourage Drinking & Driving Issues Affecting Implementation Time For a statewide program, the major issues affecting implementation include locating funding and coordinating law enforcement agencies (and possibly highway agencies if help is needed to create a safe traffic management plan or to potentially obtain crash data). For a statewide program, it was estimated that several months may be needed before the program can begin. After the DUI checkpoints are conducted, it is important that a press release is written and distributed quickly afterwards to make sure news agencies will be interested. Costs Involved The cost of a statewide DUI checkpoint and saturation patrol campaign will vary depending on the frequency, duration, number, and type of enforcement. These costs will include the time to staff each checkpoint or patrol, writing and publishing the results, and time to coordinate, plan and set-up each checkpoint. Often, officers working at a checkpoint are on overtime, which can increase the cost. The cost of the 2005 alcohol-related special enforcements conducted in Nebraska was approximately $765,000. Similarly, the reported cost for a DUI checkpoint program in Tennessee was at approximately $500,000 per year in which 576 checkpoints were conducted ( Further, NHTSA estimated that the savings (in crash costs) from each checkpoint is $62,000. The total cost of the Nebraska DUI checkpoints and saturation patrols were unpublished. But the efforts paid in part by grants from NOHS ranged from $1,200 up to $7,500. Training and Other Personnel Needs Legislative Needs Continued support of enforcement related training that includes: low staffing sobriety checkpoint operation; standard field sobriety training; administrative license hearing preparation; and impaired motorcyclist detection. Equipment needs by a number of agencies include in-car computer systems with associated training and additional equipment (i.e., portable lighting and signs) to set up checkpoints. None identified. MARCH
65 Strategy 6. Enforcement and Education to Discourage Underage Drinking and Driving Definition (1) Publicize and enforce zero tolerance laws for drivers under age 21. (2) Encourage parental involvement and attendance in programs/classes and emphasize education and training through the graduated licensing programs. To further discourage drinking and driving, (3) work with courts to discourage diversion programs and plea bargains to nonalcohol offenses (i.e., improve DUI process and conviction rate). Technical Description Nebraska currently has a 0.02 BAC limit for drivers under the legal drinking age. Therefore, the first part of this strategy is to highly publicize this law so that minors and parents understand that it exists and what the penalties are if caught in violation of the law. To facilitate making this information available, consideration of a new GDL provision could require parents to attend a class where this law is reviewed, in addition to considering other age appropriate driver safety topics. Having law enforcement or other speakers discuss the consequences (legal -- if caught by law enforcement, physical -- if drinking and driving results in a crash) of drinking and driving could be one method to make sure every teen driver and their parent is educated. Advocacy groups and agencies can work with courts (judges and prosecutors) to educate them on the potential consequences of continually reducing charges for minors (or adults) that were stopped and cited for DUI; especially for individuals that have had multiple charges reduced. Target(s) Goal Drivers under the legal drinking age is the primary target. Encouraging the elimination of diversion and plea bargains can discourage first time offenders if it is well known that the courts are strict, but it should be especially effective for repeat offenders. The statewide safety goal is approximately a 27% reduction in the number of traffic fatalities forecasted to occur in Each countermeasure is expected to reduce alcohol-related crashes by 10% to 20% if a statewide program is created. Therefore, this strategy should be part of a comprehensive program to prevent fatalities involving underage drinking drivers. (Note: The 2006 Nebraska CHSP set a goal to reduce alcohol-related fatal, disabling injury, and visible injury crashes by 4% while increasing the number of alcohol-related arrests by 5%.) An example implementation goal would be to perform 2,000 additional hours of special overtime alcohol-related enforcement for underage drivers. Furthermore, an implementation goal could include creating a program that reaches at least 500 parents of newly licensed teens and educate the court systems in the most populated areas. Responsive and Preventative Plans Expected Effectiveness The purpose of drinking and driving education, enforcement, and strict prosecution of citations is to raise awareness of the risks of drinking and driving so that people will not take the chance. Therefore, this strategy is a preventative approach to reduce underage drinking and driving (and indirectly could address adult repeat offenders). (Proven/Tried) Detailed information on the effectiveness of each strategy can be found in the sixteenth volume of the NCHRP Report 500 series, but summaries of effectiveness information are provided below. Publicize and Enforce Zero Tolerance Laws: In Maryland, a zero tolerance law alone was attributed with reducing drinking and driving crashes by 21% for drivers under the age of 21. After the addition of an extensive public information campaign, alcoholrelated crashes decreased an additional 30%. In Maine, there was a substantial decrease in nighttime single-vehicle crashes (used as a proxy for alcohol-related crashes) two months before a new zero tolerance law went into effect; which coincides with when the new law was extensively publicized. (Volume 16, Strategy 5.1 B3) MARCH
66 Strategy 6. Enforcement and Education to Discourage Underage Drinking and Driving Eliminate Diversion Programs/Plea Bargains: Although diversion programs have been tried, there is no consensus on if they are effective and if so, by how much. The elimination of diversion programs has not yet been studied. The authors literature review did identify that restrictions on plea bargains ( when combined with other policies ) was responsible for approximately a 10% reduction in crashes and injuries. (Volume 16, Strategy 17.1 F3) The forthcoming Young Driver Guide provides some background information on getting parents actively involved with their teen driver, but no programs have been carefully studied. But there is information that simply providing parents with educational material has little influence. Thus it appears that requiring classroom time or in-vehicle time is likely necessary in order to have a genuine effect. Keys to Success In order to be effective, education materials relating to underage drinking laws need to be hard hitting and personal (i.e., profile a family who lost a family member in an alcohol-related crash) and be delivered through outlets likely to be viewed by teens and their parents (in school presentations, popular radio/tv shows, internet, etc.). It should also highlight the consequences of being caught drinking and driving when under the age of 21. The related enforcement effort should be continual and visible to be effective. Getting parents to participate in a class with their teen driver is only the first step. Afterwards, parents need to stay engaged in their child s driver training/education. This can include helping parents realize that it is acceptable to set limits on driving privileges, especially early on when teens have little or no behind-the-wheel experience. It will be necessary to not only get the support of the courts, but also public s acceptance of strictly enforcing DUI citations. The Nebraska Office of Highway Safety will establish a state Traffic Safety Resource Prosecutor within the Attorney General s Office. This individual will assist, train, and educate local prosecuting attorneys with traffic violation cases including, but not limited to DUI violations. Potential Difficulties After consuming even small amounts of alcohol, underage drivers frequently exhibit significant impairment. Some of these drivers may be able to successfully perform the standard field sobriety tests which will then require that officers be equipped with breath testing equipment to determine alcohol consumption. If parents are required to attend classes with their teen, they may view it as a major inconvenience. Some Nebraska courts have already implemented similar sentencing requirements with success. Those programs can be utilized as models for other courts. Discouraging the use of plea bargains and diversion programs may create additional workload for the courts system. Appropriate Measures and Data Records should be kept on the implementation of the different treatments (i.e., number, duration, and location of special enforcements; number and type of publicity, number of parents that participate in a class; etc.). After at least one year of a program, then changes in the rate and frequency of underage drinking and driving crashes can be reviewed. MARCH
67 Strategy 6. Enforcement and Education to Discourage Underage Drinking and Driving Organizational and Institutional Champion Organizational, Institutional, and Policy Issues Issues Affecting Implementation Time Nebraska Office of Highway Safety and Project Extra Mile and other safety advocacy groups. To encourage officers to enforce the underage drinking laws, the process for processing an offender so should be kept as simple as possible with minimal paperwork. Judges and prosecutors have the ability to utilize judicial and prosecutorial discretion. It is important to attempt to obtain consensus among judges and prosecutors for strict enforcement of penalties while simultaneously respecting their discretion. Continuing work on the automated court records system will help prevent repeat offenders from going unnoticed because the convictions occurred in separate court systems. Increasing the education and enforcement of underage drinking laws could begin in as little as two months, possibly up to a year, depending on the time to develop the educational material (i.e., pamphlets, TV commercials, etc.). Special additional enforcement efforts could also be organized in as little as a few months. Expanding the program to require parent attendance may take some time to go statewide. However, expanding the implementation at local levels (i.e., by a county) could be accomplished in a much shorter timeframe. The time to change the culture of the courts will vary. However, development and production of materials to distribute and identification of persons to meet with the court employees should take no more than six months. Costs Involved The cost of publicizing and enforcing laws pertaining to underage drinking and driving will depend heavily on the type of media used (i.e., TV, radio, or print), intensity of enforcement, and frequency of media and enforcement campaigns. As an example, the cost in 2005 for the program to reduce DUI (including special enforcement; see Strategy 5) was $765,000. The cost of parent-teen programs and classes can be partially or fully offset by fees charged to the students. However, the costs could reach $500,000 per year. The cost of educating the courts regarding enhanced adjudication of the citations will include staff time and materials (including possible travel costs). An estimated cost for time and materials to support such a program is $50,000 per year. Training and Other Personnel Needs Existing staff should be able to further publicize and enforce the laws regarding underage drinking and driving. However, if agencies continue to staff special enforcements with officers on overtime, there may be a need to generally increase staff levels to keep officers from becoming burned out from all of the overtime. To conduct parent-teen classes, there will be a large need for qualified instructors if the program is statewide. Existing driver training instructors may be able to fill this need with some additional training. Also, effective selected and trained guest presenters (i.e., a parent who lost a child in an alcohol-related crash) may be an important element to encourage parents to be more involved in their child s driver training. Existing staff familiar with traffic safety within Nebraska agencies and safety advocacy groups could meet with judges and prosecutors to explain the need to enforce DUI citations, especially for repeat offenders. The reduction or elimination of diversion programs (Nebraska law currently prohibits diversion of DUI offenders) and plea bargains could create a need for additional court staff if this results in a significant increase in workload. MARCH
68 Strategy 6. Enforcement and Education to Discourage Underage Drinking and Driving Legislative Needs Action by the Nebraska Legislature would be necessary to require statewide parental involvement in programs and/or classes. However, there are already examples in Nebraska of parent-teen classes being required by some judges without action by the Legislature. Currently the penalty for violating the Zero Tolerance Law (drivers license impounded for 30 days and violation on record for 90 days before expunged) is less than the penalty for a minor in possession of alcohol (maximum fine of $500 and up to 30 days in jail). An enhanced penalty for violating the Zero Tolerance Law might include a six month loss of license and a requirement that the driver must maintain a clean record for up to twelve months. This change to the Zero Tolerance Law can only be accomplished by the Nebraska Legislature. MARCH
69 Strategy 7. Broad Based Education Campaigns to Reduce Impaired Driving Definition (1) Encourage the use of required responsible beverage service policies and training for alcohol servers and retailers, (2) continue to educate the general public, business owners, and alcohol servers on the dangers of impaired driving, (3) consider public policies that would make parents accountable for minors who consume alcohol at their place and then drive, and (4) use targeted education techniques (such as billboards) to reduce excessive drinking and underage drinking. Technical Description This strategy is a combination of general and focused education campaigns and enhancing public policies to discourage drunken driving. Beverage server training is currently required in only some communities, while most of the state has only voluntary training for managers and servers. With the funding assistance from the Nebraska Office of Highway Safety, an online manager/server training program is now available to all licensees through the Liquor Control Commission at no cost. Consideration of a policy to require training as a condition of licensing would limit over-service and selling to underage patrons. An example program related to parental accountability, addresses parents that allow minors to consume alcohol in their home is Ohio s Parents Who Host, Lose the Most. Without a social host liability provision as exists in Ohio, the effectiveness of a similar program in Nebraska would be limited as well. The final aspect of the strategy is to provide public education on the dangers of drinking and driving. The education program could be oriented for the general public or focused on important groups (such as servers). Educational material could be distributed through a variety of mediums, including TV, radio, print, pamphlets, billboards, etc. Also, the education could be focused in regions of the State (i.e., counties, cities) or along corridors where alcohol crashes are overrepresented. Target(s) Goal This strategy can be focused on target populations (i.e., servers, minors, etc.) if a serious problem exists, but the strategy is geared towards a broad based deployment to reduce drinking and driving crashes. The statewide safety goal is approximately a 27% reduction in the number of traffic fatalities forecasted to occur in Each countermeasure is expected to reduce alcohol-related crashes by 5% to 23% if a statewide program is created. However, the countermeasure with the highest expected effectiveness ratio, alcohol server training, addresses a relatively small percentage of the alcohol-related fatalities. Therefore, this strategy should be part of a comprehensive program to prevent alcohol-related fatalities. (Note: The 2006 Nebraska CHSP set a goal to reduce alcohol-related fatal, disabling injury, and visible injury crashes by 4% while increasing the number of alcohol-related arrests by 5%.) An example implementation goal would be to have an enhanced policy regarding beverage server training by Furthermore, an implementation goal could include creating a program that reaches at least 500 parents of newly licensed teens and educate the court systems in the largest populated areas. Responsive and Preventative Plans This strategy is a preventative approach to reduce alcohol-related crashes through education and improved laws/public policies. However, the strategy could be focused on target populations or locations in order to deploy responsively. An example responsive deployment may include increasing the training of alcohol servers in areas where there is a high risk of drinking and driving for people leaving bars. Another responsive deployment may include more education material (i.e., billboards, commercials, etc.) in counties or along corridors where alcohol-related crashes are over represented. MARCH
70 Strategy 7. Broad Based Education Campaigns to Reduce Impaired Driving Expected Effectiveness Keys to Success (Proven/Tried) Responsible Beverage Service Policies: A responsible beverage service training program was found to reduce sales to underage persons by 11.5%, which was also accompanied by a 46% reduction in sales to the impaired (source: Three years after a beverage training server law was implemented in Oregon, a 23% decrease in single vehicle nighttime injury crashes was observed. This crash type was used as a surrogate for alcoholrelated crashes since many of these crashes involve a drinking driver. (Volume 16, Strategy 5.1 A2) Broad Based Education Techniques: New York implemented a statewide program that relied on effective legislation that helped create a self-sustaining program at the local level. As part of this, paid media ads were used to promote fun and safe alternatives to drinking. Between 1981 and 2000 annual alcohol-related crashes fell 39%; fatalities were reduced by 70%; and alcohol-related injuries by 57%. (source: html) If new legislation is enacted for beverage server training or to address adults allowing minors to drink and drive, getting this information out to the right audiences is important. Educational messages should be demographic and content appropriate to affect a change in behavior. Potential Difficulties Implementing beverage server training will likely face opposition by business owners. Arguments will likely focus on the cost of getting all servers trained and the difficulty in training all servers within an industry that has a potential for high turnover of staff. With Nebraska s existing on-line manager/server training option, this could be mitigated. Without existing Dram Shop legislation or case law, there is little threat to licensees regarding potential liability for over service or underage sale and those consequences related to drinking and driving crashes. (Note: Dram Shop laws impose civil liability on liquor licensed establishments or alcoholic beverage retailers who sell alcohol to underage persons or obviously intoxicated adults when they are subsequently involved in a crash resulting in death or injury to a third party.) For some of the above reasons, there could be opposition to new legislation that requires beverage server training. Similar opposition could occur for legislation that strengthens laws against adults that allow minors to drink and drive. Appropriate Measures and Data To measure the effectiveness of server training requirements, the measure would be the number of servers trained and the number of servers still waiting to attend a class or be trained and potentially the number of server related violations. Data to measure the effectiveness of the implementation of education messages could include the type of medium used to deliver the messages (i.e., TV, radio, billboard, or print), the frequency, time of day, etc. The results of the education messages could be determined in before and after surveys to determine, for example, how many people remember seeing the messages and if their behavior changed afterwards. Ultimately, an effective program as part of the overall approach to reduce drinking and driving should result in a reduction of alcohol-related crashes. MARCH
71 Strategy 7. Broad Based Education Campaigns to Reduce Impaired Driving Organizational and Institutional Champion Organizational, Institutional, and Policy Issues Issues Affecting Implementation Time Costs Involved Nebraska Office of Highway Safety, likely in partnerships with safety advocacy groups such as Project Extra Mile, MADD, NU Directions, AAA and other safety advocacy groups.. None identified. After funding is identified, education messages could likely be developed and broadcast within one year. Implementation of required server training efforts and those addressing parents that allow minors to drink can only begin after the Nebraska Legislature has taken action. If required server training is passed, there would likely be a window of time where businesses would have to train all of their servers. In Oregon, existing businesses had up to five years to complete training. Required server training could likely be self-sustaining from fees collected for people to attend a class. The Nebraska Office of Highway Safety has already invested over $50,000 to establish the on-line program, including providing materials and website development. A new investment of at least $20,000 will be made to enhance the current system and to add new teaching modules. Addressing parents that allow minors to drink and drive would be minimal, mostly related to court costs for prosecuting once a program is underway these costs are often passed onto the defendant if found guilty. The cost of educating the court system and others on a new law is estimated at $10,000. The costs of education campaigns will vary greatly, depending on the media used and how broadly the message is distributed (i.e., target audiences such as minors, servers, or in target locations such as at sporting events). An estimated cost for a statewide education campaign is $100,000. Training and Other Personnel Needs Legislative Needs Existing staff within agencies are already qualified and experienced at carrying out these types of strategies. With any new public policies, some education of agency staff is appropriate to make sure they are prepared to implement and enforce the initiatives. While some individual communities in Nebraska have established required training, the Legislature and/or the Nebraska Liquor Control Commission are the only bodies with the authority to make training for alcohol servers required. The Legislature can enhance laws that address adults who allow minors to drink alcohol in their residence (and then drive afterwards). MARCH
72 Strategy 8. Compliance Checks of Alcohol Retailers Definition To reduce underage drinking (and driving), increase the number of well-publicized compliance checks of alcohol retailers to reduce sales to underage persons. Technical Description Target(s) Goal Increase the number of retail compliance checks to further discourage business from selling alcohol to minors. Highly publicizing the results of these programs, to both the general public and to alcohol retailers, can help improve compliance. If retailers are made aware that enforcement agencies are cracking down on the sale of alcohol to minors, that knowledge could act as a strong deterrent to checkers tempted to sell alcohol to minors and can also discourage minors from trying to purchase alcohol. Alcohol-related crashes involving drivers ages 20 and younger. The statewide safety goal is approximately a 27% reduction in the number of traffic fatalities forecasted to occur in However, compliance checks of alcohol retailers only address a small fraction of the alcohol-related fatalities. Therefore, this strategy should be one component of a comprehensive program to prevent fatalities involving underage drinking drivers. (Note: The 2006 Nebraska CHSP set a goal to reduce fatal, disabling injury, and visible injury crashes by 4% while increasing the number of alcohol-related arrests by 5%.) A possible implementation goal would be increasing the number of compliance checks by 25% in In addition, a goal in Nebraska has been established to reach a community consensus that clearly states that underage alcohol use is illegal, unhealthy, and unacceptable. Responsive and Preventative Plans Expected Effectiveness Alcohol retailer compliance checks (i.e., enforcement) coupled with publicizing the program (i.e., education), in general, is a preventative approach to reducing alcohol-related traffic fatalities, especially if the programs and campaigns are conducted across the entire state. However, if limitations on funding and other resources limits a statewide campaign, the program could be deployed responsively in communities (i.e., cities, counties) where there is a concentration of alcohol-related fatal crashes or a high potential for a fatal crash (possibly observed through the location of DUI stops). (Tried) In the Douglas and Sarpy County area, conducting regular compliance checks has resulted in reducing retailer non-compliance from 47% to 9%. In New Orleans, a new retailer compliance law coupled with a media campaign on the law s existence increased age checks from 11% to 40% in five months. (NCHRP Report 500, Volume 16. Strategy 5.1 A3) Keys to Success Nebraska s established We Want You Back and Think B4U Wink education campaigns use hard-hitting, personal and emotionally evoking messages that grab attention and have been making a difference. Furthermore, education combined with enforcement (including publicizing the results such as number of arrests, citations, etc.) has been proven to be more effective at changing behavior than the education campaign alone. The penalties for breaking existing laws can be severe if appropriately applied. Education alone is unlikely to be a sufficient deterrent. It is essential that existing state policies related to the selling of alcohol to minors are assessed and that they are appropriately enforced with sufficiently appropriate penalties. Finally, participation by owners and managers of businesses that sell or serve alcohol are needed to achieve maximum effectiveness. Limited participation by this segment of the population makes success more challenging. MARCH
73 Strategy 8. Compliance Checks of Alcohol Retailers Potential Difficulties The most difficult obstacle is getting the communities to recognize the seriousness of the problem and to get them engaged in supporting the education and enforcement activities necessary to change the community environment as it relates to underage drinking. An overall review of state and local alcohol policies and licensing practices, along with penalties needs to be conducted by members of that community. Those community members need to organize to support law enforcement initiatives to achieve the greatest success. Appropriate Measures and Data To measure implementation, law enforcement agencies submit activity reports regarding the enforcement operations. This includes the number of businesses checked in each operation and the media initiatives conducted. The number of alcohol-related traffic fatalities involving those drivers under age 21 is one of the most critical measurements. The non-compliance rate of retailers over time is another important performance measure. Organizational and Institutional Champion Organizational, Institutional, and Policy Issues Issues Affecting Implementation Time Nebraska State Patrol, Nebraska Liquor Control Commission, Nebraska Office of Highway Safety, Project Extra Mile, Nebraska Partners in Prevention, MADD and other safety advocacy groups. The Nebraska Under-Age Drinking Advisory Task Force has already been formed to review existing laws and programs that speak to the problems addressed by this strategy. This Task Force along with other groups have been successful at improving some of the public policies and will continue to address those identified deficiencies. The Nebraska State Patrol and more than 70 local law enforcement agencies already conduct routine compliance checks of alcohol retailers. The number of checks is constantly increasing. Educational materials already exist and results of the program are already routinely collected. Costs Involved Using an average cost of $30 per hour per officer, a team of six officers working a six hour operation would cost $2,160 ($1,080 for labor costs plus administrative costs and the cost of participation for one or two minors in the compliance checks). With nearly eight years of existing experience in conducting compliance checks in Nebraska, an established protocol with personnel and operational procedures is in place. The Nebraska Office of Highway Safety has an existing Compliance Check Grant Program that provides funding assistance to the Nebraska State Patrol and local agencies. In addition, the Office of Highway Safety is providing the Department of Health & Human Services with a template that they are using to establish requirement for the use of grant funding to conduct compliance checks. It is estimated that $300,000 will be expended in FY07 on compliance checks. The cost involved to further increase the number of compliance checks of alcohol retailers and servers could reach an additional $125,000 per year. Training and Other Personnel Needs Legislative Needs Nebraska s existing agencies have staff trained to perform retail compliance checks. Plans are underway to expand training availability to more law enforcement agencies and personnel to meet the increasing demand for training. Public policy initiatives may be necessary to enhance the penalties for selling to minors. MARCH
74 4.3 Unbelted Vehicle Occupant Critical Strategies Strategy 9. Education and Enforcement to Increase Safety Belt Use Among Target Populations Definition To increase safety belt use rate: (1) provide enhanced public information and education to population groups with lower than average restraint use rates, (2) conduct highly publicized enforcement campaigns, and (3) ensure that child and infant restraints are properly used by providing community locations for instruction in proper child restraint use and conducting high profile child restraint inspection events at multiple community locations (involving EMS personnel at inspection locations). Technical Description To increase safety belt use, a combination of enforcement and education is required. If the safety belt use rate stays static (or decreases) in the general population, enforcement will most likely need to be enhanced. The primary targeted group is year old males. A subgroup is those that are driving pick-up trucks. Nebraska just implemented a targeted public information and education campaign combined with an enhanced enforcement effort. This was initiated in 2006 and will be continued into The media messages and the selected stations and programs are those frequently listened to by this group. An effort by the Nebraska Click It, Don t Risk It statewide Safety Belt Coalition targets teens with a competition among high schools that achieve a safety belt use rate of 80%, 90%, and 100%. The honor roll awards are presented by the Governor at the Capitol Building in Lincoln. Teen specific information and education materials have been created and are being distributed across the state. The use of parents who have lost teens as a result of no safety belt use are being utilized as guest presenters at schools and parental group meetings. The third countermeasure provides assistance to adults that have questions about the installation of child safety seats, and studies have found a high percentage of child safety seats are improperly installed. In doing so, one important element is to ensure that there are a sufficient number of certified child passenger safety technicians. Second, information regarding contacts to acquire assistance and dates/locations for special events needs to be made readily available. This could be done through advertising, web pages, or information distributed at hospitals. Target(s) This strategy is intended to motivate individuals that do not routinely use safety belts. This strategy will also encourage vehicle occupants that occasionally refrain from wearing their safety belt to use a belt each time they ride in a vehicle. Male drivers ages are a targeted group along with all teens, especially when teens begin driving without an adult present. Another target is parents and care givers who need assistance to properly install child safety and booster seats in their vehicle. Goal The statewide safety goal is approximately a 27% reduction in the number of traffic fatalities forecasted to occur in Given the existing safety belt laws in Nebraska, a program that utilizes public information and education campaigns with enforcement would need to be aggressive if expected to increase safety belt usage enough so that unbelted fatalities are dropped by 25% before the end of (Note: The 2006 Nebraska CHSP set a goal to increase safety belt use to 82.8% by the end of Other goals included a 10% increase in safety belt usage by commercial motor vehicle drivers and a 5% increase in No Child Restraint and No Occupant Protection citations.) MARCH
75 Strategy 9. Education and Enforcement to Increase Safety Belt Use Among Target Populations The optimum frequency, duration, and density of enforcement efforts should be determined through experience. However, an example of an initial implementation goal would be conducting enforcement operations that result in 2,000 additional hours of special overtime safety belt-related enforcement. Furthermore, an implementation goal may be to increase education campaigns so that the message reaches an additional 10% of the population. Responsive and Preventative Plans As defined in this strategy, the education of population groups with lower than average restraint use rates is primarily intended to be a preventative approach to increasing safety belt use. The use of targeted or special enforcements when the educational begins to prove ineffective is a responsive approach. Also focused on fatality prevention is the child seat installation instruction countermeasure. Normal crash reporting practices do not currently provide information on when restraints are improperly used, which makes a responsive component of this strategy difficult. Even if this were feasible, a preventative approach will be more effective as the goal is to achieve a broad, statewide understanding by parents and care givers of how to properly use child and infant restraints. Expected Effectiveness (Proven/Tried) Between 2000 and 2004, the reported safety belt usage rates ranged from 70% to 79% (with 2000 = 71%, 2001 = 70%, 2002 = 70%, 2003 = 76%, and 2004 = 79%) with a five-year average of 73%. During this time, there were 707 unbelted vehicle occupant fatalities. So, for every 1% of safety belt nonuse, there were approximately five unbelted traffic fatalities annually (707 unbelted fatalities 27% nonuse 5 years = 5.2 unbelted fatalities per 1% nonuse per year). In NCHRP Report 500, Volume 11, Section 3, a reported NHTSA study found safety belts reduce the risk of a fatality by 45% and a critical injury by 50% for front seat passengers over the age of five. As an estimate on safety belt strategies, it was assumed that a 1% increase in safety belt use would save between two and three lives annually (5.2 unbelted fatalities per 1% nonuse per year * 45% reduction in fatalities = 2.4 lives saved per 1% increase in safety belt use per year). [The 2005 and 2006 reported safety belt usage rates in Nebraska were 79.2% and 76.0% respectively. Since this information falls outside of the years that the crash data is from, it is provided only for informational purposes.] NCHRP Report 500, Volume 11 reports that education and enforcement coupled together may result in a substantial increase in safety belt use. A South Carolina program that provided targeted education to population groups with low usage rates achieved some significant results (Strategy 8.1 A2). Overall, safety belt use in South Carolina increased by 8.4 percentage points. In target populations, there was an observed 8.7 percentage point increase in males and a 14.3 percentage point increase in nonwhites. Another example provided was the Safe Communities Coalition of Jefferson County, Wisconsin. Through their efforts, safety belt usage is above 87% in select populations, which is nearly 8 percentage points above Nebraska s statewide usage rate (79.2% in 2005). An effective and properly funded program could likely achieve a 4 percentage point increase in the safety belt usage rate (approximately half the gain seen in South Carolina and half of the difference between the Jefferson County and Nebraska usage rates). This would be expected to save almost 10 lives each year (10 lives saved per year = 2.4 lives saved per 1% increase in safety belt use per year * 4% increase in safety belt use). Locations for assistance with child seat installation has been tried by some local communities. Yet, the effectiveness of this strategy has not been documented. Additional education and inspection of child restraint use would be expected to decrease the percent of incorrectly used seats. Publicity about the conduct of events would also be expected to raise awareness among those who do not attend the events and inspire them to check for proper usage on their own. It will be difficult to quantitatively evaluate the safety impact of these programs. A special study would be required since normal crash reporting practices do not currently provide the necessary level of detail. MARCH
76 Strategy 9. Education and Enforcement to Increase Safety Belt Use Among Target Populations Keys to Success The first key of a public education campaign is to make sure the population groups being targeted indeed do have a lower than average safety belt use rate. Next, any successful public education campaign needs to be hard hitting, graphic and personal in order to make a real change in driver behavior. Also, the message needs to be delivered through a media that is frequently seen by the target population. For enforcement, the first key is a continual and visible law enforcement presence. Also, the enforcement components should be publicized before and after implementation. The purpose of publicizing before implementation is to encourage as many people to buckle up as possible. Publicizing after implementation helps people realize that one could be caught the next time if they don t use their safety belt. The primary key to success for child safety seat inspections is to provide locations for education and inspection that are open on a regularly scheduled basis and at times and locations convenient to parents and care givers. Staffing is another important consideration, so agencies in the community (police, EMS, public health) must be willing to provide certified educators/inspectors or a sufficient number of qualified citizen volunteers must be recruited and trained. The City of Lodi, California currently has a program that is run by the police department working in conjunction with an organization of retired persons who volunteer time to assist with the program ( Key goals of the program include: Providing multiple inspection sites. Providing open locations such as fire stations for walk-in inspections. Training police officers when making traffic stops or other motorist contact to recognize incorrect usage. Potential Difficulties A high profile, and extensive, public education and enforcement campaign can be costly. In addition to needing to find the financial resources, staffing special enforcement campaigns can be taxing on officers, especially if this occurs as part of a program that pays for overtime. But likely the largest difficulty to overcome is simply convincing individuals to change their behavior, especially if among a target population where use rates are below the statewide average. For whatever reasons, these groups have already demonstrated a reluctance to use their safety belts and resist efforts to change their behavior. With the many other obligations of police, EMS, and public health professionals, there may be some difficulty adequately staffing child safety seat installation inspection events at hours that are convenient to the public. Recruiting and training committed volunteers on an ongoing basis may be a challenge in some communities, especially rural areas with a low population. Appropriate Measures and Data Implementation data for education programs should be measured, including the number, type, intensity, and frequency of messages. Related enforcement data should also be measured, including at a minimum where, when, how long, how many officers, and a record of citations and arrests, for the entire effort and separately among the targeted population. A measure of effectiveness will be changes in safety belt use rates, which increases in use rates should ultimately translate into a reduction of fatalities in the general and target population. Implementation measurements for the child safety seat inspection countermeasure include the number of people instructed, the number of seats inspected, the number of sites, and the number of instructors/inspectors (including the site-hours or instructor/inspector-hours of service). MARCH
77 Strategy 9. Education and Enforcement to Increase Safety Belt Use Among Target Populations Effectiveness measurements may include the number and/or percent of incorrect usages that are identified and corrected. Note that without doing an inspection with the child in the safety seat, it is difficult to determine if the seat is being used correctly. Both how the seat is secured within the vehicle and how the child is placed and secured within the seat are important. Organizational and Institutional Champion Targeted Education and Enforcement of Safety Belt Laws: Nebraska Office of Highway Safety, Nebraska State Patrol Carrier Enforcement, Health & Human Services, EMS, and Nebraska Click It, Don t Risk It Statewide Coalition and other safety advocacy groups. Community Locations for Inspection of Child Safety Seat Installation: NDOR, EMS personnel, public health professionals, state and local law enforcement, Nebraska Office of Highway Safety, and other safety advocacy groups. Organizational, Institutional, and Policy Issues Issues Affecting Implementation Time An advocacy group within the community can be an important partner in promoting child safety restraint instruction and inspection programs, educating the public, recruiting and providing volunteers, and publicizing events. Public information and education messages (print, TV, radio, etc.) have been developed. Enforcement is already underway and could be expanded. Likely the biggest hurdle to implementation is getting more interest and motivation of local law enforcement agencies. Issues affecting implementation of community child safety seat inspection locations are primarily organizational finding good locations for the events, recruiting volunteers, training the instructors and inspectors, and effective publicizing and outreach. Costs Involved Costs of public education or enforcement campaigns will depend on the program implemented. For example, the cost of education messages delivered through school visits, print (i.e., pamphlets), radio ads, or TV ads may have a wide range of costs. Additionally, the amount of enforcement used will directly impact the cost. An example cost for a statewide program would be the cost of a program to address impaired drivers, or approximately $500,000 per year. For child seat inspections, there will be personnel costs if the instructors and inspectors are paid. If public facilities can be reserved for the programs, facility costs should be minimal. There may be some costs to develop and publish educational materials. There will be costs to advertise and publicize the events. Training and Other Personnel Needs Existing staff at State agencies and safety advocacy groups already have the training and expertise to develop and implement education and enforcement programs. Depending on the existing needs of law enforcement agencies, additional staff could be needed to meet the demands for patrol time. For child safety seat inspections, instructors and inspectors must be trained and certified. For information on child passenger safety training programs see Legislative Needs None identified. MARCH
78 Strategy 10. Enhanced Laws to Encourage Safety Belt Use Definition To increase the safety belt use rate (as recommended by the May 16, 2006 Highway Safety Workshop participants): (1) Support adoption of a primary safety belt law (2) Strengthen penalties for safety belt violations. Technical Description Nebraska currently has a secondary safety belt law which allows an officer to give a citation only if the driver was first stopped for another traffic violation. A primary safety belt law would allow an officer to stop a vehicle and issue a citation simply because a vehicle occupant wasn t using their safety belt. Passing and publicizing a primary safety belt law would be expected to increase safety belt use rates among vehicle occupants. In addition to providing a primary law, a new law could also help eliminate any gaps in the current safety belt laws. For example, some national advocacy groups recommend that booster seat laws cover all children up to age eight, instead of age six currently covered by Nebraska law. An additional potential improvement to the current law is that all vehicle passengers in all seats must wear their safety belts (not just front seat passengers or when the driver has a provisional license). Examples of stronger penalties for violating the safety belt laws could include higher fines, citations to add points to a driver s record, and tickets given to adult passengers instead of the driver. Achieving a primary law is the first priority for this strategy; however, stronger penalties would be a great addition to a primary law, but could also be implemented separately if there is no Legislative support for a primary law. Target(s) Goal This strategy is intended to motivate persons that do not regularly use safety belts. Ideally, this strategy will also encourage vehicle occupants that occasionally refrain from wearing their safety belt to use a belt every time they get in a vehicle. This strategy could also help protect children up to the age of eight by strengthening existing child restraint laws. The statewide safety goal is approximately a 27% reduction in the number of traffic fatalities forecasted to occur in A primary law with stronger penalties coupled with education and enforcement would be an integral component to achieve this goal for unbelted fatalities by (Note: The 2006 Nebraska CHSP set a goal to increase safety belt use to 82.8% by the end of Other goals included a 10% increase in safety belt usage by commercial motor vehicle drivers and a 5% increase in No Child Restraint and No Occupant Protection citations.) The implementation goal for this strategy is to have adopted a primary safety belt law (and possibly also stronger child safety seat laws) and/or enhanced penalties for not using a safety belt by Responsive and Preventative Plans New or strengthened safety belt laws would be a preventative approach to increase safety belt use. Further publicizing the new laws would increase the strategies preventative nature. MARCH
79 Strategy 10. Enhanced Laws to Encourage Safety Belt Use Expected Effectiveness (Proven/Experimental) Between 2000 and 2004, the reported safety belt usage rates ranged from 70% to 79% (2000 = 71%, 2001 = 70%, 2002 = 70%, 2003 = 76%, and 2004 = 79%) with a five-year average of 73%. During this time, there were 707 unbelted vehicle occupant fatalities. So, for every 1% of safety belt nonuse, there were approximately five unbelted traffic fatalities annually (707 unbelted fatalities 27% nonuse 5 years = 5.2 unbelted fatalities per 1% nonuse per year). In NCHRP Report 500, Volume 11, Section 3, a reported NHTSA study found safety belts reduce the risk of a fatality by 45% and a critical injury by 50% for front seat passengers over the age of five. As an estimate on safety belt strategies, it was assumed that a 1% increase in safety belt use would save between two and three lives annually (5.2 unbelted fatalities per 1% nonuse per year * 45% reduction in fatalities = 2.4 lives saved per 1% increase in safety belt use per year). [The 2005 and 2006 reported safety belt usage rates in Nebraska were 79.2% and 76.0% respectively. Since this information falls outside of the years that the crash data is from, it is provided only for informational purposes.] In 2005, the safety belt use rate in states with a primary safety belt law is on average 8.6 percentage points higher than states with a secondary law. If a primary law was passed in Nebraska and if it achieved an 8.6 percentage point increase in the safety belt usage rate, this could save 20 lives in the first year. During the study period, the information provided identifies nearly three fatalities per year where the occupant was 13 years old or younger. Realizing the number of individuals that are affected by booster seats is even less, stronger child safety seat laws may not save many lives each year. However, given the audience and importance of this group directly affected by child safety seat laws (i.e., children), the importance of strong and adequate traffic safety laws are immeasurable. Furthermore, proper use of child seat and booster seats may reduce injuries. Keys to Success Potential Difficulties Appropriate Measures and Data For a new safety belt law(s), implementing an education effort and knowing that all law enforcement agencies are enforcing the law will be important to its success. Hard-hitting, graphic, personal education materials are often the most successful. There will likely be opposition from individuals or agencies that perceive these laws as intrusive into a person s life. However, one means to combat this argument is to make it clear that electing to not wear a safety belt does impact others. These impacts to others are often in the form of medical costs passed onto others in higher insurance premiums or increased taxes for emergency services to be able to respond. Also, not wearing a safety belt can impact other individuals in the vehicle since an unbelted occupant sometimes becomes a large projectile during a crash (there are documented examples of belted passengers being crushed and killed by someone who was unbelted). Safety belt use information (entire state population and among high-risk groups) and the number of unbelted traffic fatalities are needed to evaluate the impact of this strategy. Changes in the use rate before and after any new laws go into effect will be especially important in understanding the safety benefits. It may also be necessary to monitor enforcement efforts (i.e., citations written) before and after any new laws in order to understand the impact enforcement had on the change in behavior. Organizational and Institutional Champion Organizational, Institutional, and Policy Issues Statewide Click It Don t Risk It Coalition, Highway Safety Advocates and other safety advocacy groups. Highway safety professionals need to work closely with law makers to educate them on the importance of safety belt laws. MARCH
80 Strategy 10. Enhanced Laws to Encourage Safety Belt Use Issues Affecting Implementation Time Costs Involved Action by the Nebraska Legislature is the primary constraint on implementation of a primary safety belt law, new law(s) to eliminate gaps in child safety seats, or stronger fines for not using a safety belt. The estimated cost of staff time and materials to respond to Nebraska Legislature initiated requests for information on the need and benefit of a primary safety belt law or increasing the penalties for not using a safety belt is estimated at $10,000. Unidentified private or third parties may also incur costs associated with the marketing or promotion of a new law. If Nebraska were to pass a primary safety belt law, then Nebraska would receive a one-time grant (Section 406 of title 23, United States Code) of approximately $7.6 million for traffic safety. Training and Other Personnel Needs It is important that all law enforcement officers be properly trained/educated on the importance of enforcing safety belt and child safety seat laws, how to spot unbelted vehicle occupants, and inspection of child safety seats to ensure they are properly installed. The effectiveness of safety belt laws and enforcement campaigns will also require that the courts be educated on their importance so that citations are not dismissed by the courts. State agencies should already have trained staff that can produce press releases for enforcement campaigns and develop much of the material needed for education campaigns. Legislative Needs Only the State Legislature has the authority to enact a primary safety belt law or to change the fine for not using a safety restraint device. MARCH
81 4.4 Intersection Critical Strategies Strategy 11. Follow the Principles of Access Management Definition Near unsignalized intersections, use access management techniques to manage conflicts in the influence area of intersections. Technical Description Target(s) The purpose of access management is to reduce the number of intersection-related crashes by reducing the number of conflict points or to at least separate intersections and/or driveways so that influence areas do not interact. Some techniques available include: controlling or managing access to adjacent land use (i.e., driveway frequency and location), spacing of intersections (i.e., closing and/or diverting traffic from unsignalized intersections to signalized intersections or interchanges), and prohibiting specific vehicle maneuvers that have demonstrated a higher risk (i.e., such as left turns or minor street crossings) by closing medians or using channelizing islands. Depending on the specific situation, access management can help prevent rear end, sideswipe (i.e., car slowing to turn into a driveway is rear-ended or sideswiped by a vehicle going straight), angle (i.e., vehicle turning out of a driveway hit by a vehicle on the street) and left-turn (i.e., vehicle trying to turn left into a driveway is hit by an oncoming vehicle) crashes. Proper corridor access management, including the frequency of intersections, may not only improve safety, but could also help improve operations. Goal Responsive and Preventative Plans Expected Effectiveness The statewide safety goal is approximately a % reduction in the number of traffic fatalities forecasted to occur in This strategy does have an expected effectiveness of 30% (or more), which should mean that a statewide system of roads that follow the principles of access management should help achieve the goal. However, there appear to be a relatively few fatalities that were directly linked to access management; therefore, this strategy should be part of a comprehensive program to prevent intersection fatalities. (Note: For example, a comprehensive program may also utilize roundabouts in appropriate locations or enforcement to reduce speeding and encourage passengers to wear safety belts in order to prevent intersection fatalities.) (Note: The 2006 Nebraska CHSP set a goal to reduce intersection crashes by 10% during 2006.) Access management can be practiced preventively in land use planning, working with local units of government to adopt development ordinances that include access management, and in new or reconstruction projects. This has the added benefit of minimizing construction costs if access needs to be changed after the initial construction. Another preventative plan for this strategy is to improve the access in locations that have experienced large growth in traffic volumes such that the existing access plan no longer functions well, even if a crash problem has not manifested yet. This strategy could be deployed responsively at locations or along corridors where there has been a history of access-related crashes. (Tried) Access management is reported to be considered effective and has been addressed in published literature, but there is no consensus on quantitative estimates of its effectiveness. (Volume 5, Strategy 17.1 A1) The effectiveness of any access improvements will be dependent on the size of the problem at the location fixed and the ability of the specific strategy deployed to effectively manage vehicle movements. However, studies from Minnesota (Source: Statistical Relationship Between Vehicular Crashes and Highway Access, Minnesota DOT, August 1998) and Iowa (Source: Access Management Research and Awareness Program: Phase IV, Center for Transportation Research and Education, November 1999) have suggested that 30% to 40% reduction in crash rates can be expected. MARCH
82 Strategy 11. Follow the Principles of Access Management Keys to Success Access management at a single intersection could have measurable safety benefits, but corridor improvement projects should be considered if large-scale impacts are desired. Involving the landowners and neighborhood early in the process is often an important step to helping them realize access changes will significantly improve safety while having little to no impact on ability to reach their property/business. Education of local officials is an important component in a successful statewide access management program. Example education materials and courses for access management already exist and could be used to quickly develop a program directed toward local agencies (elected officials as well as technical staff). A partnership with the Nebraska LTAP center could be used to help deliver the training to local agencies. Potential Difficulties Public opinion could be very much against the project. Especially with business owners, there is often a belief that changing access will reduce sales, possibly causing businesses to close. Studies in Texas, Kansas, Iowa, Minnesota, and Florida have found the opposite to be true, which is sales and property values in improved areas did as well as or better than comparable areas that were not improved. Access modifications could create changes in the traffic flow and patterns. Therefore, it is necessary for engineers to make sure that by correcting one location, that the change in traffic patterns won t create a problem at another location. It can also be challenging for the DOR (focus on mobility) and local planning agencies (focus on local access) to coordinate with each other. Appropriate Measures and Data Implementation information collected should include the number of intersections or corridors that had access improvements, the type of improvement(s) implemented, and the site/corridor s crash history (before and after, ideally looking at total crashes and access related crashes separately). Depending on the changes made and the concerns expressed by landowner(s) or business owner(s), an agency may also need to document impacts on travel time (i.e., increased time to access a parcel through a backage road versus direct access and how significant is this compared to the total trip length in the region) and business sales if an issue. Organizational and Institutional Champion Organizational, Institutional, and Policy Issues NDOR, county and city highway agencies. All highway agencies, whether urban, suburban, or rural, should include the principles of access management in the planning, design, and operation of their facilities because of the safety benefits. Therefore, it is best that access management be incorporated early into the process, including staff involved in planning and regulating land development. Equally important, personnel involved in final design or permitting also need to have an understanding of access management and be able to identify potential problems. It has been suggested that highway agencies need to establish formal guidelines for when and what type (i.e., full versus right-in/right-out) of access will be granted. Best practices and case examples may also be useful for staff when evaluating a situation. Agencies need to develop a culture of working with landowners to establish the best combination of access and safety, especially early in the development process before there has been large investments by the landowners. Agencies also need to work with neighborhoods to educate them when changes to access are needed, how they will benefit from a safer roadway, and demonstrate how most changes to access have a minimal effect (possibly even a positive effect) on travel time and business activity. MARCH
83 Strategy 11. Follow the Principles of Access Management Issues Affecting Implementation Time Costs Involved The time to identify all intersections or corridors in need of access improvements will depend on the size of the jurisdiction. Ideally, the first sites or corridors selected for safety improvements would have a documented safety problem related to access or characteristics similar to locations where access safety problems have occurred. The time to implement the strategy may take only a few months to several years, depending on the selected solution, size of the project, extent of the agency s power to make changes to access, and cooperation by land owners. The cost of access modifications can vary from several thousand dollars for signs to several hundred thousand dollars if driveways have to be relocated, medians constructed, or frontage roads developed. Closing access may take $10,000 to $15,000 in construction costs, but relocating or creating restricted access can be quite expensive if major construction is involved (i.e., constructing a frontage or backage road, reconstructing intersections and neighboring driveways to install channelization). Generally, loss of direct left-turn turn access is something an agency would not be required to compensate a land owner for, especially if safety is a concern. When a corridor is reconstructed, especially in urban and suburban areas, the issue of access should be reviewed. It is possible that significant access improvements could be incorporated into the reconstruction at a relatively minimal cost to the project. Training and Other Personnel Needs Staff at highway agencies should be trained in the concept of access management to ensure the principles are properly followed and that changes made to access don t create a more hazardous situation. Since many decisions regarding access are made by elected officials (county or city) or agency managers, they should be provided with education of access management principles and the benefits when appropriate for a project. Legislative Needs Highway agencies need authority to require access changes. If a review of state laws finds gaps in this authority, action might be required by Nebraska s Legislature. Some states have also been able to enact access management polices and programs through a rule making process. For example, other states (such as Colorado and New Mexico) have enacted legislation or rules that have allowed the DOT to deny direct access to a State Highway if access to other roadways was available. Another State DOT is involved in the regulatory process for land development and can directly effect access decisions regarding State Highways as part of the land use planning process. MARCH
84 Strategy 12. Improve Sight Distance at Intersections Definition Improve sight distance at intersections by clearing sight triangles. Technical Description Target(s) Goal Responsive and Preventative Plans Expected Effectiveness Keys to Success Clearing of sight triangles should include the medians of divided highways in the vicinity of an intersection in addition to the intersection approaches. Clearing of sight triangles should not be limited to routine maintenance activities (i.e., mowing grass, removing trees and shrubs). Other fixed objects and even parked vehicles may block a driver s line of sight at an intersection. Therefore, at new construction, or at a review of an existing location, the placement of signs (especially guide signs and route markers on highway approaches), mailboxes, benches, landscaping, parked vehicles, and signal hardware are examples of items that need to be considered. This strategy targets angle- and turning-related crashes at intersections. The statewide safety goal is approximately a 27% reduction in the number of traffic fatalities forecasted to occur in This strategy only has an expected effectiveness of 20%, which is below the statewide goal. Therefore, this strategy should be part of a comprehensive program to prevent intersection fatalities. (Note: For example, a comprehensive program may also utilize roundabouts in appropriate locations or enforcement to reduce speeding and encourage passengers to wear safety belts in order to prevent intersection fatalities.) (Note: The 2006 Nebraska CHSP set a goal to reduce intersection crashes by 10% during 2006.) The responsive component of the strategy involves identification of intersections with a large number of angle- and turning-related crashes where restricted sight distance is causing or contributing to the crash problem. Due to the random nature of fatal and serious crashes, a preventative component of the strategy is very important. The preventative component would be to implement the strategy at intersections that have an increased probability of a fatal or serious injury crash (based on variables such as traffic volume, crash history, crash type, facility type, and speeds). A further step, as resources allow, would be to monitor and maintain good sight triangles at all intersections. (Tried) Estimates of the safety effectiveness of providing full intersection sight distance where it does not currently exist suggest that up to a 20-percent reduction in related crashes can be expected. One key to success for the responsive component of the strategy is effective identification of whether a crash problem at an intersection is related to restricted sight distance. As sight conditions at intersections can change over time (due to growth of vegetation, placement of new obstructions, etc.), ongoing monitoring or periodic evaluations of sight triangles at intersections is important for maintaining good sight distance over time. Potential Difficulties One difficult aspect of this strategy is removal of sight restrictions on private property. The legal authority for highway agencies to remove sight obstructions from private property varies widely. If the legal authority does exist, it can still be difficult from a political perspective. There are also some obstructions that are very difficult or costly to remove, such as poles along major utility lines, obstructions owned by railroads, etc. Appropriate Measures and Data Process measures include the number of intersection quadrants at which sight distance was improved and the amount of increase in sight distance achieved. Effectiveness measures include crash frequency and severity, by type. Separate analysis of crashes targeted by the sight distance improvements is desirable. Traffic volume data are needed to understand the level of exposure. MARCH
85 Strategy 12. Improve Sight Distance at Intersections Organizational and Institutional Champion Organizational, Institutional, and Policy Issues Issues Affecting Implementation Time Costs Involved Training and Other Personnel Needs Legislative Needs NDOR, county and city highway/roadway agencies. This strategy should be incorporated into highway design policies, signing policies, maintenance manuals, and educational materials for the public. Communication between highway safety professionals within an agency and maintenance personnel is important because of the key role maintenance plays in keeping sight triangles clear at intersections. Projects to remove sight obstructions on the highway right-of-way can be accomplished in three months or less, assuming the objects are readily moveable. Removal of some obstructions may take more time. Examples include obstructions that are on private property, potentially controversial situations (such as removal of public parking), or those that involve working with other entities (such as utility or railroad companies). For many common obstructions such as vegetation, signs, etc., the cost of removal or relocation will be low. Some obstructions such as utility poles, or backslopes that require earth removal, etc. will be more costly. Training for maintenance personnel is important as sight conditions at intersections can change over time. Maintenance personnel who are out in the field often may be in the best position to identify and correct potential problems (such as overgrown vegetation). In addition to maintenance personnel, training on sight obstructions at intersections should be provided for individuals involved with geometric design, highway safety, and signing. Legal authority of highway agencies to control sight obstructions on private property may need to be strengthened. MARCH
86 Strategy 13. Improve Driver Awareness of Intersections on Approaches Definition Increase drivers awareness when approaching an intersection; whether a STOP controlled, signalized, or thru approach. Techniques for consideration include (1) enhanced warning and guide signing, (2) street lighting, (3) dynamic mainline warning flashers, and (4) advance warning flashers for traffic signals on high speed roadways. Technical Description The listed treatments are common techniques used to help increase a driver s awareness when approaching an intersection. However, many of these treatments are not intended to prevent a driver on the stopped approach from running a STOP sign. Instead, the primary focus is on increasing the awareness of the driver approaching the intersection from the major street, which may help a driver take evasive actions if another driver suddenly crosses their path. The use of street lighting and enhanced warning/guide signs helps improve the conspicuity of an intersection. In contrast, the dynamic mainline warning flashers and advance traffic signal warning flashers improve intersection conspicuity, but also provide a real-time alert when a vehicle is waiting to enter the intersection ahead or the signal indication is changing to red. Note: Enhanced guide signing techniques may include diagrammatic signs or larger advanced junction guide signs similar to freeway style signs. An example of dynamic mainline warning flashers can be found in North Carolina and Missouri. These systems include loop detectors on the minor street approaches. When these loops detect a vehicle, this activates flashers on the mainline mounted on a sign warning of entering vehicles ahead. Target(s) Goal Responsive and Preventative Plans Expected Effectiveness Intersections with a pattern of rear-end, angle, or turning collisions related to a lack of driver awareness of the presence of the intersection or the presence of vehicles entering the intersection from the minor road. The statewide safety goal is approximately a 27% reduction in the number of traffic fatalities forecasted to occur in These countermeasures have an expected effectiveness with a range of 5% to 25%. However, the most effective strategies address a relatively few number of traffic fatalities. Therefore, this strategy should be part of a comprehensive program to prevent intersection fatalities. (Note: For example, a comprehensive program may also utilize roundabouts in appropriate locations or enforcement to reduce speeding and encourage passengers to wear safety belts in order to prevent intersection fatalities.) (Note: The 2006 Nebraska CHSP set a goal to reduce intersection crashes by 10% during 2006.) The responsive component of the strategy involves identification of intersections with a large number of rear-end, angle, and turning collisions where a lack of awareness of the intersection by drivers on the mainline is contributing to the crash problem. Due to the random nature of fatal and serious crashes, a preventative component of the strategy is very important. The preventative component would be to implement the strategy at intersections that have an increased probability of a fatal or serious injury crash (based on variables such as traffic volume (on both the major and minor roads), crash history, crash type, facility type, intersection geometry, and speeds). Another preventative approach would be to improve driver awareness of intersections along an entire corridor. Improving just one intersection in a corridor may not prevent many crashes, but a noticeable benefit may occur when looking at a corridor of intersections. (Tried) 1. Enhanced warning and guide signing: this strategy is expected to improve safety at the intersection because drivers on the mainline will be more alert to vehicles entering the intersection from the minor road. This heightened awareness should quicken drivers reaction times when conflicts occur. However, the effectiveness of the strategy has not been quantified. (Proven) 2. Street lighting: studies indicate that installing streetlights at rural intersections result in a 25 to 50 percent reduction in the nighttime crash/total crash ratio. MARCH
87 Strategy 13. Improve Driver Awareness of Intersections on Approaches (Tried) 3. Dynamic mainline warning flashers: The effectiveness of this strategy has not been quantified. It is expected to improve safety by providing a dynamic warning to drivers on the major road when vehicles are approaching the intersection on the minor road. (Tried) 4. Advance warning flashers for traffic signals on high speed roadways: The effectiveness of this strategy has not been quantified. Advance warning of traffic signals is expected to help prevent serious high-speed crashes, particularly rear-end crashes. Keys to Success Potential Difficulties Appropriate Measures and Data A primary key to success is evaluating intersections to 1) determine whether or not one of these strategies is appropriate for a particular location and will have a real impact on preventing fatal and serious crashes; and 2) selection of the most appropriate strategy for a particular location. Evaluation of intersections may include looking at traffic volumes, geometry, crash types, speeds, and other factors and developing a good understanding of what factors are contributing to crashes and what measures will be most effective at preventing them. A potential difficulty related to dynamic warning flashers is that the message being conveyed needs to be clear to motorists. Additional signing can introduce sight obstructions at intersections if not properly placed. At some remote intersections, access to electricity may be a challenge for installing lighting and flashers. A process measure would be the number of intersections improved. Effectiveness measures include crash frequency and severity, by type. Separate analysis of crashes targeted by the improvements is desirable. Traffic volume data are needed to understand the level of exposure. Organizational and Institutional Champion Organizational, Institutional, and Policy Issues Issues Affecting Implementation Time Costs Involved Training and Other Personnel Needs NDOR, county and city highway agencies. Good crash data are important for effective implementation of these strategies. The type of crashes occurring at intersections will be important for determining if one or more of these strategies are appropriate for a particular location. Crash type is also important for evaluating the effectiveness of the strategies. These strategies are relatively easy to implement and most could be accomplished within one or two years at targeted intersections. Access to electrical service could affect implementation time for lighting and flashers. There will be initial material and construction costs for signing, flashers, and lighting. These may include costs for larger signs, lighting and flasher hardware, installation of loop detectors in the pavement for dynamic warning flashers, and running electrical service for lighting and flashers. There will be ongoing maintenance costs for these features. There will be ongoing utility costs for lighting and flashers. Training and guidelines for designers so they can 1) evaluate intersections and determine the factors that are contributing to crashes; 2) choose the most effective strategy for a particular location; 3) design the improvements properly (for example proper placement of signs so they provide advance warning yet do not introduce sight obstructions for motorists on the minor road). Some training and guidelines for law enforcement personnel may be helpful to ensure that the types of intersection crashes are being properly recorded. Legislative Needs None Identified. MARCH

88 Strategy 14. Use Non-Conventional Intersection Designs Definition At appropriate locations, choose non-conventional intersection designs, such as roundabouts, offset T-intersections, or one-quadrant interchanges. Technical Description This strategy is a suite of possible changes that can be made to a basic four-legged intersection to reduce conflicts and the potential for crashes. When used appropriately, roundabouts have been found to have both safety and operations improvements over a STOP or signal controlled intersection. Other design techniques such as offset T- intersections and one-quadrant interchanges can improve intersection safety. All of these techniques attempt to improve safety by reducing the number of conflict points associated with minor street crossing and left turn maneuvers. These particular maneuvers have been found to be over involved (represented) in intersection crashes, especially at thru-stop intersections in rural corridors. Example of Offset T- Intersections Example of One-Quadrant Interchange (Intersection of US 59 and US 34 in Mills County, Iowa) Source of Images: Rural Expressway Intersection Synthesis of Practice and Crash Analysis. Performed by Center for Transportation Research and Education at Iowa State University for the Iowa DOT. October MARCH
89 Strategy 14. Use Non-Conventional Intersection Designs Target(s) This suite of strategies is primarily intended to address crossing path crashes, such as leftturn and right angle crashes. The roundabout is probably most often used in urban and suburban settings, but there are some rural situations where a roundabout could be appropriate. The remaining strategies are likely more appropriate in rural situations than in an urban or suburban setting. Occasionally an isolated traffic signal is installed at a rural intersection as a safety device. In these instances, replacing the traffic signal with a one-quadrant interchange or offset T- intersections could have a better safety record with less impact on traffic operations. Goal The statewide safety goal is approximately a 27% reduction in the number of traffic fatalities forecasted to occur in These countermeasures have an expected effectiveness with a range of 40% to 90%. However, implementation costs limit the ability to deploy statewide at appropriate locations. Therefore, this strategy should be part of a comprehensive program to prevent intersection fatalities. (Note: For example, a comprehensive program may also use traffic control improvements in needed locations or enforcement to reduce speeding and encourage passengers to wear safety belts in order to prevent intersection fatalities.) Because intersection fatalities are often spread over many intersections; there is no guarantee that intersection fatalities will consistently occur at a particular intersection. Because of this, implementation should be as widespread as possible at locations that could benefit from these countermeasures, instead of focusing only on intersections where a fatality had occurred. (Note: The 2006 Nebraska CHSP set a goal to reduce intersection crashes by 10% during 2006.) Responsive and Preventative Plans This strategy should consist of both responsive and preventative components. Intersections with a documented crash problem (especially crossing path crashes) spanning multiple years are good candidates for improvement. However, improvements in reaction to a fatal crash where there has been no track record of crashes may be essentially characterized as chasing fatals and ineffective at saving lives, especially in the short-term. This is where a preventative deployment (i.e., widespread implementation) could be highly effective at preventing crashes. The relatively high construction costs do prohibit a preventative implementation plan from addressing hundreds of intersections within a year or two. So prioritization of locations is key, even in a preventative plan. Some factors to consider when developing a prioritized list may include traffic volumes, functional classification, design features, crash history, or a combination of such factors. Also, these treatments could be deployed proactively by addressing multiple intersections along a corridor, especially if the corridor has high volumes (major and minor streets) and there is a pattern of crossing path crashes in the combined history of the intersections. Expected Effectiveness (Proven/Tried) Detailed information on the effectiveness of each strategy can be found in the fifth volume of the NCHRP Report 500 series, but summaries of effectiveness information are provided below. Many of the strategies are listed as tried in the guides and there are no statistically robust estimates on their effectiveness; in these instances no information may be provided below. To estimate the expected effectiveness at a specific intersection, it is very important to have a thorough knowledge and understanding of local conditions. Convert a Four-Legged Intersection to Two T-Intersections: The crash rate at offset T- intersections is approximately 43% of the crash rate at similar four-legged intersections. (Volume 5, Strategy 17.1 B14) Roundabouts: At an unsignalized location, roundabouts can reduce all crashes by 38%, injury crashes by 76%, and fatal and life changing injury crashes by 90%. (Volume 5, Strategy 17.1 F3) Additional discussion related to these and other similar strategies is provided in Strategy 17.2 B4 and Strategy 17.2 B5 of NCHRP Report 500, Volume 12. MARCH
90 Strategy 14. Use Non-Conventional Intersection Designs Keys to Success For this strategy to be measurably successful at reducing crashes and traffic fatalities and have a significant impact on the number of fatal intersections crashes in Nebraska, a large number of candidate intersections will need to be improved, ideally starting at locations with a poor safety record. The improvements should also be designed to have a minimal adverse impact on traffic and pedestrian operations. In order for an improvement to be effective (especially in a reactive deployment), engineers need to identify that there is a geometric feature or traffic pattern that is a cause or at least a contributing factor to the crashes. If alcohol, speeding, or other driver related issues are the primary cause, the effectiveness of engineering improvements may be limited and suggests the need to partner with law enforcement to develop a comprehensive safety strategy. It is possible that these strategies will require additional right of way. If so, the highway agency will need to work with the landowners and other stakeholders to explain the importance of the project to improve the safety at the intersection. Driver education/training or additional signing may be needed to help drivers navigate through an intersection design that is unlike others in the area (i.e., roundabouts). Potential Difficulties The improvements should be designed so they create a safer intersection; opposed to a poor design that may actually create more crashes. For example, roundabouts may create crossing difficulties for pedestrians; offset T-intersections should be separated enough that the intersection influence areas don t overlap, but not so far that the extra travel distance is too great; roundabouts need to be properly signed so drivers don t become confused, especially in areas where the treatment is new. Another possible difficulty is resistance or discomfort by agencies or the public to strategies that are new to Nebraska, but have been successful elsewhere. Appropriate Measures and Data To document this strategy, the first item needed is the number of locations that have been improved, including specific information on the improvements made to the intersection. Before and after crash information will also need to be tracked for each site. Impacts to crashes that are directly related to the improvements should be monitored in addition to all crashes at the intersections. If possible, crash totals at control sites (i.e., unimproved intersections) should also be included in the study. Because individual intersections may have only a few crashes in a year; it can be difficult to see significant crash reductions at a single intersection (especially in the first six or twelve months). Therefore, the combined crash history of all intersections improved with this strategy should provide a better understanding of effectiveness. If the effect on traffic operations is of a particular concern, then an evaluation of the impacts could also include before and after travel times and intersection delay. Organizational and Institutional Champion Organizational, Institutional, and Policy Issues NDOR, county and city highway/roadway agencies. All of these strategies can be implemented by the responsible roadway agency. However, it is important for the highway agency to update/create and then to continually maintain their design policies, guidelines, and best practices so that designs will be consistent with safety standards. MARCH
91 Strategy 14. Use Non-Conventional Intersection Designs Issues Affecting Implementation Time Identification of intersections that would benefit from these specific improvements may take up to six months. Further, identification of the specific design changes recommended may take another several months or more, depending on the number of intersections identified within the jurisdiction. After identification, many strategies could be implemented in several years, as long as there are no complicating factors, such as purchase of right-of-way. The implementation time for any project requiring additional right-of way could easily stretch past two years. Another issue that may lengthen implementation time, is time needed to gain public input and acceptance for new treatments and concepts. Costs Involved The following costs are intended to represent an average expected cost for Nebraska, but these costs could change substantially depending if the area is rural or urban, available existing right-of-way, etc. The construction of a roundabout may be $300,000 for a single lane, increasing up to $1,000,000 for an urban two-lane roundabout. An expected cost per roundabout is $750,000. In many cases, compared to a new traffic signal if extensive right of way is not required, a roundabout is less in total cost. Depending on right-of-way and other constraints, the cost of constructing offset Ts or building a one-quadrant interchange could easily reach over $1 million. Training and Other Personnel Needs Legislative Needs For proper design and implementation, it is important to make sure that design staff are sufficiently trained in geometric design and MUTCD guidelines. None identified. MARCH
92 Strategy 15. Targeted Speed Enforcement at Problem Intersections Definition Use targeted speed enforcement to reduce operating speeds on specific intersection approaches. Technical Description Whether an intersection is signalized or unsignalized, vehicle speeds can be an important element in a crash that occurs. At signalized intersections, drivers speeding may not be able to react in time to changes in the signal indication or other driver, pedestrian and bicycle maneuvers. Also other drivers may experience difficulties when trying to judge if it is safe to turn into or across the path of a speeding vehicle. Similarly, a driver stopped at an unsignalized intersection could underestimate the gap to make a maneuver, as they may be unable to accurately judge the approaching vehicles excessive speed. Methods to control speeds could range from traditional law enforcement to photo-radar (automated enforcement) if permitted by law. Especially for traditional law enforcement, a key is to recognize that effectiveness of increased enforcement at specific locations has a relatively short duration measured in days or weeks, rather than months. Location of increased enforcement should be in areas where excessive speeding can be attributed to a crash problem. Target(s) Goal Intersection crashes where speeding or excessive speed is a contributing factor. The statewide safety goal is approximately a 27% reduction in the number of traffic fatalities forecasted to occur in Targeted speed enforcement may be effective at reducing fatalities, but available resources or legislative restraints for automated enforcement may prohibit widespread deployment. Therefore, this strategy should be part of a comprehensive program to prevent intersection fatalities. (Note: For example, a comprehensive program may also use traffic control improvements or construction of roundabouts in appropriate locations.) Because intersection fatalities are often spread over many intersections; it is not likely that intersection fatalities will consistently occur at a particular intersection. Because of this, implementation should be as widespread as possible at locations that could benefit from speed enforcement. (Note: The 2006 Nebraska CHSP set a goal to reduce intersection crashes by 10% during 2006.) Responsive and Preventative Plans Responsive deployment of enforcement should be at locations where there is a demonstrated crash problem that is correctable by enforcement. This may include specific signalized or unsignalized intersections where vehicle speeding was a significant contributing factor in crashes. Even though this plan would be responsive, a preventative component could be added to the program, which is to publicize the implementation of targeted enforcement, thereby increasing public knowledge and hopefully also increasing compliance with speed limits. Other preventative deployment methods may include performing targeted enforcement at locations where a crash related problem has not yet manifested, but the conditions are similar to other locations where an identified crash problem does exist. A third preventative method would be to provide additional enforcement along multiple intersections in a corridor. One of the benefits of this method would be that drivers would not be able to predict specific locations where the enforcement effort is occurring. Expected Effectiveness (Proven) Traditional speed enforcement is considered effective. However, the halo effect of traditional enforcement has been found to reduce speeds for about three days for a single enforcement episode and up to six days when multiple days of enforcement are used. Furthermore, vehicle speeds have been found to bounce back quickly downstream from the location of the enforcement. MARCH
93 Strategy 15. Targeted Speed Enforcement at Problem Intersections Although not yet common in the United States, automated speed enforcement has been employed more widely in other countries, namely across Europe. In a study conducted in the United Kingdom, officials introduced a photo-radar system on a roadway that has variable speed limits. There were 28% fewer crashes involving occupant injuries during the first year of the program, and vehicle-damage-only crashes went down 25%. Preliminary data for the second year indicates the improvements are being sustained. Using mobile units with speed enforcement cameras, Paradise Valley, Arizona saw a 40% reduction in crashes while National City, California saw a 51% reduction. (Note: the Arizona and California studies may have study design issues in the methodology used to determine the results which may have resulted in an overestimation of crash reductions.) One technique similar to photo speed enforcement that has been used in the United States is dynamic speed warning signs. Speed warning signs use radar to measure a vehicle s speed and a dynamic message board to display the speed for the driver to see. Studies on speed warning signs have found the technology to be effective at reducing vehicles speeds while in place, especially for vehicles that are 10 mph or more above the posted speed limit. The study was conducted on a roadway with a 25 mph posted speed limit and was conducted in May 1998, as reported in Road Injury Prevention & Litigation Journal. Conclusions from the report are based on the study A Comparative Study of the Speed Reduction Effects of Photo- Radar and Speed Display Boards, by Steven A. Bloch. The use of a speed warning sign reduced the mean speed by 5.8 mph at the experimental site but had little effect 0.2 miles downstream (2.9 mph reduction in mean speeds). A speed warning sign used in conjunction with intermittent enforcement resulted in a 6.1 mph mean speed reduction at the experimental site and a 5.9 mph reduction in the mean speed downstream of the display. However, one source noted that changeable message signs are unlikely to be able to reduce speeds by 10 mph or more (Eric Meyer, A Literature Review of Perceptual Countermeasures to Speeding, University of Kansas, July 2000). Keys to Success In Nebraska, several agencies have recently returned to using motorcycles to enforce speeding problems in and around problem urban and suburban roadways and intersections. Many have indicated that the ability to maneuver and handle high-volume traffic situations has aided in effective speed enforcement. For targeted enforcement to be successful, the public and affected agencies (local elected officials, state/county/city highway agency, and law enforcement) must also be supportive of the program in order for it to succeed. To increase acceptance, consideration should be given to using public information campaigns that explain the problems and the potential benefits of the program and highlight that the program is not intended as a revenue generator (i.e., through collection of fines). This should not be an issue in Nebraska because under the State Constitution, all fine money goes to the local school district. Outreach to publicize the results will also help increase compliance with posted speed limits. Also important is that the speed limit is clearly posted, so that no drivers are confused or not properly informed. For an automated program to be successful in increasing driver compliance with traffic laws and consequently to potentially reduce the number of related crashes, it first must be deployed in locations where poor driving behavior is a documented problem. A potential method to identify these intersections is to first determine an estimate of the number of speed-related crashes at each intersection. Intersections could be screened by first eliminating locations with a low frequency of crashes. Next, using volumes, a rate based screen method could be used to identify locations where the rate is higher than expected (i.e., Bayesian analysis, crash rate, etc.). Further location screening could be done by observing the intersections to make sure geometry is not a contributing problem and to learn if there is high number of violations. MARCH
94 Strategy 15. Targeted Speed Enforcement at Problem Intersections Another important factor of an automated enforcement programs is how the program is administered. Some agencies rely on private contractors to operate portions of the program. Although this is an appropriate mechanism, in such situations, it is important that the contractor s fees are not linked to the number of tickets issued or fines paid, as this is often perceived negatively by the public. Instead, it is recommended the appropriate law enforcement agency should be allowed to maintain control of the program in order to avoid any misperceptions. Potential Difficulties The general public may not be very supportive of targeted enforcement. It will be necessary to work with them to help them understand why enforcement is necessary at specific locations. As reported in NCHRP Report 500, Volume 12, the use of photo enforcement is often controversial, with most arguments centered on issues regarding personal privacy, effectiveness compared to traditional enforcement, costs exceeding the benefits, and its use by government as a revenue generator. ITE s report, Automated Enforcement in Transportation, offers counter points of view regarding these topics. Appropriate Measures and Data A key measure for evaluating the effectiveness of implementation is the number of locations where targeted traditional speed enforcement or automated enforcement were used. For traditional enforcement, additional implementation data such as time of day, and duration should be documented. A decrease in vehicle speeds and the number of speeding violations is the first means to determine the strategy s effectiveness. Also reviewing changes that occur in crash frequency and severity can be used to evaluate the effectiveness of targeted enforcement particularly those that are related to the enforcement actions. However, it is important to evaluate the effect enforcement has on all crashes and speeding or targeted crashes separately. Organizational and Institutional Champion Organizational, Institutional, and Policy Issues Issues Affecting Implementation Time Costs Involved Roadway (such as NDOR, counties and city roadway departments) and enforcement agencies (such as Nebraska State Patrol, county sheriffs, and city police departments) as well as the Nebraska Office of Highway Safety. Coordination is needed between the legislature, city councils, roadway agencies, law enforcement and traffic courts to make a program successful. This cooperation and coordination is not only needed to run the program, but also in selecting the locations where targeted enforcement will be implemented. Identification of locations that would benefit from targeted speed enforcement should take less than a year. The biggest issue facing implementation of automated enforcement is the time needed to adopt legislation to allow automated enforcement. Once automated enforcement is accepted by local and state governments, the time to gain local acceptance, approval, and participation for implementation can vary greatly depending on the local opinion and severity of the problem. (Nationwide surveys by IIHS and NHTSA both found support was already noted as strong by two-thirds of respondents.) The costs for traditional law enforcement are approximately $75 per hour for labor costs and related expenses (i.e., vehicle, fuel, etc.). Assuming that four hours of enforcement are conducted per day, one day per week; then the yearly cost per location would be approximately $15,500. For automated enforcement, the costs for the equipment will vary depending upon the actual camera and sensor equipment selected. However, a single installation could cost approximately $50,000. Additional costs include maintenance, monitoring tapes, processing citations, and moving the camera between locations. MARCH
95 Strategy 15. Targeted Speed Enforcement at Problem Intersections Training and Other Personnel Needs Use of traditional speed enforcement targeted at specific locations will not require new staff, but in order to deploy extensively, law enforcement agencies may need to pay overtime or eventually add staff. It is not expected that automated enforcement will demand additional staff (especially if operated by private contractors), yet existing staff will surely need additional training. For example, highway engineers will need training on how to evaluate the technology and select locations ideal for the program. Additional training will also be needed for personnel responsible for maintenance of the equipment and users of the software for processing violations. Some of these training needs may be offset if part of the program is operated by private contractors. Legislative Needs As recommended by the May 16, 2006 Highway Safety Workshop participants, adoption of enabling legislation by the State Unicameral is necessary to allow use of automated enforcement on Nebraska s roadways since the use of automated enforcement is not permitted. NCHRP Report 500, Volume 12, provides sources for example legislation and information regarding existing state policies, including: Insurance Institute for Highway Safety ( National Conference of State Legislatures ( The National Campaign to Stop Red Light Running ( MARCH
96 Strategy 16. Work with Local Agencies to Identify Intersections with a Severe Crash Problem Definition Through crash analysis, identify intersections with a disproportionately large number of fatal and serious injury crashes. As necessary, improve data collection to enhance analysis of intersection crashes. Technical Description Target(s) Goal The purpose of this strategy is to work with local agencies to help them identify intersections where there is an unusual number of fatal and disabling injury crashes. This may first necessitate improving data collection (i.e., crash data, intersection and road inventory information, traffic volumes) so that candidate locations can be identified. The information that comes from this program may also prove useful in identifying design or traffic characteristics that are often associated with an increased crash frequency, which could then be used to evolve the program from a strictly reactive deployment into a proactive approach. Intersections with an unusually high frequency/rate of fatal and disabling injury crashes. The statewide safety goal is approximately a 27% reduction in the number of traffic fatalities forecasted to occur in This strategy should be considered an important part in an overall comprehensive plan at reducing intersection fatalities by assisting local agencies identify those intersections with a significant safety problem. A possible implementation goal would be to assist local agencies identify the top 10% of high crash locations within their jurisdiction. (Note: The 2006 Nebraska CHSP set a goal to reduce intersection crashes by 10% during 2006.) Responsive and Preventative Plans This strategy is primarily responsive since it has a focus on identifying intersections with a crash severity issue. One method to use this strategy in a preventative approach is to identify characteristics often associated with intersections that commonly experience a high number of severe crashes (i.e., geometry, volumes, adjacent land use, etc.). This information could then be used to identify locations that have similar characteristics, such that a severe crash may be anticipated to occur at some point in the future. Expected Effectiveness No studies are available that quantify the effectiveness of similar or comparative activities, especially since the effectiveness will depend on the specific countermeasures implemented and the time it takes for implementation to occur. It was estimated that implementation of this strategy should lead to the prevention of at least one fatality and two disabling injuries over the course of five years. Keys to Success Data quality and accessibility will be one of the most important issues for this strategy to succeed. Not only are crash data important, but an intersection attribute database for all roads will be necessary (or expansion of the intersection database for the State maintained roads). This database should not only record the location of intersections, but would ideally contain information on traffic control, posted speed limit, number of lanes, turn lanes, median, street lighting, location of nearby access, etc. Further, dedicated staff that can be proactive in working with local agencies (i.e., seeks out local agencies looking for assistance rather than waiting for a local agency to initiate the request) are likely to make a more significant impact. Several states have identified average crash experience for both urban and rural intersections. While they have identified averages many intersections have substantially higher crash frequencies and these are the appropriate targets for improvements. NCHRP Report 500, Volume 5: A Guide for Addressing Unsignalized Intersection Collisions and Volume 12: A Guide for Reducing Collisions at Signalized Intersections contains such data. Also contained in these guides is a range of specific countermeasures for intersections. MARCH
97 Strategy 16. Work with Local Agencies to Identify Intersections with a Severe Crash Problem Potential Difficulties Creating a statewide intersection database would be a significant task, requiring many years and the assistance of local agencies. Current procedures used in Nebraska convert fatal and injury crashes into equivalent property damage only crashes when prioritizing locations for correction. Since the focus of this strategy is on severe crashes, the State would need to adopt a new approach at prioritizing locations. Appropriate Measures and Data Implementation data would include progress on an intersection attribute database for local agencies. Other implementation data that are important to collect include the number of problem locations identified (especially those under the jurisdiction of local agencies) and the countermeasures implemented as a result. Effectiveness data would include before and after crash data at improved intersections. The crash reductions at improved intersections would be one possible surrogate to estimate the effectiveness of this type of program. Organizational and Institutional Champion Organizational, Institutional, and Policy Issues Issues Affecting Implementation Time Costs Involved Training and Other Personnel Needs Legislative Needs NDOR, LTAP center and county and city highway/roadway agencies. NDOR will need to build relationships with each local agency to help them catalog local intersections and then identify locations that are candidates for countermeasures. Acquiring or building a reliable crash and intersection attribute database is most likely issue to impede this strategy. The cost of this strategy is simply the time and materials needed to identify high crash locations. Assuming two staff work full time with local agencies, the cost of this strategy is likely $150,000 to $250,000. This would not necessarily include all of the costs related to building a database of intersection attributes, especially if maintenance or local agency staff is used to collect the data and clerks are used to perform the data entry. Additional staff will likely need to be trained in the use of the State s crash record system. Other skills that may be needed include database construction and management as well as identification of appropriate countermeasures based on crash data and field observations. None identified. MARCH
98 4.5 Young Driver Critical Strategies Strategy 17. Comprehensive Graduated Driver Licensing System Definition Establish a more comprehensive graduated licensing system (as recommended by the May 16, 2006 Highway Safety Workshop participants). Technical Description A GDL system can have many elements to it, some of which have already been proven effective for reducing the number of young driver crashes. Some of the more common elements included in an improved GDL could include: at least six months of supervised driving for beginners starting at age 16, a night driving restriction that begins at 9:00 PM, and passenger restriction allowing only one or no young unrelated passengers. For an optimal GDL, the Advocates for Highway and Auto Safety recommend four key components: (1) six month holding period where an adult supervisor must be present at all times, (2) hours of supervised driving, (3) a restriction on unsupervised driving between 10:00 PM and 5:00 AM, and (4) a limit of one non-family teenage passenger if no supervising adult is present. Currently, Nebraska has no probationary period or restrictions on the number of young passengers when an adult is not present. While Nebraska does have a 50 hour certification requirement, this can be waived if the teen completes an approved driver safety course. In Nebraska, there is a nighttime driving restriction, but it doesn t begin until midnight. Therefore, the Advocates for Highway and Auto Safety has given Nebraska a poor rating in teen driving for having no provisions in two areas and less than optimal laws in the other two. Target(s) Goal All licensed drivers under the age of 18 during their first year of licensure. The statewide safety goal is approximately a 27% reduction in the number of traffic fatalities forecasted to occur in 2011 and a comprehensive GDL would be expected to have an effectiveness of nearly 20%. Therefore, this strategy should be part of a comprehensive program to reduce fatalities involving young drivers. (Note: For example, a comprehensive program may also use enforcement to ensure young drivers and parents adhere to the provisions.) An example implementation goal would be to have an enhanced and comprehensive GDL program by (Note: The 2006 Nebraska CHSP set a goal to reduce fatal, disabling injury, and visible injury crashes involving young drivers by 4% while increasing the number of youth-related arrests for alcohol, safety belt and speeding by 5 %.) Responsive and Preventative Plans Expected Effectiveness By their nature, a comprehensive GDL would be considered a preventative plan to reduce crashes involving young drivers. Public education and outreach along with aggressive enforcement are components that can help improve the effectiveness of a comprehensive GDL. (Proven) In Wisconsin, implementation of a stronger GDL decreased the total number of crashes involving a young driver by 15%. Fatal crashes decreased 18% and injury crashes by 20%. ( Information provided in the upcoming young driver volume of the NCHRP Report 500 series reports that a 25 35% reduction in 16 year-old crash rate, and a 15 20% reduction in 17 year-old crash rate can be achieved due to a new GDL. However, it is important to remember that the effectiveness of a specific new law depends on the provisions included, the amount and effectiveness of public education campaigns, and the degree to which the law is enforced (by parents and law enforcement agencies). MARCH
99 Strategy 17. Comprehensive Graduated Driver Licensing System Keys to Success In order for a stronger GDL to be effective, parents and young drivers first have to be informed of the new law. Also, law enforcement needs to be informed/educated and given the resources to enforce the law. One of the most important elements is getting parents to realize that even though restrictions on teenage driving privileges may cause some inconveniences, these inconveniences are better than the alternative. Appropriately developed and targeted personal education materials may be the most successful methods to get parental endorsement and adherence. Potential Difficulties At times, policy makers and parents resist limiting the driving privileges of new drivers. There will likely be opposition from individuals or agencies that perceive these laws as intrusive into a person s (and parents) life or that teens are being unfairly targeted due to their age. Parents who no longer have to taxi their teenager to events and localities may view the restrictions as another year of inconvenience if the safety benefits are not clearly articulated and highlighted. However, one means to address these arguments is to make it clear that electing to not control the privileges of young drivers can have a more substantial impact, socially and personally. The social impacts are often in the form of medical costs passed onto others in higher insurance premiums or increased taxes for emergency services to be able to respond. Also, young driver crashes can have a personal impact if a friend or family member was in a vehicle involved in the crash. Appropriate Measures and Data The effectiveness can be measured by the change in the total number of crashes involving young drivers before and after a new GDL goes into effect. In addition, evaluating the number of fatalities and disabling injuries resulting from crashes involving a teen driver would be a measurement of the effectiveness of any new restrictions. It may also be necessary to monitor enforcement efforts (i.e., citations written) before and after any new laws in order to understand the impact enforcement had on the change in behavior. Teen drivers and parents should also be surveyed to make sure the general public comprehends the provisions and to see if they abide by them. Organizational and Institutional Champion Organizational, Institutional, and Policy Issues Issues Affecting Implementation Time Costs Involved Training and Other Personnel Needs Legislative Needs Nebraska Office of Highway Safety, Safety Council, AAA, Highway Safety Advocates Organization and other safety advocacy groups. The current provisional licensing statute would need to be amended by the state legislature. Highway safety professionals need to work closely with law makers to educate them on the importance of a comprehensive GDL. A short implementation period should be built into the system so that DMV, driver educators, law enforcement, and the general public can be informed and given time to make any system changes. The real issue affecting implementation time is the actions that the State Legislature must take first. The estimated cost of staff time and materials to respond to Nebraska Legislature initiated requests for information on the need and benefit of a comprehensive GDL law is estimated at $10,000. This would not be an added cost to government agencies and organizations, but simply the value of resources allocated. Unidentified private or third parties may also incur costs associated with the marketing or promotion of a new law. Minimal training of law enforcement and driver educators would be needed to allow them to learn of the new restrictions for young drivers. Only the Nebraska State Legislature has the authority to amend the current provisional license currently in statute. MARCH
100 Strategy 18. Education and Enforcement of Laws Directed Towards Young Drivers Definition Conduct more (1) public information and (2) enforcement campaigns pertaining to young drivers. Technical Description Several of the young driver focused safety laws that could be targeted through education or enforcement campaigns may include GDL restrictions (especially if strengthened), the zero tolerance law for drivers under the legal drinking age, and safety belt requirements when a young person is behind the wheel. Education material should be target market tested material that uses appropriate graphic images and memorable facts in order to leave a lasting impression with young drivers. Also, targeting enforcement campaigns in areas where there are above average violations and crashes and then publicizing the results can help increase their effectiveness. An example program in Nebraska is Project Nightlife in the Omaha area. This program concentrates on the intermediate drivers and utilizes speakers to meet with students and parents. There is also increased enforcement to target speed, safety belts, and underage drinking and driving. The program is also using crash data to identify target locations with a known safety problem when trying to determine where to provide increased enforcement. Note, specific information pertaining to publicizing and enforcing Nebraska s Zero Tolerance Law is contained in Strategy 6. Target(s) Goal Drivers under the age of 21, especially young drivers who knowingly or unknowingly violate driver safety laws. The statewide safety goal is approximately a 27% reduction in the number of traffic fatalities forecasted to occur in 2011 and education and enforcement will be an important component to achieve a comparable decrease in fatalities involving young drivers. An example implementation goal would be to perform 2,000 additional hours of special overtime enforcement for underage drivers. Furthermore, an implementation goal may be to increase public education campaigns so that the message is heard by an additional 10% of young drivers. (Note: The 2006 Nebraska CHSP set a goal to reduce fatal, disabling injury, and visible injury crashes involving young drivers by 4% while increasing the number of youth-related arrests for alcohol, safety belt and speeding by 5 %.) Responsive and Preventative Plans Expected Effectiveness A program to address all facets of young driver related crashes statewide would be a preventative implementation approach. The strategy could be deployed in a responsive plan by increasing messages and enforcement in areas with particular problems, often seen in a concentration of crashes. Additionally, a program could be responsive if it has an increased focus on a single area of driver safety, as opposed to addressing all areas. (Proven/Experimental) Experience proves out that education and enforcement programs are most effective when coordinated with one another. Further, to improve effectiveness of enforcement, it is best to publicize before it begins and the results after completion (i.e., number of stops, citations and arrests). Getting the information out before a special enforcement program can deter drivers from violating the law in the first place, and sharing the results reinforces the idea. Publicize and enforce Zero Tolerance Laws: In Maryland, a zero tolerance law alone was attributed with reducing drinking and driving crashes by 21% for drivers under the age of 21. After the addition of an extensive public information campaign, alcoholrelated crashes decreased an additional 30%. In Maine, there was a substantial decrease in nighttime single-vehicle crashes (used as a proxy for alcohol-related crashes) two months before a new zero tolerance law went into effect; which coincides with when the new law was extensively publicized. (Volume 16, Strategy 5.1 B3) MARCH
101 Strategy 18. Education and Enforcement of Laws Directed Towards Young Drivers Publicize and enforce safety belt laws for young drivers and their passengers: Results for programs targeted specifically at young drivers and their passengers were not available. However, a review of a South Carolina program that targeted education to population groups with low usage rates has been completed. Overall, safety belt use in South Carolina increased by 8.4 percentage points. In target populations, there was an observed 8.7 percentage point increase in males and a 14.3 percentage point increase in nonwhites. (Volume 11, Strategy 8.1 A2) Keys to Success Potential Difficulties Appropriate Measures and Data Educational campaigns need to be demographically and content appropriate in order to grab the attention of the audience they are targeted towards. They should also keep the message simple by sharing the most important information, which will help people remember the message. Finally, an effective method(s) to deliver the message and/or materials should be chosen so that a large audience is reached. Enforcement needs to be visible in order to encourage good driving behavior; not only during special enforcement campaigns but also for traditional enforcement patrols. Finding the funding to prepare education materials can be difficult, especially if it is decided to use costly methods like media buys. If deployment has additional concentration in specific locations due to a higher number of crashes, then state and local agencies will have to coordinate to determine the best locations, frequency, and duration. For educational approaches, measuring the implementation should at least include the method (i.e., media buys, direct mail, etc.) along with the number. A media buy plan should be developed that reaches the target market at appropriate times. If messages were targeted in problem locations, then this information should also be recorded. To gauge the effectiveness of the education campaigns, before and after surveys could be conducted to determine if a greater percentage of the young drivers and their parents know of the existence of the laws and understand the consequences when the laws are ignored. For the enforcement portion, agencies should track data, such as the total number of stopped vehicles with a young driver, number of citations written to young drivers or their passengers, number of arrests made, and the number of agencies/officers that participated in the program. However, the real effectiveness should be realized over time as there will hopefully be a reduction in the number of fatalities and injuries involving young drivers both statewide and in the communities where programs were concentrated. Organizational and Institutional Champion Organizational, Institutional, and Policy Issues Issues Affecting Implementation Time Costs Involved Nebraska Office of Highway Safety, Project Extra Mile, University of Nebraska-Kearney Safety Center, Nebraska Safety Council, National Safety Council Omaha Chapter, Department of Motor Vehicles Examining Division and other safety advocacy groups. Getting the support and backing of prosecutors, judges, political officials, and law enforcement chiefs will be needed if the program is to reach its full potential. Potentially, many agencies (state, county, and city) will have to be working together in order to develop a comprehensive statewide program. Public information campaigns for young driver laws could begin in as little as two months, taking possibly up to a year to implement. Traditional enforcement should already be on going since there is currently a 0.02 BAC law in Nebraska, a mandatory safety belt for all passengers if the vehicle is operated by a driver with a provisional license, and a curfew law. Special enforcement efforts could likely be organized in as little as a few months. The cost of publicizing and enforcing laws directed towards young drivers will depend heavily on the type of media used (i.e., TV, radio, or print), intensity of enforcement, and frequency of media and enforcement campaigns. As an example, the cost in 2005 for the program to reduce DUI (including special enforcement; see Strategy 5) was $765,000. MARCH
102 Strategy 18. Education and Enforcement of Laws Directed Towards Young Drivers Training and Other Personnel Needs Legislative Needs Existing staff should be able to further publicize and enforce the laws directed towards young drivers. However, if agencies continue to staff special enforcement efforts with officers on overtime, there may be a need to generally increase staff levels to keep officers from becoming burned out from all of the overtime. Enhancing the current GDL law with further curfew, passenger, and violation restrictions to meet the national model law provisions (see Description) would reduce the number of teen fatal crashes based upon the evaluations of those provisions in other jurisdictions. MARCH
103 Strategy 19. Required Driver Training and Improved Training Materials Definition (1) Required driver training for new drivers and (2) improve driver training materials (as recommended by the May 16, 2006 Highway Safety Workshop participants). Technical Description Currently, novice drivers are not required to successfully complete any form of driver training in order to obtain a permit or driver license. This strategy would establish a requirement that all young drivers would have to successfully complete a Department of Motor Vehicles (DMV) approved program by a DMV Certified Instructor to obtain an intermediate (provisional) operators permit. Continued efforts to improve and enhance the content and delivery of driver education/training material will be made. This would include DMV s continued effort to target and emphasize those identified crash causes in the material. The Nebraska Office of Highway Safety has developed and distributed a special Getting Your Nebraska Drivers License A Guide for Teens that has been distributed to every 15 year old in the State for the past 4 years. Target(s) Goal Crashes involving young drivers, especially those within the first few months of receiving their driving privileges. However, training taken early (i.e., age 15) could help prevent a crash years later if drivers remember/use safe driving habits learned at the outset. The statewide safety goal is approximately a 27% reduction in the number of traffic fatalities forecasted to occur in This strategy has shown to lower the percentage of young drivers involved in a crash by five percentage points. Therefore, this strategy should be part of a comprehensive program to prevent fatalities involving young drivers. (Note: For example, a comprehensive program may also use enforcement to ensure young drivers use safety belts and don t drink and drive.) An example implementation goal would be to increase the number of teens that participate in a formal driver education/training course by 10%. (Note: The 2006 Nebraska CHSP set a goal to reduce fatal, disabling injury, and visible injury crashes involving young drivers by 4% while increasing the number of youth-related arrests for alcohol, safety belt and speeding by 5 %.) Responsive and Preventative Plans Expected Effectiveness Use of this strategy would strictly be a preventative plan. (Tried/Experimental) The Nebraska DMV has examined those teen drivers that have completed the existing DMV Driver Training Course compared to those teen drivers that have opted for the 50-hour driving log option. This comparison has revealed that the teens taking the DMV approved course have statistically significant fewer crashes, traffic violation convictions, and license suspensions than those opting for the 50-hour log provision. Specifically, an examination of the Nebraska data from 1999 to 2004 comparing the two groups found that only 23% of those that completed the driver training experienced one or more moving violations compared to 34% of those that opted for only logging the 50 hours behind the wheel. Of those that completed driver training, 19% were involved in one or more crashes compared to 22% of those with the 50-hour log. Of those completing the driver training, only 2% had their licenses suspended or revoked compared to 7% of those that utilized the 50-hour log. MARCH
104 Strategy 19. Required Driver Training and Improved Training Materials Recent national research hasn t found driver training and education programs to be effective at reducing crashes. This is especially believed to be true if completion of these courses allows an individual to get their license at a younger age. (Source: J.H. Hedlund. Countermeasures that Work: A Highway Safety Countermeasure Guide for State Highway Safety Offices. DOT HS ) However, considering the results of the driver training program in Nebraska, it is still believed that driver training and education can be effective as part of a comprehensive graduated licensing (GDL) program. Driver education and training could be used to complement other GDL requirements such as nighttime driving restrictions, passenger restrictions, probationary period, strict enforcement of Zero Tolerance, and safety belt laws. (See Strategy 17 for more information on a GDL program.) Keys to Success Potential Difficulties The quality of the materials and instructors (both classroom and behind-the-wheel) are important to a successful program. Training materials related to the safety aspect of driver education must focus on the type of errors and driver behavior that most often result in a young driver being involved in a crash. Also, integrating this strategy with a comprehensive GDL is thought to be necessary in order to maximize the benefit. Parents may be reluctant to support driver training, especially if the cost is passed onto the students and/or their parents. In rural areas where there is a low density of students, it is difficult to provide easy access to approved courses. Web based training for the classroom portion, which could be especially useful in rural areas, is now being tested by the University of Nebraska. Appropriate Measures and Data Implementation data would include the number of young drivers that have completed a formal driver-training program, especially those that used training materials with an enhanced focus. To measure the effectiveness, students that complete the program should be compared to a control group (i.e., students that received their license without participating in a formal driving training). This should include monitoring crash data as well as the number of warnings and citations given. (Note: DMV has an evaluation process already in place.) Organizational and Institutional Champion Organizational, Institutional, and Policy Issues Issues Affecting Implementation Time Costs Involved Department of Motor Vehicles, Nebraska Office of Highway Safety, Nebraska Safety Council, University of Nebraska Kearney Safety Center, State Community Colleges and other safety advocacy groups. The DMV wii need to continue monitoring approved driver training programs to ensure guidelines and quality standards will be met. Requiring driver training for young drivers couldn t be implemented without enabling legislation. Developing new training materials to have a focus on the primary contributing factors in young driver crashes could easily take two years or more. Nebraska already produces a Driver s Manual, and there are already established Rules and Regulations on what is required within the training materials. To enhance materials would require a public hearing for proposed Rules & Regulations changes and would involve minimal costs. The Nebraska Office of Highway Safety already provides an annual teen driver guide that is provided to every 15 year old in the state, so no additional funding would be needed for printing. The cost of developing new driver training materials or operating a statewide required driver training program could reach $200,000 annually. MARCH
105 Strategy 19. Required Driver Training and Improved Training Materials Training and Other Personnel Needs With required driver training, there are insufficient numbers of trained and qualified instructors. There will be a need to train more instructors before fully implementing a drivertraining requirement. State agencies should already have the staff with the necessary skills in order to develop new training manuals for novice drivers. Legislative Needs To require driver training prior to a young driver obtaining a driver permit would require enabling legislation. MARCH
106 Strategy 20. Safe Community Coalitions Definition Develop community coalition programs focused on young drivers. Technical Description Target(s) Goal Community coalitions are often non-profit organizations (could rely on private-public partnerships to fund) focused on reducing the number of crashes in a specific area. Similar efforts in other states have taken a focus on issues related to young drivers and have demonstrated success at reducing crashes involving young drivers, specifically high school students. Such successful programs have used safety belt challenges, safety reminder signs posted at high school parking lot exits, parent-teen presentations, and a display of a vehicle driven by a young driver and involved in a fatal crash. Some coalitions are beginning to experiment with programs where at an officer s (or judges) discretion, a young driver stopped for a minor driving violation has an option to attend a safety course with a parent. After successfully completing the course, the young driver won t have to pay the fine and citation is removed from their record. Crashes involving young drivers, especially those of the high school age. The statewide safety goal is approximately a 27% reduction in the number of traffic fatalities forecasted to occur in 2011 and community coalitions are expected to have an effectiveness of 24%. Therefore, statewide coverage of active and effective safe community coalitions would be an important component to achieving the safety goal. An example implementation goal would be to initiate ten new safe community coalitions by 2011, in addition to the existing 23 coalitions already created. (Note: The 2006 Nebraska CHSP set a goal to reduce fatal, disabling injury, and visible injury crashes involving young drivers by 4% while increasing the number of youth-related arrests for alcohol, safety belt and speeding by 5 %.) Responsive and Preventative Plans Expected Effectiveness The mission and actions of a Safe Communities Coalition could be both preventative and responsive. Most Safe Communities Coalitions work through public education campaigns to increase awareness of traffic safety and reduce crashes; this would be a preventative deployment. However, a Safe Community Coalition could use a responsive deployment by focusing messages along corridors or in areas where the greatest number of crashes occur. Further, targeting key segments on the population overrepresented in crashes (especially fatal and disabling crashes) can be another way efforts have a responsive nature. (Tried) Between 1997 and 2005, the efforts of Safe Communities of Wright County (Minnesota) were instrumental in a 34% reduction in fatal and severe injury crashes for all age groups. Safety belt challenges conducted at high schools showed an initial 19% increase in safety belt use rate. Nebraska already has a significant number of Safe Community type programs that have been targeting young drivers with community efforts including the safety belt use challenges. Many of these have been operating for many years and have become institutionalized locally, many connected with the local health departments. Keys to Success Potential Difficulties Appropriate Measures and Data A successful Safe Community Coalition will first have the support of many public and private entities that are have a desire to see highway safety improved in their area. Further, an effective leader will be necessary that will be proactive in getting the message out and has an ability to identify and develop quality programs. Safe Community Coalitions often receive funding from grants (Federal or State) or donations from agencies or private business. Groups may find it difficult to acquire funding every year. A Safe Community Coalition should record the different types of programs it participates in. The effectiveness data may range from changes in driver behavior (i.e., increase in safety belt use, reduction in distracted driving, reduction in speeding, etc.) to the change in crashes. MARCH
107 Strategy 20. Safe Community Coalitions Organizational and Institutional Champion Organizational, Institutional, and Policy Issues Issues Affecting Implementation Time Costs Involved Training and Other Personnel Needs Legislative Needs Nebraska Office of Highway Safety A Safe Community Coalition relies on building partnerships across many agencies and businesses. These partnerships are likely to be across groups that would typically not work with one another. Nebraska s statewide Click It, Don t Risk It Coalition has been providing support and the ability to link most of the existing community coalitions. Generally, the time to establish a Safe Community Coalition can happen relatively quickly after the initial funding is identified. Realistically, the time to develop a mission, build partnerships, identify problem areas, and develop and implement countermeasures may take up to a year. Identifiable results may not be recognizable immediately until programs have time to mature. The cost of operating a Safe Community Coalition will depend on the number of staff needed and the activities performed. Some examples use only one part-time staff while others may have multiple full-time staff. The total operating cost of a Safe Communities Coalition in Nebraska can vary from only $3,000 to $15,000 based on their activities. Safe Community Coalition leaders need many different skills to run a successful program. Some examples of necessary skills include managing budgets; coordinating with multiple businesses, agencies, enforcement departments, and schools; performing analysis of crash data; assisting in the development of educational materials - to name just a few. None identified. MARCH
108
109 5. Deployment Plan 5.1 Objective The primary goal of this Plan is to reduce the traffic fatality rate in Nebraska by approximately 38%, from 1.6 fatalities per 100 million vehicle miles of travel in 2003 to 1.0 by Achieving this goal is expected to reduce the annual number of traffic fatalities by 80 from the number of traffic fatalities forecasted for Based on a phased approach to implementation of the Critical Strategies, approximately 15 to 20 fatalities need to be prevented each year beginning in 2007 or 2008, respectively. The process for developing this Plan focused on using Nebraska s crash records and input from a wide variety of safety partners to screen the universe of potential safety strategies to a short list of strategies that are most directly linked to the factors contributing to fatal and life changing injury crashes. This screening process was completed and the resulting list of twenty Critical Strategies is documented in Chapter 3. However, even with this short list of strategies, there are still hundreds of possible safety investment scenarios, but experience suggests that only a few combinations of strategies will be the most effective at achieving the stated fatal crash reduction goal. As a result, the final component of the Nebraska SHSP and the objective of this Chapter is to provide guidance on how to invest safety funds and resources among the Critical Strategies in order to offer insight on how to achieve the safety goal and to provide proof that the goal is in fact attainable. To assist with the decision making process, a spreadsheet tool (Effectiveness Spreadsheet) was developed that provides an estimate of both the safety benefits (i.e., lives saved and disabling injuries prevented) and the implementation costs associated with deployment of the Critical Strategies. Detailed information regarding the Effectiveness Spreadsheet is available in Appendix III. 5.2 Safety Investment Analysis The Effectiveness Spreadsheet was used to complete an analysis of several investment scenarios, summarized in Table 5.1 with detailed information presented in Appendix III. The three basic concepts tested with the spreadsheet tool are: 1. Engineering Only vs. Comprehensive: Determine if flexing 10% of the safety funds in the Highway Safety Improvement Program to increase education, enforcement, or EMS activities could increase the number of lives saved when compared to investing in only engineering strategies. The focus was on the nearly $6 million dollars in Federal funding that is in the Hazard Elimination Program controlled by NDOR and does not include funds in safety programs at enforcement, education or EMS agencies. 2. Broad Selection vs. Focused Selection. One side of the comparison is selecting a wide variety strategies, sometimes high-cost countermeasures, which results in deployment of a specific countermeasure at a relatively few number of locations. The comparison is to a focused selection of countermeasures that tend to be very effective and are low-cost (although a limited number of high-cost countermeasures were selected) which means each MARCH
110 countermeasure can be deployed at a greater number of locations, possibly as part of a preventative approach. For both types of investment, an attempt was made to select a realistic mix of strategies that would comprise a state s safety plan rather than simply directing all funds at the one project that has the highest benefit-cost ratio. 3. Enabling Legislation: Use of a combination of strategies which require no enabling legislation is compared to safety investments where the State Legislature would first need to pass enabling legislation before deployment could occur. This will highlight the importance that elected officials have in reducing the number of traffic fatalities. TABLE 5.1 Example Investment Scenarios and Expected Outcomes Investment Scenario Selection of Strategies Need for State Legislature to Pass New Laws Investment Funding Notes* Estimated Number of Lives Saved Annually 1 Engineering only Broad selection 2 Engineering only Focused selection Not reliant on new legislation Not reliant on new legislation $6 Million 2 3 $6 Million Engineering only Focused selection Not reliant on new legislation Based on scenario #2, would expect the needed funding would be approximately $25 Million Comprehensive Broad selection Not reliant on new legislation $6 Million with 10% flexed to education, enforcement, or EMS Comprehensive Focused selection Not reliant on new legislation $6 Million with 10% flexed to education, enforcement, or EMS Comprehensive Broad selection Uses strategies which require enabling legislation $6 Million with 10% flexed to education, enforcement, or EMS Comprehensive Focused selection Uses strategies which require enabling legislation $6 Million with 10% flexed to education, enforcement, or EMS. > 50 * Note: $6 million is a representative amount, approximately equal to the Federal funds available through the Hazard Elimination Program as part of HSIP. The High Risk Rural Roads funds and matching state funds were not included. The results of this effort revealed several key conclusions: 1. Investment Scenario #1 reveals that use of Nebraska s HSIP funds in the traditional way implementing a wide selection of engineering strategies broadly across the states system of roads - is not likely to achieve results (lives saved) consistent with the adopted safety goal, there simply are not enough serious crashes susceptible to correction based on improving the infrastructure. While a focused selection of countermeasures may increase the number of lives saved, this is still below the reductions needed in order to achieve Nebraska s safety goal (Investment Scenario #2). MARCH
111 2. Using NDOR s HSIP funds in a more comprehensive way (investing in all four Safety E s) can increase the number of lives saved, but probably not to the point of achieving the adopted safety goal (Investment Scenarios #4 and #5). 3. Two of the most effective strategies (recommended by the May 16, 2006 Highway Safety Workshop participants and based on the number of lives saved) in the overall list of Critical Strategies are consideration of adopting a primary safety belt law and enhancing the GDL program for young drivers. Enacting either or both of these laws would likely result in significant reductions in traffic related fatalities and disabling injuries such that the trend line necessary to meet the adopted safety goal would be exceeded (Investment Scenarios #6 and #7). However, only the State Legislature has the authority to pass enabling legislation. As illustrated in Figure 5.1, national research found that only 3% of crashes could be attributable to just the roadway (7). Roadway-related crashes increased to 34% of all crashes when the roadway was also considered in combination with the driver and vehicle influences. In contrast, the only contributing factor in 57% of crashes was the driver, and driver-related crashes increased to over 90% if interactions with roadway and vehicle were included. This illustrates why strategies like considering a primary safety belt law and enhancing the GDL program, which address person behaviors as opposed to infrastructurebased engineering countermeasures, are expected to be more successful at reducing fatalities and disabling injuries. Roadway 34% Driver 93% 3% 27% 57% 1% 3% 6% 2% Vehicle 12% FIGURE 5.1 Contributing Factors in Crashes that Occurred in the United States (7) 4. Investments to improve data systems were not identified as capable of preventing a large number of traffic fatalities during the analysis of investment options. This outcome is most likely due to the lack of research results at the national level, as opposed to a lack of confidence in the value of investing in data systems. Accurate data, particularly as it relates to crash locations and key contributing factors (roadway, driver and vehicle characteristics) are critical to being able to respond to public comments about dangerous locations. In MARCH

112 addition, moving towards a more integrated system among state agencies can improve proactive efforts to implement mitigation strategies at crash prone locations based on identifying the correlation between crash frequency, severity and roadway/traffic control characteristics. Therefore, a basic assumption is that Nebraska would continue to invest in data systems enhancements and integration, which was not reflected in the investment scenarios. Each of the investment analyses assumed an incremental approach to achieving the adopted safety goal, as illustrated in Figure 5.2. The number of lives saved and disabling injuries reduced reported in this Chapter is for the first year of Nebraska s safety program that includes investment in the new Critical Strategies. The results (lives saved and injuries prevented) in subsequent years depends on continued efforts to increase the focus of the State s safety program on the most highly effective of the identified Strategies. FIGURE 5.2 Incremental Approach to Achieve Safety Goal Nebraska can achieve the adopted safety goal, but meeting the goal likely requires significant changes in the delivery of HSIP. The safety program will have to be more comprehensive, more systematic, more proactive and more narrowly focused on a small number of the most effective of the Critical Strategies. In addition, it appears that passage of a new primary safety belt law and/or a more comprehensive GDL program is also required. MARCH
113 5.3 Overview of Funding Available for Safety Programs In Nebraska, there are several available sources for funding the implementation of the Critical Strategies. For example, HSIP contains approximately $10 million in Federal funding through FHWA, of which $6 million for the Hazard Elimination Program was analyzed in the investment scenarios. There is also $3.7 million for the Highway-Rail program, $1 million for the High Risk Rural Roads Program, and the necessary State matching funds. In addition to NDOR, other agencies make significant investments to improve traffic Safety. In the 2006 fiscal year, there was an additional $3.8 million spent by the Nebraska Office of Highway Safety and $2.4 million from the Nebraska State Patrol Carrier Enforcement. A one-year breakdown of how each agency invested these funds in the 2006 fiscal year is available in Appendix III. 5.4 Implementing, Evaluating, Revising, and Reporting on the Nebraska SHSP The Nebraska SHSP will be implemented through the normal statewide transportation planning and programming process. Funding for identified safety projects will come from a number of different sources, including the FHWA HSIP funds administered by NDOR, the various NHTSA funds (Section 402, etc.) administered by the Department of Motor Vehicles, and the Motor Carrier Safety Assistance funds administered by the State Patrol. Each agency will be responsible for following the planning and programming process required by its federal counterpart. HSIP projects will be listed on the Safety Schedule of Improvements, an attachment to the Statewide Transportation Improvement Program (STIP). The Safety Schedule of Improvements (SSI) is produced annually and updated as needed, allowing safety projects, which often have a quicker turnover than regular highway projects, to be programmed on a more flexible basis. The Safety Schedule of Improvements must be approved by FHWA. After the completion of the SHSP, the Interagency Safety Committee will continue to meet regularly to set priorities for and to oversee implementation of the safety program. Individual projects will be selected to further the goals of the SHSP. A responsible agency will be assigned to each project. This agency will be responsible for implementation of the project, reporting on the progress of the project at future Interagency Safety Committee meetings, and, after the project is completed, performing an evaluation of the effectiveness of the project. NDOR will attempt to evaluate all HSIP projects which are chosen on the basis of actual crash data. A tracking system will be maintained to allow the Interagency Safety Committee to follow the progress of a project towards completion. Evaluation results should help guide the committee in making future project decisions. The CEAs and Critical Strategies identified in the Nebraska SHSP may be relevant for the next five years, or the data may show that an update is needed after several years. However, the expectation is no drastic changes in the highway safety problems identified will change in the near term. Also, time will be needed to implement the new projects identified, and also determine their effectiveness. The Interagency Safety Committee will periodically review the crash data to look for new safety initiatives. MARCH
114 The NDOR will report annually to FHWA on the HSIP. This will include types of projects initiated, funds expended, and evaluation results. MARCH
115 6. Key Conclusions Nebraska s Strategic Highway Safety Plan (SHSP) was prepared in accordance with the Federal Highway Administration s (FHWA) guidance the analytical process was driven by crash data, the State s safety partners (representing enforcement, education and emergency services) participated in the entire process and the Plan addresses the following four key items: Statewide Safety Goal The Nebraska Interagency Safety Committee has adopted a new safety performance measure fatal and life changing injury crashes and a new goal of a reducing the statewide fatality rate by 38%, from a rate 1.6 fatalities per 100 million vehicle miles of travel in 2003 to a rate of 1.0 in Achieving this goal is expected to reduce the annual number of traffic fatalities in Nebraska by almost 80 per year (compared to the number of fatalities forecasted for 2011) at the end of the phased implementation period. Critical Emphasis Areas Nebraska s crash records were used to identify the areas that are emphasized in the Plan based on the number of related fatal crashes the notion being that these Emphasis Areas represent the greatest opportunity for successfully reducing the number of severe crashes. The Interagency Safety Committee then undertook a screening process that ultimately resulted in the selection of five areas of focus the Critical Emphasis Areas (CEAs) for the Plan: 1. Increasing Safety Belt Usage 2. Keeping Vehicles on the Roadway, Minimizing the Consequences of Leaving the Road, & Reducing Head-On and Across-Median Crashes 3. Reducing Impaired Driving 4. Improving the Design and Operation of Highway Intersections 5. Addressing the Over Involvement of Young Drivers Critical Safety Strategies The selection of the five CEAs focused the vision of the Plan from an initial universe of more than 500 alternative safety strategies to approximately 160 strategies that are directly related to the factors contributing to severe crashes in Nebraska. This reduced set of strategies was then further screened by the safety partners to a list of 20 Critical Strategies addressing the Four Safety E s about one-half of the strategies address engineering issues and the rest are evenly divided between enforcement and education. This distribution is consistent with the results of the analysis of factors contributing to severe crashes in Nebraska and with research at the national level (7) that indicates driver behavior is a primary factor in more than onehalf of all crashes. A summary of the Critical Safety Strategies is illustrated in Figure 6.1. It should be noted that most of the Critical Strategies (those dealing with engineering and emergency medical services) can be implemented almost immediately, with the cooperation of the responsible agency and the allocation of the necessary financial resources. However, MARCH

116 several strategies dealing with enforcement and young drivers (enhancing safety belt law, automated enforcement and an enhanced Graduated Drivers License program) would require new legislation before they could be implemented. FIGURE 6.1 Summary of Nebraska s Critical Strategies Note: Several Critical Strategies had multiple components and addressed more than one of the Four Safety E s The strategies are based on material and guidance in the NCHRP Report 500 series, were prioritized by Safety Partners at a workshop on May 16, 2006 and with concurrence by the Nebraska Interagency Safety Committee. Safety Investment Options The process for screening safety strategies narrowed the focus of the Plan from hundreds of potential strategies to the twenty highest priority strategies. However, even after this prioritization there are still thousands of possible ways to invest safety dollars in different combinations of strategies. The analysis of alternative safety investment scenarios, using a specially developed spreadsheet tool, identified six key characteristics that are associated with the most effective investment of safety dollars and therefore most likely to result in Nebraska achieving the adopted safety goal. Nebraska s six keys to safety investment include: MARCH
117 1. Invest in all four Safety E s. 2. Focus the safety investment in the few strategies that are associated with the largest pool of fatal and disabling injury crashes. 3. Invest heavily in strategies that have proven to produce crash reductions, have relatively high safety effectiveness ratios, are relatively low cost and therefore can be widely deployed across Nebraska s entire system of highways. 4. Find a balance between the traditional reactive approach to safety and a proactive approach that is expected to be more effective at addressing the few widely distributed serious crashes that are over represented in rural areas. 5. Develop a method to direct safety resources to local road systems, which account for almost 40% of the fatal crashes in Nebraska. 6. The enforcement and young driver strategies that require new legislation are linked to large pools of severe crashes that are susceptible to correction, have low to moderate deployment costs and relatively high effectiveness ratios. As a result, the addition of these strategies to an overall safety plan would significantly increase Nebraska s ability to meet the adopted safety goal. It should be noted that additional investments to improve data systems was not identified as being highly effective at reducing severe crashes. It appears that this is likely a function of the lack of research results at the national level as opposed to providing a true picture of the actual value of good data. In fact, traffic safety professionals in Nebraska consider improving the crash data system to be a high priority. Without accurate data, both from the perspective of crash location and integrated across a variety of state agencies, the task of identifying crash prone locations and linking causative factors to mitigation strategies becomes far too speculative. As a result, Nebraska chooses to include data systems as a key part of the SHSP and will continue to make the necessary investment of safety dollars in order to support the development of a crash system that is highly accurate and integrated across the State s safety agencies. Finally, the greatest challenge facing traffic safety professionals in Nebraska is the need to acknowledge that the effort to reduce fatal and life changing injuries is tied to implementing a new, more effective safety program that is different than what has been done in the past. The previous program is associated with a trend line for highway traffic fatalities that is increasing. The analysis of safety investment options proves that Nebraska can achieve the adopted safety goal of reducing the fatal crash rate to the national goal of 1.0, a 38% reduction. However, doing so will require doing things differently than what has been the practice in recent years. This includes investing in additional enforcement, education and emergency services, being more proactive, engaging the legislature to improve dealing with safety belts, electronic enforcement and young drivers and focusing safety investments on the small subset of low cost strategies that are linked to large pools of severe crashes and that can be widely deployed across all road systems in Nebraska. MARCH
118
119 References Nebraska Strategic Highway Safety Plan Information from Nebraska s crash database provided by the NDOR Safety Section of the Traffic Engineering Division. 3. AASHTO Strategic Highway Safety Plan: A Comprehensive Plan to Substantially Reduce Vehicle- Related Fatalities and Injuries on the Nation s Highways. American Association of State Highway and Transportation Officials, Washington, D.C., Bahar, G., M. Maslian, C. Mollett, and B. Persaud. National Cooperative Highway Research Program Report 501: Integrated Safety Management Process. TRB, National Research Council, Washington, D.C., Strategic Highway Safety Plans: A Champion s Guide to Saving Lives. Guidance to Supplement SAFETEA-LU Requirements. Federal Highway Administration, Washington, D.C., April 5, Baxter, J.R. Building Safe Roads. Public Roads, Vol. 67, No. 6, Lum, H. and Reagan, J.A. Interactive Highway Safety Design Model: Accident Predictive Module. Public Roads, Vol. 58, No. 3, MARCH 2007 R-1
120
121 Appendix I Safety Countermeasures for the Selected Critical Emphasis Area
122
123 TABLE A-1 Lane Departure Strategies Objectives 15.A Keep vehicles from encroaching into the opposite lane 15.B Minimize the likelihood of crashing into an oncoming vehicle 15.C Keep vehicles from encroaching on the roadside Strategies 15.A1 Keep vehicles from encroaching into opposing lanes or running ff the road by installing: centerline rumble strips for two-lane roads; shoulder rumble strips; profiled thermoplastic strips, raised pavement markers, or other methods for centerlines in order to provide better day, night, and wet visibility; or edgeline profile marking, edgeline rumble strips or modified shoulder rumble strips on section with narrow or no paved shoulders 15.A2 Provide wider cross sections on two-lane roads 15.A3 Provide center two-way left turn lanes for four- and two-lane roads 15.C1 Provide enhanced delineation and warning of sharp curves or unexpected changes in horizontal alignment, improve horizontal curve geometry, and provide adequate sight distance on approach to horizontal curves Relative Cost to Implement and Operate Low Moderate to High Moderate Low to High Effectiveness Tried/Experimental Centerline Rumble Strips: Delaware study showed a 31% fewer head-on crashes while a Colorado study showed 35% fewer head-on crashes. Shoulder Rumble Strips: 20%-30% reduction of single vehicle ROR crashes in rural areas; expected to be less effective in urban areas. Experimental (MN: 50% fewer total crashes.) Tried (MN: 30% fewer total crashes.) Typical Timeframe for Implementation Short (< 1 yr.) to Medium (1-2 yrs.) Long (>2 yrs.) Short (< 1 yr.) Priority Ranking 15.A4 Reallocate total two-lane roadway width (lane and shoulder) to include a narrow buffer median Low Tried Short (< 1 yr.) Low 15.A5 Prohibit/restrict trucks with very long semitrailers on roads with horizontal curves that cannot accommodate truck offtracking Moderate Tried Medium (1-2 yrs.) Low 15.B1 Use alternating passing lanes or four-lane sections at key locations Moderate to High Tried Medium (1-2 yrs.) Medium 15.B2 Install median barriers for narrow-width medians on multilane roads Moderate Tried Medium (1-2 yrs.) Medium 15.B3 Deploy No Passing Zone signs as appropriate Low Tried Medium (1-2 yrs.) Low Proven/Tried/ Experimental For average to well designed roads, post-mounted delineators may reduce ROR crashes by 15%. For total crashes on curves of rural 2-lane roads: 15-80% reduction for curve flattening [varies depending on initial and final degree of curvature]; 5-30% reduction for lane and shoulder widening. Short (< 1 yr.) to Long (> 2 yrs.) 15.C2 Provide enhanced pavement markings, such as 6 or 8 markings instead of 4 markings or improved day/night/wet visibility Low Tried Short (< 1 yr.) Medium 15.C3 Provide skid-resistant pavements Moderate Tried Medium (1-2 yrs.) Low 15.C4 Eliminate shoulder drop-off by paving shoulders, widening substandard shoulders, or maintenance of gravel shoulders and construct a Low Tried/Experimental Short (<1 yr.) to beveled edge (a.k.a. safety edge) to assist drivers getting back onto the travel MN: 15% reduction in crashes. Medium (1-2 yrs.) High lane if on the shoulder 15.C13 Provide lighting of the sharp horizontal curves Moderate Tried Medium (1-2 yrs.) Low 15.C14 Provide dynamic curve warning system 15.C15 Improve or restore superelevation 15.C16 Install automated anti-icing systems 15.C17 On roadways with narrow shoulders (i.e., 2 feet), pave shoulders and then stripe 11 lanes to control speeds Moderate Moderate to High Moderate to High Low to Moderate Tried MN: Significant improvement of curve navigation, no speed reduction. Proven If superelevation is deficient: 5% crash reduction for an improvement less than A 10% crash reduction for an improvement of 0.02 or more. Medium (1-2 yrs.) Medium (1-2 yrs.) High Medium Medium Medium Medium Medium Tried Medium (1-2 yrs.) Medium Tried Short (< 1 yr.) Low MARCH 2007 APPENDIX I A.1-1
124 TABLE A-1 Lane Departure Strategies Objectives 15.D Minimize the likelihood of crashing into an object or over turning if the vehicle travels beyond the edge of the shoulder 15.E Reduce the severity of the crash 15.F Evaluate system, infrastructure, and policy 15.G Provide for driver education 15.H Provide targeted enforcement Strategies Relative Cost to Implement and Operate Effectiveness Typical Timeframe for Implementation 15.D1 Provide shoulder treatments at key locations Moderate Tried Medium (1-2 yrs.) Medium 15.D2 Design safer slopes and ditches to prevent rollovers 15.D3 Remove/relocate objects, such as trees, utility poles, light poles, and etc., in hazardous locations (i.e., provide adequate clear zones), extend culverts to move outside of clearzone 15.D4 Delineation of roadside objects, such as trees, utility poles, light poles, and etc., in hazardous locations 15.D5 Flatten transverse slopes (a.k.a. entrance slopes) and use culvert safety grates. 15.E1 Inventory, improve, update, and maintain roadside hardware including terminals 15.E2 Improve barriers and attenuation systems 15.E3 Shield motorists from striking roadside objects, such as trees, utility poles, light poles, driving off of steep slopes 15.E4 Modify roadside clear zone in the vicinity of trees, utility poles, light poles, and etc. 15.E5 Use breakaway devices Moderate to High Low to Moderate Proven (On rural 2-lane roads: 6-27% reduction for single vehicle crashes and 3-15% reduction in total crashes for sideslope flattening [varies depending on initial and final sideslope]. Washington, 25-45% reduction in ROR crashes due to sideslope flattening.) Proven (On rural 2-lane roads with a ft. clear zone: 13-44% reduction in ROR, head-on and sideswipe crashes for increased clear zones [varies depending on additional clearzone provided].) Medium (1-2 yrs.) Short (< 1 yr.) Priority Ranking Medium Medium Low Experimental Short (< 1 yr.) Low Moderate to High Moderate to High Moderate to High Moderate Moderate to High Moderate to High Tried Medium (1-2 yrs.) Low Tried Medium (1-2 yrs.) Medium Tried Medium (1-2 yrs.) Medium Proven (Reduction in ROR crash severity at an increase in number of guardrail crashes. Appendix A of Roadside Design Guide provides method to evaluate a location.) Short (< 1 yr.) Medium Tried Medium (1-2 yrs.) Low Tried Medium (1-2 yrs.) Low 15.F1 Inventory existing guardrail, develop criteria with which to evaluate the priority for replacing substandard guardrail, apply the criteria and determine a priority list to replace guardrail and systematically replace all Moderate Experimental Medium (1-2 yrs.) Low substandard guardrail. 15.F2 Develop a comprehensive median barrier policy that clearly defines warrants and improves upon the guidelines of the Roadside Design Guide Low Experimental Medium (1-2 yrs.) Low 15.F3 Identify corridors and locations with a disproportionately large number of actual and/or potential for run-off the road and head-on crashes and develop/implement a comprehensive and coordinated response Moderate Experimental Medium (1-2 yrs.) Medium 15.F4 Participate in road safety audits Low Tried Medium (1-2 yrs.) Medium 15.G1 Train and educate roadway users to safely recover if on the shoulder and understand the dangers of speeding and risk taking behavior High Experimental Medium (1-2 yrs.) Low 15.G2 Train and educate roadway users on passing zone markings and lanes High Experimental Medium (1-2 yrs.) Low 15.G3 Legislature education on safety issues Low 15.H1 Identify segments with over representation of head-on and/or sideswipe crashes and then use targeted enforcement for vehicle passing regulations 15.H2 Identify segments with over representation of run-off road crashes and then use targeted enforcement on high incident corridors Moderate to High Moderate to High Tried Short (<1 yr.) Low Tried Short (<1 yr.) Low MARCH 2007 APPENDIX I A.1-2
125 TABLE A-2 Alcohol-Related Strategies Objectives 5.A Reduce Excessive Drinking and Underage Drinking 5.B Enforce DUI Laws 5.C Control High BAC and Repeat Offenders Strategies Relative Cost to Implement and Operate Effectiveness Typical Timeframe for Implementation 5.A1 Increase the excise tax on beer Low Tried Long (>2 yrs.) Low 5.A2 Require responsible beverage service policies for alcohol servers and Moderate to Proven/Tried Short (<1 yr.) to retailers and continue to educate the general public, business owners, and 23% decrease in Oregon s single-vehicle nighttime injury crashes after High High Long (>2 yrs.) alcohol servers on the dangers of impaired driving implementing server training law. 5.A3 Conduct well-publicized compliance checks of alcohol retailers to Low Tried Short (<1 yr.) High reduce sales to underage persons 5.A4 Employ screening and brief interventions in health care settings Low Tried Short (<1 yr.) Low 5.B1 Increase number of highly publicized DUI checkpoints and saturation patrols (coordinated throughout the state), enhance DUI detection through related traffic enforcement, and further encourage cooperation between regional safety partners to identify target locations, times, etc. for enforcement efforts Note: For DUI checkpoints and saturation patrols, it is important to address areas with a high number fatal crashes and to switch back-and-forth between the two enforcement methods to keep officers from becoming burned out. 5.B2 Publicize and enforce zero tolerance laws for drivers under age 21, require parent involvement and attendance (possibly a graduated licensing provision), and eliminate diversion programs and plea bargains to nonalcohol offenses (i.e., improve DUI process and conviction rate) 5.C1 Seize vehicles administratively upon arrest Low to High Moderate Moderate Proven/Tried (NHTSA: routine highly publicized use would reduce alcohol-related fatalities by 15%. Range: 10% - 30%.) Proven/Tried Maryland: law alone reduced drinking-driving crashes among drivers <21 by 21%. Coupled with extensive PI&E campaign, reduced crashes additional 30%. Proven Studies show a decrease of 25% [first time] to 38% [repeat offenders]. Short (<1 yr.) Short (<1 yr.) to Long (>2 yrs.) Medium (1-2 yrs.) Priority Ranking High High Low MARCH 2007 APPENDIX I A.1-3
126 TABLE A-3 Unbelted Vehicle Occupant Strategies Objectives 8.A Maximize use of occupant restraints by all vehicle occupants 8.B Insure that restraints, especially child and infant restraints, are properly used 8.C Provide access to appropriate information, materials, and guidelines for those implementing programs to increase occupant restraint use Strategies 8.A1 Provide enhanced public education to population groups with lower than average restraint use rates and conduct highly publicized enforcement campaigns to maximize restraint use NOTE: If safety belt use rate stays static (or decreases), then focus switches from education to enforcement 8.A2 Support adoption of a primary safety belt law that eliminates gaps in safety belt, child seat, and booster seat laws; strengthen fines for safety belt violations Note: Primary safety belt law is first and foremost; however, stronger penalties would be a great addition to a primary law, but could also be enacted separately. 8.A3 Increase use of changeable message boards and signs encouraging restraint use 8.B1 Provide community locations for instruction in proper child restraint use and conduct high profile child restraint inspection events at multiple community locations 8.B2 Train law enforcement personnel to check for proper child restraint use in all motorist encounters 8.C1 Create state-level clearing houses for materials that offer guidance in implementing programs to increase restraint use Relative Cost to Implement and Operate Moderate to High Low Effectiveness Proven Enforcement: North Carolina case example; since 1993, there has been a 19% increase in seat belt use and a 14% decrease in fatal and serious injuries. Education: South Carolina case example; overall usage rates increased from 65.5%to 73.9%; nonwhite use rates increased from 56.1% to 70.4%; seatbelt use among males increased from 59.2% to 67.9%; and there was a 29.5% decrease in fatalities. Jefferson County (Wisconsin) Safe Communities Coalition: has achieved more than 87% usage in selected populations. Proven/Experimental In 2003, seat belt use in states with a primary law is on average 11 percentage points higher than a state with a secondary law. Typical Timeframe for Implementation Short (<1 yr.) to Medium (1-2 yrs.) Medium (1-2 yrs.) Priority Ranking Low Tried Medium (1-2 yrs.) Low Low Proven/Tried Short (<1 yr.) High Moderate Tried Short (<1 yr.) Low Moderate Experimental Medium (1-2 yrs.) Medium High High MARCH 2007 APPENDIX I A.1-4
127 TABLE A-4 Intersection Strategies Objectives 17.A Improve management of access near unsignalized intersections 17.B Reduce the frequency and severity of intersection conflicts through geometric design improvements 17.C Improve sight distance at intersections 17.D Improve availability of gaps in traffic and assist drivers in judging gap sizes at unsignalized intersections Strategies 17.A1 Manage conflicts in the influence area of intersections using driveway closures/relocations, driveway turn restrictions, and restricting cross median access near intersections 17.B1 Provide left-turn lanes at intersections; provide sufficient length to accommodate deceleration and queuing, use offset turn lanes to provide better visibility if needed, provide left-turn acceleration lanes at divided highway intersections Relative Cost to Implement and Operate Low to Moderate Moderate to High Effectiveness Tried Access management in Minnesota resulted in 15%-40% reduction in crash rates on rural roadways and as much as 75% reduction on urban roadways. Proven (Depending on location [rural vs. urban], traffic control [signal vs. STOP], and number of approach legs [three vs. four], adding left turn lanes to a major approach may reduce crashes by 22%-44%.) Typical Timeframe for Implementation Short (<1 yr.) to Medium (1-2 yrs.) Medium (1-2 yrs.) Priority Ranking 17.B2 Provide bypass lanes on shoulders at T-intersections Low Tried Short (<1 yr.) Medium 17.B3 Provide right-turn lanes at intersections; provide sufficient length to Proven accommodate deceleration and queuing, use offset turn lanes to provide Moderate to (Depending on location, traffic control [signal vs. STOP] and number of improved Medium (1-2 yrs.) Low better visibility if needed, provide left-turn acceleration lanes at divided High approaches [one vs. two], adding right turn lanes to a major approach may reduce highway intersections crashes by 5%-25%.) 17.B4 Restrict or eliminate turning maneuvers by signing Low Tried Short (<1 yr.) Low 17.B5 Restrict or eliminate turning maneuvers by providing channelization Low Tried or closing median openings (MN: 50%-90% crash reductions at limited number of sites.) Short (<1 yr.) Medium 17.B6 Close or relocate high-risk intersections High Tried Long (>2 yrs.) Low 17.B7 Convert four-legged intersection to two T-intersections High Tried Medium (1-2 yrs.) Low 17.B8 Convert offset T-intersections to four-legged intersection High Tried Medium (1-2 yrs.) Low 17.B9 Realign intersection approaches to reduce or eliminate intersection skew High Proven (Unsignalized Intersections: For removing a 30 skew, a 3-legged intersection would expect a 13% fewer crashes and a 4-legged intersection would expect 17.5% fewer crashes. For calculating the expected safety benefit for a specific skew angle, refer to the equations in NCHRP Report 500: Volume 5.) Medium (1-2 yrs.) 17.B10 Use indirect left-turn treatments to minimize conflicts at divided highway intersections Moderate Tried Medium (1-2 yrs.) Medium 17.B11 Improve pedestrian and bicycle facilities to reduce conflicts between motorists and nonmotorists Moderate Varies Medium (1-2 yrs.) Low 17.B12 Revise geometry of complex intersections High Tried Long (>2 yrs.) Low 17.B13 Construct special solutions, such as interchanges, median U-turn crossovers, etc. High Tried Long (>2 yrs.) Low 17.C1 Clear sight triangles on approaches to intersections and in the Low to medians of divided highways near intersections; eliminate parking that Moderate restricts sight distance Tried Short (<1 yr.) High 17.C2 Change horizontal and/or vertical alignment of approaches to provide more sight distance High Tried Long (>2 yrs.) Low 17.D1 Provide an automated real-time system to inform drivers of the suitability of available gaps for making turning and crossing maneuvers 17.D2 Provide roadside markers or pavement markings (static devices) to assist drivers in judging the suitability of available gaps for making turning and crossing maneuvers Moderate Experimental (FHWA & State Pooled Fund research underway. Low tech systems have also been deployed in Maine and Virginia.) Medium (1-2 yrs.) High Medium Low Experimental Medium (1-2 yrs.) Low 17.D3 Retime adjacent signals to create gaps at stop-controlled intersections Low Tried Short (<1 yr.) Low Low Low MARCH 2007 APPENDIX I A.1-5
128 TABLE A-4 Intersection Strategies Objectives 17.E Improve driver awareness of intersections as viewed from the intersection approach 17.F Choose appropriate intersection traffic control to minimize crash frequency and severity 17.G Improve driver compliance with traffic control devices and traffic laws at intersections 17.H Reduce operating speeds on specific intersection approaches Strategies 17.E1 Increase driver awareness when approaching intersections; including, STOP controlled, signalized, and thru approaches (i.e., enhanced regulatory, warning and guide signing, street lighting, dynamic mainline warning flashers) Relative Cost to Implement and Operate Low to High Effectiveness Proven/Tried/Experimental Intersection Lighting: In Minnesota, 27% reduction in the frequency of nighttime collisions; 35% reduction in nighttime crash rates; and 20% decrease in crash severity. Typical Timeframe for Implementation Short (<1 yr.) to Medium (1-2 yrs.) 17.E3 Install splitter islands on the minor-road approach to an intersection Moderate Tried Medium (1-2 yrs.) Medium 17.E4 Provide a stop bar (or provide a wider stop bar) on minor-road approaches Low Tried Short (<1 yr.) Medium 17.E6 Call attention to the intersection by installing rumble strips on intersection approaches Low Tried Short (<1 yr.) Medium 17.E7 Provide dashed marking (extended left edgelines) for major roadway continuity at divided highway intersections Low Tried Short (<1 yr.) Low 17.E8 Provide supplementary stop signs mounted over the roadway Low Tried Short (<1 yr.) Low 17.E9 Provide pavement markings with supplementary messages, such as STOP AHEAD Low Tried Short (<1 yr.) Medium 17.E10 Provide improved maintenance of stop signs Low Tried Short (<1 yr.) Low 17.E11 Install red flashing beacons on STOP signs at stop-controlled intersections Low Tried Short (<1 yr.) Medium 17.E12 Improve visibility of signals and signs at intersections Low Tried Short (<1 yr.) Medium 17.F1 Avoid Signalizing through roads High Tried Long (>2 yrs.) Low 17.F2 Provide all-way stop control at appropriate intersections 17.F3 Provide roundabouts at appropriate locations Low High Proven Conversion from 2-way to all-way stop control could reduce total intersection crashes by 53%; based on limited data. Proven Installing a modern roundabout at unsignalized location may result in a 38% reduction in total crashes, a 76% reduction in injury crashes, and a 90%reduction in fatal and serious injuries. Short (<1 yr.) Long (>2 yrs.) 17.G1 Provide targeted enforcement of traffic laws Moderate Tried Short (<1 yr.) Low 17.G2 Provide targeted public information and education on safety problems at specific intersections Low Tried Short (<1 yr.) High 17.G3 Provide public information on the importance of compliance with Moderate to traffic control devices High Tried Short (<1 yr.) Low 17.G5 Implement automated enforcement of red-light running (cameras) 17.H1 Provide targeted speed enforcement (can expand to all traffic violations) 17.H2 Provide traffic calming on intersection approaches through a combination of geometric and traffic control devices Moderate Moderate Moderate Proven (Fairfax, VA: 44% fewer violations during year 1. Oxnard, CA: 41% fewer red-light violations in first months. FHWA: 15% reduction in red-light-running incidents. Other: 35%-60% fewer violations; 35% fewer right-angle crashes, 25% fewer rightangle turning crashes, and 31% fewer rear-end crashes.) Proven (Key is to recognize that effectiveness of increased enforcement at specific locations has a relatively short duration measured in days or weeks, rather than months.) Proven (Impacts on mean speed at single sites varied from 3 mph increase to 17 mph decrease.) Medium (1-2 yrs.) Short (<1 yr.) Medium (1-2 yrs.) Priority Ranking 17.H3 Post appropriate speed limit on intersection approaches Low Tried Short (<1 yr.) Low 17.H4 Implement automated enforcement of approach speeds (cameras) Moderate Tried Medium (1-2 yrs.) Medium High Low High Medium High Low MARCH 2007 APPENDIX I A.1-6
129 TABLE A-4 Intersection Strategies Objectives 17.I Guide motorist more effectively through complex intersections 17.J Reduce frequency and severity of intersection conflicts through traffic signal control and operational improvements 17.K Improve safety through other infrastructure treatments 17.L Improve safety through data analysis and coordination with local agencies Strategies Relative Cost to Implement and Operate Effectiveness Typical Timeframe for Implementation 17.I1 Provide turn path markings Low Tried Short (<1 yr.) Medium 17.I2 Provide a double yellow centerline on the median opening of a divided highway at intersections Low Tried Short (<1 yr.) Low 17.I3 Provide lane assignment signing or marking at complex intersections Low Tried Short (<1 yr.) Medium 17.J1 Employ multiphase signal operation 17.J2 Optimize clearance intervals Low Low Proven/Tried (California: 35% fewer total crashes when left-turn lanes added along with left-turn phasing. 15% fewer crashes for left-turn lanes only.) Proven (New York: 9% reduction in multi-vehicle and a 12% reduction in injury crashes at intersections where the change interval was lengthened to meet ITE guidelines. 37% reduction in crashes involving pedestrians or bicyclists.) Short (<1 yr.) Short (<1 yr.) 17.J3 Restrict or eliminate turning maneuvers (including right turns on red) Low Tried Short (<1 yr.) Low 17.J4 Employ signal coordination 17.J5 Employ emergency vehicle preemption 17.J6 Improve operation of pedestrian and bicycle facilities at signalized intersections 17.J7 Remove unnecessary traffic signal Moderate Moderate Low Low Proven (25%-38% reduction in intersection crash.) Proven (14%-50% decreases in response times.) Proven/Tried (Addressed individually by Pedestrian Emphasis area.) Proven (Requires careful study of specific locations. When converted to all-way STOP, annual average crash frequency decreased by greater than one crash per year. When converted to two-way STOP, increase in right angle crashes was offset by reduction in rear end crashes.) Medium (1-2 yrs.) Medium (1-2 yrs.) Short (<1 yr.) Short (<1 yr.) 17.J8 Implement dilemma zone protection Moderate Tried Medium (1-2 yrs.) Low 17.J9 On high speed roadways, install advance warning flashers to inform driver of need to stop Moderate Tried Medium (1-2 yrs.) High 17.K1 Improve drainage in intersection and on approaches Moderate Tried Medium (1-2 yrs.) Low 17.K2 Provide skid resistance in intersection and on approaches Moderate Tried Medium (1-2 yrs.) Low 17.K3 Coordinate closely spaced signals near at-grade railroad crossings Moderate Tried Medium (1-2 yrs.) Low 17.K4 Relocate signal hardware out of clear zone Moderate Tried Short (<1 yr.) Low 17.L1 Through crash analysis, identify intersections with a disproportionately large number of fatal and serious injuries crashes Low Tried Short (<1 yr.) High 17.L2 Through crash analysis, identify key factors contributing to crashes and link directly to mitigative strategies Low Experimental Short (<1 yr.) Medium 17.L3 Participate in intersection safety audits Low Tried Medium (1-2 yrs.) Medium 17.L4 Coordinate with local agencies at regular intervals to identify and discuss countermeasures to reduce traffic crashes Low Experimental Medium (1-2 yrs.) Medium 17.L5 Streamline funding constraints so that local agencies can implement countermeasures to improve safety and operational features Low Experimental Medium (1-2 yrs.) Low Priority Ranking Medium Medium Medium Low Low Medium MARCH 2007 APPENDIX I A.1-7
130 TABLE A-5 Young Driver Strategies Objectives 1.A Implement or improve graduated driver licensing (GDL) systems 1.B Publicize, enforce, and adjudicate laws pertaining to young drivers 1.C Assist parents/adults in managing teen driving 1.D Improve young driver training 1.E Employ school-based strategies Strategies 1.A1 Enact a comprehensive graduated licensing system, improvements may include requiring at least 6 months of supervised driving for beginners starting at age 16, implementing a night driving restriction that begins at 9:00 PM, and implement a passenger restriction allowing no or only one young passengers Relative Cost to Implement and Operate Low Effectiveness Proven/Tried Comp. GDL: Depending on the provisions, crash reductions on the order of 25% - 35% can be attained for 16 year-old drivers. A 15% - 20% reduction can also be attained for 17 year-old drivers. Supervised Training Period: Studies indicate substantially longer learner periods can have a 22% - 40% reduction in crash rates. Nighttime Driving Restriction: For first six months, studies indicate a possible 40% - 50% reduction in crashes after 9:00 PM for drivers under 18. Typical Timeframe for Implementation Medium (1-2 yrs.) 1.A5 Prohibit cell phone use by drives with a GDL license Low Tried Medium (1-2 yrs.) Medium 1.A6 Pass a primary seat belt law for vehicles operated by a driver with a GDL license Low Experimental Medium (1-2 yrs.) High 1.B1 Conduct more public information campaigns and highly visible enforcement campaigns, including laws pertaining to GDL provisions, underage drinking and driving (i.e., zero tolerance laws), and seat belts; using check points when and where appropriate Moderate to High Proven/Experimental Zero Tolerance Law: Education and endforcement in Maryland reduced drinkingdriving crashes among drivers <21 by 21%. Coupled with extensive PI&E campaign, reduced crashes additional 30%. Safety Belt Laws: North Carolina Case example for GENERAL safety belt use; since 1993, there has been a 19% increase in seat belt use and a 14% decrease in fatal and serious injuries Short (<1 yr.) Priority Ranking 1.C1 Facilitate parental supervision of learners Moderate to High Tried Long (>2 yrs.) Medium 1.C2 Facilitate parental management of intermediate drivers Moderate Experimental Long (>2 yrs.) Medium 1.C3 Encourage selection of safer vehicles for young drivers Low Tried Medium (1-2 yrs.) Low 1.D1 Improve content and delivery of driver education/training and review Moderate to training manual to increase link between content & documented crash High causation factors for young drivers Experimental Long (>2 yrs.) High 1.D2 Require driver training for newly licensed young drivers Moderate Tried Medium (1-2 yrs.) High 1.E1 Eliminate early high school start times (e.g., before 8:30 AM) Low Tried Medium (1-2 yrs.) Low 1.E2 Review transportation plans for new expanded high school sites Low Experimental Short (<1 yr.) Low 1.E3 Develop community coalition programs focused on young drivers and linked to schools Low to Moderate Tried Safe Communities of Wright County, MN has a demonstrated success at reducing number of fatal crashes involving high school students. Short (<1 yr.) High High High MARCH 2007 APPENDIX I A.1-8
131 Appendix II High Priority Strategies
132
133 Objectives Strategies Relative Cost to Implement and Operate Effectiveness Typical Timeframe for Implementation Voting Results Lane Departure Strategies Keep vehicles in their lane Use cost effective treatments to keep vehicles in their lane. This may include: (1)centerline rumble strips for two-lane roads, (2) shoulder rumble strips on roads with paved shoulders, (3) edgeline profile marking, edgeline rumble strips or modified shoulder rumble strips on section with narrow or no paved shoulders, (4) profiled thermoplastic strips, raised pavement markers, or other methods for centerlines in order to provide better day, night, and wet visibility, and (5) enhanced pavement markings, such as 6 or 8 markings instead of 4 markings or improved day/night/wet visibility. Low Tried/ Experimental Short (< 1 yr.) to Medium (1-2 yrs.) 23 Keep vehicles from encroaching on the roadside Eliminate shoulder drop-offs by (1) paving shoulders, (2) widening substandard shoulders, and (3) maintaining gravel shoulders along pavement edges in order to keep vehicles from encroaching on the roadside. Assist drives with a safe recovery by (4) adding safety wedges to the edge of pavements. Low Experimental Medium (1-2 yrs.) 12 Provide for education Legislature education on safety issues. Low Experimental Short (< 1yr.) 3 Alcohol-Related Strategies Reduce Excessive Drinking and Underage Drinking (1) Encourage the use of required responsible beverage service policies and training for alcohol servers and retailers, (2) continue to educate the general public, business owners, and alcohol servers on the dangers of impaired driving, (3) consider public policies that would make parents accountable for minors who consume alcohol at their place and then drive, and (4) use targeted education techniques (such as billboards) to reduce excessive drinking and underage drinking. Moderate to High Proven/Tried Short (<1 yr.) to Long (>2 yrs.) 8 To reduce underage drinking (and driving), increase the number of wellpublicized compliance checks of alcohol retailers to reduce sales to underage persons. Low Tried Short (<1 yr.) 0 MARCH 2007 APPENDIX II A.2-1
134 Objectives Strategies Relative Cost to Implement and Operate Effectiveness Typical Timeframe for Implementation Voting Results Enforce DUI Laws Use enforcement to reduce the number of alcohol-related crashes by increasing the number of highly publicized and coordinated (1) DUI checkpoints or (2) saturation patrols. Also enhance DUI enforcement through the use of (3) traditional traffic enforcement. (4) Form state and local law enforcement partnerships to provide greater coverage during enforcement campaigns and also work with regional safety partners help identify target locations, times, etc. for enforcement efforts. Low to High Proven/Tried Short (<1 yr.) 23 (1) Publicize and enforce zero tolerance laws for drivers under age 21. (2) Encourage parental involvement and attendance in programs/classes and emphasize education and training through the graduated licensing programs. To further discourage drinking and driving, (3) work with courts to discourage diversion programs and plea bargains to nonalcohol offenses (i.e., improve DUI process and conviction rate). Moderate Proven/Tried Short (<1 yr.) to Long (>2 yrs.) 19 Unbelted Vehicle Occupant Strategies Maximize use of occupant restraints by all vehicle occupants To increase safety belt use rate: (1) provide enhanced public information and education to population groups with lower than average restraint use rates and (2) conduct highly publicized enforcement campaigns. Support adoption of a primary seat belt law; eliminate gaps in seat belt, child seat, and booster seat laws (i.e., cover all passenger and all seats) Low to High Low Proven Proven/ Experimental Short (<1 yr.) to Medium (1-2 yrs.) 18 Medium (1-2 yrs.) 64 Ensure that child and infant restraints are properly used by providing community locations for instruction in proper child restraint use and conducting high profile child restraint inspection events at multiple community locations (involving EMS personnel at inspection locations). Low Proven/Tried Short (<1 yr.) 1 Intersection Strategies Improve management of access near unsignalized intersections Near unsignalized intersections, use access management techniques to manage conflicts in the influence area of intersections. Moderate Tried Medium (1-2 yrs.) 2 MARCH 2007 APPENDIX II A.2-2
135 Objectives Strategies Relative Cost to Implement and Operate Effectiveness Typical Timeframe for Implementation Voting Results Improve sight distance at intersections Improve sight distance at intersections by clearing sight triangles. Low to Moderate Tried Short (<1 yr.) 0 Improve driver awareness of intersections on approaches Increase a driver awareness s when approaching an intersection; whether a STOP controlled, signalized, or thru approach. Techniques for consideration include (1) enhanced warning and guide signing, (2) street lighting, (3) dynamic mainline warning flashers, and (4) advance warning flashers for traffic signals on high speed roadways. Low to Moderate Proven/Tried Medium (1-2 yrs.) 14 Choose appropriate intersection traffic control to minimize crash frequency and severity Provide roundabouts at appropriate locations. High Proven Long (>2 yrs.) 21 Improve driver compliance with traffic control devices and traffic laws at intersections Reduce operating speeds on intersection approaches Reduce frequency and severity of intersection conflicts with traffic signal control and operational improvements Provide targeted public information and education on safety problems at specific intersections. Use targeted speed enforcement to reduce operating speeds on specific intersection approaches. On high speed roadways, install advance warning flashers to inform driver of need to stop Low Tried Short (<1 yr.) 0 Moderate Proven Short (<1 yr.) 28 Moderate Tried Medium (1-2 yrs.) 0 MARCH 2007 APPENDIX II A.2-3
136 Objectives Strategies Relative Cost to Implement and Operate Effectiveness Typical Timeframe for Implementation Voting Results Improve safety through data analysis and coordination with local agencies Through crash analysis, identify intersections with a disproportionately large number of fatal and serious injuries crashes. As necessary, improve data collection to enhance analysis of intersection crashes. Low Tried Short (<1 yr.) 18 Young Driver Strategies Implement/ improve GDL systems Establish a more comprehensive graduated licensing system. Low Proven/Tried Medium (1-2 yrs.) 32 Publicize, enforce, and adjudicate laws pertaining to young drivers Conduct more (1) public information and (2) enforcement campaigns pertaining to young drivers. Moderate to High Proven/ Experimental Short (<1 yr.) 7 Improve young driver training Improve driver training materials Moderate to High Experimental Long (>2 yrs.) 0 Mandatory driver training Moderate Tried Medium (1-2 yrs.) 21 Employ community or school-based strategies Develop community coalition programs focused on young drivers Low to Moderate Tried Short (<1 yr.) 3 MARCH 2007 APPENDIX II A.2-4
137 Appendix III Supporting Information for Deployment Plan
138
139 The following sections provide an overview of the Effectiveness Spreadsheet (see Figure A.1), discuss two fundamentally different approaches to system wide safety investments (traditional engineering only strategies and a comprehensive approach consistent with current FHWA guidance) and a summary of key lessons learned from the analyses. A.1.1 Effectiveness Spreadsheet The Effectiveness Spreadsheet estimates the number of traffic fatalities and disabling injuries prevented (i.e., benefits) given a specified level of investment in a specific combination of Critical strategies. The spreadsheet also estimates the total implementation cost and then computes a B/C ratio. It must be understood that this tool was created to provide a planning level and statewide view of deployment of the Critical Strategies in Nebraska and is based on typical implementation costs and the average crash experiences spread over the entire State roadway system. This tool is not intended to produce results (i.e., safety benefit or implementation costs) for specific projects because actual crash characteristics and costs at individual locations could vary greatly from the averages assumed. Finally, only key and/or common project types for the Critical Strategies are listed. Some Critical Strategies may consist of multiple safety project types, but only select options have been included in the Effectiveness Spreadsheet. The Spreadsheet has been organized into three basic components; given values, input values and output values. The given values (the number of crashes related to each strategy and effectiveness ratios) and input values (unit costs, service life and average system wide crash densities) were developed specifically for Nebraska using the State s data. Table A.1 provides a detailed description of each field in the spreadsheet tool. TABLE A.1 Effectiveness Spreadsheet Field Descriptions Field Field Description Given Values 1 & 2 3 & 4 Related Crashes: Fatalities and Disabling Injuries Effectiveness: Fatal & Disabling Injury The number of fatalities or disabling injuries (Nebraska, ) that were potentially correctable by the action listed under the critical strategy. Reports the effectiveness of the listed strategy at reducing the number of fatal or disabling injury crashes. The effectiveness may be listed as a percentage (i.e., prevent 50% of related crashes for every mile treated) or as an absolute number (i.e., prevent 1 crash for every program developed). The source for the effectiveness is presented in the cell s comment. Input Values 5 Deployment 6 Unit Cost The level of deployment for each strategy; for example, the number of DUI checkpoint campaigns, the miles of centerline rumble strips, the number of roundabouts constructed, etc. Represents an estimate of the implementation cost (i.e., salary, construction cost, related maintenance, etc.) for the life of the project. The original values are general estimates that may be refined if more detailed information is made available. MARCH 2007 APPENDIX III A.3-1
140 TABLE A.1 Effectiveness Spreadsheet Field Descriptions Field Field Description 7 Service Life The estimated life of the project related to the unit cost. This is the timeframe over which benefits are expected to accrue and also the number of years over which the cost is amortized. Input Values cont d 8 Crash Density: Fatal and Disabling Injury For many of the engineering strategies, the effectiveness is expressed as a percent reduction in the number of the crashes at an intersection or that occurred along a corridor. Therefore, crash density (crash per mile, crash per intersection, etc.) was determined using the relevant portions of the state highway. Even though this constant is based on large parts of the roadway system, it is likely a conservative value because crashes were averaged across most of the system. Therefore, it is also likely to provide a reasonable estimate of conditions on roadways under local jurisdiction. 9 Interest Rate An interest rate of 4% is used to amortize the implementation costs into an annual value over the life of the project. 10 & 11 Crash Prevention: Fatalities and Disabling Injuries The estimated number of fatalities or disabling injuries prevented using the level of deployment specified and the effectiveness for fatal and disabling injury crashes. Most values are computed using only the number of crashes (1 & 2), effectiveness (3 & 4), and deployment (5). A crash density (8) was also needed for many of the engineering strategies. Output Values 12 Initial Cost The upfront or initial cost for implementation based upon the unit cost and the amount of deployment. As appropriate, this is inclusive of construction, annual maintenance over the life of the project, salary, advertising, and etc. 13 & 14 Crash Cost: Fatality and Disabling Injury The value or cost of a traffic fatality ($3,687,200) and disabling injury ($261,200). This information was provided by the Nebraska Department of Roads, which was taken from Federal Highway Administration report The Cost of Highway Crashes (report number FHWA-RD ) and was adjusted to January 2006 costs. 15 B/C Ratio Annual benefit divided by the annualized cost. The annual benefit is the value of the fatalities and disabling injuries prevented. The effectiveness values (crash reduction factors) for fatal and disabling injury crashes have also been color coded based on the level of confidence. Effectiveness values noted in green are considered Proven because the associated strategies have been rigorously tested and the results have been determined to be highly reliable. Effectiveness values noted in yellow are considered Tried these strategies have been widely deployed, but statistical analysis has not yet been performed to thoroughly document the safety benefit. Effectiveness values noted in red are considered Experimental there is little or no research available to document the safety effects of deployment. The effectiveness values for Proven and Tried strategies primarily come from the NCHRP 500 Series reports, supplemented by local experience whenever it is available. Effectiveness values for Experimental strategies were established using local safety professionals knowledge and expertise. For some strategies, a range of effectiveness values may be found in the safety literature. In these cases, a effectiveness value selected was determined to give the most reasonable results. Similarly, the implementation costs were colored coded based on the level of confidence. Unit costs noted in green have a MARCH 2007 APPENDIX III A.3-2


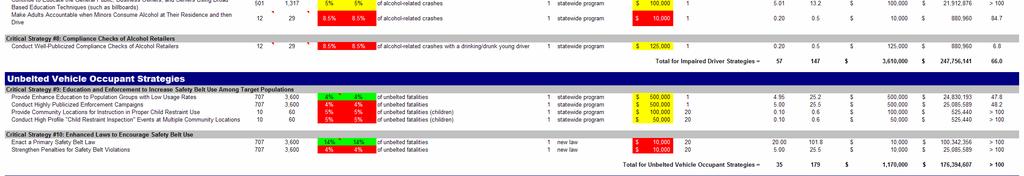
141 FIGURE A.1 Nebraska Effectiveness Spreadsheet MARCH
142 FIGURE A.1 continued Nebraska Effectiveness Spreadsheet MARCH
143 high confidence level and little variation is expected while unit costs noted in red may be a best estimate or the cost could vary significantly depending on how the specific strategy is actually deployed. A yellow coded implementation cost indicates that variation in cost is expected, however, not to the degree of a project with a red cost coded. To illustrate how the Effectiveness Spreadsheet works, a sample calculation is provided. Centerline Rumble Strips for Two-Lane Roads Step 1: Estimate annual number of crashes prevented. Fatal = (1000 miles) * ( fatal head-on crashes per mile) * 35% = 0.7 fatal head-on crashes prevented annually Disabling Injury = (1000 miles) * ( disabling injury head-on crashes per mile) * 35% = 0.9 disabling injury head-on crashes prevented annually Step 2: Convert crashes prevented to fatalities and disabling injuries prevented using statewide ratio. Fatalities = 0.7 fatal head-on crashes prevented * 130 fatalities / 99 fatal crashes = 0.92 head-on fatalities prevented annually Disabling Injuries = 0.91 dis. inj. head-on crashes prevented * 494 dis. inj. / 332 dis. inj. Crashes = 1.3 disabling injuries from head-on crashes prevented annually Note: Columns for fatal crashes and disabling injury crashes are included in the spreadsheet, but simply not visible in Figure A.1. These columns were hidden simply so that the spreadsheet would better fit the page size. Step 3: Estimate annual benefit of fatalities and injuries prevented Benefit = (0.92 fatalities) * ($3,687,200 per fatality) + (1.3 dis. inj.) * ($261,200 per dis. inj.) = $3,727,931 per year Step 4: Estimate initial implementation cost Implementation Cost = (1000 miles) * ($1000 per mile) = $1,000,000 Step 5: Amortize implementation cost over the life of project Implementation Cost = Present Value * [I * (1 + i)] / [(1 + i) n 1] = $1,000,000 * [4% * (1 + 4%)] / [(1 + 4%) 10-1] = $86,622 per year Step 6: Calculate benefit-cost ratio B/C Ratio = $3,727,931 / $86,622 = 43.0 A.1.2 Deployment Scenarios Two fundamentally different approaches to system wide safety investments were analyzed a traditional deployment of engineering only strategies and a more comprehensive program including strategies across the four safety E s engineering, enforcement, education and MARCH 2007 APPENDIX III A.3-5
144 emergency medical services. The analyses involved testing investments in different combinations of the Critical Strategies in order to provide insight on how Nebraska can achieve the adopted safety goal and prove that the goal is attainable. Each deployment scenario used the effectiveness spreadsheet and began by assuming that the safety funding is limited to the $6 million per year in Highway Safety Improvement Program (HSIP) funds that Nebraska expects to receive through the current federal transportation legislation. It is important to note that other Nebraska agencies will continue to receive safety funding and to make investments in their own safety strategies plus Nebraska will need to provide matching funds for projects. Other state agencies could pursue partnerships with NDOR in order to help increase the deployment and outreach of these programs. A detailed description of the basic deployment scenarios; engineering only strategies and a comprehensive package of strategies are provided in the following sections. A Engineering Only Deployment Scenarios Traditionally, highway safety funds the NDOR received from FHWA were spent on infrastructure improvements to the State s highway system. This first three investment scenarios look at the effectiveness of three different combinations of the Critical Strategies that continue to invest in only engineering countermeasures. Scenario #1 Engineering only with a Broad Selection of Strategies: This scenario documents the safety effects of spending NDOR s safety funds on a wide variety of engineering (lane departure and intersection) strategies and does not rely on any new legislation. An investment in a wide variety of strategies combined with the $6 million funding limit means that each strategy could be deployed at a relative few locations. This scenario would be ideal for targeting a few high crash locations, but because the location of fatal and disabling injury crashes is often random and widely spread across Nebraska s system of roads, the difficulty would be in identifying locations where fatal crashes occur regularly. This scenario reduced the number of traffic fatalities by approximately three per year (Figure A.2), which is well below the trend line (approximately 15 to 20 fatalities prevented) needed to achieve the adopted safety goal in the first year of deployment. Scenario #2 Engineering Only with a Focused Selection of Strategies: The second investment scenario also considered only engineering (lane departure and intersection) strategies, but with a focused approach that invested in fewer strategies which allowed a more widespread deployment. The strategies selected generally (1) would address a large pool of related fatal and disabling injury crashes, (2) were relatively inexpensive which would allow deployment across a larger number of locations, and (3) had a relatively high effectiveness for reducing fatal and disabling injury crashes. Focusing on a few low cost and highly effective strategies spread across a larger number of locations increased the number of lives saved to slightly more than four per year (see Figure A.3), a number that is still far below the trend line needed to achieve the adopted safety goal. MARCH 2007 APPENDIX III A.3-6


145 FIGURE A.2 Investment Scenario #1 FIGURE A.3 Investment Scenario #2 MARCH 2007 APPENDIX III A.3-7

146 Scenario #3 Engineering Only with a Focused Selection of Strategies and Meets the Safety Goal: Given the results of the first two scenarios, a key question is what level of investment in engineering only strategies would it take to reach the adopted safety goal. Based on the results of the second investment scenario, safety spending would have to be increased to approximately $25 million annually (see Figure A.4). Even if this level of funding were made available, another difficulty would be finding enough miles of state highways and intersections that would benefit from the limited number of infrastructure based improvements. This analysis clearly demonstrates that continuing to invest HSIP funds only in traditional engineering strategies is not an effective approach to achieving Nebraska s adopted safety goal. FIGURE A.4 Investment Scenario #3 A Comprehensive Deployment Scenarios Under the new federal transportation legislation (SAFETEA-LU), states may flex up to 10% of their HSIP funds to invest in the other three safety E s enforcement, education and EMS. In order to exercise this flexibility, states first have to have an approved SHSP and then they must certify that they have met all of their infrastructure needs. The following four scenarios illustrate the effectiveness of flexing 10% of Nebraska s HSIP funds for a particular year. MARCH 2007 APPENDIX III A.3-8
.")

147 Scenario #4 Comprehensive Approach with a Broad Selection of Strategies: This scenario is based on investing NDOR s HSIP funds in a broad selection of strategies and each countermeasure could be deployed at a relatively few number of locations (similar to scenario #1). As with the previous scenarios, no safety funds were spent on any strategy that requires enabling legislation. The results of this analysis indicate that flexing the safety funds to invest in additional enforcement and education and utilizing a wide array of engineering strategies, the number of lives saved increased to just over 8 per year (see Figure A.5) which is still below what is needed in order to meet the goal. FIGURE A.5 Investment Scenario #4 MARCH 2007 APPENDIX III A.3-9
.")

148 Scenario #5 Comprehensive Approach with a Focused Selection of Strategies: This scenario is based on investing NDOR s HSIP funds in a focused selection of a few strategies that are related to a large number of fatal and disabling injury crashes, are relatively inexpensive to allow a deployment at a larger number of locations and are highly effective (similar to scenario #2). As with the previous scenarios, no safety funds were spent on any strategy that requires enabling legislation. The results of this analysis indicate that between flexing the safety funds to invest in additional enforcement and education and being focused on only the most effective strategies, the number of lives saved increased to approximately 13 per year (see Figure A.6) which is still just below the desired trend line. FIGURE A.6 Investment Scenario #5 MARCH 2007 APPENDIX III A.3-10

, increased the number of lives saved per year")
149 Scenario #6 Comprehensive Approach with a Broad Selection of Strategies and Enabling Legislation: This scenario is nearly identical to scenario #4, with one key exception the addition of a primary safety belt law. The results of the analysis of this scenario indicate that the adoption of a primary safety belt law is the single most effective strategy based on the number of lives saved, approximately 20 per year. The overall effect of investing in a combination of engineering, enforcement and education strategies (including the primary safety belt law), increased the number of lives saved per year to approximately 28 (see Figure A.7), which is above the trend line necessary to achieve the adopted safety goal. FIGURE A.7 Investment Scenario #6 MARCH 2007 APPENDIX III A.3-11
 program for young drivers.")

150 Scenario #7 Comprehensive Approach with a Focused Selection of Strategies and Enabling Legislation: This scenario is similar to scenario #5, with two key exceptions the addition of a primary safety belt law, stronger penalties for not using a safety belt, and enhancing the Graduated Drivers License (GDL) program for young drivers. The results of the analysis of this scenario indicate that adoption of a primary safety belt law and enhancing the GDL program are two of the most effective strategies in the list of Critical Strategies, based on the number of lives saved. A primary safety belt law is expected to save 20 lives per year, an enhanced GDL program 12 lives per year and the overall effect of combination of strategies in this scenario would save approximately 52 lives per year (see Figure A.8), which exceeds the trend line necessary to achieve the adopted safety goal. FIGURE A.8 Investment Scenario #7 MARCH 2007 APPENDIX III A.3-12
Toward Zero Deaths. Regional SHSP Road Show Meeting. Virginia Strategic Highway Safety Plan. presented by
 Toward Zero Deaths Regional SHSP Road Show Meeting presented by Virginia Strategic Highway Safety Plan December 1, 2016 1 Welcome & Introductions Purpose of the Meeting Objectives & Key Outcomes Agenda»
Lessons Learned from the Minnesota County Road Safety Plans. Richard Storm CH2M HILL
 Lessons Learned from the Minnesota County Road Safety Plans Richard Storm CH2M HILL May 21, 2014 Overview of the MN CRSP: Why Prepare Safety Plans for Local Systems? MAP-21: Requires states to address
Minnesota Strategic Highway Safety Plan
 Minnesota Strategic Highway Safety Plan Executive Summary Minnesota s comprehensive and strategic safety planning process began in 2004, involved a cross-section of state, local and private safety partners
HSIP Project Selection Criteria
 HSIP Project Selection Criteria The purpose of the Highway Safety Improvement Program (HSIP) is to reduce the number of fatal and injury crashes by targeting high crash locations and causes. Projects,
Maine Highway Safety Facts 2016
 Maine Highway Safety Facts 216 216 MAINE HIGHWAY SAFETY FACTS The Bureau of Highway Safety and the Maine Department of Transportation are pleased to present the 216 edition of Maine Highway Safety Facts.
PRELIMINARY DRAFT FIRST AMENDMENT TO VISION 2050: A REGIONAL LAND USE AND TRANSPORTATION PLAN FOR SOUTHEASTERN WISCONSIN
 PRELIMINARY DRAFT FIRST AMENDMENT TO VISION 2050: A REGIONAL LAND USE AND TRANSPORTATION PLAN FOR SOUTHEASTERN WISCONSIN ESTABLISHING TARGETS FOR FEDERAL PERFORMANCE MEASURES: HIGHWAY SAFETY SOUTHEASTERN
Occ c u c pa p n a t pro r t O ec e t c i t O i n
 Occupant Protection Occupant Protection Introduction Buckling up or being buckled in is the most effective protection during a car crash. The simple truth is that the great majority of people ejected from
A Strategic Highway Safety Plan. a coordinated and informed approach to reducing highway fatalities and serious injuries on all public roads.
 Introduction A Strategic Highway Safety Plan is a coordinated and informed approach to reducing highway fatalities and serious injuries on all public roads. A Strategic Highway Safety Plan is Based on
Education Emergency Medical Services Enforcement Engineering. north dakota strategic highway safety plan. Submitted by
 Education Emergency Medical Services Enforcement Engineering north dakota strategic highway safety plan Submitted by SEPTEMBER 2013 North Dakota Strategic Highway Safety Plan Prepared for North Dakota
Olmsted County Highway Safety Plan
 TB072009008MKE Olmsted County Highway Safety Plan September 2009 Submitted to: Table of Contents 1. Introduction...1-1 2. Comprehensive Crash Analysis...2-1 3. Safety Emphasis Areas...3-1 4. Safety Strategies...4-1
PALM BEACH COUNTY LOCAL ROAD SAFETY PLAN
 PALM BEACH COUNTY LOCAL ROAD SAFETY PLAN JANUARY 2019 Street View Images Google 2018 Notice This document is disseminated under the sponsorship of the U.S. Department of Transportation in the interest
What is the problem? Transportation Safety Planning Purdue Road School. 42,636 Fatalities. Nearly 3M Injuries. Over 4M PDO crashes
 Transportation Safety Planning Purdue Road School March 29, 2006 What is the problem? 42,636 Fatalities Nearly 3M Injuries Over 4M PDO crashes $230B Cost to the Nation Trends in Motor Vehicle Fatality
Toward Zero Deaths: Proactive Steps for Your Community
 Est. Dec. 2014 Toward Zero Deaths: Proactive Steps for Your Community Presented by: Brian Roberts, P.E., National Association of County Engineers Marie Walsh, Ph.D., Louisiana Local Technical Assistance
FLORIDA TRANSPORTATION COMMISSION HIGHWAY SAFETY REPORT CALENDAR YEAR 2008
 FLORIDA TRANSPORTATION COMMISSION HIGHWAY SAFETY REPORT CALENDAR YEAR 2008 January 15, 2010 HIGHWAY SAFETY REPORT FOR CALENDAR YEAR 2008 January 15, 2010 2 TABLE OF CONTENTS INTRODUCTION 5 STRATEGIC HIGHWAY
FLORIDA STRATEGIC HIGHWAY SAFETY PLAN
 FLORIDA STRATEGIC HIGHWAY SAFETY PLAN 1 FLORIDA STRATEGIC HIGHWAY SAFETY PLAN Presenter: Joe Santos State Safety Engineer FDOT State Safety Office 2 Presentation 3/28/2017 3 FLORIDA STRATEGIC HIGHWAY SAFETY
South Carolina s Strategic Highway Safety Plan
 Target Zero South Carolina s Strategic Highway Safety Plan 215-218 March 4, 215 Dear Highway Safety Partner: The South Carolina Department of Public Safety (SCDPS) and the South Carolina Department of
Minnesota Comprehensive Highway Safety Plan
 The Minnesota Comprehensive Highway Safety Plan (CHSP) was created in a coordinated effort between the Minnesota Departments of Transportation and Public Safety to reduce the number of traffic fatalities
APPENDIX C. Systems Performance Report C-1
 APPENDIX C Systems Performance Report C-1 System Performance Report & Requirements According to the FAST Act, a long range transportation plan needs to include a system performance report and subsequent
November 2, Government takes on the challenge of improving traffic safety
 November 2, 2006 Government takes on the challenge of improving traffic safety Edmonton... The Alberta government has taken on the challenge of improving traffic safety by moving ahead with a comprehensive,
MTCF. Michigan Traffic Crash Facts FACT SHEETS
 FACT SHEETS This page left intentionally blank GENERAL FACTS The driver, the roadway, and the motor vehicle contribute in some measure to every crash. A preponderance of evidence, however, points to driver
Lane Area Transportation Safety and Security Plan Vulnerable Users Focus Group
 Lane Area Transportation Safety and Security Plan Vulnerable Users Focus Group Agenda 1. Planning Process Review 2. What are Emphasis Areas? 3. Your Role Today 4. Data Review 5. Small group discussion
DRIVING ZERO FATALITIES TO A REALITY ILLINOIS LOCAL SAFETY INITIATIVE
 DRIVING ZERO FATALITIES TO A REALITY ILLINOIS LOCAL SAFETY INITIATIVE Priscilla Tobias, PE State Safety Engineer Illinois Dept of Transportation Illinois Stats 102 Counties 145,000 Roadway Miles 900+ Fatalities
Department of Transportation
 Department of Transportation I. Internal Scan The number of older drivers in the United States will double over the next 30 years. By 2030 one in five Americans will be age 65 or older. On a licensed-driver
Characteristics of Traffic Accidents in Highway Work Zones
 Characteristics of Traffic Accidents in Highway Work Zones A DETAILED ANALYSIS OF WORK ZONE ACCIDENTS REPORTED ON NEW YORK STATE DEPARTMENT OF TRANSPORTATION CONSTRUCTION PROJECTS ESTABLISHED THE PREDOMINANT
Systemic Safety. Doug Bish Traffic Services Engineer Oregon Department of Transportation March 2016
 Systemic Safety Doug Bish Traffic Services Engineer Oregon Department of Transportation March 2016 Oregon averages 1700 fatal and serious injury crashes each year. Some of the more common crash types include:
MTCF. Michigan Traffic Crash Facts FACT SHEETS
 FACT SHEETS This page left intentionally blank GENERAL FACTS The driver, the roadway, and the motor vehicle contribute in some measure to every crash. A preponderance of evidence, however, points to driver
Speed Management Action Plan
 Speed Management Action Plan National Selection Criteria Criteria Description Fatalities The number of fatalities resulting from speeding-related crashes. Percentage Compares total fatalities in each State
Closing Plenary Session
 TRAFFIC SAFETY CONFERENCE Closing Plenary Session June 9, 2017 Las Colinas, TX Order of Report Out June 9, 2017 Las Colinas, TX Distracted Driving Prioritized Countermeasures Countermeasure 4a Systemically
Kansas Department of Transportation Strategic Highway Safety Plan. Intersections
 Kansas Department of Transportation Strategic Highway Safety Plan Intersections Introduction The Federal Highway Administration (FHWA) defines an intersection as a planned point of conflict in the roadway
Keep Customers and Ourselves Safe. Mark Shelton, District Engineer. Tracker. Measures of Departmental Performance
 Keep Customers and Ourselves Safe Mark Shelton, District Engineer Tracker Measures of Departmental Performance Safety is a daily commitment for all MoDOT employees. From design and construction to operations
Street Smart - Regional Pedestrian Safety Campaign. Hopkins Grand Rounds July 16, 2014
 Street Smart - Regional Pedestrian Safety Campaign Hopkins Grand Rounds July 16, 2014 Baltimore Metropolitan Council (BMC) Who We Are The organization of the Baltimore region s elected executives, representing
APPENDIX G Lane Departure Action Plan
 APPENDIX G Introduction Lane Departure is one of nine emphasis areas of the North Carolina Strategic Highway Safety Plan. This emphasis area targets the following crashes: Ran Off Road Left Ran Off Road
AMATS Complete Streets Policy
 AMATS Complete Streets Policy Table of Contents: Section 1. Definition of Complete Streets Section 2. Principles of Complete Streets Section 3. Complete Streets Policy Section 4. Consistency Section 5.
We believe the following comments and suggestions can help the department meet those goals.
 The Honorable Secretary Anthony Foxx The Secretary of Transportation United States Department of Transportation 1200 New Jersey Avenue, SE Washington, DC 20590 August 30, 2013 Dear Secretary Foxx, Thank
TEXAS TRAFFIC SAFETY TASK FORCE. Jeff Moseley Texas Transportation Commission
 TEXAS TRAFFIC SAFETY TASK FORCE Jeff Moseley Texas Transportation Commission June 7, 2016 Fatalities and fatal crashes 2010 2015 4,000 3,500 3,417 3,407 3,536 3,533 3,000 3,061 3,067 2,782 2,803 3,037
6.8 Transportation Safety & Security
 6.8 Transportation Safety & Security This chapter addresses transportation safety and security as required under MAP-21 and California s Strategic Highway Safety Plan. Transportation safety and security
Reducing Fatalities and Serious Injuries on County Roads
 Reducing Fatalities and Serious Injuries on County Roads Brian C. Roberts, P.E. Executive Director National Association of County Engineers Washington, DC Housekeeping Please silence all mobile devices.
South Dakota Strategic Highway Safety Plan
 South Dakota Strategic Highway Safety Plan Lead Agency: South Dakota Department of Transportation February 2014 Contents Section Page Acronyms... iv Definitions... v Acknowledgements... vi Executive Summary...
Canadian Association of Chiefs of Police Association canadienne des chefs de police
 WHAT S IN THE KIT? Media Advisory Template To be used to invite the media to an event during Operation Impact. We suggest you reproduce this on your own police agency letterhead. News Release Template
CENTRAL ARIZONA GOVERNMENTS STRATEGIC TRANSPORTATION SAFETY PLAN FINAL REPORT
 CENTRAL ARIZONA GOVERNMENTS STRATEGIC TRANSPORTATION SAFETY PLAN FINAL REPORT JANUARY 2017 ENGINEERING ENFORCEMENT EDUCATION EMERGENCY RESPONSE This Report is subject to the provisions of 23 USC 409. Any
2014 QUICK FACTS ILLINOIS CRASH INFORMATION. Illinois Emergency Medical Services for Children February 2016 Edition
 2014 QUICK FACTS ILLINOIS CRASH INFORMATION February 2016 Edition Illinois Emergency Medical Services for Children www.luhs.org/emsc Illinois Emergency Medical Services for Children TABLE OF CONTENTS
2012 TOWN OF CASTLE ROCK MOTOR VEHICLE ACCIDENT FACTS PREPARED BY THE PUBLIC WORKS DEPARTMENT
 ATTACHMENT A 2012 TOWN OF CASTLE ROCK MOTOR VEHICLE ACCIDENT FACTS PREPARED BY THE PUBLIC WORKS DEPARTMENT ACKNOWLEDGEMENTS This report was assembled from data provided by the Castle Rock Police Department
2012 QUICK FACTS ILLINOIS CRASH INFORMATION. Illinois Emergency Medical Services for Children September 2014 Edition
 2012 QUICK FACTS ILLINOIS CRASH INFORMATION September 2014 Edition Illinois Emergency Medical Services for Children www.luhs.org/emsc Illinois Emergency Medical Services for Children TABLE OF CONTENTS
NYC Pedestrian Safety Study & Action Plan. NYTMC Brown Bag Lunch Presentation December 15, 2010
 NYC Pedestrian Safety Study & Action Plan NYTMC Brown Bag Lunch Presentation December 15, 2010 1 Introduction DOT Safety Goal Strategic Plan: Reduce Fatalities by 50% by 2030 From 274 (2007) to 137 (2030)
Sponsored by the Office of Traffic and Safety of the Iowa Department of Transportation NOVEMBER 2001 CTRE
 PAVED SHOULDERS ON PRIMARY HIGHWAYS IN IOWA: AN ANALYSIS OF SHOULDER SURFACING CRITERIA, COSTS, AND BENEFITS EXECUTIVE SUMMARY Sponsored by the Office of Traffic and Safety of the Iowa Department of Transportation
Institute of Transportation Engineers Safety Action Plan
 I Institute of Transportation Engineers Safety Action Plan 1. Introduction 2. Intersection Crashes 3. Keep Vehicles on the Road 4. Minimize Consequences When Vehicles Leave the Road 5. School Crossing
SAFETY PERFORMANCE MEASURES AND TARGET SETTING. Transportation Subcommittee September 15, 2017
 SAFETY PERFORMANCE MEASURES AND TARGET SETTING Transportation Subcommittee September 15, 2017 ACTION REQUESTED No action is requested. This item is for presentation and discussion. PREVIOUS ACTION Presented
City of Novi Non-Motorized Master Plan 2011 Executive Summary
 City of Novi Non-Motorized Master Plan 2011 Executive Summary Prepared by: February 28, 2011 Why Plan? Encouraging healthy, active lifestyles through pathway and sidewalk connectivity has been a focus
2015 Victorian Road Trauma. Analysis of Fatalities and Serious Injuries. Updated 5 May Page 1 of 28. Commercial in Confidence
 2015 Victorian Road Trauma Analysis of Fatalities and Serious Injuries Updated 5 May 2016 Page 1 of 28 Commercial in Confidence VICROADS_n3445896_2015_Victorian_Trauma_Report_- _updated_may_2016.docx 2015
The Florida Bicycle and Pedestrian Partnership Council
 The Florida Bicycle and Pedestrian Partnership Council Input to the Update of the Florida Transportation Plan March 2015 This document presents input from the Florida Bicycle and Pedestrian Advisory Council
Figure 1. Indiana fatal collisions by young driver involvement,
 INDIANA TRAFFIC SAFETY FACTS YOUNG DRIVERS 2016 MAY 2017 ISSUE 17-C06 IN 2016: In 2016, 13.4 percent of all drivers involved in Indiana collisions were young drivers. Young drivers were involved in 105
Safety and Active Transport. Dr. Maureen Carew, Medical Officer of Health Renfrew County and District Health Unit May 30, 2014
 Safety and Active Transport Dr. Maureen Carew, Medical Officer of Health Renfrew County and District Health Unit May 30, 2014 Active Transport Vision Increase levels of walking and cycling Reduce vehicle
Texas Intersection Safety Implementation Plan Workshop JUNE 2, 2016
 Texas Intersection Safety Implementation Plan Workshop JUNE 2, 2016 Why Intersection Safety? A small part of overall highway system, but Each year roughly 50% of all crashes estimated 3 million involve
road safety issues 2001 road toll for Gisborne district July 2002 Road user casualties Estimated social cost of crashes*
 GISBORNE DISTRICT road safety issues July 22 The Land Transport Safety Authority (LTSA) has prepared this Road Safety Issues Report. It is based on reported crash data and trends for the 1997 21 period.
POLICY AGENDA For Elder Pedestrian Safety
 POLICY AGENDA For Elder Pedestrian Safety Older adults and people with disabilities often have mobility, cognitive, and sensory limitations that affect their behavior as pedestrians and place them at risk
Pavement Markings (1 of 3)
") Pavement Markings (1 of 3) DESCRIPTION AND DEFINITION Disadvantages Relatively high cost (over typical Crash reduction as yet unknown painted edge line) No tactile effect The STOP AHEAD pavement marking
Pavement Markings (1 of 3) DESCRIPTION AND DEFINITION Disadvantages Relatively high cost (over typical Crash reduction as yet unknown painted edge line) No tactile effect The STOP AHEAD pavement marking
KANSAS STRATEGIC HIGHWAY SAFETY PLAN (SHSP) The stakeholder group identified the following direction for the SHSP:
 The stakeholder group identified the following direction for the SHSP:") KANSAS STRATEGIC HIGHWAY SAFETY PLAN (SHSP) Executive Summary On February 2-3, 2006, the Kansas Department of Transportation hosted a safety summit to initiate the development of the Kansas Strategic Highway
KANSAS STRATEGIC HIGHWAY SAFETY PLAN (SHSP) Executive Summary On February 2-3, 2006, the Kansas Department of Transportation hosted a safety summit to initiate the development of the Kansas Strategic Highway
Proposed. City of Grand Junction Complete Streets Policy. Exhibit 10
 Proposed City of Grand Junction Complete Streets Policy Exhibit 10 1 City of Grand Junction Complete Streets Policy Vision: The Complete Streets Vision is to develop a safe, efficient, and reliable travel
City of San Diego Vision Zero Draft Strategic Plan FY 2017
 City of San Diego Vision Zero Draft Strategic Plan FY 2017 Engineering Objective: To develop and implement a strategy that employs best planning, design and engineering practices. Background: Over the
Alberta. Traffic Collision Statistics. Office of Traffic Safety Transportation Services Division May 2017
 Traffic Collision Statistics Office of Traffic Safety Transportation Services Division May 217 This page was intentionally left blank. 2 Table of Contents Traffic Collisions... 4 Traffic Collision Rates...
CDRT. Child Death Review Team Dallas County. Brief Report Traffic-related Child Deaths OVERVIEW
 Dallas County CDRT Child Death Review Team 2013 Brief Report Traffic-related Child Deaths 2006-2011 OVERVIEW In Dallas County, traffic-related injury death rates among children are typically less than
BIKE PLAN CONTENTS GATEWAY
 CONTENTS Acknowledgments...vii Great Rivers Greenway District Board of Directors... vii Great Rivers Greenway District Staff... vii Project Consultants... vii Committees... viii Citizens Advisory Committee
Texas Intersection Safety Implementation Plan (ISIP): Project Overview & Preliminary Findings. April 15, 2016
: Project Overview & Preliminary Findings. April 15, 2016") Texas Intersection Safety Implementation Plan (ISIP): Project Overview & Preliminary Findings April 15, 2016 2 Introductions North Central Texas Council of Governments (Dallas Fort Worth area) Capital
Texas Intersection Safety Implementation Plan (ISIP): Project Overview & Preliminary Findings April 15, 2016 2 Introductions North Central Texas Council of Governments (Dallas Fort Worth area) Capital
EVERY MOVE YOU MAKE. everymove.ohio.gov OHIO STRATEGIC HIGHWAY SAFETY PLAN
 EVERY MOVE YOU MAKE everymove.ohio.gov OHIO STRATEGIC HIGHWAY SAFETY PLAN A Comprehensive Plan to Reduce Fatalities and Serious Injuries 2014-2019 TABLE OF CONTENTS 1 Partner Pledge 2 Thank You to Our
NYC Pedestrian Safety Study & Action Plan. Research, Implementation & Safety Division of Traffic Operations
 NYC Pedestrian Safety Study & Action Plan Research, Implementation & Safety Division of Traffic Operations 1 Introduction DOT Safety GOAL Strategic Plan: Reduce Fatalities by 50% by 2030 From 274 (2007)
POLICY STATEMENT: VISION ZERO
 Overview of APBP Policy Statements POLICY STATEMENT: VISION ZERO The Association of Pedestrian and Bicycle Professionals (APBP) supports the community of professionals working to create more walkable,
MEMORANDUM. City Constituents. Leilani Schwarcz, Vision Zero Surveillance Epidemiologist, SFDPH
 MEMORANDUM TO: FROM: CC: City Constituents Leilani Schwarcz, Vision Zero Surveillance Epidemiologist, SFDPH Megan Wier, Co-Chair, San Francisco Vision Zero Task Force, SFDPH Commander Ann Mannix, Traffic
Pinellas County Metropolitan Planning Organization (MPO) 2014 Crash Data Report
 2014 Crash Data Report") Pinellas County Metropolitan Planning Organization (MPO) 2014 Crash Data Report MPO Board July 8, 2015 2 Crash Data Collection Motorcycle drove between stopped cars, ran a red light and collided with a
Pinellas County Metropolitan Planning Organization (MPO) 2014 Crash Data Report MPO Board July 8, 2015 2 Crash Data Collection Motorcycle drove between stopped cars, ran a red light and collided with a
COLLISION STATISTICS May Engineering Services Box 5008, th Avenue Red Deer, AB T4N 3T4
 COLLISION STATISTICS 2016 2016 Red Deer Annual Motor Vehicle Collision Report May 2017 Engineering Services Box 5008, 4914 48th Avenue Red Deer, AB T4N 3T4 engineering@reddeer.ca RCMP GRC Red Deer City
Keep Customers and Ourselves Safe. Mark Shelton, District Engineer. Tracker. Measures of Departmental Performance
 Keep Customers and Ourselves Safe Mark Shelton, District Engineer Tracker Measures of Departmental Performance Safety is a daily commitment for all MoDOT employees. From design and construction to operations
5. Pedestrian System. Accomplishments Over the Past Five Years
 5. Pedestrian System Accomplishments Over the Past Five Years The Alamo Area Metropolitan Planning Organization (MPO) and its partner agencies recognize the importance of improving pedestrian mobility.
CTDOT Pedestrian and Bicycle Safety Initiatives
 CTDOT Pedestrian and Bicycle Safety Initiatives 2017 Northeast Transportation Safety Conference Mark F. Carlino, P.E. Traffic Engineering Division Chief Bureau of Engineering and Construction Connecticut
Chapter 5 DATA COLLECTION FOR TRANSPORTATION SAFETY STUDIES
 Chapter 5 DATA COLLECTION FOR TRANSPORTATION SAFETY STUDIES 5.1 PURPOSE (1) The purpose of the Traffic Safety Studies chapter is to provide guidance on the data collection requirements for conducting a
Florida s Intersection Safety Implementation Plan (ISIP)
") Florida Department of TRANSPORTATION Florida s Intersection Safety Implementation Plan (ISIP) Alan El-Urfali, PE State Traffic Engineering and Operations Office March 28, 2017 Intersection Safety Implementation
Florida Department of TRANSPORTATION Florida s Intersection Safety Implementation Plan (ISIP) Alan El-Urfali, PE State Traffic Engineering and Operations Office March 28, 2017 Intersection Safety Implementation
Florida Strategic Highway Safety Plan
 Florida Strategic Highway Safety Plan Prepared by The Florida Department of Transportation In partnership with Florida Department of Education Florida Department of Health Florida Department of Highway
Update MnDOT s County Roadway Safety Plans 2012 Traffic Records Forum Biloxi, MS October 29, 2012 Brad Estochen
 Update MnDOT s County Roadway Safety Plans 2012 Traffic Records Forum Biloxi, MS October 29, 2012 Brad Estochen MnDOT, CH2M HILL, SRF Consulting Group, P.E. Services 1 County Road Safety Plans Funding
Roadside Safety Proven Countermeasures. Emmett McDevitt Transportation Safety Engineer Federal Highway Administration
 Roadside Safety Proven Countermeasures Emmett McDevitt Transportation Safety Engineer Federal Highway Administration Safety Statistics On average each year 43,000 + people die in traffic related crashes.
Effects of Traffic Signal Retiming on Safety. Peter J. Yauch, P.E., PTOE Program Manager, TSM&O Albeck Gerken, Inc.
 Effects of Traffic Signal Retiming on Safety Peter J. Yauch, P.E., PTOE Program Manager, TSM&O Albeck Gerken, Inc. Introduction It has long been recognized that traffic signal timing can have an impact
4. Transportation Safety
 4. Transportation Safety INTRODUCTION Safety is a key measure of the quality of the region s transportation system. In 2005, the federal legislation Safe, Accountable, Flexible, Efficient Transportation
CITY OF LOS ANGELES INTER-DEPARTMENTAL MEMORANDUM
 CITY OF LOS ANGELES INTER-DEPARTMENTAL MEMORANDUM Date: December 12,2011 To: Honorable City Council c/o City Clerk, Room 395, City Hall Attention: Honorable Bill Rosendahl, Chair, Transportation Committee
Introduction.
 2307-1.0. Introduction. Delaware s Safe Routes to School (SRTS) Program was established September 10, 2002 when Governor Ruth Ann Minner signed Senate Bill 353 of the 141st General Assembly of Delaware
Safety Data Resources. Multi-Discipline Safety Planning Forum March 10 & 11, 2008 Gateway Center
 Safety Data Resources Multi-Discipline Safety Planning Forum March 10 & 11, 2008 Gateway Center Tom McDonald, PE Safety Circuit Rider Iowa LTAP Jack Latterell,, PE Safety Consultant FHWA Safety Engineer,
RSTF Measurements and Status
 RSTF Measurements and Status Items in green text are on or ahead of target. Items in red text need attention. Objective & Measures Status November, 2011 Winter, 3/8/12 Build, Maintain, & Leverage Partnerships
INFORMATION TOOL KIT
 CANADA ROAD SAFETY WEEK 2017 INFORMATION TOOL KIT Thank you for being involved in Canada Road Safety Week. With your participation, we can spread the word about this special week and why it is an important
VISION ZERO ACTION PLAN
 PALM BEACH Transportation Planning Agency VISION ZERO ACTION PLAN TPA Advisory Committee Meetings March 2019 PURPOSE Present the Data Analysis Key Findings and the Action Items from the Draft Action Plan
5.0 Roadway System Plan
 Southwest Boise Transportation Study Page 16 5.0 Roadway System Plan The Roadway System Plan outlines roadway improvements in the Initial Study Area. It forecasts future deficiencies on the arterial system,
Technical Memorandum SAFETY AND SECURITY. Prepared for: Prepared by:
 Technical Memorandum SAFETY AND SECURITY Prepared for: Prepared by: June 2013 TABLE OF CONTENTS 1. Introduction... 1 1.1 Background... 1 1.2 SAFETEA-LU... 1 1.3 MAP-21... 2 1.3.1 Highway Safety Improvement
FHWA s Strategic Agenda for Pedestrian and Bicycle Transportation. Purdue Road School March 8, 2017
 FHWA s Strategic Agenda for Pedestrian and Bicycle Transportation Purdue Road School March 8, 2017 1 Strategic Agenda for Pedestrian and Bicycle Transportation Provides a framework for organizing FHWA
9:45-10:30 Understanding the Problem Overview of 15 Critical Strategies (from the CHSP, SHSP) Specific Strategies for Engineers
 Specific Strategies for Engineers") Course Agenda 8:30-9:00 Sign-in 9:00-9:45 Introducing the Issues Course Objective Present the need for safety Initiatives 9:45-10:30 Understanding the Problem Overview of 15 Critical Strategies (from the
Course Agenda 8:30-9:00 Sign-in 9:00-9:45 Introducing the Issues Course Objective Present the need for safety Initiatives 9:45-10:30 Understanding the Problem Overview of 15 Critical Strategies (from the
Pedestrian-Bicycle Emphasis Area Breakout Session. Highway Safety Summit April 26, 2016
 5/20/2016 Pedestrian-Bicycle Emphasis Area Breakout Session Highway Safety Summit April 26, 2016 Fatality and Serious Injury Averages (2008-2013) by Emphasis Area Where We ve Been: February 2014 Highway
MnDOT Implementation of Complete Streets Policy. January 2014
 MnDOT Implementation of Complete Streets Policy January 2014 1 Prepared by Minnesota Department of Transportation 395 John Ireland Boulevard Saint Paul, Minnesota 55155-1899 Phone: 651-296-3000 Toll-Free:
Truck Tractor Trailer Crash Analysis
 Building Tribal Traffic Safety Capacity Truck Tractor Trailer Crash Analysis Arizona Department of Transportation (ADOT) Motor Vehicle Crash (MVC) Data ITCA, Inc. 04/18/06 Truck Tractor Trailer Crash Analysis
People killed and injured per million hours spent travelling, Motorcyclist Cyclist Driver Car / van passenger
 Cyclists CRASH FACTSHEET 27 CRASH STATISTICS FOR THE YEAR ENDED 31 DEC 26 Prepared by Strategy and Sustainability, Ministry of Transport Cyclists have a number of risk factors that do not affect car drivers.
Policies That Improve the Environment and Environmental Public Health (Chapter 1)
") Executive Summary Introduction The public road system in the U.S. is the world s busiest, sustaining more than 3 trillion vehiclemiles of travel each year on a network of more than 4 million miles of roads
Executive Summary Introduction The public road system in the U.S. is the world s busiest, sustaining more than 3 trillion vehiclemiles of travel each year on a network of more than 4 million miles of roads
SLOW DOWN A STUDY OF SPEEDING ON MCGUINNESS BLVD
 SLOW DOWN A STUDY OF SPEEDING ON MCGUINNESS BLVD ACKNOWLEDGEMENTS This report was prepared by Shawn Macias, in consultation with the McGuinness Boulevard Working Group. This report would not have been
2003 road trauma for. Wairoa District. Road casualties Estimated social cost of crashes* Major road safety issues WAIROA DISTRICT JULY 2004
 WAIROA DISTRICT JULY 24 T he Land Transport Safety Authority (LTSA) has prepared this road safety issues report. It is based on reported crash data and trends for the 1999 23 period. The intent of the
Durham Vision Zero: Strategic Road Safety Action Plan
 If you require this document in an accessible format, please contact 905-666-8116 ext. 4733 September 11, 2017 Workshop #1 Durham Vision Zero: Strategic Road Safety Action Plan Introduction Region of Durham
For Information Only. Pedestrian Collisions (2011 to 2015) Resolution. Presented: Monday, Apr 18, Report Date Tuesday, Apr 05, 2016
 Resolution. Presented: Monday, Apr 18, Report Date Tuesday, Apr 05, 2016") Presented To: Operations Committee For Information Only Pedestrian Collisions (0 to 0) Presented: Monday, Apr 8, 06 Report Date Tuesday, Apr 0, 06 Type: Correspondence for Information Only Resolution For
Presented To: Operations Committee For Information Only Pedestrian Collisions (0 to 0) Presented: Monday, Apr 8, 06 Report Date Tuesday, Apr 0, 06 Type: Correspondence for Information Only Resolution For
Governor s Transportation Vision Panel
 Office of Governor Kate Brown Governor s Transportation Vision Panel JLA Public Involvement Project Overview The is a yearlong effort to develop a series of recommendations for the Governor that address
Temporary Traffic Control State Perspective PennDOT
 RG(1 Temporary Traffic Control State Perspective PennDOT January 27, 2016 Glenn Rowe, P.E. Chief of Highway Safety and Traffic Operations Matt Briggs Manager of Work Zones and Regulations Unit Slide 1