Psychology - Mr. Callaway/Mundy s Mill HS Unit Research Methods - Statistics
|
|
|
- Emery Crawford
- 5 years ago
- Views:
Transcription
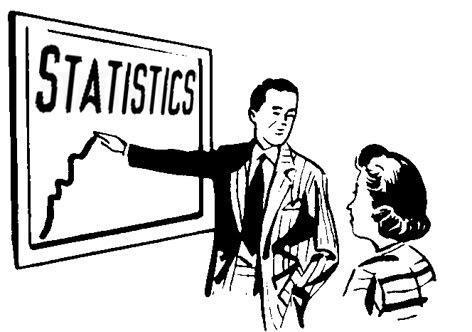
1 Psychology - Mr. Callaway/Mundy s Mill HS Unit Research Methods - Statistics


2 How do psychologists ask & answer questions? Last time we asked that we were discussing Research Methods. This time we will look at the data. Stats is all about data.
3 Distinguish the difference between the purposes of descriptive & inferential statistics. Discuss the value of reliance on operational definitions & measurements in behavioral research. Statistical procedures analyze & interpret data & let us see what the unaided eye is missing.

4 Meaningful description of data is important in research. Misrepresentation can lead to incorrect interpretation.


5 Descriptive Statistics Use measures of central tendency: mean, median and mode Use measures of variation: range and standard deviation

6 Mean, Median, Mode, & Range Mean, median, and mode are three kinds of "averages." The MEAN is the average you're used to, where you add up all the numbers and then divide by the number of numbers. The MEDIAN is the middle value in the list of numbers. To find the median, your numbers have to be listed in numerical order, so you may have to rewrite your list first. The MODE is the most often occurring value. If no number is repeated, then there is no mode for the list. The RANGE is the difference between the largest and smallest values.
 9 = 15 Note that the mean isn't a value from")


7 The mean is the usual average, so: ( ) 9 = 15 Note that the mean isn't a value from the original list. This is a common result. You should not assume that your mean will be one of your original numbers. Joe DiMaggio was the AL MVP and had a batting avg of.357 in He also had an amazing 56 game hitting streak that is still a record.


8 The Mean is the Average. So any baseball player s mean would equal the number of hits divided by the players at-bats. DiMaggio's 56 game hitting streak was amazing. However, Boston's Ted Williams hit.406 in the same season, no player has had as high an average since. DiMaggio won the American League Most Valuable Player, even though he had a lesser statistical year than Williams. Baseball averages are really just a mean. It is measured by dividing the # of hits over the # of at bats. And sometimes, real life can be mean as well!


 2 = 10 2 = 5th")

9 The median is the middle value, so I'll have to rewrite the list in order: 13, 13, 13, 13, 14, 14, 16, 18, 21 There are nine numbers in the list, so the middle one will be the (9 + 1) 2 = 10 2 = 5th number: 13, 13, 13, 13, 14, 14, 16, 18, 21 So the median is = 14
10 13, 13, 13, 13, 14, 14, 16, 18, 21 The mode is the number that is repeated more often than any other, so the mode= 13 The largest value in the list is 21, and the smallest is 13, so the range is = 8. What is the mean? mean = 15 median? median = 14 mode? mode = 13 range? range = 8 In real life, suppose a company is considering expanding into an area and is studying the size of containers that competitors are offering. Would the company be more interested in the mean, the median, or the mode of their containers? Answer: the mode because they want to know what size tends to sell most often.
11 A Skewed Distribution How are the results skewed??? Is the mean the best indicator of family income???? Probably not. That s because of the outliers - $710,000 is one such example above. So range & standard deviation come into play to help be more of an accurate description of these statistics.
12 Measures of Variation Range: The difference between the highest and lowest scores in a distribution. Standard Deviation: Average difference between each score and the mean. LARGE SD: More spread out scores are from the mean. SMALL SD: More scores bunch together around the mean.
13 How do you calculate Standard Deviation? Good News - you will NEVER have to on a test. However, I want you to understand what it represents, so here you go! Which of the following sets of data have the GREATEST SD? 1, 5, 7, 30 5, 10, 12, 18 30, 32, 34, 35 How did you figure this out???? Can estimate SD by looking at the spread of #s Can find mean and compare each # to the mean

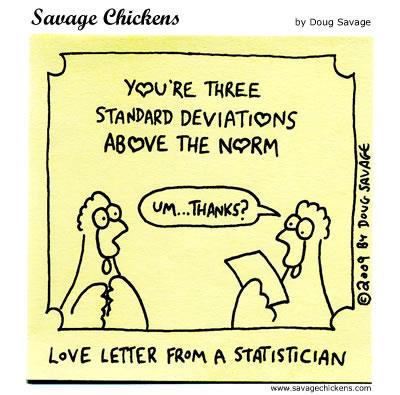
14 Standard Deviation Normal Distribution: A distribution of scores that produces a bell-shaped symmetrical curve. In this normal curve - the mean, median, and mode fall exactly at the same point. The span of ONE SD on either side of the mean covers approximately 68.2% of the scores in a normal distribution. Average IQ = 100 Most people (68.2%) fall into range IQ extremes are above 130 and below 70


15 Normal Curve <---50%---> <---50%---> You need to write this in your notes, copy it down, & memorize it. Period. There is no other way to do it. 1 SD from the mean = 68.27% 2 SD from the mean = 95.43% 3 SD from the mean = 99.73% 4 SD from the mean = %
16 A Skewed Distribution Remember this? Wouldn t this skew the curve? Is mean the best indicator of family income???? Probably not. That s because of the outliers - $710,000 is one such example above. So range & standard deviation come into play to help be more of an accurate description of these statistics.
17 A Skewed Distribution: Negative vs. Positive - Majority of scores above the mean. One or few extremely LOW scores force the mean to be less than the median score. + Majority of scores below the mean. One or few extremely HIGH scores force the mean to be greater than median score.

18 A Skewed Distribution How are the results skewed???
.")

19 Inferential Statistics: Involves estimating what is happening in a sample population for the purpose of making decisions about that population s characteristics (based in probability theory). Basically, inferential stats allow us to say: If it worked for this population, we can estimate it will work for the rest of the population. ie - Drug Testing -- if the meds worked for the sample, we estimate they will have the same effect on the rest of the population. There is always a chance for error in whatever the findings may be, so the hypothesis & results must be tested for significance.

 likelihood that any difference seen is due to your independent variable shown numerically as p <.")
20 Inferential Statistics Statistical Significance - difference observed between 2 groups is probably NOT due to chance. The difference instead is likely due to a real difference between the samples. Data is significant when the likelihood of a difference being due to chance is less than 5 times out of 100. In other words... There is a 95% chance (or greater) likelihood that any difference seen is due to your independent variable shown numerically as p <.05 Important because if research is statistically significant it means that the results are probably not a fluke or due to chance.

 Null Hypothesis = Opposite Hypothesis Purpose.")
 that there is a difference, the researcher must assume")
21 Inferential Statistics Null Hypothesis - States that there is NO difference between 2 sets of data. (basically the opposite of your hypothesis!) Null Hypothesis = Opposite Hypothesis Purpose... Until the research SHOWS (by proving the original/alternative hypothesis) that there is a difference, the researcher must assume that any difference present is due to chance. In other words, not due to statistical significance.
22 Inferential Statistics Null Hypothesis - Type I Error: Reject the null (choosing the original hypothesis), yet the null is actually true. Type II Error: Accept the null, yet the original hypothesis is actually correct. **You don t want to have errors! But, you could make them. Truth About Population NULL TRUE NULL FALSE** Decision Researcher Makes REJECT NULL (ACCEPT ORIGINAL) ACCEPT NULL Type I Error Correct Decision Correct Decision Type II Error ** If NULL FALSE - then the regular hypothesis is true!

23 Inferential Statistics Null Hypothesis Example - Original Hypothesis: A bomb threat was called into the front office, so we need to evacuate the school. Null Hypothesis: There is no bomb in the school, so we do not need to evacuate. ** If NULL FALSE - then the regular hypothesis is true! NULL TRUE Truth About Population NULL FALSE** Decision Researcher Makes REJECT NULL (ACCEPT ORIGINAL) Type I Error - students evacuated, yet bomb squad does not find a bomb. Erred on side of caution. Correct decision. Students evacuated, bomb squad finds bomb & safely removes it. All are safe! ACCEPT NULL Correct decision. No evacuation, no bomb. Threat ignored & students stay in class safe and sound. Type II Error - Bomb threat is ignored. Students stay in class, bomb goes off & students are injured.
Running head: DATA ANALYSIS AND INTERPRETATION 1
 Running head: DATA ANALYSIS AND INTERPRETATION 1 Data Analysis and Interpretation Final Project Vernon Tilly Jr. University of Central Oklahoma DATA ANALYSIS AND INTERPRETATION 2 Owners of the various
Exploring Measures of Central Tendency (mean, median and mode) Exploring range as a measure of dispersion
 Exploring range as a measure of dispersion") Unit 5 Statistical Reasoning 1 5.1 Exploring Data Goals: Exploring Measures of Central Tendency (mean, median and mode) Exploring range as a measure of dispersion Data: A set of values. A set of data can
Unit 5 Statistical Reasoning 1 5.1 Exploring Data Goals: Exploring Measures of Central Tendency (mean, median and mode) Exploring range as a measure of dispersion Data: A set of values. A set of data can
Week 7 One-way ANOVA
 Week 7 One-way ANOVA Objectives By the end of this lecture, you should be able to: Understand the shortcomings of comparing multiple means as pairs of hypotheses. Understand the steps of the ANOVA method
Averages. October 19, Discussion item: When we talk about an average, what exactly do we mean? When are they useful?
 Averages October 19, 2005 Discussion item: When we talk about an average, what exactly do we mean? When are they useful? 1 The Arithmetic Mean When we talk about an average, we can mean different things
Chapter 2: Modeling Distributions of Data
 Chapter 2: Modeling Distributions of Data Section 2.1 The Practice of Statistics, 4 th edition - For AP* STARNES, YATES, MOORE Chapter 2 Modeling Distributions of Data 2.1 2.2 Normal Distributions Section
STANDARD SCORES AND THE NORMAL DISTRIBUTION
 STANDARD SCORES AND THE NORMAL DISTRIBUTION REVIEW 1.MEASURES OF CENTRAL TENDENCY A.MEAN B.MEDIAN C.MODE 2.MEASURES OF DISPERSIONS OR VARIABILITY A.RANGE B.DEVIATION FROM THE MEAN C.VARIANCE D.STANDARD
CHAPTER 2 Modeling Distributions of Data
 CHAPTER 2 Modeling Distributions of Data 2.2 Density Curves and Normal Distributions The Practice of Statistics, 5th Edition Starnes, Tabor, Yates, Moore Bedford Freeman Worth Publishers Density Curves
Descriptive Statistics. Dr. Tom Pierce Department of Psychology Radford University
 Descriptive Statistics Dr. Tom Pierce Department of Psychology Radford University Descriptive statistics comprise a collection of techniques for better understanding what the people in a group look like
STATISTICS ELEMENTARY MARIO F. TRIOLA. Descriptive Statistics EIGHTH EDITION
 ELEMENTARY STATISTICS Chapter 2 Descriptive Statistics MARIO F. TRIOLA EIGHTH EDITION 1 2-1 Overview Chapter 2 Descriptive Statistics 2-2 Summarizing Data with Frequency Tables 2-3 Pictures of Data 2-4
Frequency Distributions
 Descriptive Statistics Dr. Tom Pierce Department of Psychology Radford University Descriptive statistics comprise a collection of techniques for better understanding what the people in a group look like
Is lung capacity affected by smoking, sport, height or gender. Table of contents
 Sample project This Maths Studies project has been graded by a moderator. As you read through it, you will see comments from the moderator in boxes like this: At the end of the sample project is a summary
How are the values related to each other? Are there values that are General Education Statistics
 How are the values related to each other? Are there values that are General Education Statistics far away from the others? Class Notes Measures of Position and Outliers: Z-scores, Percentiles, Quartiles,
Chapter 6 The Standard Deviation as a Ruler and the Normal Model
 Chapter 6 The Standard Deviation as a Ruler and the Normal Model Standardizing with z-scores Expressing data in terms of We standardize to Standardized values can be even if the original variables had
Reminders. Homework scores will be up by tomorrow morning. Please me and the TAs with any grading questions by tomorrow at 5pm
 Reminders Homework scores will be up by tomorrow morning Please email me and the TAs with any grading questions by tomorrow at 5pm 1 Chapter 12: Describing Distributions with Numbers Aaron Zimmerman STAT
y ) s x x )(y i (x i r = 1 n 1 s y Statistics Lecture 7 Exploring Data , y 2 ,y n (x 1 ),,(x n ),(x 2 ,y 1 How two variables vary together
 s x x )(y i (x i r = 1 n 1 s y Statistics Lecture 7 Exploring Data , y 2 ,y n (x 1 ),,(x n ),(x 2 ,y 1 How two variables vary together") Statistics 111 - Lecture 7 Exploring Data Numerical Summaries for Relationships between Variables Administrative Notes Homework 1 due in recitation: Friday, Feb. 5 Homework 2 now posted on course website:
Statistics 111 - Lecture 7 Exploring Data Numerical Summaries for Relationships between Variables Administrative Notes Homework 1 due in recitation: Friday, Feb. 5 Homework 2 now posted on course website:
5.1A Introduction, The Idea of Probability, Myths about Randomness
 5.1A Introduction, The Idea of Probability, Myths about Randomness The Idea of Probability Chance behavior is unpredictable in the short run, but has a regular and predictable pattern in the long run.
Descriptive Statistics
 Descriptive Statistics Descriptive Statistics vs Inferential Statistics Describing a sample Making inferences to a larger population Data = Information but too much information. How do we summarize data?
In the actual exam, you will be given more space to work each problem, so work these problems on separate sheets.
 K300 Practice Exam 1 Note: This gives you an idea of the types of questions I ask. The length of the exam may differ. The questions are meant to be representative but not all-inclused (i.e. this is a sample
Was John Adams more consistent his Junior or Senior year of High School Wrestling?
 Was John Adams more consistent his Junior or Senior year of High School Wrestling? An investigation into my Dad s high school Wrestling Career Amanda Adams Period 1 Statistical Reasoning in Sports December
Practice Test Unit 06B 11A: Probability, Permutations and Combinations. Practice Test Unit 11B: Data Analysis
 Note to CCSD HS Pre-Algebra Teachers: 3 rd quarter benchmarks begin with the last 2 sections of Chapter 6 (probability, which we will refer to as 6B), and then address Chapter 11 benchmarks (which will
The pth percentile of a distribution is the value with p percent of the observations less than it.
 Describing Location in a Distribution (2.1) Measuring Position: Percentiles One way to describe the location of a value in a distribution is to tell what percent of observations are less than it. De#inition:
PSY201: Chapter 5: The Normal Curve and Standard Scores
 PSY201: Chapter 5: The Normal Curve and Standard Scores Introduction: Normal curve + a very important distribution in behavior sciences + three principal reasons why... - 1. many of the variables measured
IHS AP Statistics Chapter 2 Modeling Distributions of Data MP1
 IHS AP Statistics Chapter 2 Modeling Distributions of Data MP1 Monday Tuesday Wednesday Thursday Friday August 22 A Day 23 B Day 24 A Day 25 B Day 26 A Day Ch1 Exploring Data Class Introduction Getting
Unit 3 ~ Data about us
 Unit 3 ~ Data about us Investigation 3: Data Sets & Displays I can construct, interpret, and compare data sets and displays. I can find, interpret, and compare measures of center and variation for data
Full file at
 Chapter 2 1. Describe the distribution. survival times of persons diagnosed with terminal lymphoma A) approximately normal B) skewed left C) skewed right D) roughly uniform Ans: C Difficulty: low 2. Without
Practice Test Unit 6B/11A/11B: Probability and Logic
 Note to CCSD Pre-Algebra Teachers: 3 rd quarter benchmarks begin with the last 2 sections of Chapter 6, and then address Chapter 11 benchmarks; logic concepts are also included. We have combined probability
% per year Age (years)
") Stat 1001 Winter 1998 Geyer Homework 2 Problem 3.1 66 inches and 72 inches. Problem 3.2 % per year 0.0 0.5 1.0 1.5 0 20 40 60 80 Age (years) (a) Age 1. (b) More 31-year olds (c) More people age 35{44,
Stat 1001 Winter 1998 Geyer Homework 2 Problem 3.1 66 inches and 72 inches. Problem 3.2 % per year 0.0 0.5 1.0 1.5 0 20 40 60 80 Age (years) (a) Age 1. (b) More 31-year olds (c) More people age 35{44,
Lesson 3 Pre-Visit Teams & Players by the Numbers
 Lesson 3 Pre-Visit Teams & Players by the Numbers Objective: Students will be able to: Review how to find the mean, median and mode of a data set. Calculate the standard deviation of a data set. Evaluate
Warm-up. Make a bar graph to display these data. What additional information do you need to make a pie chart?
 Warm-up The number of deaths among persons aged 15 to 24 years in the United States in 1997 due to the seven leading causes of death for this age group were accidents, 12,958; homicide, 5,793; suicide,
Analysis of Highland Lakes Inflows Using Process Behavior Charts Dr. William McNeese, Ph.D. Revised: Sept. 4,
 Analysis of Highland Lakes Inflows Using Process Behavior Charts Dr. William McNeese, Ph.D. Revised: Sept. 4, 2018 www.spcforexcel.com Author s Note: This document has been revised to include the latest
Unit 3 - Data. Grab a new packet from the chrome book cart. Unit 3 Day 1 PLUS Box and Whisker Plots.notebook September 28, /28 9/29 9/30?
 Unit 3 - Data Grab a new packet from the chrome book cart 9/28 9/29 9/30? 10/3 10/4 10/5 10/6 10/7-10/10 10/11 10/12 10/13 Practice ACT #1 Lesson 1: Box and Whisker Plots I can find the 5 number summary
STAT 101 Assignment 1
 STAT 1 Assignment 1 1. From the text: # 1.30 on page 29. A: For the centre the median is 2, the mean is 2.62. I am happy with either for an answer and I am happy to have these read off roughly by eye.
DESCRIBE the effect of adding, subtracting, multiplying by, or dividing by a constant on the shape, center, and spread of a distribution of data.
 Today's Objectives: FIND and INTERPRET the standardized score (z-score) of an individual value within a distribution of data. DESCRIBE the effect of adding, subtracting, multiplying by, or dividing by
MVSU NCLB 2016 Summer Reading Institute Lesson Plan Template. Name Angela Roberson
 Name Angela Roberson Name of Unit The Greatest Game Ever Played Day 1 Grade Level 6 th Understand that a set of data collected to answer a statistical question has a distribution which can be described
AP 11.1 Notes WEB.notebook March 25, 2014
 11.1 Chi Square Tests (Day 1) vocab *new seats* examples Objectives Comparing Observed & Expected Counts measurements of a categorical variable (ex/ color of M&Ms) Use Chi Square Goodness of Fit Test Must
Lesson 2 Pre-Visit Slugging Percentage
 Lesson 2 Pre-Visit Slugging Percentage Objective: Students will be able to: Set up and solve equations for batting average and slugging percentage. Review prior knowledge of conversion between fractions,
Political Science 30: Political Inquiry Section 5
 Political Science 30: Political Inquiry Section 5 Taylor Carlson tncarlson@ucsd.edu Link to Stats Motivation of the Week They ve done studies, you know. 60% of the time, it works every time. Brian, Anchorman
3.3 - Measures of Position
 3.3 - Measures of Position Z-Scores Who is taller, a man 73 inches tall or a woman 68 inches tall? The obvious answer is that the man is taller. However, men are taller than women on the average. Let s
Fundamentals of Machine Learning for Predictive Data Analytics
 Fundamentals of Machine Learning for Predictive Data Analytics Appendix A Descriptive Statistics and Data Visualization for Machine learning John Kelleher and Brian Mac Namee and Aoife D Arcy john.d.kelleher@dit.ie
Pitching Performance and Age
 Pitching Performance and Age By: Jaime Craig, Avery Heilbron, Kasey Kirschner, Luke Rector, Will Kunin Introduction April 13, 2016 Many of the oldest players and players with the most longevity of the
Fun with M&M s. By: Cassandra Gucciardo. Sorting
 Fun with M&M s Sorting Fractions Objectives: The students will be able to review the measures of central tendency by determining mean, median, mode and range. They will review their understanding of estimation,
ACTIVITY: Drawing a Box-and-Whisker Plot. a. Order the data set and write it on a strip of grid paper with 24 equally spaced boxes.
 2. Box-and-Whisker Plots describe a data set? How can you use a box-and-whisker plot to ACTIVITY: Drawing a Box-and-Whisker Plot Work with a partner. The numbers of first cousins of the students in an
Statistics. Wednesday, March 28, 2012
 Statistics Wednesday, March 28, 2012 Today's Agenda: 1. Collect HW #2: Activities 9 7 & 9 12 2. Go over HW #1: Activities 9 20 a f & 9 17 3. Practice calculating & s x 4. Activities 9 4, 9 5, 9 11, 9 13
DS5 The Normal Distribution. Write down all you can remember about the mean, median, mode, and standard deviation.
 DS5 The Normal Distribution Write down all you can remember about the mean, median, mode, and standard deviation. 1 DS5 The Normal Distribution Basic concepts: Describing and using Z scores calculated
46 Chapter 8 Statistics: An Introduction
 46 Chapter 8 Statistics: An Introduction Activity 5 Continued Box 4 1. The median is 6. The mode is 5. The mean is about 7 (6.8). 2. The median and the mode were unchanged, but the mean increased significantly.
Average Runs per inning,
 Home Team Scoring Advantage in the First Inning Largely Due to Time By David W. Smith Presented June 26, 2015 SABR45, Chicago, Illinois Throughout baseball history, the home team has scored significantly
5.1 Introduction. Learning Objectives
 Learning Objectives 5.1 Introduction Statistical Process Control (SPC): SPC is a powerful collection of problem-solving tools useful in achieving process stability and improving capability through the
NOTES: STANDARD DEVIATION DAY 4 Textbook Chapter 11.1, 11.3
 NOTES: STANDARD DEVIATION DAY 4 Textbook Chapter 11.1, 11.3 OBJECTIVE: Today you will learn about standard deviation and the normal curve! There are three ways that we can measure how spread out the data
Solutionbank S1 Edexcel AS and A Level Modular Mathematics
 Page 1 of 1 Exercise A, Question 1 A group of thirty college students was asked how many DVDs they had in their collection. The results are as follows. 12 25 34 17 12 18 29 34 45 6 15 9 25 23 29 22 20
Assignment. To New Heights! Variance in Subjective and Random Samples. Use the table to answer Questions 2 through 7.
 Assignment Assignment for Lesson.1 Name Date To New Heights! Variance in Subjective and Random Samples 1. Suppose that you have collected data for the weights of all of the crates in a warehouse. a. Give
Box-and-Whisker Plots
 7.2 Box-and-Whisker Plots Essential Question How can you use a box-and-whisker plot to describe a data set? Drawing a Box-and-Whisker Plot 3 9 23 62 3 Numbers of First Cousins 0 3 9 3 45 24 8 0 3 3 6 8
Data Set 7: Bioerosion by Parrotfish Background volume of bites The question:
 Data Set 7: Bioerosion by Parrotfish Background Bioerosion of coral reefs results from animals taking bites out of the calcium-carbonate skeleton of the reef. Parrotfishes are major bioerosion agents,
That pesky golf game and the dreaded stats class
 That pesky golf game and the dreaded stats class Marsha Jance Indiana University East A case study that involves golf and statistics is presented. This case study focuses on descriptive statistics and
Descriptive Stats. Review
 Descriptive Stats Review Categorical Data The Area Principal Distorts the data possibly making it harder to compare categories Everything should add up to 100% When we add up all of our categorical data,
Driv e accu racy. Green s in regul ation
 LEARNING ACTIVITIES FOR PART II COMPILED Statistical and Measurement Concepts We are providing a database from selected characteristics of golfers on the PGA Tour. Data are for 3 of the players, based
STAT 155 Introductory Statistics. Lecture 2-2: Displaying Distributions with Graphs
 The UNIVERSITY of NORTH CAROLINA at CHAPEL HILL STAT 155 Introductory Statistics Lecture 2-2: Displaying Distributions with Graphs 8/31/06 Lecture 2-2 1 Recall Data: Individuals Variables Categorical variables
Internet Technology Fundamentals. To use a passing score at the percentiles listed below:
 Internet Technology Fundamentals To use a passing score at the percentiles listed below: PASS candidates with this score or HIGHER: 2.90 High Scores Medium Scores Low Scores Percentile Rank Proficiency
Pitching Performance and Age
 Pitching Performance and Age Jaime Craig, Avery Heilbron, Kasey Kirschner, Luke Rector and Will Kunin Introduction April 13, 2016 Many of the oldest and most long- term players of the game are pitchers.
PRACTICE PROBLEMS FOR EXAM 1
 ST 311 PRACTICE PROBLEMS FOR EXAM 1 Topics covered on Exam 1: Chapters 1-7 in text. Reiland This material is covered in webassign homework assignments 1 through 4 and worksheets 1-7. " Exam information:
NCSS Statistical Software
 Chapter 256 Introduction This procedure computes summary statistics and common non-parametric, single-sample runs tests for a series of n numeric, binary, or categorical data values. For numeric data,
1 Hypothesis Testing for Comparing Population Parameters
 Hypothesis Testing for Comparing Population Parameters Hypothesis testing can address many di erent types of questions. We are not restricted to looking at the estimated value of a single population parameter.
Hitting with Runners in Scoring Position
 Hitting with Runners in Scoring Position Jim Albert Department of Mathematics and Statistics Bowling Green State University November 25, 2001 Abstract Sportscasters typically tell us about the batting
STT 315 Section /19/2014
 Name: PID: A STT 315 Section 101 05/19/2014 Quiz 1A 50 minutes 1. A survey by an electric company contains questions on the following: Age of household head, Gender of household head and use of electric
a) List and define all assumptions for multiple OLS regression. These are all listed in section 6.5
 List and define all assumptions for multiple OLS regression. These are all listed in section 6.5") Prof. C. M. Dalton ECN 209A Spring 2015 Practice Problems (After HW1, HW2, before HW3) CORRECTED VERSION Question 1. Draw and describe a relationship with heteroskedastic errors. Support your claim with
Prof. C. M. Dalton ECN 209A Spring 2015 Practice Problems (After HW1, HW2, before HW3) CORRECTED VERSION Question 1. Draw and describe a relationship with heteroskedastic errors. Support your claim with
Histogram. Collection
 Density Curves and Normal Distributions Suppose we looked at an exam given to a large population of students. The histogram of this data appears like the graph to the left below. However, rather than show
WHAT IS THE ESSENTIAL QUESTION?
 WHAT IS THE ESSENTIAL QUESTION? Essential Question Essential Question Essential Question Essential Question Essential Question Essential Question Essential Question Week 3, Lesson 1 1. Warm up 2. Notes
CHAPTER 1 ORGANIZATION OF DATA SETS
 CHAPTER 1 ORGANIZATION OF DATA SETS When you collect data, it comes to you in more or less a random fashion and unorganized. For example, what if you gave a 35 item test to a class of 50 students and collect
Quantitative Literacy: Thinking Between the Lines
 Quantitative Literacy: Thinking Between the Lines Crauder, Noell, Evans, Johnson Chapter 6: Statistics 2013 W. H. Freeman and Company 1 Chapter 6: Statistics Lesson Plan Data summary and presentation:
Bivariate Data. Frequency Table Line Plot Box and Whisker Plot
 U04 D02 Univariate Data Frequency Table Line Plot Box and Whisker Plot Univariate Data Bivariate Data involving a single variable does not deal with causes or relationships the major purpose of univariate
Unit 4: Inference for numerical variables Lecture 3: ANOVA
 Unit 4: Inference for numerical variables Lecture 3: ANOVA Statistics 101 Thomas Leininger June 10, 2013 Announcements Announcements Proposals due tomorrow. Will be returned to you by Wednesday. You MUST
DO YOU KNOW WHO THE BEST BASEBALL HITTER OF ALL TIMES IS?...YOUR JOB IS TO FIND OUT.
 Data Analysis & Probability Name: Date: Hour: DO YOU KNOW WHO THE BEST BASEBALL HITTER OF ALL TIMES IS?...YOUR JOB IS TO FIND OUT. This activity will find the greatest baseball hitter of all time. You
Taking Your Class for a Walk, Randomly
 Taking Your Class for a Walk, Randomly Daniel Kaplan Macalester College Oct. 27, 2009 Overview of the Activity You are going to turn your students into an ensemble of random walkers. They will start at
Stats 2002: Probabilities for Wins and Losses of Online Gambling
 Abstract: Jennifer Mateja Andrea Scisinger Lindsay Lacher Stats 2002: Probabilities for Wins and Losses of Online Gambling The objective of this experiment is to determine whether online gambling is a
Age of Fans
 Measures of Central Tendency SUGGESTED LEARNING STRATEGIES: Activating Prior Knowledge, Interactive Word Wall, Marking the Text, Summarize/Paraphrase/Retell, Think/Pair/Share Matthew is a student reporter
WorkSHEET 13.3 Univariate data II Name:
 WorkSHEET 13.3 Univariate data II Name: 1 The back-to-back stem-and-leaf plot shows the number of people (to the nearest thousand) that attend cricket matches in both Sydney and Melbourne during a season.
LaDawn Bisson Measures of Central Tendency
 LaDawn Bisson 2014 Measures of Central Tendency LaDawn Bisson 2014 Measures of central tendency: a measure used to describe data; the mean, median, and mode are measures of central tendency Mean: the sum
Introduction. Mode Choice and Urban Form. The Transportation Planner s Approach. The problem
 Introduction The table below shows transit s share in the urban US (all trip purposes) and the 10 urban areas where it is most popular (2008 data): Mode Choice and Urban Form Philip A. Viton April 4, 2014
Opleiding Informatica
 Opleiding Informatica Determining Good Tactics for a Football Game using Raw Positional Data Davey Verhoef Supervisors: Arno Knobbe Rens Meerhoff BACHELOR THESIS Leiden Institute of Advanced Computer Science
Denise L Seman City of Youngstown
 Denise L Seman City of Youngstown The control chart is one of the most important tools of quality control for laboratory data. A control chart is a specific kind of run chart that allows unusual change
The Rise in Infield Hits
 The Rise in Infield Hits Parker Phillips Harry Simon December 10, 2014 Abstract For the project, we looked at infield hits in major league baseball. Our first question was whether or not infield hits have
Unit 6 Day 2 Notes Central Tendency from a Histogram; Box Plots
 AFM Unit 6 Day 2 Notes Central Tendency from a Histogram; Box Plots Name Date To find the mean, median and mode from a histogram, you first need to know how many data points were used. Use the frequency
Mrs. Daniel- AP Stats Ch. 2 MC Practice
 Mrs. Daniel- AP Stats Ch. 2 MC Practice Name: 1. Jorge s score on Exam 1 in his statistics class was at the 64th percentile of the scores for all students. His score falls (a) between the minimum and the
Algebra 1 Unit 7 Day 2 DP Box and Whisker Plots.notebook April 10, Algebra I 04/10/18 Aim: How Do We Create Box and Whisker Plots?
 Algebra I 04/10/18 Aim: How Do We Create Box and Whisker Plots? DO NOW 1) Find the mean, median, and mode of the data below 2) Which measure of central tendency do you believe best represents the data?
AP Stats Chapter 2 Notes
 AP Stats Chapter 2 Notes 2.1 Measures of Relative Standing & Density Curves What is a percentile? On a test, is a student s percentile the same as the percent correct? Example: Test Scores Suppose the
How Fast Can You Throw?
 Name Date Period How Fast Can You Throw? Directions: Find a spot 40 feet from a wall and mark it with a piece of chalk. From that point, you will throw the ball 5 times with your right hand, and then five
A few things to remember about ANOVA
 A few things to remember about ANOVA 1) The F-test that is performed is always 1-tailed. This is because your alternative hypothesis is always that the between group variation is greater than the within
b) (2 pts.) Does the study show that drinking 4 or more cups of coffee a day caused the higher death rate?
 (2 pts.) Does the study show that drinking 4 or more cups of coffee a day caused the higher death rate?") Question 1 (10 pts) A study published in the August 15, 2017 issue of Mayo Clinic Proceedings tracked 44,000 people aged 20 to 87 for an average of about 16 years and found that those who drank 4 or more
Question 1 (10 pts) A study published in the August 15, 2017 issue of Mayo Clinic Proceedings tracked 44,000 people aged 20 to 87 for an average of about 16 years and found that those who drank 4 or more
SUMMARIZING FROG AND TOAD COUNT DATA
 SUMMARIZING FROG AND TOAD COUNT DATA This set of protocols will take you through all the steps necessary for summarizing the frog and toad data for each NAAMP route that was been assigned to you. BEFORE
Smoothing the histogram: The Normal Curve (Chapter 8)
") Sept. 3 Statistic for the day: Compared to same month the previous year, average monthly drop in U.S. traffic fatalities from May 27 to Feb. 28:.2% Drop in March 28: 22.1% Drop in April 28: 17.9% Smoothing
Sept. 3 Statistic for the day: Compared to same month the previous year, average monthly drop in U.S. traffic fatalities from May 27 to Feb. 28:.2% Drop in March 28: 22.1% Drop in April 28: 17.9% Smoothing
Section 3.2: Measures of Variability
 Section 3.2: Measures of Variability The mean and median are good statistics to employ when describing the center of a collection of data. However, there is more to a collection of data than just the center!
An Introduction to Statistical Process Control Charts (SPC) Steve Harrison
 Steve Harrison") An Introduction to Statistical Process Control Charts (SPC) Steve Harrison Topics Variation A Quick Recap An introduction to SPC Charts Interpretation Quiz Application in Improvement work Variation Common
An Introduction to Statistical Process Control Charts (SPC) Steve Harrison Topics Variation A Quick Recap An introduction to SPC Charts Interpretation Quiz Application in Improvement work Variation Common
1. Answer this student s question: Is a random sample of 5% of the students at my school large enough, or should I use 10%?
 Econ 57 Gary Smith Fall 2011 Final Examination (150 minutes) No calculators allowed. Just set up your answers, for example, P = 49/52. BE SURE TO EXPLAIN YOUR REASONING. If you want extra time, you can
Analysis of NAM Forecast Wind Shear for Dissipation of Mesoscale Convective Systems
 Analysis of NAM Forecast Wind Shear for Dissipation of Mesoscale Convective Systems MATTHEW P. HOFFMAN Meteorology Program, Iowa State University, Ames, IA Mentor: David Flory Department of Geological
CHAPTER 2 Modeling Distributions of Data
 CHAPTER 2 Modeling Distributions of Data 2.1 Describing Location in a Distribution The Practice of Statistics, 5th Edition Starnes, Tabor, Yates, Moore Bedford Freeman Worth Publishers Describing Location
Should pitchers bat 9th?
 Should pitchers bat 9th? Mark Pankin SABR 37 July 26, 2007 St. Louis, Missouri Notes provide additional information and were reminders during the presentation. They are not supposed to be anything close
5.1. Data Displays Batter Up. My Notes ACTIVITY
 SUGGESTED LEARNING STRATEGIES: Activating Prior Knowledge, Marking the Text, Group Presentation, Interactive Word Wall Henry Hank Aaron and Harmon Killebrew are among the alltime leaders in home runs in
ABOUT THE REPORT. This is a sample report. Report should be accurate but is not
 TopTyper.com Statistic Report - beta sample edition ABOUT THE REPORT ABOUT THE REPORT This is a sample report. Report should be accurate but is not verified (beta)! Report will be updated and improved,
9.3 Histograms and Box Plots
 Name Class Date 9.3 Histograms and Box Plots Essential Question: How can you interpret and compare data sets using data displays? Explore Understanding Histograms Resource Locker A histogram is a bar graph
Find Mean, Median, Mode, and Outlier
 SS SDA G6.S.5.c 2 dentify Giving the mode(s) quantitative for sets measures of categorical of center (median data, and/or the mean) and variability (interquartile mode(s), range median, and/or and mean
Lecture 16: Chapter 7, Section 2 Binomial Random Variables
 Lecture 16: Chapter 7, Section 2 Binomial Random Variables!Definition!What if Events are Dependent?!Center, Spread, Shape of Counts, Proportions!Normal Approximation Cengage Learning Elementary Statistics: