Unit 3 - Data. Grab a new packet from the chrome book cart. Unit 3 Day 1 PLUS Box and Whisker Plots.notebook September 28, /28 9/29 9/30?
|
|
|
- Osborne Simpson
- 5 years ago
- Views:
Transcription

1 Unit 3 - Data Grab a new packet from the chrome book cart 9/28 9/29 9/30? 10/3 10/4 10/5 10/6 10/7-10/10 10/11 10/12 10/13 Practice ACT #1
2 Lesson 1: Box and Whisker Plots I can find the 5 number summary and use it to create a box and whisker plot by hand and by using a calculator Vocabulary Mean: Median: Mode: Range: IQR: 5 # summary:

3 Box and Whisker Plots How can we describe a box plot?
![Let's collect some data: [1] Find your pulse rate and count for 30 seconds then MULTIPLY by 2.](/docs-images/94/122259626/images/4-0.jpg "Plug into the calculator and find the mean, median, mode and 5 # summary mean: mode: range: 5 #")
4 Let's collect some data: [1] Find your pulse rate and count for 30 seconds then MULTIPLY by 2. Plug into the calculator and find the mean, median, mode and 5 # summary mean: mode: range: 5 # summary: IQR


5 How are you doing?? Assignment: pg #1ab, 2-6, 8, 9b I can find the 5 number summary and use it to create a box and whisker plot by hand and by using a calculator
6

7 Lesson Goals - 2 Days I can: Find Mean, Median, and Mode by hand and using the calculator. Find the 5 # Summary and use it to create a box and whisker plot by hand and by calculator Create data sets given information. Find Standard Deviation on a calculator and by hand.
8 Measures of Center: mean, median, mode Box Plots: 5 number summary,,,, Standard Deviation: {5, 3, 6, 9, 5, 20, 10, 7} Range: IQR: Outlier: 1.5x beyond Q1 or Q3 {3, 5, 5, 6, 7, 9, 10, 20} Cutoffs: and
9 Making up data sets Create a set of 3 numbers; range = 12; max = 20,, Create a set of 5; mean = 15; median = 14; mode = 20,,,, Create a set of 6; mean = 22 ; max = 25; mode = 20,,,,, Mastery Work: pg # 1ab, 2-6, 8, 9b, 10-12
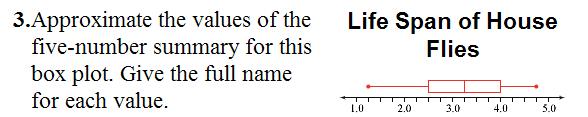
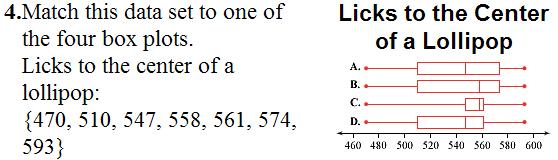
10 Key pg [1] 29.2, 28, , 17.95, 17.4 [2] 7, 14, 15 (sum 36; 14 in middle) [3] 1.25, 2.5, 3.25, 4, 4.75 [4] B [5] D [8] 25, 51, 58, 65, 72; mean: 56.54; 98 [9b] range = 47; IQR = 14 [10] 9, 10, 11, 12, 13, 14, 15 (no repeat; sum 84) [11] 62, 63, 64, 65, 70, 70, 70 (many OK) [12] 33, 50, 53, 70, 72, 83, 92; pink may be different Warm Up: How do you... put data in Calculator? clear data? Find statistics? which symbol means mean? 5 number summary? standard deviation? What # make up a 5 number summary?
11 Lesson Goals - 2 Days I can: Find Mean, Median, and Mode by hand and using the calculator. Find the 5 # Summary and use it to create a box and whisker plot by hand and by calculator Create data sets given information. Find Standard Deviation on a calculator and by hand. Find 5 # summary; check for outlier; S x Adrian Peterson statistics for total yards per regular season game in the 2012 season {100, 180, 122, 103, 129, 159, 127, 193, 176, 138, 300, 170, 212, 110, 201}
12 Erase mean average distance spread Standard Deviation Sum (Add them all up) individual data value mean number of data values in the set 1. Find the standard deviation of the data set { 2, 4, 7, 8, 12, 15 } (Find the mean) (Deviations) 2 8 = = = = = =
13 Standard deviation is larger when the data is spread from the mean. Standard deviation is smaller when. Here are 4 volleyball teams with a plot of each players height in inches. Rank from smallest to biggest standard deviation. mean = 65.7 S x = 3.39 mean = 66 S x = 4.69 mean = 66 mean = 66 S x = 4.35 S x = 4.07


14 Which has the larger standard deviation? Mastery Work: pg # 2acd, 3-6, 9ab, 11, 13
15 Key pg [1] 47; -6, 8, 1, -3; 6.06 [2] 63.4; 11.24; minutes [3] 9, 10, 14, 17, 21; 12 & 7; cm [4] 18, 22, 28, 30, 35; 17 & 8 ; g [5] 72, 78, 84, 84, 85, 90, 95 [9] skewed left symmetric skewed has greater S x since farther apart [10] 47.1, 45.9, 47.9, 47.4, 45.1, 46, 45.3 S x = 1.08; 47.9 cm; 47.4 cm; 45.1 cm [11] 1st lowest and 6th largest [12] Juneau; 40.5 and , 30, 41, 51, & 21 NYC: and , 39, 54, 68.5, & 29.5 smaller spread in Juneau
16 Warm Up I can: Create and interpret a frequency table Create and interpret a histogram Calculate and interpret percentile rank
17 Histogram: a graph that shows the frequency of data values in the data set. 1) Bin widths should all be the same 2) The smaller the interval, the more you know about the specific numbers in the data set. 3) Boundary values always fall to the right. Heights of Plants in a Garden # of plants What values are in each bin??? Height (cm) Shape/Skew
18 1. Mound Shape Shape of Histograms What does a histogram with this shape mean about the data? = there are an amount of data pieces on the left and right of the with the same deviations from the mean. 2. Rectangular Shaped What does a histogram with this shape mean about the data?
19 3. Skewed Left What does a histogram with this shape mean about the data? erase the mean is than the median dropped lower Why?? 4. Skewed Right What does a histogram with this shape mean about the data? erase the mean is higher than the median Why??
20 The Percentile Rank of a data value gives the percentage of data values that are the given value. ex) Ellen scored in the 85th Percentile on her standardized test. What does this mean? How tall are you compared to your peers? Stretch break!! Line up from shortest to tallest. Gentleman 1 side and ladies other. Bring your calculator.
21 Find your percentile rank. Let's find out Mrs. W's together! Number in line: That means she was taller than people. What percentage of the ladies is that? Now do it for Follow up questions! Who was at the 25th percentile? What number would that be on a box plot? Who was at the 3rd quartile, Q 3? What percentile is that? Who was the median?
 What shoe size is in the 57 th percentile? d) What shoe size is in the 10 th percentile? 64 th percentile 29 th percentile size 11 size 7 Finding percentile rank from a histogram.")
22 These data are the shoe sizes of 14 students. { 6, 7, 7, 7.5, 9, 9, 9.5, 10, 11, 11.5, 11.5, 12, 12, 13} a) Find the percentile rank of size 11.5 shoes. b) Find the percentile rank of size 9 shoe. c) What shoe size is in the 57 th percentile? d) What shoe size is in the 10 th percentile? 64 th percentile 29 th percentile size 11 size 7 Finding percentile rank from a histogram. 1) What is the percentile rank of a 75 foot tree? 2) In which interval is the 40th percentile?
23 Mastery Work: pages # 1ab; 4bc; 5ac (describe only); 8; 10 & Histogram & Percentile Rank WS (on google classroom - do work in note book.) Describe means write about without doing! Key [1] 2; 9; any that work [3] 5; 25%; 95% [2] 10; 15; 20; 25; iii not to 240 [4] more data in middle; mean = 2(26) + 3(56) etc / 1000 and between [5] More data to left [8] Better than 88%; = or lower to 12% Better than 95%; = or lower to 5% 99%; 10% [9] between mph; mph; location and safety
![[6] dice sum roll grades on tests with most higher hard test with more low scores.](/docs-images/94/122259626/images/24-3.jpg "Single die roll [10] 118; 57-59 mph; 55 to 60 mph Warm Up You have the 3rd biggest foot in the room. What is your percentile rank? You have the 13th biggest foot.")
24 [6] dice sum roll grades on tests with most higher hard test with more low scores. Single die roll [10] 118; mph; 55 to 60 mph Warm Up You have the 3rd biggest foot in the room. What is your percentile rank? You have the 13th biggest foot. Rank? Your foot is in the 78 th Percentile. How many feet are smaller than yours?

25 Do in your note book. Real world use of normal distribution
26 Normal Distribution Curves I can: *Sketch a Normal Distribution Curve with the mean and standard deviations in the proper positions *Use the Normal curve to find percentile rankings *Use the Normal curve to find intervals for percentages of the distribution *Understand how the works and its relationship to standard deviation Rule (Empirical Rule): Normal Distributions with mean μ, SD σ *68% of observations fall within ±1σ of μ *95% of observations fall within ±2σ of μ *99.7% of observations fall within ±3σ of μ
27 Young women age 18 to 24 have an approximately normal distribution with mean height = 64 inches and a standard deviation = 3 inches. Sketch a Normal curve that shows the mean and ±3 standard deviations correctly located. 68% of the data fall between what numbers? 95%? 99.7%? What percentage of the data fall below 67 inches? above 61 inches? What percentage of the data fall between 58 and 67 inches? If a young woman is 70 inches tall, what percentile would she be at? Mastery Work: pg. 109 # 3 and 5 Normal Distribution WS (on google classroom - do in notebook with 1/2 sheet of graphs.)
28 Key [1] Plot B; Largest Spread [2] 30 for A and 25 for B B has largest spread [3] 553.6; 167; no mode 5, 167, 460, 645, 2019 (5 number) Skewed Right IQR: 478 Outliers 1822; 2019 [4] Sx = 3.1 IQR = Sx = 2.2 IQR = 5 [5] mean = Sx = Antarctica's High Outlier
29 % in 74 in 16% %
30 16% 99.7% 2.5%
31 hrs up to 49 hrs
32 68% 16% 16%
3.3 - Measures of Position
 3.3 - Measures of Position Z-Scores Who is taller, a man 73 inches tall or a woman 68 inches tall? The obvious answer is that the man is taller. However, men are taller than women on the average. Let s
Chapter 6 The Standard Deviation as a Ruler and the Normal Model
 Chapter 6 The Standard Deviation as a Ruler and the Normal Model Standardizing with z-scores Expressing data in terms of We standardize to Standardized values can be even if the original variables had
Unit 3 ~ Data about us
 Unit 3 ~ Data about us Investigation 3: Data Sets & Displays I can construct, interpret, and compare data sets and displays. I can find, interpret, and compare measures of center and variation for data
Year 10 Term 2 Homework
 Yimin Math Centre Year 10 Term 2 Homework Student Name: Grade: Date: Score: Table of contents 6 Year 10 Term 2 Week 6 Homework 1 6.1 Data analysis and evaluation............................... 1 6.1.1
STT 315 Section /19/2014
 Name: PID: A STT 315 Section 101 05/19/2014 Quiz 1A 50 minutes 1. A survey by an electric company contains questions on the following: Age of household head, Gender of household head and use of electric
Chapter 2: Modeling Distributions of Data
 Chapter 2: Modeling Distributions of Data Section 2.1 The Practice of Statistics, 4 th edition - For AP* STARNES, YATES, MOORE Chapter 2 Modeling Distributions of Data 2.1 2.2 Normal Distributions Section
1. The data below gives the eye colors of 20 students in a Statistics class. Make a frequency table for the data.
 1. The data below gives the eye colors of 20 students in a Statistics class. Make a frequency table for the data. Green Blue Brown Blue Blue Brown Blue Blue Blue Green Blue Brown Blue Brown Brown Blue
% per year Age (years)
") Stat 1001 Winter 1998 Geyer Homework 2 Problem 3.1 66 inches and 72 inches. Problem 3.2 % per year 0.0 0.5 1.0 1.5 0 20 40 60 80 Age (years) (a) Age 1. (b) More 31-year olds (c) More people age 35{44,
Stat 1001 Winter 1998 Geyer Homework 2 Problem 3.1 66 inches and 72 inches. Problem 3.2 % per year 0.0 0.5 1.0 1.5 0 20 40 60 80 Age (years) (a) Age 1. (b) More 31-year olds (c) More people age 35{44,
Reminders. Homework scores will be up by tomorrow morning. Please me and the TAs with any grading questions by tomorrow at 5pm
 Reminders Homework scores will be up by tomorrow morning Please email me and the TAs with any grading questions by tomorrow at 5pm 1 Chapter 12: Describing Distributions with Numbers Aaron Zimmerman STAT
Lesson 2.1 Frequency Tables and Graphs Notes Stats Page 1 of 5
 Stats Page 1 of 5 Frequency Table: partitions data into classes or intervals and shows how many data values are in each class. The classes or intervals are constructed so that each data value falls exactly
Warm-up. Make a bar graph to display these data. What additional information do you need to make a pie chart?
 Warm-up The number of deaths among persons aged 15 to 24 years in the United States in 1997 due to the seven leading causes of death for this age group were accidents, 12,958; homicide, 5,793; suicide,
Full file at
 Chapter 2 1. Describe the distribution. survival times of persons diagnosed with terminal lymphoma A) approximately normal B) skewed left C) skewed right D) roughly uniform Ans: C Difficulty: low 2. Without
IHS AP Statistics Chapter 2 Modeling Distributions of Data MP1
 IHS AP Statistics Chapter 2 Modeling Distributions of Data MP1 Monday Tuesday Wednesday Thursday Friday August 22 A Day 23 B Day 24 A Day 25 B Day 26 A Day Ch1 Exploring Data Class Introduction Getting
Solutionbank S1 Edexcel AS and A Level Modular Mathematics
 Page 1 of 1 Exercise A, Question 1 A group of thirty college students was asked how many DVDs they had in their collection. The results are as follows. 12 25 34 17 12 18 29 34 45 6 15 9 25 23 29 22 20
STANDARD SCORES AND THE NORMAL DISTRIBUTION
 STANDARD SCORES AND THE NORMAL DISTRIBUTION REVIEW 1.MEASURES OF CENTRAL TENDENCY A.MEAN B.MEDIAN C.MODE 2.MEASURES OF DISPERSIONS OR VARIABILITY A.RANGE B.DEVIATION FROM THE MEAN C.VARIANCE D.STANDARD
CHAPTER 2 Modeling Distributions of Data
 CHAPTER 2 Modeling Distributions of Data 2.2 Density Curves and Normal Distributions The Practice of Statistics, 5th Edition Starnes, Tabor, Yates, Moore Bedford Freeman Worth Publishers Density Curves
Unit 6 Day 2 Notes Central Tendency from a Histogram; Box Plots
 AFM Unit 6 Day 2 Notes Central Tendency from a Histogram; Box Plots Name Date To find the mean, median and mode from a histogram, you first need to know how many data points were used. Use the frequency
Name Date Period. E) Lowest score: 67, mean: 104, median: 112, range: 83, IQR: 102, Q1: 46, SD: 17
 Lowest score: 67, mean: 104, median: 112, range: 83, IQR: 102, Q1: 46, SD: 17") Chapter 6 Review Standards: 4, 7, 8, and 11 Name Date Period Write complete answers, using complete sentences where necessary. Show your work when possible. MULTIPLE CHOICE. Choose the one alternative
Chapter 6 Review Standards: 4, 7, 8, and 11 Name Date Period Write complete answers, using complete sentences where necessary. Show your work when possible. MULTIPLE CHOICE. Choose the one alternative
Age of Fans
 Measures of Central Tendency SUGGESTED LEARNING STRATEGIES: Activating Prior Knowledge, Interactive Word Wall, Marking the Text, Summarize/Paraphrase/Retell, Think/Pair/Share Matthew is a student reporter
Practice Test Unit 6B/11A/11B: Probability and Logic
 Note to CCSD Pre-Algebra Teachers: 3 rd quarter benchmarks begin with the last 2 sections of Chapter 6, and then address Chapter 11 benchmarks; logic concepts are also included. We have combined probability
Algebra 1 Unit 6 Study Guide
 Name: Period: Date: Use this data to answer questions #1. The grades for the last algebra test were: 12, 48, 55, 57, 60, 61, 65, 65, 68, 71, 74, 74, 74, 80, 81, 81, 87, 92, 93 1a. Find the 5 number summary
Math 243 Section 4.1 The Normal Distribution
 Math 243 Section 4.1 The Normal Distribution Here are some roughly symmetric, unimodal histograms The Normal Model The famous bell curve Example 1. The mean annual rainfall in Portland is unimodal and
Practice Test Unit 06B 11A: Probability, Permutations and Combinations. Practice Test Unit 11B: Data Analysis
 Note to CCSD HS Pre-Algebra Teachers: 3 rd quarter benchmarks begin with the last 2 sections of Chapter 6 (probability, which we will refer to as 6B), and then address Chapter 11 benchmarks (which will
Algebra 1 Unit 7 Day 2 DP Box and Whisker Plots.notebook April 10, Algebra I 04/10/18 Aim: How Do We Create Box and Whisker Plots?
 Algebra I 04/10/18 Aim: How Do We Create Box and Whisker Plots? DO NOW 1) Find the mean, median, and mode of the data below 2) Which measure of central tendency do you believe best represents the data?
Lab 5: Descriptive Statistics
 Page 1 Technical Math II Lab 5: Descriptive Stats Lab 5: Descriptive Statistics Purpose: To gain experience in the descriptive statistical analysis of a large (173 scores) data set. You should do most
STAT 101 Assignment 1
 STAT 1 Assignment 1 1. From the text: # 1.30 on page 29. A: For the centre the median is 2, the mean is 2.62. I am happy with either for an answer and I am happy to have these read off roughly by eye.
(c) The hospital decided to collect the data from the first 50 patients admitted on July 4, 2010.
 The hospital decided to collect the data from the first 50 patients admitted on July 4, 2010.") Math 155, Test 1, 18 October 2011 Name: Instructions. This is a closed-book test. You may use a calculator (but not a cell phone). Make sure all cell-phones are put away and that the ringer is off. Show
Math 155, Test 1, 18 October 2011 Name: Instructions. This is a closed-book test. You may use a calculator (but not a cell phone). Make sure all cell-phones are put away and that the ringer is off. Show
NOTES: STANDARD DEVIATION DAY 4 Textbook Chapter 11.1, 11.3
 NOTES: STANDARD DEVIATION DAY 4 Textbook Chapter 11.1, 11.3 OBJECTIVE: Today you will learn about standard deviation and the normal curve! There are three ways that we can measure how spread out the data
DESCRIBE the effect of adding, subtracting, multiplying by, or dividing by a constant on the shape, center, and spread of a distribution of data.
 Today's Objectives: FIND and INTERPRET the standardized score (z-score) of an individual value within a distribution of data. DESCRIBE the effect of adding, subtracting, multiplying by, or dividing by
Descriptive Stats. Review
 Descriptive Stats Review Categorical Data The Area Principal Distorts the data possibly making it harder to compare categories Everything should add up to 100% When we add up all of our categorical data,
WorkSHEET 13.3 Univariate data II Name:
 WorkSHEET 13.3 Univariate data II Name: 1 The back-to-back stem-and-leaf plot shows the number of people (to the nearest thousand) that attend cricket matches in both Sydney and Melbourne during a season.
Effective Use of Box Charts
 Effective Use of Box Charts Purpose This tool provides guidelines and tips on how to effectively use box charts to communicate research findings. Format This tool provides guidance on box charts and their
Today s plan: Section 4.2: Normal Distribution
 1 Today s plan: Section 4.2: Normal Distribution 2 Characteristics of a data set: mean median standard deviation five-number summary 2 Characteristics of a data set: mean median standard deviation five-number
Fundamentals of Machine Learning for Predictive Data Analytics
 Fundamentals of Machine Learning for Predictive Data Analytics Appendix A Descriptive Statistics and Data Visualization for Machine learning John Kelleher and Brian Mac Namee and Aoife D Arcy john.d.kelleher@dit.ie
The pth percentile of a distribution is the value with p percent of the observations less than it.
 Describing Location in a Distribution (2.1) Measuring Position: Percentiles One way to describe the location of a value in a distribution is to tell what percent of observations are less than it. De#inition:
ACTIVITY: Drawing a Box-and-Whisker Plot. a. Order the data set and write it on a strip of grid paper with 24 equally spaced boxes.
 2. Box-and-Whisker Plots describe a data set? How can you use a box-and-whisker plot to ACTIVITY: Drawing a Box-and-Whisker Plot Work with a partner. The numbers of first cousins of the students in an
Diameter in cm. Bubble Number. Bubble Number Diameter in cm
 Bubble lab Data Sheet Blow bubbles and measure the diameter to the nearest whole centimeter. Record in the tables below. Try to blow different sized bubbles. Name: Bubble Number Diameter in cm Bubble Number
WHAT IS THE ESSENTIAL QUESTION?
 WHAT IS THE ESSENTIAL QUESTION? Essential Question Essential Question Essential Question Essential Question Essential Question Essential Question Essential Question Week 3, Lesson 1 1. Warm up 2. Notes
AP STATISTICS Name Chapter 6 Applications Period: Use summary statistics to answer the question. Solve the problem.
 AP STATISTICS Chapter 6 Applications Name Period: Use summary statistics to answer the question. 1) The speed vehicles travelled on a local highway was recorded for one month. The speeds ranged from 48
Scaled vs. Original Socre Mean = 77 Median = 77.1
 Have out... - notebook - colors - calculator (phone calc will work fine) Tests back as you come in! vocab example Tests Scaled vs. Original Socre Mean = 77 Median = 77.1 + Δ vocab example 1 2.1 Describing
How are the values related to each other? Are there values that are General Education Statistics
 How are the values related to each other? Are there values that are General Education Statistics far away from the others? Class Notes Measures of Position and Outliers: Z-scores, Percentiles, Quartiles,
Statistics. Wednesday, March 28, 2012
 Statistics Wednesday, March 28, 2012 Today's Agenda: 1. Collect HW #2: Activities 9 7 & 9 12 2. Go over HW #1: Activities 9 20 a f & 9 17 3. Practice calculating & s x 4. Activities 9 4, 9 5, 9 11, 9 13
Box-and-Whisker Plots
 7.2 Box-and-Whisker Plots Essential Question How can you use a box-and-whisker plot to describe a data set? Drawing a Box-and-Whisker Plot 3 9 23 62 3 Numbers of First Cousins 0 3 9 3 45 24 8 0 3 3 6 8
North Point - Advance Placement Statistics Summer Assignment
 North Point - Advance Placement Statistics This assignment is due during the first week of class. It is considered an exam grade, which that category is worth approximately 60% of your total grade. All
5.1. Data Displays Batter Up. My Notes ACTIVITY
 SUGGESTED LEARNING STRATEGIES: Activating Prior Knowledge, Marking the Text, Group Presentation, Interactive Word Wall Henry Hank Aaron and Harmon Killebrew are among the alltime leaders in home runs in
AP Stats Chapter 2 Notes
 AP Stats Chapter 2 Notes 2.1 Measures of Relative Standing & Density Curves What is a percentile? On a test, is a student s percentile the same as the percent correct? Example: Test Scores Suppose the
Analyzing Categorical Data & Displaying Quantitative Data Section 1.1 & 1.2
 Analyzing Categorical Data & Displaying Quantitative Data Section 1.1 & 1.2 Reference Text: The Practice of Statistics, Fourth Edition. Starnes, Yates, Moore Starter Problem Antoinette plays a lot of golf.
Descriptive Statistics Project Is there a home field advantage in major league baseball?
 Descriptive Statistics Project Is there a home field advantage in major league baseball? DUE at the start of class on date posted on website (in the first 5 minutes of class) There may be other due dates
Internet Technology Fundamentals. To use a passing score at the percentiles listed below:
 Internet Technology Fundamentals To use a passing score at the percentiles listed below: PASS candidates with this score or HIGHER: 2.90 High Scores Medium Scores Low Scores Percentile Rank Proficiency
Bivariate Data. Frequency Table Line Plot Box and Whisker Plot
 U04 D02 Univariate Data Frequency Table Line Plot Box and Whisker Plot Univariate Data Bivariate Data involving a single variable does not deal with causes or relationships the major purpose of univariate
9.3 Histograms and Box Plots
 Name Class Date 9.3 Histograms and Box Plots Essential Question: How can you interpret and compare data sets using data displays? Explore Understanding Histograms Resource Locker A histogram is a bar graph
Chapter 4 Displaying Quantitative Data
 Chapter Displaying Quantitative Data 17 Chapter Displaying Quantitative Data 1. Statistics in print. Answers will vary. 2. Not a histogram. Answers will vary. 3. In the news. Answers will vary.. In the
Descriptive Statistics. Dr. Tom Pierce Department of Psychology Radford University
 Descriptive Statistics Dr. Tom Pierce Department of Psychology Radford University Descriptive statistics comprise a collection of techniques for better understanding what the people in a group look like
Math 146 Statistics for the Health Sciences Additional Exercises on Chapter 2
 Math 146 Statistics for the Health Sciences Additional Exercises on Chapter 2 Student Name: Solve the problem. 1) Scott Tarnowski owns a pet grooming shop. His prices for grooming dogs are based on the
b) (2 pts.) Does the study show that drinking 4 or more cups of coffee a day caused the higher death rate?
 (2 pts.) Does the study show that drinking 4 or more cups of coffee a day caused the higher death rate?") Question 1 (10 pts) A study published in the August 15, 2017 issue of Mayo Clinic Proceedings tracked 44,000 people aged 20 to 87 for an average of about 16 years and found that those who drank 4 or more
Question 1 (10 pts) A study published in the August 15, 2017 issue of Mayo Clinic Proceedings tracked 44,000 people aged 20 to 87 for an average of about 16 years and found that those who drank 4 or more
Data Set 7: Bioerosion by Parrotfish Background volume of bites The question:
 Data Set 7: Bioerosion by Parrotfish Background Bioerosion of coral reefs results from animals taking bites out of the calcium-carbonate skeleton of the reef. Parrotfishes are major bioerosion agents,
STAT 155 Introductory Statistics. Lecture 2-2: Displaying Distributions with Graphs
 The UNIVERSITY of NORTH CAROLINA at CHAPEL HILL STAT 155 Introductory Statistics Lecture 2-2: Displaying Distributions with Graphs 8/31/06 Lecture 2-2 1 Recall Data: Individuals Variables Categorical variables
Frequency Distributions
 Descriptive Statistics Dr. Tom Pierce Department of Psychology Radford University Descriptive statistics comprise a collection of techniques for better understanding what the people in a group look like
Quantitative Literacy: Thinking Between the Lines
 Quantitative Literacy: Thinking Between the Lines Crauder, Noell, Evans, Johnson Chapter 6: Statistics 2013 W. H. Freeman and Company 1 Chapter 6: Statistics Lesson Plan Data summary and presentation:
How Fast Can You Throw?
 Name Date Period How Fast Can You Throw? Directions: Find a spot 40 feet from a wall and mark it with a piece of chalk. From that point, you will throw the ball 5 times with your right hand, and then five
Organizing Quantitative Data
 Organizing Quantitative Data MATH 130, Elements of Statistics I J. Robert Buchanan Department of Mathematics Fall 2018 Objectives At the end of this lesson we will be able to: organize discrete data in
Statistical Studies: Analyzing Data III.B Student Activity Sheet 6: Analyzing Graphical Displays
 The Phoenix Mercury of the Women s National Basketball League had 14 players on the roster for the 2008 season. The players and their average points per game (PPG) are shown below. Player Diana Taurasi
Statistical Studies: Analyzing Data III.B Student Activity Sheet 6: Analyzing Graphical Displays
 The Phoenix Mercury of the Women s National Basketball League had 14 players on the roster for the 2008 season. The players and their average points per game (PPG) are shown below. Player Diana Taurasi
Exploring Measures of Central Tendency (mean, median and mode) Exploring range as a measure of dispersion
 Exploring range as a measure of dispersion") Unit 5 Statistical Reasoning 1 5.1 Exploring Data Goals: Exploring Measures of Central Tendency (mean, median and mode) Exploring range as a measure of dispersion Data: A set of values. A set of data can
Unit 5 Statistical Reasoning 1 5.1 Exploring Data Goals: Exploring Measures of Central Tendency (mean, median and mode) Exploring range as a measure of dispersion Data: A set of values. A set of data can
March Madness Basketball Tournament
 March Madness Basketball Tournament Math Project COMMON Core Aligned Decimals, Fractions, Percents, Probability, Rates, Algebra, Word Problems, and more! To Use: -Print out all the worksheets. -Introduce
IGCSE - Cumulative Frequency Questions
 Dulwich College Shanghai IGCSE - Cumulative Frequency Questions 85 min 72 marks 1. Answer the whole of this question on one sheet of graph paper. The heights (h cm) of 270 students in a school are measured
1wsSMAM 319 Some Examples of Graphical Display of Data
 1wsSMAM 319 Some Examples of Graphical Display of Data 1. Lands End employs numerous persons to take phone orders. Computers on which orders are entered also automatically collect data on phone activity.
MATH-A SOL Remediation - A.10 Exam not valid for Paper Pencil Test Sessions
 MATH-A SOL Remediation - A.10 Exam not valid for Paper Pencil Test Sessions [Exam ID:17009A 1 The lower quartile of the box-and-whisker is represented by which number? A 18 B 21 C 27 D 19 2 What is the
CHAPTER 2 Modeling Distributions of Data
 CHAPTER 2 Modeling Distributions of Data 2.1 Describing Location in a Distribution The Practice of Statistics, 5th Edition Starnes, Tabor, Yates, Moore Bedford Freeman Worth Publishers 2.1 Reading Quiz
Statistics Class 3. Jan 30, 2012
 Statistics Class 3 Jan 30, 2012 Group Quiz 2 1. The Statistical Abstract of the United States includes the average per capita income for each of the 50 states. When those 50 values are added, then divided
DS5 The Normal Distribution. Write down all you can remember about the mean, median, mode, and standard deviation.
 DS5 The Normal Distribution Write down all you can remember about the mean, median, mode, and standard deviation. 1 DS5 The Normal Distribution Basic concepts: Describing and using Z scores calculated
Running head: DATA ANALYSIS AND INTERPRETATION 1
 Running head: DATA ANALYSIS AND INTERPRETATION 1 Data Analysis and Interpretation Final Project Vernon Tilly Jr. University of Central Oklahoma DATA ANALYSIS AND INTERPRETATION 2 Owners of the various
Math 227 Test 1 (Ch2 and 3) Name
 Name") Math 227 Test 1 (Ch2 and 3) Name 1) In a survey, 20 people were asked how many magazines they had purchased during the previous year. The results are shown below. Construct a histogram to represent the
Math 227 Test 1 (Ch2 and 3) Name 1) In a survey, 20 people were asked how many magazines they had purchased during the previous year. The results are shown below. Construct a histogram to represent the
Study Guide and Intervention
 Study Guide and Intervention Normal and Skewed Distributions A continuous probability distribution is represented by a curve. Types of Continuous Distributions Normal Positively Skewed Negatively Skewed
Statistical Analysis Project - How do you decide Who s the Best?
 Statistical Analysis Project - How do you decide Who s the Best? In order to choose the best shot put thrower to go to IASAS, the three candidates were asked to throw the shot put for a total of times
The Five Magic Numbers
 The Five Magic Numbers Objective: Students will review the five numbers needed to construct a box and whisker plot. Students will also answer questions using a box and whisker plot they created. Background
CHAPTER 2 Modeling Distributions of Data
 CHAPTER 2 Modeling Distributions of Data 2.1 Describing Location in a Distribution The Practice of Statistics, 5th Edition Starnes, Tabor, Yates, Moore Bedford Freeman Worth Publishers Describing Location
Assignment. To New Heights! Variance in Subjective and Random Samples. Use the table to answer Questions 2 through 7.
 Assignment Assignment for Lesson.1 Name Date To New Heights! Variance in Subjective and Random Samples 1. Suppose that you have collected data for the weights of all of the crates in a warehouse. a. Give
MEANS, MEDIANS and OUTLIERS
 ESSENTIAL MATHEMATICS 2 WEEK 3 NOTES AND EXERCISES MEANS, MEDIANS and OUTLIERS An outlier is a score much larger (or smaller) than others scores in the data set. Outliers can have a dramatic effect on
46 Chapter 8 Statistics: An Introduction
 46 Chapter 8 Statistics: An Introduction Activity 5 Continued Box 4 1. The median is 6. The mode is 5. The mean is about 7 (6.8). 2. The median and the mode were unchanged, but the mean increased significantly.
March Madness Basketball Tournament
 March Madness Basketball Tournament Math Project COMMON Core Aligned Decimals, Fractions, Percents, Probability, Rates, Algebra, Word Problems, and more! To Use: -Print out all the worksheets. -Introduce
NCAA March Madness Statistics 2018
 NCAA March Madness Statistics 2018 NAME HOUR 111-120 101-110 91-100 81-90 71-80 61-70 51-60 41-50 31-40 21-30 11-20 1-10 March Madness Activity 1 Directions: Choose a college basketball team in the March
Lesson 3 Pre-Visit Teams & Players by the Numbers
 Lesson 3 Pre-Visit Teams & Players by the Numbers Objective: Students will be able to: Review how to find the mean, median and mode of a data set. Calculate the standard deviation of a data set. Evaluate
BASEBALL SALARIES: DO YOU GET WHAT YOU PAY FOR? Comparing two or more distributions by parallel box plots
 Name BASEBALL SALARIES: DO YOU GET WHAT YOU PAY FOR? Comparing two or more distributions by parallel box plots The American League East had three excellent teams in the years 2008 2010. Here are the combined
0-13 Representing Data
 1. SURVEYS Alana surveyed several students to find the number of hours of sleep they typically get each night. The results are shown in the table. Make a bar graph of the data. Draw a histogram to represent
77.1 Apply the Pythagorean Theorem
 Right Triangles and Trigonometry 77.1 Apply the Pythagorean Theorem 7.2 Use the Converse of the Pythagorean Theorem 7.3 Use Similar Right Triangles 7.4 Special Right Triangles 7.5 Apply the Tangent Ratio
Histogram. Collection
 Density Curves and Normal Distributions Suppose we looked at an exam given to a large population of students. The histogram of this data appears like the graph to the left below. However, rather than show
All AQA Unit 1 Questions Higher
 All AQA Unit 1 Questions Higher 467 minutes 391 marks Page 1 of 46 Q1. A book has a front and back cover and 100 pages. The front and back cover are each 0.8 millimetres thick when measured to one decimal
That pesky golf game and the dreaded stats class
 That pesky golf game and the dreaded stats class Marsha Jance Indiana University East A case study that involves golf and statistics is presented. This case study focuses on descriptive statistics and
Mrs. Daniel- AP Stats Ch. 2 MC Practice
 Mrs. Daniel- AP Stats Ch. 2 MC Practice Name: 1. Jorge s score on Exam 1 in his statistics class was at the 64th percentile of the scores for all students. His score falls (a) between the minimum and the
MATH 118 Chapter 5 Sample Exam By: Maan Omran
 MATH 118 Chapter 5 Sample Exam By: Maan Omran Problem 1-4 refer to the following table: X P Product a 0.2 d 0 0.1 e 1 b 0.4 2 c? 5 0.2? E(X) = 1.7 1. The value of a in the above table is [A] 0.1 [B] 0.2
Statistical Measures
 Statistical Measures Question Paper 2 Level IGCSE Subject Maths Exam Board Edexcel Topic Handling Data Statistics Sub Topic Statistical Measures(Mean, Median, Mode) Booklet Question Paper 2 Time Allowed:
CHAPTER 1 ORGANIZATION OF DATA SETS
 CHAPTER 1 ORGANIZATION OF DATA SETS When you collect data, it comes to you in more or less a random fashion and unorganized. For example, what if you gave a 35 item test to a class of 50 students and collect
SUMMER Math STEM 7th Grade Summer Math Packet
 Name Date SUMMER Math STEM 7th Grade Summer Math Packet Simplify the expression. 3 7 1. 4(x + 3) 2. x 3. Use a formula to find the area of the figure. 4. Tickets to a basketball game cost $4 for adults
Lesson Z-Scores and Normal Distributions
 STATWAY STUDENT HANDOUT STUDENT NAME DATE INTRODUCTION 1 A large company is hiring one employee for a top position. Your team will recommend who gets the job. After completing many interviews, reference
Warm-Up: Create a Boxplot.
 Warm-Up: Create a Boxplot. 2 Warm - UP 1. 2. Find the mean. 3. Find the standard deviation for the set { 54, 59, 35, 41, 22} Warm - UP How many hours do you spend watching TV or surfing the net each
Box-and-Whisker Plots
 Lesson 75 Objectives Calculate quartile values for a data set Create a box-and-whisker plot Quartiles and Box-and-Whisker Plots Richard recorded the number of people that attended his team s minor league
September Population analysis of the Finnish Spitz breed
 Population analysis of the Finnish Spitz breed Genetic analysis of the Kennel Club pedigree records of the UK Finnish Spitz population has been carried out with the aim of estimating the rate of loss of
north carolina End of Grade 7EOG Mathematics Practice and Mastery EOG EOG EOG EOG EOG EOG EOG EOG EOG North Carolina
 north carolina End of Grade Mathematics North Carolina Practice and Mastery 7 FOR THE STUDENT North Carolina End-of-Grade Mathematics Practice and Mastery is a mathematics review program. It can help you
September Population analysis of the Portuguese Water Dog breed
 Population analysis of the Portuguese Water Dog breed Genetic analysis of the Kennel Club pedigree records of the UK Portuguese Water Dog population has been carried out with the aim of estimating the