Statistics Class 3. Jan 30, 2012
|
|
|
- Elijah Parks
- 5 years ago
- Views:
Transcription
1 Statistics Class 3 Jan 30, 2012
2 Group Quiz 2 1. The Statistical Abstract of the United States includes the average per capita income for each of the 50 states. When those 50 values are added, then divided by 50, the result is $29, Is $ 29, the average per capita income for all individuals in the United States? Why or why not? 2. A classroom consists of 36 students seated in six different rows, with six students in each row. The instructor rolls a die to determine a row, then rolls the die again to select a particular student in the row. This process is reapeated until a sample of 6 students is obtained. Does this sampling plan result in a ranbom sample? Simple random Sample? Explain.
3 Frequency Distributions A frequency Distribution shows how a data set is partitioned among all of several categories (or classes) by listing all of the categories along with the number of data values in each of the categories. Lower class limits are the smallest numbers that can belong to the different classes. Upper class limits are the largest numbers that can belong to the different classes. Class boundaries are the numbers used to separate the classes, but without the gaps created by class limits
4 Frequency Distributions Class midpoints are the values in the middle of the classes. Class width is the difference between two consecutive lower class limits.
5 Procedure for constructing a frequency Distribution. 1. Determine the number of classes. 2. Calculate the class width class width. class width= (max data value-min data value)/number of classes. 3. Choose either the min data value or convenient value below the min data value as the first lower class limit. 4. Using the first lower class limit and class width, list the other lower class limits. Do this vertically and add in the upper class limits 5. Tally up the data values in each class.
6 Example 1 Frequency table by hand
7 Example 1 Frequency table by hand Lets Have 7 classes. 2. Find the width.
8 Example 1 Frequency table by hand Lets Have 7 classes. 2. Find the width = 64 64/7=9.14
9 List the min data value or convenient data value
10 60 List the lower values
11 60 70 List the lower values
12 Add in the upper limit values
13 Tally Ho!
14
15 Tally Ho!
16
17 Tally Ho!
18 Pulse Rate Freq Make it look nice
19 Relative Frequency In a relative frequency the frequency is replaced with a relative frequency (proportion) or a percentage frequency (percent). Relative frequency=class frequency/sum of all frequencies Percentage freq=(class freq/sum of all freq)*100%
20 Pulse Rate Relative Frequency / / / / / / /40 Change into a relative frequency
21 Pulse Rate Relative Frequency /40= /40= /40= /40= /40= /40= /40=0.025 Change into a relative frequency
22 Pulse Rate Relative Frequency Change into a relative frequency
23 Pulse Rate Freq Change into cumulative frequency
24 Pulse Rate Cumulative Freq Change into cumulative frequency
25 Pulse Rate Cumulative Freq 69 or less or less 12+14=26 89 or less =37 99 or less = or less = or less = or less =40 Change into cumulative frequency
26 Pulse Rate Cumulative Freq
27 Frequency Distribution Do # 17 on page 54
28 Now go to my website and use the data provided to use open office to construct a Frequency Table

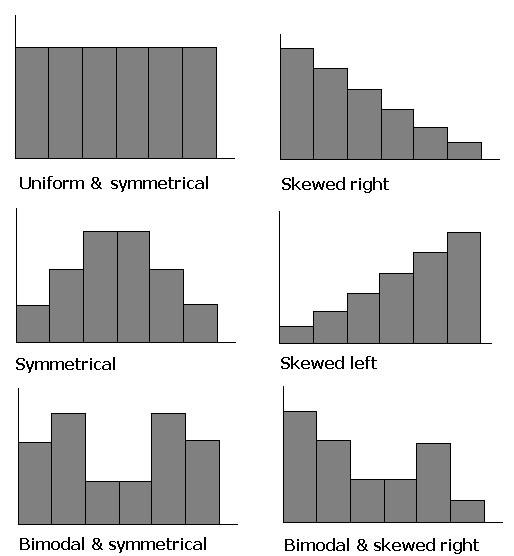
29 Histograms A histogram is a graph consisting of bars of equal width drawn adjacent to each other (without gaps). The Horizontal scale represents classes of quantitative data value and the vertical scale represents frequencies. The heights of the bars correspond to the frequency values.

30 Relative Frequency Histogram A relative frequency histogram is the same as a histogram with relative frequencies instead of frequencies.

31 This data because of its shape is said to have a normal distribution.
32
33 Measure of center A measure of center is a value at the center or middle of a data set. The mean of a set of data is the measure of center found by adding the data values and dividing the total by the number of data values. =average(data)
34 Calculate the mean of some data
35 Calculate the mean of some data x= 3052/40=76.3
36 Median The median of a data set is the measure of center that is the middle value when the data values are arranged in increasing (decreasing) order. So take order it
37 Median Select the middle values Even number of data values average the middle two. (72+76)/2=148/2=74 open office: median(data)
38 Mode The mode of a data set is the data value that occurs with greatest frequency. When two data values occur with the same greatest frequency, each one is a mode and the data set is bimodal. No repeated data value, then there is no mode. Find the mode of our previous data
39 Mode The mode of a data set is the data value that occurs with greatest frequency. When two data values occur with the same greatest frequency, each one is a mode and the data set is bimodal. No repeated data value, then there is no mode. Find the mode of our previous data Mode is 72, in open office use mode(data).
40 Midrange The midrange of a data set is the value midway between the maximum and minimum values midrange=(maximum data value + minimum data value)/2 From our previous data set the max was 124 and the min was 60 so... midrange= ( )/2=62.
41 Mean from a frequency distribution
42 Pulse Rate Freq Total 40
43 Pulse Rate Freq Midpoint Total 40
44 Pulse Rate Freq f Midpoint x x*f Total 40
45 Pulse Rate Freq f Midpoint x x*f Total
46 Pulse Rate Freq f Midpoint x x*f Totals Mean 3070/
47 Homework 2-2: 1, 3, 17, : 3, 9, : 1, 3, 7, 17, 29.
Lesson 2.1 Frequency Tables and Graphs Notes Stats Page 1 of 5
 Stats Page 1 of 5 Frequency Table: partitions data into classes or intervals and shows how many data values are in each class. The classes or intervals are constructed so that each data value falls exactly
STATISTICS ELEMENTARY MARIO F. TRIOLA. Descriptive Statistics EIGHTH EDITION
 ELEMENTARY STATISTICS Chapter 2 Descriptive Statistics MARIO F. TRIOLA EIGHTH EDITION 1 2-1 Overview Chapter 2 Descriptive Statistics 2-2 Summarizing Data with Frequency Tables 2-3 Pictures of Data 2-4
Organizing Quantitative Data
 Organizing Quantitative Data MATH 130, Elements of Statistics I J. Robert Buchanan Department of Mathematics Fall 2018 Objectives At the end of this lesson we will be able to: organize discrete data in
1. The data below gives the eye colors of 20 students in a Statistics class. Make a frequency table for the data.
 1. The data below gives the eye colors of 20 students in a Statistics class. Make a frequency table for the data. Green Blue Brown Blue Blue Brown Blue Blue Blue Green Blue Brown Blue Brown Brown Blue
Chapter 2 - Frequency Distributions and Graphs
 - Frequency Distributions and Graphs 1. Which of the following does not need to be done when constructing a frequency distribution? A) select the number of classes desired B) find the range C) make the
Full file at
 Chapter 2 1. Describe the distribution. survival times of persons diagnosed with terminal lymphoma A) approximately normal B) skewed left C) skewed right D) roughly uniform Ans: C Difficulty: low 2. Without
North Point - Advance Placement Statistics Summer Assignment
 North Point - Advance Placement Statistics This assignment is due during the first week of class. It is considered an exam grade, which that category is worth approximately 60% of your total grade. All
CHAPTER 1 Exploring Data
 CHAPTER 1 Exploring Data 1.2 Displaying Quantitative Data with Graphs The Practice of Statistics, 5th Edition Starnes, Tabor, Yates, Moore Bedford Freeman Worth Publishers Displaying Quantitative Data
Lab 5: Descriptive Statistics
 Page 1 Technical Math II Lab 5: Descriptive Stats Lab 5: Descriptive Statistics Purpose: To gain experience in the descriptive statistical analysis of a large (173 scores) data set. You should do most
Fun with M&M s. By: Cassandra Gucciardo. Sorting
 Fun with M&M s Sorting Fractions Objectives: The students will be able to review the measures of central tendency by determining mean, median, mode and range. They will review their understanding of estimation,
STAT 155 Introductory Statistics. Lecture 2-2: Displaying Distributions with Graphs
 The UNIVERSITY of NORTH CAROLINA at CHAPEL HILL STAT 155 Introductory Statistics Lecture 2-2: Displaying Distributions with Graphs 8/31/06 Lecture 2-2 1 Recall Data: Individuals Variables Categorical variables
(c) The hospital decided to collect the data from the first 50 patients admitted on July 4, 2010.
 The hospital decided to collect the data from the first 50 patients admitted on July 4, 2010.") Math 155, Test 1, 18 October 2011 Name: Instructions. This is a closed-book test. You may use a calculator (but not a cell phone). Make sure all cell-phones are put away and that the ringer is off. Show
Math 155, Test 1, 18 October 2011 Name: Instructions. This is a closed-book test. You may use a calculator (but not a cell phone). Make sure all cell-phones are put away and that the ringer is off. Show
Unit 3 - Data. Grab a new packet from the chrome book cart. Unit 3 Day 1 PLUS Box and Whisker Plots.notebook September 28, /28 9/29 9/30?
 Unit 3 - Data Grab a new packet from the chrome book cart 9/28 9/29 9/30? 10/3 10/4 10/5 10/6 10/7-10/10 10/11 10/12 10/13 Practice ACT #1 Lesson 1: Box and Whisker Plots I can find the 5 number summary
STT 315 Section /19/2014
 Name: PID: A STT 315 Section 101 05/19/2014 Quiz 1A 50 minutes 1. A survey by an electric company contains questions on the following: Age of household head, Gender of household head and use of electric
Analyzing Categorical Data & Displaying Quantitative Data Section 1.1 & 1.2
 Analyzing Categorical Data & Displaying Quantitative Data Section 1.1 & 1.2 Reference Text: The Practice of Statistics, Fourth Edition. Starnes, Yates, Moore Starter Problem Antoinette plays a lot of golf.
Chapter 2: Modeling Distributions of Data
 Chapter 2: Modeling Distributions of Data Section 2.1 The Practice of Statistics, 4 th edition - For AP* STARNES, YATES, MOORE Chapter 2 Modeling Distributions of Data 2.1 2.2 Normal Distributions Section
46 Chapter 8 Statistics: An Introduction
 46 Chapter 8 Statistics: An Introduction Activity 5 Continued Box 4 1. The median is 6. The mode is 5. The mean is about 7 (6.8). 2. The median and the mode were unchanged, but the mean increased significantly.
5.1. Data Displays Batter Up. My Notes ACTIVITY
 SUGGESTED LEARNING STRATEGIES: Activating Prior Knowledge, Marking the Text, Group Presentation, Interactive Word Wall Henry Hank Aaron and Harmon Killebrew are among the alltime leaders in home runs in
Descriptive Statistics
 Descriptive Statistics Descriptive Statistics vs Inferential Statistics Describing a sample Making inferences to a larger population Data = Information but too much information. How do we summarize data?
Internet Technology Fundamentals. To use a passing score at the percentiles listed below:
 Internet Technology Fundamentals To use a passing score at the percentiles listed below: PASS candidates with this score or HIGHER: 2.90 High Scores Medium Scores Low Scores Percentile Rank Proficiency
Warm-Up: Create a Boxplot.
 Warm-Up: Create a Boxplot. 2 Warm - UP 1. 2. Find the mean. 3. Find the standard deviation for the set { 54, 59, 35, 41, 22} Warm - UP How many hours do you spend watching TV or surfing the net each
Exploring Measures of Central Tendency (mean, median and mode) Exploring range as a measure of dispersion
 Exploring range as a measure of dispersion") Unit 5 Statistical Reasoning 1 5.1 Exploring Data Goals: Exploring Measures of Central Tendency (mean, median and mode) Exploring range as a measure of dispersion Data: A set of values. A set of data can
Unit 5 Statistical Reasoning 1 5.1 Exploring Data Goals: Exploring Measures of Central Tendency (mean, median and mode) Exploring range as a measure of dispersion Data: A set of values. A set of data can
9.3 Histograms and Box Plots
 Name Class Date 9.3 Histograms and Box Plots Essential Question: How can you interpret and compare data sets using data displays? Explore Understanding Histograms Resource Locker A histogram is a bar graph
Age of Fans
 Measures of Central Tendency SUGGESTED LEARNING STRATEGIES: Activating Prior Knowledge, Interactive Word Wall, Marking the Text, Summarize/Paraphrase/Retell, Think/Pair/Share Matthew is a student reporter
% per year Age (years)
") Stat 1001 Winter 1998 Geyer Homework 2 Problem 3.1 66 inches and 72 inches. Problem 3.2 % per year 0.0 0.5 1.0 1.5 0 20 40 60 80 Age (years) (a) Age 1. (b) More 31-year olds (c) More people age 35{44,
Stat 1001 Winter 1998 Geyer Homework 2 Problem 3.1 66 inches and 72 inches. Problem 3.2 % per year 0.0 0.5 1.0 1.5 0 20 40 60 80 Age (years) (a) Age 1. (b) More 31-year olds (c) More people age 35{44,
Chapter 4 Displaying Quantitative Data
 Chapter Displaying Quantitative Data 17 Chapter Displaying Quantitative Data 1. Statistics in print. Answers will vary. 2. Not a histogram. Answers will vary. 3. In the news. Answers will vary.. In the
CHAPTER 2 Modeling Distributions of Data
 CHAPTER 2 Modeling Distributions of Data 2.1 Describing Location in a Distribution The Practice of Statistics, 5th Edition Starnes, Tabor, Yates, Moore Bedford Freeman Worth Publishers Describing Location
Year 10 Term 2 Homework
 Yimin Math Centre Year 10 Term 2 Homework Student Name: Grade: Date: Score: Table of contents 6 Year 10 Term 2 Week 6 Homework 1 6.1 Data analysis and evaluation............................... 1 6.1.1
IHS AP Statistics Chapter 2 Modeling Distributions of Data MP1
 IHS AP Statistics Chapter 2 Modeling Distributions of Data MP1 Monday Tuesday Wednesday Thursday Friday August 22 A Day 23 B Day 24 A Day 25 B Day 26 A Day Ch1 Exploring Data Class Introduction Getting
Descriptive Stats. Review
 Descriptive Stats Review Categorical Data The Area Principal Distorts the data possibly making it harder to compare categories Everything should add up to 100% When we add up all of our categorical data,
0-13 Representing Data
 1. SURVEYS Alana surveyed several students to find the number of hours of sleep they typically get each night. The results are shown in the table. Make a bar graph of the data. Draw a histogram to represent
Descriptive Statistics Project Is there a home field advantage in major league baseball?
 Descriptive Statistics Project Is there a home field advantage in major league baseball? DUE at the start of class on date posted on website (in the first 5 minutes of class) There may be other due dates
Chapter 2: Visual Description of Data
 Chapter 2: Visual Description of Data El Mechry El Koudous Fordham University January 24, 2018 Meshry (Fordham University) Chapter 2 January 24, 2018 1 / 35 Introduction In this chapter we will cover:
IGCSE - Cumulative Frequency Questions
 Dulwich College Shanghai IGCSE - Cumulative Frequency Questions 85 min 72 marks 1. Answer the whole of this question on one sheet of graph paper. The heights (h cm) of 270 students in a school are measured
Statistical Measures
 Statistical Measures Question Paper 2 Level IGCSE Subject Maths Exam Board Edexcel Topic Handling Data Statistics Sub Topic Statistical Measures(Mean, Median, Mode) Booklet Question Paper 2 Time Allowed:
STAT 155 Introductory Statistics. Lecture 2: Displaying Distributions with Graphs
 The UNIVERSITY of NORTH CAROLINA at CHAPEL HILL STAT 155 Introductory Statistics Lecture 2: Displaying Distributions with Graphs 8/29/06 Lecture 2-1 1 Recall Statistics is the science of data. Collecting
Today s plan: Section 4.2: Normal Distribution
 1 Today s plan: Section 4.2: Normal Distribution 2 Characteristics of a data set: mean median standard deviation five-number summary 2 Characteristics of a data set: mean median standard deviation five-number
CHAPTER 1 ORGANIZATION OF DATA SETS
 CHAPTER 1 ORGANIZATION OF DATA SETS When you collect data, it comes to you in more or less a random fashion and unorganized. For example, what if you gave a 35 item test to a class of 50 students and collect
The pth percentile of a distribution is the value with p percent of the observations less than it.
 Describing Location in a Distribution (2.1) Measuring Position: Percentiles One way to describe the location of a value in a distribution is to tell what percent of observations are less than it. De#inition:
All AQA Unit 1 Questions Higher
 All AQA Unit 1 Questions Higher 467 minutes 391 marks Page 1 of 46 Q1. A book has a front and back cover and 100 pages. The front and back cover are each 0.8 millimetres thick when measured to one decimal
Bivariate Data. Frequency Table Line Plot Box and Whisker Plot
 U04 D02 Univariate Data Frequency Table Line Plot Box and Whisker Plot Univariate Data Bivariate Data involving a single variable does not deal with causes or relationships the major purpose of univariate
The Five Magic Numbers
 The Five Magic Numbers Objective: Students will review the five numbers needed to construct a box and whisker plot. Students will also answer questions using a box and whisker plot they created. Background
Scaled vs. Original Socre Mean = 77 Median = 77.1
 Have out... - notebook - colors - calculator (phone calc will work fine) Tests back as you come in! vocab example Tests Scaled vs. Original Socre Mean = 77 Median = 77.1 + Δ vocab example 1 2.1 Describing
1 Measures of Center. 1.1 The Mean. 1.2 The Median
 1 Measures of Center In statistics we frequently need to perform operations on entire sets of data. One such operation is to add all values in a particular set together. We use a capital Greek sigma,,
4-3 Rate of Change and Slope. Warm Up Lesson Presentation. Lesson Quiz
 4-3 Rate of Change and Slope Warm Up Lesson Presentation Lesson Quiz Holt Algebra McDougal 1 Algebra 1 Warm Up 1. Find the x- and y-intercepts of 2x 5y = 20. x-int.: 10; y-int.: 4 Describe the correlation
"Full Coverage": Histograms
 "Full Coverage": Histograms This worksheet is designed to cover one question of each type seen in past papers, for each GCSE Higher Tier topic. This worksheet was automatically generated by the DrFrostMaths
CHAPTER 2 Modeling Distributions of Data
 CHAPTER 2 Modeling Distributions of Data 2.1 Describing Location in a Distribution The Practice of Statistics, 5th Edition Starnes, Tabor, Yates, Moore Bedford Freeman Worth Publishers 2.1 Reading Quiz
Math 146 Statistics for the Health Sciences Additional Exercises on Chapter 2
 Math 146 Statistics for the Health Sciences Additional Exercises on Chapter 2 Student Name: Solve the problem. 1) Scott Tarnowski owns a pet grooming shop. His prices for grooming dogs are based on the
Reminders. Homework scores will be up by tomorrow morning. Please me and the TAs with any grading questions by tomorrow at 5pm
 Reminders Homework scores will be up by tomorrow morning Please email me and the TAs with any grading questions by tomorrow at 5pm 1 Chapter 12: Describing Distributions with Numbers Aaron Zimmerman STAT
Practice Test Unit 6B/11A/11B: Probability and Logic
 Note to CCSD Pre-Algebra Teachers: 3 rd quarter benchmarks begin with the last 2 sections of Chapter 6, and then address Chapter 11 benchmarks; logic concepts are also included. We have combined probability
Grade 6 Math Circles Fall October 7/8 Statistics
 Faculty of Mathematics Waterloo, Ontario Centre for Education in Mathematics and Computing Grade 6 Math Circles Fall 2014 - October 7/8 Statistics Statistics (or Stats) is a branch of math that deals with
Practice Test Unit 06B 11A: Probability, Permutations and Combinations. Practice Test Unit 11B: Data Analysis
 Note to CCSD HS Pre-Algebra Teachers: 3 rd quarter benchmarks begin with the last 2 sections of Chapter 6 (probability, which we will refer to as 6B), and then address Chapter 11 benchmarks (which will
How long would it take to escape from the pendulum?
 Week 2, Lesson 1 1. Warm up 2. ICA The Pit & the Pendulum 3. ICA Discussion?s How long would it take to escape from the pendulum? Essential Question Essential Question Essential Question Essential Question
4-3 Rate of Change and Slope. Warm Up. 1. Find the x- and y-intercepts of 2x 5y = 20. Describe the correlation shown by the scatter plot. 2.
 Warm Up 1. Find the x- and y-intercepts of 2x 5y = 20. Describe the correlation shown by the scatter plot. 2. Objectives Find rates of change and slopes. Relate a constant rate of change to the slope of
Diameter in cm. Bubble Number. Bubble Number Diameter in cm
 Bubble lab Data Sheet Blow bubbles and measure the diameter to the nearest whole centimeter. Record in the tables below. Try to blow different sized bubbles. Name: Bubble Number Diameter in cm Bubble Number
CHAPTER 2 Modeling Distributions of Data
 CHAPTER 2 Modeling Distributions of Data 2.2 Density Curves and Normal Distributions The Practice of Statistics, 5th Edition Starnes, Tabor, Yates, Moore Bedford Freeman Worth Publishers Density Curves
Computational Analysis Task Casio ClassPad
 Computational Analysis Task Casio ClassPad The organisers of a surf contest examine two Victorian beaches as proposed venues for the contest. Each day, for two weeks, the organisers record the height of
Lesson 3 Pre-Visit Teams & Players by the Numbers
 Lesson 3 Pre-Visit Teams & Players by the Numbers Objective: Students will be able to: Review how to find the mean, median and mode of a data set. Calculate the standard deviation of a data set. Evaluate
DATA HANDLING EXAM QUESTIONS
 DATA HANDLING EXAM QUESTIONS MARK SCHEME 1. (a) Reason 1 B1 Makes some mention of bias either directly or making reference to an insufficient or biased range of responses (b) Reason 1 B1 (a) an insufficient
Topic No January 2000 Manual on Uniform Traffic Studies Revised July Chapter 8 GAP STUDY
 Chapter 8 8.1 PURPOSE GAP STUDY (1) The Gap Study is used to determine the size and the number of gaps in the vehicular traffic stream for unsignalized intersections and access points, pedestrian studies,
If a fair coin is tossed 10 times, what will we see? 24.61% 20.51% 20.51% 11.72% 11.72% 4.39% 4.39% 0.98% 0.98% 0.098% 0.098%
 Coin tosses If a fair coin is tossed 10 times, what will we see? 30% 25% 24.61% 20% 15% 10% Probability 20.51% 20.51% 11.72% 11.72% 5% 4.39% 4.39% 0.98% 0.98% 0.098% 0.098% 0 1 2 3 4 5 6 7 8 9 10 Number
How to use the Turnip Graph Engine in STATA
 How to use the Turnip Graph Engine in STATA WHAT YOU HAVE TO DO: 1. Download turnip.ado and put it in an ado file folder 2. Now whenever you open STATA you can run turnip as you would any.ado file: for
Solutionbank S1 Edexcel AS and A Level Modular Mathematics
 Page 1 of 1 Exercise A, Question 1 A group of thirty college students was asked how many DVDs they had in their collection. The results are as follows. 12 25 34 17 12 18 29 34 45 6 15 9 25 23 29 22 20
March Madness Basketball Tournament
 March Madness Basketball Tournament Math Project COMMON Core Aligned Decimals, Fractions, Percents, Probability, Rates, Algebra, Word Problems, and more! To Use: -Print out all the worksheets. -Introduce
Unit 6 Day 2 Notes Central Tendency from a Histogram; Box Plots
 AFM Unit 6 Day 2 Notes Central Tendency from a Histogram; Box Plots Name Date To find the mean, median and mode from a histogram, you first need to know how many data points were used. Use the frequency
LaDawn Bisson Measures of Central Tendency
 LaDawn Bisson 2014 Measures of Central Tendency LaDawn Bisson 2014 Measures of central tendency: a measure used to describe data; the mean, median, and mode are measures of central tendency Mean: the sum
STAT 625: 2000 Olympic Diving Exploration
 Corey S Brier, Department of Statistics, Yale University 1 STAT 625: 2000 Olympic Diving Exploration Corey S Brier Yale University Abstract This document contains a preliminary investigation of data from
True class interval. frequency total. frequency
 20 1 16 14 12 10 6 4 2 0 frequency 44.5 54.5 64.5 74.5 4.5 94.5 104.5 49.5 59.5 69.5 79.5 9.5 99.5 True class interval True class interval 49.5-59.5 59.5-69.5 69.5-79.5 79.5-9.5 9.5-99.5 total frequency
March Madness Basketball Tournament
 March Madness Basketball Tournament Math Project COMMON Core Aligned Decimals, Fractions, Percents, Probability, Rates, Algebra, Word Problems, and more! To Use: -Print out all the worksheets. -Introduce
ROUND TOSS-UP: What is the square root of one million? (1000) (10 points) BONUS: How many zeros are at the end of ?
 (10 points) BONUS: How many zeros are at the end of ?") ROUND 1 1. TOSS-UP: What is 24% of 50? (12) (10 points) BONUS: A clothing store is having a 60% off sale on its dresses. Brandi has a coupon that lets her take 20% off of the sale price. If she pays $24
ROUND 1 1. TOSS-UP: What is 24% of 50? (12) (10 points) BONUS: A clothing store is having a 60% off sale on its dresses. Brandi has a coupon that lets her take 20% off of the sale price. If she pays $24
Quantitative Literacy: Thinking Between the Lines
 Quantitative Literacy: Thinking Between the Lines Crauder, Noell, Evans, Johnson Chapter 6: Statistics 2013 W. H. Freeman and Company 1 Chapter 6: Statistics Lesson Plan Data summary and presentation:
Statistical Studies: Analyzing Data III.B Student Activity Sheet 6: Analyzing Graphical Displays
 The Phoenix Mercury of the Women s National Basketball League had 14 players on the roster for the 2008 season. The players and their average points per game (PPG) are shown below. Player Diana Taurasi
Statistical Studies: Analyzing Data III.B Student Activity Sheet 6: Analyzing Graphical Displays
 The Phoenix Mercury of the Women s National Basketball League had 14 players on the roster for the 2008 season. The players and their average points per game (PPG) are shown below. Player Diana Taurasi
SUMMER Math STEM 7th Grade Summer Math Packet
 Name Date SUMMER Math STEM 7th Grade Summer Math Packet Simplify the expression. 3 7 1. 4(x + 3) 2. x 3. Use a formula to find the area of the figure. 4. Tickets to a basketball game cost $4 for adults
Mrs. Daniel- AP Stats Ch. 2 MC Practice
 Mrs. Daniel- AP Stats Ch. 2 MC Practice Name: 1. Jorge s score on Exam 1 in his statistics class was at the 64th percentile of the scores for all students. His score falls (a) between the minimum and the
Math 227 Test 1 (Ch2 and 3) Name
 Name") Math 227 Test 1 (Ch2 and 3) Name 1) In a survey, 20 people were asked how many magazines they had purchased during the previous year. The results are shown below. Construct a histogram to represent the
Math 227 Test 1 (Ch2 and 3) Name 1) In a survey, 20 people were asked how many magazines they had purchased during the previous year. The results are shown below. Construct a histogram to represent the
Running head: DATA ANALYSIS AND INTERPRETATION 1
 Running head: DATA ANALYSIS AND INTERPRETATION 1 Data Analysis and Interpretation Final Project Vernon Tilly Jr. University of Central Oklahoma DATA ANALYSIS AND INTERPRETATION 2 Owners of the various
That pesky golf game and the dreaded stats class
 That pesky golf game and the dreaded stats class Marsha Jance Indiana University East A case study that involves golf and statistics is presented. This case study focuses on descriptive statistics and
Figure 39. Yearly Trend in Death Rates for Drowning: NSW, Year
 10.0 DROWNING 10.1 Deaths due to Drowning: The drowning death rate showed a statistically significant decrease between 199 and 1999 (Figure 39). Between 199 and 1999, 46 people died from drowning, at a
Highway & Transportation (I) ECIV 4333 Chapter (4): Traffic Engineering Studies. Spot Speed
 ECIV 4333 Chapter (4): Traffic Engineering Studies. Spot Speed") Introduction Spot Speed Speed is an important measure of the quality of travel and safety of road network. Speed by definition is the rate of movement of vehicle in distance per unit time. A typical unit
Introduction Spot Speed Speed is an important measure of the quality of travel and safety of road network. Speed by definition is the rate of movement of vehicle in distance per unit time. A typical unit
WHAT IS THE ESSENTIAL QUESTION?
 WHAT IS THE ESSENTIAL QUESTION? Essential Question Essential Question Essential Question Essential Question Essential Question Essential Question Essential Question Week 3, Lesson 1 1. Warm up 2. Notes
Section 3.1: Measures of Center
 Section.1: Measures of Center In statistics we frequently need to perform operations on entire sets of data. One such operation is to add all values in a particular set together. We use a capital Greek
Chapter 2 Displaying and Describing Categorical Data
 Chapter 2 Displaying and Describing Categorical Data Graphs for Categorical Variables Our concern will be two types of visual representations. Graphs for Categorical Variables Our concern will be two types
Waves Multiple Choice
 Waves Multiple Choice PSI Physics Name: 1. The distance traveled by a wave in one period is called? A. Frequency B. Period C. Speed of wave D. Wavelength E. Amplitude 2. Which of the following is the speed
Regents Style Box & Whisker Plot Problems
 Name: ate: 1. Robin collected data on the number of hours she watched television on Sunday through Thursday nights for a period of 3 weeks. The data are shown in the table below. Sun Mon Tues Wed Thurs
Find Mean, Median, Mode, and Outlier
 SS SDA G6.S.5.c 2 dentify Giving the mode(s) quantitative for sets measures of categorical of center (median data, and/or the mean) and variability (interquartile mode(s), range median, and/or and mean
DIFFERENCES BETWEEN THE WINNING AND DEFEATED FEMALE HANDBALL TEAMS IN RELATION TO THE TYPE AND DURATION OF ATTACKS
 DIFFERENCES BETWEEN THE WINNING AND DEFEATED FEMALE HANDBALL TEAMS IN RELATION TO THE TYPE AND DURATION OF ATTACKS Katarina OHNJEC, Dinko VULETA, Lidija BOJIĆ-ĆAĆIĆ Faculty of Kinesiology, University of
Acknowledgement: Author is indebted to Dr. Jennifer Kaplan, Dr. Parthanil Roy and Dr Ashoke Sinha for allowing him to use/edit many of their slides.
 Acknowledgement: Author is indebted to Dr. Jennifer Kaplan, Dr. Parthanil Roy and Dr Ashoke Sinha for allowing him to use/edit many of their slides. Topic for this lecture 0Today s lecture s materials
Constructing and Interpreting Two-Way Frequency Tables
 ACTIVITY 5.1 Constructing and Interpreting Two-Way Frequency Tables Ms. Carter is an athletic coordinator at Liberty Middle School. She is developing an after-school sports program. Ms. Carter has a budget
Cambridge International Examinations Cambridge International General Certificate of Secondary Education
 Cambridge International Examinations Cambridge International General Certificate of Secondary Education *6519612675* MATHEMATICS 0580/32 Paper 3 (Core) February/March 2018 Candidates answer on the Question
!!!!!!!!!!!!! One Score All or All Score One? Points Scored Inequality and NBA Team Performance Patryk Perkowski Fall 2013 Professor Ryan Edwards!
 One Score All or All Score One? Points Scored Inequality and NBA Team Performance Patryk Perkowski Fall 2013 Professor Ryan Edwards "#$%&'(#$)**$'($"#$%&'(#$)**+$,'-"./$%&'(#0$1"#234*-.5$4"0$67)$,#(8'(94"&#$:
Ch. 8 Review - Analyzing Data and Graphs
 How to find the Median Value It's the middle number in a sorted list. To find the Median, place the numbers you are given in value order and find the middle number. Look at these numbers: 3, 13, 7, 5,
Chapter 2 - Displaying and Describing Categorical Data
 Chapter 2 - Displaying and Describing Categorical Data August 28, 2014 Exploratory Data Analysis - The use of graphs or numerical summaries (values) to describe the variables in a data set and the relation
Chapter 3 - Displaying and Describing Categorical Data
 Chapter 3 - Displaying and Describing Categorical Data August 25, 2010 Exploratory Data Analysis - The use of graphs or numerical summaries (values) to describe the variables in a data set and the relation
Chapter 0 Pretest = 4
 Determine whether you need an estimate or an exact answer. Then solve. 1. SHOPPING Addison paid $1.29 for gum and $0.89 for a package of notebook paper. She gave the cashier a $5 bill. If the tax was $0.14,
The Field of Play. Only the lines indicated in Law 1 are to be marked on the field of play.
 01 Law The Field of Play 1. Field surface The field of play must be a wholly natural or, if competition rules permit, a wholly artificial playing surface except where competition rules permit an integrated
Waves Practice Problems AP Physics In a wave, the distance traveled by a wave during one period is called:
 Waves Practice Problems AP Physics 1 Name 1. In a wave, the distance traveled by a wave during one period is called: (A) Amplitude (B) Frequency (C) Wavelength (D) Displacement 2. A stretched wire resonates
1ACE Exercise 4. Name Date Class
 1ACE Exercise 4 Investigation 1 4. A farm wants to add a small rectangular petting zoo for the public. They have a fixed amount of fencing to use for the zoo. This graph shows the lengths and areas of
Chapter 11 Waves. Waves transport energy without transporting matter. The intensity is the average power per unit area. It is measured in W/m 2.
 Energy can be transported by particles or waves: Chapter 11 Waves A wave is characterized as some sort of disturbance that travels away from a source. The key difference between particles and waves is
Histogram. Collection
 Density Curves and Normal Distributions Suppose we looked at an exam given to a large population of students. The histogram of this data appears like the graph to the left below. However, rather than show