At each type of conflict location, the risk is affected by certain parameters:
|
|
|
- Lindsey Neal
- 5 years ago
- Views:
Transcription

1 TN001 April 2016 The separated cycleway options tool (SCOT) was developed to partially address some of the gaps identified in Stage 1 of the Cycling Network Guidance project relating to separated cycleways. Regardless of its current or eventual accuracy, it is not intended that SCOT be used as the sole deciding factor regarding the form of separated cycleway; it should form part of a multi-criteria analysis. There will be other factors to consider beyond those covered in the tool, including how a particular section connects to the greater route at each end and the physical constraints of accommodating the cycleways within the existing corridor. SCOT is intended as an interim guidance tool, it is expected that it be improved after more separated cycleways have been constructed and evaluated in New Zealand. SCOT has been developed based on professional judgement by experienced practitioners and it is to be used as interim guidance by the industry. SCOT can be applied to choose between two facility types, by evaluating the risk at certain types of conflict locations along the route, within a certain road layout and traffic environment. 2.1 SCOT gives two main options for type of separated cycleway: 1. One-way (i.e. uni-directional, with cycling in the same direction as adjacent traffic on each side of the road) o Users have the option of individual inputs for each side of the road. Therefore this tool could be used to assess a single one-way cycleway on one side of the road, including one-way streets, as long as the cycle flow is in the same direction as adjacent traffic. Note that it does not yet cover, however, the case of a one-way cycleway for contraflow cycling. 2. Two-way (i.e. bi-directional, with cycling in both directions, hence involving a component of contraflow cycling) o Users have the option of individual inputs for cycle volumes in each direction. Figure 1 illustrates a two-way separated cycleway. As people can cycle in both directions, some of them will be cycling in the same direction as adjacent traffic (i.e. with-flow cycling) and others will be cycling in the opposite direction to adjacent traffic (i.e. contraflow cycling).

 will reduce the risk of conflict.")


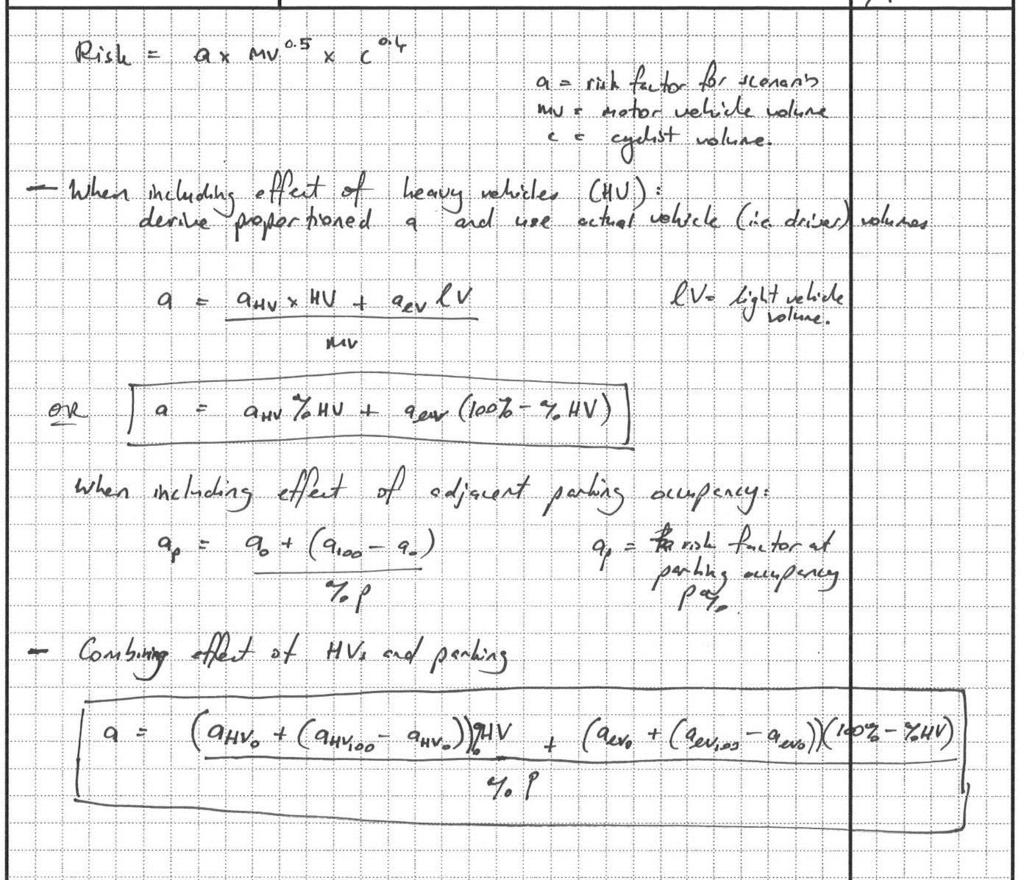
2 2.2 There will be a number of potential conflict locations where vehicles have access across a separated cycleway; SCOT considers: Residential driveways; Non-residential driveways; Priority controlled side streets / intersections; and Signalised intersections. Note that SCOT has been developed assuming streets allow for two-way traffic and all turning movements are accommodated at accessways (i.e. left and right turns in and out). It is reasonable to assume that restricting certain movements across a cycleway (especially movements that affect contraflow cycling) will reduce the risk of conflict. Whilst no specific consideration of one-way streets has been made, SCOT should be suitable for one-way separated cycleways where cycle flow is in the same direction as adjacent traffic. The case of a one-way separated cycleway for contraflow cycling could be covered by defining a two-way cycleway with a volume of zero for cyclists travelling in the with-flow direction. 2.3 At each type of conflict location, the risk is affected by certain parameters: 2.4 Cyclist volumes; Direction of cycle travel with respect to adjacent traffic; Motor vehicle volumes for conflicting movements; Proportion of heavy vehicles involved; and Occupancy of adjacent on-street parking. A type of cycleway at a specific conflict location with its unique parameters is termed a conflict scenario. The methods of deriving the risk factors for various conflict scenarios are discussed in section 4.1
 Notes on development of the factor to convert from crash risk to actual crashes.")


3 3.1 SCOT consists of a Microsoft Excel workbook containing three worksheets: General notes outlining tool development. Separated cycleway options tool (intended for industry guidance) Notes on development of the factor to convert from crash risk to actual crashes. The second sheet, Conflict evaluation contains the tool itself and all relevant output for users; the others provide documentation on the tool development and application, as a supplement to this guidance. 3.2 A variety of colours is applied to the cells in the facility selection tool spreadsheet ( conflict evaluation ) to assist the user: The only cells that can be modified by users are the red cells; the spreadsheet is password protected, but still allows users to see the underlying factors. 3.3 SCOT is configured to give the two facility options: one-way separated cycleways (with the option of being on one or both sides of the road) and two-way separated cycleways, as identified in section 2.1. Tool users are required to describe the conflict scenarios by entering values in the red cells, which cover: Cyclist volumes o For one-way cycleways daily volumes are specified for each side of the road o For two-way cycleways, daily volumes are specified for with-flow and contraflow directions (as illustrated in Figure 1) Number of driveway movements generated per residence per day (a default value of 10 is used) Number of driveways servicing a given number of residential properties, at a given parking occupancy rate (see below for more information on assessing parking occupancy) Total daily traffic movements at non-residential driveways (sum of vehicles in and out) Total daily traffic movements crossing cycleway at side streets and intersections Percentage of heavy vehicles in the traffic crossing the cycleway at non-residential driveways, side streets and intersections Occupancy of parking adjacent to cycleway; o This factor applies to driveways and priority-controlled side streets / intersections. o This should be approximated based on a 50 m section of parking prior to (i.e. in the direction of an approaching cyclist) the conflict location For one-way facilities, consider the parking occupancy for 50 m in the upstream direction (as illustrated in Figure 3) For two-way facilities, therefore, consider the parking occupancy for 50 m either side of the driveway / side street (as illustrated in Figure 4) o Where parking occupancy is likely to vary throughout the day, the peak periods should be considered. o Where no on-street parking is provided, the parking occupancy is 0%.

, or each cycling")


4 3.4 SCOT shows a risk rating for each individual conflict location (except that risk at residential driveways can be grouped together for driveways servicing the same number of properties / movements and with the same expected parking occupancy on the frontage road). Risk is summed for each conflict type on each side of the road (for a pair of one-way cycleways), or each cycling direction (for a two-way cycleway). A conversion factor is used to convert the risk scores to predicted actual crash rates. A summary table at the bottom of the conflict evaluation worksheet presents the relevant risks and predicted crash rates. This can be used to identify which option is considered safer, by what proportion and by what number of actual expected crashes. The summary table can also be used to identify which aspects contribute the most to the risk rating of a particular option and therefore which locations could be addressed to reduce an option s risk rating or achieve an acceptable predicted crash rate. The summary table for an example where SCOT was applied to a section of Sawyers Arms Road in Christchurch is shown in Figure 5:


5 3.5 Current crash prediction models 1 focus on on-road cycling environments which differ from separated cycleways in terms of relative position to moving traffic and parked cars, visibility, directional flow and user familiarity. The current models available also include a high degree of aggregation; for example, they consider entire midblock sections without allowing for any distinction between the number and type of driveways along the section. Thus, until more separated cycleways are built and observed there is little information available to accurately validate the values that have been assumed. In the meantime, it is anticipated that this interim guidance tool will provide practitioners with a useful basis of evaluation. Professional judgement on site-specific criteria must always be applied. This section gives further explanation of the underlying factors used by SCOT to evaluate risk and crash rates. 4.1 As discussed in section 2.2, a conflict scenario depends on the facility type, location type and parameters. The factors used in SCOT to determine the risk at various conflict scenarios are presented in Figure 6, and the rationales for these are discussed in this section. 1 E.g. NZTA Research Reports 289 and 389.


6 Note that the risk factors have been developed assuming that the design complies with the relevant guidance regarding geometry and visibility etc. In particular, risk factors relating to driveways apply to driveways with adjacent on-street parking that complies with the recommended minimum parking setbacks from driveways as outlined in the Cycle network guidance section on separated cycleways at driveways. Along a separated cycleway there may also exist locations of potential conflict between cyclists and pedestrians. These include pedestrian crossing points that traverse the cycleway, bus stops and shared areas where footpaths and separated cycleways are merged. Crashes between a cyclist and a pedestrian are generally less significant than crashes between a cyclist and a motor vehicle, and thus have not been considered in this tool. However, it is assumed that such locations with potential conflict between cyclists and pedestrians will be designed according to best practice guidance The risk of a conflict involving cycling in the with-flow direction on a separated cycleway at a residential driveway with no adjacent parking has been taken as the base case and assigned a risk factor of 1. The other conflict location scenarios reference this directly or with one or two degrees of separation. International studies that compare with-flow and contraflow cycling suggest that cycling in the contraflow direction is approximately three times riskier than cycling in the with-flow direction at an intersection between a cycleway and a side road (see Figure 7). It has been assumed that a similar ratio between risk of with-flow and contraflow cycling would apply at driveways. Thus a risk factor of 3 has been applied to residential driveways for separated cycleways that involve contraflow cycling, where there is no adjacent on-street parking.


7 When adjacent parking is present, the risk increases. Parked vehicles obscure intervisibility between drivers turning into driveways and cyclists. Parked vehicles obscure visibility for drivers turning out of driveways to on-road traffic, which adds complication to their manoeuvre and therefore increases the likelihood that they will overlook cycleway users. This risk has been assumed to be a linear increase with respect to the no parking (equal to zero occupancy) case (i.e. this involves an addition to, not a multiplication of, the no-parking cases for both with and without adjacent parking). The upper limit of risk for locations with 100% parking occupancy will need to be subjected to sensitivity testing. It is expected to be times that of the zero occupancy case. It has been assumed that heavy vehicle movements at residential driveways are so rare that they are insignificant and therefore not accounted for The unfamiliarity of users at non-residential driveways is expected to increase the likelihood of conflicts. Non-residential driveways are also expected to involve a non-negligible proportion of heavy vehicles which must be accounted for. To account for the lack of unfamiliarity at non-residential driveways, the risk factors for conflicts involving light vehicles have been taken as twice that of the corresponding risks at residential driveways for all four combinations involving direction of cyclist travel and parking occupancy. That is, a multiplication factor of 2 has been applied to the row in Figure 6 for the various conflict scenarios relating to residential driveways to produce the next row for conflict scenarios relating to light vehicles at non-residential driveways. 2 Diagram created by Shane Foran of the Galway Cycling Campaign; see and
8 In assessing the risk of conflicts involving heavy vehicles at non-residential driveways, two principles are noted: 1. The consequences of crashes involving heavy vehicles and cyclists are much more severe, therefore the risk factors will be higher than for light vehicles. 2. The geometry of heavy vehicles restricts drivers turning left into a driveway from seeing adjacent cyclists travelling in the same (i.e. with-flow ) direction. This means that the proportion of risk between crashes involving with-flow cycling and those involving contraflow cycling is reduced for heavy vehicles compared with light vehicles. Therefore, it is not possible to simply apply a multiplication factor to the conflict scenarios involving residential driveways to derive the risks associated with heavy vehicles at non-residential driveways, as was possible for light vehicles at non-residential driveways. Combining these two principles, the tool uses a factor of 10 for with-flow heavy vehicle crashes and 15 for heavy vehicle contraflow crashes. Another way of looking at this is that a heavy vehicle crash with cyclists in the with-flow direction at a non-residential driveway is 5 times more risky than a light vehicle crash at the same location and a heavy vehicle crash involving contraflow cycling is 1.5 times more risky than one involving with-flow cycling. It has been assumed that these risk factors are not augmented by the presence of parking as heavy vehicle drivers are positioned to be able to see over parked vehicles For the initial tool development, it has been assumed the risk factors applied at non-residential driveways are also suitable for priority-controlled side streets, for both light and heavy vehicles. The two conflict location types both involve a higher proportion of unfamiliar motorists than residential driveways. Side streets are generally wider (and therefore involve a larger zone of potential conflict) than non-residential driveways, but side streets are also more prominent to users; cyclists in particular are likely to be more cautious at side streets than at driveways as they enter the roadway at side streets. The tool does not make any distinction between priority-controlled intersections where turning drivers are required to give way to cycleway users and those where cycleway users are required to give way. Here it was identified that too little information and professional understanding is available to determine which operation would be safer, and furthermore that the most important factor is achieving a suitable design that communicates the intended function to users. Therefore, these two methods of assigning priority have been assumed to be equal. As the risk is calculated as a function of the volume of vehicles that cross the cycle route, no distinction is made between T intersections (i.e. side streets) and X intersections, although it may be investigated whether the latter group has a slightly higher risk due to increased complexity It has been assumed that signalised intersections are safer for all users than non-signalised intersections as they involve a higher degree of control and less room for user-error, however non-compliance may be an issue at signalised intersections. The tool assumes that the risk at signalised intersections will be, for both light and heavy vehicles. There are few models available that can be used to compare signalised intersections with priority intersections, especially with respect to cycling. The most useful comparison comes from the bicyclist likelihood risk factors developed by the International Road Assessment Programme as shown in
9 Table 4-1. The irap ratios for signalised / un-signalised taken from these factors are all higher than 0.5, which suggests that the risk of a signalised intersection is more than half of that of an un-signalised intersection for cyclists, however there is not enough background information provided with the irap factors to confirm whether these should be adopted in the SCOT risks.
10 Research shows that as the volume of cyclists on a cycleway increases, the crash rate per cyclist decreases. This is because motorists are more likely to see cyclists more often and therefore will be more aware of them and more likely to expect to see them. Similarly, but to a lesser degree, the tool assumes that an increase in motor vehicle volume will also reduce the likelihood of a crash per vehicle; this is because cyclists will be more aware of the presence of motorists at locations with high vehicle volumes. The tool applies an exponent of 0.5 (i.e. the square-root) to motor vehicle volumes, based on the exponents used in crash prediction models for on-road cycling (e.g. Research Reports 289 and 389) which were generally in the range of As these models involve cyclists directly next to the motor vehicles (i.e. not separated by parked vehicles or physical devices) and did not include lower volume roads in the dataset (where non-linear effects are more likely to be identified) the upper end of the range, i.e. 0.5, has been adopted for the tool. It is assumed that the safety in numbers effect will be more sensitive to the cyclist volumes thus an exponent of 0.4 has been applied to the cyclist volumes. For want of more informed data, the exponents applied to cycle and motor vehicle volumes to represent the safety in numbers effect remains the same for each of the conflict types. Each conflict location is treated separately in terms of the safety in numbers effect. That is, the safety in numbers factors are applied to the motor vehicle and cyclist volumes at each individual driveway, accessway and intersection. Thus the tool s safety in numbers reduction does not account for an improvement in safety where there are numerous occurrences of a particular type of conflict location along a route. To illustrate this, while it may be reasonable to assume that a route with frequent driveways will have fewer crashes per driveway (as cyclists will be more aware of the associated dangers) than a route with very few driveways, the tool does not go to this level of detail. Appendix A shows how the parking occupancy, heavy vehicle volumes and risk factors are incorporated into the basic safety in numbers risk equation. 4.3 The conversion factor from the tool risk to actual crash rates has been developed based on the case of with-flow cycling at a residential driveway, crash prediction models, mode share statistics and relative safety for on-road versus off-road cycling. The derivation behind this is detailed further in the SCOT worksheet actual crash prediction. The separated cycleways option tool (SCOT) has been developed using professional judgement to assess the relative risks of various conflict locations. It provides the industry with a useful interim tool to be used while waiting on more informed experience and evaluation of the risks involved at separated cycleways. Users must continue to apply professional judgement to consideration of the inputs and interpretation of the outputs. In addition to the further research required to validate the factors used in this tool, the tool could be expanded to include different facility types (e.g. shared paths, one-way cycleways with cycling in the contraflow direction, or comparison with on-road cycling provisions). 3 International Road Assessment Programme (irap) Road Attribute Risk Factors: Intersection Type. UKEwiGvM6r45XJAhWMRSYKHZBOCAo&url=http%3A%2F%2Fwww.irap.net%2Fabout-irap- 3%2Fmethodology%3Fdownload%3D117%3Airap-road-attribute-risk-factors-intersectiontype&usg=AFQjCNEHnvqrHU1dd3pEVcVrJN0f8fWynA&sig2=k5QITcxPPQDlCFKdMgeY5A&bvm=bv ,d.eWE
11
Section Outline Signalised Intersection Layout
 Advanced Planning and Design for Cycling Module 4 Intersections SECTION 2 SIGNALISED INTERSECTION LAYOUT Section Outline Signalised Intersection Layout Refresher: 6 elements of intersection design Providing
RIGHT TURNS AT INTERSECTIONS: ARE THERE ALTERNATIVES?
 RIGHT TURNS AT INTERSECTIONS: ARE THERE ALTERNATIVES? R.C. Pyke, J.D. Sampson and K.G. Schmid Stewart Scott International, P O Box 784506, Sandton, 2146 TTT Africa, P.O.Box 109, Sunninghill, G.D.P.T.R.W,
Welcome! San Jose Avenue Open House August 25, 2015
 Welcome! San Jose Avenue Open House August 25, 2015 Vision Zero The City and County of San Francisco adopted Vision Zero San Francisco Vision Zero High Injury Network as a policy in 2014, committing an
HAP e-help. Obtaining Consistent Results Using HAP and the ASHRAE 62MZ Ventilation Rate Procedure Spreadsheet. Introduction
 Introduction A key task in commercial building HVAC design is determining outdoor ventilation airflow rates. In most jurisdictions in the United States, ventilation airflow rates must comply with local
Reducing Speed: The C-Roundabout
 Reducing Speed: The C-Roundabout Ivan Jurisich (PRESENTER) NZCE (Civil) BSc(Maths) MPhil (Civil Eng) Member of ITE Traffic Engineering Solutions Ltd Phone: +649 366 7532 Email: ivan.jurisich@tes.net.nz
Reduction of Speed Limit at Approaches to Railway Level Crossings in WA. Main Roads WA. Presenter - Brian Kidd
 Australasian College of Road Safety Conference A Safe System: Making it Happen! Melbourne 1-2 September 2011 Reduction of Speed Limit at Approaches to Railway Level Crossings in WA Radalj T 1, Kidd B 1
Document 2 - City of Ottawa Pedestrian Crossover (PXO) Program
 Program") 40 Document 2 - City of Ottawa Pedestrian Crossover (PXO) Program OVERVIEW The City of Ottawa Pedestrian Crossover (PXO) Program provides the basis for PXO implementation in Ottawa. The program s processes
40 Document 2 - City of Ottawa Pedestrian Crossover (PXO) Program OVERVIEW The City of Ottawa Pedestrian Crossover (PXO) Program provides the basis for PXO implementation in Ottawa. The program s processes
Access Location, Spacing, Turn Lanes, and Medians
 Design Manual Chapter 5 - Roadway Design 5L - Access Management 5L-3 Access Location, Spacing, Turn Lanes, and Medians This section addresses access location, spacing, turn lane and median needs, including
Roundabout Design 101: Roundabout Capacity Issues
 Design 101: Capacity Issues Part 2 March 7, 2012 Presentation Outline Part 2 Geometry and Capacity Choosing a Capacity Analysis Method Modeling differences Capacity Delay Limitations Variation / Uncertainty
5.0 Roadway System Plan
 Southwest Boise Transportation Study Page 16 5.0 Roadway System Plan The Roadway System Plan outlines roadway improvements in the Initial Study Area. It forecasts future deficiencies on the arterial system,
6. BREENS/GARDINERS/HAREWOOD INTERSECTION - SAFETY IMPROVEMENT PROJECT
 6. BREENS/GARDINERS/HAREWOOD INTERSECTION - SAFETY IMPROVEMENT PROJECT General Manager responsible: Officer responsible: Author: Jane Parfitt General Manager City Environment DDI 941 8656 Michael Aitken
ENHANCED PARKWAY STUDY: PHASE 2 CONTINUOUS FLOW INTERSECTIONS. Final Report
 Preparedby: ENHANCED PARKWAY STUDY: PHASE 2 CONTINUOUS FLOW INTERSECTIONS Final Report Prepared for Maricopa County Department of Transportation Prepared by TABLE OF CONTENTS Page EXECUTIVE SUMMARY ES-1
Chapter 2: Standards for Access, Non-Motorized, and Transit
 Standards for Access, Non-Motorized, and Transit Chapter 2: Standards for Access, Non-Motorized, and Transit The Washtenaw County Access Management Plan was developed based on the analysis of existing
Frequently Asked Questions
 Frequently Asked Questions Business US 190 in Copperas Cove From Avenue D to Constitution Drive What is access management? A. Access Management is a growing effort by government agencies to improve how
The Safe System Approach
 There are very few areas of public discussion and sentiment which generate as much consensus as road safety. Everyone wants safer roads for all users, and road safety is a key priority for governments,
Minor Amendments to the Street and Traffic By-law 2849 and Skateboards in Protected Bike Lanes
 ADMINISTRATIVE REPORT Report Date: October 31, 2017 Contact: Lon LaClaire Contact No.: 604.873.7336 RTS No.: 12241 VanRIMS No.: 08-2000-20 Meeting Date: November 15, 2017 TO: FROM: SUBJECT: Standing Committee
EXECUTIVE SUMMARY Callan Park accommodates travel from a wide range of transport modes, including walking, cycling, bus and light rail.
 TRANSPORT AND ACCESS EXECUTIVE SUMMARY Callan Park accommodates travel from a wide range of transport modes, including walking, cycling, bus and light rail. Whilst there are some walking facilities within
University Hill Transportation Study Technical Memorandum Alternatives Modeling and Analysis May 2007
 Technical Memorandum May 2007 Syracuse Metropolitan Transportation Council Edwards and Kelcey with Wallace Roberts and Todd Alta Planning and Design CONTENTS SECTION ONE- INTRODUCTION...1 SECTION TWO-
21. CHRISTCHURCH CYCLE LANES: PROPOSED COLOURED SURFACING CHANGE
 21. CHRISTCHURCH CYCLE LANES: PROPOSED COLOURED SURFACING CHANGE General Manager responsible: General Manager City Environment, DDI 941-8608 Officer responsible: Transport and Greenspace Manager Author:
BICYCLE LEVEL OF SERVICE for URBAN STREETS. Prepared by Ben Matters and Mike Cechvala. 4/16/14 Page 1
 BICYCLE LEVEL OF SERVICE for URBAN STREETS Prepared by Ben Matters and Mike Cechvala 4/16/14 Page 1 Introduction The methodology used for the Bicycle (BLOS) analysis is from the Highway Capacity Manual
Simulation Analysis of Intersection Treatments for Cycle Tracks
 Abstract Simulation Analysis of Intersection Treatments for Cycle Tracks The increased use of cycle tracks also known as protected bike lanes has led to investigations of how to accommodate them at intersections.
Low Level Cycle Signals used as repeaters of the main traffic signals Appendices
 Low Level Cycle Signals used as repeaters of the main traffic signals Appendices Track trial report This document contains the appendices to accompany the report from the first sub-trial of a larger track
A Traffic Operations Method for Assessing Automobile and Bicycle Shared Roadways
 A Traffic Operations Method for Assessing Automobile and Bicycle Shared Roadways A Thesis Proposal By James A. Robertson Submitted to the Office of Graduate Studies Texas A&M University in partial fulfillment
Southside Road. Prepared for: City of St. John s Police & Traffic Committee. Prepared by: City of St. John s Traffic Division
 Southside Road Prepared for: City of St. John s Police & Traffic Committee Prepared by: City of St. John s Traffic Division January 2007 Southside Road - Traffic Report Page 1 of 9 BACKGROUND: th At the
TRANSPORTATION ANALYSIS REPORT US Route 6 Huron, Erie County, Ohio
 TRANSPORTATION ANALYSIS REPORT US Route 6 Huron, Erie County, Ohio December 12, 2012 Prepared for: The City of Huron 417 Main Huron, OH 44839 Providing Practical Experience Technical Excellence and Client
EUCLID AVENUE PARKING STUDY CITY OF SYRACUSE, ONONDAGA COUNTY, NEW YORK
 EUCLID AVENUE PARKING STUDY CITY OF SYRACUSE, ONONDAGA COUNTY, NEW YORK CITY OF SYRACUSE DEPARTMENT OF PUBLIC WORKS 1200 CANAL STREET EXTENSION SYRACUSE, NEW YORK 13210 DRAFT REPORT DATE: November 13,
TRAFFIC IMPACT STUDY CRITERIA
 Chapter 6 - TRAFFIC IMPACT STUDY CRITERIA 6.1 GENERAL PROVISIONS 6.1.1. Purpose: The purpose of this document is to outline a standard format for preparing a traffic impact study in the City of Steamboat
Active Transportation Facility Glossary
 Active Transportation Facility Glossary This document defines different active transportation facilities and suggests appropriate corridor types. Click on a facility type to jump to its definition. Bike
CHAPTER 2G. PREFERENTIAL AND MANAGED LANE SIGNS
 2011 Edition - Revision 2 Page 275 Section 2G.01 Scope CHAPTER 2G. PREFERENTIAL AND MANAGED LANE SIGNS 01 Preferential lanes are lanes designated for special traffic uses such as high-occupancy vehicles
DUNBOW ROAD FUNCTIONAL PLANNING
 DUNBOW ROAD FUNCTIONAL PLANNING Final Report August 3, 216 #31, 316 5th Avenue NE Calgary, AB T2A 6K4 Phone: 43.273.91 Fax: 43.273.344 wattconsultinggroup.com Dunbow Road Functional Planning Final Report
CITY OF CAMBRIDGE 2015 BICYCLE PLAN TOWARDS A BIKABLE FUTURE
 CITY OF CAMBRIDGE 2015 BICYCLE PLAN TOWARDS A BIKABLE FUTURE WHICH FUTURE? CAMBRIDGE MUNICIPAL POLICIES 1992: Vehicle Trip Reduction Ordinance 1998: Parking & Transportation Demand Ordinance 2002: Climate
MILTON ROAD LLF PROJECT UPDATE
 Greater Cambridge City Deal MILTON ROAD LLF PROJECT UPDATE 9 th May 2017 Project objectives Comprehensive priority for buses in both directions wherever practicable; Additional capacity for sustainable
Update June 2018 OUR 2017 PUBLIC ENGAGEMENT
 Update June 2018 Hi, Let s Get Wellington Moving (LGWM) is developing a Recommended Programme of Investment (RPI) that meets our programme objectives and supports the city s and region s growth. As part
ARLINGTON COUNTY, VIRGINIA
 ARLINGTON COUNTY, VIRGINIA County Board Agenda Item Meeting of October 15, 2016 DATE: October 7, 2016 SUBJECT: Adoption of amendments to the Master Transportation Plan (MTP) to create a new Pedestrian
Community Bicycle Planning
 Community Bicycle Planning City of Mentor s Bicycle Facility Plan Allen E. Pennington, P.E. Civil Engineer - Traffic Office of the Mentor City Engineer Why has Mentor participated in bicycle planning?
Potential Bicycle Facility on Bayou Street Mobile, Alabama
 Potential Bicycle Facility on Bayou Street Mobile, Alabama By Richard A. Hall, P.E. Prepared For Mobile Downtown Alliance Hall Planning & Engineering, Inc. March 28, 2018 Introduction Review of the February
MEMORANDUM. Charlotte Fleetwood, Transportation Planner
 MEMORANDUM Date: Updated August 22, 2017 To: Organization: Charlotte Fleetwood, Transportation Planner Boston Transportation Department From: Jason DeGray, P.E., PTOE, Regional Director of Engineering
10 SHERFORD Town Code
 Key Fixes (Ref: Masterplan Book, section 4a. Land Use Budget and Key Fixes ) The Town Plan designs and allocates buildings, streets and spaces as accurately as possible in the understandable absence of
SIDRA INTERSECTION 6.1 UPDATE HISTORY
 Akcelik & Associates Pty Ltd PO Box 1075G, Greythorn, Vic 3104 AUSTRALIA ABN 79 088 889 687 For all technical support, sales support and general enquiries: support.sidrasolutions.com SIDRA INTERSECTION
CHAPTER 7 ACCESS MANAGEMENT. Background. Principles of Access Management. Hennepin County Transportation Systems Plan (HC-TSP)
") CHAPTER 7 ACCESS MANAGEMENT Background Principles of Access Management Hennepin County Transportation Systems Plan (HC-TSP) Chapter 7 Access Management 7.1 Background Access management has become an important
CHAPTER 7 ACCESS MANAGEMENT Background Principles of Access Management Hennepin County Transportation Systems Plan (HC-TSP) Chapter 7 Access Management 7.1 Background Access management has become an important
Addressing Deficiencies HCM Bike Level of Service Model for Arterial Roadways
 Petritsch, et al 1 1 2 3 4 5 6 7 8 9 10 11 12 13 14 15 16 17 18 19 20 21 22 23 24 25 26 27 28 Addressing Deficiencies HCM Bike Level of Service Model for Arterial Roadways Submitted July 31, 2013 Word
Cycle Track Design Best Practices Cycle Track Sections
 Design Best Practices Sections It is along street segments where the separation and protection methods of cycle tracks offer more comfort than conventional bicycle lanes, and are more attractive to a wide
Findings on the Effectiveness of Intersection Treatments included in the Victorian Statewide Accident Black Spot Program
 Findings on the Effectiveness of Intersection Treatments included in the Victorian Statewide Accident Black Spot Program Nimmi Candappa, Jim Scully, Stuart Newstead and Bruce Corben, Monash University
Baseline Survey of New Zealanders' Attitudes and Behaviours towards Cycling in Urban Settings
 Baseline Survey of New Zealanders' Attitudes and Behaviours towards Cycling in Urban Settings Highlights 67% of urban New Zealanders, 18 years of age or more own or have access to a bicycle that is in
Stanley Street/Shotover Street, Queenstown. Traffic Modelling Report
 Stanley Street/Shotover Street, Queenstown Traffic Modelling Report Stanley Street/Shotover Street, Queenstown Traffic Modelling Report Prepared By Chris Morahan Transportation Engineer/Traffic Modeller
SCHOOL CROSSING PROTECTION CRITERIA
 CITY OF MADISON TRAFFIC ENGINEERING SCHOOL CROSSING PROTECTION CRITERIA AUGUST 1990 Adopted as Policy on August 31, 1976, by Common Council by Amended Resolution #29,540 Amended on September 14, 1976,
Complete Streets Process and Case Study: Taft / McMillian Two-Way Street Conversion Cincinnati, Ohio. Traffic Engineering Workshop June 4, 2014
 Complete Streets Process and Case Study: Taft / McMillian Two-Way Street Conversion Cincinnati, Ohio Traffic Engineering Workshop June 4, 2014 Complete Streets Streets that enable safe access for users
North West Non-Technical Summary of the Transport Assessment September 2011
 North West Non-Technical Summary of the Transport Assessment September 2011 Introduction This is a Non-Technical Summary of the findings of the Transport assessment work undertaken for the proposed North
Chapter 7 Intersection Design
 hapter 7 Dr. Yahya Sarraj Faculty of Engineering The Islamic University of Gaza An intersection is an area, shared by two or more roads, whose main function is to provide for the change of route directions.
Ministry of Education Flat Bush School Notice of Requirement. Integrated Transportation Assessment Report. February 2016
 Ministry of Education Flat Bush School Notice of Requirement Integrated Transportation Assessment Report February 2016 TDG Ref: 12988-2 151105 ita flat bush.docx Ministry of Education Flat Bush School
EFFICIENCY OF TRIPLE LEFT-TURN LANES AT SIGNALIZED INTERSECTIONS
 EFFICIENCY OF TRIPLE LEFT-TURN LANES AT SIGNALIZED INTERSECTIONS Khaled Shaaban, Ph.D., P.E., PTOE (a) (a) Assistant Professor, Department of Civil Engineering, Qatar University (a) kshaaban@qu.edu.qa
TECHNICAL NOTE THROUGH KERBSIDE LANE UTILISATION AT SIGNALISED INTERSECTIONS
 TECHNICAL NOTE THROUGH KERBSIDE LANE UTILISATION AT SIGNALISED INTERSECTIONS Authors: Randhir Karma NDip: Eng (Civil) B. Tech Eng (Civil) M Eng (Hons) (Transportation) Auckland Traffic Service Group Manager
Access Management Regulations and Standards
 Access Management Regulations and Standards January 2014 Efficient highway operation Reasonable property access Concept of Access Management The way to manage access to land development while preserving
Exhibit 1 PLANNING COMMISSION AGENDA ITEM
 Exhibit 1 PLANNING COMMISSION AGENDA ITEM Project Name: Grand Junction Circulation Plan Grand Junction Complete Streets Policy Applicant: City of Grand Junction Representative: David Thornton Address:
Roundabouts in Australia: the state of the art on models and applications
 Roundabouts in Australia: the state of the art on models and applications Seminar Presentation One-day International Meeting on Roundabouts Università di Pisa - Corso di TECNICA del TRAFFICO, Livorno,
HIGHWAY CAPACITY MANUAL
 HISTORY OF THE HIGHWAY CAPACITY MANUAL TexITE - Houston Chapter November 10, 2010 Michael Y. Ereti City of Houston Department of Public Works & Engineering THE NEW GUY (Michael Ereti) Consultant (10 years)
Bicycle - Motor Vehicle Collisions on Controlled Access Highways in Arizona
 Bicycle - Motor Vehicle Collisions on Controlled Access Highways in Arizona Analysis from January 1, 1991 to June 30, 2002 Richard C. Moeur, PE Traffic Design Manager, Northern Region Michelle N. Bina
Appendix T CCMP TRAIL TRAFFIC & TRANSPORTATION DESIGN STANDARD
 Appendix T CCMP 3.3.4 TRAIL TRAFFIC & TRANSPORTATION DESIGN STANDARD 3.3.4 Trail Traffic and Transportation Design Multi-use trails have certain design standards, which vary depending on the agency that
Speed Limits in the Hoddle Grid
 Speed Limits in the Hoddle Grid Recent History of speed limits March 2013 Docs # 7738485 1 Introduction Muncipalities have power to Erect speed limit signs BUT Municipalities DO NOT have the power to approve
Arlington s Master Transportation Plan
 Arlington s Master Transportation Plan The Master Transportation Plan (MTP) Adopted in eight parts Goals & Policies element and MTP Map adopted in 2007 Bicycle, Pedestrian and Demand and Systems Management
Project Report. South Kirkwood Road Traffic Study. Meadows Place, TX October 9, 2015
 Meadows Place, TX October 9, 2015 Contents 1 Introduction... 1 2 Data Collection... 1 3 Existing Roadway Network... 2 4 Traffic Volume Development... 2 5 Warrant Analysis... 3 6 Traffic Control Alternative
On Road Bikeways Part 1: Bicycle Lane Design
 On Road Bikeways Part 1: Bicycle Lane Design Presentation by: Nick Jackson Bill Schultheiss, P.E. September 04, 2012 FOLLOW THE CONVERSATION ON TWITTER Toole Design Group is live tweeting this webinar
Collision Estimation and Cost Calculation
 Collision Estimation and Cost Calculation Table of Contents Introduction... 3 Rates Based Method... 4 20-Year Collision Cost Procedure... 4 Safety Performance Function Method... 7 Important notes when
Statement of Rebuttal Evidence of Anthony Thomas Penny on Behalf of Danne Mora Holdings (#1134)
") In the Matter of: The Resource Management Act 1991 and In the Matter of: and The Christchurch Proposed Replacement District Plan under the Canterbury Earthquake (Christchurch Replacement District Plan)
In the Matter of: The Resource Management Act 1991 and In the Matter of: and The Christchurch Proposed Replacement District Plan under the Canterbury Earthquake (Christchurch Replacement District Plan)
Traffic Impact Analysis
 Traffic Impact Analysis Isle of Capri Casinos, Inc. Waterloo, Iowa SEH No. A-CLAAS0501.00 November 16, 2004 Table of Contents (Continued) Table of Contents Certification Page Table of Contents Page 1.0
7 th Street Bike Lane Traffic Impact Study
 7 th Street Bike Lane Traffic Impact Study Submitted by: San Francisco Department of Parking and Traffic Michael Sallaberry June 11, 2001 EXECUTIVE SUMMARY This report presents the Department of Parking
Introduction to Roundabout Analysis Using ARCADY
 Introduction to Roundabout Analysis Using ARCADY Toronto SimCap User Group Technical Event and ITE Toronto Section Social Event July 22, 2014 Phil Weber, P.Eng. GHD Inc. (The Home of Ourston Roundabout
Governance and Priorities Committee Report For the July 2, 2015 Meeting
 CITY OF VICTORIA For the July 2, 2015 Meeting To: Governance and Priorities Committee Date: From: Subject: Brad Dellebuur, A/Assistant Director, Transportation and Parking Services Executive Summary The
SCHOOL CROSSING PROTECTION CRITERIA
 CITY OF MADISON TRAFFIC ENGINEERING SCHOOL CROSSING PROTECTION CRITERIA January 2016 Adopted as Policy on August 31, 1976, by Common Council by Amended Resolution #29,540 Amended on September 14, 1976,
Calculation of Trail Usage from Counter Data
 1. Introduction 1 Calculation of Trail Usage from Counter Data 1/17/17 Stephen Martin, Ph.D. Automatic counters are used on trails to measure how many people are using the trail. A fundamental question
Local road mountable roundabouts are there safety benefits?
 Local road mountable roundabouts are there safety benefits? Nimmi Monash University Accident Research Centre Abstract Roundabouts are internationally accepted as being highly effective in improving safety
Introduction Roundabouts are an increasingly popular alternative to traffic signals for intersection control in the United States. Roundabouts have a
 HIGH-CAPACITY ROUNDABOUT INTERSECTION ANALYSIS: GOING AROUND IN CIRCLES David Stanek, PE and Ronald T. Milam, AICP Abstract. Roundabouts have become increasingly popular in recent years as an innovative
Planning Guidance in the 2012 AASHTO Bike Guide
 Planning Guidance in the 2012 AASHTO Bike Guide Presentation by: RJ Eldridge Peter Lagerwey August 22, 2012 WEBINAR 2: PLANNING GUIDANCE IN THE 2012 AASHTO BIKE GUIDE Today s Webinar Significant Updates
Relative safety of alternative intersection designs
 Urban Transport XII: Urban Transport and the Environment in the 21st Century 379 Relative safety of alternative intersection designs L. C. Wadhwa 1 & M. Thomson 2 1 James Cook University Townsville Queensland
CITY OF OAKLAND. 27th Street Bikeway Feasibility and Design. Final Report (v3) March 23, Kimley-Horn and Associates, Inc.
 March 23, Kimley-Horn and Associates, Inc.") CITY OF OAKLAND 27th Street Bikeway Feasibility and Design Final Report (v3) March 23, 2007 PREPARED BY: Kimley-Horn and Associates, Inc. Table of Contents 1. Introduction 3 2. 27 th Street/Bay Place Corridor
CITY OF OAKLAND 27th Street Bikeway Feasibility and Design Final Report (v3) March 23, 2007 PREPARED BY: Kimley-Horn and Associates, Inc. Table of Contents 1. Introduction 3 2. 27 th Street/Bay Place Corridor
/ ARLINGTON COUNTY, VIRGINIA
 / ARLINGTON COUNTY, VIRGINIA County Board Agenda Item Meeting of September 24, 2016 DATE: August 11, 2016 SUBJECT: Amendment of the Master Transportation Plan (MTP) Streets Element to include new local
Roundabouts in Edmonton - A Comparison to the State-of-the-Art
 Roundabouts in Edmonton - A Comparison to the State-of-the-Art Authors: Carl Clayton, P.Eng. P.E. PTOE Stantec Consulting Ltd. Chuan Kua, P.Eng. City of Edmonton, Transportation and Streets Brice Stephenson,
An Assessment of FlowRound for Signalised Roundabout Design.
 An Assessment of FlowRound for Signalised Roundabout Design. 1.0 Introduction This critique is based upon recent use by White Young Green signal engineering staff. The comments made do not cover all of
Access Management Regulations and Standards for Minor Arterials, Collectors, Local Streets
 Access Management Regulations and Standards for Minor Arterials, Collectors, Local Streets September 2009 Paul Grasewicz Access Management Administrator Concept of Access Management The way to manage access
J Street and Folsom Boulevard Lane Conversion Project (T ) Before and After Traffic Evaluation
 Before and After Traffic Evaluation") J Street and Folsom Boulevard Lane Conversion Project (T15125400) Before and After Traffic Evaluation Prepared by Transportation Division June 2014 Executive Summary On February 12, 2013, the City of Sacramento
J Street and Folsom Boulevard Lane Conversion Project (T15125400) Before and After Traffic Evaluation Prepared by Transportation Division June 2014 Executive Summary On February 12, 2013, the City of Sacramento
Simulating Street-Running LRT Terminus Station Options in Dense Urban Environments Shaumik Pal, Rajat Parashar and Michael Meyer
 Simulating Street-Running LRT Terminus Station Options in Dense Urban Environments Shaumik Pal, Rajat Parashar and Michael Meyer Abstract The Exposition Corridor transit project is a light rail project
Bay to Bay Boulevard Complete Streets Project
 Bay to Bay Boulevard Complete Streets Project Dale Mabry Highway to Bayshore Boulevard February 08, 2018 Photo Source: Tampa Bay Times Alessandra Da Pra Meeting Format Introduction Resurfacing Information
1 VicRoads Access Management Policies May 2006 Ver VicRoads Access Management Policies May 2006 Version 1.02
 1 VicRoads Access Management Policies May 2006 Ver 1.02 VicRoads Access Management Policies May 2006 Version 1.02 2 VicRoads Access Management Policies May 2006 Ver 1.02 FOREWORD FOR ACCESS MANAGEMENT
Chapter 3 DESIGN SPECIFICATIONS
 Brampton PathWays Planning and Design Guidelines 27 Chapter 3 DESIGN SPECIFICATIONS 3.1 CLASS 1 MULTI-USE PATH Off-road multi-use trails are the backbone of the Brampton PathWays Network. They are typically
Our Approach to Managing Level Crossing Safety Our Policy
 Our Approach to Managing Level Crossing Safety Our Policy Our policy towards managing level crossing risk is: that we are committed to reducing the risk at level crossings where reasonably practicable
Marcus Jones, TRL. Presented by Name Here Job Title - Date
 Segregation Insert the title and of priority your at presentation junctions: a here discussion Marcus Jones, TRL Presented by Name Here Job Title - Date Background: TfL cycle facility trials Infrastructure
Abstract. Background. protected/permissive operation. Source: Google Streetview, Fairview/Orchard intersection
 ITE 2015 Western District Annual Meeting Ada County Highway District s Flashing Yellow Arrow Initiative Primary Author: Tim Curns, PE Ada County Highway District Traffic Engineer Author: Andrew Cibor,
CITY OF KASSON TRANSPORTATION ALTERNATIVES KASSON SAFE ROUTES TO SCHOOL
 ve ha 8t G B A Mantorville Ave N 240th Ave 16th St NE 11th Ave NE K-M HIGH SCHOOL SUNRISE TRAIL TO MANTORVILLE MNTH 57 SUNSET TRAIL TO MANTORVILLE NE PARK 16TH ST NE TRAIL K-M ELEMENTARY SCHOOL K-M MIDDLE
MONROE COUNTY NEW YORK
 MONROE COUNTY NEW YORK Intersection Accident Database Enhancement Project (UPWP 4380) FINAL January 2008 Prepared By: Prepared For: Bergmann Associates 200 First Federal Plaza 28 East Main Street Rochester,
DYNAMIC LANES FOR AUCKLAND
 Dynamic Lanes for Auckland MENEZES M. and INMAN R. Page 1 DYNAMIC LANES FOR AUCKLAND Authors: INMAN, Robert BA (Hons) Previously Auckland Transport Senior Traffic Engineer Now Aurecon Robert.Inman@aurecongroup.com
10.0 CURB EXTENSIONS GUIDELINE
 10.0 CURB EXTENSIONS GUIDELINE Road Engineering Design Guidelines Version 1.0 March 2017 City of Toronto, Transportation Services City of Toronto Page 0 Background In early 2014, Transportation Services
Intersection Safety 6/7/2015 INTERSECTIONS. Five basic elements should be considered in intersection design. Intersection Safety (continued)
") Intersection Safety S. M. SOHEL MAHMUD Assistant Professor Accident Research Institute (ARI), Bangladesh University of Engineering and Technology (BUET) Dhaka-1000, Bangladesh 1 Outline of the Presentation
Intersection Safety S. M. SOHEL MAHMUD Assistant Professor Accident Research Institute (ARI), Bangladesh University of Engineering and Technology (BUET) Dhaka-1000, Bangladesh 1 Outline of the Presentation
INTERSECTION DESIGN TREATMENTS
 Designing for Bicyclist Safety INTERSECTION DESIGN TREATMENTS LEARNING OUTCOMES Understand intersection design options and features Select appropriate design feature for a bikeway in a given context C1
Development of Arlington County s Marked Crosswalk Guidelines. Jon Lawler, P.E. Design Engineer Arlington County, VA
 Development of Arlington County s Marked Crosswalk Guidelines Jon Lawler, P.E. Design Engineer Arlington County, VA April 13, 2015 Transportation System Users Residents Estimated 215,000 in 2014 Lowest
Issues at T junctions:
 TheSlade_PublicConsulationPlans_March2017.pdf These comments relate to junction designs in this phase of the project on The Slade. Comments begin with the northernmost junction: Girdlestone Rd and continue
Complete Street Analysis of a Road Diet: Orange Grove Boulevard, Pasadena, CA
 Complete Street Analysis of a Road Diet: Orange Grove Boulevard, Pasadena, CA Aaron Elias, Bill Cisco Abstract As part of evaluating the feasibility of a road diet on Orange Grove Boulevard in Pasadena,
Developing a Safer Cycling Strategy for the ACT ACRS Conference August 2012
 Developing a Safer Cycling Strategy for the ACT ACRS Conference 2012 Peter Strang Canberra Manager Sarah Court Transport Consultant 10 August 2012 Presentation Outline Background Data Analysis (Stage 1)
Pedestrian Crosswalk Audit
 1200, Scotia Place, Tower 1 10060 Jasper Avenue Edmonton, Alberta T5J 3R8 edmonton.ca/auditor Pedestrian Crosswalk Audit June 19, 2017 The conducted this project in accordance with the International Standards
VIVA RETIREMENT COMMUNITIES OAKVILLE TRAFFIC IMPACT STUDY
 VIVA RETIREMENT COMMUNITIES OAKVILLE TRAFFIC IMPACT STUDY VIVA RETIREMENT COMMUNITIES OAKVILLE TRAFFIC IMPACT STUDY DECEMBER 2012 READ, VOORHEES & ASSOCIATES TORONTO, ONTARIO Read, Voorhees & Associates
Recommendations for the Risk Assessment of Buffer Stops and End Impact Walls
 Recommendations for the Risk Assessment of Buffer Stops and End Synopsis This document gives details of a recommended method which, if followed, would meet the requirements of section 11, Buffer Stops