This project completion report details the biological monitoring aspect of OWEB Grant , PUR Umpqua Fish Population Monitoring
|
|
|
- Maude Cameron
- 5 years ago
- Views:
Transcription
1 April 25, 2011 This project completion report details the biological monitoring aspect of OWEB Grant , PUR Umpqua Fish Population Monitoring Exhibit B Reporting Requirements: 1a. Submitted copy of draft report on 4/12/11 to Mark Grenbemer for review. b. NA c. Two copies of final report are enclosed. d. See attached report. e. NA f. Monitoring Data sent to NRIMP Data Clearinghouse on 4/13/11. g. See attached confirmation from NRIMP. Exhibit C Reporting Requirements: 1. See attached report. 2. See attached report. Monitoring Data is housed at ODFW Roseburg and was submitted to NRIMP Data Clearinghouse on 4/13/11.
2 Oregon Department of Fish and Wildlife You are currently signed in as {Edit Profile} {Sign Out} {Close This Window} Home Data ODFW's Data Clearinghouse My Records View All Records My Records Data Templates Add A New Record DCH-Data-Index_User Module - Unfinished My Records Edit Edit Edit Title Big Tom Folley Creek, Brush Creek, and Hinkle Creek Smolt Trap Population Estimates for Coho Smolts and Winter Steelhead, OWEB Grant Number Project Completion Report - PUR Monitoring Wolf Creek basin AUC coho estimates from spawning surveys Submission Status Approval Status Date Created Submitted Approved 4/18/2011 9:28:46 AM Submitted Approved 12/10/2009 9:25:47 AM Submitted Approved 4/18/2011 8:58:17 AM Date Last Modified 4/18/2011 9:28:46 AM 12/10/2009 9:42:09 AM 4/18/2011 8:58:17 AM Original Owner Truemper, Holly Truemper, Holly Truemper, Holly


3 OWEB Grant # PUR Fish Population and Habitat Monitoring Project Completion Report Holly Truemper 1, Andrew Janos 2, Andrea Rangeloff 2, Samuel Moyers 1, Kalene Onikama 2, Brian Franklin 2, Aaron Bliesner 2, and Keith Karoglanian 2 1 Oregon Department of Fish and Wildlife, 4192 N. Umpqua Hwy., Roseburg, OR Partnership for the Umpqua Rivers, 1758 NE Airport Rd, Roseburg, OR 97470
4 Table of Contents Introduction... 6 Study Area... 9 Elk Creek Watershed... 9 Wolf Creek Watershed Calapooya Watershed Methods Seeding Surveys Spawning Surveys Rotary Screw Traps Habitat Surveys Results Seeding Surveys Spawning Surveys Rotary Screw Traps Habitat Surveys Big Tom Folley Creek Brush Creek Discussion Seeding Surveys Spawning Surveys Rotary Screw Traps Habitat Surveys Overall Summary Additional Data Acknowledgements References Appendices
5 List of Figures Figure 1. Map of Big Tom Folley Creek, Brush Creek, and Hinkle Creek smolt trap sites. 16 Figure 2. Brush Creek smolt trap and site (pre-2010). Site was relocated approximately 75 yds downstream in 2010 due to sedimentation at the previous site due to a restoration project and log jam. New site ( ) is just below bedrock cascade above bridge 30 yds. 17 Figure 3. Location of coho seeding surveys with start and end points on Wolf Creek and Little Wolf Creek. 22 Figure 4. Location of coho seeding surveys with start and end points on Big Tom Folley Creek. 23 Figure 5. Location of coho seeding surveys with start and end points on Brush Creek. 24 Figure 6. Density of juvenile coho from surveys conducted in Wolf Creek basin during Reaches with instream restoration are denoted with an asterisk. 25 Figure 7. Density of juvenile coho salmon from surveys conducted in Little Wolf Creek basin during Figure 8. Little Wolf Creek Discharge (Survey Seasons , , , ). Data collected by USGS at the Little Wolf Creek gauging station. 34 Figure 9. Habitat types by percent occurrence in Big Tom Folley Creek and Brush Creek. Refer to ODFW AIP Manual for complete list and descriptions of habitat unit types. 50 Figure 10. Habitat types by percent total stream channel length in Big Tom Folley Creek and Brush Creek. 51 Figure 11. Mean depths (in meters) of common habitat types in Big Tom Folley Creek and Brush Creek. 51 Figure 12. Substrate composition in scour pools (LP and SP habitat unit types) and low gradient riffles (RI and RP habitat unit types with an average slope of %) in Big Tom Folley Creek. 52 Figure 13. Summary of hardwoods and conifers in riparian Zones 1-3 (Distance of 0-30 meters from the edge of the active channel on both the left and right bank, perpendicular to the stream channel) extrapolated to 1000 feet along Big Tom Folley Creek. 53 Figure 14. Summary of hardwoods by diameter class within each distinct riparian zone of Big Tom Folley Creek. 53 Figure 15. Summary of conifers by diameter class within each distinct riparian zone of Big Tom Folley Creek. 54 Figure 16. Substrate composition in scour pools (LP and SP habitat unit types) and low gradient riffles (RI and RP habitat unit types with an average slope of %) in Brush Creek. 57 Figure 17. Summary of hardwoods and conifers in riparian Zones 1-3 (Distance of 0-30 meters from the edge of the active channel on both the left and right bank, perpendicular to the stream channel) extrapolated to 1000 feet along Brush Creek. 58 Figure 18. Summary of hardwoods by diameter class within each distinct riparian zone of Brush Creek. 59 Figure 19. Summary of conifers by diameter class within each distinct riparian zone of Brush Creek. 59 Figure 20. Estimated abundance of wild adult coho salmon spawners (OASIS 2010) for Middle Umpqua and Umpqua Populations. 73 3
6 List of Tables Table Umpqua Fish District Rotary Screw Trap Locations and Operation Dates. T is township, R is range, and S is section. Trap locations are identified by quarter sections. 15 Table 2. Size classes for salmonids caught in rotary screw traps. 19 Table 3. Big Tom Folley seeding data Table 4. Brush Creek seeding data Table 5. Acronyms from Figure 7 associated with spawning ground survey reach names. Reaches with restoration projects highlighted. 28 Table 6. AUC summary for Wolf Creek Basin from Reaches with restoration are highlighted. 30 Table 7. AUC Summary for Little Wolf Creek Basin from Reaches with restoration are highlighted. 31 Table 8. Big Tom Folley Creek coho salmon and steelhead (1+, 2+, 3+) Smolt Population Estimates Table 9. Brush Creek coho salmon and steelhead (1+, 2+, 3+) Smolt Population Estimates Highlighted cells indicate years of influence from otolith study outmigrating coho smolts. 48 Table 10. Hinkle Creek coho salmon and steelhead (1+, 2+, 3+) Smolt Population Estimates
7 List of Appendices Appendix 1. Coho seeding densities (coho/m 2 ) observed in Wolf Creek basin juvenile snorkel surveys from Appendix 2. Seeding densities for coho in Big Tom Folley and Brush Creek during Appendix 3. Summary of total fish observed by reach of spawning ground surveys conducted in Wolf Creek basin Appendix 4. Summary of total fish observed by reach of spawning ground surveys conducted in Wolf Creek basin Appendix 5. Summary of total fish observed by reach of spawning ground surveys conducted in Wolf Creek basin Appendix 6. Summary of total fish observed by reach of spawning ground surveys conducted in Wolf Creek basin Appendix 7. Wolf Creek Basin PUR Coho spawning ground peak summaries Appendix 8. Population estimates for Big Tom Folley Creek during for coho smolts (A), steelhead (1+, 2+, 3+) (B), and cutthroat (1+, 2+, 3+) (C) Appendix 9. Population estimates for Brush Creek during for coho smolts (A), steelhead (1+, 2+, 3+) (B), and cutthroat (1+, 2+, 3+) (C) Appendix 10. Population estimates for Hinkle Creek during 2009 for coho smolts (A), steelhead (1+, 2+, 3+) (B), and cutthroat (1+, 2+, 3+) (C) Appendix 11. Non-Game summary for Big Tom Folley Creek rotary screw traps Appendix 12. Non-Game summary for Brush Creek rotary screw traps Appendix 13. Non-Game summary for Hinkle Creek rotary screw trap Appendix 14. Weekly salmonid summaries for Big Tom Folly Creek rotary screw traps for Appendix 15. Weekly salmonid summaries for Brush Creek rotary screw traps Appendix 16. Weekly salmonid summaries for Hinkle Creek rotary screw traps Appendix 17. PacifiCorp Monitoring Match Report
8 Introduction The Oregon Department of Fish and Wildlife (ODFW) Umpqua Watershed District joined with the Partnership for the Umpqua Rivers (PUR) in an effort to continue ongoing fish population and habitat monitoring within the Umpqua Basin. Since little is empirically known about stream specific limiting factors and fish production response to various habitat restoration treatments such as log or boulder placement, these long term data sets will help to understand fish response related to or resulting from habitat restoration projects. The goals of this partnership are to: 1) gather additional information regarding the anadromous salmonid response to various land management practices; 2) monitor coho salmon trends in response to habitat enhancement work. To accomplish this, ODFW, BLM, and PUR have been conducting surveys that observe life history traits which include: smolt out-migration timing, size, age, condition of out-migrants, outmigrant population estimates, summer parr densities, habitat surveys, and adult spawning salmonid surveys in various Umpqua River tributaries. Monitoring work is planned in various key streams throughout the basin for biological and physical data collection. The installation of in-stream structures is made with the assumption that in streams lacking habitat, improving physical habitat will result in increased salmonid densities as long as enough of the correct type of habitat is modified. Other work within the basin related to this project includes temperature monitoring in both Brush Creek and Big Tom Folley (BTF) Creek by industrial timber companies (Lone Rock Timber and Seneca Jones Timber) to monitor impacts of riparian conversions and habitat enhancement. Wolf Creek is targeted for habitat enhancement projects, habitat surveys, summer seeding surveys, stream temperature data logging at log structures and adult spawning salmon surveys. Other work has also been conducted in Little Wolf Creek and monitored by Roseburg Bureau of Land Management (BLM). Brush Creek and BTF were originally chosen as monitoring sites in the mid 1990 s since they are similar in characteristics, and Brush was originally the treatment stream for restoration projects while BTF was used as the control. Limiting factor analysis showed that both streams lacked adequate spawning gravels and winter habitat. 6
9 Later in the 1990 s, it was determined that summer deep pool habitats were lacking. A 1993 aquatic habitat survey (AQI 1993) found the middle reaches of BTF to be lacking in spawning gravels (<30% in riffles) and local fish biologists felt that it lacked adequate winter refugia, deep summer pools for rearing, and potentially macroinvertebrates. Restoration work in Brush Creek took place from 1995 to 2001 with the primary goal of addressing the lack of spawning gravel in the system and the secondary goal being addressing lack of winter habitat such as alcoves. Since then, Brush Creek work has targeted over-winter habitat, riparian conversions (for future recruitment of LWD), and fish passage (culvert replacements). Big Tom Folley projects (n=11) such as culvert replacements, log and boulder placements, and alder conversions were completed during Brush and BTF were targeted in this long term monitoring project for habitat surveys, rotary screw traps and summer seeding surveys. Mass spawning ground surveys were conducted in Brush Creek from and in BTF from During this habitat effectiveness monitoring project, it is important to note that another ODFW experimental project took place in Brush Creek looking at contributions of unfed fry to wild populations. In 1999, 2000, and 2001, thermal marked unfed coho fry (197,767; 217,495; and 219,753) were released in mid to late March at 20 sites throughout the Brush Creek basin. These fish affected the total population in Brush Creek, comprising 49-57% of the total outmigrating fish in (ODFW unpublished data). Whether these fish supplemented or displaced wild coho out-migrants is unknown but there were no significant differences between the control stream for the project (BTF Creek) and Brush Creek before, during, or after the study for total coho outmigrants or adults. In-stream habitat restoration projects in the Little Wolf Creek and Wolf Creek Basins have been taking place off and on since 1992, with a recent surge of projects during 2008 and 2009 (Figure 9). Both log and boulder structures have been placed by ODFW, PUR and the Roseburg BLM in both of the mainstems of Little Wolf and Wolf Creek and their tributaries. Further restoration is planned for the summer of 2011 by the Roseburg BLM. PUR habitat enhancement projects (boulder and log structures) have been implemented within the Little Wolf Creek and Wolf Creek basins in 2008 and In order to gain more insight as to whether or not restoration efforts improve fish 7
10 populations and address limiting factors in this basin, baseline and post treatment surveys are needed. These recent restoration projects provide a unique opportunity to examine stream and fish responses to log-only and boulder-only in-stream placements. Some pretreatment data exists on these streams for smolt outmigration, summer habitat, spawning adults, summer seeding, channel cross-sections and temperature. Spawn-timing of coho salmon (Oncorhynchus kisutch) for the entire Wolf Creek watershed was also monitored as part of this project. During surveys, barriers to upstream migration were identified and monitored over the course of the winter. These surveys were conducted as part of an ongoing attempt to monitor the response of coho salmon to major stream restoration projects being conducted throughout the basin. This work started in 2001 and was designed to assess the overall affects of habitat enhancement on the basin. The ODFW has used smolt traps in the past to both establish a baseline record and to attempt to determine any response to habitat enhancement through long term monitoring of several sites (Brush and BTF Creeks). Smolt trap data is very useful when combined with other fish survey methods. ODFW has been collecting smolt outmigration data at sites in the Upper Umpqua and Elk Creek watersheds almost continuously for 16 years to monitor yearly trends of coho and steelhead. This Oregon Watershed Enhancement Board (OWEB) grant (# ) added to baseline data and provided funding to continue past monitoring and add new monitoring components. This continuous smolt trap data from Brush, BTF, and Hinkle Creek is important to future efforts to monitor watershed health. Extensive habitat enhancement and fish inventories have been completed within the Hinkle Creek, Brush Creek, and BTF Creek basins. A stream habitat inventory was completed for two Elk Creek tributaries, BTF and Brush Creeks, during the summer and early fall of The objective of the inventories was to provide baseline data on the condition of habitat available for anadromous salmon species, particularly coho salmon. The results of the inventory (presented here) may help identify and prioritize areas for potential salmon habitat enhancement and restoration efforts. Oregon Coastal Coho Salmon Evolutionarily Significant Unit (ESU) Populations of coho salmon which inhabit coastal watersheds between Seaside and Cape Blanco, 8
11 Oregon, have been designated as a single ESU, and have received a great deal of attention by the State of Oregon, federal agencies, and local and private organizations. The formation of the Oregon Plan for Salmon and Watersheds in 1997 prompted extensive conservation efforts by government agencies and nongovernmental entities to restore fish populations throughout Oregon, including those coho salmon populations which constitute the Oregon Coastal Coho ESU. Coho salmon populations in Wolf Creek, BTF Creek and Brush Creek are considered part of the Middle Umpqua Population Unit, a smaller monitoring area within the Oregon Coastal Coho ESU, and have been the focus of significant restoration efforts in recent years. Study Area Elk Creek Watershed The Elk Creek fifth-field watershed encompasses approximately 187,000 acres and is situated in the northwestern portion of the Umpqua River Basin. Elk Creek flows north from its headwaters near Robinson Ridge to the confluence with Salt Creek, where it begins flowing west to the confluence of the Umpqua River near the town of Elkton. The upland portions of the watershed are fairly steep with higher gradient stream channels. However, the Elk Creek Valley becomes significantly wider near Putnam Valley and Yoncalla Valley. About 76% of the Elk Creek watershed is privately owned and nearly one quarter (24%) are public lands, most of which are managed by the BLM. Privately owned timber land is prevalent in the western portion of the watershed, where BTF and Brush Creek are located. However, this region also contains a large percentage of the aforementioned BLM lands. The majority of land cover in the Elk Creek watershed is comprised of coniferous forest and forestry is the predominant land use type, accounting for approximately 81% of the watershed. Approximately 9% of the watershed is apportioned for agriculture and an additional 9% consists of grass and shrub land, used primarily for livestock grazing (Umpqua Basin Explorer 2011). Other land uses, such as industrial and residential, represent about 1% of the watershed. Fish species that inhabit the Elk Creek watershed include chinook salmon (Oncorhynchus tshawytscha), coho salmon (O. kisutch), winter steelhead trout (O. mykiss), and cutthroat 9
12 trout (O. clarki). Coho and winter steelhead spawn in nearly all of the watershed's major tributaries, including BTF Creek, Brush Creek, Pass Creek, Billy Creek, and Yoncalla Creek. Fall chinook salmon spawn in Elk Creek and in the lower reaches of BTF and Brush Creeks. The watershed contains approximately 248 miles of anadromous salmonid streams. Some typical non-native fish species found in the watershed are smallmouth bass (Micropterus dolomieui), brown bullhead (Ameiurus nebulosus), and bluegill (Lepomis macrochirus). Wolf Creek Watershed Wolf Creek is a tributary to the Umpqua River, located approximately 14 miles south of the town of Elkton. This 6 th field watershed has a total drainage area of approximately 23,500 acres. Salmonid fish species that inhabit the Wolf Creek watershed include fall chinook salmon, coho salmon, winter steelhead trout, and cutthroat trout. Coho salmon and winter steelhead spawn in many of the watershed's major tributaries. Calapooya Watershed Hinkle Creek is part of the fifth-field Calapooya Creek watershed that drains a total of 157,282 acres and contains 260 total stream miles. Within the watershed, one hundred and seventy one miles of stream are home to anadromous salmonids. Most of the watershed (98%) is contained in the Umpqua Interior Foothills, while a small portion is made up of the Western Cascades Lowlands and Valleys Ecoregion or the Mid-Coastal Sedimentary Ecoregion. Within the watershed, 64% of the land is public/private forestry and 33% is agricultural (Umpqua Basin Explorer 2011). Land ownership is 91% private with most public lands owned by BLM. The middle portions of the Calapooya watershed consist of streams such as Hinkle Creek, Coon Creek, and Burke Creek that feed directly into the mainstem of the Calapooya. These stream channels have moderate gradients (3% to 12%) with moderately confined valleys and small floodplains (Geyer 2003). The 2003 watershed analysis (Geyer 2003) rated all sections of Hinkle Creek poor for large 10
13 woody debris and riffles. Salmonid fish present in the Calapooya basin include cutthroat trout, fall chinook salmon, coho salmon, and winter steelhead. Methods Seeding Surveys Surveyors snorkeled standard seeding sites that have already been established (to include both control non-treated reaches and treatment reaches) during this study on mainstem and tributary reaches of BTF, Brush Creek, and Wolf Creek in 2008, 2009, and Most standard sites were initially set up as 1000 meter reaches. Only pools that were greater than six square meters and at least 0.40 meters deep were surveyed. For each pool surveyed, pool length in meters from tail out to pool head, mean width in meters, max depth in meters, and water temperature were recorded. Each reach was sampled by the same surveyor to reduce between observer biases. Surveyors snorkeled each pool from the tail out up to the head, targeting counts of coho salmon but also recording other species when reasonable. During 2009, pools were calibrated using estimates derived from multiple passes with backpack electrofishing units. Spawning Surveys In the summer of 2007, PUR staff conducted habitat surveys through the entire Wolf Creek Basin following ODFW habitat typing protocols (AIP 2007). During these field operations, Wolf Creek Basin was broken out into twenty seven individual stream reaches (approximately 18.1 mi) to conduct spawning surveys at, based on channel morphology and other guidelines described in the ODFW habitat typing protocol. The intent of these initial set up surveys was to make sure that all coho salmon spawning habitat in the Wolf Creek basin was surveyed, while Little Wolf Creek basin was surveyed by BLM staff. The twenty seven stream reaches delineated in 2007 were deemed to be suitable coho salmon habitat and were surveyed for spawning fish once every ten days throughout the entire , , and coho salmon spawning seasons (October to February). 11
14 Corvallis ODFW s Oregon Adult Salmonid Inventory & Sampling (OASIS) project was consulted annually to make sure that no survey was double sampled since they also conduct random surveys in Wolf Creek basin. If one of the surveys from this project was being sampled by the OASIS staff, PUR would not survey that year and simply share the data from OASIS for AUC (Area Under the Curve) calculations. Surveys were conducted following the ODFW OASIS protocol (OASIS 2007), except for: no lengths or fish activity were recorded and no biological samples were taken. While the presence of chinook salmon and steelhead were recorded, primary data was only collected on coho salmon. To determine the end of the coho salmon spawning season and ensure a representative sample throughout the duration of the run, surveys were conducted until two weeks after the last live fish was observed in each stream reach. To reduce individual surveyor bias, the two person team alternated surveying the reaches each week throughout the spawning season. Prior to field investigations, landowners were contacted to gain permission to walk the streams that ran through their property. During this time, potential barriers to upstream migration were also identified. All live coho salmon were tallied per reach each survey day. Coho salmon were visually observed to either have an adipose fin or not and were recorded as unmarked (UnMA) or marked (MkA) respectively. Wild fish were determined if the adipose fin was completely intact. Fish that were observed and identified but the presence of an adipose fin was undetermined, were recorded as an unknown (UnKA). Live jack coho salmon were also recorded. All coho salmon carcasses encountered were sexed as either male or female and if this could not be determined, they were recorded as an unknown (UnK). The caudal fins of all carcasses were completely removed by cutting the tail off for the purpose of identifying the fish as being previously counted. Subsequent surveys identified carcasses as either fresh or previously handled (PHA or PHJ). For every survey in each reach, all redds were recorded. Redds were recounted as long as they were still completely discernable. At the request of a project partner, during the season, redds were marked with flags that contained the date in which the redd was first observed. After the survey season was over, the location of each redd was recorded using GPS (NAD 83, accuracy<15 ft) by standing as close as possible to each actual redd location without damaging the redd. Several locations that had potential for 12
15 future habitat restoration projects were also recorded using GPS. Stream surveys were broken down into three separate categories with regards to water clarity. The classification of a one indicated that the entire water column was visible. The classification of a two indicated that some or all of the pools were clouded to an extent beyond clear visual inspection but riffles and pool crest were clear. The classification of a three meant that water quality prevented any visual inspection of the survey reaches. The weather was also recorded for each reach, being labeled as either clear (C), overcast (O), foggy (F), rain (R), snow (S) or partly cloudy (P). For each reach during every survey, the streams flow was described as either low, moderate, high or flooding. Only surveys that had a visibility ranking of a one or two were included in AUC estimates. The goal for frequency of sampling each reach is to keep every survey within a ten day rotation. By surveying every 10 days, the goal is to be consistently counting fish throughout the season to ensure a peak count is recorded for each survey (barring any floods or visibility three surveys). Since 11.3 days represents the average spawning life for coho salmon spawning in survey streams (Willis 1954, Beidler and Nickelson 1980, and Perrin and Irvine 1990), surveying within a ten day rotation [in theory] avoids missing any fish in each reach as long as the surveyor had ideal viewing conditions. During the beginning of the season, survey start and end points were recorded using GPS (NAD 83, accuracy <15 ft). These points were plotted into ARC GIS software in order to determine exact mileages for survey reaches. The survey mileage for each reach was then calculated by selecting the survey reach on the stream layer and summing the shape length in meters, then converting to miles. The BLM provided ARC GIS layer files marking the locations of previous in-stream restoration sites, 2011 planned restoration areas, snorkel survey endpoints, Little Wolf Creek spawning survey endpoints, and Little Wolf Creek redds. This data was used to make detailed maps of the entire Wolf Creek basin. The AUC, which is a calculation estimating coho abundance, was calculated each year surveyed for every survey reach. First, the estimated number of coho within each survey between survey dates was calculated by averaging the total number of coho observed (adults and jacks) in two successive surveys multiplied by the number of days 13
16 between the surveys. The following equation represents the calculation for the estimated number of coho present during a time period: F = ((C1 + C2)/2)(D) where F = estimated number of coho salmon present in a survey reach during a time period, C1 = total number of coho salmon (adults and jacks) observed in one survey, C2 = total number of coho salmon (adults and jacks) observed in the following survey, D = number of days between the two surveys. For example, on November 29, 2010, 12 coho salmon (adults and jacks) were observed in Wolf Creek Reach 5, and 10 coho salmon (adults and jacks) were observed during the next successive survey on December 7, The average daily number of coho salmon estimated to be present between both of those surveys was 11. This number (11) was then multiplied by the total number of days between surveys (8) to determine that there were a total of 88 fish estimated present in Wolf Creek Reach 5 between November 29, 2010 and December 7, For the last survey of the season, the number of days between surveys was always recorded as 7. The estimated number of coho salmon present for each time frame was then summed to determine the total estimated number of coho salmon present for the season within each individual survey reach. The AUC was then calculated for each survey reach by dividing the season total estimated number of coho salmon present in each reach by 11.3 days and then dividing that total by the visibility factor of The 11.3 days represents the average spawning life for coho salmon spawning in survey streams (Willis 1954, Beidler and Nickelson 1980, and Perrin and Irvine 1990). The visibility factor 0.75 is explained by the Mario factor (Solazzi 1984). This was a study that showed surveyors only see 75% of the coho actually present. The estimated spawning density (total coho salmon per mile) was then calculated for each stream reach by dividing the AUC by the stream mileage for each survey reach as determined through ARC GIS. The following equation represents the AUC calculation: 14
17 AUC = (T/L)/V where T = season total estimated number of coho salmon present within each survey reach, L = 11.3 = average spawning life in days for coho salmon spawning in survey streams, V = 0.75 = visibility factor. Basin AUC was calculated by summing AUC estimates for each reach. Basin estimated spawning density (total coho salmon per mile) was also calculated by dividing the basin AUC by the total stream mileage of all the survey reaches. The AUC calculations used in this project were similar to Corvallis OASIS protocol except that we included all surveys in the estimate where Corvallis discards surveys that have more than one gap of days between surveys or have any gaps over 16 days. Rotary Screw Traps Site selection was based on access to streams to place traps, landowner permission, bedrock bottoms or chutes, pool depths greater than 2.5 feet, and stream gradients less than 2 percent (Table 1, Figure 1&2). Table Umpqua Fish District Rotary Screw Trap Locations and Operation Dates. T is township, R is range, and S is section. Trap locations are identified by quarter sections. Trap Site Location (T,R,S) Operation Dates Brush Creek T22S R7W Sec 13 SW/SE March-May Hinkle Creek T24S R3W Sec 31 SW/SW March-May Big Tom Folley T22S R7W Sec 16 SE/NW March-May 15
.")

18 Figure 1. Map of Big Tom Folley Creek, Brush Creek, and Hinkle Creek smolt trap sites. A five foot rotary trap that contains an Archimedes screw built into a screened cone suspended between two pontoons was placed at each site location (Figure 2). The large opening of the cone was placed upstream into stream flows so that water pressure forces the cone to turn on a shaft. Migrating fish enter the large end of the cone and are passed through the trap into a holding box at the back of the trap. Traps were secured using a system of cables and pulleys to allow easy adjustment of traps during fluctuating flow conditions. The traps were operated 24 hours a day, seven days a week and only were not operating if flows were high or debris was jamming the trap. 16
 is just below bedrock cascade above bridge 30 yds. Fish were removed from the holding box and placed in five-gallon buckets.")
19 Figure 2. Brush Creek smolt trap and site (pre-2010). Site was relocated approximately 75 yds downstream in 2010 due to sedimentation at the previous site due to a restoration project and log jam. New site ( ) is just below bedrock cascade above bridge 30 yds. Fish were removed from the holding box and placed in five-gallon buckets. A separate bucket was filled and MS-222 (Tricaine Methanesulfonate) or Alka-Seltzer was added to sedate captured fish. All fish were sedated, to reduce stress and ease handling, then identified, and counted. New salmonids captured were measured (fork length, mm; wet weight, g) each time the trap was operated. During peak migration periods, only 25 salmonids of each species were measured per day, 100 per week, while the remaining fish were enumerated. Fish are only marked each week from Sunday thru Thursday (or until 100 fish per species is reached) with the assumption that the marked fish will clear out of the system by allowing a two day window of no marking on Friday and Saturday each week. All unmarked fish were released downstream of the trap. Nongame fish were also identified to species, counted, and released downstream. Because the rotary trap does not sample 100 percent of the water column, only portions of the downstream juvenile migrants are captured. A variety of factors such as changing stream flows, changing fish size, behavior, and species composition can influence the total migrant population. To accurately estimate downstream juvenile migrants, trap efficiency must be measured on a regular basis. Other smolt trap studies recommend up to 25 fish of each age class are marked and released each day (Jepsen et al. 2006). Typically not enough fish are captured to be marked on a daily basis thus a 17
20 weekly estimate is calculated to estimate salmonid population. To estimate trap efficiency, coho salmon, chinook salmon, cutthroat, and steelhead were marked from Sunday through Thursday each week (or until 100 fish were marked for each species) using a upper or lower caudal fin clip. Marked salmonids were released at a minimum of 100 meters upstream of the trap and allowed to pass by the trap a second time. Recaptured salmonids were recorded and released downstream of the trap. Weekly estimates were calculated by expanding trap catches using the following formula: N i = (n i )/ (m r /m rl ) where N i = weekly total number of migrants passing the trap n i = number of unmarked fish caught in the trap in week (Sunday-Saturday) m r = number of marked fish recaptured in trap in week (Sunday-Saturday) m rl = number of marked fish released above the trap in week (Sunday-Thursday) The total number of fish migrating past the trap site (N total ) for the season is the estimate of summing N i for the season. All marked fish were released within one hour after being marked and during daylight hours. Salmonids were divided into age classes based on fork lengths of fish measured at the time of capture. Criteria used to place fish into age classes were taken from data collected by ODFW on rotary traps in North Coast streams. Adult steelhead (mostly kelts) are occasionally caught in the traps and are included in the summary table but do not go into calculations for population estimate since only juvenile fish are used. 18
21 Table 2. Size classes for salmonids caught in rotary screw traps. Species Fork Length (mm) Coho 0+ < 70 Coho 1+ > 70 CHF 0+ All fall Chinook are 0+ Trout fry < 60 Stw & Ct Stw & Ct Stw & Ct 3+ > 200 Additional life history information was collected during the trap seasons. It is hypothesized that out-migrating salmonids in good physical condition will survive at a higher rate to become adults compared to large numbers of poor conditioned out-migrating smolts. Trap operators collected weight information using a portable scale. Weights were recorded in grams and combined with lengths to estimate an individual condition factor of coho smolts and out-migrating steelhead. Condition factors were calculated using the following formula: K= (100 x W)/ (L/10) ^3 K= Condition Factor W= Weight in grams L= Fork Length in millimeters A new method of calculating a 95 percent confidence interval was used for the smolt trap seasons. The old method used one calculation to find variance using the equation: V= ((X^2)*(Y-Z))/ ((Y+1)*(Z+1)). Where X= the number of estimated migrants, Y= number of new fish captured in the trap, Z=the number of recaptured fish caught in the trap and V= Variance. The confidence interval was determined by the equation: CI= 1.96*(V) (1/2). The new method uses Bootstrap, a program that uses multiple calculations to arrive at a variance and 95% C.I. (Thedinga et al. 1994) by using marked fish, trap efficiency, and estimated population to find each value. The program gives an option of the number of iterations and this study used 1000 iterations when using 19
22 the program. The confidence interval is then determined using the same equation as above CI= 1.96*((V) (1/2) ) except the Bootstrap variance is substituted into the equation. Habitat Surveys The habitat surveys conducted in BTF and Brush Creek follow the methodology presented in Aquatic Inventories Project: Methods for Stream Habitat Surveys (Moore et al. 2008). The surveys were conducted during summer base flows, and surveyors were trained in standardized habitat survey methods by ODFW. These surveys were conducted by a two-person team, beginning on June 30, 2008, and ending on September 29, HABITAT INVENTORY COMPONENTS Channel morphology and valley characteristics (Channel form, Valley form, and Valley Width Index) Water temperature ( C) Stream flow (Empirical observation, based upon entire stream reach - i.e. moderate flow, low flow, etc.) Habitat unit type (Refer to ODFW AIP Manual for complete list and descriptions of habitat unit types) Habitat unit dimensions (Estimated and verified length/wetted width; measured depth) Slope (Percent - maximum of 150% for vertical step unit) Shade (Percent of maximum of 90% per bank) Channel dimensions (Active channel, floodprone, and terrace heights/widths) Substrate composition (Percent total substrate corresponding to silt/organic, sand, gravel, cobble, boulder, and bedrock substrate types - total of 100% per habitat unit) Actively eroding and undercut banks (Combined percentage - maximum of 50% per bank and 100% for left and right banks combined) Large woody debris (Diameter and length classes; excludes live woody material and dead woody material < 0.15 m dbh; length class < 3 m and meeting minimum dbh requirement constitutes a countable root wad; LWD jams consist of 5 or more pieces which meet the size requirements and are in contact with each other in an accumulation; placed wood, or "artificial" wood, is recorded with an "A" after diameter at breast height) Riparian characteristics per zone (Zones 1-3) (Surface type and slope - maximum of 150% slope for vertical hillslope; canopy closure, shrub cover, and grass cover - maximum of 100% for each category; tree count per diameter class - excludes riparian trees < 3 cm dbh) 20
23 Data from the habitat inventory forms are entered into Microsoft Access 2003 (Version ), a common data entry program utilized by ODFW, as well as other agencies and organizations. This program processes the data, and summarizes it in the following reports/tables: Reach report (Valley and Channel Summary, Riparian, Bank, and Wood Summary) Detailed riparian report Riparian summary Habitat unit report (Habitat Detail, Habitat Summary, and Pool Summary) Graphics were produced from the reports using Microsoft Excel 2003 (Version ). Figures created for BTF and Brush Creeks include: Habitat types by percent occurrence Habitat types by percent total length Summary of riparian zone Mean depths of common habitat types Substrate composition in scour pools and low gradient riffles Average number of hardwoods and conifers in the riparian area (per riparian zone) Results Seeding Surveys Pools were surveyed during late August by field staff that were experienced and trained in conducting surveys and identification of juvenile fish. Wolf Creek basin (Figure 3) is surveyed by ODFW, while BLM partners survey four standard reaches on Little Wolf Creek annually. ODFW, in partnership with PUR, surveys BTF (Figure 4) and Brush Creek (Figure 5) when funding and staffing allow and all standard sites were surveyed in 2009 while in 2010 limitations only allowed partial surveys on Brush Creek and no surveys in BTF. In lieu of seeding results, juvenile data is available from rotary screw traps operated in these two basins during

24 Figure 3. Location of coho seeding surveys with start and end points on Wolf Creek and Little Wolf Creek. 22

25 Figure 4. Location of coho seeding surveys with start and end points on Big Tom Folley Creek. 23

26 Figure 5. Location of coho seeding surveys with start and end points on Brush Creek. 24
27 Wolf Creek surveys have been completed during on seven standard reaches (Figure 3). Surveys in 2008 were conducted in late September on a total of 142 pools surveys were conducted in early September on a total of 142 pools surveys were conducted in early September on a total of 127 pools. Differences in number of pools surveyed each year are due to how many pools meet the minimum survey criteria in each reach from year to year. During , Wolf Creek reaches showed no significant difference [F(2, 18) = 0.09, p = 0.91] in average coho density by reach using a one-way analysis of variance (ANOVA). However, coho densities (Figure 6, Appendix 1) in all reaches except for Wolf Creek Reach 1 decreased in summer Wolf Creek Reach 4 is consistently the highest seeded reach of those surveyed. Four of the seven reaches have reached fully seeded levels (>0.7 coho/m 2 ) in two or more years during the project Density (Coho/m 2 in pools) Miner* Rader* Rader Trib A Wolf 1* Wolf 2 Wolf 3 Wolf 4 Figure 6. Density of juvenile coho from surveys conducted in Wolf Creek basin during Reaches with in-stream restoration are denoted with an asterisk. 25

28 Figure 7 shows raw seeding densities for coho in various standard Little Wolf Creek basin reaches from surveys conducted by BLM. Three of the four reaches have been fully seeded in two or more years with the exception of the lowest treatment reach. Figure 7. Density of juvenile coho salmon from surveys conducted in Little Wolf Creek basin during Brush and BTF snorkel surveys were completed from August 11-September 15, 2009 (Appendix 2). A total of 74 pools were surveyed in Brush Creek, 16 pools in Thistleburn (trib of Brush Creek), and 73 pools in BTF and North Fork Tom Folley (trib of BTF). During 2010, the only full reach completed was Brush Creek Reach 3 in which 19 pools were surveyed. A partial survey was done on nine pools in Brush Creek Reach 2 in which 9 pools were surveyed. Big Tom Folley has been under-seeded for coho salmon (Table 3) in both enhancement reaches with the exception of Reach 3 in 2009 (0.877 coho/m 2 ). Control Reach 2 is under-seeded and control Reach 4 has been under-seeded except for 2007 (0.807 coho/m 2 ) and 2009 (0.914 coho/m 2 ). 26
29 Table 3. Big Tom Folley seeding data Reach Type * Enhanced NS 2 Control NS 3 Enhanced NS 4 Control NS *Sites that were electrofished instead of snorkeled. Brush Creek is under-seeded for coho salmon (Table 4) in Reaches 1 & 2 for all years and in Reaches 3 & 4 for all years except 2007 and Table 4. Brush Creek seeding data Reach Type * Enhanced NS 2 Enhanced ** 3 Control Control NS *Sites that were electrofished instead of snorkeled. **Partial survey. A sub-sample of pools during 2009 on Brush (n=22), and BTF (n=25) were calibrated after snorkeling by using multiple pass backpack electrofishing. Brush Creek snorkel counts were an average of 1.72 fish lower than electrofishing passes. BTF snorkel counts had an average deficiency of 8.76 fish when compared to electrofishing passes. Variability between snorkel counts and electrofishing passes ranged up to 81 fish in Brush Creek and up to 74 fish in BTF. Spawning Surveys Spawning surveys were conducted annually from fall 2007 through winter Reach locations and acronyms (Table 5) are visible in Figure 7, and varied year to year depending on what surveys Corvallis was sampling for each year. PUR staff conducted the majority of the surveys in Wolf Creek basin while ODFW OASIS staff surveyed Wolf Creek Reach 3 in the and seasons and Wolf Creek Reaches 3 & 4 and half of Reach 1 in the season. BLM staff annually surveys six reaches in Little Wolf Creek basin. Results are presented by year for each Wolf Creek reach for total number of coho salmon observed (Appendix 3-6), peak number of coho salmon 27
30 observed (Appendix 7), and for both Wolf Creek and Little Wolf Creek AUC estimates (Table 6 & 7). Table 5. Acronyms from Figure 7 associated with spawning ground survey reach names. Reaches with restoration projects highlighted. Start/End point label Survey name W1 Wolf Creek Reach 1 W2 Wolf Creek Reach 2 W3 Wolf Creek Reach 3 W4 Wolf Creek Reach 4 W5 Wolf Creek Reach 5 W6 Wolf Creek Reach 6 M1 Miner Creek Reach 1 M2 Miner Creek Reach 2 M3 Miner Creek Reach 3 WC1 Whiskey Camp Creek Reach 1 WC2 Whiskey Camp Creek Reach 2 CK1 Case Knife Creek Reach 1 CK2 Case Knife Creek Reach 2 R1 Rader Creek Reach 1 R2 Rader Creek Reach 2 R3 Rader Creek Reach 3 R4 Rader Creek Reach 4 R5 Rader Creek Reach 5 R6 Rader Creek Reach 6 WF1 West Fork Rader Creek Reach 1 TA1 Rader Creek Tributary A Reach 1 TA2 Rader Creek Tributary A Reach 2 TA3 Rader Creek Tributary A Reach 3 TA4 Rader Creek Tributary A Reach 4 TA5 Rader Creek Tributary A Reach 5 EF1 East Fork Rader Creek Reach 1 EF2 East Fork Rader Creek Reach 2 28

31 Figure 7. Location of spawning ground surveys in Wolf Creek basin. See Table 5 for description of acronyms. 29
32 Table 6. AUC summary for Wolf Creek Basin from Reaches with restoration are highlighted. Number of Coho Observed AUC AUC Coho/Mile Reach Mileage Number of Coho Observed AUC Coho/Mile Reach Mileage Number of Coho Observed AUC Coho/Mile Reach Mileage Number of Coho Observed AUC Coho/Mile Survey Reach AUC AUC AUC Wolf Creek Wolf Creek Wolf Creek Wolf Creek Wolf Creek Wolf Creek Miner Creek Miner Creek Miner Creek Case Knife Creek Case Knife Creek Whiskey Camp Creek 1 NS NS NS NS Whiskey Camp Creek 2 NS NS NS NS Rader Creek Rader Creek Rader Creek Rader Creek Rader Creek Rader Creek West Fork Rader Creek Rader Creek Trib A * 0* 0.00* 0.03 ** ** ** ** Rader Creek Trib A Rader Creek Trib A Rader Creek Trib A Rader Creek Trib A East Fork Rader Creek East Fork Rader Creek Totals NS = Not surveyed * Incomplete data set ** Rader Trib A1 data combined with Rader Trib A Reach Mileage 30
33 Table 7. AUC Summary for Little Wolf Creek Basin from Reaches with restoration are highlighted. Number of Coho Observed Reach Mileage Number of Coho Observed Number of Coho Observed Number of Coho Observed Survey Reach AUC AUC Coho/Mile AUC AUC Coho/Mile AUC AUC Coho/Mile AUC AUC Coho/Mile Little Wolf Cr Little Wolf Cr Little Wolf Cr Little Wolf Cr Little Wolf Cr Little Wolf Cr Totals
34 Coho salmon spawning surveys for the season started on November 13, 2007 and ran through January 18, The first live coho salmon were observed in the basin on November 23, However, the first freshet of the year was on October 19, 2007 (Figure 8) and because surveys started late this year some fish may have been missed. A total of 38 live adult coho salmon and 6 jacks were observed in the entire basin over the course of the season or roughly 2.6 fish per surveyed stream mile including jacks. There were no live hatchery fish observed in the Wolf Creek drainage; however, 15 coho salmon were unknown as to having an adipose fin or not. Reach specific details are illustrated in Table 6 (Appendix 3 & 7). The last live coho salmon in the basin was observed January 3, Over the course of the spawning season, a total of two coho salmon carcasses (adults and jacks) were recovered, for approximately 0.1 fish carcass per surveyed stream mile. Of these carcasses, one was a male coho salmon and one coho salmon carcass sex was undetermined. All of the carcasses recovered had complete adipose fins and were of wild origin. Of the two carcasses sampled throughout the season none were encountered on subsequent surveys. There were no previously handled jacks encountered. The total peak count of redds for the basin through the season was 60 or roughly 3.5 redds per mile. Of the 27 identified (Figure 7) stream reaches, 17 contained redds, 8 contained no redds observed and two (Whiskey Camp Reaches 1 and 2) were not surveyed due to an impassable barrier below. The highest density of redds was found in Rader Trib A2 with a peak count of 8. Winter steelhead were also observed during the survey season. Four winter steelhead were recorded on Case Knife Creek Reach 2 on December 13, 2007 and 2 were recorded on Rader Creek Reach 4. Coho salmon spawning surveys for the season started on October 28, 2008 and ran through February 3, The first two weeks of surveying were spent clearing trails up the streams, identifying and re-hanging flagging at segment breaks. The first live coho salmon were observed in the basin on November 9, 2008 corresponding with the first freshet of the season (Figure 8). A total of 204 live adult coho salmon and 28 jacks were observed in the entire basin over the course of the season or roughly 12.8 fish per surveyed stream mile including jacks. There were no live hatchery fish observed in the Wolf Creek drainage; however, 51 coho salmon were unknown as to having an 32
35 adipose fin or not. Reach specific details are illustrated in Table 6 (Appendix 4 & 7). The last live coho salmon in the basin was observed January 21, Over the course of the spawning season, a total of 55 coho salmon carcasses (adults and jacks) were recovered, for approximately 3 fish per surveyed stream mile. Of these carcasses, 25 were male coho salmon, 28 were female, 1 was a jack and for one coho salmon carcasses the sex was undetermined. All of the carcasses recovered had complete adipose fins and were deemed to be of wild origin. Of the 55 carcasses sampled throughout the season, only 16 were encountered as PHA on subsequent surveys. There were no previously handled jacks encountered. The total peak count of redds for the basin through the season was 169 or roughly 9.33 redds per mile. Of the 27 identified (Figure 7) stream reaches, 23 contained redds and in the other 4 there were no redds observed. The highest density of redds was found in Radar Creek Reach 4 with a peak count of 26. Coho salmon spawning surveys for the season started on October 5, 2009 and ran through February 2, The first live coho salmon were observed in the basin on November 2, 2009 on Wolf Creek Reach 1 but most surveys did not contain coho salmon until November 23, 2009 which corresponds with the first freshet of the season (Figure 8). A total of 1,090 live adult coho salmon and 19 jacks were observed in the entire basin over the course of the season or roughly 61 fish per surveyed stream mile including jacks. There were no live hatchery fish observed in the Wolf Creek drainage; however, one coho salmon was unknown as to having an adipose fin or not. Reach specific details are illustrated in Table 6 (Appendix 5 & 7). The last live coho salmon in the basin was observed January 21,
36 / / / /11 Discharge (cfs) daily mean /10 10/20 10/30 11/09 11/19 11/29 12/09 12/19 12/29 01/08 01/18 01/28 02/07 Date Figure 8. Little Wolf Creek Discharge (Survey Seasons , , , ). Data collected by USGS at the Little Wolf Creek gauging station. 34
37 Over the course of the spawning season, a total of 263 coho salmon carcasses (adults and jacks) were recovered, for approximately 14.5 fish carcasses per surveyed stream mile. Of these carcasses, 121 were male coho salmon, 128 were female, 5 were jacks and for 9 coho salmon carcasses the sex was undetermined. All of the carcasses recovered had complete adipose fins and were deemed to be of wild origin. Of the 263 carcasses sampled throughout the season 160 were encountered on subsequent surveys. There were no previously handled jacks encountered. The total peak count of redds for the basin through the season was 658 or roughly 36.3 redds per mile. Of the 27 identified (Figure 7) stream reaches, 24 contained redds and in the other 3 there were no redds observed. The highest density of redds was found in Case Knife Creek Reach 1 with a peak count of 87. Fall chinook were also observed during the survey season. One live fall chinook was recorded in the Wolf Creek Reach 3 survey on December 30, Coho salmon spawning surveys for the season started on October 11, 2010 and ran through January 27, The first week of surveying was spent clearing trails up the streams, re-hanging survey signs, verifying site descriptions, and recording GPS points at reach breaks. The first live coho salmon were observed in the basin on October 29, 2010 on the lowest survey, however, most coho salmon were first seen in the majority of the surveys around November 25, 2010 corresponding with the first major freshet of the season (Figure 3). A total of 899 live adult coho salmon and 49 jacks were observed in the entire basin over the course of the season or 52.3 fish per surveyed stream mile including jacks. There were two live hatchery fish observed in the Wolf Creek drainage and 344 coho salmon were unknown as to having an adipose fin or not. Reach specific details are noted in Table 6 (Appendix 6 & 7). The last live coho salmon in the basin was observed January 10, Over the course of the spawning season, a total of 361 coho salmon carcasses (adults and jacks) were recovered, for approximately 19.9 fish carcasses per surveyed stream mile. Of these carcasses, 137 were male coho salmon, 195 were female, 20 were 35
38 jacks and for 9 coho salmon carcasses the sex was undetermined. All of the carcasses recovered had complete adipose fins and were deemed to be of wild origin. Previously handled adults were encountered 480 times and previously handled jacks were encountered 13 times on subsequent surveys. The total peak count of redds for the basin through the season was 981 or roughly 54.1 redds per mile. Of the 27 identified (Figure 7) stream reaches all but one survey (Rader Creek Trib A4) contained redds. The highest redd densities were found in Case Knife Creek Reach 1 with a peak count of 127 and Rader Creek Reach 4 with a peak of 125. Fall chinook and winter steelhead were also observed in the Wolf Creek Basin during the survey year. Four live fall chinook were recorded in the Wolf Creek Reach 1 survey on October 29, Winter steelhead were observed on multiple surveys in January in the Wolf Creek basin. Ten live winter steelhead were recorded on Miner Creek Reach 1 on January 21, 2011 and eight on January 27, 2011; two on Miner Creek Reach 3 on January 20, 2011; two on Rader Creek Reach 2 on January 24, 2011; five on Rader Creek Reach 3 on January 24, 2011; one on East Fork Rader Creek Reach 1 on January 21, 2011; and one on East Fork Rader Creek Reach 2 on January 11, Restoration work completed by the BLM in Wolf Creek basin was mapped in ArcMap to show distribution of restoration projects within spawning ground survey reaches (Figure 9). In addition to the BLM work in Figure 9, there are also boulder weirs both above and below the confluence of Little Wolf Creek (labeled W2 in Figure 9) in the mainstem Wolf Creek, completed by ODFW & PUR in 2008 and Redds that were flagged in were mapped in ArcMap to show distribution and densities of redds in various spawning ground reaches (Figure 10). Both of these maps exclude Little Wolf basin. Table 6 shows the AUC for coho salmon during each year surveyed for every survey reach in Wolf Creek basin. The AUC and estimated spawning density (coho salmon per mile) were calculated for each individual survey and for the entire basin. The basin AUC for the survey season was 69 determining the estimated spawning density for that year 4.03 coho salmon per mile. The basin AUC for the survey season was 268 determining the estimated spawning density for that year 14.8 coho 36
39 salmon per mile. The basin AUC for the survey season was 1,035 coho salmon, and the estimated spawning density for that year 57.1 coho salmon per mile. The basin AUC for the survey season was 951, and the estimated spawning density for that season coho salmon per mile. Table 7 shows the AUC for coho salmon in Little Wolf Creek. The basin AUC for survey season was 17 determining the average estimated spawning density for that year as 2.4 coho salmon per mile. The basin AUC for was 208 with a spawning density of 29.5 coho salmon per mile. The basin AUC for was 655 with a spawning density of 95 coho salmon per mile. This year s AUC was 555 with a spawner density of 82.6 coho salmon per mile. 37

40 Figure 9. Locations of previous in-stream habitat restoration projects in Wolf Creek basin. 38
41 Figure coho salmon redd distribution. Redd locations were not recorded for surveys done by ODFW (half of Wolf Creek 1; Wolf Creek 3; Wolf Creek 4). 39
42 Rotary Screw Traps Big Tom Folley Creek Coho salmon smolts, winter steelhead (1+, 2+, 3+), and cutthroat (1+, 2+, 3+) were marked to determine trap efficiency, and to generate a population estimate for each species in BTF from Appendix 14 displays salmonid species totals by week, with mortality data. Seasonal population estimates with mark/re-capture data for coho smolts, steelhead (1+, 2+, 3+), and cutthroat (1+, 2+, 3+) are presented by year and species in Appendix 8. Non-game fish that were captured are presented by year in Appendix 11. In 2008, a rotary screw trap was placed in Big Tom Folley Creek on March 25 th and removed on June 7 th. The total number of coho salmon fry captured during 2008 trap operation was 164. Total coho salmon smolts captured were 1,232, with the peak (n=271) occurring in late-april/early-may. There were 935 trout fry captured for the season. Of the older aged steelhead captured, 1+ were the most abundant. There were 268 steelhead 1+ and one steelhead 2+ captured during trap operation. A total of 66 cutthroat trout of various age classes were captured. The 2008 season trap efficiency for coho salmon smolts was For the season, 1,232 coho salmon smolts were captured estimating the Big Tom Folley Creek basin population to be 13,585 with a 95% confidence interval of ± 3,044 fish, which gives an out-migrant estimate ranging from 10,541 to 16,629. The season trap efficiency for steelhead (1+, 2+, 3+) was There were 269 steelhead (1+, 2+, 3+) captured and the population was estimated to be 4,248 with a 95% confidence interval of ± 2,260 fish, which gives an out-migrant estimate ranging from 1,988 to 6,508. The season trap efficiency for cutthroat (1+, 2+, 3+) was There were 66 cutthroat (1+, 2+, 3+) captured estimating the population to be 68 with a 95% confidence interval of ± 85 fish, which gives an out-migrant estimate ranging from 68 to 153. In 2009, a rotary screw trap was placed in Big Tom Folley Creek on March 7 th and removed on June 6 th. The total number of coho salmon fry captured during 2009 trap operation was 699. Total coho salmon smolts captured were 1,620, with the peak (n=648) occurring in late-april. There were 2,513 trout fry captured for the season. Of 40
43 the older aged steelhead captured, 2+ were the most abundant. There were 126 steelhead 1+, 189 steelhead 2+ and 37 steelhead 3+ captured during trap operation. A total of 83 cutthroat trout of various age classes were captured. The 2009 season trap efficiency for coho salmon smolts was For the season, 1,620 coho salmon smolts were captured estimating the BTF basin population to be 7,261 with a 95% confidence interval of ± 1,029 fish, which gives an out-migrant estimate ranging from 6,232 to 8,290. The season trap efficiency for steelhead (1+, 2+, 3+) was There were 354 steelhead (1+, 2+, 3+) captured estimating the population to be 3,636 with a 95% confidence interval of ± 1,389 fish, which gives an out-migrant estimate ranging from 2,247 to 5,025. The season trap efficiency for cutthroat (1+, 2+, 3+) was There were 83 cutthroat (1+, 2+, 3+) captured estimating the population to be 1,297 with a confidence 95% interval of ± 2,197 fish, which gives an out-migrant estimate ranging from 83 to 3,494. In 2010, a rotary screw trap was placed in Big Tom Folley Creek on March 2 nd and removed on June 26 th. The total number of coho salmon fry captured during 2010 trap operation was 569. Total coho salmon smolts captured were 1,512, with the peak (n=319) occurring in late-april. There were 195 trout fry captured for the season. Of the older aged steelhead captured, 1+ were the most numerous. There were 210 steelhead 1+ and eight steelhead 2+ captured during trap operation. A total of 106 cutthroat trout of various age classes were captured. The 2010 season trap efficiency for coho salmon smolts was For the season, 1,512 coho salmon smolts were captured estimating the BTF basin population to be 23,289 with a 95% confidence interval of ± 4,387 fish, which gives an out-migrant estimate ranging from18,902 to 27,676. The season trap efficiency for steelhead (1+, 2+, 3+) was There were 218 steelhead (1+, 2+, 3+) captured estimating the population to be 1,394 with a 95% confidence interval of ± 656 fish, which gives an out-migrant estimate ranging from 738 to 2,050. The season trap efficiency for cutthroat (1+, 2+, 3+) was There were 106 cutthroat (1+, 2+, 3+) captured estimating the population to be 1,271 with a 95% confidence interval of ± 1,933 fish, which gives an out-migrant estimate ranging from 106 to 3,204. Trap operations have been continuous in Big Tom Folley since 1997 and during this time ODFW has been calculating out-migrants per meter to monitor trends and 41
44 compare with Brush Creek. To obtain migrants per meter, the total stream length of coho salmon distribution in BTF was divided by the estimated number of migrants. Table 8 shows both coho salmon and steelhead migrants per meter trends in BTF. In 2008, coho salmon out-migrants per meter of stream were while steelhead out-migrants per meter of stream were In 2009, coho salmon out-migrants per meter of stream were while steelhead out-migrants per meter of stream were In 2010, coho salmon out-migrants per meter of stream were while steelhead out-migrants per meter of stream were The 12 year average (no data was recorded for 2003 and 2004) is coho salmon out-migrants per meter of stream, and the 11 year average (no data was recorded for 1997, 2003, and 2004) for steelhead is out-migrants per meter of stream. Weights and lengths for condition factors were collected for coho salmon smolts, steelhead, and cutthroat during trapping operations. The 2008 BTF season average condition factor for coho salmon smolts was 1.021, ranging from to The 2009 season average condition factor for coho salmon smolts was 1.064, ranging from to The 2010 season average condition factor for coho salmon smolts was 1.061, ranging from to Even with a higher total estimated coho outmigrant population in 2008 and 2010 (13,585 and 23,289) when compared to the average population size of 7,558, condition factors remained high at and when compared to average condition factor of Brush Creek Coho salmon smolts, winter steelhead (1+, 2+, 3+), and cutthroat (1+, 2+, 3+) were marked to determine trap efficiency, and to generate a population estimate for each species in Brush Creek from Appendix 15 displays salmonid species totals by week, with mortality data. Seasonal population estimates with mark/re-capture data for coho salmon smolts, steelhead (1+, 2+, 3+), and cutthroat (1+, 2+, 3+) are presented by year and species in Appendix 9. Non-game fish that were captured are presented by year in Appendix 12. In 2008, a rotary screw trap was placed in Brush Creek on March 25 th and removed on June 7 th. The total number of coho salmon fry captured during 2008 trap 42
45 operation was 38. Total coho salmon smolts captured were 40, with the peak (n=11) occurring in late-march/early-april. There were 151 trout fry captured for the season. Of the older aged steelhead captured, 1+ were the most numerous. There were 286 steelhead 1+ and 26 steelhead 2+ captured during trap operation. A total of 69 cutthroat trout of various age classes were captured. The 2008 season trap efficiency for coho salmon smolts was For the season, 1,948 coho salmon smolts were captured estimating the Brush Creek basin population to be 3,641 with a 95% confidence interval of ± 306 fish, which gives an outmigrant estimate ranging from 3,335 to 3,947. The season trap efficiency for steelhead (1+, 2+, 3+) was There were 354 steelhead (1+, 2+, 3+) captured estimating the population to be 758 with a 95% confidence interval of ± 104 fish, which gives an outmigrant estimate ranging from 654 to 862. The season trap efficiency for cutthroat (1+, 2+, 3+) was There were 69 cutthroat (1+, 2+, 3+) captured estimating the population to be 179 with a 95% confidence interval of ± 72 fish, which gives an outmigrant estimate ranging from 107 to 251. In 2009, the Brush Creek rotary screw trap was placed on March 7 th and removed on June 6 th. The total number of coho salmon fry captured during 2009 trap operation was 884. Total coho salmon smolts captured were 530, with the peak (n=157) occurring in mid-april. There were 336 trout fry captured for the season. Of the older aged steelhead captured, 2+ were the most numerous. There were 52 steelhead 1+, 73 steelhead 2+ and 19 steelhead 3+ captured during trap operation. A total of 23 cutthroat trout of various age classes were captured. The 2009 season trap efficiency for coho salmon smolts was For the season, 530 coho salmon smolts were captured estimating the Brush Creek basin population to be 2,905 with a 95% confidence interval of ± 561 fish, which gives an outmigrant estimate ranging from 2,344 to 3,466. The season trap efficiency for steelhead (1+, 2+, 3+) was There were 144 steelhead (1+, 2+, 3+) captured estimating the population to be 1,035 with a 95% confidence interval of ± 721 fish, which gives an outmigrant estimate ranging from 314 to 1,756. The season trap efficiency for cutthroat (1+, 2+, 3+) was There were 23 cutthroat (1+, 2+, 3+) captured estimating the population to be 320 with a 95% confidence interval of ± 286 fish, which gives an outmigrant estimate ranging from 34 to
46 In 2010, a rotary screw trap was placed in Brush Creek on March 2 nd and removed on June 26 th. The total number of coho salmon fry captured during 2010 trap operation was 1,441. Total coho salmon smolts captured were 1,448, with the peak (n=221) occurring in early-march. There were 145 trout fry captured for the season. Of the older aged steelhead captured, 1+ were the most numerous. There were 284 steelhead 1+, 17 steelhead 2+ and one steelhead 3+ captured during trap operation. A total of 108 cutthroat trout of various age classes were captured. The 2010 season trap efficiency for coho salmon smolts was For the season, 1,448 coho salmon smolts were captured estimating the Brush Creek basin population to be 7,177 with a 95% confidence interval of ± 862 fish, which gives an outmigrant estimate ranging from 6,315 to 8,039. The season trap efficiency for steelhead (1+, 2+, 3+) was There were 302 steelhead (1+, 2+, 3+) captured estimating the population to be 1,434 with a 95% confidence interval of ± 416 fish, which gives an outmigrant estimate ranging from 1,132 to 1,850. The season trap efficiency for cutthroat (1+, 2+, 3+) was There were 108 cutthroat (1+, 2+, 3+) captured estimating the population to be 371 with a 95% confidence interval of ± 116 fish, which gives an outmigrant estimate ranging from 255 to 487. To gain a perspective of the smolt out-migration trends at a watershed level, migrants per stream meter has been calculated in the Brush Creek basin since To obtain migrants per meter, the total stream length of coho distribution in Brush Creek is divided by the estimated number of out-migrants. Table 9 shows the migrants per meter for both coho and steelhead. For 2008, coho salmon out-migrants per meter of stream were 0.129, while steelhead out-migrants per meter of stream were For 2009, coho salmon out-migrants per meter of stream were 0.103, while steelhead out-migrants per meter of stream were For 2010, coho salmon out-migrants per meter of stream were 0.255, while steelhead out-migrants per meter of stream were The 15 year average (no data was recorded for 2004) is coho salmon out-migrants per meter of stream, and steelhead out-migrants per meter of stream. Weights and lengths for condition factors were collected for coho salmon smolts, steelhead, and cutthroat during trapping operations. The 2008 Brush Creek season average condition factor for coho salmon smolts was 0.998, ranging from to The 2009 season average condition factor for coho salmon smolts was 1.047, 44
47 ranging from to The 2010 season average condition factor for coho salmon smolts was 1.068, ranging from to Hinkle Creek Coho salmon smolts, winter steelhead (1+, 2+, 3+), and cutthroat (1+, 2+, 3+) were marked to determine trap efficiency, and to generate a population estimate for each species in Hinkle Creek from Appendix 16 displays salmonid species totals by week, with mortality data. Seasonal population estimates with mark/re-capture data for coho salmon smolts, steelhead (1+, 2+, 3+), and cutthroat (1+, 2+, 3+) are presented by year and species in Appendix 10. Non-game fish that were captured are presented by year in Appendix 13. In 2009, a rotary screw trap was placed in Hinkle Creek on March 7 th and removed on June 6 th. The total number of coho salmon fry captured during 2009 trap operation was 681. Total coho salmon smolts captured were 221, with the peak (n=43) occurring in early-may. There were 506 trout fry captured for the season. Of the older aged steelhead captured, 1+ were the most numerous. There were 45 steelhead 1+, 17 steelhead 2+ and 7 steelhead 3+ captured during trap operation. A total of 13 cutthroat trout of various age classes were captured. The 2009 season trap efficiency for coho salmon smolts was For the season, 221 coho salmon smolts were captured estimating the Brush Creek basin population to be 867 with a 95% confidence interval of ± 354 fish, which gives an outmigrant estimate ranging from 513 to 1,221. The season trap efficiency for steelhead (1+, 2+, 3+) was There were 69 steelhead (1+, 2+, 3+) captured estimating the population to be 750 with a 95% confidence interval of ± 1,228 fish, which gives an outmigrant estimate ranging from 750 to 1,978. The season trap efficiency for cutthroat (1+, 2+, 3+) was There were 13 cutthroat (1+, 2+, 3+) captured estimating the population to be 89 with a 95% confidence interval of ± 84 fish, which gives an outmigrant estimate ranging from 13 to 173. To gain a perspective of the smolt out-migration trends at a watershed level, migrants per stream meter has been calculated in the Hinkle Creek basin since To obtain migrants per meter, the total stream length of coho salmon distribution in Hinkle Creek is divided by the estimated number of out-migrants. Table 10 shows the migrants 45
48 per meter for both coho salmon and steelhead. For 2008, coho salmon out-migrants per meter of stream were 0.215, while steelhead out-migrants per meter of stream were For 2009, coho salmon out-migrants per meter of stream were 0.148, while steelhead out-migrants per meter of stream were The 8 year average is coho salmon out-migrants per meter of stream, and steelhead out-migrants per meter of stream. Weights and lengths for condition factors were collected for coho salmon smolts, for steelhead and for cutthroat during 2009 trapping operations. The 2009 season average condition factor for coho salmon smolts was 1.057, ranging from to
49 Table 8. Big Tom Folley Creek coho salmon and steelhead (1+, 2+, 3+) Smolt Population Estimates Seasonal Trap Efficiency Est. Stream Length (m) Migrants per meter Stream Year Species Age Class Number Captured Estimated Migrants Average K factor BTF 1997 Coho Smolt ,826 35, BTF 1998 Coho Smolt ,016 35, BTF 1999 Coho Smolt , BTF 2000 Coho Smolt ,637 35, BTF Coho Smolt ,926 6,636 35, BTF ,2 Coho Smolt ,207 35, BTF Coho Smolt BTF ,3 Coho Smolt BTF Coho Smolt ,223 13,803 35, BTF Coho Smolt ,336 5,163 35, BTF 2007 Coho Smolt ,428 11,864 35, BTF 2008 Coho Smolt ,232 13,585 35, BTF 2009 Coho Smolt ,620 7,261 35, BTF 2010 Coho Smolt ,512 23,289 35, Seasonal Trap Efficiency Est. Stream Length (m) Migrants per meter Stream Year Species Age Class Number Captured Estimated Migrants BTF 1997 STW 1+,2+,3+ BTF 1998 STW 1+,2+, , BTF 1999 STW 1+,2+, , BTF 2000 STW 1+,2+, ,868 35, BTF STW 1+,2+, ,503 35, BTF ,2 STW 1+,2+, , BTF STW 1+,2+,3+ BTF ,3 STW 1+,2+,3+ BTF STW 1+,2+, ,972 35, BTF STW 1+,2+, , BTF 2007 STW 1+,2+, ,170 35, BTF 2008 STW 1+,2+, ,248 35, BTF 2009 STW 1+,2+, ,636 35, BTF 2010 STW 1+,2+, ,394 35, Stream Enhancement 2 Low Flows caused trap operations to cease during 1 st week of May 3 Trap was not operational and wasn t installed 4 Drought winter, only a couple of two year flood events 5 Trap not in until April 47
50 Table 9. Brush Creek coho salmon and steelhead (1+, 2+, 3+) Smolt Population Estimates Highlighted cells indicate years of influence from otolith study outmigrating coho smolts. Stream Year Species Age Class Seasonal Trap Efficiency Est. Number Captured Estimated Migrants Stream Length (m) Migrants per meter Average K factor Brush Coho Smolt ,959 6,236 28, Brush Coho Smolt ,344 28, Brush Coho Smolt ,220 28, Brush Coho Smolt ,231 15,512 28, Brush Coho Smolt , Brush 2000 Coho Smolt ,324 4,980 28, Brush Coho Smolt ,451 2,760 28, Brush 2002 Coho Smolt ,818 3,495 28, Brush 2003 Coho Smolt ,171 3,236 28, Brush 2004 Coho Smolt Brush Coho Smolt ,515 9,508 28, Brush ,3 Coho Smolt ,306 4,937 28, Brush 2007 Coho Smolt ,732 2,086 28, Brush 2008 Coho Smolt ,948 3,641 28, Brush 2009 Coho Smolt ,905 28, Brush 2010 Coho Smolt ,448 7,177 28, Stream Year Species Age Class Seasonal Trap Efficiency Est. Number Captured Estimated Migrants Stream Length (m) Migrants per meter Brush STW 1+,2+, ,200 Brush STW 1+,2+, ,200 Brush STW 1+,2+, ,200 Brush STW 1+,2+, ,249 28, Brush STW 1+,2+, , Brush 2000 STW 1+,2+, , Brush STW 1+,2+, , Brush 2002 STW 1+,2+, , Brush 2003 STW 1+,2+, , Brush 2004 STW 1+,2+,3+ Brush STW 1+,2+, , Brush ,3 STW 1+,2+, , Brush 2007 STW 1+,2+, , Brush 2008 STW 1+,2+, , Brush 2009 STW 1+,2+, ,035 28, Brush 2010 STW 1+,2+, ,434 28, Stream Enhancement 2 Drought winter, only a couple of two year flood events 3 Trap not installed until April 48
51 Table 10. Hinkle Creek coho salmon and steelhead (1+, 2+, 3+) Smolt Population Estimates Seasonal Trap Efficiency Est. Stream Length (m) Migrants per meter Stream Year Species Age Class Number Captured Estimated Migrants Hinkle 2002 Coho Smolt ,063 2,428 5, Hinkle 2003 Coho Smolt ,799 5, Hinkle 2004 Coho Smolt ,019 5, Hinkle 2005 Coho Smolt ,182 5, Hinkle 2006 Coho Smolt , Hinkle 2007 Coho Smolt ,137 5, Hinkle 2008 Coho Smolt ,254 5, Hinkle 2009 Coho Smolt , Seasonal Trap Efficiency Est. Stream Length (m) Migrants per meter Stream Year Species Age Class Number Captured Estimated Migrants Hinkle 2002 STW 1+,2+, , Hinkle 2003 STW 1+,2+, , Hinkle 2004 STW 1+,2+, ,152 5, Hinkle 2005 STW 1+,2+, , Hinkle 2006 STW 1+,2+, , Hinkle 2007 STW 1+,2+, ,068 5, Hinkle 2008 STW 1+,2+, , Hinkle 2009 STW 1+,2+, , Habitat Surveys Big Tom Folley Creek The Big Tom Folley Creek sub-watershed is comprised of mainstem Big Tom Folley Creek and its tributaries. Big Tom Folley Creek's legal description at the confluence with Elk Creek is T22S R07W Sec10. In addition to Big Tom Folley Creek, three tributaries were surveyed: Saddle Butte Creek, North Fork Big Tom Folley Creek, and an unnamed tributary that will be referred to in this report as Tributary A. Habitat inventories in the Big Tom Folley Creek sub-watershed were conducted from June 30, 2008, through August 27, Big Tom Folley Creek was primarily constrained by terraces, with a mean Valley Width Index (VWI) of 6.2 (VWI Range = ). The most frequently occurring habitat unit types were 43% scour pools, 29% riffles and 10% glides (Figure 9). The 49
52 most prevalent habitat unit types by percent total length were scour pools at 40%, riffles 32 %, glides 9%, and boulder cascades 7.6% (Figure 10). Mean depths of predominant habitat unit types were 0.51 meters for scour pools, 0.08 meters for riffles, 0.19 meters for glides, and 0.07 meters for cascades (Figure 11). Pool frequency (channel widths/pool) was 6.9 and mean residual pool depth (RPD) was 0.47 meters. There were approximately 28 pools per mile, and 15 pools 1 meter depth. Water temperatures in Big Tom Folley Creek ranged from C, and there was approximately 2,719 meters of secondary channels. Habitat types by percent occurrence Percent Occurrence IP BW BP LP & SP GL RI RP CB Habitat Type RR Step DU PD Brush Creek BTF Creek Figure 9. Habitat types by percent occurrence in Big Tom Folley Creek and Brush Creek. Refer to ODFW AIP Manual for complete list and descriptions of habitat unit types. 50
53 Habitat types by percent total length Percent Total Length IP BW BP LP & SP GL RI RP Habitat Type CB RR DU PD Brush Creek BTF Creek Figure 10. Habitat types by percent total stream channel length in Big Tom Folley Creek and Brush Creek. Mean depths of common habitat types Mean Depth (m) BTF Creek Brush Creek IP BW BP LP & SP GL RI RP CB RR PD Habitat Type Figure 11. Mean depths (in meters) of common habitat types in Big Tom Folley Creek and Brush Creek. 51
54 Average substrate composition in scour pools was 10% silt/organic, sand 19%, gravel 29.5%, cobble 10%, boulder 4%, and bedrock 27.5%. Average substrate composition in riffles was 2.5% silt/organic, sand 6%, gravel 47%, cobble 24%, boulder 5.5%, and bedrock 14% (Figure 12). Average substrate composition in glides was 7% silt/organic, sand 12%, gravel 30%, cobble 15%, boulder 6%, and bedrock 30%. Big Tom Folley Creek - Substrate composition in scour pools and low gradient riffles Mean Percent Composition S/O Snd Grvl Cbl Bldr Bdrk Low gradient riffles Scour pools Substrate Type Figure 12. Substrate composition in scour pools (LP and SP habitat unit types) and low gradient riffles (RI and RP habitat unit types with an average slope of %) in Big Tom Folley Creek. The riparian zone (0-30 meters) was dominated by hardwoods, particularly in Zone 1 (0-10 meters) and Zone 2 (10-20 meters). Some larger conifers (50-90 cm dbh) were present, but there were very few conifers greater than 90 cm dbh (Figure 13). Figures 14 and 15 summarize the hardwoods and conifers by diameter class within each distinct riparian zone along Big Tom Folley Creek. 52
55 Big Tom Folley Creek - Summary of riparian zone (0-30 m) extrapolated to 1000 feet along stream (Total / 1000 ft) Hardwoods Conifers Conifers > 20 in. dbh Conifers > 35 in. dbh Figure 13. Summary of hardwoods and conifers in riparian Zones 1-3 (Distance of 0-30 meters from the edge of the active channel on both the left and right bank, perpendicular to the stream channel) extrapolated to 1000 feet along Big Tom Folley Creek. Big Tom Folley Creek - Hardwoods 7 Total / 100 m > 90 cm dbh cm dbh cm dbh cm dbh 3-15 cm dbh 0 Zone 1 (0-10 m) Zone 2 (10-20 m) Zone 3 (20-30 m) Average number of trees in a 5-meter wide band Figure 14. Summary of hardwoods by diameter class within each distinct riparian zone of Big Tom Folley Creek. 53
56 Big Tom Folley Creek - Conifers 2.5 Total / 100 m > 90 cm dbh cm dbh cm dbh cm dbh 3-15 cm dbh 0 Zone 1 (0-10 m) Zone 2 (10-20 m) Zone 3 (20-30 m) Average number of trees in a 5-meter wide band Figure 15. Summary of conifers by diameter class within each distinct riparian zone of Big Tom Folley Creek. Saddle Butte Creek Saddle Butte Creek was primarily constrained by terraces, with a mean VWI of 4.2 (VWI Range = ). The most frequently occurring habitat unit types were 39% scour pools, 25% riffles and 13% boulder cascades. Mean depths of predominant habitat unit types were 0.44 meters for scour pools, 0.09 meters for riffles, and 0.12 meters for cascades. Mean RPD was 0.4 meters and there was only one pool 1 meter depth. There were 30 step units in Saddle Butte Creek, 19 of which were steps over woody debris accumulations. Water temperature was 15.5 C. Average substrate composition in scour pools was 9.5% silt/organic, sand 32%, gravel 19%, cobble 17.5%, boulder 19%, and bedrock 4%. Average substrate composition in riffles was 6% silt/organic, sand 13%, gravel 42.5%, cobble 25.5%, boulder 6%, and bedrock 7%. Average substrate composition in glides was 6% silt/organic, sand 11%, gravel 41%, cobble 28%, boulder 4%, and bedrock 10%. Riparian Zone 1 (0-10 meters) and Zone 3 (20-30 meters) were dominated by small 54
57 conifers (3-30 cm dbh). There was a low occurrence of larger conifers (> 50 cm dbh) in riparian transects along Saddle Butte Creek. North Fork Big Tom Folley Creek North Fork Big Tom Folley Creek was primarily constrained by alternating terraces and hillslope, with a mean VWI of 4.6 (VWI Range = ). The most frequently occurring habitat unit types were 40% scour pools, 27% riffles, 7.8% boulder cascades, 6.9% glides, and 6.6% dry units. Mean depths of predominant habitat unit types were 0.48 meters for scour pools, 0.12 meters for riffles, 0.18 meters for cascades, and 0.18 meters for glides. Mean RPD was 0.44 meters and there was only one pool 1 meter depth. Water temperatures in North Fork Big Tom Folley Creek ranged from C. Average substrate composition in scour pools was 6% silt/organic, sand 22.5%, gravel 32.5%, cobble 9.5%, boulder 12.5%, and bedrock 17%. Average substrate composition in riffles was 3% silt/organic, sand 14%, gravel 48%, cobble 15.5%, boulder 11%, and bedrock 8.5%. Average substrate composition in glides was 3% silt/organic, sand 16%, gravel 44%, cobble 12%, boulder 9%, and bedrock 16%. The riparian zone (0-30 meters) was dominated by hardwoods, and very few large conifers (> 50 cm dbh) occurred in riparian transects along North Fork Big Tom Folley Creek. Tributary A Big Tom Folley Creek Tributary A Big Tom Folley Creek was primarily constrained by terraces and, with a mean VWI of 4.6 (VWI Range = ). The most frequently occurring habitat unit types were 46% scour pools, 26% riffles, 8.5% boulder cascades, and 8.5% glides. Mean depths of predominant habitat unit types were 0.5 meters for scour pools, 0.08 meters for riffles, 0.12 meters for cascades, and 0.15 meters for glides. Mean RPD was 0.47 meters and there was only one pool 1 meter depth. Water temperature in Tributary A was 15.0 C. Average substrate composition in scour pools was 7% silt/organic, sand 16%, gravel 49%, cobble 16%, boulder 7%, and bedrock 6%. Average substrate composition in riffles was 2% silt/organic, sand 10%, gravel 53%, cobble 26%, boulder 8%, and bedrock 1%. Average substrate composition in glides was 5% silt/organic, sand 16%, 55
58 gravel 51%, cobble 17%, boulder 5%, and bedrock 7%. The riparian zone was dominated by hardwoods, particularly in Zones 1 and 2 (0-20 meters), and there was a low occurrence of large conifers (> 50 cm dbh) in riparian transects along Tributary A. Brush Creek The Brush Creek sub-watershed is comprised of mainstem Brush Creek and its tributaries. In addition to Brush Creek, three tributaries were surveyed: Thistleburn Creek, Squaw Creek, and Blue Hole Creek. Habitat inventories in the Brush Creek subwatershed were conducted from August 26, 2008, through September 29, Brush Creek was predominantly constrained by alternating terraces and hillslope. However, terraces were the main source of channel constraint in two stream reaches and hillslope was the primary source of channel constraint in three other reaches. Mean VWI for Brush Creek was 5.7, with values ranging from The most frequently occurring habitat unit types were 46% scour pools, 17% riffles, and 12% glides (Figure 9). The most prevalent habitat unit types by percent total length were scour pools at 43%, riffles 18%, glides 13%, puddled units 7.8%, boulder cascades 7%, and beaver dam pools 6.5% (Figure 10). Mean depths of predominant habitat unit types were 0.59 meters for scour pools, 0.79 meters for beaver dam pools, 0.1 meters for riffles, 0.2 meters for glides, 0.05 meters for cascades, and 0.15 meters for puddled units (Figure 11). Pool frequency was 6.1 and mean residual pool depth (RPD) was 0.57 meters. There were approximately 24.6 pools per mile, and 25 pools 1 meter depth. Beaver activity in portions of Brush Creek had created large, deep pools, as well as off-channel habitat. Water temperatures ranged from C, and there was approximately 918 meters of secondary channels. Average substrate composition in scour pools was 18% silt/organic, sand 19.5%, gravel 23%, cobble 10%, boulder 10%, and bedrock 19.5%. Average substrate composition in riffles was 6% silt/organic, sand 8.5%, gravel 41%, cobble 17%, boulder 7.5%, and bedrock 20% (Figure 16). Average substrate composition in glides was 7% silt/organic, sand 12%, gravel 30%, cobble 15%, boulder 6%, and bedrock 30%. Average substrate composition in beaver dam pools was 38% silt/organic, sand 24%, gravel 28%, cobble 5%, boulder 1%, and bedrock 5%. 56
59 Brush Creek - Substrate composition in scour pools and low gradient riffles Mean Percent Composition S/O Snd Grvl Cbl Bldr Bdrk Substrate Type Low gradient riffles Scour pools Figure 16. Substrate composition in scour pools (LP and SP habitat unit types) and low gradient riffles (RI and RP habitat unit types with an average slope of %) in Brush Creek. Some larger conifers (50-90 cm dbh) were present, but there was a relatively low occurrence of conifers greater than 90 cm dbh in riparian transects along Brush Creek (Figure 17). Figures 18 and 19 summarize the hardwoods and conifers by diameter class within each distinct riparian zone along Brush Creek. The riparian zone (0-30 meters) was dominated by hardwoods, particularly in Zones 1 and 2 (0-20 meters). 57
60 Brush Creek - Summary of riparian zone (0-30 m) extrapolated to 1000 feet along stream Hardwoods Conifers Conifers > 20 in. dbh Conifers > 35 in. dbh Figure 17. Summary of hardwoods and conifers in riparian Zones 1-3 (Distance of 0-30 meters from the edge of the active channel on both the left and right bank, perpendicular to the stream channel) extrapolated to 1000 feet along Brush Creek. Brush Creek - Hardwoods Total / 100 m Zone 1 (0-10 m) Zone 2 (10-20 m) Zone 3 (20-30 m) Average number of trees in a 5-meter wide band > 90 cm dbh cm dbh cm dbh cm dbh 3-15 cm dbh 58
61 Figure 18. Summary of hardwoods by diameter class within each distinct riparian zone of Brush Creek. Brush Creek - Conifers 2.5 Total / 100 m > 90 cm dbh cm dbh cm dbh cm dbh 3-15 cm dbh 0 Zone 1 (0-10 m) Zone 2 (10-20 m) Zone 3 (20-30 m) Average number of trees in a 5-meter wide band Figure 19. Summary of conifers by diameter class within each distinct riparian zone of Brush Creek. Thistleburn Creek Thistleburn Creek was primarily constrained by alternating terraces and hillslope. However, hillslope was the main source of channel constraint in the upper portions of the stream. Mean VWI for Thistleburn Creek was 3.7, with values ranging from The most frequently occurring habitat unit types were 36 % scour pools, 27% riffles, and 17% glides. The most prevalent habitat unit types by percent total length were riffles at 29%, scour pools 25%, boulder cascades 20%, glides 16%, and puddled units 5%. Mean depths of predominant habitat unit types were 0.48 meters for scour pools, 0.08 meters for riffles, 0.17 meters for glides, 0.08 meters for cascades, and 0.16 meters for puddled units. Pool frequency was 10.4 and mean RPD was 0.45 meters. There were approximately 24.9 pools per mile, and no pools 1 meter depth were documented. 59
62 Water temperatures in Thistleburn Creek ranged from C, and there was approximately 273 meters of secondary channels. Average substrate composition in scour pools was 13.5% silt/organic, sand 33%, gravel 21%, cobble 7.5%, boulder 8%, and bedrock 17%. Average substrate composition in riffles was 6% silt/organic, sand 10%, gravel 42%, cobble 24%, boulder 8%, and bedrock 10%. Average substrate composition in glides was 9% silt/organic, sand 18%, gravel 33%, cobble 12%, boulder 6%, and bedrock 22%. The riparian zone was dominated by hardwoods in Zones 1 and 2 (0-20 meters). There was a high occurrence of conifers in Zone 3, and the entire riparian zone (0-30 meters) was dominated by conifers in the upper reaches of Thistleburn Creek. Larger conifers (50-90 cm dbh) were present, as well as some conifers greater than 90 cm dbh. Squaw Creek Squaw Creek was predominantly constrained by alternating terraces and hillslope. However, terraces were the main source of channel constraint in the lower reaches of Squaw Creek, and hillslope was the primary source of channel constraint in the upper reaches. Mean VWI was 3.9, with values ranging from The most frequently occurring habitat unit types were 36% scour pools, 21% puddled units, and 19% riffles. The most prevalent habitat unit types by percent total length were puddled units at 43%, riffles 21%, scour pools 12%, dry units 12%, and boulder cascades 9%. Mean depths of predominant habitat unit types were 0.41 meters for scour pools, 0.03 meters for riffles, 0.03 meters for cascades, and 0.21 meters for puddled units. Pool frequency was 18.5 and mean RPD was 0.4 meters. There were approximately 18.6 pools per mile, and one pool 1 meter depth. Water temperature in Squaw Creek was 14.0 C, and there was approximately 42 meters of secondary channels. Average substrate composition in scour pools was 17% silt/organic, sand 30%, gravel 35%, cobble 9%, boulder 5%, and bedrock 4%. Average substrate composition in riffles was 1% silt/organic, sand 3%, gravel 62.5%, cobble 23.5%, boulder 1%, and bedrock 9%. Average substrate composition in puddled units was 6% silt/organic, sand 12%, gravel 58%, cobble 17%, boulder 7%, and bedrock 1%. The riparian zone was dominated by small hardwoods (3-15 cm dbh) in Zone 3. There was a high occurrence of conifers in Zones 1 and 2 (0-20 meters) including some 60
63 larger conifers (50-90 cm dbh), which produced a fairly dense canopy. Canopy closure values for Zones 1-3 were 90%, 84%, and 78%, respectively. Blue Hole Creek Blue Hole Creek was primarily constrained by hillslope. Mean VWI was 1.8, with values ranging from The most frequently occurring habitat unit types were 30 % boulder cascades, 26% scour pools, 18% riffles with pockets, steps 9%, and 6.5% puddled units. The most prevalent habitat unit types by percent total length were boulder cascades at 56%, riffles with pockets 29%, scour pools 9%, and puddled units 3%. Mean depths of predominant habitat unit types were 0.48 meters for scour pools, 0.03 meters for riffles with pockets, 0.04 meters for cascades, and 0.03 meters for puddled units. Pool frequency was 27.6 and mean RPD was 0.46 meters. There were approximately 13 pools per mile, and one pool 1 meter depth. Water temperature in Blue Hole Creek was 12.0 C, and there was approximately 21 meters of secondary channels. There were 7 step units in Blue Hole Creek, 5 of which were steps over boulders. Average unit gradient was 7.8%. Average substrate composition in scour pools was 15% silt/organic, sand 21%, gravel 25.5%, cobble 13.5%, boulder 14.5%, and bedrock 10.5%. Average substrate composition in riffles with pockets was 6% silt/organic, sand 6%, gravel 50%, cobble 25%, boulder 7%, and bedrock 6%. Average substrate composition in puddled units was 9% silt/organic, sand 14%, gravel 52%, cobble 17%, boulder 8%, and bedrock 0%. Average substrate composition in boulder cascades was 8% silt/organic, sand 6%, gravel 35%, cobble 28%, boulder 22%, and bedrock 1%. The riparian zone was dominated by small hardwoods (3-15 cm dbh), and vine maple was particularly dense in Zone 1. Very few conifers greater than 30 cm dbh occurred in riparian transects along Blue Hole Creek. However, it should be noted that only two riparian transects were conducted during the survey of Blue Hole Creek, and performing additional transects may yield different results. 61
64 Discussion Seeding Surveys Big Tom Folley sites were set up to do a comparison between habitat restoration sites and non enhanced or control reaches. Brush Creek and Wolf basin sites were selected randomly on each creek to get seeding information for those basins. In general for seeding surveys, a value of 0.7 coho/m 2 is used for fully seeded in pool only snorkeling projects based off observed coho salmon. This number was based on work completed by ODFW (Nickelson 1992) where a value of 1.0 coho/m 2 was determined as fully seeded for Oregon coastal coho salmon streams. Then the 0.7 coho/m 2 value for fully seeded was derived from pool snorkeling by Rodgers et al. (1992) based off the number of fish visually seen by surveyors versus total fish present (Erik Suring, ODFW Corvallis-personal communication). Little Wolf Creek surveys completed by BLM show a similar trend to our Wolf Creek surveys in that 2010 was slightly decreased from recent years in densities of coho salmon per square meter. Since restoration occurred in 2008 for their two treated reaches, we would not expect to see an impact for a few years in increasing juvenile salmonid densities. Wolf Creek seeding surveys have shown low coho salmon densities in the lower two mainstem sites (Wolf Reach 1 & 2). The lower section of Wolf Creek Reach 1 received boulder weirs during summer 2008 and summer 2009 which should start accumulating gravel in the next few years. Wolf Creek Reach 3&4 and Rader Trib A are planned to undergo BLM/PUR helicopter log placements during Wolf Creek Reach 4 has an average seeding level of 1.06 coho salmon per square meter and is exceeding target seeding levels of 0.7. Rader Trib A is currently averaging 0.66 coho salmon per square meter and is almost fully seeded prior to planned restoration. It is too early to detect changes in juvenile densities from in-stream restoration placed in Wolf Creek seeding reaches (Wolf 1, Miner 1, Rader 1), so continued monitoring of these reaches may show any changes in juvenile densities related to certain reaches or overall in the basin. A meta-analysis of relationships between fish densitiy monitoring as affected by in-stream habitat restoration projects notes it may take up to five years post 62
65 installation to see the full effect on salmonids (Whiteway et al. 2010). No pre-project data is available in these reaches, so we will be looking for overall fish densities in coming years to monitor the juvenile coho populations. We do know that adult coho are using these areas with structures for spawning (Figure 10), and as time progresses expect these structures to raise the water level and provide some winter refuge. Wolf Creek Reach 1 is the only seeding survey to increase in fish density from (Figure 6), so although adult fish may not be using the habitat for spawning yet (Figure 37), boulder structures placed by ODFW not shown in Figure 9 but upstream and downstream from point W2 in Figure 9 may by providing some additional summer rearing habitat for juvenile coho from the basin. Whiteway et al. (2010) showed that boulder structures had a larger effect on salmonid densities than did LWD structures, so we expect to see changes in density here as the structure matures. In Brush Creek, habitat structures placed during the 90 s were designed to address the limiting factor of spawning gravel. Pre and post-project surveys were conducted from to look at impacts of habitat structures to fish populations. Most of the older data is not comparable with the more recent data due to lack of specific site locations where surveys were completed. However, we do know that on June 19, 2001, a density of coho/square meter was observed for Reach #2 when surveyed for 577m 2 (about ¼ of currently surveyed reach). In addition, mass adult spawning surveys showed 2.45 coho salmon per mile pre-1998 and 8.93 coho salmon per mile from Three of these years ( ) included 35%-53% of returning adults being from the otolith mark study. We also see an example of this same juvenile density trend in the 1999 restoration site. Therefore, we infer that six years post-treatment, in 2001, the habitat was more seeded than currently which means that some of the structures and substrate collected by those structures washed out. Habitat types in the system may have changed, or overall the amount of available habitat may have changed since original restoration treatments were placed in the mid-90 s. It is also possible to infer that spawning gravel was not the major limiting factor of coho salmon production in Brush Creek. Habitat restoration biology has evolved drastically in the last 10 years and moved from 1-3 cabled logs (cabled to bedrock on the stream floor) to multiple log jam structures that are more keyed into riparian trees. Older cable structures were placed along stream margins to collect gravels and narrow the 63
66 channels, or occassionally creat scout. However, these structures didn t create much habitat complexity or over winter refuge for fish. Multiple log structures also address another limiting factor in Brush Creek of rearing habitat (summer and/or winter). Placement of these larger, multilayered structures (which function at a higher range of water flows), we would expect these newer structures to better sustain higher long term densities of coho salmon. The other potential explanation for the higher seeding in 2001 is that another research project was releasing unfed fry during both 2000 and 2001 which would ve been potentially counted in the 2001 seeding survey. Since the fry were not externally marked there was no way to distinguish these fish from wild fish during snorkel surveys, but we know from mark-recapture data at smolt traps in the basin that these made up 52-57% of outmigrating smolts. Based on this study, wild seeding levels would ve been approximately coho per meter square in 2001 which would be similar to results we saw in this study from Overall, seeding data in Brush has been highly variable with the control reaches remaining close to fully seeded and the enhanced reaches less so. Every other year (in all surveyed reaches) shows a sharp decline in coho salmon seeding. In BTF the control reaches and one of the enhanced reaches have shown a slight downward trend, the one exception is the North Fork Tom Folley reach which is showing an upward trend. The North Fork Tom Folley reach has increased from a low of in 2007 to a high of in 2009 and seeding in this reach has exceeded the control reach since A comparison of seeding levels between BTF and Brush Creek shows that while these two systems are virtually the same in geology, land management, water flows, water temperature, coho salmon populations are reacting differently. In Brush Creek there is sharp variability in seeding levels from year to year while in BTF the variability is much less and the summer seeding seems fairly stable if not slightly increasing. Spawning Surveys Weather and water conditions play a big role in the success of gathering spawning survey data. The greatest movement of fish into their spawning grounds occurs during the raising of water levels and it is common for these events to render survey reaches unsurveyable due to poor visibility and dangerous wading conditions. The optimal time 64
67 to observe live fish is after a high water event when the stream is receding and clearing. Some seasons have better surveying conditions than others and this is something to be taken into consideration when comparing data between reaches and seasons. The Little Wolf Creek discharge data collected by the USGS (Figure 8) will be referred to when discussing water conditions. During all four seasons surveyed in Wolf Creek basin, most of the peak live fish counts occurred from December 20 th through January 14 th following high water events. For the , , and seasons, the majority of the peak fish counts occurred in the month of December (Appendix 7). During , most of the peak fish counts occurred during the first half of January. Although the peaks were approximately during the same time period, the peak counts varied for each year mostly due to stream flows/conditions. The survey season was marked with many high water events. The first major event of the season occurred in mid November with a second following in the first week of December. On December 16, 2007 the water levels again rose and did not subside until the middle of January. As a result, most surveys were not conducted for most of the season. The season had the lowest number of surveys completed for each segment as well as the lowest number of coho salmon and redd counts. This may have been due to the flows throughout the spawning season being too high to survey and thus causing the surveyors to miss peak fish. Peak redd counts may have also been missed due to the high flows washing out redds before surveyors could get back into the creeks to survey. Other adult traps run in the basin by ODFW such as Calapooya adult trap and Winchester Dam ladder that were run continually all season also had relatively low counts in The Umpqua Basin OASIS spawning survey AUC estimates were also lower than normal this season. During the season, the water levels remained low throughout October, November and the first half of December which limited coho salmon passage throughout the Wolf Creek basin. The flows started to rise on December 20, 2008 with a peak at 492 cubic feet per second (cfs) on December 29, 2008 (the average cfs from the start of the season leading up to this event was 10.4) causing many of the surveys to be unsurveyable from December 16, 2008 through January 14, Following the initial high water event, it was 15 to 30 days before any of the surveys were surveyed again. 65
68 Although the fish and redd counts are higher than the previous year, it is likely that the peak counts were missed for both because of the unfavorable surveying conditions. The season, on the other hand, had relatively favorable water conditions and the reaches were surveyable throughout the majority of the season. The season had the lowest average flows of all four survey seasons presented here and the high water events that did occur were moderate enough to allow the observance of peak coho salmon counts shortly after their occurrence. The survey reaches were all surveyed with the highest frequency during this season compared to the other three seasons, and only the lowest reaches in the watershed went over 12 days between surveys. Highest counts for many surveys occurred during 2009 and 2010 field seasons due to good runs of fish and good visibility and conditions for surveying. Rader Creek reaches had the highest numbers of coho observed during this season. Several high water events occurred during the season allowing for fish passage to occur throughout the coho spawning season. The events were spaced apart enough to allow the upper reaches to drop into shape and become surveyable frequently. However, due to five major high water events that occurred in December, several of the lower reaches went 15 to 20 days between surveys. Except for the lowest reaches, most reaches became surveyable within a day or two after a high water event allowing for good conditions in which to observe peak counts. During the season, the survey crew documented seven barriers to upstream migration that either caused delays or prevented the upstream migration of coho salmon altogether in Wolf Creek basin. Many of the barriers only became a problem during low water periods and were passable when flows were sufficient. Each of the barriers continues to be an issue in subsequent seasons and changes that occurred to some of them were documented in the season. The first low flow barrier was noted on Case Knife Creek at the first left bank tributary in Reach 2. The barrier was constructed of logs with a few small boulders and was in a wide valley location. Flow moved around the barrier during large flow events allowing passage. This barrier was significantly altered in the season during a late December high water event that dislodged several logs causing gravel and sediment to wash downstream, making fish passage much easier. After the changes occurred, the first fish of the season were observed above the barrier. 66
69 The second and third barriers occurred in Miner Creek at the Reach 2-3 break and the other approximately 360 feet upstream. The first low flow barrier was constructed of wood and large boulders constrained within a narrow inner gorge. Sediment had built up behind this structure making the feature a 10 foot jump without any jump pool. This structure remained difficult for fish to navigate throughout the spawning season but during high flows, passage was possible. The third barrier just up stream prevented all upstream migration to coho throughout the year. This structure was mostly composed of logs with a few small boulders. Juvenile coho were not observed above this structure indicating that this may have prevented upstream migration in previous years as well. The survey crew did not survey both Whiskey Camp Creek reaches, which is upstream, because of this barrier. During the summer of 2009, Roseburg BLM staff, while conducting restoration work in the basin, altered the log jam, providing access to several miles of good coho habitat. During the season, 56 coho salmon and 99 redds were observed above the recently manipulated log jam, in Miner Creek Reach 3. During the season, 34 fish and 36 redds were observed. Further up in the watershed, where coho salmon had not been previously observed, there were three fish in Whiskey Camp Creek Reach 1 and four fish observed in Whiskey Camp Reach 2. The fourth low water barrier, located approximately 500 feet up Rader Creek Reach 2, is a bedrock cascade that delays fish. This barrier becomes passable at higher flows. The fifth barrier is in Rader Creek tributary A Reach 4 approximately 50 feet from the mouth of this tributary. This structure is composed of wood and large boulders and prevents fish access throughout the entire year. The sixth low flow barrier, located in the middle of East Fork Rader Creek Reach 2, was constructed of logs with a few small boulders. This barrier was in a wide valley location and flow moved around the barrier during large flow events. During a large flow event in mid December 2010 part of the log jam shifted, washing a large amount of gravel and sediment downstream allowing for easy fish passage. The seventh barrier is found at the Radar Creek Reach 5-6 break. This structure is composed mainly of large boulders with large logs mixed into the structure. The barrier is difficult for fish to navigate but is passable during high flows. Barriers in the basin did cause a significant amount of delays and in one case prevented upstream migration for coho altogether. All but one of theses structures 67
70 became passable at some point during the spawning season. With the exception of two structures (Rader Reach 2, and Rader trib. A Reach 4), these structures retained a significant amount of sediment upstream, providing excellent spawning opportunity for coho. During both the and survey seasons, coho were observed past the end of surveys in Rader Creek, West Fork Rader Creek, East Fork Rader Creek, and Wolf Creek, suggesting that the corresponding surveys need to be extended further upstream to better reflect the complete coverage of the coho salmon spawning habitat in the Wolf Creek Basin. Several areas were also noticed to have potential for coho usage including the upper reaches of Miner Creek (upstream of the Whiskey Camp Creek confluence). Extending Miner Creek Reach 3 into this stretch would add 0.5 miles to the total survey. New reaches should be established for the survey season (funding pending) to further extend the coverage of spawning habitat in the Wolf Creek Basin including the Rader Creek tributary that enters Rader Creek at the Rader Reach 2-3 break. This tributary has been surveyed by ODFW in the past (named Rader Creek trib. B) and would add 0.35 miles to the total basin coverage. During the spawning survey season two factors occurred that may have influenced the actual total number of coho salmon in the Wolf Creek basin during the season. One of the factors acted to decrease the overall estimate and the other may have overestimated the total abundance of coho salmon in the basin. During the time period of October 26, 2008 to December 16, 2008, flow conditions remained very low throughout the basin (Figure 8). Surveys were conducted through this time period every 7 to 8 days. However from the peak redd count data in the upper portion of the basin (excluding Wolf Reaches 1-4) it is clear that fish were not observed. For these reaches, the peak count of redds was 36 and there were only 14 live fish observed including jacks and 6 carcasses. This may indicate an overestimation of spawner residence time (Jacobs 2002) potentially due to increased predation during low flow conditions. The second factor took place between December 1, 2008 and December 10, A large pod of coho salmon were observed in the lower portion of the Wolf Creek basin. A total of 97 coho salmon adults and jacks were observed during surveys conducted on December 1. The majority of these fish were in one pool in Wolf Reach 1 (63 fish). Flow conditions dropped over the course of the next week by only a few cubic feet per 68
71 second but live fish numbers dropped dramatically with only 13 live fish, including 12 holding adults and one jack, observed in the entire basin. From December 8-10 there were no new carcasses observed. The overall increase in number of peak redds only increased by 10 redds during the same time period. On December 1, spawning ground surveyors reported that heavy river otter predation was observed. It is likely that a significant number of coho salmon either perished or returned to the mainstem Umpqua River to escape predation until flow conditions increased, which may have resulted in the recounting of a significant number of fish or straying of these fish to other mainstem tributaries. Another factor may have influenced the redd count for the season. All redds were flagged in the season to document redd distribution and abundance. There may have been a bias to call an old redd, a redd later in the season due to a flag guiding surveyors towards redds that in previous years they may have missed and believed it was no longer a redd. This may also have caused the surveyors to over count the number of redds later in the season. Current restoration projects in the Wolf Creek basin are being preformed to increase the amount of spawning and summer/winter habitat in the basin. Much of this work to date has been large wood and rock structure placement. If future monitoring is funded, impacts of these projects to fish abundance can be observed. Throughout the four survey seasons, the highest densities of both live fish and redds were observed most consistently in Case Knife Creek Reach 1 and Rader Creek Reach 4. Both of these reaches were observed to have the most abundant and best spawning habitat of all the reaches surveyed. Both of these reaches maintain ample stream flow for fish passage throughout the duration of the spawning season. The large woody debris that is dispersed throughout both reaches, much of it placed during restoration projects, provides cover for fish and slows down the transport of substrate downstream creating ideal spawning habitat. The lower portion of Case Knife Reach 1, in particular, exhibits several positive changes in response to log structures, including a meandering stream with split channels with an abundance of spawning gravel. Due to its close proximity to the road and its general lack of habitat diversity, Rader Creek has been the focus of numerous habitat enhancement projects including log weirs and structures. Rader Creek Reach 4, being the highest up of the reaches on Rader Creek that have had 69
72 restoration done, is holding back gravel and cobble that fish are utilizing for spawning. Although there are still large stretches of [primarily] bedrock on Rader Creek Reaches 1, 2 and 3, the areas that have good spawning habitat are well utilized. Miner Creek Reaches 1 and 2 have also been the focus of restoration projects including rock weirs and log structures. The streambed in the proximity of the habitat structures on the lower portion of Miner Creek Reach 1, consists of mainly bedrock and loose fine particulates. The habitat in this section is comprised largely of several long pools where few fish are spawning. The middle and upper portions of Miner Creek Reach 1, however, exhibit more diverse habitat and the fish and redd densities reflect this. There are numerous log jams in this section several of which are placed, that are building up material at every high water. Wolf Creek Reaches 1-4, which are below the confluence of Rader Creek, consist primarily of bedrock and fine substrate with very little large woody debris or spawning gravel present. The habitat modifications on these reaches consist mostly of boulder structures and weirs, with a few log placements in Wolf Creek Reach 4. To date, the long slow pools upstream of the boulder weir placements have not accumulated much gravel but are instead accumulating mostly fine substrate and organic material. Gravel deposition behind the boulder weirs on the lower Wolf Creek reaches is expected to be slow since there is more gravel recruitment higher in the watershed and there are numerous log structures in both of the major tributaries to Wolf Creek (Miner Creek and Rader Creek). However, areas that have accumulated suitable gravel are attracting spawning fish such as Miner Creek Reaches 1&2 along with Rader Creek Reaches 1, 2, and 4 (Figures 9 & 10). During the course of the and survey seasons, redd superimposition was quite common, particularly in lower reaches in the system. This is often caused by high densities of spawners or low habitat quantity, quality, or both. Redd superimposition can cause partial to full mortality to previously fertile eggs (Groot and Margolis, 1991). In-stream restoration projects are attempting to solve these issues; however it may be years before the habitat quantity and quality improve enough to lower the occurrence of redd superimposition. The estimated coho salmon spawning densities calculated using the AUC estimates for each survey reach for all four seasons significantly changed each year 70
73 (Tables 6 & 7). Wolf Creek basin results estimated a spawning density of 4.0 fish per mile for the season which increased to 14.8 fish per mile for the season and again dramatically increased to 57.1 fish per mile for the The season data estimated 52.5 fish per mile in Wolf Creek basin which is a slight decrease from the season. The decrease in spawning densities from to may be due to survey conditions in or may be due to the spawning coho populations in The season overall had the best survey conditions with lower flows and clearer visibility. Unfortunately, there is not enough data from surveys in to compare spawning coho salmon populations for Wolf Creek basin. Although the habitat restoration placements may have affected the increased spawning densities from 2007 to 2011, several other factors, such as survey conditions, ocean conditions, fishing pressures and other potential biases, may have also influenced these estimates. With the current data collected, the and seasons can be reasonably compared because the coho were returning from the season. The data shows a high return of spawning coho salmon from the season, which had a very low spawning density, suggesting that the juvenile survival rate was high. This may be partially due to the restoration structures placed in Although these structures did not have time to accumulate gravel, they may have created pools for summer rearing and also helped slow flows and create eddies in the fall and winter of 2008 creating winter refuge. The effects of restoration structures on juvenile survival may be more evident in the next two seasons when the juveniles from and return. Each survey reach from season through season also experienced considerable changes in spawning densities. While in all reaches the spawning density estimates increased from 2007 to 2011, the most prominent increases occurred in nine of the survey reaches. Some of the largest increases occurred in reaches that had habitat restoration sites completed within them (Figure 2). From 2007 until 2011, Case Knife Creek Reach 1 had an average increase of 56.0 fish per mile per year; Rader Creek Reach 4 had an average increase of 53.1 fish per mile per year; and Miner Creek Reach 2 had an average increase of 30.2 fish per mile per year. Again, this may be due to the habitat 71
74 improvement projects increasing the amount of spawning, summer rearing and overwintering habitats, and also other factors previously mentioned. Rader Creek tributary A Reach 5 had an average increase in spawning density of 32.2 fish per mile per year from 2007 until 2010 however has not had any habitat improvement projects placed in the entire stream. This increase is most likely due to beaver activity. There has been a network of beaver dams in the upper half of this reach since 2007 that may have slowed or prevented fish access. Then in December of 2010, after a high water event, a majority of the larger dams dislodged allowing for much easier fish passage. In , there were much higher fish counts in this area than in previous years. Several survey reaches had an increase in coho salmon spawning density from 2007 until 2010 but did not have any habitat improvement projects or other alterations within the stream. Wolf Creek Reach 5 had an average increase in spawning density of 18.7 fish per mile per year; Wolf Creek Reach 6 had an average increase of 22.2 fish per mile per year; Rader Creek Reach 3 had an average increase of 20.5 fish per mile per year; Rader Creek tributary A Reach 3 had an average increase of 28.0 fish per mile per year; and East Fork Rader Creek Reach 2 had an average increase of 21.9 fish per mile per year. Even though there were not any habitat improvement structures within these streams, there were structures placed downstream on the main Wolf Creek tributary, Little Wolf Creek. The juvenile survival rates (summer and winter) may have increased in Wolf Creek basin due to habitat improvement increasing the number of out-migrating smolts to return as adults. The returning coho salmon may have then dispersed into more areas with spawning habitat as a result of increased spawning gravel due to restoration projects throughout the basin. Again other factors previously mentioned may have also influenced the spawning densities. It is difficult to conclude without more historical data on the entire Wolf Creek basin. The Umpqua ESU is separated into four monitoring areas within the Umpqua River basin. Wolf Creek is included in the Middle Umpqua monitoring area. This area includes the mainstem Umpqua and all of the tributaries from just above Elk Creek to the confluence of the North and South Forks of the Umpqua River. The AUC estimates for coho salmon abundance as calculated by OASIS (Figure 20) for the Middle Umpqua 72
75 River in the , , and (preliminary) spawning seasons are 1,587, 4,594, 13,346, and 11,649 respectively. 60,000 Middle Umpqua Umpqua Total 50,000 40,000 30,000 20,000 10, Figure 20. Estimated abundance of wild adult coho salmon spawners (OASIS 2010) for Middle Umpqua and Umpqua Populations. This data concludes that between 5.4% and 12.9% of the spawning coho salmon in the Middle Umpqua monitoring area were estimated to be present in Wolf Creek basin between 2007 and The estimated percentages of Wolf Creek basin coho abundance during the and seasons were higher (12.7% in and 12.9% in ) and more accurate than the previous two seasons (5.4% in and 10.4% in ) possibly due to the stream flows for those years. It is possible that the AUC estimates for the and seasons were underestimated because the surveyors missed surveys during the peak spawning periods (the last 2-3 weeks of 73
76 December) due to poor survey conditions. It can not ultimately be determined that the last 2-3 weeks in December are the peak coho salmon spawning periods for Wolf Creek basin based on only four years of data. However, the and survey seasons had favorable weather conditions and the data shows that this is the peak spawning time. Further years of spawning survey data collected in Wolf Creek basin may prove this theory. The Wolf Creek and Middle Umpqua AUC estimate trends matches that of the other Oregon Coast monitoring areas during the same time period. In the last decade there have been two peaks of coho salmon spawner abundance. From the previous decade, coho salmon abundance increased dramatically from 2001 through 2004, following favorable ocean conditions. Coho salmon abundance then declined in , in a period of reduced ocean survival. The spawner abundance has rebounded in recent years as ocean conditions have once again become favorable. The AUC estimates for coho salmon abundance in the Middle Umpqua monitoring area for the , and seasons, are the highest on record since 1990 ( The AUC estimates calculated for the Wolf Creek basin in all seasons do not take into account the areas that are used by coho salmon but are not surveyed. This issue will be corrected in future survey seasons (funding pending) as some reaches will be extended and new ones will be added. The corrections will give an AUC estimate that better reflects the actual abundance of coho salmon in the Wolf Creek basin. The other streams that comprise the Middle Umpqua monitoring area are influenced by similar water conditions to that of Wolf Creek, therefore they exhibit similar trends in surveying conditions. The AUC estimates calculated for the same four seasons in the Wolf Creek and Little Wolf Creek basins correspond with the Middle Umpqua estimates in terms of general abundance. In chronological order from 2007 to 2010, the AUC estimated coho salmon abundance in Wolf Creek basin are: 69, 268, 1,035 and 951 and in Little Wolf Creek basin are: 17, 208, 655, and 555. The goal is to survey all possible coho habitat and estimate total escapement. However, in 2010 field season it was discovered that approximately 0.6 miles of coho habitat in Little Wolf (Jeff McEnroe, BLM- personal communication 4/13/11), and approximately 1 mile in Wolf Creek is not currently 74
77 included in surveys. This means, total basin AUC is slightly underestimated in If you combine Wolf Creek basin surveys completed by PUR staff with BLM surveys in Little Wolf to get the entire Wolf basin AUC for , estimates are 86, 476, 1690, and 1506 respectively by year which comprises an average of 10.3% of the Middle Umpqua ESU population estimate ( each year. Rotary Screw Traps This concludes the 15 th year of trapping on Brush Creek. The coho salmon smolt out-migration peaks varied for each year from early-march to mid-april while the winter steelhead and cutthroat trout out-migration peaks were usually in late March/early April except for in 2010 when cutthroat out-migration peaked in late May. When compared to the three years prior to 2008, the number of steelhead out-migrants has remained stable. Coho salmon out-migrants, had shown a steady decline from 2005 to 2007, with 2007 having the second lowest out-migrant per meter count in the history of Brush Creek trap operations. However, the number of coho salmon out-migrants has increased since 2007, with 2010 having the third highest out-migrant per meter count in the history of Brush Creek trap operations. The reason for the past decline and most recent increase is unknown at this time, especially with no basin scale spawning surveys having been completed in Brush Creek since However, the downward trend tends to follow the AUC data for the middle Umpqua population (Figure 20). The one anomaly within this 3 year period would be 2005, which was a drought winter, so winter survival rates were very high. Condition factors for coho salmon smolts at Brush Creek remains good indicating that out-migrants who survive the winter freshets are in good condition as they start their migration to the ocean. The three season average condition factor for coho salmon was This was the 12 th year of trap operation in BTF. The trap operated from March 25 th through June 7 th in 2008; March 7 th through June 6 th in 2009; and March 3 rd through June 26 th in The out-migrant peaks for salmonids in 2009 and 2010 were all during the same week in late April (the week of April 19, 2009 to April 25, 2009 and the week of April 18, 2010 to April 24, 2010). In 2008, however, the out-migrant peaks for 75
78 salmonids varied for each species. The coho salmon smolt out-migration peak was in late April/early May; the steelhead out-migration peak was in mid-april; and the cutthroat out-migration peak was in mid-may. Coho salmon smolts in BTF had shown a decline from the 2005 season (drought winter with high survival and a record number of coho salmon smolts) to 2007, but still remained above estimated counts calculated prior to restoration work beginning in the basin (2001). In 2008, the number of coho salmon outmigrants per meter more than doubled from 2007, declined slightly in 2009 and had the highest estimate of coho salmon out-migrants per meter in 2010 in the history of the BTF trap operations. Condition factors for coho salmon smolts in BTF remains good. The three season average condition factor for coho salmon was The number of steelhead out-migrants increased in 2008 and 2009 when compared to the previous 3 years, however drastically declined in 2010 to the lowest out-migrants per meter count since A comparison between Brush Creek and BTF shows that prior to restoration work in BTF the average number of coho salmon out-migrants in Brush Creek was double what out-migrated from BTF (4,920 versus 2,621) from 1997 to Since restoration work was completed in 2003 on BTF, the average number of coho salmon out-migrants from BTF has quadrupled (12,494) while Brush Creek has remained the same (4,784). Steelhead out migrants in BTF have shown little increase pre and post stream habitat enhancement. A one-way ANOVA was used to test for differences between streams, by year, and pre/post restoration in BTF and Brush Creek. There was no significant difference in number of migrants by stream across the project F (1,22)=1.159, p = or by year F (11,12) = 1.114, p = There was a significant difference between pre and post restoration F (1,22) = 5.369, p = 0.030, meaning that combined results from BTF and Brush Creek showed a difference pre and post restoration. Non-game fish species in all the smolt traps have remained constant over the past three years. Speckled dace and red-sided shiner are the dominant nongame fish. Pacific lamprey juveniles (ammocetes) were also numerous, with some brook lamprey and Pacific lamprey adults being caught at Brush Creek and Big Tom Folley. Not much is known about the lamprey juveniles downstream migration patterns. 76
79 Hinkle Creek smolt trap had been operated previously on it s own project. Funding from this project simply paid to finish up the last year of running the trap with the intent to write up a large report on the project at a later time. Funding was never secured for analysis of this data, but the results from are presented in the results section (Table 10). Habitat Surveys A major limiting factor in the production of juvenile coho in streams is the availability of suitable summer and winter rearing habitat. Habitat selection by juvenile coho is primarily based on water velocity and, although to a lesser degree, depth and light intensity also influence habitat selection (Shirvell 1990). Low velocity habitats preferred by juvenile coho include pools, beaver ponds, and off channel habitats. Although there were a sufficient number of pools in BTF and Brush Creek, the amount of off channel habitats such as secondary channels, beaver dam pools, and backwater areas may be inadequate. For example, in recent summer habitat surveys there were approximately 918 meters of secondary channels in mainstem Brush Creek, accounting for only about 4.7% of the total length surveyed. Also, the percent occurrence of backwater (BW) habitat units was very low and totaled 0.34% of habitat surveyed for Brush Creek and 0.53% in BTF. Large woody debris (LWD) creates pool habitats by influencing channel morphology and provides areas of reduced velocity during high stream flows. In coastal streams, the majority of juvenile coho overwinter in deeper pools with adequate cover in the form of woody debris (Scarlett and Cederholm 1984). In addition to creating habitat complexity, LWD also traps fine sediments and facilitates the sorting of stream substrates, which can increase both percent survival to emergence and the availability of spawning gravels for adult coho salmon. LWD is an integral component of stream ecosystems. Riparian areas are the link between aquatic and terrestrial ecosystems, and facilitate bank stability, water temperature regulation, nutrient cycling, and biological production. Riparian transects conducted as part of the habitat inventory of BTF and Brush Creek showed that the riparian zone was often dominated by small hardwoods, and that the density of larger conifers was significantly low. 77
80 LWD in forested streams has been lost primarily by activities such as splash damming, stream cleaning, streamside logging, agricultural conversion, and fire. Studies have indicated that many tributaries in the Elk Creek Watershed, including Big Tom Folley Creek, are lacking LWD. A decrease in recruitment of LWD into streams may have potential adverse effects on the hydrology and ecology of lotic systems and the production of coho in streams. In the last fifteen years, in both the Big Tom Folley Creek and Brush Creek sub-watersheds, the placement of numerous in-stream log structures was intended to augment the natural input of LWD into the streams. Pre-treatment habitat surveys conducted in 1993 in both BTF and Brush Creeks allow comparison on what effects boulder or log placements can have on habitat suitable to fish production. For example, Brush Creek increased average gravel in riffles (spawning habitat) from 1993 (26%) to 2008 (41%), and Thistleburn Creek decreased average fines in riffles (aeration for eggs in redds) from 21.6% in 1993 to 6% in Even with double the spawning gravel, we did not see a substantial increase in coho outmigrants which tells us that gravel was not the limiting factor for fish production. In BTF, NF BTF, and Saddle Butte Creek which had minimal enhancement, stayed stable for average gravel in riffles (45-47% between pre/post surveys), but decreased average fines in riffles by about 6% from Spawning gravel remained stable, which indicated that LWD structures in lower NF BTF and boulder structures on Seneca Lands may have addressed another limiting factor since number of outmigrating coho increased since restoration. Large woody debris increased an average of 30 pieces/100m in Brush Creek and 18 pieces/100m in Thistleburn Creek. LWD decreased 2.5 pieces/100m in BTF, increased 6 pieces/100m in NF BTF, remained the same in Saddle Butte Creek, and increased 4 pieces/100m in BTF Trib A. Overall, the treated stream (Brush Creek) had higher amounts and quality of spawning habitat as well as more substantial increases in LWD which creates rearing habitat for juvenile fish. Whiteway et al. (2010) also showed similar increases in a compilation of data from 211 restoration projects monitoring habitat and fish changes and found that overall, there was significant increased in the number of LWD pieces in rivers but also increased in pool area, channel depth and percent cover. 78
81 Overall Summary The effectiveness of habitat restoration projects for salmonids can be shown by increases in fish production or increases in fish fitness. Also, once the habitat reaches its carrying capacity there will be a limitation of x number of adults can only produce x number of juvenile fish at which increased adult fish may not mean increased juvenile fish since it could be limited by rearing or spawning habitat. Many peer reviewed articles and studies conclude that salmonid abundance typically increases post restoration projects, even if some case studies are not successful due to other environmental variables (Stewart et al. 2009; Whiteway et al. 2010). In addition, it is difficult to distinguish between changes in fish densities resulting from other variables such as ocean survival, recruitment, and redistribution within a basin. Juvenile coho data provides index data at standard sites that hopefully in future years can be an effective way to compare trends in the basin. Seeding surveys are an effective survey technique to cover a lot of ground in different stretches of creek and habitats. However, as we have shown here, the seeding surveys do not detect changes in short periods of time and are prone to surveyor bias. Selecting good pre and post monitoring sites that are not later influenced by new habitat projects or other factors is important in detecting trends. The BTF and Brush Creek project was a long term effectiveness monitoring project designed to look at smolt production and habitats specifically related to restoration work as a control and treatment set up. Results from this study show that enhanced reaches in Brush Creek remained under-seeded years post treatment and that overall it remains less seeded than the control stream (BTF). We believe that this is due to lack of summer and winter habitat for juveniles. In addition, due to the small total mileage affected by installation of habitat projects in Brush Creek, we may not see a measurable change in coho (Minns et al. 1996). Brush Creek is also still heavily dominated by bedrock as shown in habitat surveys so could still benefit from more large wood jam projects. The average number of smolt out-migrants in Brush Creek (pre restoration) was 4,920 and 4,784 post restoration. Although this is an overall increase for the system, the overall returns of coho have increased since pre-restoration, so to directly relate this to increased spawning gravel is difficult. BTF which was set up to be the control stream showed pre-project averages of 2,621 coho and post-project averages of 79
82 12,494 coho. Less miles of restoration but more recent (eg. multiple log jams vs. single log placements) stream habitat improvements to improve over-winter survival have been done in the basin and coho salmon populations have increased in average number but not statistically different from pre-restoration populations. Small increases in coho numbers post treatment in both control and treatment reaches (BTF and Brush), while not statistically different pre/post treatment, make it difficult to make direct correlations to habitat improvements. Many others note this difficulty in showing direct correlations with increases in fish related to habitat restoration projects (Stewart et al. 2009). Spawning surveys and juvenile fish trap data were run as a more long term study to get a better idea of specific basin populations. However, they are expensive to complete due to the number of days and months required to operate the traps. With current budgets, more juvenile information will be collected via seeding surveys rather than smolt traps. Additional Data Appendix 17 of this report is the details from in kind match funding provided by the related project in the North Umpqua funded by PacifiCorp. This report includes data and results used as match for this project to give a more full set of data for the Umpqua. Specific to this project are results from rotary screw traps, seeding, and spawning ground surveys in Calf, Copeland, Soda Springs, and Boulder Creeks. As part of the OWEB grant agreement, information from this project is posted to the NRIMP Data Clearinghouse. Raw data is housed at the ODFW Southwest Regional office. Acknowledgements Funding for this reporting phase of the project was provided by OWEB, US-BLM Challenge Cost Share, and Lone Rock Timber. In kind staff time, training, data analysis and management, report writing, and supervision of field staff was provided by Oregon Department of Fish and Wildlife, Umpqua Watershed District and ODFW Hydro Staff through PacifiCorp match. Thank you to the private landowners, Lone Rock Timber, and Seneca Jones Timber who continually allow permission to conduct this ongoing study. Partners on this project include Roseburg BLM, Partnership for the Umpqua Rivers, OWEB, Corvallis ODFW OASIS project, Lone Rock Timber, and Seneca Jones Timber. 80
83 A note of appreciation to all the field staff throughout the years that have braved all sorts of weather and conditions to make this long term dataset continue with high quality data. Thanks to Laura Jackson, Dave Harris, and co-authors for providing comments and review and to DeWaine Jackson for statistical guidance. References Aquatic Inventories Project Stream survey data reports. Oregon Department of Fish and Wildlife, Corvallis, OR. Aquatic Inventories Project Methods for Stream Habitat Surveys. Oregon Department of Fish and Wildlife, Corvallis, OR. Beidler, W.M., T.E. Nickelson, and A.M. McGie Escapement goals for coho salmon in coastal Oregon streams. Oregon Department of Fish and Wildlife Fish Information Report Portland, OR. 30 p. Geyer, Nancy A Calapooya Creek Watershed Assessment and Action Plan. July, Prepared for the Umpqua Basin Watershed Council, Roseburg, Oregon. Groot, C. and L. Margolis Pacific salmon life histories. University of British Columbia Press, Vancouver. Jacobs, S Calibration of Estimates of Coho Spawner Abundance in the Smith River Basin, Oregon Department of Fish and Wildlife, OPSWOPSW ODFW , Portland, Oregon. Jepsen, D.B., T. Dalton, S.L. Johnson, K.A. Leader, and B.A. Miller Salmonid Life Cycle Monitoring in Western Oregon streams, Monitoring Program Report Number OPSW-ODFW , Oregon Department of Fish and Wildlife, Salem, OR. Minns, C.K., J.R.M. Kelso, and R.G. Randall Detecting the response of fish to habitat alterations in freshwater ecosytems. Canadian Journal of Fisheries and Aquatic Sciences 53(S1): Moore et al Aquatic Inventories Project: Methods for Stream Habitat Surveys (Version 17.1, May 2008). Oregon Department of Fish and Wildlife, Corvallis, OR. Nickelson, T.E., J.D. Rodgers, S.L. Johnson, and M.F. Solazzi Seasonal changes in habitat use by juvenile coho salmon (Oncorhynchus kisutch) in Oregon coastal streams. Canadian Journal of Fisheries and Aquatic Sciences 49: XX. 81
84 Oregon Adult Salmonid Inventory and Sampling Project (OASIS) Coastal Salmon Spawning Survey Procedures Manual. Oregon Department of Fish and Wildlife. Corvallis, OR. Perrin, C.J., and J.R. Irvine A review of survey life estimates as they apply to the area under-the-curve method for estimating the spawning escapement of pacific salmon. Canadian Technical Report of Fisheries and Aquatic Sciences Rodgers, J.D., M.F. Solazzi, S.L. Johnson, and M.A. Buckman Comparison of three techniques to estimate juvenile coho salmon populations in small streams. North American Journal of Fisheries Management 12: Scarlett, W. S., and C. J. Cederholm Juvenile coho salmon fall-winter utilization of two small tributaries of the Clearwater River, Jefferson County, Washington. Pages in J. M. Walton and D. B. Houston, editors. Proceedings of the Olympic Wild Fish Conference. Peninsula College, Port Angeles, Washington. Shirvell, C. S Role of in-stream rootwads as juvenile coho salmon (Oncorhynchus kisutch) and steelhead trout (O. mykiss) cover habitat under varying streamflows. Canadian Journal of Fisheries and Aquatic Sciences 47: Solazzi, M.F Relationship between visual counts of coho, chinook and chum salmon from spawning fish surveys and the actual number of fish present. Oregon Department of Fish and Wildlife, Information Reports (Fish) 84-7, Portland. Stewart, G.B., H. R. Bayliss, D.A. Showler, W.J. Sutherland, and A.S. Pullin Effectiveness of engineered in-stream structure mitigiation measures to increase salmonid abundance: a systematic review. Ecological Applications 19(4): Thedinga, J. F., M. L. Murphy, S. W. Johnson, J. M. Lorenz, and K. V. Koski Determination of salmonid smolt yield with rotary-screw traps in the Situk River, Alaska, to predict effects of glacial flooding. North American Journal of Fisheries Management 14: Umpqua Basin Explorer (January 2011). Whiteway, S.L., P.M. Biron, A. Zimmermann, O. Venter, and J.W.A. Grant Do instream restoration structures enhance salmonid abundance? A meta-analysis. Canadian Journal of Fisheries and Aquatic Sciences 67: Willis, R.A The length of time that silver salmon spent before death on spawning grounds at Spring Creek, Wilson River in Fish Commission of Oregon Research Briefs 5:
85 Appendices Appendix 1. Coho seeding densities (coho/m 2 ) observed in Wolf Creek basin juvenile snorkel surveys from Miner Rader Rader Trib A Wolf Wolf Wolf Wolf
86 Appendix 2. Seeding densities for coho in Big Tom Folley and Brush Creek during Reach Date Pool (n) m 2 sampled Coho Coho/m 2 BTF 1 8/11/ BTF 2 8/12/ BTF 3 8/19/ BTF 4 8/24/ Brush 1 9/9/ Brush 2 8/26/ Brush 3 9/10/ Thistleburn 9/15/
87 Appendix 3. Summary of total fish observed by reach of spawning ground surveys conducted in Wolf Creek basin. Reach Total UnMA Total MkA Live Coho Total UnKA Total Jacks Total live coho Total Male Total Female Carcasses Wolf Creek Wolf Creek Wolf Creek Wolf Creek Wolf Creek Wolf Creek Miner Creek Miner Creek Miner Creek Case Knife Creek Case Knife Creek Rader Creek Rader Creek Rader Creek Rader Creek Rader Creek Rader Creek West Fork Rader Creek Radar Creek Trib A Radar Creek Trib A Radar Creek Trib A Radar Creek Trib A Radar Creek Trib A East Fork Rader Creek East Fork Rader Creek Totals Total Jack Total UnK Total PHA Total PHJ Total Redds 85
88 Appendix 4. Summary of total fish observed by reach of spawning ground surveys conducted in Wolf Creek basin. Reach Total UnMA Total MkA Live Coho Total UnKA Total Jacks Total live coho Total Male Total Female Carcasses Wolf Creek Wolf Creek Wolf Creek Wolf Creek Wolf Creek Wolf Creek Miner Creek Miner Creek Miner Creek Case Knife Creek Case Knife Creek Whiskey Camp Creek Whiskey Camp Creek Rader Creek Rader Creek Rader Creek Rader Creek Rader Creek Rader Creek West Fork Rader Creek Radar Creek Trib A Rader Creek Trib A Radar Creek Trib A Radar Creek Trib A Radar Creek Trib A East Fork Rader Creek East Fork Rader Creek Totals Total Jack Total UnK Total PHA Total PHJ Total Redds 86
89 Appendix 5. Summary of total fish observed by reach of spawning ground surveys conducted in Wolf Creek basin. Reach Total UnMA Total MkA Live Coho Total UnKA Total Jacks Total live coho Total Male Total Female Carcasses Wolf Creek Wolf Creek Wolf Creek Wolf Creek Wolf Creek Wolf Creek Miner Creek Miner Creek Miner Creek Case Knife Creek Case Knife Creek Whiskey Camp Creek Whiskey Camp Creek Rader Creek Rader Creek Rader Creek Rader Creek Rader Creek Rader Creek West Fork Rader Creek Radar Creek Trib A 1& Radar Creek Trib A Radar Creek Trib A Radar Creek Trib A East Fork Rader Creek East Fork Rader Creek Totals Total Jack Total UnK Total PHA Total PHJ Total Redds 87
90 Appendix 6. Summary of total fish observed by reach of spawning ground surveys conducted in Wolf Creek basin. Reach Total UnMA Total MkA Live Coho Total UnKA Total Jacks Total live coho Total Male Total Female Carcasses Wolf Creek Wolf Creek Wolf Creek Wolf Creek Wolf Creek Wolf Creek Miner Creek Miner Creek Miner Creek Case Knife Creek Case Knife Creek Whiskey Camp Creek Whiskey Camp Creek Rader Creek Rader Creek Rader Creek Rader Creek Rader Creek Rader Creek West Fork Rader Creek Radar Creek Trib A Radar Creek Trib A Radar Creek Trib A Radar Creek Trib A Radar Creek Trib A East Fork Rader Creek East Fork Rader Creek Total Jack Total UnK Total PHA Total PHJ Total Redds Totals
91 Appendix 7. Wolf Creek Basin PUR Coho spawning ground peak summaries Survey Name Number of Times Surveyed Peak Fish Date Peak Redds Date Number of Times Surveyed Peak Fish Date Peak Redds Date Number of Times Surveyed Peak Fish Date Peak Redds Date Number of Times Surveyed Wolf Creek /29/ /25/ /1/ /15/ /30/ /14/ /21/ /9/2010 Wolf Creek /29/ /16/ /14/ /28/ /7/ /6/ /5/2011 Wolf Creek /18/ /27/ /21/ /6/ /17/ /26/2011 Wolf Creek /12/ /1/ /15/ /19/ /14/ /23/ /23/2010 Wolf Creek /12/ /12/ /20/ /27/ /29/ /24/2010 Wolf Creek /24/ /20/ /20/ /20/ /20/ /7/ /27/2010 Miner Creek /28/ /18/ /22/ /28/ /28/ /6/ /18/2010 Miner Creek /10/ /10/ /14/ /3/ /19/ /28/ /7/ /23/2010 Miner Creek /10/ /14/ /19/ /28/ /23/ /24/2011 Case Knife /10/ /10/ /4/ /22/ /19/ /28/ /7/ /27/2010 Case Knife /28/ /28/ /4/ /14/ /19/ /28/ /16/ /10/2011 Whiskey Camp 1 NS NS NS NS NS /16/ /24/2011 Whiskey Camp 2 NS NS NS NS NS /16/ /3/2011 Rader Creek /11/ /16/ /20/ /23/ /8/ /6/ /6/2010 Rader Creek /11/ /8/ /8/ /30/ /14/ /6/ /18/2010 Rader Creek /11/ /12/ /8/ /20/ /20/ /6/ /18/2010 Rader Creek /13/ /2/ /5/ /13/ /20/ /20/ /8/ /27/2010 Rader Creek /7/ /5/ /27/ /20/ /4/ /8/ /11/2011 Rader Creek /21/ /4/ /12/ /18/ /18/2010 West Fork Rader Creek /7/ /5/ /13/ /20/ /29/ /18/ /18/2010 Rader Trib A /9/2007 4* 0* * 0* * ** ** ** ** ** /30/ /17/2010 Rader Trib A /9/ /13/ /21/ /21/ /27/ /7/ /24/2010 Rader Trib A /2/ /13/ /21/ /21/ /27/ /7/ /24/2010 Rader Trib A /2/ /21/ Rader Trib A /17/ /24/ /7/ /14/ /20/ /7/ /24/2010 East Fork Rader Creek /10/ /27/ /14/ /5/ /21/ /29/ /8/ /4/2011 East Fork Rader Creek /10/ /5/ /26/ /21/ /29/ /8/ /27/2010 NS = Not surveyed * Incomplete data set ** Rader Trib A1 data combined with Rader Trib A Peak Fish Date Peak Redds Date 89
92 Appendix 8. Population estimates for Big Tom Folley Creek during for coho smolts (A), steelhead (1+, 2+, 3+) (B), and cutthroat (1+, 2+, 3+) (C). A B C Number Number of Number of Estimate Estimated Number Number of Number of Estimate Estimated Number Number of Number of Estimate Estimated 2008 captured fish marked of trap number of Old Bootstrap 2008 captured fish marked of trap number of Old Bootstrap 2008 captured fish marked of trap number of Old Bootstrap in trap (a) marked (b) fish recap efficiency migrants Method in trap (a) marked (b) fish recap efficiency migrants Method in trap (a) marked (b) fish recap efficiency migrants Method 3/26-3/ /26-3/ /26-3/ /30-4/ /30-4/ /30-4/ /6-4/ /6-4/ /6-4/ /13-4/ /13-4/ /13-4/ /20-4/ /20-4/ /20-4/ /27-5/ /27-5/ /27-5/ /4-5/ /4-5/ /4-5/ /11-5/ /11-5/ /11-5/ /18-5/ /18-5/ /18-5/ /25-5/ /25-5/ /25-5/ /1-6/ /1-6/ /1-6/ Total Total Total Variance Variance Variance % CI % CI % CI Number captured in trap (a) Number of fish marked (b) Number of marked fish recap Estimate of trap efficiency Estimated number of migrants Old Method Bootstrap 2009 Number captured in trap (a) Number of fish marked (b) Number of marked fish recap Estimate of trap efficiency Estimated number of migrants Old Method Bootstrap 2009 Number captured in trap (a) Number of fish marked (b) Number of marked fish recap Estimate of trap efficiency Estimated number of migrants Old Method Bootstrap 3/8-3/ /8-3/ /8-3/ /15-3/ /15-3/ /15-3/ /22-3/ /22-3/ /22-3/ /29-4/ /29-4/ /29-4/ /5-4/ /5-4/ /5-4/ /12-4/ /12-4/ /12-4/ /19-4/ /19-4/ /19-4/ /26-5/ /26-5/ /26-5/ /3-5/ /3-5/ /3-5/ /10-5/ /10-5/ /10-5/ /17-5/ /17-5/ /17-5/ /24-5/ /24-5/ /24-5/ /31-6/ /31-6/ /31-6/ Total Total Total Variance Variance Variance % CI % CI % CI Number Number of Number of Estimate Estimated Number Number of Number of Estimate Estimated Number Number of Number of Estimate Estimated 2010 captured fish marked of trap number of Old Bootstrap 2010 captured fish marked of trap number of Old Bootstrap 2010 captured fish marked of trap number of Old Bootstrap in trap (a) marked (b) fish recap efficiency migrants Method in trap (a) marked (b) fish recap efficiency migrants Method in trap (a) marked (b) fish recap efficiency migrants Method 3/3-3/ /3-3/ /3-3/ /7-3/ /7-3/ /7-3/ /14-3/ /14-3/ /14-3/ /21-3/ /21-3/ /21-3/ /28-4/ /28-4/ /28-4/ /4-4/ /4-4/ /4-4/ /11-4/ /11-4/ /11-4/ /18-4/ /18-4/ /18-4/ /25-5/ /25-5/ /25-5/ /2-5/ /2-5/ /2-5/ /9-5/ /9-5/ /9-5/ /16-5/ /16-5/ /16-5/ /23-5/ /23-5/ /23-5/ /30-6/ /30-6/ /30-6/ /6-6/ /6-6/ /6-6/ /13-6/ /13-6/ /13-6/ /20-6/ /20-6/ /20-6/ Total Total Total Variance Variance Variance % CI % CI % CI
93 Appendix 9. Population estimates for Brush Creek during for coho smolts (A), steelhead (1+, 2+, 3+) (B), and cutthroat (1+, 2+, 3+) (C). A B C Number Number of Number of Estimate Estimated Number Number of Number of Estimate Estimated Number Number of Number of Estimate Estimated 2008 captured fish marked of trap number of Old Bootstrap 2008 captured fish marked of trap number of Old Bootstrap 2008 captured fish marked of trap number of Old Bootstrap in trap (a) marked (b) fish recap efficiency migrants Method in trap (a) marked (b) fish recap efficiency migrants Method in trap (a) marked (b) fish recap efficiency migrants Method 3/26-3/ /26-3/ /26-3/ /30-4/ /30-4/ /30-4/ /6-4/ /6-4/ /6-4/ /13-4/ /13-4/ /13-4/ /20-4/ /20-4/ /20-4/ /27-5/ /27-5/ /27-5/ /4-5/ /4-5/ /4-5/ /11-5/ /11-5/ /11-5/ /18-5/ /18-5/ /18-5/ /25-5/ /25-5/ /25-5/ /1-6/ /1-6/ /1-6/ Total Total Total Variance Variance Variance % CI % CI % CI Number captured in trap (a) Number of fish marked (b) Number of marked fish recap Estimate of trap efficiency Estimated number of migrants Old Method Bootstrap 2009 Number captured in trap (a) Number of fish marked (b) Number of marked fish recap Estimate of trap efficiency Estimated number of migrants Old Method Bootstrap 2009 Number captured in trap (a) Number of fish marked (b) Number of marked fish recap Estimate of trap efficiency Estimated number of migrants Old Method Bootstrap 3/8-3/ /8-3/ /8-3/ /15-3/ /15-3/ /15-3/ /22-3/ /22-3/ /22-3/ /29-4/ /29-4/ /29-4/ /5-4/ /5-4/ /5-4/ /12-4/ /12-4/ /12-4/ /19-4/ /19-4/ /19-4/ /26-5/ /26-5/ /26-5/ /3-5/ /3-5/ /3-5/ /10-5/ /10-5/ /10-5/ /17-5/ /17-5/ /17-5/ /24-5/ /24-5/ /24-5/ /31-6/ /31-6/ /31-6/ Total Total Total Variance Variance Variance % CI % CI % CI Number Number of Number of Estimate Estimated Number Number of Number of Estimate Estimated Number Number of Number of Estimate Estimated 2010 captured fish marked of trap number of Old Bootstrap 2010 captured fish marked of trap number of Old Bootstrap 2010 captured fish marked of trap number of Old Bootstrap in trap (a) marked (b) fish recap efficiency migrants Method in trap (a) marked (b) fish recap efficiency migrants Method in trap (a) marked (b) fish recap efficiency migrants Method 3/3-3/ /3-3/ /3-3/ /7-3/ /7-3/ /7-3/ /14-3/ /14-3/ /14-3/ /21-3/ /21-3/ /21-3/ /28-4/ /28-4/ /28-4/ /4-4/ /4-4/ /4-4/ /11-4/ /11-4/ /11-4/ /18-4/ /18-4/ /18-4/ /25-5/ /25-5/ /25-5/ /2-5/ /2-5/ /2-5/ /9-5/ /9-5/ /9-5/ /16-5/ /16-5/ /16-5/ /23-5/ /23-5/ /23-5/ /30-6/ /30-6/ /30-6/ /6-6/ /6-6/ /6-6/ /13-6/ /13-6/ /13-6/ /20-6/ /20-6/ /20-6/ Total Total Total Variance Variance Variance % CI % CI % CI
94 Appendix 10. Population estimates for Hinkle Creek during 2009 for coho smolts (A), steelhead (1+, 2+, 3+) (B), and cutthroat (1+, 2+, 3+) (C) Number captured in trap (a) Number of fish marked (b) A Number of marked fish recap Estimate of trap efficiency Estimated number of migrants Old Method Bootstrap 3/8-3/ /15-3/ /22-3/ /29-4/ /5-4/ /12-4/ /19-4/ /26-5/ /3-5/ /10-5/ /17-5/ /24-5/ /31-6/ Total Variance % CI Number captured in trap (a) Number of fish marked (b) B Number of marked fish recap Estimate of trap efficiency Estimated number of migrants 3/8-3/ /15-3/ /22-3/ /29-4/ /5-4/ /12-4/ /19-4/ /26-5/ /3-5/ /10-5/ /17-5/ /24-5/ /31-6/ Total Old Method Bootstrap Variance % CI Number captured in trap (a) Number of fish marked (b) C Number of marked fish recap Estimate of trap efficiency Estimated number of migrants 3/8-3/ /15-3/ /22-3/ /29-4/ /5-4/ /12-4/ /19-4/ /26-5/ /3-5/ /10-5/ /17-5/ /24-5/ /31-6/ Total Old Method Bootstrap Variance % CI
95 Appendix 11. Non-Game summary for Big Tom Folley Creek rotary screw traps Ammocete Brook Lamprey LN Dace Pacific Lamprey Speckled Dace Umpqua Dace Unknown Dace Redside Shiner Sculpin Sucker Other 3/26-3/ /30-4/ /6-4/ /13-4/ /20-4/ /27-5/ /4-5/ /11-5/ /18-5/ /25-5/ /1-6/ BTF Season Totals Ammocete Brook Lamprey LN Dace Pacific Lamprey Speckled Dace Umpqua Dace Unknown Dace Redside Shiner Sculpin Sucker Other 3/8-3/ /15-3/ /22-3/ /29-4/ /5-4/ /12-4/ /19-4/ /26-5/ /3-5/ /10-5/ /17-5/ /24-5/ /31-6/ BTF Season Totals Ammocete Brook Lamprey LN Dace Pacific Lamprey Speckled Dace Umpqua Dace Unknown Dace Redside Shiner Sculpin Sucker Other 3/3-3/ /7-3/ /14-3/ /21-3/ /28-4/ /4-4/ /11-4/ /18-4/ /25-5/ /2-5/ /9-5/ /16-5/ /23-5/ /30-6/ /6-6/ /13-6/ /20-6/ BTF Season Totals
96 Appendix 12. Non-Game summary for Brush Creek rotary screw traps Ammocete Brook Lamprey LN Dace Pacific Lamprey Speckled Dace Umpqua Dace Unknown Dace Redside Shiner Sculpin Sucker Other 3/26-3/ /30-4/ /6-4/ /13-4/ /20-4/ /27-5/ /4-5/ /11-5/ /18-5/ /25-5/ /1-6/ Brush Season Totals Ammocete Brook Lamprey LN Dace Pacific Lamprey Speckled Dace Umpqua Dace Unknown Dace Redside Shiner Sculpin Sucker Other 3/8-3/ /15-3/ /22-3/ /29-4/ /5-4/ /12-4/ /19-4/ /26-5/ /3-5/ /10-5/ /17-5/ /24-5/ /31-6/ Brush Season Totals Ammocete Brook Lamprey LN Dace Pacific Lamprey Speckled Dace Umpqua Dace Unknown Dace Redside Shiner Sculpin Sucker Other 3/3-3/ /7-3/ /14-3/ /21-3/ /28-4/ /4-4/ /11-4/ /18-4/ /25-5/ /2-5/ /9-5/ /16-5/ /23-5/ /30-6/ /6-6/ /13-6/ /20-6/ Brush Season Totals
97 Appendix 13. Non-Game summary for Hinkle Creek rotary screw trap Brook Lamprey Redside Shiner Pacific Lamprey Speckled Dace Unknown Dace 2009 Ammocete Sucker Sculpin Comments 3/8-3/ /15-3/ /22-3/ /29-4/ /5-4/ /12-4/ /19-4/ Unknown Dace Mort 4/26-5/ /3-5/ /10-5/ /17-5/ /24-5/ /31-6/ Hinkle Season Totals
98 Appendix 14. Weekly salmonid summaries for Big Tom Folly Creek rotary screw traps for Steelhead Smolt Steelhead Kelt Ct 1+ Ct 2+ Ct 3+ Chinook fry Morts % Mort 2008 Coho Fry Coho Smolt Trout Fry St 1+ St 2+ St 3+ 3/26-3/ /30-4/ /6-4/ /13-4/ /20-4/ /27-5/ /4-5/ /11-5/ /18-5/ /25-5/ /1-6/ BTF Season Totals Steelhead Smolt Steelhead Kelt Ct 1+ Ct 2+ Ct 3+ Cutthroat Morts % Mort 2009 Coho Fry Coho Smolt Trout Fry St 1+ St 2+ St 3+ 3/8-3/ /15-3/ /22-3/ /29-4/ /5-4/ /12-4/ /19-4/ /26-5/ /3-5/ /10-5/ /17-5/ /24-5/ /31-6/ BTF Season Totals Steelhead Smolt Steelhead Kelt Ct 1+ Ct 2+ Ct Coho Fry Coho Smolt Trout Fry St 1+ St 2+ St 3+ 3/3-3/ /7-3/ /14-3/ /21-3/ /28-4/ /4-4/ /11-4/ /18-4/ /25-5/ /2-5/ /9-5/ /16-5/ /23-5/ /30-6/ /6-6/ /13-6/ /20-6/ Chinook fry Morts % Mort BTF Season Totals
99 Appendix 15. Weekly salmonid summaries for Brush Creek rotary screw traps Coho Fry Coho Smolt Trout Fry St 1+ St 2+ St 3+ Steelhead Smolt Steelhead Kelt Ct 1+ Ct 2+ Ct 3+ Chinook fry Morts /26-3/ /30-4/ /6-4/ /13-4/ /20-4/ /27-5/ /4-5/ /11-5/ /18-5/ /25-5/ /1-6/ Brush Season Totals Coho Fry Coho Smolt Trout Fry St 1+ St 2+ St 3+ Steelhead Smolt Steelhead Kelt Ct 1+ Ct 2+ Ct 3+ Chinook fry Morts /8-3/ /15-3/ /22-3/ /29-4/ /5-4/ /12-4/ /19-4/ /26-5/ /3-5/ /10-5/ /17-5/ /24-5/ /31-6/ Brush Season Totals Coho Fry Coho Smolt Trout Fry St 1+ St 2+ St 3+ Steelhead Smolt Steelhead Kelt Ct 1+ Ct 2+ Ct 3+ Chinook fry Morts /3-3/ /7-3/ /14-3/ /21-3/ /28-4/ /4-4/ /11-4/ /18-4/ /25-5/ /2-5/ /9-5/ /16-5/ /23-5/ /30-6/ /6-6/ /13-6/ /20-6/ Brush Season Totals
100 Appendix 16. Weekly salmonid summaries for Hinkle Creek rotary screw traps Coho Coho Trout Steelhead 2009 Fry Smolt Fry St 1+ St 2+ St 3+ smolts Ct 1+ Ct 2+ Ct 3+ Chinook fry Morts % Mort 3/8-3/ /15-3/ /22-3/ /29-4/ /5-4/ /12-4/ /19-4/ /26-5/ /3-5/ /10-5/ /17-5/ /24-5/ /31-6/ Hinkle Season Totals
101 Appendix 17. PacifiCorp Monitoring Match Report 99


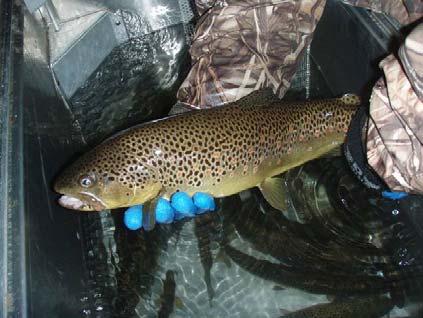
102 SA 19.2 Long-Term Monitoring and Predator Control Study: Annual Report 2009 Produced by the FHS TWG for the RCC Feb 17, 2011
103 Executive Summary The Settlement Agreement (SA) for the North Umpqua Hydroelectric Project requires PacifiCorp to fund a Long Term Monitoring and Predator Control study and program (SA Section 19.2). The purposes of this measure are: 1) to monitor and evaluate the success of the anadromous fish reintroduction in the North Umpqua River upstream of Soda Springs Dam; and (2) to formulate and implement a study plan, implementation plan, and monitoring and adaptive management plan concerning the potential predation of anadromous salmonid juveniles by nonnative predator species in Soda Springs Reservoir. The fund is administered by PacifiCorp and managed by the Resource Coordination Committee (RCC) based on recommendations from a Technical Work Group (TWG). This program of work is guided by a Study Plan approved by the RCC in September The plan specifies that a written annual report be provided to the RCC each March. Per the Study Plan, the 2009 program was overseen by ODFW, who selected and managed three personnel (2 ODFW and 1 PUR) dedicated to this program for most of the year. ODFW continues to provide smolt traps, nets, other equipment, and additional personnel as needed. ODFW conducted all redd surveys except for Copeland Creek which was surveyed by USFS staff. PacifiCorp provided technical assistance, in-kind services such as heavy equipment for smolt trap placement and retrieval, and coordination during river and reservoir sampling. Overall Conditions and Noteworthy Events Flows were average for the spring and early summer in The average snow pack and normal spring temperatures caused flows to drop quickly in Copeland and Calf Creeks. In the Soda Springs bypass, during the month of May, high flows dislodged wood debris which floated into the Soda Springs trap. This wood was short enough to float into the cone and become jammed in the live well causing the cone to stop spinning and the trap to become partially submerged. With the help of Weekly Construction, ODFW personnel were able to pull the trap out of the thalwag and remove the wood. This was the first true test of the new anchor, installed by Weekly Construction during the last week of February, no damage was done to the new anchor even though the boulder anchors on the left bank shifted forward two feet. The cessation of the cone put extra pressure on one of the collars which caused the set screw to slide allowing the cone to begin grinding into the walls of the live well. Efforts were made to shift the cone forward and tighten the set screw but the cone slipped back and by late July enough damage had been done to the live well to threaten its structural integrity. The trap was pulled and sent to Koffler for repairs. Counts at Winchester Dam of adult, unclipped fish indicated that the number of returning spring Chinook salmon to the North Umpqua River doubled the 2008 run. The number of returning coho salmon doubled the 2008 returns, while the number of returning summer and winter steelhead decreased slightly (Table 1). Table1. Counts of Unmarked Adult Salmonids at Winchester Dam, North Umpqua River, OR. Species Year Average Spring Chinook 5,310 2,626 2,430 2,575 4,739 Summer Steelhead 3,701 4,385 2,733 4,347 4,044 Coho 8,233 4,027 1,798 3,338 3,704 Winter Steelhead 7,640 9,041 8,377 6,307 8,629
104 Long-term Monitoring Program Smolt trapping began in early March and concluded during the first week of July at Copeland and Calf Creeks (low flows) and late July at the Soda Springs bypass. Resident fish population estimates were completed from Medicine Creek Bridge to Slide Creek dam and in lower Fish Creek. Three different sampling methods were used to estimate the resident trout populations. Daytime snorkeling was used in Fish Creek, angling was used from Slide Creek power house to Slide Creek dam, and night snorkeling was used in the Slide Creek full flow reach. Coho abundance surveys were completed in Boulder using daytime snorkel surveys. Soda Springs Bypass Reach (juvenile trapping, and adult spawning surveys) Smolt trap weekly efficiencies ranged from 5 to 19% for various species and life stages. The smolt trap catch was dominated by spring Chinook fry followed by trout and coho salmon fry (Table 2). Smolts and older age classes of four species were also captured. Notable to the predator study is that 75 brown trout were captured in the smolt trap, many were observed with trout and salmon fry in their mouths and stomachs. One lavaged brown had a spring Chinook yearling in its stomach contents. Spring Chinook salmon, coho salmon, and steelhead redd counts were conducted through the bypass reach for the sixth year. The peak redd density for spring Chinook salmon (166 redds/mile) is the highest observed in the last six years, while that for coho was similar to past years, and steelhead was lower than past years (Table 3). North Umpqua River Main stem (Soda Springs powerhouse to Calf Cr - spawning surveys only) Redd counts were conducted by float surveys for spring Chinook salmon, coho salmon and steelhead. The peak redd density for spring Chinook salmon was 59.9 redds/mile, which is similar to last years high of 56.9 redds/mile (Table 3). Three of the four surveyed reaches increased in peak redds per mile with the Boulder to Copeland reach showing a decrease from 196 redds/mile to 165 redds/mile. Coho salmon and steelhead live fish and redds are less observable than spring Chinook salmon due to higher flows and sparser distribution. Coho salmon and steelhead redds were observed in all four reaches, with a peak redd density of 13.5 redds/mile for coho salmon and 5.9 redds/mile for steelhead (Table 3). Boulder Creek to Copeland Creek reach had the highest coho salmon redd density at 27.6 redds/mile.. The highest steelhead redd density (6.9 redds/mile) was observed in the Copeland Creek to Deception Creek reach. Boulder Creek (juvenile density and spawning surveys) Summer surveys of juvenile coho density were completed this year. A summer coho salmon density of was calculated for the snorkeled portion of Boulder Creek (mouth to 200 yards above Rattlesnake Creek). Above Rattlesnake Creek juvenile coho salmon were observed in 29 of the 40 pools snorkeled but densities were lower than in the downstream reach. Spring Chinook juveniles were observed in low densities from the mouth upstream 0.5 miles to a large log jam. These are the first spring Chinook juveniles observed while snorkeling in Boulder Creek. One 3+ cutthroat trout was also observed in the survey. Spring Chinook salmon, coho salmon, and steelhead redd counts were made for the ninth year. One Chinook redd was observed at the confluence with the North Umpqua but low flows apparently precluded Chinook to access and spawn further upstream. The total number of observed coho redds (49) was the highest since 2002, and the peak redd density 8.7 redds/mile (Table 3). Coho salmon peak redd densities, since 2001, have ranged from 4.8 to 30.4 redds/mile. Steelhead peak redd densities increased to 6.7 redds/mile up from last years low of 2.7 redds/mile. One survey was completed from Rattlesnake Creek to the barrier below Onion Creek. Steelhead redds (15) were observed as far up as the large trench pool 0.3 miles downstream of Onion Creek.
105 Copeland Creek (juvenile trapping, juvenile density and adult spawning surveys) Weekly smolt trap efficiencies ranged from 9 to 54% for various species and life stages. The smolt trap catch was dominated by trout fry, followed by coho salmon fry and steelhead 1+ (Table 2). Steelhead smolts of varying sizes were captured as well as fifty-one coho salmon smolts, twelve resident rainbow trout, nine cutthroat trout and four brown trout. No summer fish density surveys were conducted in Copeland Creek this year due to higher priority efforts for resident trout population estimates above Soda Springs dam. Redd counts for spring Chinook salmon, coho salmon and steelhead were conducted in Copeland Creek for the sixth, eighth, and ninth years, respectively, by the USFS. No spring Chinook redds were observed in Copeland creek this year, low fall flows did not allow access for spawning adults. Coho salmon improved dramatically from the previous four years, in 2007 the peak density was 2.7 redds per mile compared to 14 redds/mile for (Table 3). Coho salmon peak redd densities, since 2001, have ranged from 2.7 to 17.3 redds/mile. Steelhead peak redd densities (2.5 redds/mile) were up slightly from last years low count (2.1 redds/mile), this was the second lowest total steelhead redd count. Calf Creek (juvenile trapping, juvenile density and adult spawning surveys) During 2009, weekly smolt trap efficiencies ranged from 33 to 71% depending on species and life stage. The smolt trap catch was dominated by steelhead 1+ followed by coho salmon fry and cutthroat trout. Thirty-one coho salmon smolts were captured as well as seven resident rainbow trout and one brown trout. No summer density surveys were conducted in Calf Creek this year due to resident trout population estimates above Soda Springs dam. Coho salmon and steelhead redd counts surveys were conducted for the fourth year and third years respectively. Peak redd density for coho salmon was 8.0 redds/mile and steelhead was 1.8 redds/mile. (Table 3). Coho salmon peak redd densities, since 2006, have ranged from 3.6 to 8.0. Resident population estimates Resident population estimates were completed through the following reaches: (1) Slide Creek full flow reach (2) Slide Creek bypass reach and (3) 3.2 miles of lower Fish Creek. The total length of streams surveyed was 7.3 miles. Slide Creek bypass and full flow reaches To estimate the resident trout population for the Slide Creek bypass reach it was decide to conduct a hook and line (angling) modified Peterson-Chapman mark/recapture sampling effort. Trout were captured using a variety of tackle from Aug 25 th through October 5 th. A total of 354 trout ranging from 3 inches to 13 inches were captured during the sampling, with most in the 5 to 10 inch range. This gives a population estimate for the Slide Creek bypass reach that ranges from 1,652 to 2,630 depending on how the estimate is calculated. Stillwater Sciences also reviewed and analyzed the data for this reach and produced a population estimate of about 1,500 rainbow trout and 160 brown trout (Appendix 1). The Slide Creek full-flow reach was not effectively sampled by hook and line(only 4 fish captured in 2 days of effort), so a one-pass night snorkel survey was done on October 5 th covering a 3-9 meter band along each bank. Sixty four rainbow and five brown trout, between 14 and 27 cm long, were counted. Fish Creek Two attempts were made to conduct a resident fish population estimate on Fish Creek using removal estimates and a modified Peterson-Chapman mark/recapture estimate. These two methods require a random sample of habitat units to be isolated from the rest of the stream using block nets and to be electrofished. Both attempts failed due to the inability to effectively isolate the sample unit and the
106 inability to effectively capture fish. A third attempt, using day time snorkeling, was made to conduct the resident population estimate. Using ODFW juvenile snorkeling protocols resident population densities were calculated for a random sample of available habitat types (pools, riffles, rapids, cascades, etc.). From these densities and the total area of each habitat type a population estimate of 5,889 (936 0+, 2,463 1+, 2,252 2+, ) resident rainbow trout was calculated. No brown trout were observed during the snorkeling although two 1+ brown trout were captured during the electrofishing attempts. Table 2. Comparison of Estimated out-migration (or catch) of Fry and Smolts Species and life Soda Springs Bypass Copeland Cr Calf Cr stage (wild only unless otherwise indicated) 2009 (3/4-7/25) 2008 (3/4-9/6) 2007 (3/2-6/13) 2009 (3/3-6/30) 2008 (3/4-7/5) 2007 (3/2-6/17) 2009 (3/3-6/7) 2008 (3/4-7/5) 2007 (3/2-6/17) Chinook fry 182,011 22,121 41, , Chinook smolts Trout fry 10,024* 8,809* 285* 9,530* 182* 335* 6* 921* 604* Steelhead juvenile 1,515 74* 1,451** 7,516 4,248 2,274 2,692 4,309 2,971 (includes smolts) Coho salmon fry 5,734* 733* 523* 3,175* 277* 266* 238* 774* 3,204* Coho salmon smolts Cutthroat trout * * Brown trout 1, * 2* 1* 1* 3* *catch only, no estimate ** includes unmarked hatchery fish released as part of predation study Table 3. Comparison of Peak Redds per Mile for All Spawning Surveys Species Soda Springs Bypass NUR main stem Boulder Cr Copeland Cr** Calf Cr Steelhead Chinook NA NA NA Coho * NA *may include an unknown number of brown trout redds Predator Study Soda Springs reservoir was electrofished three times in 2009 once in July, August, and September. The August event was from dusk to midnight and the other two were from 0145 to dawn. A total of 358 trout were captured, including 31 that were previously tagged and 233 that were implanted with new PIT tags. Catch rates tended to be higher during the morning sessions but the percentage of empty stomachs was similar between night and morning catches. Only one brown trout was observed to have a fish (trout fry) in its stomach (captured during the July morning session), although the lavage equipment may have limited our ability to flush fish from stomachs. Stillwater Sciences updated their predator study report, largely strengthening previous findings and the conclusion that predation has th potential to substantially reduce survival of smolts through te reservoir (Appendix 2), Anticipated Work and Recommendations for 2010 The program will continue to be overseen by ODFW, with housing support from USFS (if needed) and technical and logistical support from PacifiCorp. This will be the last year of pre-passage baseline condition monitoring, since construction of fish passage and protection facilities throughout 2011 will force access limitations and cause abnormal flow conditions in Slide and Soda Springs bypass reaches. Access to Soda Springs will be very limited during most of 2010 due to road closure, safety issues, and traffic congestion related to initiation of construction of the new fish passage facilities. Monitoring crews will coordinate closely with PacifiCorp and construction contractors to ensure safety and minimize
107 disturbance of construction work. Monitoring in this area may be limited from past years. PacifiCorp (TCC) and ODFW (smolt trap crew) will continue to coordinate closely regarding flow changes in Soda Springs bypass reach to ensure safety and trap efficiency. all three smolt traps will be operated until low flows or ladder construction stop operations Redd surveys will continue as in 2009, with ODFW and USFS coordinating closely to ensure that all reaches get surveyed appropriately for all fish species. Float surveys of the NUR main stem for steelhead and coho redds will be continued in During steelhead redd surveys observers will also document any observations of lamprey and lamprey redds, with additional lamprey surveys added during June and July if flows and workload allow. A second season of resident fish abundance estimates will be made during late summer from Soda Springs reservoir to Slide Creek dam and in the lower 3 miles of Fish Creek. Sampling will include snorkeling and angling in an attempt to repeat and improve the methods used in This work will take priority over the surveys of summer coho salmon seeding levels in Boulder, Copeland and Calf creeks. If there is time for summer density surveys, Boulder Creek will be the highest priority since it has the least amount of effort thus far. Predator study work will again utilize the electrofishing boat on Soda Springs reservoir to recapture marked fish and also to capture, mark, measure, and examine stomach contents of new fish. Sampling will include at least one night and one morning during May and June (contingent on boat ramp and ladder construction). Data management and analyses will proceed throughout the year to facilitate data quality control and annual reporting. Annual report drafting (ODFW) and review (TWG) will attempt to meet the schedule in the Study Plan for March delivery to the RCC.
108 Table of Contents 1 Introduction 1 2 Study Area Rotary Screw Traps Resident and Anadromous Juvenile Summer Surveys Adult Spawning Surveys Soda Springs Predation Study 4 3 Methods Rotary Screw Traps Resident and Anadromous Juvenile Summer Surveys Adult Spawning Surveys Soda Springs Predation Study 8 4 Results Rotary Screw Traps Resident and Anadromous Juvenile Summer Surveys Adult Spawning Surveys Soda Springs Predation Study 50 5 Discussion Rotary Screw Traps Resident and Anadromous Juvenile Summer Surveys Adult Spawning Surveys Soda Springs Predation Study 54 List of Tables Table 1. Study Reach Description 2 Table 2. Screw Trap Locations 1 Table 3. Identified Salmonid Sizes for North Umpqua Rotary Screw Traps 6 Table 4. Soda Springs Bypass Weekly Salmonid Captures 10 Table 5. Soda Springs Bypass Steelhead Out-migrant Estimates 11 Table 6. Soda Springs Bypass Coho Salmon Smolt Out-migrant Estimates 12 Table 7. Soda Springs Bypass Spring Chinook Yearling Out-migrant Estimates 13 Table 8. Soda Springs Bypass Spring Chinook Fry Out-migrant Estimates 14 Table 9. Soda Springs Bypass Brown Trout Out-migrant Estimates 15 Table 10. Soda Springs Bypass Steelhead Migrants per Meter 16 Table 11. Soda Springs Bypass Coho Salmon Smolt Out-migrants per Meter 16 Table 12. Soda Springs Bypass Spring Chinook Fry Migrants per Meter 16 Table 13. Copeland Creek Weekly Salmonid Captures 19 Table 14. Copeland Creek Steelhead Out-migrant Estimates 20 Table 15. Copeland Creek Coho Salmon Smolt Out-migrant Estimates 21 Table 16. Copeland Creek Cutthroat Out-Migrant Estimates 22 Table 17. Copeland Creek Brown Trout Out-Migrant Estimate 23 Table 18. Copeland Creek Steelhead Migrants per Meter 23 Table 19. Copeland Creek Coho Salmon Smolt Migrants per Meter 23 Table 20. Calf Creek weekly Salmonid Captures 26 Table 21. Calf Creek Steelhead Out-migrant Estimates 27 Table 22 Calf Creek Coho Salmon Smolt Out-migrants Estimates 27 Table 23. Calf Creek Cutthroat Out-migrant Estimates 28 Table 24. Calf Creek Steelhead Migrants per Meter 28 Table 25. Calf Creek Coho Salmon Smolt Migrants per Meter 28
109 Table 26. Slide Creek Bypass Population Estimate by Reach (upper caudal only) 31 Table 27. Slide Creek Bypass Population Estimate by Size (upper caudal only 31 Table 28. Slide Creek Bypass Population Estimate by Reach (lumped mark/recapture) 32 Table 29. Slide Creek Bypass Population Estimate by Size (lumped mark/recapture) 32 Table 30. Fish Creek Population Estimate (lower 3.1 miles) 33 Table 31. Boulder Creek Coho Salmon Summer Density Estimates 33 Table 32 Comparison of Boulder Creek Coho Salmon Densities 33 Table 33 Soda Bypass Spawning Survey Table 34. North Umpqua Spawning Survey , 40, 41 Table 35. Boulder Creek Total Redds by Year 42 Table 36. Boulder Creek Spawning Surveys Table 37. Copeland Creek Total Redds by Year 44 Table 38. Copeland Creek Spawning Surveys Table 39. Calf Creek Spawning Surveys Table 40. Soda Springs Predation Sampling List of Figures Figure 1 Project Area Map 2 Figure 2. Soda Springs Bypass Coho and Spring Chinook Salmon Fry Timing 16 Figure 3. Soda Springs Bypass Steelhead 1+, 2+, 3+ Timing 17 Figure 4. Soda Springs Bypass Spring Chinook Timing 17 Figure 5. Soda Springs Bypass Brown Trout Timing 18 Figure 6. Copeland Creek Coho Salmon Fry Timing 24 Figure 7. Copeland Creek Steelhead Timing 24 Figure 8. Copeland Creek Cutthroat and Rainbow Trout Timing 25 Figure 9 Calf Creek Coho Salmon Fry Timing 29 Figure 10. Calf Creek Steelhead Timing 29 Figure 11.Calf Creek Cutthroat and Coho Salmon Fry Timing 30 Figure 12. North Umpqua Spring Chinook (fish per mile) 36 Figure 13. North Umpqua Spring Chinook Peak Redds per Mile 36 Figure 14. North Umpqua Spring Chinook Peak Redds by Year 38 Figure 15. Boulder Creek Steelhead Spawning Ground Surveys Figure 16. Boulder Creek Coho Salmon Spawning Ground Surveys Figure 17. Boulder Creek Total Redds ( ) 44 Figure 18. Copeland Creek Steelhead Spawning Ground Surveys Figure 19. Copeland Creek Coho Salmon Spawning Ground Surveys Figure 20. Copeland Creek Total Redds ( ) 47 Figure 21. Calf Creek Steelhead Spawning Ground Surveys Figure 22. Calf Creek Coho Salmon Spawning Ground Surveys Figure 23. Calf Creek Total Redds ( ) 50 APPENDIX 1. STILLWATER SCIENCES, ANALYSIS OF 2009 ANGLING SURVEY DATA APPENDIX 2. STILLWATER SCIENCES, PREDATION STUDY UPDATED RESULTS
110 1. INTRODUCTION The Settlement Agreement (SA) for Relicensing of the North Umpqua Hydroelectric Project requires PacifiCorp to fund a Long Term Monitoring and Predator Control study (SA Section 19.2). The purposes of this measure are: (1) to monitor and evaluate the success of anadromous fish reintroduction in the North Umpqua River upstream of Soda Springs Dam; and (2) to formulate and implement a study plan, implementation plan, and monitoring and adaptive management plan concerning the potential predation of anadromous salmonid juveniles by nonnative predator species in Soda Springs Reservoir. The fund is administered by PacifiCorp and managed by the Resource Coordination Committee (RCC) based on recommendations from the Fish Habitat and Studies (FHS) Technical Work Group (TWG). This program of work is guided by a study plan approved by the RCC in September 2006, which requires written annual reporting to the RCC each March. The Oregon Department of Fish and Wildlife (ODFW), in partnership with Partnership for the Umpqua Rivers (PUR), the United States Forest Service (USFS), and PacifiCorp, implemented the program of long-term monitoring work outlined in the study plan. Oversight and technical support was provided by ODFW. Rotary screw trapping, spawning surveys, resident trout population estimates and one summer juvenile density survey was completed in Predator control study work continued at Soda Springs reservoir in 2009 using ODFW and PacifiCorp staff. For the 2009 season, two seasonal biologists were hired by ODFW and one seasonal biologist was hired by PUR to operate rotary screw traps, conduct summer snorkeling in Boulder creeks and complete baseline surveys above Soda Springs Dam. Spawning surveys and routine data management and analyses were conducted by ODFW seasonal biologists. The USFS continued spawning surveys in Copeland Creek. 2. STUDY AREA Soda Springs Dam is located at river mile (RM) 70 on the North Umpqua River. Construction of the dam occurred during Soda Springs Dam is a 23.5 meter (77-ft) high arch concrete dam, and the resulting reservoir is 31.5 surface acres and 1.9 kilometers (1.2 miles) long when filled to capacity. The maximum depth is 15 m (50 ft), with water levels fluctuating up to 3 m/day (9 ft/day), and typically m/day (4 8 ft/day). Upstream fish passage and screens will be constructed at Soda Springs Dam by Upstream fish passage will provide access to at least 6.6 miles of anadromous spawning and rearing habitat in the North Umpqua River and Fish Creek. To evaluate the need to control brown trout populations after fish passage is provided, predation studies are focused on Soda Springs Reservoir, where most predation is predicted to occur. Brown and rainbow trout will also be monitored in: (1) Soda Springs bypass reaches (upper and lower) (2) Slide Creek full flow reach (3) Slide Creek bypass reaches (upper and lower) and (4) 3.2 miles of lower Fish Creek (Figure 1, Table 1). To determine baseline conditions and changes to anadromous fish abundance and species composition over time, long-term monitoring efforts will include the same study area, but will also include the upper portion of the North Umpqua River downstream from Soda Springs Dam (Table 1, Figure 1), and Boulder, Copeland, and Calf creeks. 2.1 Rotary Screw Traps For 2008 smolt traps were fished at the same sites as in 2007 (Table 2). Table 2: Traps Locations and Operation Months (2008). Trap Locations Identified by Quarter Sections. Trap Site Location (T,R,Sec) Trap Diameter Operation Dates Soda Bypass T26S R3E Sec 18 NW/SE 8 feet March-August Calf Creek T26S R2E Sec 19 NE/SE 5 feet March-June Copeland Creek T26S R2E Sec 23 NW/SE 5 feet March-July 1
 Study Reach Description NURM Upper wild and scenic reach of the North Umpqua River (from Calf Creek upstream to Soda Springs 7.")
111 Table 1. Study Reaches Where Monitoring is Occurring or Planned (see Figure 1). Study reach Study Reach code Length (mi) Study Reach Description NURM Upper wild and scenic reach of the North Umpqua River (from Calf Creek upstream to Soda Springs 7.4 powerhouse) COCR Copeland Creek (reach accessible to coho salmon, spring Chinook salmon, and/or steelhead) (The area 3.3 above Halfway Creek, ~1.5 from confluence is not accessible to chinook and coho) CACR 2.0+ Calf Creek (reach accessible to coho salmon, spring Chinook salmon, and/or steelhead) BOCR 1.5 Boulder Creek (reach accessible to coho and Chinook salmon and steelhead) SSBRL 0.3 Soda Spring bypass lower reach (downstream of gage pool) SSBRU 0.2 Soda Springs bypass upper reach (gage pool tailout to dam) SSR 1.2 Soda Springs reservoir (from dam face upstream to Medicine Creek bridge) SCFF 0.4 Slide Creek full-flow reach (from Medicine Creek bridge to Slide Creek powerhouse) SCBRL 0.5 Slide Creek bypass lower reach (powerhouse to Fish Creek confluence) SCBRU 1.5 Slide Creek bypass upper reach (Fish Creek confluence to Slide Creek Dam) FCBRL 3.2 Fish Creek bypass lower reach (mouth to major obstacle at RM 3.2) Figure 1. Vicinity and Reaches Where Most SA 19.2 Monitoring Activity Occurs 2
112 2.2 Resident and Anadromous Juvenile Summer Surveys Summer resident population estimates were conducted in the Slide Creek bypass reach, Slide Creek full flow reach and the lower 3.2 miles of Fish Creek (Table 1). Summer density surveys in Boulder were completed when resident surveys were finished. The summer population estimates in Slide Creek, Fish Creek and Soda bypass followed general ODFW population estimate protocols. Boulder, Copeland and Calf Creeks were originally set up following ODFW Corvallis Research 1000-meter protocols. When the reaches were first established each was selected randomly throughout coho spawning reaches. Copeland Creek was modified in 2006 (at the request of the Forest Service) from 1000-meter reaches to extent of anadromy. Reach descriptions are described as follows. Boulder Creek (BOCR) Reach 1 From the mouth of Boulder Creek at its confluence with the North Umpqua upstream 1000 meters. Reach meters downstream of Rattlesnake Creek to confluence of Rattlesnake Creek and Boulder Creek. Copeland Creek (COCR) Reach 1 From the mouth of Copeland Creek at its confluence with the North Umpqua upstream 0.7 miles to a small tributary entering on the right bank (ODFW Hab. Method, upstream). Reach 2 From the mouth of the small tributary (entering on right) upstream to 2800 Road bridge crossing. Reach 3 From 2800 Road bridge crossing upstream to end of anadromy at river mile 3.3. Calf Creek (CACR) Reach 1 From the mouth of Calf Creek at its confluence with the North Umpqua upstream 1000 meters. Reach 2 From large dome falls upstream 1000 meters Reach 3 From second bridge upstream to coho anadromous barrier. This reach is longer than 1000 meters 2.3 Adult Spawning Surveys Spawning surveys for steelhead and coho were conducted on Boulder Creek, Copeland Creek, and Calf Creek. Spawning surveys for Spring Chinook salmon were conducted in the Soda Bypass and main-stem North Umpqua River (Soda Springs powerhouse to Calf Creek), Copeland Creek and the lower ¼ mile of Boulder Creek. Boulder and Copeland Creeks have been examined for evidence of lamprey (redds and live or dead fish) since salmon and steelhead surveys have been conducted. Reach descriptions follow. Soda Springs Bypass (SSBRL, SSBRU) From the Soda Springs power house upstream to the pool located at the base of Soda Springs dam. This survey is a walking survey. Soda Powerhouse Tailrace Barrier This is the area directly impacted by the construction of the tailrace barrier, and extends from about 40 ft downstream to 20 feet upstream of the 220-ft-long tailrace barrier. Because this barrier was built in 2007, and the long-term stability of the resulting new gravel patches is unknown, the site is treated separately from other sites so as to not bias numbers from adjacent reaches. North Umpqua River ( NURM) The North Umpqua River spawning surveys are float surveys using small catarafts. 3
113 Reach 1 From Soda Springs powerhouse downstream to Boulder Creek. Stream distance is 1.41 miles. Reach 2 Boulder Creek to Copeland Creek. Stream distance is 1.23 miles. Reach 3 Copeland Creek to Deception Creek. Stream distance is 2.62 miles. Reach 4 Deception Creek to Calf Creek. Stream distance is 2.23 miles. BOCR Reach 1 From the mouth of Boulder Creek at its confluence with the North Umpqua River to Rattlesnake Creek. Approximate map distance is 1.5 miles. Reach 2 From the mouth of Rattlesnake Creek to the anadromous fish barrier at the forty-foot falls located approximately 330 meters below Onion Creek. Approximate map distance is 1.25 miles. The stream channel above Rattlesnake Creek is high gradient and dominated by large boulders and logs. The creek beyond Reach 2 is impassable due to sheer rock sidewalls and deep water. Egress is by land via a knob on the right bank, northeast cross-country to Onion Creek, then south on the Pine Bench Trail to the trailhead (point of beginning). COCR Reach 1 From the mouth of Copeland Creek, at its confluence with the North Umpqua River, to the 15 foot falls located approximately 200 meters upstream of the confluence of Halfway Creek and Copeland Creek. Approximate map distance is 1.5 miles. Reach 2 - From the 15 foot falls, noted above, to a 25 foot falls that appears to be the anadromous fish barrier, located northeast of the Road junction. Surveys above this falls will occur periodically to confirm whether this is a complete anadromous barrier. Approximate map distance is 1.25 miles. CACR Reach 1 From the mouth of Calf Creek, at its confluence with the North Umpqua River, upstream to large dome falls. Approximate map distance is 1 mile. Reach 2 From the dome falls to a large falls that appears to be a spring Chinook and coho salmon barrier. Approximate map distance is 1.5 miles. Reach 3 From large fall upstream to 200 meters below Twin Lakes Creek. Approximate map distance is 2 miles. This reach is accessible only to steelhead 2.4 Predator Control Study Predator control study efforts are concentrated on Soda Springs Reservoir on the North Umpqua River, but extend upstream as far as spawning brown trout can go, and downstream to the Soda Springs smolt trap. The reservoir is approximately 1.2 miles long and extends upstream of the dam. The upper limit is generally considered to be Medicine Creek Bridge, although the actual transition varies with water level and the upper portion of the reservoir resembles a river during low water surface levels 3. METHODS 3.1 Rotary Screw Traps Smolt traps were operated in COCR and CACR from March-June and in SSBRL from March-August. During each 4
114 daily check, captured fish were removed from the trap holding box and placed in five-gallon buckets. A separate bucket was 1/3 filled and sodium bicarbonate tablets added to sedate captured fish. All fish captured were sedated, to reduce stress and ease the handling, identification, and enumeration. All salmonids were measured (fork length) except during peak out migration periods, when sub-samples of 25 salmonids of each species were measured while the remaining fish were only enumerated. All unmarked fish were released downstream of the trap. Non-game fishes were also counted and released downstream. To estimate the total downstream juvenile out-migration, trap efficiency was calculated weekly. A variety of factors such as changing stream flows and levels, increasing fish size, behavior and species composition can influence the capture efficiency of the trap. ODFW research biologists recommend using up to 25 fish of each age class and species per day to be marked and released for trap efficiencies. To estimate the trap efficiency, captured coho and Chinook salmon, steelhead, rainbow, and brown trout were marked using a top or bottom caudal fin clip. Coho salmon, steelhead, rainbow and brown trout fry are enumerated only as these fish are generally being washed downstream in high flow events and not actually migrating Spring Chinook salmon fry are marked because a portion of these fish do migrate as 0+ fish. Caudal clips were designated by week prior to operation of the traps. Marked salmonids were released at least 100 meters upstream of the trap and allowed to pass by the trap a second time. Recaptured salmonids of each marked species were recorded and released downstream of the trap. Weekly estimates were calculated using the following formula. NI= (ni)/ (mrecap/mreli) Where NI = total # of estimated migrants passing the trap during week ni = # of unmarked fish caught in the trap during week (Sunday-Saturday) mrecap = # of marked fish recaptured in trap during week (Sunday-Saturday) mreli = # of marked fish released above the trap during week (Sunday-Thursday) The total # of fish migrating past the trap site for the season is the estimate by N tot = season sum of NI For weeks in which no marked fish were recaptured, the season trap efficiency was used to calculate the estimated migrants for the week. All marked fish were released within one hour after being marked and during daylight hours. Salmonids were divided into age classes based on fork lengths at the time of capture. Criteria used to place fish into age classes were taken from data collected by ODFW biologists at North Umpqua trap sites, a summary of this data is shown in Table 3. Trap operators measured lengths and weights of 100 fish (or all captured, if fewer) of each species and size class per week. This information was then used to calculate condition factors for each fish using the following formula: K= (100 x W)/ (l/10) 3 K= Condition Factor W= Weight in grams l= Length in millimeters A condition factor of 1.0 is considered optimal. A condition factor below 1.0 indicates a fish s body condition is long and light. A condition factor above 1.0 indicates a fish body condition is short and heavy. 5
115 Table 3. Identified Salmonid Size Classes for North Umpqua Rotary Screw Traps. Species Fork Length (mm) Coho 0+ < 70 Coho 1+ > 70 Chinook 0+ < 70 Chinook 1+ > 70 Stw & Ct 0+ < 90 Stw & Ct Stw & Ct Stw & Ct Summer Estimates of Salmonid Abundance The initial year of resident trout abundance was calculated for SCBRL, SCBRU, SCFF and FCBRL. Five different sampling methods were attempted due to the reach widths, water flows and water temperatures. The original surveys, completed by Harza Northwest in 1992, were completed using day time snorkeling (FCBRL) and one pass electrofishing (SCBRL, SCBRU, SCFF). For the 2009 season, ODFW attempted to sample FCBRL using electrofishers and conducting two pass removal estimates. All established sampling protocols for this were followed. Protocols require setting block nets at the head and tail of the selected habitat unit (habitat units are selected randomly) to isolate the fish population. Electrofishing began at the bottom of the unit and a pass is completed shocking upstream to the head of the unit, block nets are checked after each pass and electroshocked fish are placed into capture buckets and held for identification and size classification upon completion of all passes. In order for a population estimate to be completed at each unit there must be a 50% reduction in all size classes and species. If 50% reduction is not attained another pass (of equal effort) must be made. This continues until the proper reduction is met. Due to the stream size in FCBRL and water flows, an attempt was made to conduct a Peterson mark/recapture while doing the two pass reduction estimates. All established sampling protocols were used during this sampling except for allowing marked and released fish to recovery for 24 hours before resampling. After consultation with ODFW researchers, it was decided that the recapture event could occur after allowing the fish to recover for one hour. In addition to the two methods above, daytime snorkeling of FCBRL, using ODFW Corvallis Research Lab survey methodology was completed. The exception to the protocol is that ODFW snorkelers also snorkeled randomly selected rifles, rapids and cascades. This was done to calculate the resident trout population estimate for the entire stream length rather than just pool densities. Pre-passage trout population estimates for the SCBRL and SCBRU reaches were made using multi trip hook and line angling during late August and September. Within the SCBRU reach, two hook and line reaches were broke out (Fish Creek confluence to green bridge and green bridge to Slide Creek dam). SCBRL reach was kept at one reach only for sampling. Each reach was angled using a variety of lures and baits; start and stop time, habitat the fish was captured in, lure or bait being used, species and lengths were recorded for each sampling session. Captured fish were broken out into size categories (<130 mm fork length, fork length, >230 fork length) and marked with a small fin clip on the caudal. During recapture events fish were identified by species and broken into the same size categories. Population estimates were calculated by 1) size categories and individual reach, 2) individual reach with all fish lumped into one group, capture (Aug 25 th Sept 2 nd ) and recapture events (Sept 14 th Oct 5th) broken into separate events, or 3) individual reaches and all fish lumped into one group but any fish recaptured during capture events used to help calculate the population estimate. 6
116 Snorkel surveys for juvenile salmon and resident trout were conducted in BOCR and FCBRL during August and September. ODFW Corvallis Research Lab survey methodology was used for both reaches. To ensure the accuracy of the two person crew, a third snorkeler (calibrator) resurveys all the snorkeled pools during the next 48 hours. The calibrator s counts are compared to the original snorkeler counts and if there is a 10% or greater difference in the two juvenile coho salmon counts then the calibrators count is used. Start and end points for the established reaches have been GPS and tagged in order to be used as standard surveys. To reduce problems associated with snorkeling in shallow or fast water habitats, only pools 6 m 2 in surface area and at least 40 centimeters deep were snorkeled in BOCR. In FCBRL, because we were attempting to get a complete population estimate for the reach length a sub-sample of fast water units was snorkeled. A single upstream pass is made when snorkeling, and surveyors either alternate turns snorkeling or one surveyor snorkels an entire segment depending on the number of pools to be snorkeled. In rare cases both surveyors would snorkel a pool, usually because the pool was too large for one surveyor to effectively count juvenile fish. Once a pool was snorkeled, surveyors estimated or measured the maximum depth, average width, and length of the pool in meters. In BOCR and FCBRL every third pool was measured all other snorkeled pools in the reaches had the dimensions estimated. In FCBRL every third snorkeled fast water unit was measured. All salmonids were identified and counted by species and age class for each pool surveyed. Other resident fish, beaver activity, habitat enhancement, tributary junctions, and all other information relevant to the pool snorkeled was recorded. Juvenile salmonid numbers and habitat unit lengths and widths are used to calculate densities of fish by species for each snorkeled unit. Juvenile densities are calculated for each reach using the total fish numbers (by species) and the total pool area and fast water area (FCBRL only). Steelhead, rainbow trout, cutthroat trout and brown trout seeding levels are very inaccurate due to the habitats that these fish generally inhabit (riffles, rapids and margin areas of pools). In addition, according to ODFW Corvallis Research, snorkelers observe only 10-20% of juvenile trout; most snorkelers observe 70% of coho and spring Chinook salmon juveniles. Riffles, glides and pools less than 0.4 meters in depth have no densities calculated due to the inability to accurately snorkel these unit types. Due to the stream size and water flows electrofishing was not feasible or efficient in FCBRL so all habitat unit types were snorkeled. 3.3 Adult Spawning Surveys Survey timing varied by species: spring Chinook salmon surveys (late September - late October), coho salmon surveys (November - January), and steelhead surveys (January - May). During these periods, the target survey interval was 10 days, except when high flows created a safety hazard or impaired visibility. When high water prevented scheduled surveys, they were conducted as soon as possible thereafter. Flows are expressed in relation to survey wadeability, e.g., flows higher than approximately 200 cubic feet per second (cfs) in Boulder, Copeland and Calf Creeks were considered high and normally create hazardous and unproductive surveying. Visibility refers to water clarity and is subjectively rated from poor to excellent. Surveyors are expected to wear polarized glasses when useful to improve visibility into the water. Surveyors recorded the number of redds, live adults (male, female, unknown) and carcasses (male, female, wild, hatchery) observed on each survey. All carcasses were examined for fin clips and if reachable had their tails severed to prevent double-counting on subsequent surveys. On tributaries, USFS surveyors mark all new redds and locations (USFS protocols) for all species, while ODFW surveyors mark all new redds and locations for steelhead and coho salmon, but for spring Chinook salmon all redds are counted during each survey until such time that the redds can no longer be distinguished. Soda Springs bypass reach and the tributaries were waded by crews of one-two people. In the tributaries, coho salmon and steelhead redds were flagged to prevent double counting on subsequent surveys (USFS does this for all surveys, ODFW only for tributary coho salmon and steelhead surveys), but this is not done on the main stem reaches. Surveys completed during 2009 are described below for each reach and species. 7
117 SSBRL and SSBRU ODFW surveyed on foot from the powerhouse upstream to the pool at the base of Soda Springs dam for spring Chinook salmon, coho salmon and steelhead. Counts were segregated for SSBRL and SSBRU (the vicinity of the SA 8.3 spawning habitat). Soda Powerhouse Tailrace Barrier Survey is conducted by visual observation from both ends of the tailrace barrier, on the tailrace barrier and by cataraft. NURM The main-stem of the North Umpqua River was floated by crews of two to four people on one-man catarafts, with at least one boat observing each margin of the river to the centerline and remaining in close contact to avoid confusion. ODFW surveyed for spring Chinook salmon by the above methods, and recorded the information specific to four subreaches (powerhouse to Boulder Creek, Boulder Creek to Copeland Creek, Copeland Creek to Deception Creek, Deception Creek to Calf Creek). The annual one-time peak spawning float survey from the powerhouse to Rock Creek was not completed by the USFS this year. BOCR, COCR and CACR ODFW and USFS staff completed surveys for coho salmon and steelhead in BOCR, COCR, and CACR in From 2005 through 2006 the USFS has conducted annual peak Chinook spawning surveys in BOCR. From 2003 through 2009, the USFS has conducted a peak-spawning survey for spring Chinook salmon in COCR. Since 2001, coho salmon and steelhead were surveyed by USFS on COCR, with redds marked by orange (coho) or pink (steelhead) flagging hung on the bank of the stream directly opposite the downstream end of the redd. The flags contain fish redd species, surveyor s initials, date and distance to/or location of redd. Superimposition of redds is also recorded. Red flagging was used for the Chinook salmon spawning survey. Where more than one redd is located in close proximity to one another, the appropriate number of flags are hung, i.e., three redds = three hung flags. Marked or unmarked refers to the absence or presence of an adipose fin, respectively. All stream banks are expressed looking downstream. For the BOCR and CACR surveys, ODFW protocols dictate that for spring Chinook salmon, all visible redds will be counted during each survey trip. This provides for a peak count of cumulative redds. For coho salmon and steelhead, new redds are marked with ribbons in the same manner as the USFS surveys. 3.4 Soda Springs Predation Study Boat electrofishing was performed from a Smith-Root 18-ft aluminum flat-bottomed boat. The crew consisted of one captain, two forward deck dip netters and one fish transfer person. The crew consisted of ODFW 19.2 and PUR seasonals and an ODFW or PacifiCorp captain. Electrofishing began after dark and was conducted between either 2100 and 2400 or 0145 and 0745 with 1.5 hours of electrofishing in the reservoir s upstream reach (Medicine Creek bridge downstream approximately 0.6 miles), and 1.5 hours of electrofishing in the reservoir s downstream reach (from dam upstream 0.6 miles). Electrofishing efforts focused on shallow areas (e.g., <12 ft) and along the banks. All captured fish were placed within an on-board live well and held until processing. Upon completion of each reach, the captured fish were brought to a land based processing station. When processing was completed, all captured fish were released to the reservoir reach where they were originally captured. In addition to the work being completed within the reservoir, the predation study has been extended up and downstream of the reservoir. At the SSBRL smolt trap, brown trout captured in the smolt trap are checked for PIT tags and to enumerate the smaller fish consumed. Above the reservoir spawning ground surveys are being conducted to estimate German brown spawning escapement. 8
118 4. RESULTS 4.1 Rotary Screw Traps All three smolt traps began operating on March 3. Low flows in CACR caused this trap to be pulled on June 7 th ; no attempt was made to motorize the trap this year. At COCR, a large cobble barb was built that allowed the trap to continue operation until June 30 th when summer low flows and other 19.2 work caused this trap to be pulled. The SSBRL trap was to be operated until the end of October but damage to the live well (caused by the cone sliding back and grinding into the aluminum) caused the trap to be pulled August 1 st. The number of each species and size classes for each smolt trap are available from ODFW upon request. Summarized in the tables are the total number of fish trapped on a daily and weekly basis, and the total number of salmonids marked and recaptured. To gain a perspective of the smolt out-migration trends among different trapped streams, migrants per stream meter were calculated as estimated number of migrants divided by the total stream length of coho salmon anadromy. SSBRL: Steelhead 1+, 2+, 3+, coho 1+, coho and spring Chinook salmon fry, spring Chinook salmon 1+, brown trout, and rainbow trout were marked and recaptured to obtain an estimated population size(tables 5-9). Table 4 displays the total capture of salmonids by week. For the season, 52 spring Chinook salmon yearlings and 12,498 spring Chinook salmon fry were captured (34 were classified as smolting). Coho salmon captures totaled 5,734 coho salmon fry and 41 coho salmon 1+ smolts. The number of trout fry captured was 10,024. Of the older aged steelhead captured, aged 1+ were the most numerous (61 aged 1+, 47 aged 2+, 10 aged 3+). A total of 33 steelhead smolts were identified. Seventy-five brown trout and two rainbow trout were captured. Total mortality on salmonids species was 2.6%, with the majority being spring Chinook fry Tables 5-9 summarize the mark/recapture results for the season. The season trap efficiency for older aged steelhead was 6.5% which provided an estimate of 1,515. The season trap efficiency for coho salmon smolts was 19.4% and the estimated number of coho salmon smolt out-migrants was 172. For the trapping season 12,498 spring Chinook salmon fry were captured with a trap efficiency of 14.4%. The estimated number of spring Chinook fry moving downstream past the trap was 182,011. The seasonal trap efficiency for spring Chinook salmon smolts was 14.6% with an estimated out-migrant number of 456. A trap efficiency of 5.3% was calculated for marked brown trout, which results in an estimate of 1,233 brown trout moving past the trap. Tables show the migrants per meter for steelhead, coho salmon and spring Chinook salmon fry. Coho salmon smolts per meter of stream were , spring Chinook salmon fry were fish per meter of stream and steelhead out-migrants per meter of stream were Weights for condition factors were collected 95 times for steelhead, 44 times for brown trout, 47 times for spring Chinook salmon yearlings, and 37 times for coho salmon smolts. Age classes of steelhead and Chinook salmon were not separated when calculating condition factors. The overall condition factor for all steelhead was The season condition factor for non-clipped spring Chinook salmon and coho salmon were and 1.044, respectively. Gastric lavage was performed on randomly selected brown trout, steelhead and rainbow trout (size>130 mm) captured in the trap. In the lavaged fish, eighty-nine percent of brown trout were observed with salmonid fry in their stomach contents, seventy-six percent of the steelhead had salmonid fry in their stomach contents. Ingested fry numbers ranged from 1 to 71 (in a 303 mm steelhead). Insects (terrestrial and aquatic) were observed in 58% of the lavaged fish. The predominate prey species seen in these lavage samples was salmonid fry (Chinook salmon, coho salmon, 9
119 trout fry) although one Chinook yearling was observed in a 264 mm brown trout and one steelhead 1+ was observed in a 235 mm steelhead. Ingested fry size ranged from 22 mm to 50 mm. Non-game species captured in Soda Springs bypass were sculpin, lamprey ammocetes, and Pacific giant salamanders. Thirty five Pacific lamprey ammocetes were captured this year with sizes ranging from mm in length. In addition, one adult Pacific lamprey and one bluegill were also captured. Figures 2 through 5 show timing of outmigration for all salmonid species caught in Table 4: SSBRL Weekly Salmonid Captures (2009) Trout Week fry ST 1+ ST 2+ ST 3+ CO Fry CO Smolt CHS Fry CHS Smolt RB Brown Tr 3/1 to 3/ /8-3/ /15-3/ /22-3/ /29-4/ /5-4/ /12-4/ /19-4/ /26-5/ /3-5/ / /17-5/ /24-5/ /31-6/ /7-6/ /14-6/ /21-6/ /28-7/ /5-7/ /12-7/ /19-7/ /26-8/ Totals 10, , , (Coho salmon (CO), Steelhead (ST), Spring Chinook salmon (CHS), Trout (TR), Rainbow (RB)) 10
120 Table 5: 2009 SSBRL Steelhead (1+, 2+, 3+) Out-Migrant Estimates Week Number captured in trap Number of fish marked Number of marked fish recap Estimate of trap efficiency Estimated number of migrants V(Ns) Bootstrap 95% CI 3/1-3/ /8-3/ /15-3/ /22-3/ /29-4/ /5-4/ /12-4/ /19-4/ /26-5/ /3-5/ / /17-5/ /24-5/ /31-6/ /7-6/ /14-6/ /21-6/ /28-7/ /5-7/ /12-7/ /19-7/ Totals ±
121 Table 6: 2009 SSBRL Coho Salmon Smolt Migrant Estimates Week Number captured in trap Number of fish marked Number of marked fish recap Estimate of trap efficiency Estimated number of migrants V(Ns) Bootstrap 95%CI 3/1-3/ /8-3/ /15-3/ /22-3/ /29-4/ /5-4/ /12-4/ /19-4/ /26-5/ /3-5/ / /17-5/ /24-5/ /31-6/ /7-6/ /14-6/ /21-6/ /28-7/ /5-7/ /12-7/ /19-7/ Totals ±240 12
122 Table 7: 2009 SSBRL Spring Chinook Salmon Smolt (non-clipped) Migrant Estimates Week Number captured in trap Number of fish marked Number of marked fish recap Estimate of trap efficiency Estimated number of migrants V(Ns) Bootstrap 95% CI 3/1-3/ /8-3/ /15-3/ /22-3/ /29-4/ /5-4/ /12-4/ /19-4/ /26-5/ /3-5/ / /17-5/ /24-5/ /31-6/ /7-6/ /14-6/ /21-6/ /28-7/ /5-7/11 3* /12-7/18 11* /19-7/25 20* Totals ±728 *smolting spring chinook 0+ 13
123 Table 8: 2009 SSBRL Spring Chinook Salmon Fry Migrant Estimates Week Number captured in trap Number of fish marked Number of marked fish recap Estimate of trap efficiency Estimated number of migrants V(Ns) Bootstrap 95% CI 3/1-3/ /8-3/ /15-3/ /22-3/ /29-4/ /5-4/ /12-4/ /19-4/ /26-5/ /3-5/ / /17-5/ /24-5/ /31-6/ /7-6/ /14-6/ /21-6/ /28-7/ /5-7/ /12-7/ /19-7/ Totals ±
124 Table 9: 2009 SSBRL Brown Trout Migrant Estimates Week Number captured in trap Number of fish marked Number of marked fish recap Estimate of trap efficiency Estimated number of migrants V(Ns) Bootstrap 95% CI 3/1-3/ /8-3/ /15-3/ /22-3/ /29-4/ /5-4/ /12-4/ /19-4/ /26-5/ /3-5/ / /17-5/ /24-5/ /31-6/ /7-6/ /14-6/ /21-6/ /28-7/ /5-7/ /12-7/ /19-7/ Totals ±
125 Table 10: Steelhead Migrants per Meter in SSBRL and SSBRU Date Operated Year Species Number Captured in Trap Number of Fish Marked Number of Fish Recap Overall Trap Efficiency Estimated Number of Migrants Stream Length (m) Migrants per Meter April-October 2006 STW(1+,2+,3+) March-June 2007 STW(1+,2+,3+) , March-August 2008 STW(1+,2+,3+) March-July 2009 STW(1+,2+,3+) , Table 11: Coho Salmon Smolt Migrants per Meter in SSBRL and SSBRU Date Operated Year Species Number Captured in Trap Number of Fish Marked Number of Fish Recap Overall Trap Efficiency Estimated Number of Migrants Stream Length (m) Migrants per Meter April-October 2006 Coho smolts March-June 2007 Coho smolts March-August 2008 Coho smolts March-July 2009 Coho smolts Table 12: Spring Chinook Salmon Fry Migrants per Meter in SSBRL and SSBRU Date Operated Year Species Number Captured in Trap Number of Fish Marked Number of Fish Recap Overall Trap Efficiency Estimated Number of Migrants Stream Length (m) Migrants per Meter April-October 2006 CHS fry 1731* 907* , March-June 2007 CHS fry , March-August 2008 CHS fry , March-July 2009 CHS fry , *includes 2 spring chinook yearlings No. of Fish /1 to 3/7 3/15-3/21 3/29-4/4 4/12-4/18 4/26-5/2 5/ /24-5/30 6/7-6/13 6/21-6/27 7/5-7/11 7/19-7/25 Figure 2: 2009 SSBRL Coho and Spring Chinook Salmon Fry Timing 16
126 25 20 No. of Fish /1 to 3/7 3/15-3/21 3/29-4/4 4/12-4/18 4/26-5/2 5/ /24-5/30 6/7-6/13 6/21-6/27 7/5-7/11 7/19-7/25 Figure 3: 2009 SSBRL Steelhead 1+, 2+, 3+ Timing No. of Fish /1 to 3/7 3/15-3/21 3/29-4/4 4/12-4/18 4/26-5/2 5/ /24-5/30 6/7-6/13 6/21-6/27 7/5-7/11 7/19-7/25 Figure 4: 2009 SSBRL Coho and Spring Chinook Yearling Timing 17
127 No. of Fish /1 to 3/7 3/15-3/21 3/29-4/4 4/12-4/18 4/26-5/2 5/ /24-5/30 6/7-6/13 6/21-6/27 7/5-7/11 7/19-7/25 Figure 5: 2009 SSBRL Brown Trout Timing COCR: Steelhead 1+, 2+, 3+, coho salmon smolts and spring Chinook salmon fry were marked to estimate out-migrant population size. Table 13 shows the total salmonid species captured by week with the marked recapture and mortality data excluded. The total number of coho salmon fry captured was 3,175. Fifty-one coho salmon smolts were captured during trap operation. The total number of trout fry captured was 9,530. Of the older aged steelhead captured age 1+ were the most abundant (1,821 aged 1+ and 14 aged 2+, 1 aged 3+). Twenty-two steelhead were identified as smolts during trap operation. One spring Chinook smolt, four brown trout (lengths >141mm), twelve resident rainbow trout and nine cutthroat trout were observed in the trap this year. The mortality rate for all salmonids decreased significantly from 12.4% (2008) to 1% for 2009 Tables summarize the mark/recaptures for the 2009 season. The season trap efficiency for steelhead (1+, 2+, and 3+) was 31.6%. Based on this efficiency the estimated number of steelhead out-migrants was 7,516 with a 95% confidence interval of ±750. The overall trap efficiency for coho salmon smolts was 54.5% which gives an estimated out-migration of 122(± 34). Table show the migrants per meter for coho salmon smolts and older aged classes of steelhead. Steelhead out-migrants per meter were and coho salmon out-migrants per meter were Lengths and weights for condition factor estimates were collected on 1022 steelhead, 44 coho salmon 4 brown trout, 11 resident rainbow trout and 9 cutthroat trout. No trout fry or coho salmon fry were included in the condition factor analysis. The season condition factor for older age class steelhead was 1.027; coho salmon was 1.055, brown trout 1.086, rainbow trout and cutthroat trout Dace were the most abundant non-game species captured in COCR during 2009 trap operation. Other non-game species captured in the trap included sculpin, pacific giant salamanders and one pacific lamprey ammocete. This is the first lamprey ammocete to be captured in Copeland Creek. Figures 6 through 8 shows timing of out migration for juvenile salmonids caught in
128 Table 13: COCR Weekly Salmonid Captures Week Trout fry ST 1+ ST 2+ ST 3+ CO Fry CO Smolt CH Smolt Cutthroat Res Rainbow Brown Trout 3/1 to 3/ /8-3/ /15-3/ /22-3/ /29-4/ /5-4/ /12-4/ /19-4/ /26-5/ /3-5/ / /17-5/ /24-5/ /31-6/ /7-6/ /14-6/ /21-6/ /28-7/ Totals
129 Table 14: 2009 COCR Steelhead (1+, 2+, 3+) Migrant Estimate Week Number captured in trap Number of fish marked Number of marked fish recap Estimate of trap efficiency Estimated number of migrants V(Ns) Bootstrap 95% CI 3/1-3/ /8-3/ /15-3/ /22-3/ /29-4/ /5-4/ /12-4/ /19-4/ /26-5/ /3-5/ / /17-5/ /24-5/ /31-6/ /7-6/ /14-6/ /21-6/ /28-6/ Totals ±750 20
130 Table 15: 2009 COCR Coho Salmon Smolt Migrant Estimates Week Number captured in trap Number of fish marked Number of marked fish recap Estimate of trap efficiency Estimated number of migrants V(Ns) Bootstrap 95% CI 3/1-3/ /8-3/ /15-3/ /22-3/ /29-4/ /5-4/ /12-4/ /19-4/ /26-5/ /3-5/ / /17-5/ /24-5/ /31-6/ /7-6/ /14-6/ /21-6/ /28-6/ Totals ±34 21
131 Table 16: 2009 COCR Cutthroat Trout Migrant Estimate Week Number captured in trap Number of fish marked Number of marked fish recap Estimate of trap efficiency Estimated number of migrants V(Ns) Bootstrap 95% CI 3/1-3/ /8-3/ /15-3/ /22-3/ /29-4/ /5-4/ /12-4/ /19-4/ /26-5/ /3-5/ / /17-5/ /24-5/ /31-6/ /7-6/ /14-6/ /21-6/ /28-6/ Totals ±29 22
132 Table 17: 2009 COCR Brown Trout Migrant Estimate Week Number captured in trap Number of fish marked Number of marked fish recap Estimate of trap efficiency Estimated number of migrants 3/1-3/ /8-3/ /15-3/ /22-3/ /29-4/ /5-4/ /12-4/ /19-4/ /26-5/ /3-5/ / /17-5/ /24-5/ /31-6/ /7-6/ /14-6/ /21-6/ /28-6/ Totals Table 18: Steelhead Migrants per Meter in COCR Number Date Operated Year Species Captured in Trap Number of Fish Marked Number of Fish Recap Overall Trap Efficiency Estimated Number of Migrants Stream Length (m) Migrants per Meter April-June 2006 STW (1+,2+,3+) , March-June 2007 STW (1+,2+,3+) , March-July 2008 STW (1+,2+,3+) , March-June 2009 STW (1+,2+,3+) , Table 19: Coho Salmon Smolt Migrants per Meter in COCR Date Operated Year Species Number Captured in Trap Number of Fish Marked Number of Fish Recap Overall Trap Efficiency Estimated Number of Migrants Stream Length (m) Migrants per Meter March-June 2007* Coho smolt , March-July 2008 Coho smolt , March-June 2009 Coho smolt , * only 1 coho smolt was captured in
133 No. of Coho /1 to 3/7 3/15-3/21 3/29-4/4 4/12-4/18 4/26-5/2 5/ /24-5/30 6/7-6/13 6/21-6/27 CO Smolt Figure 6: 2009 COCR Coho Salmon Timing No. of Steelhead /5-4/11 4/12-4/18 4/19-4/25 4/26-5/2 5/3-5/9 5/ /17-5/23 5/24-5/30 5/31-6/6 6/7-6/13 6/14-6/20 6/21-6/27 6/28-7/4 St 1+,2+,3+ Figure 7: 2009 COCR Steelhead (1+, 2+, 3+) Timing 24
134 No. of Fish /5-4/11 4/19-4/25 5/3-5/9 5/17-5/23 5/31-6/6 6/14-6/20 6/28-7/4 Cutthroat Res. Rainbow Figure 8: 2009 COCR Cutthroat and Rainbow trout Timing CACR: Table 20 shows the total salmonid by species captured by week with the marked recapture and mortality data excluded. Fish marked to estimate the population for each size class included: Steelhead 1+, 2+, 3+, cutthroat trout and coho salmon 1+. Tables summarize the mark and recaptures for all salmonid species captured in the trap for The overall season trap efficiency for steelhead (1+, 2+, 3+) was 44.7%, which resulted in an estimate of 2,692 steelhead outmigrants. The overall season trap efficiency for coho salmon smolts was 71.4% which resulted in an estimate of 43 coho salmon smolts moving out of CACR. The season trap efficiency for cutthroat trout was 33.0%, based on this an estimate of 330 out-migrating fish was calculated. Trap efficiencies for trout and coho salmon fry were not calculated for 2009 Smolt out-migration trends were calculated for CACR for future comparisons with other streams within the study area. To obtain migrants per meter, the total stream length of anadromous distribution was divided by the estimated number of migrants. Tables 24 and 25 show the migrants per meter for steelhead and coho smolts. Steelhead migrants per meter were 0.344, coho salmon out-migrants per meter were
135 Table 20: 2009 Calf Creek Weekly Salmonid Captures Trout Week fry ST 1+ ST 2+ ST 3+ CO Fry CO Smolt Cutthroat Res Rainbow Brown Trout 3/1 to 3/ /8-3/ /15-3/ /22-3/ /29-4/ /5-4/ /12-4/ /19-4/ /26-5/ /3-5/ / /17-5/ /24-5/ /31-6/ Totals Condition factors were calculated for older age classed steelhead, cutthroat trout and coho salmon smolts. For the season, twenty eight coho salmon smolts, seven hundred fifty-two steelhead, one hundred two cutthroat trout, seven rainbow trout and one brown trout were sampled for condition factor analysis. The overall condition factor for the coho salmon was The older age classes of steelhead were not separated during data collection. The seasonal condition factor for steelhead (ages 1+, 2+, and 3+) was Cutthroat trout were also not separated by age class during data collection. The cutthroat trout seasonal condition factor was Trout and coho salmon fry had no condition factor information collected due to their small size. The most prevalent non-game species captured were speckled dace followed by sculpin and Pacific Giant salamanders. Figures 9 through 11 shows timing of out migration for coho salmon, steelhead and cutthroat trout caught in
136 Table 21: 2009 CACR Steelhead (+1, +2, +3) Out-Migrant Estimate Week Number captured in trap Number of fish marked Number of marked fish recap Estimate of trap efficiency Estimated number of migrants V(Ns) Bootstrap 95% CI 3/1-3/ /8-3/ /15-3/ /22-3/ /29-4/ /5-4/ /12-4/ /19-4/ /26-5/ /3-5/ / /17-5/ /24-5/ /31-6/ Totals ±247 Table 22: 2009 CACR Coho Salmon Smolt Out-Migrant Estimate Week Number captured in trap Number of fish marked Number of marked fish recap Estimate of trap efficiency Estimated number of migrants V(Ns) Bootstrap 95% CI 3/1-3/ /8-3/ /15-3/ /22-3/ /29-4/ /5-4/ /12-4/ /19-4/ /26-5/ /3-5/ / /17-5/ /24-5/ /31-6/ Totals ±14 27
137 Table 23: 2009 CACR Cutthroat Out-Migrant Estimate Week Number captured in trap Number of fish marked Number of marked fish recap Estimate of trap efficiency Estimated number of migrants V(Ns) Bootstrap 95% CI 3/1-3/ /8-3/ /15-3/ /22-3/ /29-4/ /5-4/ /12-4/ /19-4/ /26-5/ /3-5/ / /17-5/ /24-5/ /31-6/ Totals ±116 Table 24: Steelhead Migrants per Meter in CACR Date Operated Year Species Number Captured in Trap Number of Fish Marked Number of Fish Recap Overall Trap Efficiency Estimated Number of Migrants Stream Length (m) Migrants per Meter April-June 2006 STW(1+,2+,3+) , March-June 2007 STW(1+,2+,3+) , March-July 2008 STW(1+,2+,3+) , March-June 2009 STW(1+,2+,3+) , Table 25: Coho Salmon Smolt Migrants per Meter in CACR Date Operated Year Species Number Captured in Trap Number of Fish Marked Number of Fish Recap Overall Trap Efficiency Estimated Number of Migrants Stream Length (m) Migrants per Meter March-June 2007 Coho smolts , March-July 2008 Coho smolts , March-June 2009 Coho smolts ,
138 /1 to 3/7 3/15-3/21 3/29-4/4 4/12-4/18 4/26-5/2 5/ /24-5/30 Figure 9: 2009 CACR Coho Smolt Timing /1 to 3/7 3/15-3/21 3/29-4/4 4/12-4/18 4/26-5/2 5/ /24-5/30 Figure 10: 2009 CACR Steelhead Timing 29
139 /1 to 3/7 3/15-3/21 3/29-4/4 4/12-4/18 4/26-5/2 5/ /24-5/30 CO Fry Cutthroat Figure 11: 2009 CACR Cutthroat and Coho salmon FryTiming 4.2Resident and Anadromous Juvenile Summer Surveys SCFF Hook and line sampling was attempted on the SCFF reach, two days were spent fishing and only 4 fish were captured. With the small number of fish captured, night snorkeling, using two snorkelers, was conducted on October 5 th. The survey was conducted downstream as the water velocity and depth were too great to allow an upstream snorkel survey. A total of 64 rainbow and 5 brown trout were counted, with the majority of the fish in the mm size range. Most of these fish were found on the margins, although with only two people snorkeling, the middle portion of the river was not covered. SCBRL, SCBRU Hook and line sampling began Aug 25 th and ran intermittently through October 5 th. From Aug. 25 th through Sept 2 nd all fish were marked with an upper caudal clip. Six days were fished during this period which allowed for all three reaches to be fished twice. Beginning on Sept 14 th through Sept 21 all unmarked fish were marked with a lower caudal clip to differentiate between the two marking periods. Four days of sampling occurred during this time period with each reach being sampled once and the SCFF reach sampled twice. From Sept 23 through Oct 5 th, 3 days of sampling occurred with only the SCBRL and SCBRU being angled, no fish were caudal clipped as we were trying for maximum recapture effort. Two population estimates were calculated using different groupings for the marking and recapture events. The first estimate calculated in the table below is derived from: counting the times we marked upper caudal as the capture events (M). The lower caudal marking and no marking efforts were used as the recapture events (C). Only fish with upper caudal marks captured during the lower caudal marking and maximum recapture effort counted towards the R. Any fish recaptured during the capture events were not counted into the total of the number tagged (R). Recaptured fish caught during the lower caudal marking were not included in the number tagged (M). This gives a population 30
140 estimate of 1,652 total trout if summed by individual reach or a population estimate of 1,921 if the estimate is calculated as one lumped reach (Table 26, 27). Table 26: Slide Creek Bypass Population Estimates by Reach (upper caudal mark/recapture events only) Fish Cr. to Slide Power House Slide Power House to Medicine Cr. Bridge Slide Dam to Bridge Bridge to Fish Cr. Total Number Tagged = M Number Caught During Recapture = C Number Marked Caught During Recapture = R Chapman Peterson Population Estimate If this estimate is calculated by size class and reach, the breakdown can be seen in Table 27. The majority of the captured fish were between mm in fork length, species composition was 99% rainbow trout, and very few fish < 130mm fork length were captured. Table 27: Slide Creek Bypass Population Estimates by Size Class (upper caudal mark/recapture events only) Slide Dam to Bridge < >230 Number Tagged = M Number Caught During Recapture = C Number Marked Caught During Recapture = R Chapman Peterson Population Estimate Bridge to Fish Cr. < >230 Number Tagged = M Number Caught During Recapture = C Number Marked Caught During Recapture = R 3 2 Chapman Peterson Population Estimate Fish Cr. to Slide Powerhouse < >230 Number Tagged = M Number Caught During Recapture = C Number Marked Caught During Recapture = R Chapman Peterson Population Estimate 6 Total For All Three Reaches The second estimate was calculated pooling the upper and lower caudal marking events into the number tagged (M). After the initial marking events for each reach (Aug 25 th and 26 th ) the upper and lower caudal marking events and the maximum effort recapture events were lumped into the number caught during recapture (C). Any recaptured fish (with the exception of those caught on Aug 25 and 26) were counted as recaptures (R). Fish that were previously marked, regardless of the mark, were not double counted into M. This gives a population estimate of 1,807 total trout if summed by individual reach or a population estimate of 1,956 if the estimate is calculated as one lumped reach (Table 28, 29). 31
141 Table 28: Slide Creek Bypass Population Estimates by Reach (Lumped marking events) Fish Cr. to Slide Power House Slide Power House to Medicine Cr. Bridge Slide Dam to Bridge Bridge to Fish Cr. Total Number Tagged = M Number Caught During Recapture = C Number Marked Caught During Recapture = R Chapman Peterson Population Estimate If this estimate is calculated by size class and reach, the breakdown can be seen in Table 29. The total population estimate if calculated by size class is 2,630. Table 29:Slide Creek Bypass Population Estimate by Size Class (Lumped recapture events) Slide Dam to Bridge < >230 Number Tagged = M Number Caught During Recapture = C Number Marked Caught During Recapture = R Chapman Peterson Population Estimate Bridge to Fish Cr. < >230 Number Tagged = M Number Caught During Recapture = C Number Marked Caught During Recapture = R Chapman Peterson Population Estimate Fish Cr. to Slide Powerhouse < >230 Number Tagged = M Number Caught During Recapture = C Number Marked Caught During Recapture = R Chapman Peterson Population Estimate Total For All Three Reaches FCBRL Snorkel surveys were performed in Fish Creek on August 10 and 18 th and the calibration snorkeling was done on August 20 th. Seventy-eight pools, two riffles, ten rapids and eleven cascades were snorkeled through the 3.2 miles of lower Fish Creek. The total population estimate for all age classes was 5,889 resident rainbow or 1,840 fish per mile. In comparison, the Harza Northwest (1992) snorkel surveys calculated a population estimate of 8, and 2,100 2+/3+ rainbow trout or 2,191 fish per mile. 0+ trout were observed in the Harza Northwest surveys but not enumerated. The Harza Northwest snorkel survey covered from the mouth up to Camas Creek which is 4.7 miles. The density levels, by age class, for each habitat type can be seen in Table 30. No brown trout were observed during the snorkel surveys completed in 1992 or
142 Table 30. FCBRL Resident Population Estimate by Size Class Total Area (m 2 ) Trout 0+ / m 2 Estimate 0+ trout Trout 1+ / m 2 Estimate 1+ trout Trout 2+ / m 2 Estimated 2+ trout Trout 3+ / m 2 Estimated 3+ trout Pools snorkeled 72% of hab Riffle snorkeled 48% of hab Rapid snorkeled 18% of hab Cascade snorkeled 15% of hab A removal estimate and a modified Peterson-Chapman mark/recapture estimate were attempted prior to conducting the snorkel survey in FCBRL. Both attempts failed, due to the inability to keep the block nets from washing out which allowed fish to both escape and enter the sampling area, the inability to successfully recapture trout that had been marked and water depths that did not allow for effective backpack electrofishing.. Two small 1+ brown trout were captured during electrofishing. Anadromous surveys BOCR Snorkel surveys were performed in Boulder Creek on September 9 and 10. Eighty five pools were snorkeled through two reaches and the average seeding level was coho/m 2 (Table 31).Trout fry (<90mm), steelhead 1+, 2+, 3+ were also counted with trout fry having the highest average seeding level of all counted fish at 0.16 fish/ m 2 through the two snorkeled reaches. Spring Chinook summer parr were observed for the first time in Boulder Creek as was one cutthroat trout. Table 31: Total Pools Sampled and Average Coho Salmon Densities in BOCR (2009) Reach # of Pools Sampled Coho per m Total Table 32 compares the 2007 coho densities to those completed in For the 2009 season all reaches were below minimum seeding levels but reach 1 had higher densities than those observed in Table 32: BOCR Coho Salmon Densities by Year and Reach Reach m m m m 2 COCR No summer density surveys were completed in Copeland Creek due to time constraints CACR No summer density surveys were completed in Calf Creek due to time constraints 4.3 Adult Spawning Surveys Peak counts generally occurred during April for steelhead, mid-october for Chinook salmon, and late December for coho salmon. Although surveys were not made specifically for them, as in all past years, no evidence of lamprey spawning (live fish, redds, or carcasses) was observed in any reach during the course of these surveys for other species. 33
143 SSBRL and SSBRU SA 8.3 spawning surveys have been conducted for all salmonid fish species since ODFW began surveying the bypass as part of 19.2 in The peak fish count for spring Chinook salmon in 2009 was 210 (live and dead), 44 carcasses were recovered in the bypass reach this year (Table 33). ODFW fish counts through the bypass reach have ranged from a peak counts of 210 (6 fin clipped) during 2009 to a low of 4 (1 fin clipped) in 2006 (Figure 12). The peak redd per mile count for spring Chinook salmon increased to 166 (redds per mile) from the previous years of 144 in 2008(Figure 13). Steelhead redds have only been counted since 2005 and had remained fairly constant during the previous four years. The 2009 steelhead redd count was down sharply with a peak redd per mile of 14 compared to a peak of 44 redds per mile in For the 2009 spawning season, there were more coho salmon spawning than has been observed during previous 8.3 surveys. A peak of 3 brown trout redds (6 redds/mile) and 4 live brown trout were counted in early December. A peak count of 17 coho salmon (live and dead) and 30 redds per mile were observed in Spawning surveys specifically for pacific lamprey have not been conducted in the bypass reach. Spawning surveyors are aware of the possibility and have been instructed to count any lamprey or redds observed during steelhead spawning season. At this time no pacific lamprey adults or redds have been observed in the reach. 34
144 Table 33: Summary of SSBRL and SSBRU Spawning Surveys (2009) Live Fish and Carcasses Species Survey Date Redd Count Non- Clipped Fin Clipped Unknown Steelhead 1 1/ / / / / / / / / / / / / / / / / Spring Chinook salmon 1 9/ / / / / / / / Coho salmon 1 11/ / / / / / / / / / / / / spring Chinook and coho salmon redd counts are total, steelhead are new redds counted in the survey 35
145 fish per mile Soda Bypass Soda to Boulder Boulder to Copeland Copeland to Calf Figure 12: North Umpqua Spring Chinook Salmon Peak (Fish per Mile) redds per mile Soda Bypass Soda to Boulder Boulder to Copeland Copeland to Deception Deception to Calf Figure 13: North Umpqua Spring Chinook Salmon Peak (Redds per Mile)
146 Soda Power House Tailrace Barrier ODFW and PacifiCorp have been surveying the tailrace barrier area as a separate survey since construction was completed. For the 2009 season the spring Chinook salmon peak redd count was 44 and 88 fish were observed holding/spawning in the vicinity of the barrier. The peak redd count for coho salmon was 18. NURM The USFS conducted spring Chinook salmon spawning surveys in 1993, 1995, , and ; the last four years in conjunction with ODFW and others. The USFS surveys are completed once per year during the peak of Chinook salmon spawning. In 2004, ODFW began conducting surveys (following ODFW spawning survey protocols) from the Soda Springs powerhouse to Calf Creek to monitor hatchery stray rates. All fish (live or dead) and redds are counted during the survey. Peak fish counts (live and dead) have varied greatly by year and by reach (Figure 14). During the spring of 2007 PacifiCorp (Rich Grost) initiated the first steelhead redd count float and in 2009 four floats were conducted for steelhead (monthly from March May). Coho floats were initiated during the fall of 2008, for 2009 floats were conducted maximum of every ten days. Seven coho float surveys were conducted between November 24 th and January 22 nd. Spawning survey data from the USFS, through the study area, is broken into four reaches (Soda to Boulder, Boulder to Copeland, Copeland to Deception, and Deception to Calf). From 2004 through 2006 ODFW survey data (in the study area) is broken into 2 reaches (Boulder to Copeland, Copeland to Calf).In 2007 the surveys were broken into the four USFS reaches for ease of comparison. Spring Chinook salmon peak redds per mile have continued to increase through the four float reaches (Figure 14). The peak redd count for 2009 was 449 and recorded on October 5 th (Table 34). Coho salmon floats observed increased numbers of redds over 2008, with a peak coho salmon redd count of 101 (13.5 redds per mile) compared to 2008 s peak of 36 (4.8 redds per mile). Steelhead redd numbers also increased from the 2008 counts with a peak steelhead redd count of 44 (5.9 redds per mile) compared to 29 redds (3.9 redds per mile). Challenges to surveying for these species in the main stem include broad spawning periods, high and variable flows, high water velocities, poor water visibility, and limited daylight for floating. During the final steelhead redd count float, surveyors were asked to watch for pacific lamprey redds, live fish and carcasses. No pacific lamprey activity was observed during the float. 37
147 Redds per Mile Soda to Boulder (1.4 mi) Boulder to Copeland (1.23 mi) Copeland to Deception (2.6 mi) Deception to Calf (2.2) Figure 14: North Umpqua Spring Chinook Salmon Peak Redds per Mile (by Floated Reach) 38
148 Table 34: Summary of NURM Spawning Surveys during 2009 Species Float Reach Organization Survey Date Carcasses Total Redd Count Non-Clipped Fin Clipped Unknown CHS Power House to Boulder Creek ODFW/PC 9/ Power House to Boulder Creek ODFW/PC 9/ Power House to Boulder Creek ODFW 10/ Power House to Boulder Creek ODFW 10/ Power House to Boulder Creek ODFW 10/ Power House to Boulder Creek ODFW 11/ Power House to Boulder Creek ODFW 11/ CHS Boulder Creek to Copeland Creek ODFW/PC 9/ Boulder Creek to Copeland Creek ODFW/PC 9/ Boulder Creek to Copeland Creek ODFW 10/ Boulder Creek to Copeland Creek ODFW 10/ Boulder Creek to Copeland Creek ODFW 10/ Boulder Creek to Copeland Creek ODFW 11/ Boulder Creek to Copeland Creek ODFW 11/ CHS Copeland Creek to Deception Creek ODFW/PC 9/ Copeland Creek to Deception Creek ODFW/PC 9/ Copeland Creek to Deception Creek ODFW 10/ Copeland Creek to Deception Creek ODFW 10/ Copeland Creek to Deception Creek ODFW 10/ Copeland Creek to Deception Creek ODFW 11/ Copeland Creek to Deception Creek ODFW 11/ CHS Deception Creek to Calf Creek ODFW/PC 9/ Deception Creek to Calf Creek ODFW/PC 9/ Deception Creek to Calf Creek ODFW 10/ Deception Creek to Calf Creek ODFW 10/ Deception Creek to Calf Creek ODFW 10/ Deception Creek to Calf Creek ODFW 11/ Deception Creek to Calf Creek ODFW 11/
149 Table 34: Summary of NURM Spawning Surveys during 2009 Species Float Reach Organization Carcasses Live Fish Survey Date Total Redd Count Non-Clipped Fin Clipped Unknown Coho Power House to Boulder Creek ODFW 11/ Power House to Boulder Creek ODFW 12/ Power House to Boulder Creek ODFW 12/ Power House to Boulder Creek ODFW 12/ Power House to Boulder Creek ODFW 1/ Power House to Boulder Creek ODFW 1/ Power House to Boulder Creek ODFW 1/ Boulder Creek to Copeland Creek ODFW 11/ Boulder Creek to Copeland Creek ODFW 12/ Boulder Creek to Copeland Creek ODFW 12/ Boulder Creek to Copeland Creek ODFW 12/ Boulder Creek to Copeland Creek ODFW 1/ Boulder Creek to Copeland Creek ODFW 1/ Boulder Creek to Copeland Creek ODFW 1/ Copeland Creek to Deception Creek ODFW 11/ Copeland Creek to Deception Creek ODFW 12/ Copeland Creek to Deception Creek ODFW 12/ Copeland Creek to Deception Creek ODFW 12/ Copeland Creek to Deception Creek ODFW 1/ Copeland Creek to Deception Creek ODFW 1/ Copeland Creek to Deception Creek ODFW 1/ Deception Creek to Calf Creek ODFW 11/ Deception Creek to Calf Creek ODFW 12/ Deception Creek to Calf Creek ODFW 12/ Deception Creek to Calf Creek ODFW 12/ Deception Creek to Calf Creek ODFW 1/ Deception Creek to Calf Creek ODFW 1/ Deception Creek to Calf Creek ODFW 1/
150 Table 34: Summary of NURM Spawning Surveys during 2009 Carcasses Species Float Reach Organization Survey Date Total Redd Count Non-Clipped Fin Clipped Unknown ST Power House to Boulder Creek ODFW 3/ Power House to Boulder Creek ODFW 4/ Power House to Boulder Creek ODFW 4/ Power House to Boulder Creek ODFW/NOAA/PC 5/ Boulder Creek to Copeland Creek ODFW 3/ Boulder Creek to Copeland Creek ODFW 4/ Boulder Creek to Copeland Creek ODFW 4/ Boulder Creek to Copeland Creek ODFW/NOAA/PC 5/ Copeland Creek to Deception Creek ODFW 3/ Copeland Creek to Deception Creek ODFW 4/ Copeland Creek to Deception Creek ODFW 4/ Copeland Creek to Deception Creek ODFW/NOAA/PC 5/ Deception Creek to Calf Creek ODFW 3/ Deception Creek to Calf Creek ODFW 4/ Deception Creek to Calf Creek ODFW 4/ Deception Creek to Calf Creek ODFW/NOAA/PC 5/ *brown trout redd BOCR Spawning surveys have been conducted in BOCR, by the Forest Service from and ODFW since March 21, 2007 (Table 35). Coho salmon redds seem to have stabilized during the last three years of surveys. In 2001 the total redd count was 71 (56.8 redds per mile) with a peak of 38, this count dropped to a low of 15 total redds (12 redds per mile) in The total redd number has shown a gradual increase from this low up to a total count of 49 redds (39.2 redds per mile) with a peak of 13 redds for the 2009 season. Steelhead redds in BOCR had remained fairly consistent from 2002 through 2007 (5.3 redds/mile to 14 redds per mile), the 2008 redd count was the lowest recorded in the last 8 years (2.7 redds per mile). For the 2009 season steelhead redd counts improved to 6.7 redds per mile. Table 36 and Figures show the survey dates, redds for each species for 2009, and total redds by year. Virtually all redds were located in Reach 1, Reach 2 is gravel limited and only a peak steelhead redd count on April 30 was conducted in this reach (8 steelhead redds and 5 live fish were observed). Due to the length of the steelhead spawning surveys and the timing of pacific lamprey spawning, there have been ample opportunities to observe lamprey spawning if it occurs in BOCR. To date, no pacific lamprey spawning has been observed in BOCR. 41
151 Table 35: BOCR Total Redds per Mile ( ) Chinook Coho Steelhead Table 36: Summary of BOCR Spawning Surveys ( ) Species Survey Date Redds Steelhead 1/28 0* 2/5 1* 2/10 2* 2/19 0* 3/5 3* 3/13 1* 3/19 1* 3/31 1* 4/9 8* 4/19 5* 4/30 10* 5/10 2* 5/19 4* 5/31 1* 6/19 0* Total 39 Spring Chinook 9/16 0 9/ /5 0 10/ / /2 0 11/11 0 Total 1 Coho 11/11 2* 11/20 8* 12/1 13* 12/7 4* 12/18 8* 12/29 12* 1/13 2* 1/21 0* 1/27 0* Total 49 * surveys count only new redds during each trip 42
152 # of new redds /28/2009 2/11/2009 2/25/2009 3/11/2009 3/25/2009 4/8/2009 4/22/2009 5/6/2009 5/20/2009 6/3/2009 6/17/2009 Figure 15: BOCR Daily Steelhead Redd Counts for # of new redds /16/2009 9/23/2009 9/30/ /7/ /14/ /21/ /28/ /4/ /11/2009 Chinook 11/18/ /25/ /2/2009 Coho Figure 16: BOCR Daily Spring Chinook and Coho Salmon Redd Counts /9/ /16/ /23/ /30/2009 1/6/2010 1/13/2010 1/20/2010 1/27/
153 No. of redds Years Chinook Coho Steelhead Figure 17: BOCR Peak Total Redds ( ) COCR Spawning surveys have been conducted in COCR, by the Forest Service since 2001 (Table 37). No spring Chinook salmon were observed during the 2009 surveys. The peak count for coho salmon redds was 21 with a total count of 62 during the survey season (Table 38) Table 37: Copeland Creek Total Redds per Mile from Chinook Coho Steelhead Steelhead redd numbers in COCR have remained fairly stable since survey s began in Total redds per mile have ranged from a high of 37.5 redds per mile in 2001 to a low of 15.3 redds per mile in The 2009 survey had the third lowest number of steelhead redds recorded but was up slightly from 2008 (30 redds vs 26 redds). Figures show the daily redds and total redds for COCR by species for years Due to the length of the steelhead spawning surveys and the timing of pacific lamprey spawning, there have been ample opportunities to observe lamprey spawning if it occurs in COCR. To date no pacific lamprey spawning has been observed in COCR. 44
154 Table 38: Summary of Copeland Creek Spawning Surveys during Species Survey Date New Redds Steelhead 2/9 1* 2/19 0 2/26 0 3/5 3* 3/12 0 3/19 0 3/26 1* 4/2 0 4/8 5* 4/16 1* 4/22 1* 4/30 2* 5/7 2* 5/14 0 5/20 7* 5/28 7* 6/4 0 Total 30 Spring Chinook 9/ /7 0 10/ / /30 0 Total 0 Coho 12/2 8* 12/8 0 12/14 7* 12/21 8* 12/28 21* 1/6 1* 1/11 14* 1/19 3* Total * surveys count only new redds during each trip 62 45
155 7 6 5 # of new redds /29/2008 2/5/2008 2/12/2008 2/19/2008 2/26/2008 3/4/2008 3/11/2008 3/18/2008 3/25/2008 4/1/2008 4/8/2008 4/15/2008 4/22/2008 4/29/2008 5/6/2008 5/13/2008 5/20/2008 Figure 18: COCR Daily Steelhead Redd Counts for # of new redds /2/ /6/ /10/ /14/ /18/ /22/ /26/ /30/2009 1/3/2010 1/7/2010 1/11/2010 1/15/2010 1/19/2010 Figure 19: COCR Daily Coho Salmon Redd Counts for
156 No. of redds Years Chinook Coho Steelhead Figure 20: COCR Total Redds ( ) CACR This is the second year spawning surveys were completed for steelhead and coho salmon. The peak redd count for coho salmon was 22 with a total count of 58 redds this is up from the 2008 total redd count of 46. Steelhead decreased from a total of 51 redds during the season to 22 redds in (Table 39, Figures 21-23). Due to the length of the steelhead spawning surveys and the timing of pacific lamprey spawning, there has been ample opportunities to observe lamprey spawning if it occurs in CACR. To date no pacific lamprey spawning has been observed in CACR. 47
157 Table 39: Summary of CACR Spawning Surveys during Species Survey Date New Redds Steelhead 1/30 5* 2/4 1* 2/12 0* 2/18 1* 3/4 1* 3/10 0 3/20 1* 3/28 5* 4/7 2* 4/17 3* 4/27 1* 5/9 0* 5/19 2* 5/28 0* 6/9 0* Total 22 Coho 11/18 5* 11/25 16* 12/3 22* 12/17 4* 12/22 4* 12/30 5* 1/7 0* 1/12 1* 1/20 1* 1/26 0 Total * surveys count only new redds during each trip 58 48
158 6 5 # of new redds /30/2009 2/6/2009 Figure 21: CACR Daily Steelhead Redd Counts 2009 # of redds /13/2009 2/20/2009 2/27/2009 3/6/2009 3/13/2009 3/20/2009 3/27/2009 4/3/2009 4/10/2009 4/17/2009 4/24/2009 5/1/2009 5/8/2009 5/15/2009 5/22/2009 5/29/2009 6/5/ /18/ /23/ /28/ /3/ /8/ /13/ /18/ /23/ /28/2009 1/2/2010 1/7/2010 1/12/2010 1/17/2010 1/22/2010 Figure 22: CACR Daily Coho Salmon Redd Counts ( ). 49
159 Number of Redds Coho Steelhead Figure 23. CACR Total Redds ( ) 4.4 Soda Springs Predation Study Soda Springs reservoir was electrofished three times during summer 2009: twice between 0145 and dawn (July 24 and September 30), and once from dusk to midnight (August 27). Catch rates tended to be higher for the morning events than the evening one. although there was an observed decline in catch as the sky lightened in July. A total of 358 trout were captured, including 31 fish that been previously PIT tagged and 233 that were newly implanted with PIT tags (Table 40). Most trout longer than 15 cm fl were measured and tagged, except in July when 50 trout cm long were released without being tagged. One fish was observed with a healed PIT tag scar but without an active PIT tag, indicating either evulsion or failure of the tag. A number of trout were observed with spinal hemorrhaging, the percentage with hemorrhaging differed by species and by electrofishing session. Table 40. Summary of predator sampling on Soda Springs reservoir, July (morning) August (night) September (morning) total # of fish captured # fish exhibiting spinal hemorrhage # mortalities from sampling or marking # of recaptured fish (brown/rainbow) 3 / 0 9 / 2 13 / 4 25 / 6 # fish newly PIT tagged (brown/rainbow) 38 / 7 52 / / / 58 All fish with lengths greater than 150mm (fork length) were gastric lavaged. The proportion of empty stomachs was about equal for each electrofishing session. Aquatic macroinvertebrates made up the majority of the stomach contents 50
160 for all trout lavaged. One brown trout fry (45mm) was observed in the stomach contents of a 232 mm (fork length) adult brown trout collected during the July 24, 2009 early morning sampling effort. This was the only fish observed in the stomach contents of any lavaged trout from reservoir sampling in However, the lavage method (straws and plastic squeeze or pump bottles) did not seem adequate for evacuating larger contents from larger fish, so some stomach contents may have been missed. The composition of stomach contents varied between the upper and lower reaches of Soda Springs Reservoir with annelids consumed by trout at a greater rate in the upper reach compared to the lower reach. 5. Discussion and Recommendations for 2010 This season s work was completed in a safe and efficient manner. There has been some turnover with the seasonal staff but all efforts are being made to maintain the consistency and continuity of the project. This has also led to improved cooperation between the multiple cooperators. For 2010, continuing to communicate remains a high priority to ensure that data collection is consistent and accurate. Further efforts will made to make sure all data is collected in the same way as previous years, especially in light of the high seasonal turnover. This includes using the correct reach breaks for spawning and snorkeling surveys, as well as marking all new redds for coho and steelhead on all the walking surveys. 5.1 Rotary Screw Traps All three traps began operation on March 3 rd. The CACR trap was fished until the first week of June when low flows caused the trap to be pulled; the COCR trap was fished until June 30 th due to the large cobble barb and putting the legs on the trap, which kept the cone from grounding out and kept water velocities high enough to keep the cone spinning at over 4 rpm through June; and the SSBRL trap operated until July 25 th when it was pulled due to mechanical reasons. Two high flow events in May affected the SSBRL trap, one of which floated woody debris into the trap jamming the cone and partially sinking the trap and placed enough force on the cone to shift it downstream into the livewell causing trap operations to cease July 25 th. The cone shifted approximately 2 inches making it impossible to raise completely out of the water, wearing a groove into the 3 inch tube aluminum of the livewell and grinding ½ inch of aluminum off the rear of the cone. The trap was taken to Eugene to repair this damage and to try and prevent this shifting in the future. The same high flow events caused large amounts of woody debris to enter the CACR and COCR traps, some of the fish mortalities in these two traps can be attributed to this. No attempts were made to motorize either the CACR or COCR traps this year due to a need to shift the seasonals to other priorities. Low flow modifications (a large cobble barb and legs) at COCR, allowed the trap to continue operation for a month longer than CACR Mortality rates at all three traps decreased significantly from the 2008 trapping season. All three traps had mortality rates on all salmonid species less than 1% compared to the 12% and 9% mortality rates observed at COCR and SSBRL traps in Large fish exclusion devices (fry protectors) were experimented with in SSBRL to try and reduce fry predation in the livewell. Buckets with holes large enough for fry to swim through, hardware clothe screens and clumps of fir bows tied to the livewell were all tried with varied results. Predation was still observed (gastric lavage) but did seem lower with the exclusion devices in the livewell. Trap efficiencies at each site are affected by stream width, depth, flow, and water velocities they are located in. Trap operation on large waterways (5 th and 6 th order) is always difficult and typically produces trap efficiencies below 20%. Trap efficiencies for all species, except steelhead, were down at SSBRL this year, 19.4% for coho salmon smolts in 09 versus 40% in 08, 14% for 09 all Chinook salmon (fry and smolts) versus 24% in 08 and 5% for 09 brown trout versus 9.4% in 08. Steelhead trap efficiencies did improve from no recaptures in 08 to 6.5% in 09. In CACR and COCR trap efficiencies continue to improve for all species. Steelhead and coho salmon trap efficiencies were over 25% for both traps. For the second year at COCR and CACR the upstream release sites were changed for all fish to examine the effects on trap efficiencies. In 2008 the release sites were moved upstream approximately 1 mile from May through the end of trapping season, this was reversed for 2009 (fish released 1 mile upstream March and April, 51
161 .1 miles above trap May through June). This was done to see if differences in the 2008 salmonid trap efficiencies were a factor of stream flows rather than the shift in release sites. An examination of the data seems to show that flows were not a major factor in the improvement of older age class steelhead recaptures in CACR. Recapture rates for the 1+,2+,3+ steelhead were much higher for 2008 and 2009 when released 1 mile upstream of the trap: 50% (2008) and 72% (2009) versus recapture rates of 16% (2008) and 57% (2009) 0.1 miles upstream of the trap. This does not hold true for coho salmon smolts in CACR or for any salmonid juveniles in COCR, recapture rates decreased when the release site was moved upstream. Migrants per meter are often used to summarize how many fish out-migrated from the available habitat. These numbers can be compared from year to year to monitor trends and changes in out-migrants. The stream lengths vary by fish species in each stream. In COCR, spring Chinook salmon distribution ends approximately 1,900 meters from the mouth; coho salmon are only found in the first 2,220 meters and end at the first falls. Steelhead can be found up to the second falls in COCR approximately 5,800 meters. In CACR, coho salmon and steelhead can be found throughout the first 4,800 meters and distribution ends at a large falls. In order to make a comparison between the three smolt traps older age (1+, 2+, 3+) steelhead were used (Tables 10, 18, 24). Steelhead migrants per meter in decreased in CACR and SSBRL but doubled in COCR. Coho salmon smolts migrants per meter showed little change in CACR and COCR but increase in SSBRL (Tables 11, 19, 25) and spring Chinook fry migrants per meter were 8 times greater than previous years (Table 12). The 2010 trapping season will be shortened at SSBRL due to construction of the new fishway and may be shortened at CACR and COCR in order to conduct a more intensive resident trout population estimate above Soda Springs dam. For the 2010 trapping season work will continue on large fish exclusion device for the SSBRL trap Gastric lavage will continue to be performed at all traps on all brown trout and large rainbows to monitor fry predation and timing of predation. All large rainbow and brown trout will be scanned for PIT tags to monitor downstream movement from Soda Springs reservoir. 5.2 Resident and Anadromous Juvenile Summer Surveys The 2009 resident trout population efforts in the Slide Creek full flow, bypass and Fish Creek reaches were initially modeled after the 1992 efforts by Harza Northwest. During the 1992 surveys, one pass backpack electrofishing and snorkeling (night and day) sampling was completed. In Fish Creek snorkel surveys calculated a population estimate of 10,300 resident trout (8, and 2,100 2+/3+ rainbow trout), 0+ trout were observed but not enumerated. For 2009 efforts were made to conduct Peterson-Chapman mark recapture and removal estimates using ODFW protocols (block netting each unit, 50% reduction in fish of each size class, etc.) to make a better comparison between the 1992 and 2009 estimates. Stream flows have increased in Fish Creek since the surveys were completed in 1992 and hydro staff and volunteers were not able to effectively electrofish any habitat units. Two electrofishers were used and multiple passes were made but our results showed that the efforts were inefficient, time consuming and labor intensive. In addition staff were unable to secure the block nets allowing fish to move freely in and out of the sample habitat unit. Water depths over 0.6 meters made habitat unit selection difficult, water this deep allows fish to avoid the electrical field. Given the two month window in which we had to complete the population estimates it was decided to snorkel all pools deeper than 0.4 meters and snorkel 25% of the fastwater units. This gave an estimate of 5,889 (936 0+, 2,463 1+, 2, ) resident trout, this estimate is half of what was estimated in The major difference between the surveys was the estimated 1+ trout. Some of this discrepancy may be in 1.6 miles of stream not surveyed in 2009; the 2009 survey was only completed up to the potential anadromous barrier located at mile 3.1 on Fish Creek. Another difference would be in the snorkelers, the 2009 snorkel crew and 1992 snorkel crews have different criteria for breaking fish into different size classes. Snorkelers did not observe any brown trout in 2009 or 1992 but two were electrofished out of one habitat unit. In order to observe brown trout and perhaps higher numbers of rainbow trout it may be best to night snorkel. This will lead to a new set of safety hazards so a decision will need to be made on whether to continue daytime snorkeling or change to nights. 52
162 Similarly, higher flows in the Slide Creek bypass reaches (SCBRL and SCBRU) made it impossible to repeat the methods used in It was decided (after consulting ODFW Corvallis Research) to conduct a Peterson Chapman mark/recapture survey using hook and line to capture fish. All captured fish were measured and marked with a small upper caudal fin clip. After the initial marking had occurred, through the bypass reach, each reach was fished multiple times with all captured fish being examined for recaptures. Recaptures were measured and released all new unmarked fish were marked with a lower caudal fin clip. After completing the mark/recapture efforts population estimates were calculated by grouping the fish four different ways. This gives a population estimate that ranges from 1,569 to 2,630 resident trout. The majority of the fish were four to nine inches long, very few fish less than four inches and greater than 9 inches were captured or recaptured during sampling. Smaller hook sizes, use of bait and flies were all used in an attempt to catch fish smaller than 4 inches. In an attempt to catch larger fish, fishing times were altered to late afternoon and evenings again with little success. The number of brown trout captured was very low and no changes in brown trout catch rates were observed by fishing in the evening. For the coming season (if hook and line sampling is used again) sampling times will be shifted towards early mornings and late evenings in an attempt to mark more fish of all sizes and to capture more brown trout. During calculation of the population estimate I was unsure how to group the mark and recapture groups to provide the most accurate estimate. This is why four estimates were made calculating by smaller reaches, size classes, lumped reaches and splitting marking trips out from recapture trips. No standard error or confidence interval was calculated it is uncertain which estimate is the best. Completing a population estimate using these methods will become more difficult as the minimum flows increase. It may be best to try night snorkeling (cold water temperatures) for the 2010 sampling season. To better account for uncertainty in the 2009 population estimates within Slide Creek bypass reach, Stillwater Sciences was contracted to review and analyze the same hook-and-line data referred to in this report. They concluded that the low number of recaptures produced high uncertainty in all estimates (especially for brown trout, with no recaptures). Their best estimates for the entire reach were 1500 rainbow trout (95% interval = ) and 160 brown trout (95% intervals = ). Their methods and results are described in Appendix 1. For the Slide Creek full flow reach attempts were made to complete a hook and line sampling but due to the size of the river, lack of good access and the inability to catch numbers of fish, it was decided to night snorkel the reach. This night snorkel was completed on October 5 th, using two snorkelers and one person in a cataraft for support. Low numbers of fish, all of which were rainbow, were counted during the one pass. Only the stream margins were covered by the two snorkelers so any fish outside the 3-4 meter margin were not counted. Summer density surveys for anadromous fish are not a component of the Long-term Monitoring Plan. Summer density surveys are being used as a quick gauge of summer coho parr density levels. A snorkel survey was completed through the extent of coho salmon in BOCR. The 2009 snorkel survey examined 85 pools, 19 of which were above Rattlesnake Creek. Coho salmon summer densities in reach 1, although still less than 0.3 fish per m 2, were higher than those observed in 2007 (0.165 fish per m 2 in 2009 versus 0.11 fish per m 2 in 2007). Coho salmon densities in reach 2 were lower 0.07 fish per m 2 than the 2007 densities of fish per m 2, but the number of snorkeled pools increased from 27 pools (stopped at Rattlesnake Creek) to 40 pools. Spring Chinook salmon summer parr and cutthroat trout were observed for the first time above the North Umpqua trail in Boulder Creek. The upper most observed spring Chinook salmon parr was seen approximately ½ miles above the North Umpqua trail. Snorkeling surveys are very effective for coho and spring Chinook salmon but don t work well for steelhead or cutthroat. The reason is that the majority of these fish are found in faster water units which are shallow and nearly impossible to snorkel. ODFW s Corvallis Research team has determined that when snorkeling for coho, a stream is considered fully seeded at 0.7 coho/m 2 and under seeded at 0.3 coho/m 2. In 2010 resident population estimates will be completed again for SCBRU and FCBRL. In an effort to better estimate the trout populations this years data will be sent to Stillwater Sciences who will assist ODFW in coming up with the best available method to complete the sampling with a minimum amount of bias. Additional personnel may have to be hired in order to complete these surveys in a timely manner. Summer coho seeding surveys may continue 53
163 periodically as time and money allow, but not at the expense of higher priority Long-term Monitoring Plan work. For the 2010 survey season all established reaches (including the 1000 meter reaches) for COCR, BOCR and CACR will be surveyed if time allows. 5.3 Spawning Ground Surveys All spawning surveys were completed following ODFW spring Chinook salmon, coho salmon, and steelhead protocols. Ten day intervals were maintained except when high flows reduced visibility and increased safety concerns. In addition, due to the rough nature and safety concerns, reach 2 of Boulder Creek and reach 3 of Calf Creek were only surveyed once during peak steelhead spawning. Float surveys for spring Chinook salmon had the largest increase in observed redds, in all reaches, since The peak redd count (449) for the float survey was the highest ever recorded, the previous high was in 2008 (427). Looking at the data presented in Figure 14, it seems the spring Chinook salmon in the NURM are running on four year cycles. If this is trend continues it would seem that redd counts for spring Chinook salmon will drop off for the 2010 spawning season. The three other reaches that spring Chinook salmon surveys are conducted in (Soda bypass, Boulder Creek, Copeland Creek) had varied results. No spring Chinook salmon redds or fish were observed in COCR this year and only one Chinook salmon redd was observed in BOCR. Low water and no significant rain events throughout Chinook salmon spawning kept fish from both streams. In the bypass reach, the peak spring Chinook salmon redd count of 83 was higher than in The peak count at the tailrace barrier was 44 redds. During 2010, construction work for the Soda Springs fish ladder will impact Chinook salmon spawning in the bypass reach. Decreased water flows and the work place isolation below Soda Springs dam will reduce the area available for fish to spawn. Coho salmon redd numbers increased through all surveyed reaches when compared with the 2008 spawning surveys. Copeland and Calf Creeks peak redd counts increased significantly from the 2008 peaks (CACR - 10 redds in 2008 to 22 redds in 2009, COCR- 12 redds in 2008 to 21 redds in 2009). The peak redd count of 101 for the North Umpqua float was triple the peak redd count (36)observed in 2008 Steelhead peak redd numbers remained stable in COCR but decreased in CACR (9 redds in 2008 to 5 redds in 2009) and the Soda Bypass reach (peak of 22 in 2008 to 7 redds in 2009). The North Umpqua floats (22 redds in 2008 to 44 redds in 2009) and BOCR (4 redds in 2008 to 10 redds in 2009) saw large increases in peak redd counts with both surveys doubling the previous years peak redd counts. 5.4 Soda Springs Predation Study Limited work was completed for the predation study due to monitoring commitments required by the Long Term Monitoring Plan. Three electrofishing trips were conducted in Soda Springs reservoir in an effort to place additional pit-tags into reservoir fish, gather additional growth data from previously pit-tagged fish and to see if there were differences in stomach contents of fish captured prior to sun-rise versus those capture after dusk. The three electrofishing trips did produce some interesting results as far as gastric lavage and spinal hemorrhage rates. The percentage of fish with spinal hemorrhages ranged from 60% to 11% with a higher percentage of spinal hemorrhages occurring during the morning sessions. In addition, more rainbow (25%) were observed (during all electrofishing trips) with spinal hemorrhages than brown trout (18%). The settings on the boat for all three trips were the same as those used in 2008 (3% hemorrhage in brown trout and 0% rainbow), so I am not sure if the water was more conductive, the reservoir was lower, larger numbers of fish being shocked or if we were not observing fish as quickly. Gastic lavage only recovered one trout fry from only one adult trout and may be due to the difficulty lavaging fish over 30 cm -- it is possible that we are not able to fully evacuate the stomach contents of the larger fish with the 54
164 equipment we are currently using. A one-gallon pump sprayer was employed in 2009 but efforts were still limited by an inadequate tube for delivering water and loosening contents. We have been able to get macroinvertebrates from the larger fish but this may be because they are lighter, smaller, and easier to remove. Larger trout fry and small 1+ fish may not come out of the stomachs as easily, therefore for the future we plan to use heavier-duty gastric lavage equipment that was previously used during smallmouth bass studies in the Umpqua River. This system uses a small electric pump and metal wand to force higher pressure water into the fish s stomach. In addition to the analyses described in this report, Stillwater Sciences was contracted to update their 2007 study of predator population characteristics by including the predator data collected by this program in 2008 and The larger updated data set produced similar results to those for the 2007 study (Appendix 2): Parameter Based on 2007 Based on Population of trout >15 cm long 2,027 2,129 Population of trout >30 cm long Bioenergentics indicates piscivory? yes yes smolt survival through reservoir based on bioenergetics model (assuming piscivory at >30 cm long) Length range of trout with fish in stomachs 0-23% 8-32% 37 cm, 45 cm 23cm The updated report concludes that predation continues to have a high potential to substantially reduce the survival of smolts through the reservoir, but indicates that conditions may change after anadromous fish access the area. It recommends that survival of smolts through the reservoir be directly measured by mark-recapture methods after anadromous fish are present, and that predator control be implemented as warranted based on monitoring results (Appendix 2). For the 2010 season, if access allows it, we plan to continue sampling fish in both morning and evening periods. These fish will be gastric lavaged using the new lavaging system in a continued effort to examine for piscivorous activity and to see if there are differences in stomach contents depending on when they were captured. 6. Acknowledgments Work during 2009 was overseen by ODFW (D. Harris, S. Moyers) and PacifiCorp (R. Grost). Field assistance was provided by ODFW staff (many), PacifiCorp (R. Grost), USFS (C. Street), and primarily by three field technicians (Justin Miles, Hayden Howell) and Chris Sheely was specifically hired for this project by the Partnership for Umpqua Rivers and managed by ODFW. ODFW also provided smolt traps, management of the SA 19.2 electrofishing boat, nets, and other equipment. Stillwater Sciences has assisted under various contracts with technical analyses of resident fish and predator populations. 55
165 APPENDIX 1. STILLWATER SCIENCES, ANALYSIS OF 2009 ANGLING SURVEY DATA 56
166 850 G Street, Suite K, Arcata, CA phone fax TECHNICAL MEMORANDUM DATE: 29 July 2010 TO: FROM: SUBJECT: TWG of the RCC Peter Baker and Dirk Pedersen Analysis of 2009 Angling Survey Data 1 INTRODUCTION Rainbow trout (Oncorhynchus mykiss) and brown trout (Salmo trutta) in the reach from Slide Creek Dam to the Slide Creek Powerhouse were sampled in a series of angling surveys from late August through early October As fish were caught, existing fin clips were recorded and new clips optionally added, with the intention of obtaining data from which population estimates could be made using mark-recapture estimators. Four or five distinct sampling efforts were conducted, with each of the three main segments of the survey reach visited four times. Two different clips were used. The original analysis consisted of interpreting the data as a simple mark-recapture experiment, and applying the classical Peterson estimator. The model for this estimator requires that the population is closed (no births, deaths, immigration, or emigration), that two randomly drawn subsets are taken, and that the sizes of these subsets and of their intersection are known. There are a number of different ways of interpreting and grouping the angling recoveries into mark, capture, and recapture classes suitable for application of this estimator. The original analysis used two different groupings resulting in two different population estimates, raising problem of deciding which one is most appropriate. Another limitation of the original analysis was that no information about the uncertainty of the population estimates (i.e., variances or confidence intervals) was developed. A potential limiation with using the Peterson method to evaluate this data set compared with other estimators is that it discards information that was present in the original data for example, the fact that two different marks were used, and that more than two capture events can be distinguished. Because the number of fish recovered with marks was very small, any population estimates made from these data will be highly uncertain, so this loss of information is potentially especially relevant. We therefore revisited the data using models within Program MARK and other sources to see if it was possible to make fuller use of the data with an alternate estimator. An additional goal was to assess variance and develop confidence intervals for the population estimates.
167 Technical Memorandum Analysis of 2009 Angling Survey Data 2 METHODS The protocol as actually developed and implemented over the course of the surveys was rather complex. For the purposes of this report, it can be roughly summarized as a multiple markrecapture experiment as follows. The study reach was divided into three segments. The survey effort can be divided into four passes: Segment Survey 1 Survey 2 Survey 3 Survey 4 Slide Creek Dam to Slide Creek Bridge 8/25 8/31 9/14, 9/15 9/23 Slide Creek Bridge to Fish Creek 8/26 9/1 9/16 9/24 Fish Creek to Slide Creek Powerhouse 8/26, 8/27 9/2 9/21 10/5 On survey 1, captured fish were measured, given an upper caudal fin clip and released. On survey 2, captured fish were measured and examined for upper caudal clips, given an upper caudal fin clip if not already present, and released. On survey 3, captured fish were measured and examined for clips, given a lower caudal fin clip, and released. On survey 4, captured fish were examined for clips only (and released). There were a few departures from these survey protocols. On survey 2, in the Slide Creek Dam to Slide Creek Bridge segment, two rainbow trout found with upper caudal clips were given lower caudal clips before release, and one rainbow trout found without a clip was released without being clipped (because it was hooked in the gill and bleeding). These departures were not considered directly in the revised estimates. Since the number of fish seen was only a small fraction of the total number of fish present, the difference between a single fish which dies after release and a fish that was marked but never captured again is unlikely to affect the results in a meaningful way, so we treated the gill-caught fish as if it had in fact been given a mark and released in good health. Similarly, no fish were actually encountered with both upper caudal and lower caudal marks, so the two fish prematurely given lower caudal marks were treated as if they had been marked as expected. With four passes, sixteen distinct capture histories are possible. An unusual aspect of these data, however, is that not all of these are distinguishable. In particular, when a fish is caught in the third or fourth survey bearing an upper caudal clip, one can be sure it had previously been caught also in one of the first two surveys, but there is no way to determine which. The MARK software provides for very many contingencies. However, this ambiguity of capture history is not one of them. We identified two ways of collapsing the data which are analyzable in MARK while still retaining more data than the simple Peterson model: 2.1 Model A This consists of treating the data from the first two surveys and from the last two surveys as two independent two-sample mark recapture experiments, with distinct capture probabilities but a common value for the true population. 2 Stillwater Sciences
168 Technical Memorandum Analysis of 2009 Angling Survey Data 2.2 Model B This consists of treating the data as a three-sample experiment, combining the first and second surveys. Because the sample sizes are so small, all the MARK analyses with the added assumption that the probability of capture is independent of prior capture history (in MARK jargon, c=p ). In this situation, however, it is known that the numbers of individuals seen in each pass, together with the total number of distinct individuals seen in all passes, are sufficient statistics for estimation. That is, it is actually possible to fit the full four-sample model: 2.3 Model C This is the four-sample model, under the conditions described. There are several limitations on the use of Model C. The first is simply that it cannot be formulated directly in MARK. We carried out the analysis (using the R program) using the methods of J.N. Darroch, as described in Section of (Seber 1982). The second is that, since the sufficient statistics determine the likelihood function only up to an additive constant, there is no way to calculate goodness-of-fit measures by which it could be compared with the other models. We will discuss this briefly in the Discussion section below. 3 RESULTS 3.1 Model A (Program MARK: c=p, p~time, common N) Table 1. Rainbow only. AIC= BIC= Parameter Estimate Standard error 95% confidence interval Lower Upper pr. of capture survey pr. of capture survey pr. of capture survey pr. of capture survey Rainbow population There were no recoveries of marked brown trout; consequently, it was not possible to estimate the brown trout population without making some assumptions about the capture probabilities. Under the (rather dubious) assumption that the capture probability is the same for browns as for rainbows, we can form the following estimate: 3 Stillwater Sciences
169 Technical Memorandum Analysis of 2009 Angling Survey Data Table 2. Rainbow and Brown, capture probability independent of species. AIC= BIC= Parameter Estimate Standard error 95% confidence interval Lower Upper pr. of capture survey pr. of capture survey pr. of capture survey pr. of capture survey Rainbow population Brown trout population Model B (Program MARK: c=p, p~time) Table 3. Rainbow only. AIC= BIC= Parameter Estimate Standard error 95% confidence interval Lower Upper pr. of capture surveys 1 or pr. of capture survey pr. of capture survey Rainbow population Table 4. Rainbow and Brown, capture probability independent of species. AIC= BIC= Parameter Estimate Standard error 95% confidence interval Lower Upper pr. of capture surveys 1 or pr. of capture survey pr. of capture survey Rainbow population Brown trout population Model C (Darroch) Table 5. Rainbow only. 95% confidence interval Parameter Estimate Standard error Lower Upper Rainbow population The formulation of Model C we are using does not naturally permit the simultaneous estimation of rainbow and brown trout populations as was done under Models A and B. 4 Stillwater Sciences
170 Technical Memorandum Analysis of 2009 Angling Survey Data 4 REACH-SPECIFIC POPULATION ESTIMATES The same models can be applied on a reach-by-reach basis. Suppressing the capture probabilities, we have: Table 6. Model A (rainbow and brown trout). Parameter Population Estimate Std. err. 95% conf. interval Lower Upper Slide Creek Dam to Rainbow 1, ,552 Slide Creek Bridge Brown Slide Creek Bridge to Rainbow Fish Creek Brown Fish Creek to Rainbow Slide Creek Powerhouse Brown Table 7. Model B (rainbow and brown trout). Parameter Population Estimate Std. err. 95% conf. interval Lower Upper Slide Creek Dam to Rainbow Slide Creek Bridge Brown Slide Creek Bridge to Rainbow Fish Creek Brown Fish Creek to Rainbow ,873 Slide Creek Powerhouse Brown Table 8. Model C (rainbow trout only). Parameter Population Estimate Std. err. 95% conf. interval Lower Upper Slide Creek Dam to Rainbow ,382 Slide Creek Bridge Brown Slide Creek Bridge to Rainbow ,128 Fish Creek Brown Fish Creek to Rainbow n/a 1 Slide Creek Powerhouse Brown 1 Insufficient data 5 DISCUSSION With three estimates of trout abundance, which should be accepted? Models A and B both use full likelihoods and it is therefore possible to calculate and compare goodness-of-fit measures such as Akaike s Information Criterion (AIC) and the Bayesian Information Criterion (BIC). Based on these criterion, Model A is unambiguously better (that is, yields smaller criterion values) than Model B under either criterion, for both the one-species and two-species models. 5 Stillwater Sciences
171 Technical Memorandum Analysis of 2009 Angling Survey Data It is not possible to calculate AIC or BIC values for Model C. However, Model C is the only one of the models considered which makes full use of the data (that is, Models A and B both aggregate the data in ways which discard some information). Since the Model C estimate is close to that of Model A, with a tighter confidence interval, it is considered the best estimate for the rainbow population. Since the Model C cannot provide an estimate for brown trout, Model A provides the best estimate for brown trout and the best estimate overall. Although reasonable estimates were be developed from the available data, the confidence intervals on the estimates are relatively wide and indicate that a larger sample size with a greater number of recaptures would be required to improve the estimates to level that would be useful for detecting changes to the population over time. The consequences of having a small sample size are even more pronounced at the reach scale. Despite the apparent accuracy of the estimates (with lots of significant digits, standard errors, and confidence bounds), they should be treated with caution. All of the estimates rely on the assumption that all fish were equally likely to be captured in any particular sampling period. This assumption is certainly false. It is well known that individual fish vary significantly in catchability, and that prior experience of being caught can affect the probability of being caught again. One of the advantages of using the MARK software is that it is possible to explore the consequences of relaxing this assumption in various ways; unfortunately, the 2009 data set is too small to pursue this. The caution in interpreting the rainbow estimates should be increased in interpreting the brown trout estimates, since these rely on the added assumption that brown and rainbow trout are equally catchable. 6 REFERENCES Seber, G. A. F The estimation of animal abundance. Second edition. Charles Griffin & Company Ltd., London, England 6 Stillwater Sciences
172 APPENDIX 2. STILLWATER SCIENCES, PREDATION STUDY UPDATED RESULTS 57

173 850 G Street, Suite K, Arcata, CA phone fax TECHNICAL MEMORANDUM DATE: 24 February 2010 TO: FROM: SUBJECT: North Umpqua Hydroelectric Project Resource Coordination Committee Dirk Pedersen, Stillwater Sciences SA 19.2 Soda Springs Reservoir Predation Study, Updated results based on addition of 2008 and 2009 data 1 INTRODUCTION AND PURPOSE This document provides an update on studies conducted in 2006 and 2007 and reported in SA 19.2 Soda Springs Reservoir Predation Study (Stillwater Sciences 2008). The Soda Springs Reservoir predation study was implemented under pre-passage conditions to examine conditions that may occur after fish passage provisions have been implemented at Soda Springs Dam. The purpose of this pre-passage reservoir predation study was to estimate the existing predator population and assess whether the existing predator populations could consume a substantial proportion of juvenile anadromous fish that would likely be produced upstream of the reservoir, once fish passage provisions are implemented. The results of this study will help inform the potential need for and merit of predator control measures. This intent of this document is to incorporate data collected during 2008 and 2009 with previous data from 2006 and 2007 and assess whether any of the results, conclusions, or recommendations may change based on this information. Details regarding the purpose, approach, methods and previous results from this study are reported in Stillwater Sciences (2008), and are not repeated here. Rather, new data from 2008 and 2009 are summarized; analyses relevant to this update is briefly described; and a summary of results, including a comparison with previous results and conclusions, is provided. 2 SUMMARY OF DATA AND ANALYSES Methods used during fish capture and processing efforts in 2008 and 2009 were similar to those conducted previously (Stillwater Sciences 2008) although fish were exclusively captured using boat electrofishing. Fish greater than 150 mm were tagged with a full-duplex or half-duplex passive integrated transponder (PIT) tag. Lavage samples of stomach contents were collected to document food items and piscivory, but predator consumption was not estimated directly via releases of fry and smolt. Scales were not collected so ages could not be determined for fish captured during 2008 and 2009.
Monitoring Project - Final Report Metrics Form
 Monitoring Project - Final Report Metrics Form OWEB receives a portion of its funds from the federal government and is required to report how its grantees have used those funds. The information you provide
OREGON DEPARTMENT OF FISH AND WILDLIFE ROGUE FISH DISTRICT REPORT
 OREGON DEPARTMENT OF FISH AND WILDLIFE ROGUE FISH DISTRICT REPORT TITLE: Upper Rogue Smolt Trapping Project, 1999 STREAM: Big Butte, Little Butte, South Fork Big Butte, Slate and West Fork Evans Creeks
Sub-watershed Summaries
 Project Description The Salmon Drift Creek Watershed Council (SDCWC) has focused their efforts in the Salmon River estuary for the past few years. The multifaceted partnership effort is nearing completion
ASSESSMENT OF THE STATUS OF NESTUCCA RIVER WINTER STEELHEAD
 ASSESSMENT OF THE STATUS OF NESTUCCA RIVER WINTER STEELHEAD Gary Susac and Steve Jacobs Coastal Salmonid Inventory Project Oregon Department of Fish and Wildlife August 21, 2001 INTRODUCTION This report
1998 Willow Creek Downstream Migrant Trap Report. Draft. Prepared By: C. A. Walker. Lower Trinity Ranger District. Six Rivers National Forest
 1998 Willow Creek Downstream Migrant Trap Report Draft Prepared By: C. A. Walker Lower Trinity Ranger District Six Rivers National Forest September 1998 Executive Summary The downstream migrant trap was
Abundance of Steelhead and Coho Salmon in the Lagunitas Creek Drainage, Marin County, California
 scanned for KRIS Abundance of Steelhead and Coho Salmon in the Lagunitas Creek Drainage, Marin County, California Prepared for: Marin Municipal Water District 220 Nellen Drive Corte Madera, California
Blue Creek Chinook Outmigration Monitoring Technical Memorandum
 Blue Creek Chinook Outmigration Monitoring 2012 Technical Memorandum Prepared by: Andrew Antonetti and Erika Partee Yurok Tribe Fisheries Program PO Box 1027 Klamath, California 95548 In Partnership with:
OREGON DEPARTMENT OF FISH AND WILDLIFE ROGUE WATERSHED DISTRICT REPORT INTRODUCTION
 OREGON DEPARTMENT OF FISH AND WILDLIFE ROGUE WATERSHED DISTRICT REPORT TITLE: Upper Rogue Smolt Trapping Project, 2003 STREAM: Bear, Little Butte, Elk, Slate and West Fork Evans Creeks and the Little Applegate
Final Bull Trout Genetics Monitoring Plan for the Wallowa Falls Hydroelectric Project. (FERC No. P-308) June 2017
 June 2017") Final for the Wallowa Falls Hydroelectric Project (FERC No. P-308) June 2017 Prepared by: Jeremiah Doyle PacifiCorp 825 NE Multnomah Street Portland, OR 97232 June, 2017 Page 1 of 8 Table of Contents 1.0
Final for the Wallowa Falls Hydroelectric Project (FERC No. P-308) June 2017 Prepared by: Jeremiah Doyle PacifiCorp 825 NE Multnomah Street Portland, OR 97232 June, 2017 Page 1 of 8 Table of Contents 1.0
THE CONFEDERATED TRIBES OF THE WARM SPRINGS RESERVATION OF OREGON
 THE CONFEDERATED TRIBES OF THE WARM SPRINGS RESERVATION OF OREGON To: Branch of Natural Resources P.0. Box C, Warm Springs, Oregon 97761 Phone (541) 553-2002/2003 Fax (541) 553-1994 The Independent Science
STEELHEAD SURVEYS IN OMAK CREEK
 STEELHEAD SURVEYS IN OMAK CREEK 2002 Annual Report Prepared by Chris Fisher John Arterburn Colville Confederated Tribes Fish and Wildlife Department P.O. Box 150 Nespelem, WA 99155 Prepared for Project
Interim Guidance Fish Presence Absence
 Interim Guidance Fish Presence Absence Source: Forest Practices Act Guidance for Division 635 of the forest practices act dealing with stream classification when no fish surveys have been done (referenced
3. The qualification raised by the ISRP is addressed in #2 above and in the work area submittal and review by the ISRP as addressed in #1.
 Please find attached a response from The Confederated Tribes of the Warm Springs Reservation of Oregon (CTWSRO) for Project # 2008-301-00, Habitat Restoration Planning, Design and Implementation within
South Fork Chehalis Watershed Culvert Assessment
 South Fork Chehalis Watershed Culvert Assessment Water Resource Inventory Area 23 Lewis County Conservation District Final Report By: Kelly Verd and Nikki Wilson March 2003 Funded by: The Washington State
Southern Oregon Coastal Cutthroat Trout
 Species Management Unit Description Southern Oregon Coastal Cutthroat Trout The Southern Oregon Coastal Cutthroat Trout SMU includes all populations of cutthroat trout inhabiting ocean tributary streams
Oregon Coast Coastal Cutthroat Trout
 Oregon Coast Coastal Cutthroat Trout Species Management Unit Description The Oregon Coast Coastal Cutthroat Trout Species Management Unit (SMU) includes all populations of cutthroat trout inhabiting ocean
Data Report : Russian River Basin Steelhead and Coho Salmon Monitoring Program Pilot Study
 Data Report 1999-1: Russian River Basin Steelhead and Coho Salmon Monitoring Program Pilot Study Sonoma County Water Agency 215 West College Avenue Santa Rosa, California 951 Prepared by David Cook Senior
Study Update Fish Distribution and Species Composition
 Study Update Fish Distribution and Species Composition Goals and Study Area Gain a better understanding of fish species composition and abundance in waters associated with the Packwood Lake Hydroelectric
THE OREGON PLAN for. Salmon and Watersheds. Smith River Steelhead and Coho Monitoring Verification Study, Report Number: OPSW-ODFW
 THE OREGON PLAN for Salmon and Watersheds Smith River Steelhead and Coho Monitoring Verification Study, 2007 Report Number: OPSW-ODFW-2009-11 The Oregon Department of Fish and Wildlife prohibits discrimination
Calibration of Estimates of Coho Spawner Abundance in the Smith River Basin, 2001 Report Number: OPSW-ODFW
 for Salmon and Watersheds Calibration of Estimates of Coho Spawner Abundance in the Smith River Basin, 2001 Report Number: OPSW-ODFW-2002-06 Calibration of Estimates of Coho Spawner Abundance in the Smith
Yale Reservoir Kokanee (Oncorhynchus nerka) Escapement Report 2016
 Escapement Report 2016") Yale Reservoir Kokanee (Oncorhynchus nerka) Escapement Report 2016 North Fork Lewis River Hydroelectric Project Yale FERC No. 2071 Prepared by: Jeremiah Doyle, PacifiCorp April 4, 2017 1.0 INTRODUCTION
Yale Reservoir Kokanee (Oncorhynchus nerka) Escapement Report 2016 North Fork Lewis River Hydroelectric Project Yale FERC No. 2071 Prepared by: Jeremiah Doyle, PacifiCorp April 4, 2017 1.0 INTRODUCTION
Final Bull Trout Redd Monitoring Report for the Wallowa Falls Hydroelectric Project
 Final for the Wallowa Falls Hydroelectric Project East Fork Wallowa River barrier to upstream fish migration, photo courtesy of Kendrick Moholt (FERC No. P-308) December 18, 2017 Prepared by: Jeremiah
NATIVE FISH CONSERVATION PLAN FOR THE SPRING CHINOOK SALMON ROGUE SPECIES MANAGEMENT UNIT
 Attachment 4 NATIVE FISH CONSERVATION PLAN FOR THE SPRING CHINOOK SALMON ROGUE SPECIES MANAGEMENT UNIT Figures in Draft Plan of February 28, 27 Figure 1. Map of the Rogue River Basin. PASSAGE ESTIMATES
Oregon Chapter American Fisheries Society Nongame Native Fish Workshop. Tiller, OR 9/13/16
 Oregon Chapter American Fisheries Society Nongame Native Fish Workshop Tiller, OR 9/13/16 UMPQUA OVERVIEW Drains 3.2 million acres & encompasses Douglas Co. Is 111 RM to the confluence North is 106 RM
STREAM SURVEY File form No..
 scanned for KRIS THE RESOURCES AGENCY OF CALIFORNIA California Department of Fish and Game STREAM SURVEY File form No.. Date: September 4, 1969. NAME: North Fork Schooner Gulch Creek COUNTY: Mendocino.
Redd Dewatering and Juvenile Salmonid Stranding in the Lower Feather River,
 Redd Dewatering and Juvenile Salmonid Stranding in the Lower Feather River, 2005-2006 Interim Report for NOAA Fisheries Prepared by: California Department of Water Resources Division of Environmental Services
State of California The Resources Agency DEPARTMENT OF FISH AND GAME
 State of California The Resources Agency DEPARTMENT OF FISH AND GAME FINAL REPORT SHASTA AND SCOTT RIVER JUVENILE SALMONID OUTMIGRATION MONITORING PROJECT Prepared for the Pacific States Marine Fisheries
Newaukum Watershed Culvert Assessment
 Newaukum Watershed Culvert Assessment Water Resource Inventory Area 23 Lewis County Conservation District Final Report By: Kelly Verd and Nikki Wilson July 2002 Funded by: Chehalis Fisheries Restoration
***Please Note*** April 3, Dear advisory committee members:
 April 3, 29 Dear advisory committee members: The fifth meeting of the CHF advisory committee will be held April 13 in Grants Pass from 6:-8:3 PM, and the purpose of this document is to help committee members
THE OREGON. PLAN for. Salmon and Watersheds. Assessment of Western Oregon Adult Winter Steelhead Redd Surveys Report Number: OPSW-ODFW
 THE OREGON PLAN for Salmon and Watersheds Assessment of Western Oregon Adult Winter Steelhead Redd Surveys 2013 Report Number: OPSW-ODFW-2013-09 The Oregon Department of Fish and Wildlife prohibits discrimination
FISH HABITAT ASSESSMENT IN THE OREGON DEPARTMENT OF FORESTRY MIAMI STUDY AREA
 FISH HABITAT ASSESSMENT IN THE OREGON DEARTMENT OF FORESTRY MIAMI STUDY AREA July 11, 2005 eggy Kavanagh Charlie Stein Andy Talabere Kim Jones Oregon Department of Fish and Wildlife Aquatic Inventories
FISH PASSAGE IMPROVEMENT in California s Watersheds. Assessments & Recommendations by the Fish Passage Forum
 FISH PASSAGE IMPROVEMENT in California s Watersheds Assessments & Recommendations by the Fish Passage Forum FISH PASSAGE IMPROVEMENT in California s Watersheds The mission of the Fish Passage Forum is
Monitoring of Downstream Fish Passage at Cougar Dam in the South Fork McKenzie River, Oregon February 8, By Greg A.
 Monitoring of Downstream Fish Passage at Cougar Dam in the South Fork McKenzie River, Oregon 1998- February 8, 2 By Greg A. Taylor Oregon Dept. of Fish & Wildlife 315 E. Main Street Springfield, OR 97478
Job 1. Title: Estimate abundance of juvenile trout and salmon.
 STUDY PERFORMANCE REPORT State: Michigan Project No.: F-53-R-13 Study No.: 461 Title: Population dynamics of juvenile rainbow trout and coho salmon in Lake Superior tributaries Period Covered: April 1,
Executive Summary. Map 1. The Santa Clara River watershed with topography.
 Santa Clara River Steelhead Trout: Assessment and Recovery Opportunities December 2005 Prepared By: Matt Stoecker and Elise Kelley, Ph.D. University of California, Santa Barbara Prepared For: The Santa
BOGUS CREEK SALMON STUDIES 2002
 BOGUS CREEK SALMON STUDIES 2002 BY: JEANNINE RICHEY California Department of Fish and Game KLAMATH RIVER PROJECT 303 SOUTH STREET YREKA, CALIFORNIA 96097 (530) 842-3109 California Department of Fish and
Don Pedro Project Relicensing
 Don Pedro Project Relicensing M ODESTO I RRIGATION D ISTRICT TURLOCK I RRIGATION D ISTRICT FERC PROJECT N O. 2299 Resident Fish in Don Pedro Reservoir Don Pedro Reservoir Fish Stocking (1971-Present) CDFG
CHAPTER 4 DESIRED OUTCOMES: VISION, GOALS, AND OBJECTIVES
 CHAPTER 4 DESIRED OUTCOMES: VISION, GOALS, AND OBJECTIVES Vision One of the first steps in developing this Plan was articulating a vision - a clear statement of what the Plan strives to achieve and what
Mid-Columbia Fisheries Enhancement Group Annual Report Fiscal Year 06: July 1, 2005 June 30, 2006
 Mid-Columbia Fisheries Enhancement Group Annual Report Fiscal Year 06: July 1, 2005 June 30, 2006 Mission Statement The mission of the Mid-Columbia Fisheries Enhancement Group is to restore self-sustaining
Packwood Hydroelectric Project Barrier Analysis December 12, 2006
 Packwood Hydroelectric Project Barrier Analysis December 12, 2006 Study Area Natural barriers to upstream fish passage on Lake Creek at RM 1.03 and RM 1.95 Snyder Creek culvert under the Project tailrace
FISHERIES BLUE MOUNTAINS ADAPTATION PARTNERSHIP
 FISHERIES A warming climate, by itself, substantially affects the hydrology of watersheds in the Blue Mountains. Among the key hydrologic changes projected under all scenarios for the 2040s and beyond
State of San Francisco Bay 2011 Appendix O Steelhead Trout Production as an Indicator of Watershed Health
 State of San Francisco Bay 2011 Appendix O Steelhead Trout Production as an Indicator of Watershed Health Gordon Becker and Katherine Smetak, Center for Ecosystem Management and Restoration 290 Introduction
Klamath Lake Bull Trout
 Klamath Lake Bull Trout Existing Populations The Klamath Lake Bull Trout SMU is comprised of seven existing populations and four populations classified as extinct or functionally extinct (Table 189). Populations
Steelhead Society of BC. Thompson River Watershed Restoration and Enhancement Project #4 Nicola River Bank Stabilization and Enhancement Project
 Steelhead Society of BC Presents: Thompson River Watershed Restoration and Enhancement Project #4 Nicola River Bank Stabilization and Enhancement Project Application for Funding December 2013 1.0 BACKGROUND
Willow Creek Road 2 nd Bridge Area Fish Passage Project Jenner, Sonoma County, California Final Fisheries Monitoring Report April 2014
 Willow Creek Road 2 nd Bridge Area Fish Passage Project Jenner, Sonoma County, California Final Fisheries Monitoring Report April 2014 Prepared for: Stewards of the Coast and Redwoods P.O. Box 2 Duncans
Minnesota Department of Natural Resources Division of Fish and Wildlife Section of Fisheries. Stream Survey Report. Luxemburg Creek.
 Minnesota F-29-R(P)-24 Area 315 Study 3 March 2016 Minnesota Department of Natural Resources Division of Fish and Wildlife Section of Fisheries Stream Survey Report Luxemburg Creek 2015 Mark Pelham Sauk
Minnesota Department of Natural Resources Fisheries Division, Lake Superior Area
 Minnesota F-9-R(P)- Study 4 Job 616 Minnesota Department of Natural Resources Fisheries Division, Lake Superior Area Coaster Brook Trout Status in Minnesota-Lake Superior Tributaries Following Regulation
San Lorenzo Valley Water District, Watershed Management Plan, Final Version Part I: Existing Conditions Report
 LIST OF FIGURES Figure 1-1. Map of the San Lorenzo River watershed Figure 2-1. The Santa Cruz Mountains Bioregion Figure 2-2. Protected areas within the San Lorenzo River watershed Figure 2-3. Primary
Michigan Department of Natural Resources Status of the Fishery Resource Report Page 1
 Michigan Department of Natural Resources 2008-59 Status of the Fishery Resource Report Page 1 Bowens Manistee County, (T24N R16W Sec. 11, 12, 13, 14, 15, 24, and 30). Last surveyed 2008 Mark A. Tonello
Estimating Summer Steelhead Escapement using Redd Surveys: What have we learned and where do we go? Jim Ruzycki Oregon Department of Fish & Wildlife
 Estimating Summer Steelhead Escapement using Redd Surveys: What have we learned and where do we go? Jim Ruzycki Oregon Department of Fish & Wildlife Spawner Abundance for the John Day Summer Steelhead
August 11 Snorkel SCC side channel network (SBA, SCC3) feet 707
 feet 707") Date Survey Type Habitat July 29 Snorkel (reconnaissance) Table 1. Fish use survey schedule 2004 Water temperature 1 (ºC) Estimated Mean visibility 2 discharge 3 (cfs) Mainstem (units #1 42) ND ND 814
Date Survey Type Habitat July 29 Snorkel (reconnaissance) Table 1. Fish use survey schedule 2004 Water temperature 1 (ºC) Estimated Mean visibility 2 discharge 3 (cfs) Mainstem (units #1 42) ND ND 814
Study Update Tailrace Slough Use by Anadromous Salmonids
 Study Update Tailrace Slough Use by Anadromous Salmonids Goals and Objectives Identify what anadromous salmonids use the tailrace slough by: Life Stage (Juvenile, migrating and spawning adults) Timing
Salmon Biology Station
 Salmon Biology Station OBJECTIVES: Students learn: Wild salmon are indicator species and keystone species whose survival is connected to the health of the watershed. o Riparian salmon need trees and trees
COA-F17-F-1343 YEAR END REPORT
 DAVE MARSHALL SALMON RESERVE RESTORATION, MAINTENANCE, AND UPGRADES YEAR END REPORT Prepared for: Fish and Wildlife Compensation Program Prepared by: Edith Tobe, RPBio, Executive Director Box 1791, Squamish,
Rogue Winter Steelhead
 Rogue Winter Steelhead Existing Populations The Rogue Winter Steelhead SMU includes eight populations within the Klamath Mountains Province (KMP) in southwest Oregon (Table 93). None of the populations
Summer Steelhead Surveys North Fork Trinity River Trinity County, California
 KRIS edition Summer Steelhead Surveys North Fork Trinity River Trinity County, California 1978-1997 By Loren Everest Fishery Biologist Weaverville Ranger District Shasta-Trinity National Forests October
Rehabilitation of Grimes Creek, a Stream Impacted in the Past by Bucket-lined Dredge Gold Mining, Boise River Drainage, July 2008 to August 2011.
 Rehabilitation of Grimes Creek, a Stream Impacted in the Past by Bucket-lined Dredge Gold Mining, Boise River Drainage, July 2008 to August 2011. Pam Harrington TU,1020 W. Main Street Suite 440, Boise,
Fish Passage Culvert Assessment for Cahilty Creek Watershed FIA Project #
 Fish Passage Culvert Assessment for Cahilty Creek Watershed FIA Project # 4602004 Prepared for Weyerhaeuser Company Ltd. Jason Ladyman R.P.F. 1550 Mission Flats Road PO Box 40 Kamloops BC V2C 5K3 Prepared
Walker Creek Salmon Monitoring Program FINAL COMPILATION REPORT
 FINAL COMPILATION REPORT Submitted to: California Department of Fish and Game Fishery Restoration Grant Program Grant No. P053414 Submitted by: Marin Municipal Water District (MMWD) 220 Nellen Avenue Corte
Chinook Salmon Spawning Study Russian River Fall 2005
 Chinook Salmon Spawning Study Russian River Fall 2005 Sonoma County Water Agency 2150 West College Avenue Santa Rosa, California 95401 Prepared by David Cook - Senior Environmental Specialist March 27,
Big Spring Creek Habitat Enhancement and Fishery Management Plans
 Big Spring Creek Habitat Enhancement and Fishery Management Plans November 5, 2012 Big Spring Events and Activities Center Newville, PA Charlie McGarrell Regional Habitat Biologist Pennsylvania Fish and
MINNESOTA DEPARTMENT OF NATURAL RESOURCES DIVISION OF FISHERIES AND WILDLIFE. Gamefish Assessment Report
 Minnesota DNR F-29-R(P) Area F312 February 1, 2013 MINNESOTA DEPARTMENT OF NATURAL RESOURCES DIVISION OF FISHERIES AND WILDLIFE Gamefish Assessment Report Spring Gamefish Assessment on the Mississippi
Limiting Factors Assessment and Restoration Plan. Bear Creek
 Limiting Factors Assessment and Restoration Plan Bear Creek A Tributary to Salmon River January 2009 Prepared by Bio-Surveys, LLC P.O. Box 65 Alsea, OR 97324 541-487-4338 Contact: Steve Trask, Mary Holbert
CHAPTER 2 - THE COQUILLE FISHERY
 CHAPTER 2 - THE COQUILLE FISHERY TABLE OF CONTENTS A. INTRODUCTION... 2-1 FIGURE 2-1 Life Histories of Anadromous Salmonids in the Coquille River... 2-2 1. Coho Salmon... 2-2 FIGURE 2-2 Coho Packed or
Juvenile Steelhead and Stream Habitat Conditions Steelhead and Coho Salmon Life History Prepared by: DW ALLEY & Associates, Fishery Consultant
 Juvenile Steelhead and Stream Habitat Conditions Steelhead and Coho Salmon Life History Prepared by: DW ALLEY & Associates, Fishery Consultant I-1. Steelhead and Coho Salmon Ecology Migration. Adult steelhead
LIFE HISTORY DIVERSITY AND RESILIENCE
 LIFE HISTORY DIVERSITY AND RESILIENCE SPRING CHINOOK IN THE WILLAMETTE RIVER BASIN Kirk Schroeder Brian Cannon Luke Whitman Paul Olmsted Oregon Department of Fish and Wildlife Corvallis Research Lab Thanks
Horse Linto Creek Anadromous Monitoring Project. Funded by: SB-271 California Department of Fish and Game Agreement #P
 2000-2001 Horse Linto Creek Anadromous Monitoring Project Funded by: SB-271 California Department of Fish and Game Agreement #P0010554 Prepared By: Heidi Peura Lower Trinity Ranger District November 2001
CHINOOK AND COHO SPAWNING REPORT LOWER TRINITY RANGER DISTRICT SIX RIVERS NATIONAL FOREST. Final: April 1999
 1998-99 CHINOOK AND COHO SPAWNING REPORT LOWER TRINITY RANGER DISTRICT SIX RIVERS NATIONAL FOREST Final: April 1999 Prepared By: Becky L. Dutra and Sean A. Thomas, AmeriCorps Watershed Stewards Project
Bull Trout Salvelinus confluentus Population and Habitat Surveys in the McKenzie and Middle Fork Willamette Basins, 2000
 Bull Trout Salvelinus confluentus Population and Habitat Surveys in the McKenzie and Middle Fork Willamette Basins, 2000 Greg Taylor Oregon Department of Fish and Wildlife 3150 E. Main Street Springfield,
REVISED DRAFT HABITAT SUITABILITY CURVES and COHO SALMON and STEELHEAD TROUT. Sawmill Creek Alaska
 REVISED DRAFT HABITAT SUITABILITY CURVES and COHO SALMON and STEELHEAD TROUT Sawmill Creek Alaska Blue Lake Hydroelectric Project, FERC No. 2230, Relicensing Prepared by: City and Borough of Sitka ( City
NEVADA DEPARTMENT OF WILDLIFE STATEWIDE FISHERIES MANAGEMENT FEDERAL AID JOB PROGRESS REPORTS F LAHONTAN CUTTHROAT TROUT EASTERN REGION
 NEVADA DEPARTMENT OF WILDLIFE STATEWIDE FISHERIES MANAGEMENT FEDERAL AID JOB PROGRESS REPORTS F-20-50 2014 LAHONTAN CUTTHROAT TROUT EASTERN REGION NEVADA DEPARTMENT OF WILDLIFE, FISHERIES DIVISION ANNUAL
Annual Report for Fiscal Year and Future Plans for the Tillamook Bay Watershed Council
 Annual Report for Fiscal Year 2012-2013 and Future Plans for the Tillamook Bay Watershed Council A report prepared for the Tillamook County Board of Commissioners August 2013 Table of Contents: Recently
Coho. Oregon Native Fish Status Report 13
 12 Coho Coho salmon are widespread in small, low gradient streams of the coast and lower Columbia. They enter freshwater and spawn after fall rains raise river levels, typically from September through
NEVADA DEPARTMENT OF WILDLIFE STATEWIDE FISHERIES MANAGEMENT
 NEVADA DEPARTMENT OF WILDLIFE STATEWIDE FISHERIES MANAGEMENT FEDERAL AID JOB PROGRESS REPORTS F-20-52 2016 REDBAND TROUT EASTERN REGION NEVADA DEPARTMENT OF WILDLIFE, FISHERIES DIVISION ANNUAL JOB PROGRESS
Final Fish Salvage & Temporary Tailrace Barrier Report for the Wallowa Falls Hydroelectric Project Tailrace. (FERC No. P-308) December 18, 2017
 December 18, 2017") Final for the Wallowa Falls Hydroelectric Project Tailrace (FERC No. P-308) December 18, 2017 Prepared by: Jeremiah Doyle PacifiCorp 825 NE Multnomah Street Portland, OR 97232 December 18, 2017 Page 1
Final for the Wallowa Falls Hydroelectric Project Tailrace (FERC No. P-308) December 18, 2017 Prepared by: Jeremiah Doyle PacifiCorp 825 NE Multnomah Street Portland, OR 97232 December 18, 2017 Page 1
NAPA RIVER SALMON MONITORING PROGRAM SPAWNING YEAR 2007 REPORT AUGUST, 2008 PREPARED BY JONATHAN KOEHLER SENIOR BIOLOGIST
 NAPA RIVER SALMON MONITORING PROGRAM SPAWNING YEAR 2007 REPORT AUGUST, 2008 PREPARED BY CONTACT: JONATHAN KOEHLER SENIOR BIOLOGIST CHAD EDWARDS BIOLOGIST (707) 252 4188 X 109 (707) 252 4188 X 116 JONATHAN@NAPARCD.ORG
Preliminary Summary of Out-of-Basin Steelhead Strays in the John Day River Basin
 Preliminary Summary of Out-of-Basin Steelhead Strays in the John Day River Basin Prepared by: James R. Ruzycki and Richard W. Carmichael Oregon Department of Fish and Wildlife La Grande, Oregon Introduction
Cemetery Creek Smolt Trap Data Summary What is a smolt? What is a smolt trap? Cemetery Creek Smolt Trap Data:
 Cemetery Creek Smolt Trap Data Summary What is a smolt? A "smolt" is one of the life stages of a juvenile salmon. This life stage occurs when the juvenile salmon begins its migration from freshwater to
Project Completion Abstract Fish Passage Activity ( Engineering Activities)
") Project Completion Abstract Fish Passage Activity ( Engineering Activities) SUBMIT COMPLETED FORM TO DISTRICT MANAGER AND FIA ADMINISTRATOR AFTER PROJECT COMPLETION SECTION A GENERAL INFORMATION Recipient:
Project Completion Abstract Fish Passage Activity ( Engineering Activities) SUBMIT COMPLETED FORM TO DISTRICT MANAGER AND FIA ADMINISTRATOR AFTER PROJECT COMPLETION SECTION A GENERAL INFORMATION Recipient:
Assessment of Baseline Geomorphic Features at. Proposed Stream Crossings On The Proposed County Road 595. Marquette County, Michigan
 Assessment of Baseline Geomorphic Features at Proposed Stream Crossings On The Proposed County Road 595 Marquette County, Michigan Prepared for: Kennecott Eagle Minerals Company Marquette, Michigan Prepared
The Calawah River System
 The Calawah River System The Calawah River is the largest tributary of the Bogachiel River and is formed by the confluence of the north and south forks of the Calawah. The two forks of the Calawah, CALAWAH
Study No. 18. Mystic Lake, Montana. PPL Montana 45 Basin Creek Road Butte, Montana 59701
 Study No. 18 Evaluation of the Current Fish Population and Habitat in West Rosebud Creek Downstream from Emerald Lake Mystic Lake Hydroelectric Project FERC No. 2301 Mystic Lake, Montana PPL Montana 45
NEVADA DEPARTMENT OF WILDLIFE STATEWIDE FISHERIES MANAGEMENT
 NEVADA DEPARTMENT OF WILDLIFE STATEWIDE FISHERIES MANAGEMENT FEDERAL AID JOB PROGRESS REPORTS F-20-52 2016 Lake Tahoe Rainbow Trout Study WESTERN REGION NEVADA DEPARTMENT OF WILDLIFE, FISHERIES DIVISION
Proposed Habitat Suitability Criteria (HSC) Curves For Application in Habitat Flow Modeling For the Sultan River Instream Flow Study RSP 3
 Curves For Application in Habitat Flow Modeling For the Sultan River Instream Flow Study RSP 3") - - Proposed Habitat Suitability Criteria (HSC) Curves For Application in Habitat Flow Modeling For the Sultan River Instream Flow Study RSP 3 Prepared for: Public Utility District No. 1 of Snohomish County
- - Proposed Habitat Suitability Criteria (HSC) Curves For Application in Habitat Flow Modeling For the Sultan River Instream Flow Study RSP 3 Prepared for: Public Utility District No. 1 of Snohomish County
1996 Progress Report. Anadromous Salmonid Escapement and Downstream Migration Studies. in Prairie Creek, California,
 1996 Progress Report Anadromous Salmonid Escapement and Downstream Migration Studies in Prairie Creek, California, 1995-1996 By Dr. Terry Roelofs and Bernard Klatte Humboldt State University Arcata, California
SECTION F FISH HABITAT CONDITION AND AQUATIC SPECIES DISTRIBUTION
 SECTION F FISH HABITAT CONDITION AND AQUATIC SPECIES DISTRIBUTION INTRODUCTION The fish species currently inhabiting the Gualala River WAU are steelhead trout (Oncorhynchus mykiss), sculpin (Cottus spp.),
ELK RIVER WATERSHED ACTION PLAN
 ELK RIVER WATERSHED ACTION PLAN Prepared for The Elk River Watershed Council Prepared by Chris Massingill Mainstream Contracting South Coast Watershed Council September 2001 South Coast Watershed Council
Juvenile Salmonid Monitoring on the Lower Trinity River, California, 2001
 Juvenile Salmonid Monitoring on the Lower Trinity River, California, 21 Prepared By: Seth W. Naman Scott Turo Tim Hayden Yurok Tribal Fisheries Program Hwy 96 Box 196 Hoopa, CA 95546 sethnaman@earthlink.net
2013 WHITE SALMON CHINOOK SALMON VSP MONITORING. Jeremy Wilson Washington Department of Fish and Wildlife
 2013 WHITE SALMON CHINOOK SALMON VSP MONITORING Jeremy Wilson Washington Department of Fish and Wildlife Study Area Outline History of WDFW Chinook Monitoring in WS 2013 Objectives 2013 Study Design 2013
Five Counties Salmonid Conservation Program - Fish Passage Design Workshop. February 2013
 Program - Aquatic Organisms and Stream Crossings Ecological Connectivity A watershed is a network of channels that drain a common boundary. Channel characteristics formed by interaction of precipitation,
Garcia and Associates One Saunders Avenue San Anselmo, CA Phone: (415) Fax: (415)
 Fax: (415)") Garcia and Associates One Saunders Avenue San Anselmo, CA 94960 Phone: 415) 458-5803 Fax: 415) 458-5829 To: From: Gregory Andrew, Fishery Program Manager Marin Municipal Water District Rob Aramayo Date:
Garcia and Associates One Saunders Avenue San Anselmo, CA 94960 Phone: 415) 458-5803 Fax: 415) 458-5829 To: From: Gregory Andrew, Fishery Program Manager Marin Municipal Water District Rob Aramayo Date:
P.O. Box 65 Hancock, Michigan USA fax
 This PDF file is a digital version of a chapter in the 2005 GWS Conference Proceedings. Please cite as follows: Harmon, David, ed. 2006. People, Places, and Parks: Proceedings of the 2005 George Wright
TABLE 1. Riverscape surveys completed in the upper Chehalis River, Newaukum, and Satsop rivers.
 RIVERSCAPE SURVEYS OF IN-STREAM FISH ASSEMBLAGES AND HABITAT IN THE CHEHALIS RIVER Mara Zimmerman and John Winkowski Washington Department of Fish and Wildlife, Fish Program EXECUTIVE SUMMARY Introduction
APPENDIX B. Final reports on chinook salmon spawning surveys - Sultan River, Washington Report
 APPENDX B Final reports on chinook salmon spawning surveys - Sultan River, Washington B-1. B-2. 1987 Report. 1988 Report APPENDX B-l Final report on 1987 chinook spawning survey - Sultan River, Snohomish
Winter Steelhead Redd to Fish conversions, Spawning Ground Survey Data
 Winter Steelhead Redd to Fish conversions, Spawning Ground Survey Data Oregon Department of Fish and Wildlife (ODFW); Corvallis Research Office Oregon Adult Salmonid Inventory and Sampling Project (June
NEVADA DEPARTMENT OF WILDLIFE STATEWIDE FISHERIES MANAGEMENT
 NEVADA DEPARTMENT OF WILDLIFE STATEWIDE FISHERIES MANAGEMENT FEDERAL AID JOB PROGRESS REPORT F-20-50 2014 LAHONTAN CUTTHROAT TROUT STUDY WESTERN REGION NEVADA DEPARTMENT OF WILDLIFE, FISHERIES DIVISION
2011 SUMMARY REPORT Juvenile Steelhead Densities in the San Lorenzo, Soquel, Aptos and Corralitos Watersheds, Santa Cruz County, CA
 211 SUMMARY REPORT Juvenile Steelhead Densities in the San Lorenzo, Soquel, Aptos and Corralitos Watersheds, Santa Cruz County, CA, Aquatic Biology Don Alley, Jerry Smith and Chad Steiner, Fishery Biologists
c h a p t e r 6 n n n Related to the VAMP
 c h a p t e r 6 n n n Complimentary Studies Related to the VAMP Throughout 27 several fishery studies were conducted to advance the understanding of juvenile salmon abundance and survival in the San Joaquin
Fish Habitat Restoration and Monitoring in Southeast Washington. Andy Hill Eco Logical Research, Inc.
 Fish Habitat Restoration and Monitoring in Southeast Washington Andy Hill Eco Logical Research, Inc. Fish Habitat Restoration and Monitoring in Southeast Washington Talk overview: Restoration projects
Discussion on the Selection of the Recommended Fish Passage Design Discharge
 Discussion on the Selection of the Recommended Fish Passage Design Discharge Introduction The provision of fish passage is a requirement for most proposed culvert and bridge installations in Alberta, depending