Sciences, University of Washington, Box , Seattle, WA USA. Center, 2725 Montlake Boulevard East, Seattle, Washington, 98112, USA
|
|
|
- Malcolm Noel Moore
- 5 years ago
- Views:
Transcription
1 Marine Survival of Puget Sound Chinook: Size-Selective Mortality Growth Limitation and Bioenergetics of Sub-Yearling Chinook Salmon in Puget Sound, Washington Kristin A. Connelly 1+, Jennifer R. Gardner 1, Madilyn M. Gamble 1*, Joshua W. Chamberlin 2, Amanda Winans 3, Julie Keister 3, David A. Beauchamp 1,4 1 Washington Cooperative Fish and Wildlife Research Unit, School of Aquatic and Fishery Sciences, University of Washington, Box , Seattle, WA USA 2 National Oceanic and Atmospheric Administration Fisheries, Northwest Fisheries Science Center, 2725 Montlake Boulevard East, Seattle, Washington, 98112, USA 3 School of Oceanography, University of Washington, Seattle, WA USA 4 U.S. Geological Survey, Western Fisheries Research Center, 6505 NE 65 th Street, Seattle, Washington USA + Present address: School of the Environment, Washington State University-Vancouver, NE Salmon Creek Dr, Vancouver, WA *Present address: Graduate Program in Ecology, Evolution, Ecosystems, and Society, Dartmouth College, 78 College Street, Hanover, NH 03755, USA Final Technical Report June 2018 Prepared for: Long Live the Kings: #LLTK-SSMSP-9 1
2 Executive Summary Chinook salmon from the Salish Sea have seen declining marine survival rates, a trend that has not been seen in adjacent regions. Previous work suggests this may be in part due to size selective mortality happening either within Puget Sound during the first marine summer, or occurring in subsequent life stages, but is highly influenced by growth performance during critical growth periods while rearing within Puget Sound. Nine distinct and traceable sub-yearling Chinook stocks from four watersheds (Nooksack, Skagit, Snohomish & Nisqually) were identified and used in all size-selective mortality and bioenergetics scenarios, of which two were natural-origin and seven hatchery-origin. We evaluated the ability to detect size-selective mortality from scales sampled from outmigrating sub-yearling Chinook salmon within distinct habitats and watersheds of Puget Sound prior to mid-summer of the first marine growth season. Based on growth-trajectories of back-calculated size-at-age (circuli) we found minimal evidence of size-selective mortality at the life stage level (habitat and sample period combination) or habitat level within stocks for either sampling year. Based on growth trajectories from scales as well as growth trajectories from observed weights, it appears that size-selective habitat use occurred in 2014, with fish of smaller average size-at-age more frequently captured in nearshore habitats than in offshore habitats. From bioenergetics, our findings suggest complex interactive effects among habitat, prey quality, prey availability, stock and time for sub-yearling Chinook salmon in Puget Sound. In general, feeding and growth were lower in 2014 than 2015, and were also lower in nearshore habitats than offshore habitats. No relationship was evident between prey quality and growth or feeding in either nearshore or offshore habitats. Temperature was less variable, cooler, and within the optimum range for juvenile Chinook growth in the offshore, but approached thermal tolerance limits during peak summer in the nearshore. The San Juan Islands were compared as an alternate rearing habitat for stocks coming from the Skagit and Nooksack watersheds. Subyearlings exhibited growth trajectories most similar to natal watershed offshore; however, fish in the SJI nearshore were growing at faster rates than fish in comparable natal watershed nearshore habitats. The higher growth rates in SJI nearshore was not associated with higher feeding rates or higher energy density of prey, however, the lower average temperatures in the SJI nearshore enabled higher growth efficiency and overall growth in this somewhat unique nearshore rearing habitat when compared to nearshore habitats in the natal watershed. Temperature and feeding rate (a surrogate measure of food availability) were identified as ecological drivers of growth rates. Combinations of year, watershed and habitat that provide both adequate prey supply and temperatures confer higher growth rates, and may lead to higher marine survival rates. While conditions favorable to growth were linked to offshore habitats in this study, both 2014 and 2015 were abnormally warm years, wherein growth limitations in nearshore habitats might have been more extreme than in years with more normal thermal regimes. Temperature and energy density of prey were more variable in nearshore rearing habitats than offshore. habitats provide more reliable thermal regimes and appear to support higher growth rates in general. However, the spatial-temporal availability of key prey like crab megalopae can vary considerably among regions, months and years. 2
3 Only Z5 zoea and megalops of intermediate sized Cancer sp and Pinnotherid crabs. The mean carapace lengths of megalops in the diet generally ranged within mm, so the megalops from C. magister were to large for most subyearling Chinook during the critical growth period in June-July, and perhaps August. Densities of the edible sizes and taxa of larval crab were highly variable through time and among watersheds with no apparent coherence among marine regions. Megalops densities ranged from <1/m 3 up to 9/m 3 during May-August both years based on oblique Bongo Net tows. During June-August, subyearling Chinook ate an estimated 252 metric tons (MT) of crab larvae (55% of 454 MT total prey biomass consumed) in 2014 compared to 488 MT in 2015 (43% of a total 1,134 MT consumed). Fish prey contributed only 5% of the prey biomass consumed by subyearling Chinook in 2014, but 15% in Anchovy were absent from the diet in 2014 but contributed 46% of the fish biomass consumed in 2015). The biomass of fish prey consumed increased progressively from June through August in 2015 but was less evident in Pacific Herring consumed an estimated 24,000 MT of larval crab during June-August. The biomass of larval crab consumed by Herring over these 3 months was 96x higher than consumption of larval crab by Chinook during June-August 2014 and 49x higher than Chinook consumption in Consumption of other shared prey by Herring similarly outstripped consumption by Chinook by a large margin. 3
4 Acknowledgments This study was part of the Salish Sea Marine Survival Project, an international research collaboration designed to determine the primary factors affecting the survival of juvenile salmon and steelhead in the Salish Sea. Funding for this project was provided by Washington Sea Grant, a Pacific Salmon Commission Grant through Long Live the Kings and the Salish Sea Marine Survival Project, Salmon Recovery Funding Board, and the Puget Sound Partnership with matching or in-kind contributions from the University of Washington School of Aquatic and Fisheries Sciences, and the Nisqually and Tulalip Tribes. Sample collection was a collaboration between the Washington Cooperative Fish and Wildlife Research Unit at the University of Washington, Washington Department of Fish and Wildlife, NOAA- Northwest Fisheries Science Center, and Tribal Fisheries programs from the Skagit River Cooperative System, Nisqually, Tulalip, and Lummi Tribes. Special thanks to Michael Schmidt and Iris Kemp (Long Live the Kings), Joe Anderson (Washington Department of Fish and Wildlife), Mike Crewson and Ryan Miller (Tulalip Tribes Natural Resources Department), Jed Moore (Nisqually Indian Tribe), Evelyn Brown (Lummi Natural Resources), and Rich Henderson (Skagit River Cooperative System). Handling of live vertebrates in this study was performed under the auspices of the University of Washington IACUC protocol # Any use of trade, firm, or product names is for descriptive purposes only and does not imply endorsement by the U.S. Government. 4
5 Objectives and Approach The primary objective of this report was to evaluate the major factors affecting growth and survival of sub-yearling Chinook salmon during their first marine growing season as they migrated into and reared in Puget Sound. Identifying, quantifying, and understanding these factors can guide future restoration and management practices within the region to improve survival of Chinook salmon from Puget Sound and the Salish Sea more broadly. This work is part of the Salish Sea Marine Survival Project, an international research collaboration designed to determine the primary factors affecting the survival of juvenile salmon and steelhead in the Salish Sea. We address the primary hypotheses: 1) That strong size-selective mortality operates on one or more early marine life stages of subyearling Chinook salmon associated with estuarine delta, marine nearshore or offshore habitats; 2) That growth performance associated with these life stages strongly influences survival during subsequent life stages and overall marine survival; and 3) That growth during critical life stages is affected by food supply (as indicated by feeding rate, energetic quality of prey, or thermal regime). As part of this project, an extensive sampling scheme was undertaken in 2014 and 2015 to sample sub-yearling Chinook salmon in Puget Sound across regions, habitats and throughout the duration of the outmigration. Biological samples from subyearling Chinook salmon, zooplankton and temperature data were collected concurrently at a variety of temporal and spatial scales in order to investigate the dynamics of growth and the ecological factors that affect growth during a critical growth period identified during previous research wherein the size achieved in offshore habitats by mid-july was strongly and positively correlated overall marine survival (Duffy and Beauchamp 2011). Our specific research objectives were: 1. Size-selective mortality analysis - Use scale based growth histories to determine if sizeselective mortality occurred during life stages leading to or during the critical growth period in Puget Sound, if so at what temporal and spatial scales. 2. Ecological factors affecting stage-specific growth Use bioenergetics models to mechanistically link Chinook size and growth with ecological factors including diet, water temperature and prey availability. Study System and Sample Collection Puget Sound is a deep glacial fjord comprised of four basins with different oceanographic and ecological characteristics (Moore et al. 2008). This study focused on sub-yearling Chinook salmon from four river systems: the Nooksack River, which drains into Bellingham Bay in the North basin, the Skagit and Snohomish Rivers, which drain into Whidbey basin, and the Nisqually River, which drains into the South basin (Figure i). Each of these rivers supports both natural-origin and hatchery-origin Chinook Salmon, which display different migration and distribution patterns in Puget Sound (Rice et al. 2011). Sub-yearling ocean-type juveniles predominate throughout Puget Sound (Healey 1991) and generally enter marine waters between May and July and rear in Puget Sound through the summer (Duffy et al. 2005, Rice et al. 2011). During outmigration they move through and may feed in multiple habitats, which we categorized into four general habitat types: freshwater, tidally influenced estuarine deltas (hereafter estuary ), shallow nearshore marine waters (hereafter nearshore ), and the epi-pelagic offshore marine waters (hereafter offshore ) within Puget Sound (Duffy et al. 2005, 2010). Both within and across river systems, growing conditions and predation risk may differ among habitats and 5
6 across time such that each combination of habitat and sample period defines a separate life stage for juvenile Chinook salmon. This study sampled both natural- and hatchery-origin juvenile Chinook salmon in Puget Sound and examined growth histories of known-origin stocks separately. Hatchery-origin Chinook salmon in Puget Sound can be identified by hatchery marks including a clipped adipose fin, a coded wire tag (CWT) implanted in their nasal cavity, or both. We used specialized metal detectors to detect CWTs, which are encoded with information about the hatchery of origin, broodstock, release age, date, and site, and could be linked to additional data such as average size at release ( In river systems where hatcheries also applied unique thermal otolith marks, those marks were used to determine hatchery origin for fish not marked with a CWT. Natural-origin Chinook salmon were identified by having an intact adipose fin and lack of a CWT. Genetic stock identification was used to determine specific origin of unmarked fish (see stock definition and identification methods in Section 1). In 2014 and 2015, we sequentially sampled both natural-origin and hatchery-origin subyearling Chinook salmon from the four habitats and river systems mentioned above, as well as in the nearshore and offshore habitats of the San Juan Islands (Figure i). Our collaborators sampled downstream-migrating smolts in freshwater habitats using smolt traps, in estuary and nearshore habitats using beach seines (following Duffy et al. 2005) and fyke traps, and in offshore habitats we used a purse seine (FV Franciscan I, approximate net dimensions: 402 m long, fished effectively to 22 m; bunt constructed of 1 cm knotless mesh to 18 m, 1.3 cm knotless mesh to 73 m, 2 cm knotless mesh to 146 m, 9 cm knotted mesh to 402 m). In both years sampling occurred approximately every two weeks from late January through late July for freshwater habitats, late January through early October for estuarine and nearshore habitats (with some variation among watersheds), and early May through early August for offshore habitats. These sampling periods were determined mainly by historical presence of juvenile sub-yearling Chinook salmon in each habitat at different times of year (Duffy et al. 2005, 2010, Rice et al. 2011, Kemp 2014). During each sampling event we recorded total counts, mark types, fork lengths, and weights of hatchery- and natural-origin Chinook. Up to 30 hatchery-origin Chinook in each sampling event were lethally sampled for blood collection for IGF-1, and CWT and otolith extraction and reading; up to 30 unmarked Chinook were lethally sampled in northern watershed for blood collection for IGF-1 and in southern watersheds were sampled live and released whenever possible. From each individual we collected scales and caudal fin tissue (used for genetic stock identification of unmarked Chinook). Scales were taken from the preferred area on the side of the fish: from the second to the seventh rows of scales above the lateral line on a diagonal from the posterior insertion of the dorsal fin to the front of the anal fin (Mosher 1968, Shearer 1992). Scales were stored in a piece of folded wax paper in a coin envelope. Fin clips were stored in 100% ethanol. Otoliths were removed in the lab and stored dry. Diets were collected via gastric lavage in the field or dissection in the lab. Diet samples taken in the field were frozen in a small zip-lock bag in water from the sample site; stomach samples taken in the lab were frozen in a small zip-lock bag Handling and care of all vertebrates were conducted under the auspices of the University of Washington Institutional and Animal Care Use Committee protocol

7 Figure i. Map showing approximate locations of juvenile Chinook salmon sampling efforts in each habitat and focal watershed in Puget Sound, WA during 2014 and The black dashed line differentiates between what was considered the offshore region of the Skagit and Snohomish watersheds. 7
8 1. Size-Selective Mortality and Scale Based Growth Introduction Body size, mediated through biotic and abiotic factors affecting growth, is fundamental in determining an animal s survival. Larger animals are usually less vulnerable to predation, starvation, and extreme environmental conditions (Peterson and Wroblewski 1984, Sogard 1997); therefore ecological conditions that affect growth and size are key to survival and fitness. The relationship between size and survival in ecosystems where the intensity of size-related mortality varies over time and space has been codified in the critical size-critical period hypothesis (Beamish and Mahnken 2001). This hypothesis, which was formed to describe variable patterns of growth and survival in populations of anadromous fish, postulates that individuals must reach a certain size or body condition (absolute or relative to other individuals) in order to survive a critical period during which mortality is high and size-selective. Size-selective mortality during juvenile life stages can regulate survival of many marine fishes (Sogard 1997), including Pacific salmon (Oncorhynchus spp.; Coho Salmon O. kisutch: Holtby et al. 1990, Beamish et al. 2004; Pink Salmon O. gorbuscha: Cross et al. 2009; Chinook Salmon O. tshawytscha: Duffy and Beauchamp 2011, Tomaro et al. 2012, Woodson et al. 2013; Chum Salmon O. keta: Healey 1982; Sockeye Salmon O. nerka: Henderson and Cass 1991, Farley et al. 2007; steelhead O. mykiss: Ward et al. 1989, Thompson and Beauchamp 2014). The critical size-critical period hypothesis suggests that Pacific salmon populations experience two size-related survival bottlenecks one due to predation during their first marine summer and the other due to starvation during their first marine winter that largely regulate marine survival (Beamish and Mahnken 2001). Marine survival rates of Chinook Salmon in Puget Sound have declined drastically since 1980 (Ruggerone and Goetz 2004, Sharma et al. 2012). Smolt-to-adult survival rates for hatchery-reared sub-yearling Chinook Salmon within Puget Sound have averaged less than 1% over the past three decades (Kilduff et al. 2014) and the Puget Sound Chinook ESU is now listed as threatened under the Endangered Species Act (Federal Register 2014). Stocks from adjacent regions (i.e. west coast of Vancouver Island and coast of Washington) have not shown similar declines (Kilduff et al. 2015). This pattern suggests factors affecting marine survival occur within Puget Sound and has motivated recent studies to identify potential mechanisms. Throughout their range, marine survival of Chinook Salmon is highly correlated with size during their first marine summer, both within (Claiborne et al. 2011, Woodson et al. 2013) and among years (Duffy and Beauchamp 2011, Tomaro et al. 2012). Previous research revealed a strong positive correlation between marine survival and body mass in July for sub-yearling hatchery-origin Chinook Salmon in Puget Sound (Duffy and Beauchamp 2011). That work also showed that survival was not related to size at hatchery release, and was only weakly related to size in September of the first marine growing season. These results suggest that the growth achieved by mid-summer is critical to survival, but a fine scale spatiotemporal sampling scheme is needed to identify specific times or habitats in which growth and size may be most crucial. In addition, to obtain unbiased estimates of growth during specific times and habitats, it is necessary to determine how size-selective processes may have altered the population size structure prior to sampling. 8
9 In order to understand the range of growth opportunities juvenile Chinook salmon encounter during their first marine summer, it is imperative to understand the scale and intensity of stage-specific growth and size-selective mortality occurring before mid-summer in multiple habitats throughout Puget Sound. By sampling frequently and across habitats, it may be possible to identify when and where growth opportunities and size-selective mortality occur within Puget Sound. Size-selective mortality is a convenient indicator of factors affecting marine survival as it integrates effects of biological status (size, growth rate) and processes (starvation, predation) with behavior (foraging, predator avoidance) into one metric rather than conforming to a classical top-down or bottom-up approach in describing mortality. Evaluating size-selective mortality allows us to investigate mortality through characteristics of survivors rather than mechanisms of death, which are difficult to observe or detect in marine environments. Understanding how size-selective mortality operates in Puget Sound can potentially guide future monitoring, be used to forecast marine survival, and steer restoration or conservation efforts to particular habitats that augment early marine growth, and thus survival, of Chinook Salmon. The objectives of this study were (1) to document the timing of peak utilization of key habitats (estuarine delta, nearshore marine, offshore marine) by sub-yearling Chinook Salmon smolts from known-origin stocks among within Puget Sound; (2) to determine whether scale morphometrics could be used to compare back-calculated fork length at age within or between stocks on a two-week temporal scale; (3) to examine the extent to which sub-yearling Chinook Salmon experience size-selective mortality during early marine rearing in Puget Sound; and (4) to compare these trends between years. We sampled sub-yearling smolts in four river systems draining into Puget Sound using smolt traps, beach seines, and a purse seine in 2014 and To determine how scale morphometrics could be used to assess size-selective mortality, we tested the relationships between scale radius and fork length-at-capture and between circulus count and time. Size-selective mortality was evaluated across habitats and life stages (defined as habitat and sampling period combinations) by comparing the average growth history (backcalculated fork lengths) for known-origin stocks of juveniles sampled in one life stage with that of individuals sampled in subsequent life stages assumed to be survivors of the previous life stage. Sample collection Methods Samples were collected as described in the Objectives and Approach: Study System and Sample Collection section above. For this section, we also collected sub-yearling Chinook salmon from hatcheries (N = for participating hatcheries in 2014 and N = for participating hatcheries in 2015) in each of the four watersheds in the week before release to record pre-release fork-length frequency distributions, mean fork length and weight, and growth histories (Table 1.1). Stock identification and distribution In order to minimize variation in genetic predisposition to growth and differing exposure to various growth environments prior to sampling, all data analyses were performed on separate identifiable stocks of hatchery-origin or natural-origin subyearling Chinook salmon. A hatcheryorigin stock was defined as a group of fish originating from the same broodstock released from the same hatchery at the same time, as determined by CWTs or thermal otolith marks. Natural- 9
10 origin fish were assigned to specific stocks or aggregate stocks using a 192 SNP (single nucleotide polymorphism) panel for Puget Sound Chinook Salmon (Warheit et al. 2013) and the conditional maximum likelihood method of Fournier et al. (1984) and Millar (1987) (see also Anderson et al. 2008), with Rannala and Mountain (1997) likelihoods, implemented in a Matlab script written by Warheit. We focused on stocks of sub-yearling Chinook salmon caught and sampled in habitats associated with their natal watershed to exclude those that may have experienced different growth environments. We only included stocks from the four focal watersheds from which at least 10 fish had been collected in each of two or more life stages. For each stock that fit these criteria, we plotted total catch by date and habitat to examine stock-specific distribution within and between years. Scale morphometrics We used scale morphometrics to track growth trajectories of individuals captured in different combinations of sampling periods and habitats and to test for size-selective mortality within each stock. Because scales grow in proportion to the fish s length and circuli are laid down at a relatively constant rate during the growing season (Fisher and Pearcy 1990, Ricker 1992), the scale radius at a given circulus is proportional to the length of the fish at a given age, and the increase in scale radius between circuli is approximately proportional to growth rate. We tested whether scale radius was proportional to fish length by fitting a geometric mean regression of fish fork length to scale radius (Ricker 1992) using scales from all fish from our sampled stocks, but separately for each year, and referred back to this regression to ensure that it was consistent across scale samples from each stock. In this and all subsequent analyses, we excluded scale samples from fish within our stocks when (a) the scale radius: fork length regression indicated that the scale radius was much too small to be from the preferred area for a fish of that length, or (b) the scale had at least 5 more circuli than the fish with the next highest circulus count within a life stage. To test whether circulus count was a reasonable proxy for age (i.e. time) on a two-week temporal scale during the first marine growing season, we fit a linear regression of time (day of year) to circulus count separately for each stock to account for differences in age among stocks. Growth analysis & identifying size-selective mortality To test whether mortality was size-selective, we looked for changes in the frequency distribution and average size at age of each stock. To evaluate size-selective mortality we used only sub-yearling Chinook Salmon of known origin that were caught and sampled in habitats associated with their natal watershed to exclude those that may have experienced different growth environments. We looked for evidence of size-selective mortality in stocks from these focal watersheds from which at least 10 fish had been collected in each of two or more life stages. We analyzed scales from all fish in each stock that fit these criteria. We then compared fish caught within their natal watershed to those caught in the offshore or nearshore of the San Juan Islands, to better understand how that region may function as an alternative rearing habitat for Puget Sound Chinook. Scales were prepared for measurement by creating impressions of up to 10 scales from each fish mounted on gummed cards and pressed into acetate strips (Cross et al. 2008). For each 10
11 fish we selected the largest scale that was not damaged or regenerated to be imaged and measured. The acetate impressions were imaged using Image-Pro 9.0 software with a digital camera (Lumenera Infinity1-3c camera with Diagnostic Instruments 1.0x HR100-CMT lens attachment) attached to a Leica MZ6 microscope fitted with 20x oculars and a 2.0x objective for a total magnification range of 64x to 160x. Scale measurements were recorded from scale images with Image-Pro or ImageJ software. For each scale we recorded total circulus count, total scale radius along the anterior-posterior axis, and scale radius at each circulus. For each fish, scale radii at each circulus were used to back-calculate fork length using the Fraser-Lee method (Ricker 1992). Back-calculated fork lengths were then used to create individual growth histories. Individual growth histories of fish from each habitat and life stage were plotted on a single set of axes to visually ensure that the distribution of growth histories was approximately normal. Individual growth histories were then averaged to assess mean size at age for each stock as sampled in different habitats and life stages. We evaluated average growth histories (back-calculated fork length at each circulus) at two different temporal/spatial scales for each stock. To examine larger scale habitat-specific size-selective mortality, growth histories for fish from each stock caught within each habitat were averaged across all sampling periods in which three or more usable scale samples were available. To evaluate finer scale, life stage-specific size-selective mortality within and across habitats, we averaged growth histories for fish caught within the same life stage for all life stages with three or more usable scale samples. This finer-scale life stage analysis was only included for 2015 samples as scale sampling in 2014 was not consistent enough to detect fine scale differences in back-calculated fork length-at-circulus. For both habitat- and life stage-specific analyses, we looked for changes in average size at age (average back-calculated fork length at circulus) between subsequent habitats or life stages within each stock by plotting average growth histories for sequential life stages. If size-selective mortality occurred between two life stages, the later life stage should show larger average size at age (i.e., scale radius at circulus) at circuli formed during previous life stages, because average size at age would increase as smaller fish dropped out of the stock (Figure 1.1A, C). No change in stage-specific growth histories among life stages or habitats would suggest that size-selective mortality did not occur between those life stages or habitats (Figure 1.1B). Stock identification & distribution Results From the 10,700 sub-yearling Chinook salmon caught and sampled across all habitats and both years (7,020 individuals in 2014 and 3,680 in 2015), we identified seven hatchery-origin and two natural-origin stocks of sub-yearling Chinook salmon from which at least 10 fish had been collected in each of two or more life stages within their natal watershed throughout the summer. Catches from these nine stocks totaled 1323 fish in 2014 and 1233 fish in 2015 (Figure 1.2, Appendix Table A1). Of these, there were 1099 individuals in 2014 and 960 individuals in 2015 with usable scale samples (Appendix Table A1). There were two hatchery-origin stocks from each of the Nooksack (Kendall Creek and Skookum Creek hatcheries), Skagit ( spring and summer populations from Marblemount hatchery), and Snohomish (Bernie Kai-Kai Gobin Tulalip and Wallace hatcheries) watersheds and one hatchery stock from the Nisqually watershed (Nisqually Clear Creek hatchery; Table 1.1). These hatchery-origin stocks represent both 11
12 segregated and integrated programs (Table 1.1). Comparisons of lengths and weights measured from hatchery samples in the lab to those reported by the Regional Mark Information System (RMIS; indicate that in most cases our hatchery samples are smaller than average, as our samples were collected slightly prior to release. The natural-origin stocks originated from the Nooksack Fall and the Upper Skagit Summer populations. The Upper Skagit Summer stock is the source population for the Marblemount Summer stock, allowing investigation of hatchery effects while controlling for population. For hatchery stocks in both years, peak catches within specific habitats ranged from early May to late July, and generally followed the expected sequence of encounters at the smolt trap (where hatchery releases were located upstream of the trap as in the Skagit River), estuary, nearshore, and offshore habitats (Figure 1.2). Peak catches in the estuary and nearshore habitats preceded peak offshore catches for all but the Snohomish Wallace stock, in which peak catches in the estuary and nearshore coincided with offshore catches during both years. These trends suggested that fish moved sequentially from estuary and nearshore habitats to offshore habitats, though potentially at different rates depending on stock. catches of fish from the natural-origin stocks where higher over a longer period in both years, suggesting a more protracted outmigration and use of the nearshore compared to hatchery stocks. In 2015, catches peaked earlier in the offshore habitats associated with the Snohomish, Skagit, and Nooksack watersheds than in 2014, which suggests that the majority of fish moved through the estuary and nearshore faster in 2015 than in However, hatchery releases in these stocks were also slightly later in 2015 than in 2014 (Table 1), so this result should be interpreted conservatively. Scale morphometrics Scale radius (SR) was linearly related to fork length (FL) for both years, verifying that scale radius could be used as a proxy for fish length: 2014: FL = * SR (N = 1099, r 2 = 0.784) 2015: FL = * SR (N = 960, r 2 = 0.942) Circulus count explained the majority (53-93%) of variation in sample date for all stocks in both years except the Snohomish Tulalip stock in 2014 (Figure 1.3; Table 1.3), showing that circulus count could be used as a proxy for fish age within most stocks. The Tulalip stock in 2014 also deviated from the others in that estuary samples tended to have fewer circuli than nearshore samples at the same date. Excluding the 2014 Snohomish Tulalip stock, circulus deposition rates ranged from 4.4 to 8.3 days in 2014 and 4.6 to 8.0 in Circulus deposition rates were not statistically different between years for hatchery-origin (t = 1.19, df = 11, P = 0.26) or naturalorigin stocks (t = 0.84, df = 2, P = 0.49). Across years, hatchery-origin stocks exhibited significantly faster deposition rates than natural-origin stocks (mean ± SD deposition rate for hatchery-origin: 5.61 ± 0.65 days per circulus, natural-origin: 7.71 ± 0.58 days per circulus; t = 5.79, df = 15, P < 0.001). The scale sampling protocol was refined and more consistent in 2015 compared to 2014, resulting in less scale sampling error, a stronger FL:SR regression and stronger regressions for circulus deposition rate (Table 1.3). This improvement in scale sampling allowed for comparison of growth histories at the finer life stage level for Growth analysis & identifying size-selective mortality 12
13 We found little evidence of size selective mortality among juvenile life stages from marine entry through early August in Puget Sound in either 2014 or 2015 (Figure 1.4). In the 2014 habitat-specific analysis, the Nooksack Kendall Creek and Upper Skagit Summer stocks suggested some apparent divergence between average growth histories for the nearshore and offshore habitats (Figure 1.4A). The divergence at the last common circulus was not significant for the Upper Skagit Summer stock (circulus 17, t = , df = 7, P = 0.114), but was significant for the Nooksack Kendall Creek stock (circulus 14, Welch's t = , df= 17.72, P < 0.001). However, the mean residuals of the geometric mean regression of scale radius and fork length for the nearshore and offshore Nooksack Kendall Creek samples werte quite different from one another, indicating that the nearshore scale samples for this stock were larger than expected for their length and offshore scale samples were smaller than expected. This would result in an underestimation of back-calculated fork length at each circulus for nearshore scales and an overestimation of back-calculated fork length at each circulus for offshore scales, which would artificially exaggerate the divergence in size at age between nearshore and offshore samples. Indeed, the difference in back-calculated fork length between nearshore and offshore samples in this stock is mm at the last shared circulus, and the difference between the mean residuals for nearshore and offshore samples is mm. In other words, small differences in scale sampling explain 71% of the divergence between nearshore and offshore average growth histories for the Nooksack Kendall Creek stock. Other stocks did not exhibit such a pronounced difference in mean residuals between habitats Though sampling error may explain a significant portion of the apparent divergence in 2014 (supported by examination of residuals and the relatively weaker relationship between scale radius and fork length in that year r 2 = 0.78), it is also important to note that for all stocks which show divergence, the divergence between trajectories begins at very early circulus counts (approximately circulus 2-6 depending on stock). For all stocks with hatchery samples, divergence was occurring before hatchery release. Early divergence of trajectories indicates a degree of size-selective habitat use within stocks: fish with smaller average size-at-age trajectories were more frequently captured in nearshore habitats than in offshore habitats. This scale-based finding was also supported by observed fish weights, with offshore weights heavier than nearshore weights during the same sampling period for multiple stocks (see Section 2, Figure 2.1). In 2015, there was no apparent divergence among habitat trajectories within stocks. The life stage-specific analysis in 2015 also showed little evidence for size-selective mortality, as growth histories for different life stages overlapped both within and among habitats for each stock (Figure 1.4B, 1.5). In the San Juan Islands, only the Nooksack Skookum Creek and Upper Skagit Summer (N) stocks were encountered in adequate sample sizes to create scale growth trajectories (at least 3 fish captured in a life stage) in nearshore habitats during Scale growth trajectories of fish from the Nooksack Skookum Creek and the Upper Skagit Summer (N) stocks caught in the San Juan Islands nearshore in 2014 closely resembled the offshore growth trajectories exhibited in their natal watershed offshore habitats (Figure 1.6). The San Juan Islands nearshore trajectory for Nooksack Skookum Creek begins to diverge from the offshore line at later circulus numbers, however the divergence is not significant. Sample sizes of our stocks captured in the San Juan Islands were inadequate for the nearshore in 2015 and in both offshore sampling years. 13
14 Discussion We found little evidence for size-selective mortality affecting sub-yearling Chinook salmon from marine entry through early August in Puget Sound in both 2014 and This was evident in both large-scale (habitat) and fine-scale (life stage) analyses. Though the 2014 habitat analysis showed some apparent divergence in average growth histories, these divergences were either not statistically significant or, in the case of the Nooksack Kendall Creek stock, were likely due to inconsistencies in sampling technique. We did detect some apparent size-selective habitat use, with smaller size-at-age fish occupying nearshore habitats to a greater degree. This study represents the first fine-scale investigation of size-selective mortality among early estuarine-marine life stages in sub-yearling Chinook within Puget Sound, although habitatspecific size-selective mortality has also been examined for subyearling stocks from the Central Valley of California (Woodson et al. 2013) and the Columbia River (Claiborne et al. 2014). Other studies have focused on size-selective mortality of yearling salmonids. For example, the larger coho larger steelhead smolts both in British Columbia and the Skagit River had a higher probability of survival during downstream and early marine migrations (Melnychuk et al. 2007, Thompson and Beauchamp 2014). On the other hand, studies of yearling Chinook smolts from the Columbia River (Rechisky et al. 2013, Rechisky and Welch 2017), yearling coho smolts in British Columbia (Beacham et al. 2017), and Atlantic salmon smolts in Ireland (Newton et al. 2016) found no evidence of size-selective mortality. Additionally, Howard et al. (2016) found evidence of size-selective mortality for yearling Chinook salmon from the Yukon River that was related to body weight and energy density rather than length. This literature suggests that sizeselective mortality likely operates differently on different species, life stages, and geographic regions. We expected that hatchery- and natural-origin stocks might show different patterns and intensities of size-selective mortality, as they exhibit different patterns of size and date of outmigration (Rice et al. 2011). It is difficult to assess the effect of hatchery practices alone on size-selective mortality because of the integrated nature of many hatchery programs. However, the Upper Skagit Summer and Skagit Summer stocks provided us with the opportunity to directly compare size-selective mortality in natural and hatchery stocks, as they come from the same broodstock and differ only in that the Skagit Summer stock is bred and reared in a hatchery while the Upper Skagit Summer stock breeds and rears in the river. As neither stock exhibited sizeselective mortality, we conclude that there was no difference in patterns of size-selective mortality between hatchery and natural-origin stocks. However, this conclusion would benefit from additional comparisons of natural-origin and hatchery-origin populations that are genetically similar and outmigrate from the same area. In Washington, hatchery coho salmon exhibit lower marine survival than wild stocks (Beetz 2009). Additionally, Melnychuck et al. (2014) found different survival rates for hatchery- and natural-origin steelhead smolts in British Columbia. We found that scale based growth trajectories of fish caught in the San Juan Islands nearshore were similar to the higher offshore than lower nearshore growth trajectories associated with the natal watershed. This result was not surprising given that fish would need to migrate through offshore habitats in proximity to their natal watersheds in order to reach the San Juan Islands. We had expected to see increased scale-based growth rates at later circulus numbers for fish caught in the San Juan Islands compared to that of fish caught in their natal watershed based 14
15 on evidence of increased levels of IGF-1 for fish caught in the San Juan Islands (Chamberlin et al., unpublished data). Though we did not see significantly higher scale growth histories in the San Juan Islands, it is possible that fish rearing in that region may be experiencing higher growth rates that are not yet represented on scales, depending on the duration of their nearshore rearing in the San Juans in relation to the 5-7 days between circulus deposition. We confirmed that scale radius could be used as a proxy for fish length by fitting a geometric mean regression of fish fork length to scale radius from all fish from our sampled stocks, separately for each year. We also demonstrated that a circulus or range of circuli corresponded to a particular period or age within a stock and that juvenile Chinook salmon formed circuli at a relatively constant stock-specific rate throughout the growing season. The lower and more variable correlations in 2014 (mean r 2 = 69%, range 53-89%) improved dramatically with improved protocols in 2015 (mean r 2 = 85%, range 70-91%), whereas the mean circulus deposition rates remained remarkably similar between years for natural origin ( days/circulus) and hatchery origin subyearlings ( days/circulus) Higher growth rates can accelerate circulus deposition (Bilton 1971, Fisher and Pearcy 1990, Beakes et al. 2014, Walker and Sutton 2016). This phenomenon could potentially create variability among stocks or among periods within stocks, and might have contributed to the consistently slower deposition rates by natural-origin than hatchery-origin subyearlings. However, the magnitude of these potential errors within hatchery or natural origin stocks appears to be relatively low, based on the relatively correlations within and among stocks in 2015 (after protocols were improved) and coefficients of variation for the mean deposition rates of CV = 9% for both natural and hatchery stocks. For the Snohomish Tulalip stock, the poor fit between sampling date and circulus count in 2014 could be a result of large variation in growth rate or size of fish prior to hatchery release (supported by the high coefficient of variation in length prior to release). An additional contributing factor could that the Snohomish Tulalip stock is released directly into the nearshore habitat outside the hatchery rather than into the Snohomish River.Many Snohomish Tulalip juveniles were caught in the Snohomish estuary after release. The fact that circulus counts on a given date were lower in the estuary than the nearshore for this stock suggests that younger (and smaller) subyearling Chinook were more likely to use the estuary, while the older (larger) individuals were more likely to utilize nearshore habitats. The slope of the relationship between day of year and circulus count for this stock could have been artificially lowered by a disproportionally large sample of larger fish sampled in the nearshore compared to smaller fish sampled in the estuary during the same sampling period. Due to the low coefficient of variation for this relationship, inferences regarding size-selective mortality in the Tulalip stock must be conservative. The slower circulus deposition rates for natural stocks compared to hatchery stocks might suggest lower growth rates for natural stocks during this important growth period. Specifically, the fact that the Skagit Summer (hatchery-origin) circulus deposition rate was faster than the Upper Skagit Summer (natural-origin) deposition rate suggests that hatchery rearing could result in faster growth rate post-hatchery release, as these two stocks were genetically indistinct. Alternatively, greater variation in hatching time, especially for natural-origin fish, would affect variation in circulus count within a population sampled at a given time. Additional comparisons of genetically similar hatchery- and natural-origin stocks would be needed to support these possibilities. 15
16 Though our results were consistent across two years, climatic anomalies in the Northeast Pacific during our study due to the warm blob (Bond et al. 2015) may limit applicability of our results to other years. Sea surface temperatures in the Northeast Pacific Ocean were more than 2.5 C warmer than average by February 2014, and by May 2014 this high temperature anomaly extended to coastal regions. Record high temperatures were also observed on land in 2014 in much of the Pacific Northwest (Bond et al. 2015). Warm surface waters persisted in summer 2015 (Peterson et al. 2015). In offshore habitats within Puget Sound associated with our focal watersheds, mean water temperatures in 2015 were 1.3 C warmer than in 2014 (Gamble et al. unpublished data). Though the difference in temperatures between 2014 and 2015 had no apparent effect on size-selective mortality during early marine residence, we did see a possible effect of temperature on fish distribution among habitats, as peak offshore catches for Snohomish, Skagit, and Nooksack stocks occurred earlier in 2015 than in Warmer temperatures in nearshore habitats in 2015 may have driven fish into cooler offshore habitats sooner than in This observation should be interpreted conservatively since our data were reported as total catch rather than catch per unit effort (although purse seining effort was similar between years), and because some hatchery release dates for Snohomish, Skagit, and Nooksack stocks were earlier in 2015 than in Given that we did not detect size-selective mortality for sub-yearling Chinook salmon through mid-summer, we could not identify particular habitats or life stages that might be most prone to direct mortality. Previous research showed a strong relationship between the size of juvenile Chinook salmon in July and smolt-to-adult returns, indicating that size-selective mortality may drive overall marine survival (Duffy and Beauchamp 2011). Our results suggest that, while significant size-selective mortality does not occur prior to or during the critical growth period in Puget Sound, factors that affect early marine growth and body mass achieved by July strongly influence overall marine survival to adulthood. The lack of strong size-selective mortality during these early marine life stages eliminate, or at least minimize the potential confounding effects on interpretation of stage-specific growth and the factors that affect growth. Taken together, these results suggest that early marine growth through mid-summer is critical to marine survival and could provide a useful predictor of adult returns. This study cannot rule out the possibility that juvenile Chinook salmon experience sizeselective mortality at the basin- or Puget Sound-scale prior to July. For example, fish in the Skagit Summer stock, which were smallest at hatchery release, may have experienced higher mortality than stocks with a larger size at release. However, the lack of relationship between size at release and marine survival (Duffy and Beauchamp 2011) suggests that if size-selective mortality is operating among stocks rather than within stocks it is likely due to differences in growth after hatchery release rather than size at release. We did not make any conclusions about size-selective mortality among stocks, as a scale-based analysis of size-selective mortality at the basin- or Puget Sound-scale is precluded by variation in hatch timing, outmigration timing, and circulus deposition rates across watersheds and between natural-origin and hatchery stocks. Scale regions associated with specific life stages can potentially vary among stocks, and thus scale radius at a specific circulus averaged among stocks might not represent a generalized average size at age for a composite of Puget Sound stocks. Inference of size-selective mortality across stocks would require analyses to control for variation in the relationship between circulus count and time for different stocks, as both the circulus deposition rate and intercept (of circulus number by date) differed among stocks. 16
17 Future research should expand our understanding of the regional and inter-annual variation in early marine growth and size-selective mortality and enable us to mechanistically relate these emerging patterns to variability in overall marine survival. Though our study spanned two years, major fluctuations in survival of Chinook salmon often occur on a longer time scale (Kilduff et al. 2014), and studies spanning more years could elucidate temporal patterns in size selective mortality during early marine life stages. Indeed, other studies have suggested that size might only affect survival of salmon during years with low overall survival, indicating that other factors such as density dependence or ocean conditions can also be important drivers of survival (Holtby et al. 1990, Quinn et al. 2005, Claiborne et al. 2011, Miller et al. 2013, Woodson et al. 2013). As adults return from these brood years, comparing our juvenile scale samples to scales from surviving adults from each stock will provide more conclusive evidence of size-selective mortality associated with growth during the first marine growth season and add important information regarding when or where growth of survivors deviate from the general pool of juveniles, as well as the magnitude of the size-selectivity effect (Moss et al. 2005, Cross et al. 2009, Beauchamp and Duffy 2011). These juvenile adult scale comparisons are a critical next step in understanding size-selective mortality dynamics, as are studies focusing on growth and size-selective mortality during late summer and the first marine winter. Future studies could also compare growth performance and marine survival between stocks of Chinook salmon from the Salish Sea (Puget Sound and the Strait of Georgia) and adjacent coastal regions (Washington coast, west coast of Vancouver Island) and other inland waterways where marine survival rates have displayed different and less variable patterns over recent decades (Kilduff et al. 2015), as these comparisons and contrasts might identify the key factors that influence marine survival rates in different regions. This study is the first step toward a fine-scale understanding of the mechanisms driving early marine growth and the connection between growth and survival. We conclude that sizeselective mortality was not a strong force affecting sub-yearling Chinook salmon before midsummer in Puget Sound during 2014 and This pattern held over the course of two years, across habitats and regions of Puget Sound, and for both natural- and hatchery-origin stocks. Because size achieved by mid-summer strongly influences survival to adulthood (Duffy and Beauchamp 2011), understanding the factors that most influence growth during this critical period, across all habitats and life stages, will be essential for guiding restoration and recovery efforts. Follow-up analyses will determine whether growth rates varied among stocks, habitats or across time during this study, and will identify the environmental factors that most strongly affected growth. Understanding variation in growth rates, as well as the environmental drivers of growth, throughout the first marine summer will be important for guiding restoration and conservation activities to have the greatest impact on overall marine survival. 17
18 Table 1.1. Hatchery rearing and release information for hatchery-origin Chinook Salmon stocks sampled in Puget Sound in 2014 and CV is coefficient of variation. Weight, length, and length CV were calculated from hatchery samples received in the lab unless otherwise noted. Comparisons of lengths and weights measured from hatchery samples in the lab to those reported by RMIS indicate that in most cases our samples are smaller than average. Integrated hatcheries manage hatchery and natural fish as a single population, generally using both hatchery- and natural-origin fish as broodstock; segregated hatcheries use only hatchery-origin fish as broodstock. Stock name Nooksack Kendall d Creek Nooksack Skookum Creek d Hatchery name Kendall Creek Skookum Creek Release date(s) 4/15/2014-5/16/2014 6/2/2014-6/5/2014 Mean weight 2014 Mean length (mm) 5.03 a 78 a 5.67 a Not Available Length CV (%) Not Available Not Available Broodstock run time Spring Spring Hatchery type Integrated Captive brood c Skagit Spring Marblemount 6/12/ Spring Segregated Skagit Summer Marblemount 6/25/ Snohomish Tulalip Snohomish Wallace Nisqually Clear Creek Nooksack Kendall Creek Nooksack Skookum Creek d Bernie Kai- Kai Gobin Wallace Clear Creek Kendall Creek Skookum Creek 5/21/2014-5/29/2014 6/1/2014-6/7/2014 5/1/2014-6/1/2014 4/15/2015-5/13/2015 5/20/2015-6/4/ Summer Summer Summer Fall Integrated b Integrated Integrated Segregated 5.96 a Spring Integrated 5.89 a Not Available Not Available Spring Captive brood c Skagit Spring Marblemount 6/1/ Spring Segregated Skagit Summer Marblemount 6/11/ Summer Integrated b Snohomish Tulalip Bernie Kai- Kai Gobin 5/1/2015-5/12/ Summer Integrated Snohomish Wallace Wallace 6/1/2015-7/6/ Summer Integrated 18
19 Nisqually Clear Creek Clear Creek 5/4/2015-6/20/ Fall Segregated a value reported by RMIS, not calculated from samples received from hatchery. b same population as Upper Skagit Summer natural-origin stock, but spawned, reared, and released from hatchery. c captive broodstock from fish captured as juveniles in the SF Nooksack River and genetically identified as the SF Nooksack spring Chinook population. Captive fish held at both Kendall Hatchery and NOAA Fisheries facility in Manchester, WA. All fish spawned at Kendall, and reared and released from Skookum. d samples were not available from these hatcheries. 19
20 Table 1.2. Number of scales used in habitat-specific average growth histories by stock. Blank cells indicate zeros. Sample sizes include only scales from life stages in which 3 or more useable scale samples were taken. SJI indicates stock fish caught outside of their natal watershed in the San Juan Islands nearshore. Stock Hatchery Smolt Trap 2014 Estuary SJI Nooksack Kendall Creek Nooksack Skookum Creek Nooksack Fall (N) Skagit Spring Skagit Summer Total Upper Skagit Summer (N) Snohomish Tulalip Snohomish Wallace Nisqually Clear Creek Total 1091 Nooksack Kendall Creek Nooksack Skookum Creek Nooksack Fall (N) Skagit Spring Skagit Summer Upper Skagit Summer (N) Snohomish Tulalip Snohomish Wallace Nisqually Clear Creek Total
21 Table 1.3. Circulus deposition rates and r 2 values from linear regressions of time and circulus count by year. Stock Circulus Deposition Rate (days per circulus) R Nooksack Kendall Creek Nooksack Skookum Creek Nooksack Fall (N) Skagit Spring Skagit Summer Skagit Upper Summer (N) Snohomish Tulalip Snohomish Wallace Nisqually Clear Creek Nooksack Kendall Creek Nooksack Skookum Creek Nooksack Fall (N) Skagit Spring Skagit Summer Skagit Upper Summer (N) Snohomish Tulalip Snohomish Wallace Nisqually Clear Creek
22 Back calculated Fork Length (mm) Frequency A C B Back calculated Fork Length Earlier Lifestage Later Lifestage Circulus Figure 1.1. Theoretical comparisons of average growth histories indicating (A) size-selective mortality or (B) no size-selective mortality. Histograms (C) show the change in the distribution of size-at-age if size-selective mortality occurs. 22
23 A. 23
24 B. Figure 1.2. Catch of each stock by life stage (habitat and sample period combination) in 2014 (A) and 2015 (B). Points are only plotted for periods in which sampling occurred in each habitat. Natural-origin stocks are indicated by (N) following the stock name. Detailed catch numbers for each life stage are available in Appendix Table A1. 24
25 Figure 1.3. Linear regressions of sample date and total circulus count for 9 stocks of Chinook Salmon show that circulus count can be a proxy for time throughout the duration of this study. Natural-origin stocks are indicated by (N) following the stock name. 25
26 A. 26
27 B. Figure 1.4. Habitat-specific growth histories (average back-calculated fork length at circulus ± 1.96 SE) for 9 stocks of Chinook Salmon in 2014 (A) and 2015 (B) show little evidence of sizeselective mortality among habitats. Each curve represents size at age averaged across all juveniles sampled in a particular habitat, regardless of sample period (sample sizes for each stock and habitat are available in Table 2). Vertical dashed lines indicate median circulus count at hatchery release where pre-release hatchery samples were available. Natural-origin stocks are indicated by (N) following the stock name. Note that a given circulus number does not indicate a common date among stocks. 27
28 Figure 1.5. Life stage-specific growth histories (average back-calculated fork length at circulus ± 1.96 SE) for 9 stocks of Chinook Salmon in 2015 show little evidence of size-selective mortality among life stages. Shading of trajectories within habitats indicates sampling period, with earlier sampling periods represented by dark-shaded lines and later periods represented by light-shaded lines. Each curve represents size at age averaged across all juveniles sampled in a particular habitat and sample period. Each average back-calculated fork length represents an average of at least three scale samples (sample sizes for each stock and sampling period are available in Appendix Table A1). Vertical dashed lines indicate median circulus count at hatchery release where pre-release hatchery samples were available. Natural-origin stocks are indicated by (N) following the stock name. Note that a given circulus number does not indicate a common date among stocks. 28
29 Figure 1.6. Habitat-specific growth histories (average back-calculated fork length at circulus ± 1.96 SE) for fish caught in the San Juan Islands nearshore in 2014 compared to fish caught in habitats associated with their natal watershed. San Juan Island (SJI) nearshore trajectories closely track the natal watershed offshore trajectory. Each curve represents size at age averaged across all juveniles sampled in a particular habitat, regardless of sample period (sample sizes for each stock and habitat are available in Table 2). Natural-origin stocks are indicated by (N) following the stock name. Note that a given circulus number does not indicate a common date among stocks. 29
30 2. Ecological Factors Affecting Stage-Specific Growth Introduction An animal s ability to survive and reproduce is often related to body size; larger animals are usually less vulnerable to predation, starvation, and extreme environmental conditions (Peterson and Wroblewski 1984, Sogard 1997). Ecological conditions that affect growth and size are therefore key to an animal s survival and fitness. The relationship between size and survival of juvenile salmon in ecosystems where the intensity of size-related mortality varies over time and space has been codified in the critical size-critical period hypothesis (Beamish and Mahnken 2001). This hypothesis, which was formed to describe variable patterns of growth and survival in populations of anadromous fish, postulates that individuals must reach a certain size or body condition (absolute or relative to other individuals) in order to survive a critical period during which mortality is high and size-selective. The critical size-critical period hypothesis suggests that Pacific salmon populations experience two size-related survival bottlenecks one due to predation during their first marine summer and the other due to starvation during their first marine winter that largely regulate marine survival (Beamish and Mahnken 2001). Previous research for ESA-listed Chinook salmon in Puget Sound, WA, has suggested a strong positive correlation between overall marine survival of hatchery-origin Chinook salmon and body mass of subyearling smolts sampled offshore in July of the first marine summer (Duffy and Beauchamp 2011). Additional studies of Pacific Salmon have supported a positive relationship of juvenile size and survival as well (coho: Beamish et al. 2004, Holtby et al. 1990; pink: Cross et al. 2008; chum: Healey 1982; sockeye: Henderson and Cass 1991; Chinook: Claiborne et al. 2011, Woodson et al. 2013; steelhead: Ward et al. 1989, Thompson and Beauchamp 2014). Marine survival of Chinook salmon in Puget Sound has drastically declined since the 1980s (Ruggerone and Goetz 2004, Sharma et al. 2012), which along with the perceived linkage between size and marine survival, has instigated much interest in the ecological drivers of juvenile Chinook salmon growth in the region. From a bioenergetics perspective, prey availability, prey quality, and water temperature are the major ecological factors governing growth of juvenile Chinook salmon (Hanson et al. 1997, Beauchamp 2009). Growth rate at a given temperature is positively correlated with both prey quality and prey quantity; therefore increases in either will equate to an increase in growth rate (Beauchamp 2009). Prey quality, or the energy value of the diet, depends on the diet items consumed and their relative energy density. Temperature affects fish in a multitude of ways; it impacts metabolic processes and scope for growth based on species specific physiological constraints, alters behavior and duration of habitat use, and can have significant effects on the timing and magnitude of prey supply (Duffy et al. 2010). In marine ecosystems, prey availability, prey quality, and water temperature are very dynamic, varying with large-scale climatic and oceanographic indices and on smaller spatial and temporal scales, creating patchy food availability and variable local thermal conditions. Though these ecological factors are independently measureable, their interaction and impact on Pacific salmon survival are poorly understood. Climatic indices like the Pacific Decadal Oscillation and North Pacific Gyre Oscillation correlate with marine survival (Mantua et 30
31 al. 1997, Kilduff et al. 2015), but mechanisms underlying these correlations have not been adequately described. In the California Current, changes to the zooplankton community have been associated with ocean temperature and currents have been suggested as an indirect link between climate indices and marine survival of salmon based on correlations (Keister et al. 2011), but again the causal mechanisms have yet to be examined through an integrated food web study combining climate and water temperature data with information on zooplankton availability and their energetic contribution to salmon growth. In Puget Sound, prior research has indicated that juvenile Chinook undergo an ontogenetic shift in diet composition and prey energy density as they transition from nearshore to offshore habitats (Duffy et al. 2010). The transition from nearshore to offshore is accompanied by a reduced reliance on high energy terrestrial or adult aquatic insects, to lower energy but larger and more abundant zooplankton, specifically larval crab. Larval crab and other zooplankton are a particularly important prey group in the epipelagic offshore environment; however, the degree that prey availability interacts with temperature to determine growth rates offshore among the regions of Puget Sound has not previously been investigated. Furthermore, growth conditions in nearshore habitats have not been compared among regions, or to offshore epipelagic habitats. This study concurrently collected fish, temperature and zooplankton samples extensively during the outmigration and early marine growth period (spring-early fall) of 2014 and 2015, to provide the necessary data to develop a mechanistic understanding of factors affecting growth of hatchery- and natural-origin sub-yearling Chinook salmon in Puget Sound. Samples were collected from multiple watersheds, habitats and sample periods to capture the variation in temperature, diet and prey supply that fish experience. Growth conditions of habitats occupied by fish during the first marine summer growth period were examined to diagnose where growth opportunities exist in Puget Sound, and conversely, were growth limitations may occur. Our specific objectives were: (1) Examine differences in growth performance of sub-yearling Chinook among habitats and life stages using mass, growth rate and specific growth rate as metrics, (2) Determine water temperatures, diet composition and prey energy to be used as inputs to bioenergetics models, (3) Use bioenergetics models to fit prey consumption and feeding rate to observed ecological data, (4) Compare differences in growth metrics to explanatory ecological data, including feeding rate (a proxy for prey availability), temperature and prey energy density information. We hypothesized that growth rates of juvenile Chinook salmon would differ across time, among habitats, and among regions of Puget Sound, and that prey quality, prey availability, and water temperature would differ across similar dimensions. A bioenergetics framework will be used to determine which factors affect fish growth to inform decisions that prioritize actions related to species recovery and guide how/where to prioritize restoration efforts that may target growth bottlenecks and enhance sub-yearling Chinook salmon growth opportunities in Puget Sound. 31
32 Methods Stock Selection We focused our comparisons on sub-yearling Chinook salmon from the same nine stocks identified in Section 1. These stocks originated in four focal watersheds (the Nisqually, Snohomish, Skagit, and Nooksack rivers). Within these stocks, we only considered fish that were caught and sampled in their natal watershed and adjacent marine waters (within an approximately 25 km radius of the estuarine delta) to exclude those that may have experienced different growth environments in other regions. When possible for comparison, we also considered fish from these same stocks caught in the San Juan Islands. We only included life stages (habitat/sample period combinations) from which at least three individuals of a stock were sampled. Based on the findings from Section 1, we determined that fish from a single stock exhibited similar growth trajectories within habitats. Therefore, all fish of one stock in one habitat could be used to calculate growth for bioenergetics modeling. For the natural-origin stocks, it was known that both fry and parr migrants had been sampled, but they could not be distinguished based on scale growth trajectories, thus it was assumed that all fish from these stocks experienced similar habitat-specific growth during the May-August study period. Bioenergetics modeling We combined empirically measured water temperatures, stage-specific weights of subyearling Chinook salmon, and diet data from sub-yearling Chinook salmon in bioenergetics model simulations to determine the relative importance of prey quality, prey availability, and temperature in contributing to the body mass achieved during their first summer in Puget Sound, WA. Bioenergetics model simulations were used to estimate feeding rate (a proxy for prey availability) during different periods in different habitats for each stock. We used a version of the Wisconsin fish bioenergetics model (Hanson et al. 1997) coded into R for running our simulations. The bioenergetics model is an energy-balance equation that calculates daily weight gain of the juvenile Chinook, daily consumption (in grams) of each prey category, and an overall feeding rate over a specified simulation period. Daily feeding and growth rates were fit to the initial and final body mass inputs, thermal experience, diet composition, and energy densities of juvenile Chinook and their diet through the duration of each simulation. Feeding rate was reported as a percent of the theoretical maximum consumption rate (%Cmax) for Chinook salmon, given the change in body mass and thermal experience over the simulation interval. The feeding rate can be used as an indicator for prey availability within a specific habitat for that specific size of consumer (Beauchamp 2009). Bioenergetics models were parameterized for juvenile Chinook salmon (Stewart and Ibarra 1991, modified by Plumb and Moffitt 2015 for the upper temperature dependent consumption equation) and used empirically measured inputs for life stage-specific water temperature (Table 2.1), and seasonal diet composition (Table 2.2). Energy density of juvenile Chinook salmon (4085 J/g; David et al. 2014, and unpublished data for subyearling Chinook from all life stages May-September) and their prey came from literature values and were held constant across all simulations (Appendix Table A2). 32
33 Diet content analysis Diet contents from at least 10 non-empty stomachs (where possible) of sub-yearling Chinook in each life stage and watershed combination were separated into 23 functional prey groups based on taxonomic order and energy density (Table 2.2). A blotted wet weight (to the nearest g) was recorded for each prey group. Total diet weight was calculated by adding wet weights of all prey categories (excluding indigestible and unidentified digested material). We then calculated the proportional contribution of each prey group by dividing each prey group s blotted wet weight by the total diet weight for each stomach sample. The prey proportions from all individual non-empty stomach samples were averaged for each sampling period within each stock and life stage for fish that were within +/- 20% of the mean fork length of the stock during the life stage to be simulated. An energy density for each diet was calculated by summing the products of each prey group s energy density and its diet proportion (Table 2.1, Appendix Table A2). Temperature data collection Temperature data were recorded concurrently with fish and zooplankton sampling when possible, and data gaps were estimated by interpolating between temperatures from the preceding and following life stage (Table 2.1). temperatures were recorded immediately prior to fish sampling using a CTD (SBE 19plus V2 SeaCAT) and were averaged over the top 15 m of the water column to correspond with the observed modal depth distribution of juvenile Chinook in offshore habitats (Duffy 2009, Kemp 2014). Estuary and nearshore temperatures were taken as the average of surface and bottom temperatures at each sample site when both values were available. Because waters in these habitats were well-mixed, there was a high level of agreement between surface and bottom temperatures; so if only one value was available, it was used. Growth Simulations For each stock, transitions between each life stage within a habitat were treated as separate bioenergetics simulations such that factors affecting growth could be attributed to the appropriate habitats and temporal scales. Growth scenarios were constructed by linking life stages within one habitat consecutively in time. For each simulation period (Table 2.1) We calculated growth for juvenile Chinook either between two nearshore life stages or between two offshore life stages for each stock. We did not simulate feeding rates between nearshore and offshore habitats due to an inability to determine which fish were moving between habitats and allocate the proportion of time spent in each habitat. We felt that forcing simulations between these two habitats would give artificially inflated growth and feeding rates as there was evidence of size-selective habitat use with the fish that had smaller average size-at-age more frequently captured in nearshore habitats than in offshore habitats (Section 1). We did not model simulations for estuary or freshwater habitats due to a lack of temperature data. Scale-based growth histories verified that observed weights were representative of actual growth by confirming that no size-selective processes had occurred prior to weight sampling (Section 1). Geometric mean weights were calculated for each of the nearshore and offshore life stages that met minimum sample size requirements (Table 2.1). There was some irregularity in 33
34 the progression of mean weights throughout the season for some stocks, likely due to small sample sizes. Therefore, we fit smoothed growth trajectories by regressing log-transformed weight by day of year for each stock and habitat (Table 2.4). We then simulated growth between points on the regression of growth rather than between the geometric mean weights of fish captured at each sampling event. When wet weights were not measured in the field, they were calculated from thawed weights measured in the lab (using size specific regressions; Table 2.3) or wet fork length (Table 2.3). When wet fork lengths were not available, they were calculated from thawed fork lengths measured in the lab (Wet Weight=10^(3.205*log10(Wet FL)-5.350)). Interpreting factors affecting growth We used regression models to determine how weight and various predictors were related. We constructed regressions of log-transformed weight with combinations of day of year, habitat, stock, and interaction terms. Each year was handled separately in this analysis, with between year comparisons reserved for visual analysis. We also examined how growth rate (g/d) and specific growth rate (g/g*d) varied with these factors. To determine the relative importance of prey quality, prey availability, and water temperature in determining growth, we looked for similarities between the dimensions over which each of these factors varied (time, stock, watershed, or habitat) and the dimensions over which growth rate varied. These comparisons were visual as we were precluded from doing more in depth statistical tests due to the unbalanced nature of the design and the covariance of all factors with time. Stage-specific weights and growth rates Results Patterns in catch (Figure 1.2 in the previous section)and average weights showed that all stocks used habitats sequentially and grew in weight through time (Figure 2.1A-B). Yearspecific linear regressions of log-transformed weight and sampling day of year revealed that weight changed over time but also differed by stock and habitat. Significant interactions between stock and time, and habitat and time within the model indicated that each stock and habitat combination exhibited different absolute growth rates (g/d). This signifies that each stock and habitat must be considered individually when examining ecological factors affecting growth metrics. Across Puget Sound and throughout our study, fish collected offshore in 2014 were larger than those collected concurrently in the nearshore (Figure 2.1A). A similar trend was seen in 2015 though offshore and nearshore weights appeared more similar at concurrent periods than they had in 2014 (Figure 2.1B). Absolute weight gain over the course of this study was highest in offshore habitats (Figure 2.1). Absolute growth rate (g/d) increased with time and was highest in the offshore, where fish were larger and added more grams of growth each day (Figure 2.2). In both years, growth rates (g/d) were more variable in the offshore than the nearshore. growth rates (g/d) for most stocks were higher than nearshore with some exceptions (most notable, Upper Skagit Summer Figure 2.2). In both years, Nisqually and Nooksack hatchery stocks appear to have higher absolute growth rates (g/d) in the offshore than the Skagit and Snohomish stocks. Weights of fish from the Nooksack Skookum Creek and Upper 34
35 Skagit Summer (N) stocks caught in the San Juan Islands (SJI) nearshore during 2014, exhibit weight gains most comparable to that of their natal watershed offshore habitat (Figure 2.2, Figure 2.3). The Upper Skagit Summer stock caught in the SJI nearshore exhibited higher absolute growth rates (g/d) than any other nearshore simulation (Figure 2.2). When scaled by body size, specific growth rate (g/[g*d]) for individual stocks did not vary over time within habitats, but did vary among stocks and between habitats (Figure 2.4). In 2014, the Nooksack Skookum Creek nearshore and Upper Skagit Summer offshore fish exhibited the lowest specific growth rates, while in 2015 Upper Skagit Summer had the lowest specific growth rates in both the nearshore and offshore simulations (Figure 2.4). Interestingly, Upper Skagit Summer Chinook caught in the alternative SJI nearshore habitat in 2014 exhibited specific growth rates that closely tracked that of the natal watershed nearshore habitat, despite having weights (Figure 2.2) and scale-based growth trajectories (see Section 1, Figure 1.6) most similar to the offshore habitat. In other words, the improved growth conditions in SJI nearshore allowed this stock to overcome the expected allometric reduction in specific growth rate for larger individuals. Factors affecting growth The combination of temperature, feeding rate, and prey energy influenced the scope for growth of juvenile Chinook (Figure 2.5). The interaction of feeding rate and temperature is very important, as at low feeding rates the optimal temperature range over which growth can occur becomes much smaller and shifts to a cooler range of temperatures. Increased feeding rate can increase specific growth rate (g/[g*day]) considerably at optimal temperatures. Feeding rate was generally higher in offshore than nearshore for both years and higher in 2015 than 2014 (Figure 2.6). In 2014, feeding rate averaged 0.32 of Cmax (range: Cmax) in the nearshore, and averaged 0.40 Cmax ( Cmax) in the offshore. In 2015, feeding rates averaged 0.35 Cmax ( Cmax) in the nearshore and averaged 0.53 Cmax ( Cmax) in the offshore. Feeding rate appeared to increase over time within habitats for most stocks during 2015 but did not show a consistent trend in Averaging across all stocks and habitats Cmax(%) was 35% in 2014 and 45% in Prey quality, measured by average energy density of the diet, did not show trends associated with watershed, stock, or date and showed only very slight trends with habitat (Figure 2.7). Average prey energy densities were highly variable, particularly in the nearshore in 2014, suggesting that fish capitalized on temporally- or spatially-patchy resources such as adult or terrestrial insects. Energy densities vary tremendously (e.g., ~3,000-12,000 J/g) among life stages and taxonomic groups of insects, and thus we would expect more variation in nearshore habitats where insects were the predominant prey, but where other benthic invertebrates of low to moderate energy density also contribute substantially to the diet. energy densities were slightly higher than offshore in both years when pooled across all watersheds. Median energy density for the nearshore was 4583 J/g in 2014 and 4656 J/g in 2015, while composite energy densities of the offshore diets were4119 J/g in 2014 and 4118 J/g in Daily consumption of prey groups when converted to energy consumed in kilojoules shows how each prey group contributes fish growth (Figures 2.8 A-I). 35
36 The contribution of specific prey groups to juvenile Chinook daily energy consumption varied by watershed, habitat and to a lesser degree, simulation period. With few exceptions, the general dietary pattern entailed an initial heavy reliance on insects in nearshore habitats with progressively higher contributions of various crustacean prey through time (including crab larvae), whereas in offshore habitats, larval crab were frequently the most important prey followed by other pelagic crustaceans (Figure 2.8 A-I). Juvenile Chinook in the nearshore of the Nooksack and Skagit watersheds relied heavily on insects (Nooksack 2014: 60%, 2015: 67%; Skagit 2014: 75%, 2015: 68%), aquatic invertebrates (Nooksack 2014: 39%, 2015: 33%; Skagit 2014: 21%, 2015: 18%) and fish prey (Nooksack 2014: 2%, 2015: 0%; Skagit 2014: 5%, 2015: 13%) in order to satisfy their daily energy needs. In the San Juan Islands nearshore, marine invertebrates, insects, and larval fish (37%, 40%, and 23%) contributed most to daily energy intake. Nisqually nearshore simulations showed a much greater reliance than the other watersheds on crustacean and marine invertebrate energy sources (2014: 28% larval crab, 39% other crustacean/invert, 30% insects; 2015: 35% larval crab, 48% other crustacean/invert, 17% insect). energy budgets in both years had high proportions of crustacean prey, notably crab megalops, however, different watersheds had greater reliance on larval crab than others. Nisqually offshore energy was almost exclusively crustacean derived (2014: 90%; 2015: 98%) of which roughly half was crab megalops (2014: 54%, 2015: 40%). Snohomish stocks had high energy contributions of both insects (2014: 62%, 2015: 34%) and larval crab (2014: 35%, 2015: 20%) and they consumed some fish, while Nooksack and Skagit stocks obtained their daily energy from larval crab (Nooksack 2014: 35%, 2015: 67%; Skagit 2014: 47%, 30%), insects (Nooksack 2014: 25%, 2015: 5%; Skagit 2014: 38%, 2015: 51%) and smaller proportions of larval fish. Temperatures experienced by outmigrating fish were cooler in the offshore than nearshore in both years (Figure 2.9). The range of temperatures in the offshore was close to optimal for fish in both years, even though offshore temperatures were on average higher in 2015 than in 2014 (Figure 2.5, Figure 2.9, Appendix Figures A4-A5). We encountered fish over a broader range of temperatures in the nearshore in 2014 than in Temperatures in the nearshore that coincided with catches of juvenile Chinook did not significantly differ between years; however, fish likely avoided habitats with more extreme temperatures and therefore this comparison may not capture the true variation in temperatures seen in these watersheds and habitats experienced under a broader range of years. Discussion Overall, potential and realized growth conditions for juvenile Chinook salmon were better in offshore than nearshore habitats and were related primarily to the consistently higher feeding rates (indicating higher food availability) and thermal conditions that remained consistently closer to growth optima for the range of feeding rates observed. The energetic quality of prey found in offshore diets was less variable and generally a bit lower than in nearshore diets, but the consistently higher offshore feeding rates more than compensated for the lower-energy prey. In nearshore habitats, the lower feeding rates (suggesting lower food 36
37 availability) and greater thermal limitation by warmer nearshore temperatures during a significant portion of the nearshore rearing period reduced the growth potential for juvenile Chinook rearing in nearshore habitats. Subyearling Chinook encounter estuarine delta and nearshore habitats earlier and at smaller sizes than offshore habitats, yet apparently forego the higher growth potential offered offshore. While some delay in transition to offshore rearing might be linked to seasonal increases in offshore food supply, several stocks exhibited measureable numbers of smaller subyearlings in nearshore habitats while larger individuals of these same stocks were feeding and growing at faster rates offshore. This suggests that other ontogenetic processes (e.g., osmoregulation, size-dependent foraging competency or predation risk) beyond simply feeding and growth potential likely operate on the trade-offs associated with remaining in nearshore versus moving to offshore feeding habitats. Our findings suggest that there are complex interactive effects among habitat, prey quality, prey availability, stock and time for sub-yearling Chinook salmon in Puget Sound. We found that greater overall growth, absolute growth rate (g/d), and specific growth rate (g/[g*d]) occurred in both nearshore and offshore habtats during 2015 and were associated with offshore habitats both years. We also observed marginally improved feeding rate (Cmax) in both Year = 2015 and in offshore habitat. Prey quality, however, was slightly higher in nearshore environments relative to offshore, suggesting that the observed differences in growth metrics were not significantly influenced by prey quality. Temperature was less variable, cooler, and within the optimum range for juvenile Chinook growth in the offshore, while it neared thermal tolerance limits during nearshore rearing in the summer. From these relationships, we conclude that the larger sizes and growth rates observed in 2015 and in offshore habitat, were related to higher feeding rates and favorable offshore temperature. Higher feeding rates increase the growth rate attainable at a given temperature, expanding the range of temperatures over which positive growth rates are possible, and allowing for higher growth rates toward the upper limit of a fish s thermal tolerance (Beauchamp 2009). At approximately 35% Cmax and 4 grams (the 2014 Puget Sound wide average nearshore Cmax and fish size) scope for growth is restricted to under approximately 18 o C. At the average Cmax (~ 45%) and size (5 grams) for the 2015 nearshore, scope for growth is extended to approximately 20 o C. This feeding rate-derived difference in growth potential and thermal range is biologically significant, as nearshore habitat in Puget Sound can reach those upper temperature limits during the peak of summer (Late May - Early September) (Appendix Figures A4-A5) and may result in reductions in growth or habitat avoidance. Combinations of year, watershed and habitat that provide both adequate prey supply and temperatures confer higher growth rates, and most importantly, should support higher marine survival rates (Duffy and Beauchamp 2011). While conditions favorable to growth were linked to offshore habitats in this study, it is possible that in cooler years, estuarine delta and nearshore habitats could support improved growing conditions than were observed in 2014 and 2015, which were both abnormally warm years. Comparatively, the highest temperatures in this study were about 2 degrees above the highest average temperatures reported in 2003 (Rice et al. 2011) (Appendix Figures A4-A5). 37
38 Since nearshore temperature, prey availability and prey energy density are more variable than offshore, it follows that offshore rearing may be a more reliable and successful growth strategy for juvenile fish during years with extreme environmental conditions, assuming there is an adequate supply of offshore prey. In the past, understanding of offshore prey supply dynamics in Puget Sound had been constrained by a lack of reliable zooplankton data; however, as part of the Salish Sea Marine Survival Project, zooplankton has been collected since 2014 to better quantify the available biomass of crab larvae and other key prey and to better understand how zooplankton communities vary across time and space. By combining data on temporal-spatial density and size structure of key zooplankton prey consumption estimates for sub-yearling Chinook and potential major competitors, we can begin to examine the dynamics of offshore prey supply to consumption demand. Such comparisons would quantify the relative magnitude of potential competition among salmon and forage fish species for shared prey resources and help determine whether the collective feeding demand by epi-pelagic planktivores create trophic bottlenecks in particular regions or periods. Feeding rates reported here were similar to those reported for juvenile Chinook in the Salmon River estuary in Oregon (31-60 %Cmax; Bieber 2005, Gray 2005), though other studies of juvenile Chinook in Puget Sound reported higher feeding rates (55-90 %Cmax; Beauchamp and Duffy 2011). This difference is partially an artifact of differences in bioenergetics parameters used between studies. The default bioenergetics model software increases the energy density of juvenile Chinook used in Beauchamp and Duffy 2011 was higher than the observed energy densities used in this study We based our Chinook energy density on measured values from juvenile Chinook salmon sampled in Puget Sound (David et al. 2014). We also kept Chinook energy density constant throughout the summer in our bioenergetics simulations based on studies of Chinook and coho salmon in the northeast Pacific that showed that energy density stayed relatively constant between May and August (Trudel et al. 2005). Recent calorimetry measurements of subyearling Chinook sampled during this study in 2015 revealed a grand mean energy density of 4429 J/g with no temporal trends evident during May-August, nor was variability evident among habitats. This study s bioenergetics framework can be used to evaluate how differences in temperature and food quality and quantity affect the feeding behavior and distribution of juvenile Chinook salmon. For example, certain combinations of high temperatures and low prey availability would identify uninhabitable habitats for foraging juvenile salmon due to very low or negative growth potential during certain periods. Loss of such rearing habitats would exacerbate density-dependent processes, which might result in lower growth rates for entire stocks of juvenile salmon. Higher temperatures in the nearshore may also push juvenile Chinook out of the nearshore habitat in search of better growth conditions. Similarly, higher prey availability and cooler temperatures in offshore habitats may pull juvenile Chinook into offshore habitats even when nearshore conditions do not fully preclude growth. The ability to mechanistically examine the spatial-temporal dynamics of growth potential among habitats and regions provides a useful analytical framework for then examining other processes (e.g., predation risk, osmoregulation, other environmental stressors) that might affect the benefits or costs of utilizing specific habitat types by a variety of life stages. 38
39 The results of this study can guide restoration and conservation efforts aimed at supporting juvenile Chinook salmon growth in Puget Sound. Because growth metrics were most heavily influenced by temperature and feeding rate, human actions that conserve or bolster prey availability or reduce the maximum temperature in nearshore habitats could be effective in supporting higher early marine growth of juvenile Chinook salmon. Climate change could reduce early marine growth in Puget Sound if feeding rates remain at levels observed in this study, as the optimal temperature range for growth becomes both narrower and colder at lower feeding rates (Beauchamp 2009). Increased sea surface temperature has been correlated with reduced survival of Chinook salmon from Washington and Oregon (Sharma et al. 2012), and sea surface temperatures in Puget Sound are most directly influenced by air temperatures (Moore et al. 2008b), which are expected to rise to 14.8 C by 2080 (Elsner et al. 2009). If water temperatures warm with air temperatures as predicted, juvenile Chinook salmon may experience diminished growth conditions in Puget Sound unless prey quality or prey availability increase. This study utilized a mechanistic approach to investigate factors affecting early marine growth of juvenile Chinook salmon at a variety of temporal and spatial scales during a critical growth period. We have qualitatively linked habitat-specific weight gain and growth rates with ecological factors affecting growth in these habitats. This study s findings, combined with the strong positive correlation between the weight of juvenile Chinook when sampled offshore in July and survival (Duffy and Beauchamp 2011), suggest that habitats that support both high feeding rates and optimal temperatures are especially critical to marine survival. This adds to a growing body of literature that suggests that Pacific salmon survival rates depend on critical growth periods that occur during early marine life stages. Availability of key prey and temperature have emerged as primary factors regulating growth during those critical periods for multiple Pacific salmon species and systems (Duffy 2003, Beauchamp et al. 2007, Beauchamp and Duffy 2011). Recognizing the mechanisms through which ecological factors affect growth will lead to a more thorough understanding of movement, distribution, and survival patterns of Pacific salmon. 39
40 Table 2.1. Bioenergetics model inputs and outputs for each stock and growth stock. Each simulation starts in the life stage directly above the simulation name and ends in the life stage in the same row as the simulation name. Sim1 Sim2 Sim3 Sim4 Sim5 Sim6 Sim1 Sim2 Habitat Habitat Sampling Period Mean Day of Year Simulation Day N Mean Weight a 2014 Nooksack Fall (N) Input Weight b 40 Growth Rate (g/d) Avg Prey Energy Density (J/g) Temp c ( C) P-value (feeding rate) Total Consumption Growth Efficiency (%) Early March 3/10/ Late March 3/24-3/25/ Early April 4/7-4/8/ Late April 4/21-4/25/ Early May 5/6/ Late May 5/20/ Early June 6/6/ Sampling Period Mean Day of Year Simulation Day N Nooksack Kendall Creek Mean Weight a Input Weight b Growth Rate (g/d) Avg Prey Energy Density (J/g) Temp c ( C) Early June 6/2/ P-value (feeding rate) Total Consumption Growth Efficiency (%) Late July 7/21/ Early August 8/4/
41 Sim1 Sim2 Sim3 Sim1 Sim2 Sim3 Habitat Mean Day of Year Table 2.1 (Continued) Nooksack Skookum Creek Mean Weight a Input Weight b Growth Rate (g/d) Avg Prey Energy Density (J/g) Sampling Period Simulation Day N Temp c ( C) Late June 6/20-6/23/ P-value (feeding rate) Total Consumption Growth Efficiency (%) Early July 7/8/ Late July 7/18-7/21/ Early September 9/3/ Late June 6/16/ * Early July 7/7/ Late July 7/21/ Early August 8/4/ Habitat Mean Day of Year Nisqually Clear Creek Mean Weight a Input Weight b Growth Rate (g/d) Avg Prey Energy Density (J/g) Sampling Period Simulation Day N Temp c ( C) Late May 5/19-5/22/ P-value (feeding rate) Total Consumption Growth Efficiency (%) 41
42 Sim1 Sim2 Sim1 Sim2 Sim3 Sim1 Sim2 Sim3 Sim1 Habitat Table 2.1 (Continued) Early June 5/30-6/9/ Late June 6/17-6/23/ Early May 5/11/ Early June 6/7-6/8/ Late June 6/18-6/19/ * Early July 7/9-7/10/ Mean Day of Year Mean Weight a Skagit Spring Input Weight b 42 Growth Rate (g/d) Avg Prey Energy Density (J/g) Sampling Period Simulation Day N Temp c ( C) Late June 6/23-6/25/ P-value (feeding rate) Total Consumption Growth Efficiency (%) Early July 7/7/ Late July 7/21-7/23/ Early August 8/4-8/5/ Late July 7/22/ Early August 8/4-8/5/
43 Sim1 Sim2 Sim1 Sim2 Sim3 Sim4 Sim5 Sim6 Habitat Habitat Sampling Period Mean Day of Year Simulation Day N Table 2.1 (Continued) Mean Weight a Skagit Summer Input Weight b Growth Rate (g/d) Avg Prey Energy Density (J/g) Temp c ( C) P-value (feeding rate) Total Consumption Growth Efficiency (%) Early July 7/7/ Late July 7/21-7/23/ Early August 8/4-8/5/ Upper Skagit Summer (N) Mean Avg Prey Day Mean Input Growth Energy Sampling of Simulation Weight a Weight b Rate Density Temp c Period Year Day N (g/d) (J/g) ( C) Early March 3/11-3/12/ Late March 3/24- P-value (feeding rate) Total Consumption Growth Efficiency (%) 3/25/ Early April 4/7-4/11/ Late April 4/21-4/25/ Early May 5/8-5/9/ Late May 5/20-5/27/ Early June 6/9/
44 Sim7 Sim8 Sim9 Sim10 Sim11 Sim1 Sim2 Sim3 Sim4 Sim1 Habitat Table 2.1 (Continued) Late June 6/23-6/30/ Early July 7/7-7/9/ Late July 7/21-7/23/ Early August 8/4-8/5/ Late August 8/18-8/19/ Early June 6/3/ Late June 6/17/ * Early July 7/8/ Late July 7/22/ Early August 8/4-8/5/ Mean Day of Year Mean Weight a Snohomish Tulalip Input Weight b Growth Rate (g/d) Avg Prey Energy Density (J/g) Sampling Period Simulation Day N Temp c ( C) Late June 6/17-6/18/ * P-value (feeding rate) Total Consumption Growth Efficiency (%) Early July 7/8-7/9/
45 Sim1 Sim1 Sim1 Sim2 Sim3 Habitat Habitat Habitat Sampling Period Mean Day of Year Simulation Day N Table 2.1 (Continued) Snohomish Wallace Mean Weight a Input Weight b 45 Growth Rate (g/d) Avg Prey Energy Density (J/g) Temp c ( C) Early July 7/8-7/9/ P-value (feeding rate) Total Consumption Growth Efficiency (%) Late July 7/23/ Sampling Period Mean Day of Year Simulation Day Upper Skagit Summer in San Juan Islands N Mean Weight a Input Weight b Growth Rate (g/d) Avg Prey Energy Density (J/g) Temp c ( C) P-value (feeding rate) Total Consumption Growth Efficiency (%) Early July 7/17/ Late July 7/29-7/30/ Mean Day of Year Mean Weight a 2015 Nooksack Fall (N) Input Weight b Growth Rate (g/d) Avg Prey Energy Density (J/g) Sampling Period Simulation Day N Temp c ( C) Late February 2/19-2/20/ P-value (feeding rate) Total Consumption Growth Efficiency (%) Early March 3/2-3/5/ Late March 3/16-3/25/ Early April 4/14-4/16/
46 Table 2.1 (Continued) Sim4 Sim5 Sim1 Sim2 Sim1 Sim2 Sim3 Sim4 Habitat Habitat Late April 4/28/ Early May 5/13-5/14/ Late June 6/22/ Early July 7/6/ Late July 7/20/ Sampling Period Mean Day of Year Simulation Day N Nooksack Kendall Creek Mean Weight a Input Weight b 46 Growth Rate (g/d) Avg Prey Energy Density (J/g) Temp c ( C) Early June 6/8/ P-value (feeding rate) Total Consumption Growth Efficiency (%) Late June 6/22/ Early July 7/6/ Late July 7/20/ Early August 8/3/ Sampling Period Mean Day of Year Simulation Day N Nooksack Skookum Creek Mean Weight a Input Weight b Growth Rate (g/d) Avg Prey Energy Density (J/g) Temp c ( C) Late June 6/22/ P-value (feeding rate) Total Consumption Growth Efficiency (%)
47 Table 2.1 (Continued) Sim1 Sim2 Sim3 Sim1 Sim2 Sim1 Sim2 Sim3 Habitat Habitat Early July 7/6/ Late July 7/20/ Early August 8/3/ Nisqually Clear Creek Mean Avg Prey Day Mean Input Growth Energy Sampling of Simulation Weight a Weight b Rate Density Temp c Period Year Day N (g/d) (J/g) ( C) Early May 5/7-5/14/ Late May 5/21-47 P-value (feeding rate) Total Consumption Growth Efficiency (%) 5/28/ Early June 6/8-6/11/ Early June 6/11/ Late June 6/25/ Early July 7/9/ Late July 7/23/ Sampling Period Mean Day of Year Simulation Day N Mean Weight a Skagit Spring Input Weight b Growth Rate (g/d) Avg Prey Energy Density (J/g) Temp c ( C) Early June 6/8-6/9/ P-value (feeding rate) Total Consumption Growth Efficiency (%)
48 Sim1 Sim2 Sim3 Sim1 Sim2 Sim3 Sim4 Sim1 Sim2 Sim3 Habitat Table 2.1 (Continued) Late June 6/22-6/24/ Early July 7/7-7/13/ Late July 7/21-7/22/ Early June 6/9/ Late June 6/23/ Early July 7/7/ Late July 7/21/ Early August 8/4/ Sampling Period Mean Day of Year Simulation Day N Mean Weight a Skagit Summer Input Weight b Growth Rate (g/d) Avg Prey Energy Density (J/g) Temp c ( C) Late June 6/23/ P-value (feeding rate) Total Consumption Growth Efficiency (%) Early July 7/13/ Late July 7/21-7/22/ Late August 8/24-8/26/
49 Table 2.1 (Continued) Sim1 Sim1 Sim2 Sim3 Sim4 Sim5 Sim6 Sim7 Sim8 Habitat Late July 7/21/ Early August 8/4/ Upper Skagit Summer (N) Mean Avg Prey Day Mean Input Growth Energy Sampling of Simulation Weight a Weight b Rate Density Temp c Period Year Day N (g/d) (J/g) ( C) Late March 3/17-3/18/ Early April 4/14-49 P-value (feeding rate) Total Consumption Growth Efficiency (%) 4/16/ Late April 4/27-4/28/ Early May 5/12-5/15/ Late May 5/26-5/28/ Early June 6/8-6/10/ Late June 6/22-6/23/ Early July 7/7-7/8/ Late July 7/21-7/22/ Early June 6/9/
50 Table 2.1 (Continued) Sim1 Sim2 Sim3 Sim1 Sim2 Sim3 Sim4 Sim1 Sim2 Habitat Habitat Late June 6/23/ Early July 7/7/ Late July 7/21/ Sampling Period Mean Day of Year Simulation Day N Mean Weight a Snohomish Tulalip Input Weight b Growth Rate (g/d) Avg Prey Energy Density (J/g) Temp c ( C) Early May 5/13/ P-value (feeding rate) Total Consumption Growth Efficiency (%) Late June 6/24/ Early July 7/7-7/8/ Late July 7/22/ Early August 8/4-8/5/ Sampling Period Mean Day of Year Simulation Day N Snohomish Wallace Mean Weight a Input Weight b Growth Rate (g/d) Avg Prey Energy Density (J/g) Temp c ( C) Early June 6/10/ P-value (feeding rate) Total Consumption Growth Efficiency (%) Late June 6/24/ Early July 7/7-7/8/
51 Sim3 Sim4 Table 2.1 (Continued) Late July 7/22/ Early August 8/4-8/5/ a Mean weight is geometric mean weight for all stock fish in a life stage b Input weight is weight used for bioenergetics simulations, calculated from linear regression of log10 transformed weight over time. Linear regressions were calculated individually for each habitat, stock and year c Temperatures were calculated from data collected concurrently with fish except when it was unavailble. In those cases temperature for the lifestage was calculated by iterating temperature between the preceding and following life stages. Ititerated temperatures are labeled with a * 51
52 Sim Day N Diets Diptera Adult Other Insect Insect Pupa Insect Larva Hemiptera Hymenoptera Aquatic Insect Collembola Arachnid Other Crustacean Amphipod Decapod Megalops Decapod Zoea Euphausid Mysid Shrimp Hyperiid Worm Isopod Other Fish Salmonid Sandlance Herring Anchovy Table 2.2. Average prey proportions and energy densities for each stock and bioenergetics scenario. Prey Energy Density (J/g): Habitat 2014 Nooksack Fall (N) Nooksack Kendall Creek Nooksack Skookum Creek Nisqually Clear Creek
53 Sim Day N Diets Diptera Adult Other Insect Insect Pupa Insect Larva Hemiptera Hymenoptera Aquatic Insect Collembola Arachnid Other Crustacean Amphipod Decapod Megalops Decapod Zoea Euphausid Mysid Shrimp Hyperiid Worm Isopod Other Fish Salmonid Sandlance Herring Anchovy Table 2.2 (Continued) Habitat Skagit Spring Skagit Summer Upper Skagit Summer (N) Iterated
54 Sim Day N Diets Diptera Adult Other Insect Insect Pupa Insect Larva Hemiptera Hymenoptera Aquatic Insect Collembola Arachnid Other Crustacean Amphipod Decapod Megalops Decapod Zoea Euphausid Mysid Shrimp Hyperiid Worm Isopod Other Fish Salmonid Sandlance Herring Anchovy Table 2.2 (Continued) Habitat Snohomish Tulalip Snohomish Wallace Upper Skagit Summer (N) in San Juan Islands Nooksack Fall (N) Nooksack Kendall Creek Nooksack Skookum Creek
55 Sim Day N Diets Diptera Adult Other Insect Insect Pupa Insect Larva Hemiptera Hymenoptera Aquatic Insect Collembola Arachnid Other Crustacean Amphipod Decapod Megalops Decapod Zoea Euphausid Mysid Shrimp Hyperiid Worm Isopod Other Fish Salmonid Sandlance Herring Anchovy Table 2.2 (Continued) Habitat Nisqually Clear Creek Skagit Spring Skagit Summer
56 Sim Day N Diets Diptera Adult Other Insect Insect Pupa Insect Larva Hemiptera Hymenoptera Aquatic Insect Collembola Arachnid Other Crustacean Amphipod Decapod Megalops Decapod Zoea Euphausid Mysid Shrimp Hyperiid Worm Isopod Other Fish Salmonid Sandlance Herring Anchovy Table 2.2 (Continued) Habitat Upper Skagit Summer (N) Iterated Snohomish Tulalip Snohomish Wallace
57 Table 2.3. Year and treatment specific thawed regressions for thawed to wet fork length and weight Measurement Treatment/ Size Class Year Equation N R 2 Thawed Measurements Used Fork Length None *FL mm Fork Length None *FL mm Fork Length Ethanol Soaked Both 1.062*FL mm Fork Length IGF Taken *FL mm Fork Length IGF Taken *FL Fork Length Standard Length Both 0.931*FL mm Weight Thaw 0-6.5g Both 1.167*Weight g Weight Thaw >=6.5g Both 1.067*Weight g 57
58 Table 2.4. Regressions of log transformed weight:time used to calculate weight inputs to the bioenergetics model Stock Habitat Equation N R Nooksack Fall (N) Weight =10^(0.0089*Day ) Nooksack Kendall Creek Weight =10^(0.0072*Day ) Nooksack Skookum Creek Weight =10^(0.0050*Day ) Nooksack Skookum Creek Weight =10^(0.0112*Day ) Nisqually Clear Creek Weight =10^(0.0063*Day ) Nisqually Clear Creek Weight =10^(0.0100*Day ) Skagit Spring Weight =10^(0.0061*Day ) Weight Skagit Spring =10^(0.0053*Day ) Skagit Summer Weight =10^(0.0088*Day ) Skagit Summer Weight =10^(0.0076*Day ) Weight Upper Skagit Summer (N) =10^(0.0053*Day ) Snohomish Tulalip Weight =10^(0.0141*Day ) Snohomish Wallace Weight =10^(0.0078*Day ) Upper Skagit Summer (N) in San Juan Island Weight =10^(0.0079*Day ) Nooksack Fall (N) Weight =10^(0.0084*Day ) Nooksack Fall (N) Weight =10^(0.0083*Day ) Nooksack Kendall Creek Weight =10^(0.0116*Day ) Nooksack Skookum Creek Weight =10^(0.0111*Day ) Nisqually Clear Creek Weight =10^(0.0076*Day ) Nisqually Clear Creek Weight =10^(0.0098*Day ) Skagit Spring Weight =10^(0.0088*Day ) Skagit Spring Weight =10^(0.0103*Day ) Skagit Summer Weight =10^(0.0116*Day ) Skagit Summer Weight =10^(0.0174*Day ) Upper Skagit Summer (N) Weight =10^(0.0069*Day ) Weight Upper Skagit Summer (N) =10^(0.0056*Day ) Snohomish Tulalip Weight =10^(0.0100*Day ) Snohomish Wallace Weight =10^(0.0120*Day )
59 A. 59
60 B. Figure 2.1 Geometric mean weights for each life stage (habitat and time period combination) for (A) 2014 and (B) Error bars are two geometric standard errors. If error bars aren t seen they are smaller than the point. Line on the graph are from linear regressions of log10 transformed weight. These regressions were used for weight inputs into the bioenergetics model simulations. Day 182 corresponds to July 1. 60
61 Figure 2.2. Growth rate over time for nearshore and offshore habitats in 2014 and Error bars are two standard errors. Error bars that aren t visible are smaller than points. Day 182 corresponds to July 1. Note that y-axis scales differ between years. 61
62 Figure 2.3. Geometric mean weight over time for all stocks that had enough fish caught in the San Juan Islands (SJI) to be considered. Error bars are two geometric standard errors. Day 182 corresponds to July 1. 62
63 Figure 2.4. Specific growth rate over time for nearshore and offshore habitats in 2014 and Error bars are two standard errors. Error bars that aren t visible are smaller than points. Day 182 corresponds to July 1. 63

64 Figure 2.5. Temperature dependent growth curves for different feeding rates and fish sizes. Consumer energy density and prey energy density were held constant (4085 J/g, 4000 J/g). Green bars represent nearshore temperatures that fish experienced and blue bars represent offshore temperatures that fish experienced. Size in each habitat and year was estimated from a Puget Sound wide average of the data. Average Cmax(%) was 35% in 2014 and 45% in
65 Figure 2.6. Feeding rate (Cmax) over time for nearshore and offshore habitats in 2014 and Day 182 corresponds to July 1. 65
66 Figure 2.7. Average diet energy density for each life stage used in bioenergetics modeling. Day 182 corresponds to July 1. 66
 for each simulation as a percentage of the theoretical maximum consumption rate for the given diet and thermal experience.")
67 A. Nooksack Kendall Creek Figure 2.8. Average daily kilojoules (kj) of prey consumed for each growth scenario for each stock (A-I), habitat and year. Values above the bars indicate feeding rates (%Cmax) for each simulation as a percentage of the theoretical maximum consumption rate for the given diet and thermal experience. Bar size represents total energy needs and has not been scaled by fish weight (larger fish require more energy). SJI in Figure F shows the average daily energy consumption for fish from that stock in the San Juan Islands alternative rearing habitat. 67


68 B. Nooksack Skookum Creek 68


69 C. Nooksack Fall (N) 69

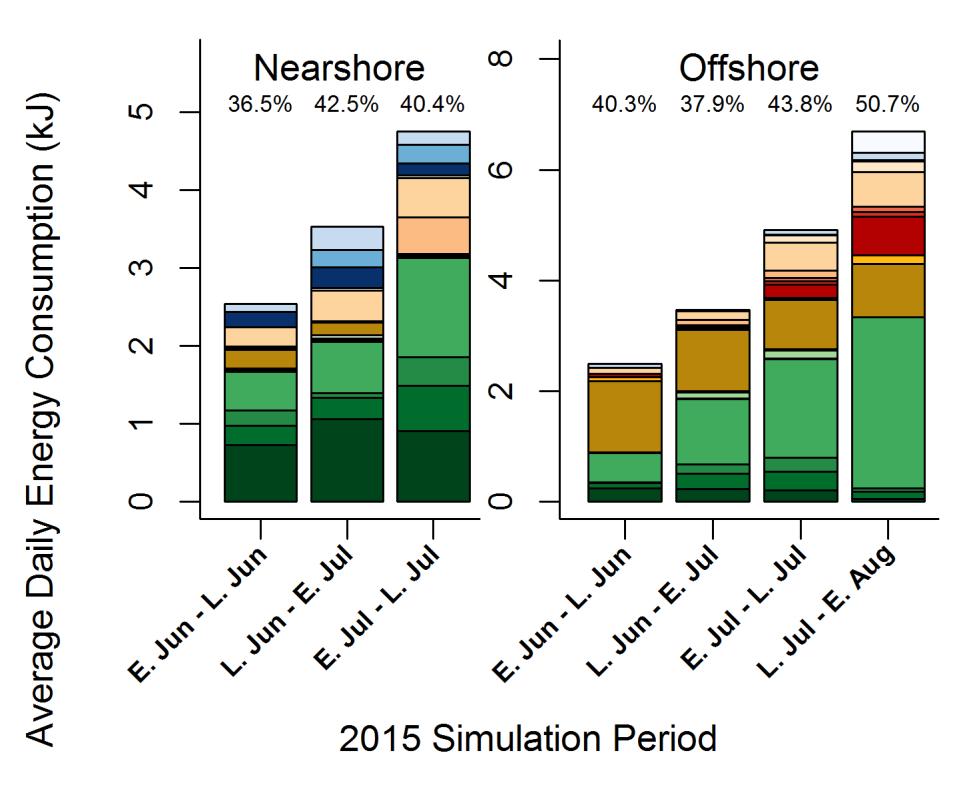
70 D. Skagit Spring 70


71 E. Skagit Summer 71

 72")
72 F. Upper Skagit Summer (N) 72

73 G. Snohomish Tulalip H. Snohomish Wallace 73

74 I. Nisqually Clear Creek 74
Marine Survival of Puget Sound Chinook salmon- New studies on size-selective mortality and critical growth periods
 Western Washington University Western CEDAR Salish Sea Ecosystem Conference 2014 Salish Sea Ecosystem Conference (Seattle) May 1st, 1:30 PM - 3:00 PM Marine Survival of Puget Sound Chinook salmon- New
Perspectives of a State Director Selective fisheries as a tool in fisheries management and salmon recovery
 Perspectives of a State Director Selective fisheries as a tool in fisheries management and salmon recovery Jeffrey P. Koenings, PhD. Washington Department of Fish and Wildlife American Fisheries Society
Declining patterns of Pacific Northwest steelhead trout spawner abundance and marine survival
 Declining patterns of Pacific Northwest steelhead trout spawner abundance and marine survival Neala Kendall, Gary Marston, and Matt Klungle Washington Department of Fish and Wildlife Presented by: Erik
Ocean Conditions, Salmon, and Climate Change
 Ocean Conditions, Salmon, and Climate Change John Ferguson 1 NOAA Fisheries Northwest Fisheries Science Center Seattle, Washington 1 Talk represents work by dozens of scientists at NWFSC and OSU Today
Michael Tehan, Assistant Regional Administrator, Interior Columbia Basin Office
 UNITED STATES DEPARTMENT OF COMMERCE National Oceanic and Atmospheric Administration NATIONAL MARINE FISHERIES SERVICE Northwest Fisheries Science Center Fish Ecology Division 2725 Montlake Boulevard East
FISHERIES BLUE MOUNTAINS ADAPTATION PARTNERSHIP
 FISHERIES A warming climate, by itself, substantially affects the hydrology of watersheds in the Blue Mountains. Among the key hydrologic changes projected under all scenarios for the 2040s and beyond
Kirt Hughes Washington Department of Fish and Wildlife Region 6 - Fish Program Manager
 Kirt Hughes Region 6 - Fish Program Manager Habitat Hatcheries Harvest Clean Water Act Shorelines Harvest Hydro Habitat Forest Practices Non-regulatory Programs Water Supply & Conservation Growth Management
Juvenile Steelhead Distribution, Migration, Growth and Feeding in the Columbia River Estuary, Plume and Ocean Waters
 Juvenile Steelhead Distribution, Migration, Growth and Feeding in the Columbia River Estuary, Plume and Ocean Waters Elizabeth Daly (OSU) Richard Brodeur (NWFSC) Julie Scheurer (ARO) Laurie Weitkamp (NWFSC)
Life Beyond the Spawning Grounds: Distribution & Food Web Relations of Herring & Forage Fishes in Puget Sound
 Life Beyond the Spawning Grounds: Distribution & Food Web Relations of Herring & Forage Fishes in Puget Sound Dave Beauchamp, USGS & UW-SAFS Liz Duffy, UW-SAFS (NRDC) Iris Kemp, UW-SAFS Collaborators:
Report on Science Center Activities
 Agenda Item E.1.b Supp NMFS PowerPoint March 2016 Report on Science Center Activities Columbia River Estuary Habitat Puget Sound Harbor Seal Predation West Coast Salmon GSI Climate Update Evaluating the
Stock Assessment of Anadromous Salmonids, 2003 Report Number: OPSW-ODFW
 THE OREGON PLAN for Salmon and Watersheds Stock Assessment of Anadromous Salmonids, 3 Report Number: OPSW-ODFW-- The Oregon Department of Fish and Wildlife prohibits discrimination in all of its programs
Salmon responses to Climate change
 Salmon responses to Climate change Dr. Correigh Greene NOAA Fisheries October 17th, 2012 WSU, Mt. Vernon Importance of salmon in the skagit Importance to the ecosystem Tribal rights Recreational value
Smolt Monitoring Protocol at COE Dams On the Lower Snake and Lower Columbia rivers
 Smolt Monitoring Protocol at COE Dams On the Lower Snake and Lower Columbia rivers 1.0 Introduction There are two primary goals of the Smolt Monitoring Program (SMP); to provide realtime data on juvenile
LONE TREE POCKET ESTUARY RESTORATION 2004 FISH SAMPLING AND PRE-RESTORATION PROJECT MONITORING REPORT
 Skagit River System Cooperative 11426 Moorage Way P.O. Box 368 LaConner, WA 98257-368 Phone: 36-466-7228 Fax: 36-466-447 www.skagitcoop.org LONE TREE POCKET ESTUARY RESTORATION 24 FISH SAMPLING AND PRE-RESTORATION
For next Thurs: Jackson et al Historical overfishing and the recent collapse of coastal ecosystems. Science 293:
 For next Thurs: Jackson et al. 2001. Historical overfishing and the recent collapse of coastal ecosystems. Science 293: 629-637. Resource: means of supplying a want or deficiency, from French resourdre
for Salmon and Watersheds
 for Salmon and Watersheds Stock Assessment of Anadromous Salmonids, Report Number: OPSW-ODFW-3- The Oregon Department of Fish and Wildlife prohibits discrimination in all of its programs and services on
Co-Principal Investigators Stephen C. Jewett, Ph.D. Paul C. Rusanowski, Ph.D.
 PROGRESS REPORT FACTORS AFFECTING NEARSHORE SURVIVAL AND PRODUCTION OF JUVENILE SOCKEYE SALMON FROM KVICHAK BAY Phase I: Important habitat, migration routes and food resources CoPrincipal Investigators
Survival Testing at Rocky Reach and Rock Island Dams
 FISH PASSAGE CENTER 1827 NE 44 th Ave., Suite 240, Portland, OR 97213 Phone: (503) 230-4099 Fax: (503) 230-7559 http://www.fpc.org/ e-mail us at fpcstaff@fpc.org MEMORANDUM TO: FROM: Michele DeHart Erin
Salmon age and size at maturity: Patterns and processes
 Salmon age and size at maturity: Patterns and processes 1. Age Designation 2. Variation among populations 1. Latitude 2. Within regions 3. Within watersheds 3. Variation within populations 1. Smolt size
Appendix A Recommended EPA Temperature Thresholds for use in Establishing Thermal Potential and Species Life Stage Numeric Criteria
 Appendix A Recommended EPA Temperature Thresholds for use in Establishing Thermal Potential and Species Life Stage Numeric Criteria 1. Temperature Limits Recommended to Protect Salmonid Guilds In this
Appendix M. Gas Bubble Trauma Monitoring and Data Reporting for 2007
 Appendix M Gas Bubble Trauma Monitoring and Data Reporting for 2007 FISH PASSAGE CENTER 1827 NE 44 th Ave., Suite 240, Portland, OR 97213 Phone: (503) 230-4099 Fax: (503) 230-7559 http://www.fpc.org e-mail
Juvenile Salmon Use of Knik Arm Estuaries. Hannah N. Ramage
 Juvenile Salmon Use of Knik Arm Estuaries Hannah N. Ramage Literature Review Function of estuaries for juvenile salmon Migration pathway Pink salmon use estuaries as a neutral pathway (Simenstad 1982)
THE OREGON. PLAN for Salmon and Watersheds. Stock Assessment of Anadromous Salmonids, Report Number: OPSW-ODFW
 THE OREGON PLAN for Salmon and Watersheds Stock Assessment of Anadromous Salmonids, Report Number: OPSW-ODFW-1- The Oregon Department of Fish and Wildlife prohibits discrimination in all of it s programs
Spilling Water at Hydroelectric Projects in the Columbia and Snake Rivers How Does It Benefit Salmon?
 Spilling Water at Hydroelectric Projects in the Columbia and Snake Rivers How Does It Benefit Salmon? Hydropower development in the Columbia and Snake rivers has left its mark on salmonid populations,
Rivers Inlet Salmon Initiative
 Rivers Inlet Salmon Initiative 5-YEAR BUSINESS PLAN C AS E F O R S U P P O R T M AR C H 2 0 1 5 Dedication Rick Hansen had been inspired to go to Rivers Inlet in July 2010 by his good friend, and fellow
Wetland Recovery and Salmon Population Resilience: A Case Study in Estuary Ecosystem Restoration
 Wetland Recovery and Salmon Population Resilience: A Case Study in Estuary Ecosystem Restoration Daniel L. Bottom NOAA NW Fisheries Science Center, Newport, OR Kim K. Jones, Trevan J. Cornwell, Staci Stein
Early Marine Migrations. General geography Four general patterns Influence of genetics
 Early Marine Migrations General geography Four general patterns Influence of genetics Coastal range of anadromous Pacific salmon and trout Techniques employed to study salmon at sea Recently developed
LIFE HISTORY DIVERSITY AND RESILIENCE
 LIFE HISTORY DIVERSITY AND RESILIENCE SPRING CHINOOK IN THE WILLAMETTE RIVER BASIN Kirk Schroeder Brian Cannon Luke Whitman Paul Olmsted Oregon Department of Fish and Wildlife Corvallis Research Lab Thanks
SALMON FACTS. Chinook Salmon. Oncorhynchus tshawytscha
 SALMON FACTS Chinook Salmon Oncorhynchus tshawytscha Other names: king, tyee, blackmouth (immature) Average size: 10-15 lbs, up to 135 lbs Fall spawner; fall, spring, and summer runs Chinook salmon are
Proposed 2018 Fisheries Management Measures to Support Recovery of Interior Fraser River Steelhead
 Proposed 2018 Fisheries Management Measures to Support Recovery of Interior Fraser River Steelhead 22-March-2018 Spawning escapements of two Interior Fraser River steelhead stocks, Thompson and Chilcotin
2016 Conservation Stamp, Esther Semple. Dr. Brian Riddell, Pacific Salmon Foundation, Vancouver, B.C. Contacts:
 2016 Conservation Stamp, Esther Semple Dr. Brian Riddell, Pacific Salmon Foundation, Vancouver, B.C. Contacts: briddell@psf.ca 604-664-7664 www.marinesurvivalproject.com 2 Our Work www.psf.ca Grant Making:
Restoration of the Nisqually River Delta and increased rearing opportunities for salmonids
 Western Washington University Western CEDAR Salish Sea Ecosystem Conference 2014 Salish Sea Ecosystem Conference (Seattle, Wash.) May 2nd, 8:30 AM - 10:00 AM Restoration of the Nisqually River Delta and
Tidal delta restoration for the recovery of wild Skagit River Chinook salmon: linking estuary restoration to wild Chinook salmon populations
 Tidal delta restoration for the recovery of wild Skagit River Chinook salmon: linking estuary restoration to wild Chinook salmon populations Eric Beamer Skagit River System Cooperative February 2009 Acknowledgements
Hatcheries: Role in Restoration and Enhancement of Salmon Populations
 Hatcheries: Role in Restoration and Enhancement of Salmon Populations Hatcheries play a large role in the management, ecology, and evolution of Pacific salmon. Why were/are they built? What are the assumptions
BOGUS CREEK SALMON STUDIES 2002
 BOGUS CREEK SALMON STUDIES 2002 BY: JEANNINE RICHEY California Department of Fish and Game KLAMATH RIVER PROJECT 303 SOUTH STREET YREKA, CALIFORNIA 96097 (530) 842-3109 California Department of Fish and
CHAPTER 4 DESIRED OUTCOMES: VISION, GOALS, AND OBJECTIVES
 CHAPTER 4 DESIRED OUTCOMES: VISION, GOALS, AND OBJECTIVES Vision One of the first steps in developing this Plan was articulating a vision - a clear statement of what the Plan strives to achieve and what
Redd Dewatering and Juvenile Salmonid Stranding in the Lower Feather River,
 Redd Dewatering and Juvenile Salmonid Stranding in the Lower Feather River, 2005-2006 Interim Report for NOAA Fisheries Prepared by: California Department of Water Resources Division of Environmental Services
The Role of the NPAFC in Conservation and Protection of Pacific Salmon
 The Role of the NPAFC in Conservation and Protection of Pacific Salmon Vladimir Fedorenko Executive Director and Shigehiko Urawa Deputy Director North Pacific Anadromous Fish Commission Vancouver, Canada
The Columbia River Estuary half of estuary-ocean coupling: more going on than we thought
 The Columbia River Estuary half of estuary-ocean coupling: more going on than we thought Laurie Weitkamp Northwest Fisheries Science Center Newport, OR laurie.weitkamp@noaa.gov Today s talk Briefly describe
ACUTE TEMPERATURE TOLERANCE OF JUVENILE CHINOOK SALMON FROM THE MOKELUMNE RIVER
 ACUTE TEMPERATURE TOLERANCE OF JUVENILE CHINOOK SALMON FROM THE MOKELUMNE RIVER Charles H. Hanson, Ph.D. Hanson Environmental, Inc. SUMMARY A series of static acute tests were performed to determine the
Preliminary survival estimates for the passage of spring-migrating juvenile salmonids through Snake and Columbia River dams and reservoirs, 2017
 UNITED STATES DEPARTMENT OF COMMERCE National Oceanic and Atmospheric Administration NATIONAL MARINE FISHERIES SERVICE Northwest Fisheries Science Center Fish Ecology Division 2725 Montlake Boulevard East
State of San Francisco Bay 2011 Appendix O Steelhead Trout Production as an Indicator of Watershed Health
 State of San Francisco Bay 2011 Appendix O Steelhead Trout Production as an Indicator of Watershed Health Gordon Becker and Katherine Smetak, Center for Ecosystem Management and Restoration 290 Introduction
11426 Moorage Way P.O. Box 368 LaConner, WA Phone: Fax:
 Skagit River System Cooperative 11426 Moorage Way P.O. Box 368 LaConner, WA 98257-368 Phone: 36-466-7228 Fax: 36-466-447 www.skagitcoop.org BULL TROUT USE OF SWINOMISH RESERVATION WATERS Eric Beamer, Rich
Ocean and Plume Science Management Uncertainties, Questions and Potential Actions (Work Group draft 11/27/13)
") Ocean and Plume Science Management Uncertainties, Questions and Potential Actions (Work Group draft 11/27/13) (The work group thinks the following four questions should form a logic path, but that logic
Ocean and Plume Science Management Uncertainties, Questions and Potential Actions (Work Group draft 11/27/13) (The work group thinks the following four questions should form a logic path, but that logic
EXHIBIT ARWA-700 TESTIMONY OF PAUL BRATOVICH
 EXHIBIT ARWA-700 TESTIMONY OF PAUL BRATOVICH 1. I am a fisheries biologist employed by the firm of HDR, Inc. I hold a Bachelor of Science degree in Fisheries from the University of Washington, located
A Combined Recruitment Index for Demersal Juvenile Cod in NAFO Divisions 3K and 3L
 NAFO Sci. Coun. Studies, 29: 23 29 A Combined Recruitment Index for Demersal Juvenile Cod in NAFO Divisions 3K and 3L David C. Schneider Ocean Sciences Centre, Memorial University St. John's, Newfoundland,
Impact of climate variability and change on winter survival of Bristol Bay sockeye salmon
 Impact of climate variability and change on winter survival of Bristol Bay sockeye salmon Alaska Fisheries Science Center Ed Farley (NOAA), Greg Ruggerone (NRC) Phil Mundy (NOAA), Ellen Yasumiishi (NOAA)
MEMORANDUM. Ron Boyce, ODFW Bob Heinith, CRITFC. Michele DeHart. DATE: November 30, Operations
 FISH PASSAGE CENTER 1827 NE 44 th Ave., Suite 240, Portland, OR 97213 Phone: (503) 230-4099 Fax: (503) 230-7559 http://www.fpc.org/ e-mail us at fpcstaff@fpc.org MEMORANDUM TO: Ron Boyce, ODFW Bob Heinith,
Patterns of migration and delay observed in Summer Steelhead from the Upper Columbia and Snake River Basins from PIT tag data
 West Coast Region Patterns of migration and delay observed in Summer Steelhead from the Upper Columbia and Snake River Basins from PIT tag data Blane Bellerud August, 2015 Columbia River Basin Columbia
Ecological Risks to Natural Populations of Chinook Salmon by Hatchery Releases of Chinook and Coho Salmon. Throughout the Greater Puget Sound Region
 Ecological Risks to Natural Populations of Chinook Salmon by Hatchery Releases of Chinook and Coho Salmon Throughout the Greater Puget Sound Region ~~ A PCD RISK 1 Model* Assessment ~~ Kyle Brakensiek
Matching bird diets with fish data: New insight into avian predation in the Columbia River estuary
 Matching bird diets with fish data: New insight into avian predation in the Columbia River estuary Laurie Weitkamp and Tom Good NOAA Fisheries, Northwest Fisheries Science Center Don Lyons and Dan Roby
Preliminary survival estimates for the passage of spring-migrating juvenile salmonids through Snake and Columbia River dams and reservoirs, 2018
 UNITED STATES DEPARTMENT OF COMMERCE National Oceanic and Atmospheric Administration NATIONAL MARINE FISHERIES SERVICE Northwest Fisheries Science Center Fish Ecology Division 2725 Montlake Boulevard East
Backgrounder and Frequently Asked Questions
 Backgrounder and Frequently Asked Questions Who Sent the Letter? The 60-day Notice of Intent to File Suit was sent by Conservation Angler, Wild Fish Conservancy, Snake River Waterkeeper, Friends of the
PRE-SEASON PLANNING FOR FRASER SALMON and STOCKS OF CONCERN. Forum on Conservation and Harvest Planning for Fraser Salmon January 22, 2010
 PRE-SEASON PLANNING FOR FRASER SALMON and STOCKS OF CONCERN Forum on Conservation and Harvest Planning for Fraser Salmon January 22, 2010 2 Outline South Coast Chinook Status Management Actions Recovery
Juvenile Pacific Herring (Clupea pallasi) trophic linkages in the Strait of Georgia, British Columbia
 trophic linkages in the Strait of Georgia, British Columbia") Juvenile Pacific Herring (Clupea pallasi) trophic linkages in the Strait of Georgia, British Columbia Jennifer L. Boldt 1, Matthew Thompson 1, Chris Rooper 2, Chrys Neville 1, Doug Hay 3, Jake Schweigert
Juvenile Pacific Herring (Clupea pallasi) trophic linkages in the Strait of Georgia, British Columbia Jennifer L. Boldt 1, Matthew Thompson 1, Chris Rooper 2, Chrys Neville 1, Doug Hay 3, Jake Schweigert
Howe Sound Chinook Smolt Outmigration Pilot Study. Interim Report August 2011
 Howe Sound Chinook Smolt Outmigration Pilot Study Interim Report August 2011 Prepared for: Squamish River Watershed Society & Fisheries and Oceans Canada Prepared by: Kendra Morgan Simon Fraser University
Comparative Survival Study
 Agenda Item C.1.a Supplemental PPT Presentation June 2012 Comparative Survival Study Habitat Committee meeting Pacific Fishery Management Council June 12, 2012 Comparative Survival Study Initiated in 1996
Juvenile chum migration patterns in the lower Columbia River and estuary
 Juvenile chum migration patterns in the lower Columbia River and estuary Curtis Roegner Dan Bottom Kristen Homel Thanks to the many NOAA and CE colleagues! * Columbia River Estuary Workshop 214 * Collapse
Preliminary survival estimates for the passage of spring-migrating juvenile salmonids through Snake and Columbia River dams and reservoirs, 2016
 UNITED STATES DEPARTMENT OF COMMERCE National Oceanic and Atmospheric Administration NATIONAL MARINE FISHERIES SERVICE Northwest Fisheries Science Center Fish Ecology Division 2725 Montlake Boulevard East
***Please Note*** April 3, Dear advisory committee members:
 April 3, 29 Dear advisory committee members: The fifth meeting of the CHF advisory committee will be held April 13 in Grants Pass from 6:-8:3 PM, and the purpose of this document is to help committee members
Fish Tech Weekly Outline January 14-18
 Fish Tech Weekly Outline January 14-18 TOPICS: salmon, trout, and char in Southeast Alaska salmonid identification overview salmonid life cycle and stages salmonid freshwater and marine distribution/residence
Wild Steelhead Coalition Richard Burge Conservation VP September 11, 2006
 Wild Steelhead Coalition Richard Burge Conservation VP September 11, 2006 The following are talking points for the WDFW SEPA Scoping Meetings regarding the preparation of the State-wide and the Puget Sound
Potential effects of climate change on the high seas life history and ecology of steelhead in the North Pacific Ocean
 Potential effects of climate change on the high seas life history and ecology of steelhead in the North Pacific Ocean Presentation for the 14th Steelhead Management Meeting, Pacific States Marine Fisheries
Chinook salmon (photo by Roger Tabor)
") Stream Residence 1. The choice : emigration vs. residence 2. Food: Abundance, density, and variation 3. Territory and Dominance 4. Fish Responses: Distribution, growth, survival 5. Mortality Migration
Stream Residence 1. The choice : emigration vs. residence 2. Food: Abundance, density, and variation 3. Territory and Dominance 4. Fish Responses: Distribution, growth, survival 5. Mortality Migration
Population Structure
 Population Structure Elements of Population Evolution Reproductive isolation (homing to natal sites) Differential natural and sexual selection Heritable traits Results Genetically determined population
Conditions affecting the 2011 and 2012 Fall Chinook Adult Returns to Spring Creek National Fish Hatchery.
 FISH PASSAGE CENTER 1827 NE 44 th Ave., Suite 240, Portland, OR 97213 Phone: (503) 230-4099 Fax: (503) 230-7559 http://www.fpc.org/ e-mail us at fpcstaff@fpc.org MEMORANDUM TO: Liz Hamilton, NSIA FROM:
The Salmonid Species. The Salmonid Species. Definitions of Salmonid Clans. The Salmonid Species
 The Salmonid Species The Salmonid Species N. American salmon (2 more Asian species) Chinook ( King ) Coho ( Silver ) Sockeye Chum ( Dog ) Pink ( Humpy ) Sea-run trout Steelhead, Cutthroat, Dolly Varden
COLUMBIA RIVER SALMON AND STEELHEAD HARVEST 1980 TO by John McKern for The Columbia-Snake River Irrigators Association
 COLUMBIA RIVER SALMON AND STEELHEAD HARVEST 198 TO 26 by John McKern for The Columbia-Snake River Irrigators Association COLUMBIA RIVER SALMON AND STEELHEAD HARVEST 198 THROUGH 26 By John McKern FISH PASSAGE
State of California The Resources Agency DEPARTMENT OF FISH AND GAME
 State of California The Resources Agency DEPARTMENT OF FISH AND GAME FINAL REPORT SHASTA AND SCOTT RIVER JUVENILE SALMONID OUTMIGRATION MONITORING PROJECT Prepared for the Pacific States Marine Fisheries
Overview of herring related findings of NCEAS Portfolio Effects Working Group
 Overview of herring related findings of NCEAS Portfolio Effects Working Group Northwest Eric Ward, Rich Brenner eric.ward@noaa.gov richard.brenner@alaska.gov September 8, 2017 Acknowledgments Thanks to
ALASKA DEPARTMENT OF FISH AND GAME DIVISION OF COMMERCIAL FISHERIES NEWS RELEASE
 ALASKA DEPARTMENT OF FISH AND GAME DIVISION OF COMMERCIAL FISHERIES NEWS RELEASE Sam Cotten, Commissioner Scott Kelley, Director Contact: Cordova ADF&G Steve Moffitt, PWS Finfish Research Biologist 401
STUDY PERFORMANCE REPORT
 STUDY PERFORMANCE REPORT State: Michigan Project No.: F-53-R-14 Study No.: 486 Title: Assessment of lake trout populations in Michigan s waters of Lake Michigan. Period Covered: April 1, 1997 to March
Strategies for mitigating ecological effects of hatchery programs
 Strategies for mitigating ecological effects of hatchery programs Some case studies from the Pacific Northwest Kathryn Kostow Oregon Department of Fish and Wildlife Ecological risks occur when the presence
ESTIMATED RETURNS AND HARVEST OF COLUMBIA RIVER FALL CHINOOK 2000 TO BY JOHN McKERN FISH PASSAGE SOLUTIONS
 ESTIMATED RETURNS AND HARVEST OF COLUMBIA RIVER FALL CHINOOK 2000 TO 2007 BY JOHN McKERN FISH PASSAGE SOLUTIONS ESTIMATED RETURNS AND HARVEST OF COLUMBIA RIVER FALL CHINOOK 2000 TO 2007 This analysis of
Summary of HSRG Findings for Chum Populations in the Lower Columbia River and Gorge
 Summary of HSRG Findings for Chum Populations in the Lower Columbia River and Gorge The Congressionally-established Hatchery and Scientific Review Group (HSRG) developed a foundation of salmon hatchery
ANNUAL PERFORMANCE REPORT FEDERAL AID IN SPORT FISH RESTORATION ACT. State: California Project Number: F-51-R-6
 ANNUAL PERFORMANCE REPORT FEDERAL AID IN SPORT FISH RESTORATION ACT State: California Project Number: F-51-R-6 Project Title: Category: Project No. 17: Job No. 1 & 2: Inland and Anadromous Sport Fish Management
Ned Currence, Nooksack Indian Tribe
 Ned Currence, Nooksack Indian Tribe Problem Status Distribution Habitat Hatcheries Harvest 25000 20000 Natural-Origin Spawners 15000 10000 22500 5000 0 Historic catch Spawners (2011-2015) Problem Status
Hatchery Scientific Review Group Review and Recommendations
 Hatchery Scientific Review Group Review and Recommendations Willamette McKenzie Spring Chinook Salmon Population and Related Hatchery Programs January 31, 2009 Columbia River Hatchery Reform Project -
Challenges in communicating uncertainty of production and timing forecasts to salmon fishery managers and the public
 Challenges in communicating uncertainty of production and timing forecasts to salmon fishery managers and the public Alaska Fisheries Science Center Joseph A. Orsi and Phillip R. Mundy Auke Bay Laboratories
Monitoring of Downstream Fish Passage at Cougar Dam in the South Fork McKenzie River, Oregon February 8, By Greg A.
 Monitoring of Downstream Fish Passage at Cougar Dam in the South Fork McKenzie River, Oregon 1998- February 8, 2 By Greg A. Taylor Oregon Dept. of Fish & Wildlife 315 E. Main Street Springfield, OR 97478
Linkages between coastal and open ocean habitats of Pacific salmon and small pelagics in the Northwestern and central Pacific
 Linkages between coastal and open ocean habitats of Pacific salmon and small pelagics in the Northwestern and central Pacific Akihiko Yatsu* and Masahide Kaeriyama** * National Research Institute of Fisheries
Oregon Hatchery Research Center January 2014 David L. G. Noakes, Professor & Director
 Oregon Hatchery Research Center January 2014 David L. G. Noakes, Professor & Director Research Proposal Homing Homing behavior is a striking feature of the biology of Pacific salmon, and is the basis for
Fish Conservation and Management
 Fish Conservation and Management CONS 486 Ocean ecosystems Ross Chapter 2 Topics Physical/temperature zones Magnitude/types of currents Major theme: Linking science to conservation & management Physiology
Attachment 1. Agenda Item Summary BACKGROUND
 Attachment 1 Agenda Item Summary BACKGROUND Spring Chinook Salmon: Prior to the late 1970s, non-treaty spring Chinook fisheries in the mainstem Columbia River occurred from February through May and harvested
ALASKA DEPARTMENT OF FISH AND GAME DIVISION OF COMMERCIAL FISHERIES NEWS RELEASE
 ALASKA DEPARTMENT OF FISH AND GAME DIVISION OF COMMERCIAL FISHERIES NEWS RELEASE Sam Cotten, Commissioner Scott Kelley, Director Contact: Cordova ADF&G Steve Moffitt, PWS Finfish Research Biologist 401
R.J. Beamish, R.M. Sweeting and K.L. Lange
 A preliminary interpretation of coded wire tag recoveries from juvenile coho and chinook salmon released into the Strait of Georgia and Puget Sound from 1997 to 26 R.J. Beamish, R.M. Sweeting and K.L.
Abundance of Steelhead and Coho Salmon in the Lagunitas Creek Drainage, Marin County, California
 scanned for KRIS Abundance of Steelhead and Coho Salmon in the Lagunitas Creek Drainage, Marin County, California Prepared for: Marin Municipal Water District 220 Nellen Drive Corte Madera, California
A Method for Utilizing Recent Coded Wire Tag Recovery Data to Adjust FRAM Base Period Exploitation Rates
 Agenda Item F.2.a Attachment 4 November 2014 2014 Salmon Methodology Review A Method for Utilizing Recent Coded Wire Tag Recovery Data to Adjust FRAM Base Period Exploitation Rates Galen A. Johnson, Northwest
The Blue Heron Slough Conservation Bank
 1 The Blue Heron Slough Conservation Bank CONSERVATION BANKING July 19-23, 2010 CASE STUDY SERIES The Blue Heron Slough Conservation Bank (Washington) I. OVERVIEW & BACKGROUND: Location: Snohomish River
3.4.3 Advice June Barents Sea and Norwegian Sea Cod in Subareas I and II (Norwegian coastal waters cod)
") 3.4.3 Advice June 2013 ECOREGION STOCK Barents Sea and Norwegian Sea Cod in Subareas I and II (Norwegian coastal waters cod) Advice for 2014 ICES advises on the basis of the Norwegian rebuilding plan,
3.4.3 Advice June 2013 ECOREGION STOCK Barents Sea and Norwegian Sea Cod in Subareas I and II (Norwegian coastal waters cod) Advice for 2014 ICES advises on the basis of the Norwegian rebuilding plan,
MEMORANDUM. Joan Dukes, NPCC. Michele DeHart. DATE: August 5, Data Request
 FISH PASSAGE CENTER 1827 NE 44 th Ave., Suite 240, Portland, OR 97213 Phone: (503) 230-4099 Fax: (503) 230-7559 http://www.fpc.org/ e-mail us at fpcstaff@fpc.org MEMORANDUM TO: Joan Dukes, NPCC FROM: Michele
Green Sturgeon Feeding Observations in Humboldt Bay, California
 Green Sturgeon Feeding Observations in Humboldt Bay, California Matt Goldsworthy 1, Bill Pinnix, Miles Barker 1, Liz Perkins 1, Aaron David, Jeffrey Jahn 1 Introduction Understanding the distribution,
Recent Environmental Conditions and BC Salmon Outlook to 2020
 Recent Environmental Conditions and BC Salmon Outlook to 2020 K. Hyatt & S. Grant Pacific Biological Station, Nanaimo Contributors: I. Perry, L. Weitkamp, M. Galbraith, J. Boldt, P. Chandler, S. King,
Trends in salmon fisheries
 Trends in salmon fisheries Marc Trudel Fisheries and Oceans Canada Pacific Biological Station, Nanaimo Department of Biology, University of Victoria Plan of the presentation 1. Introduction 2. Salmon Harvest
Attachment 2. Exhibit (I) Public Correspondence received as of May 25, 2018.
 Public Correspondence received as of May 25, 2018.") Attachment 2 Exhibit (I) Public Correspondence received as of May 25, 2018. From: To: Subject: Date: Attachments: Michelle Tate April H Mack FW: Thermal Refuge comments and recommendations Tuesday, March
Attachment 2 Exhibit (I) Public Correspondence received as of May 25, 2018. From: To: Subject: Date: Attachments: Michelle Tate April H Mack FW: Thermal Refuge comments and recommendations Tuesday, March
ATLANTIC STATES MARINE FISHERIES COMMISSION. Winter Flounder Abundance and Biomass Indices from State Fishery-Independent Surveys
 ATLANTIC STATES MARINE FISHERIES COMMISSION Winter Flounder Abundance and Biomass Indices from State Fishery-Independent Surveys Technical Committee Report to the Winter Flounder Management Board February
June 3, 2014 MEMORANDUM. Council Members. Stacy Horton, Policy Analyst, Washington. SUBJECT: Final 2012 Hatchery Fin Clip Report
 Bill Bradbury Chair Oregon Henry Lorenzen Oregon W. Bill Booth Idaho James A. Yost Idaho Jennifer Anders Vice Chair Montana Pat Smith Montana Tom Karier Washington Phil Rockefeller Washington June 3, 2014
c h a p t e r 6 n n n Related to the VAMP
 c h a p t e r 6 n n n Complimentary Studies Related to the VAMP Throughout 27 several fishery studies were conducted to advance the understanding of juvenile salmon abundance and survival in the San Joaquin
Okanagan Sockeye Reintroduction
 Okanagan Sockeye Reintroduction Backgrounder Elders accounts, and other forms of Traditional Ecological Knowledge (TEK) tell us that many species of salmon once came into the Okanagan Valley and tell us
Protect Our Reefs Grant Interim Report (October 1, 2008 March 31, 2009) Principal investigators: Donald C. Behringer and Mark J.
 Principal investigators: Donald C. Behringer and Mark J.") Investigating the role of the spotted spiny lobster (Panulirus guttatus) in the recovery of the long spined sea urchin (Diadema antillarum) on the coral reefs of the Florida Keys Protect Our Reefs Grant
Investigating the role of the spotted spiny lobster (Panulirus guttatus) in the recovery of the long spined sea urchin (Diadema antillarum) on the coral reefs of the Florida Keys Protect Our Reefs Grant