Status and management of the sea cucumber fishery of La Grande Terre, New Caledonia
|
|
|
- Britton Porter
- 6 years ago
- Views:
Transcription


1 STUDIES AND REVIEWS 1901 Status and management of the sea cucumber fishery of La Grande Terre, New Caledonia Steven W. Purcell, Hugues Gossuin, Natacha S. Agudo Reducing poverty and hunger by improving fisheries and aquaculture


2 Status and management of the sea cucumber fishery of la Grande Terre, New Caledonia Steven W. Purcell, Hugues Gossuin, Natacha N. Agudo Final report for ZoNéCo program project: Ėvaluation et gestion des stocks d holothuries dans les Provinces Nord et Sud de Nouvelle Calédonie The WorldFish Center c/- SPC - Secretariat of the Pacific Community B.P. D Nouméa Cedex New Caledonia
3 Status and management of the sea cucumber fishery of la Grande Terre, New Caledonia Prepared by: Steven W. Purcell, Hugues Gossuin and Natacha N. Agudo, The WorldFish Center, Pacific Office, c/o Secretariat of the Pacific Community, B.P. D5, Noumea Cedex 98848, New Caledonia Published by: The WorldFish Center, P.O. Box 500 GPO, Penang, Malaysia Funded by: Le programme ZoNéCo d inventaire et de gestion durable des ressources marines de Nouvelle Calédonie. Original text: English Translation: French, by Gerard De Haro and the Translation and Interpretation section of the Secretariat of the Pacific Community. ISBN: WorldFish Center Contribution No Cover photos: Purcell, Steven. All rights reserved The WorldFish Center and Programme ZoNéCo. All rights reserved. This publication may be reproduced in whole or in part and in any form for educational or non-profit purposes without the permission of the copyright holders provided that acknowledgement of the source is given. This publication may not be copied, or distributed electronically, for resale or other commercial purposes without prior permission, in writing, from the WorldFish Center and Programme ZoNéCo. This document should be cited as: Purcell, S.W., Gossuin, H. and Agudo, N.N Status and management of the sea cucumber fishery of la Grande Terre, New Caledonia. Programme ZoNéCo. WorldFish Center Studies and Reviews No The WorldFish Center, Penang, Malaysia. 138 p.
4 Contents 1. Executive Summary Preamble Project Activities and Methods Personnel and training Underwater population surveys Landing surveys Fisher and processor surveys Study on growth and movement of sea cucumbers Fishery management workshop Results Underwater population surveys Landing surveys Fisher and processor surveys Recommendations for fisheries management and workshop outcomes Conclusions References Appendices A. Data sheets for field surveys B. Fisher questionnaire C. Processor questionnaire D. Landing catch survey datasheet E. Aerial/satellite photographs of study sites with transect positions i
5 ii
6 1. EXECUTIVE SUMMARY Background Sea cucumbers are fished worldwide but over-exploited in most countries (Lovatelli et al. 2004). International workshops have recently developed manuals on management of these resources. Sea cucumber populations can be slow to recover from overfishing and must be managed conservatively. In New Caledonia, the sea cucumber fishery has operated since the 1840 s (Conand 1990). Now, it is based primarily on about 12 species, exported as dried bêche-de-mer to Asian markets. In 2007, the reported export value of sea cucumbers from New Caledonia (404,613,500 XPF 1, or 5.3 million USD) was twice that of tuna (202,305,100 XPF) or other fish (14,828,600 XPF) ranking it the second-most valuable marine export commodity after farmed shrimp (1,527,422,000 XPF). Based on a need by the provinces to better understand and manage the sea cucumber resource of la Grande Terre, a ZoNéCo project was developed by the WorldFish Center. This report covers work coordinated by the WorldFish Center from October 2006 to May 2008 for the project Assessment and management of sea cucumber stocks in the Northern and Southern Province of New Caledonia. It describes results of field population surveys (sea cucumbers, giant clams and trochus), landing surveys, socio-economic surveys with fishers and processors, and the conclusions from a workshop with stakeholders on fishery management. The main emphasis is on sea cucumbers. Methodology A total of 50 lagoon and barrier reef sites were chosen by the provincial fisheries departments. Populations of sea cucumbers, trochus and giant clams were surveyed using stratified, replicate, belt transects that were geo-referenced using GPS technology. The surveys provide estimates of densities of species from five habitat types on the reefs. More than 6,000 sea cucumbers were counted. Additionally, we measured and weighed 1,724 sea cucumbers, of medium or high value, collected along the 1,475 transects. GIS software (MapInfo) was used to calculate the surface area of sites and of each of the five predefined habitats within each site. The total abundance of each species per site could then be calculated by combining estimates of abundance among habitats. We present estimates of densities in the habitat in which each species was found most, for each site. We calculated and present average weights and size-frequency distributions of high- and medium-value sea cucumbers, grouped within each of six study regions. Abundances of giant clams and trochus are presented for each site. We trained nine technicians or scientists from the provincial fishery departments and one ZoNéCo scientist in field survey methods and identification of sea cucumber species. Questionnaire-based interviews were used to collect responses from 26 fishers from the same study regions. The 35 questions sought responses on the fishing history, economic importance, fishing effort and techniques, sale of product, and their views on resource status and management. Separate questionnaires were developed for seven processors. A preliminary study to assess the retention of PIT tags in sea cucumbers was successfully completed. Unfortunately, it showed that PIT tags were rejected quickly from the two test species, which means that the growth and movement study using PIT tags is not plausible. In place of a large study on movement and growth, we conducted landing surveys and a study on weight loss through different processing stages for selected species. Conversion ratios were calculated for each step of processing of sea cucumbers in the weight-loss study and used to standardise weights of fisher-landed sea cucumbers, in various states of processing, to whole (wet) weights. We measured and weighed 2,433 individual sea cucumbers from a total of 54 landings from fishers in the different study regions. We grouped those data by study region and present average sizes and size-frequency distributions of collected sea cucumbers and Catch Per Unit Effort (CPUE). These were compared with our results from population surveys and fisher interviews. 1 XPF = Comptoirs Français du Pacifique Franc; 1 USD = 76.8 XPF (June 1, 2008). 1
7 Results About 12 sea cucumber species of high and medium value are harvested in the fishery of la Grande Terre. At the majority of sites, one or more of these species was found in reasonable abundance. However, the community composition varied markedly among sites: species were abundant at some sites but not others. That is, distributions were quite patchy for most species. On average, we observed 8 different sea cucumber species at each site. The species richness did not differ greatly between the two provinces or between reefs in reserves and those open to fishing. Populations of a few commercial species appear depleted, namely Holothuria fuscogilva, Holothuria lessoni and Actinopyga lecanora. Several other species are perhaps not critically low but are relatively sparse, namely A. mauritiana, A. miliaris and H. scabra. Most of the other commercial species are relatively common and have breeding populations at some sites that should allow for some further recruitment. The body sizes of sea cucumbers varied among the six study regions; individuals of commercial species were small in the Boulouparis-Poya region. Also, several species were rare in our field observations. A comparison of size-frequencies of sea cucumbers in landing and those from field surveys suggested that there was some selection by fishers for larger individuals, but not in all regions. Populations of some species were restricted to one or two size classes, perhaps indicating infrequent recruitment. Giant clams, particularly Tridacna maxima, were found at almost all of the sites but populations were relatively sparse. One third of the study sites held giant clam populations that were one-third to oneseventieth of the (species-combined) abundance estimates of the least populated site in a reference long-term reserve. Abundances of two species, Tridacna derasa and Hippopus hippopus, were generally very low. In contrast, there were a number of relatively dense populations of the topshell Trochus niloticus. Most of the sea cucumber fishers are men aged years. Many fishers had years of experience, but a lot of them have only recently started fishing sea cucumbers, particularly in Province Nord. Sea cucumbers were the most important source of income for most of the fishers we interviewed. Many fishers only spend a couple of days fishing each week, and the Catch Per Unit Effort (CPUE) of fishers varied markedly among regions. Fishers in Province Nord processed their own catches more commonly than fishers in Province Sud because they are further from most processors. Compared to perceived historical CPUE, estimates of current CPUE from landing and interviews with fishers indicate that catch rates have declined in some regions. The CPUE of fishers has increased near Nouméa and further south, but the catch has broadened to include many low-value species that can dominate the catch volume. The region under highest current fishing pressure appears to be Touho- Boat Pass. Conclusions Stocks of giant clams appear to be over-fished in a significant proportion of sites, and need strict management regulations to safeguard against their depletion. On the other hand, stocks of trochus do not appear in danger of being depleted to low levels in New Caledonia if the current size limits are well enforced. Some stocks of sea cucumbers in New Caledonia can probably sustain further fishing impacts, at modest levels. Stocks for some other species are low or depleted and management regulations should be brought in to ensure their breeding populations do not decline further. Fishers in some areas are still harvesting sea cucumbers intensely even though the average sizes of animals have declined and even though they believe the abundances have declined. The capture of some small animals and responses from questionnaires shows that more education of fishers is needed through regular visits by fisheries officers. We propose 13 recommendations for actions to be taken by the fisheries services, and fishery regulations to be imposed on fishers. In particular, we propose fishing closures for several species and advise regulations to limit industrial-type fishing. A management plan needs to be rapidly established in the provinces of New Caledonia that will safeguard the reproductive potential of sea cucumber populations and their biodiversity on reefs. We recommend an adaptive management approach, whereby the management plan can be changed over time through new information from the socialecological system. 2
8 2. PREAMBLE The project s objective was to provide, by way of ecological and sociological research, support to the Southern (Sud) and Northern (Nord) Provinces for decisions about how best to manage the sea cucumber fishery around la Grande Terre. It follows from two previous studies by the WorldFish Center on sea cucumber populations in the inshore mangrove-seagrass habitats of la Grande Terre and reefs of Province des Iles Loyauté. It is also complementary to similar research conducted, at other sites within and outside New Caledonia, by the PROCFish/C program of the Secretariat of the Pacific Community (SPC). Data was collected during underwater population surveys, questionnaire-based interviews with fishers and processors, and landing catch surveys. A core objective of the population surveys was to furnish the provinces with ballpark estimates of the abundance and density of commercially important sea cucumbers on lagoon and barrier reefs. The population surveys were not designed to give precise estimates of standing stocks of sea cucumbers on the reefs or to provide estimates of total standing stock (in terms of numbers or biomass) of individual species or groups in the provinces. Instead, the emphasis was placed on surveying a large number of reefs over a 600-km stretch of coastline and to survey large sites so that general estimates could be made. Both fished and protected reefs were assessed. Analysis and synthesis of the ecological and sociological data provide the basis for informed recommendations on the management of this sea cucumber fishery. Field data collected on the density of trochus and giant clams allows us to also describe the general status of those resources. The project was situated within the ZoNéCo research program of ADECAL. The first three months of work (in 2006) was supported through funding from Province Sud. Thereafter, the majority of funding for the research was provided by ADECAL, while the WorldFish Center and the fisheries services of Province Nord and Province Sud also contributed in-kind support and equipment. In total, this project cost about 28,000,000 XPF, or US$360,000, over 20 months. Research work was coordinated by staff from the WorldFish Center, in partnership with the SPC: Steven Purcell (Project Leader), Hugues Gossuin (Research Assistant) and Natacha Agudo (Research Associate). Field work was conducted in collaboration with technicians and scientists from the provincial fishery departments and scientists from the ZoNéCo program of ADECAL: (in alphabetical order) Jérôme Azzaro, Pablo Chavance, Nathaniel Cornuet, Bernard Fao, Antoine Maloune, Zaccharie Moenteapo, Hugo Pala, Charles Poithily, Philippe Postic and Thomas Requillart. We thank Warwick Nash, Mecki Kronen, Emmanuel Tardy, and Sven Uthicke for comments on the draft report. This report is written primarily for policy makers and technicians within the fisheries services of Province Nord and Province Sud, and scientists in New Caledonia, who have prior understanding of biological and fisheries terminology, and concepts. It is not a report written for fishers or processors but we have avoided complex analyses and terminology. We have also explained the local context and sites in a broad way so that it is understandable to fishery managers, extension workers and scientists in other countries who may benefit from the methodologies and findings. To this end, we have included shaded text boxes of 20 lessons that should be valuable for fishery managers in general. The report is not a review of the biology, ecology and management of sea cucumbers but we have discussed some aspects in some detail where appropriate. For further reading on the ecology of tropical sea cucumbers, readers should consult Conand (1989), parts of which are available in English through the SPC, and Conand (1990). For further information on management of sea cucumber fisheries, we recommend Lovatelli et al. (2004), Friedman et al. (2008), and FAO (in prep.). 3


9 3. PROJECT ACTIVITIES AND METHODS 3.1. Personnel and training Training was given to the project Research Assistant and Research Associate in the field survey methods and species identification. We also trained the provincial technicians in the identification of sea cucumber species, measurements of live animals, and the various methodologies for censusing sea cucumbers, trochus and giant clams. From Province Sud, the head of the Bureau of Fisheries and Aquaculture and three technicians received training, while in Province Nord, the head of the fisheries section and four technicians received training. One scientist from the ZoNéCo program joined several field trips and was trained in species identification and survey methods. A B C D Figure 1. On-the-job training being given to some of the project partners. A Bernard Fao measuring a Stichopus herrmanni with Hugues Gossuin near Ile Ouen in the Province Sud. B Zaccharie Moenteapo recording measurements of a Holothuria fuscogilva with Hugues Gossuin at Koné. C Antoine Maloune conducting a transect survey on a reef crest near Touho. D Pablo Chavance driving an outboard motor while a diver is towed behind the boat for a manta-tow transect near Ile Balabio. Photos: S. Purcell WorldFish Center. 4
.")
10 3.2 Underwater population surveys Site selection Meetings were held with the fisheries services of Province Sud and Province Nord to choose sites for the population surveys. A total of 50 sites were chosen by the provinces on the basis of their importance to the fishery; 25 sites in each province (Figure 2). Some of the sites were in reserves, to allow comparisons with fished sites and to give base-line data. Out of the 50 sites, 20 were on reefs within the lagoon around la Grande Terre and 30 were barrier reef sites. Lagoon sites were more protected from oceanic swell and were sometimes exposed to turbid inshore seawater. Sites were 3 to 36 km off the mainland. Notably, there were few sites on the east coast of la Grande Terre, because there is little fishing activity and the provinces preferred to have the sampling on the west coast. The population surveys for sea cucumbers, giant clams and trochus were conducted using methods following those proposed to ADECAL. The data sheets were harmonised with, but not identical to, those used by the PROCFish/C program at the SPC, and are given in Appendix A. For each site, a survey area of generally ha, that contained each of the five habitat types where possible, was designated before the field trips. This size allowed a broad coverage of reef area, while not dispersing transects by more than a couple of hundred metres. Generally, transects were surveyed at each site (Table 1). At Ilot Maître, the sea cucumber population was both diverse and abundant, and we conducted twice the normal number of transects (67 total) at that site and surveyed a larger area (540 ha) to better estimate the population for the entire shallow reef. Figure 2. Map of New Caledonia, showing the main island of la Grande Terre with the 50 study sites. Land is shaded. Abbreviations: G.R. = Grand Récif; It = Ilot; P = Passe; Pt = Plateau; R = Récif. 5
11 Table 1. Sites surveyed in Province Nord and Province Sud. S = Province Sud; N = Province Nord. n = number of transects. Reef type: L = Lagoonal, B = Barrier. Site # Province Site Date n Site size (ha) Reef type Open or reserve 1 S G. R. Aboré N.O 29/01/ B R 2 S G. R. Aboré S 18/12/ B R 3 S R. M'Béré 07/02/ B O 4 S R. N Digoro 10/01/ B R 5 S Quatre bancs du Nord 13/03/ L O 6 S R. Snark 14/02/ L O 7 S It M'bé Kouen 19/12/ L O 8 S It Goldfields 06/02/ L O 9 S G. R. Extérieur NW 09/01/ B O 10 S It Konduyo 11/01/ L R 11 S It Maître 30/10/ L R 12 S It Isié 12/01/ L O 13 S R. Tetembia 24/04/ B O 14 N P. de Yandé 22/05/ B O 15 N It Yandé 22/05/ L O 16 N P. de Poum 23/05/ B O 17 N It Neba 24/05/ L O 18 N P. de Koné 14/06/ B O 19 N Pt de Koniène Sud 12/06/ L O 20 N Pt de Koniène N.O 13/06/ L O 21 N P. de Muéo 06/06/ B O 22 N P. de Poya Sud 04/06/ B O 23 N P. Poya N.O 04/06/ B O 24 N It Grimault 04/06/ L O 25 N P. Koumac 04/07/ B O 26 N R. Kendec 05/07/ B O 27 N Pt de l'infernet 03/07/ L O 28 N Pt de Karembé 04/07/ L O 29 S R. Niagi N.O 11/09/ L O 30 S R. Niagi Sud 27/09/ L O 31 S R. Tote 07/12/ L O 32 S It Uaterembi 05/12/ L O 33 S It Ua 04/12/ L O 34 S It Gi 06/12/ L O 35 S R. U 08/01/ L O 36 S Prince de Galles 21/01/ L O 37 S R. Ua 06/02/ L O 38 S R. Komekamé 06/02/ B R 39 S R. Oema 07/02/ L R 40 S R. Gunoma 12/02/ B R 41 N R. d'amos 05/03/ L R 42 N R. Balabio 04/03/ L O 43 N Pt. Des Massacres 06/03/ L O 44 N P. Durock 26/03/ B O 45 N P. Coupée 27/03/ B O 46 N P. Touho 30/03/ B O 47 N It. Ouao 30/03/ L O 48 N It Hiengu 31/03/ L O 49 N It Cocotier 01/04/ L O 50 N P. Pouébo 02/04/ B O 6
12 Stratification of transects among habitats We mostly chose days of calm to moderate wind conditions (0-15 knots) for the field surveys for ease and safety of diving and boating. Once at the field sites, the order of habitats to survey was organised according to expected winds, currents and tides. For example, the reef flat was surveyed just before or after high tide to ensure enough depth for boat access for manta-tow method (Figure 4). Also we tried surveying the reef crest and front slope early in the day when wave chop would be lighter for boat safety. The habitats were defined by the broad geomorphological features, described in Table 2. Table 2. Definitions of the habitats used for stratified sampling. Habitat Defining geomorphological features 1 Crest Exposed to predominant swell or waves. Zone where the waves break on the reef. 2 Front slope The fore-reef substrata, descending 3-8 m on the wave-exposed side of the reef crest. 3 Reef flat Mostly shallow, hard reef substrata leeward of the crest, but not dominated by sand. 4 Lagoon Mostly sand substrata, leeward of the reef flat. Often with patch-reefs or bommies. 5 Passes or deep substrata Deep substrata from 8-25 m, hard or soft, just within barrier reef passes. Alternatively, deep substrata at the base of lagoon reefs. Lagoon Pass Reef flat Crest Front slope Figure 3. Aerial photo of one of the barrier reef study sites (SE end of Récif Tetembia, Province Sud), showing the actual position of transects in the five habitats. Pink (long) transects (200 m) Front slope. Green transects crest. Orange transects reef flat. Red transects lagoon. Yellow transects deep water in the barrier reef pass. 7


13 Population survey methods Different survey methods were used for each habitat due to their depth or exposure to waves (see Figure 3). The methodologies and dimensions for 2-m-wide transects in the five habitats are given in Table 3. Table 3. Survey methods used in the five different habitats. Habitat Survey method Transect length (m) Crest Tandem belt transects, 4 5 m apart. Skin-diving, measured with GPS by one diver. 100 Front slope Single belt transect by manta-tow method, measured with GPS in boat. 200 Reef flat Single belt transect by manta-tow method, measured with GPS in boat. 100 Lagoon Single belt transect by manta-tow method, measured with GPS in boat. 100 Passes or deep substrate Tandem belt transects, 4 5 m apart. Swim on SCUBA, measured with hip-chain device by one diver. 50 A Figure 4. A: Skin-diver being towed on a reef flat, using a manta board. Sea cucumbers of high and medium value are placed temporarily in the white catch bag attached to the rear of the manta board. B: The manta board with waterproof data sheet, framed at the centre. Photos: S. Purcell WorldFish Center. Transects were positioned randomly within each habitat, either by the boat driver, or by nominating distant points as the start of transects, on SCUBA. In each case, the width of transects was calibrated using the arm-span of the diver plus the known distance from his/her fingertips to equal 2 m. The start and end waypoints for each transect were recorded on a handheld GPS (Garmin 60C) on the boat, except for crest transects, which were marked by one of the transect recorders who carried the GPS unit. The waypoints were interfaced with aerial (high resolution) and satellite (low resolution) photographs from Google Earth to illustrate the exact positions of the transects (Appendix E). 8
14 Crest transects followed parallel to the line of wave action and were placed 5 to 20 m within the exposed zone where waves broke. The pairs of crest transects were generally spaced 100 to 300 m apart along the crest, and the two transects in each pair were about 5 m apart. We searched under reef ledges and in crevices along the transects, especially in this habitat, to be sure to sight Actinopyga mauritiana and Trochus niloticus that may have been otherwise obscured from overhead view. Transects on SCUBA in reef passes and deep areas followed the depth contour of the initial starting point, and ran roughly in a straight line with m gaps between each successive pair. That is, both buddy divers surveyed transects that were about 5 m apart, then advanced m before randomly selecting a new position to start the next pair of transects. The 50-m distance of each transect was measured using a hip-chain device, as described by Leeworthy and Skewes (2007). We searched in crevices and under ledges along these transects. The entry and exit waypoints of the SCUBA dives were marked with a GPS unit in the boat, and transect positions later extrapolated from those points. At some lagoon sites, the deep habitat did not exist, so generally more transects were conducted in the other habitats at those sites. Transects on the front slope were longer because this habitat was usually more barren of sea cucumbers and the tow speed needed to be a little faster (2.5 to 3.5 km h -1 ) to aid the skin-diver to descend closer to the substratum with the manta board. Reef flat and lagoon transects were positioned 100 to 200 m apart, generally using a tow speed of 2.0 to 3.0 km h -1. They were dispersed within the habitat area of the site so as to get representation of the different substrata within the site. Along each transect, the numbers of individuals of each sea cucumber species were recorded on proforma data sheets affixed to underwater slates or manta board (see Appendix A). This included species of high, medium and low commercial value. We also counted trochus (Trochus niloticus), and were careful to confirm they were not Tectus pyramis, which can appear similar overhead but is of no export value. Species of giant clams (except the small burrowing species, Tridacna crocea) were also counted within each transect. Recordings were made at the end of transects after memorizing counts of individuals along each transect. We also recorded sightings of species that may have been seen outside, or between, transects by just placing asterisks in the datasheet cells. These sightings contribute to the estimates of species richness at sites, but not to abundance estimates. At the end of each transect, the recorder also estimated the surface coverage of biota and substrate types and physical parameters (see Appendix A). Visibility was estimated by the diver as the distance at which another diver could be seen through the water. Relief was defined as the variation in the topography of the reef surface at scales of 2 10 m, whereas complexity was the small-scale (i.e. <1 m 2 ) variation in topography, i.e. crevices and small outcrops on the reef surface in which animals could shelter. Live coral included hard and soft coral. Rubble was dead coral or shell fragments smaller than a fist, whether loose or consolidated, whereas boulders were detached rocks or hard substrate larger than a fist. Pavement is hard, consolidated, reef matrix, whether flat or as outcrops. We defined surfaces as dead coral if the corallite structure was still noticeable, but covered with algae. The number of replicate transects we conducted varied from site to site. We generally conducted 5 to 7 transects per habitat. The replication within habitats depended on (1) how many transects could be sensibly fit into each habitat area, (2) whether we needed more transects to adequately cover the available surface area, and, to a lesser extent (3) time available in the field. A schematic illustration of the sampling design is given below (S = slope, C = crest, R = Reef flat, L = lagoon, P = Pass and deep substrata): Sites Zones S C R L P S C R L P S C R L P Transects

.")

15 In the boat, a second person recorded data of the waypoint coordinates, tow speed (for manta-tow), tow length, habitat, time of day, and water depth. The data sheets for these recordings are given in Appendix A. Size and weight measurements In addition to counting sea cucumbers, we also measured and weighed a random sub-sample of individuals from species of high and medium commercial value. The first six individuals of these species were collected by the observer along each transect and placed in a collection bag (see Figure 4). These animals were then taken to the boat after each transect survey, where their body was measured (length and width along ventral surface) to nearest 0.5 cm and weighed to nearest 5 g using an electronic balance. Body width was taken at the middle of the animals. The animals were allowed approximately 1 minute to drain on the deck of the boat before being weighed. We note here that the readout of the balance was inconstant with more wave action, so a median weight was inferred from the range in readouts over a 5 10 second period. We collected length and weight measurements for the following species: Actinopyga echinites, A. miliaris, A. palauensis, A. spinea, A. mauritiana, Holothuria fuscogilva, H. scabra, H. lessoni, H. whitmaei, Stichopus chloronotus, S. herrmanni, and Thelenota ananas. They were immediately returned to the water after taking measurements. Other species, that are fished in other countries but considered low value and not fished often in New Caledonia, were not collected and measured. The low-value species included Bohadschia argus, Holothuria atra, H. coluber, H. edulis, H. fuscopunctata, and Thelenota anax (and several other species). In total, 1,724 individual sea cucumbers were measured and weighed from the population surveys. These data were used to calculate the average sizes and size-frequency distributions of commerciallyvaluable species from each study region. The grouping by region was done to allow enough replicates for meaningful estimates of size and size-frequency, because only some of the species were found at any one site and the number of individuals measured at each site was relatively low. The data also permitted analyses of the relationship between the basal surface area of the animals and their weight, so that a conversion equation can later be used by other workers to estimate weight from body measurements. A B C Figure 5. Measuring and weighing individual sea cucumbers collected on transects of the population surveys. A Charles Poithily measuring the length of a Stichopus chloronotus near Koné. B Antoine Maloune measuring the width of a Holothuria fuscogilva near Touho. C Hugues Gossuin and Natacha Agudo weighing a Thelenota ananas from Ilot Maître. Photos: S. Purcell WorldFish Center. Species identification Species identifications were made through the use of published books, scientific journal articles, museum journal articles, and correspondence with internationally-renowned taxomomists. Notably, photos we sent of one individual of a rare species we identified as Stichopus pseudohorrens were apparently an undescribed species, called here Stichopus sp. type pseudohorrens. Through correspondence with taxonomists in Australia and Palau, we also clarified the scientific name for a species described previously (Figure 4 of Conand, 1989) as Holothuria sp. 2 as Holothuria dofleinii. 10
, was determined to be Holothuria isuga through discussion with Chantal Conand, Maria Byrne, and overseas taxonomists.")


 who sequenced the DNA from the samples and provided some confirmation of")
16 A relatively common species of little commercial value in New Caledonia, previously called Holothuria sp. 1 by Conand (Figure 4, 1989), was determined to be Holothuria isuga through discussion with Chantal Conand, Maria Byrne, and overseas taxonomists. It is rusty-brown, with large papillae, and buries most of its soft body in sediments. A B C Figure 6. Species names now clarified for several species in New Caledonia: A Stichopus sp. type pseudohorrens; B Holothuria dofleinii; C H. isuga. Photos: S. Purcell WorldFish Center. Further published literature clarified the distinctions between the three blackfish species: Actinopyga miliaris, A. palauensis and A. spinea (Figure 7).These animals are occasionally recorded by other researchers as one species, but this brings ambiguity to results since the body sizes and habitat specificities differ between the three species. The key identifying features of the three species are: A. miliaris: dark brown dorsally but lighter ventrally, anus terminal, papillae long and numerous, anal teeth conical and not nodulous A. palauensis: blackish-brown (appearing black at depth) over entire body, dorsal surface textured, anus terminal, papillae sparse and short, anal teeth nodulous or serrated A. spinea: rusty-brown or medium-brown over entire body, dorsal surface smooth, anus subdorsal, papillae short but numerous, anal teeth nodulous A B C Figure 7. The blackfish group of species. A Actinopyga miliaris; B A. palauensis; C A. spinea. Photos: S. Purcell WorldFish Center. In addition, we sent more than 50 tissue samples to geneticists in Australia (Dr Sven Uthicke, Dr Maria Byrne) who sequenced the DNA from the samples and provided some confirmation of identifications. In particular, one species we had identified as Stichopus horrens was in fact Stichopus naso (probably corresponds with Stichopus sp. 1 from Figure 4 of Conand, 1989). Also, there were three morphotypes of Holothuria atra, which we distinguished on data sheets early in the project but later grouped on the basis of genetic analyses that could not detect evidence for those being different species. All of the genetic samples will also contribute strongly to a project by the United Nations-FAO to obtain genetic barcodes of species from around the world. 11
17 Data management A database was created in MS-Access to store and maintain the integrity of the field data. All of the data from the 1,475 transects were stored in this way. The form of the database was checked by the Direction des Technologies et des Services de l Information (DTSI), in Nouméa, and was suitable for integrating with other ZoNéCo geo-referenced data. An important step in this operation was to attribute a unique identifying number for each transect. These unique identifiers provided a link between the transect survey observations, animal measurements and geographic coordinates. The unique identifiers equally correspond in the GIS interface to the geographic object (i.e. transect). Three main tables were created that correspond to the three field data sheets (Appendix A). Coordinates recorded using the handheld GPS were transferred on navigation software and associated to the data in MS-Excel tables. Data manipulations, e.g., to calculate average abundances, densities and error estimates, were made in MS-Excel. The summary data were then imported into a GIS application, MapInfo, in order to illustrate results geographically. Tables were automatically created on MapInfo by opening Excel results tables. Associated coordinates allowed us to position field data information on their object transect. Afterward, we used the thematic mapping function in MapInfo to create different types of graphs to illustrate results geographically. All files were saved in table (.tab ) format for MapInfo and, at the end of the project, final files in shapefile (.shp) format were stored at the DTSI. Site and habitat mapping using Geographic Information System (GIS) Through the navigation software we drew transects and exported them to aerial/satellite images and we exported coordinates in MS-Excel tables to associate them to the ecological and biological data from transects. Additionally, the waypoint coordinates were interfaced in MapInfo with maps of reefs and land of New Caledonia. Calculations of the surface area of habitats and sites were made using a dataset of existing geomorphological coding within each reef, provided by the Institut de Recherche pour le Développement (IRD), in Nouméa. That is, the study reefs were partitioned already into several geomorphological codes, which are similar to broad habitats, e.g. the reef flat was one code, the front slope another, and the lagoon another. We grouped geomorphological codes into 6 habitat types: Crest, Front slope, Pass/deep substrata, Lagoon, Reef flat and Land (i.e. islands). The original geomorphological codes that we obtained were broad and did not contain the reef crest habitat or deep substrata that we surveyed. Ideally, one would create these new codes from chromic signals from satellite imagery, but that was beyond the resources of the project. Therefore, we created the reef crest habitat by an algorithm that produced a new zone between the reef flat and front slope: of a width of 50 m for barrier reefs and 25 m for lagoon reefs. We acknowledge that this will not accurately reflect the width of the reef crest on each reef, but believe this estimation is realistic in terms of average width of the wave-exposed zone on these reefs. We also created new codes for the deep water habitat based on depth profiles from navigational charts. To construct new codes for the crest habitat, we firstly made three copies of the map. The first one was used to create crest polygons, the second one to create the crest into the initial map and the third one was a backup. Then, all polygons with slope attribute (Figure 8a) were selected in the data base. A buffer was made around the perimeter of each slope polygon: a 50 m buffer for barrier reef polygons and 25 m buffer for lagoon reef. Then, the operation was repeated for reef flat polygons. This gave overlapping buffers where reef flat polygons and front slope polygons met (Figure 8b). We then created new polygons with the attribute crest which are delimited by the intersection of slope and reef flat polygons (including buffers). We then pasted the new layer of crest polygons (Figure 8c) on the initial map (Figure 8d), hence the three copies. So, the crest polygons are created from equal parts of front slope and reef flat polygons. Finally, we deleted and reshaped slope and reef flat polygons where crest polygons are overlapping the slope and the reef flat, and incorporated these codes into the initial map base. 12

 we had to create codes for a complete reef because the data were missing from the map database provided by the IRD.")

18 Figure 8. Progression of steps performed in MapInfo to create the crest codes. A Front slope and reef flat polygons are selected. B Buffers are placed around each polygon. C The intersection of polygon buffers is selected, corresponding to the new crest habitat. D The new crest polygons are pasted on the initial map and the slope and reef flat polygons are reshaped in MapInfo. In one case (Récif Niagi, Province Sud) we had to create codes for a complete reef because the data were missing from the map database provided by the IRD. This was achieved by obtaining an aerial photo of the site from Google Earth and importing it into the GIS application. Geographic reference points were then identified and linked to the GIS application to wedge the raster image. We then drew around the various habitats depending on their colour signals on the photo to yield polygons, to which we gave appropriate attributes in the associated data table. Because the original geomorphological codes did not correspond exactly to the reef habitats, sometimes waypoints were slightly outside of their correct habitat. In such cases, we adjusted the shape of the corresponding polygons slightly to match the transect data, since we knew the waypoints were in their corresponding habitat. To determine the area of each site, we applied buffers of 100 m radius (circles) around each GPS waypoint (Figure 9b) and manually drew polygons around the outer perimeter of the buffers of the outer waypoints (Figure 9c). This procedure thus assumes that transects placed 100 m from the perimeter of the site would adequately sample the perimeter zone of the sites. Within each polygon, we then obtained the surface area for each habitat type, corresponding to the five habitats in which we stratified the transect sampling. 13
19 Pass Lagoon A Reef flat Crest Front slope B C D Figure 9. Progression of steps performed in MapInfo to obtain the perimeter of the site in order to calculate surface area of the sites and of each habitat within the sites. A Transects are uploaded to the map with geomorphological codes. B Buffers of 100 m radius are applied to each transect. C The perimeter of the buffers is drawn. D The buffers are removed to show the new layer, which is just the study site (in colour) with associated habitats. Statistical calculations of population parameters Calculation of the average densities of each species within each habitat is simple: it is just a computation using the transect data, standardised to individuals per hectare. However, we chose to present abundances for whole reef units (including all habitats) for two reasons. Firstly, because some habitats are much smaller than others and a high density in these habitats does not mean the species were numerically abundant at the sites. Secondly, because some species occur in more than one habitat and graphic illustrations would be inconceivably complex if they had to show densities for each species in each of the five zones for each of the 50 reef sites. Abundance estimates take into account the actual area of habitats in which the animals occur, and whether some were present in more than one habitat. To calculate abundance, we firstly multiplied the density of each species within each habitat by the habitat surface area within the site polygon. This provided mean estimates, with associated standard error, of the number of individuals of each species within each habitat for each site (i.e. abundance per habitat). We note here that some species have strong habitat affinities and occur mostly in the same habitat on each reef (e.g., Actinopyga mauritiana occurs on the reef crest, and rarely elsewhere). Other species have broader habitat affinities and could be found regularly in two or more habitats (e.g., Holothuria atra can be found in all habitats, depending on the reef site). The equation to calculate abundances of each species in each habitat for each reef site is given below: 14
20 Abundances by habitat: AbH ijk 1 n jk n jk = t=1 D ijkt A jk where: AbH ijk = Abundance per habitat for species i in habitat j at site k D ijk = Density of individuals from a transect for species i in habitat j at site k n jk = number of replicate transects conducted in habitat j at site k A jk = area of habitat j at site k To calculate the total abundance for a whole site for each species separately, we added the abundance estimates for each habitat. This gives a total abundance, for each species, per site. At this point, comparisons of these estimates among sites are difficult, and potentially misleading, because there was up to a 3-fold difference in site size. That is, some sites were small (e.g., 60 ha), so the total abundance of a species would naturally be less than at a larger site (e.g., 160 ha), even if densities per habitat were identical. Therefore, we standardised the total abundance of each species by dividing by the site area in hectares, to give a standardised abundance per square kilometre of reef, which includes all five habitats. The equation for this last step is given below: Abundances by site (standardised per km 2 ): AbS jk H AbH j= = 1 A k ijk where: AbS ik = Abundance per site for species i at site k AbH ijk = Estimated abundance of individuals of species i in habitat i at site k A k = area of site k in square kilometres H = number of habitats surveyed The calculation of error terms, e.g., Standard Error, of the density and abundance estimates within each habitat is straightforward; it simply reflects the variation in data of counts of individuals of each species among transects within habitats. Error estimates for abundances per site are not just averages of the error estimates for each habitat, but pooled error estimates, following Zar (1984; p. 128): Pooled S.E.: EAbS il H s = n j=1 2 ij j Al where: 15
21 EAbS ik = Error estimate for the abundance per site for species i at site l, standardised per km 2 of reef s ij = variance of the abundance of individuals of species i in habitat j n j = number of transects conducted in habitat j A l = area of site l For population abundance and density estimates, we present standard errors as the error estimates, since it is the estimation of precision of the mean that should be of main interest. As mentioned, average weights of sea cucumbers were calculated and presented per region. In Figures, we use standard deviation as the error term of average body weights since it is the variation in body weights among individual animals within a region that is of main interest. Body weights are also presented as size-frequency distributions, using logical size-class intervals for each species given the range in body sizes measured. Graphical presentations of results using GIS We used MapInfo to prepare illustrations of the abundance and body sizes from sites and study regions. We developed novel techniques for displaying average body sizes of sea cucumbers and for displaying error estimates of mean abundance and body sizes, which to our knowledge are new to this field of scientific research. Normally, the MapInfo software does not have built-in options for including error bars on bar charts or pie charts, which we used for displaying population abundances. Bar charts would therefore just display mean abundance estimates for each species, without showing the error of the estimations. This was unsatisfactory to us for two reasons: (1) because the error terms are important for visually comparing abundances of one species to another or one site to another, to indicate if values are significantly different, and (2) because the error terms show how precise the estimates are for giving confidence in the mean estimates for understanding quantities of exploitable stocks per square kilometre, for example. We presented standard errors on bar charts of abundances of sea cucumbers by sub-posing open (no fill) bar charts of the mean + standard error under the bar charts of mean abundance. Likewise, we sub-posed open pie charts of the pooled mean + standard error under pie charts of pooled abundances for giant clams. We also developed a novel technique to show mean sizes of individuals measured from survey transects and from landings of the study regions, instead of just using bubble plots. This involved importing graphics of photos of each species into MapInfo and using the images to display estimated mean body sizes. The software then adjusts the image size automatically to correspond with the mean estimates in the data matrix. Thus, the sub-posed bar widths represent the mean + standard deviation. 3.3 Landing surveys Landed catch data A separate study was conducted to examine the composition, body sizes, catch volume and fishing effort of fishing campaigns by the fishers. We conducted 54 visits to make these measurements on batches of harvested sea cucumbers, and tried to partition the visits equitably among the regions in which the population surveys were conducted. The visits were facilitated by (1) travelling with processors to the fishing communities to measure catches at the point of first sale, (2) going to processors at the time when they received harvested sea cucumbers, or (3) visiting fishers after they had spent one or more days harvesting sea cucumbers. Once the entire catch was presented, we recorded the composition by species in terms of weights or estimated proportion of the entire catch weight. The catch could be in various forms such as fresh (gutted or whole), salted or dried. Appendix B gives the data sheet used for the landing surveys. Where enough individual sea cucumbers of each species were present, we measured the body lengths (± 0.5 cm) and weights (± 1 g) of 20 random individuals. The form of measured animals and 16
22 scientific names were recorded on the landing data sheet (see Appendix D). Most of sea cucumber species are gutted from the ventral surface, except for Holothuria whitmaei and Holothuria fuscogilva. For all species, the lengths and widths of individuals were measured on the ventral surface as shown on the photo of Appendix D. In case of damaged eviscerated animals, with difficulties to recover original form or width, only the length was recorded. For the length measurement, animals were usually placed on a horizontal tray to facilitate measurement. Each sampled animal was weighed on an electronic balance. Landing surveys at processing stations were easier to organize than at fishers homes or at boat ramps. Most of interviewed processors were based in Province Sud and possessed larger boats that go fishing in the north and west of New Caledonia (Surprise Islands and Chesterfield Reefs). Thus larger quantities of animals were usually observed at processors places. All data from each datasheet were recorded in an MS-Excel file for later analysis of results. We also questioned the fishers about their fishing effort: number of days to catch the batch, travel time, time in the water, number of actual fishers on the boat. We also asked for the site from which the sea cucumbers were collected, but often only received a general response of the fishing region, not specific sites. A guide to completing the landing catch survey (Appendix D) was given to the provinces so their technicians could also collect this data, but we did not receive any forms from them during this project. In the 54 landing surveys, we measured a total of 2,433 animals from 17 species. Many species were just fished opportunistically by inexperienced fishers, and represent a small proportion of the number of animals observed. The species measured from landed catches are given in Table 4. Table 4. List of sea cucumber species encountered and measured in the landing surveys. Family: Holothuriidae Family: Stichopodidae Actinopyga echinites Holothuria coluber Stichopus herrmanni Actinopyga lecanora Holothuria fuscogilva Thelenota ananas Actinopyga mauritiana Holothuria isuga Thelenota anax Actinopyga miliaris Holothuria scabra Actinopyga palauensis Holothuria lessoni Actinopyga spinea Holothuria whitmaei Bohadschia argus Bohadschia vitiensis Study of conversion factors for processing stages An immediate problem we faced was that animals sold or presented by fishers were in various forms of processing into bêche-de-mer. On some occasions the catch was just gutted; other times, the animals were gutted and salted; other times they were dried already. We needed to be able to convert the individual weights back to whole body weight, in order to have a common unit for analyses of the landing data and to allow direct comparisons of weights with data on body weights of sea cucumbers that we collected in the population surveys. Some conversion factors have been published for some stages of processing for some species (Skewes et al. 2004). However, there were gaps in published information for some species that we measured. Therefore, we conducted a study to estimate the average weight loss at each principal stage of processing for those species. The 70 samples for this study were obtained either by accompanying a fisher (Wigrial Mouzin) and using animals he collected, or by using animals we collected during a population survey (near Ile Ouen). Once collected, the animals were drained on the deck of the boat for approx. 1 min before weighing the whole body to the nearest 5 g using an electronic balance. The viscera were then removed, by cutting the animals as practiced by the fishers. Tags were placed through the body wall of the animals; a plastic label threaded through the anus with fishing line, and (for A. palauensis and H. whitmaei) a T-bar tag was also inserted through the body wall. The bodies were then weighed; i.e. gutted weight. Salt was then added to the sea cucumbers and left for 10 days (with two salt changes during that time), which is standard for the processor we worked with, and then each individual was 17
23 weighed again. For Stichopus herrmanni, animals were not salted by the fisherman, since his practice was to place them immediately on ice and boil them after returning to land. The sea cucumbers were boiled and dried to a hard product (bêche-de-mer) and weighed again. The species and number of replicate individuals for which we calculated weight loss at each successive stage of processing are given in Table 5. Note that some tags were lost during the salting and boiling stages for some of the individuals from the trip with the fisher. The loss of tags resulted in fewer replicates for conversion factors of the later stages. Table 5. Number of replicate individuals of the six study species measured at different stages of transformation into bêche-de-mer. Species Number of individuals weighed (n) Whole (fresh) Gutted Salted Dried Actinopyga echinites Actinopyga spinea Actinopyga palauensis Holothuria lessoni Holothuria whitmaei Stichopus herrmanni 11 9 The conversion factors arising from this study (presented in section 4.3), and those published by Skewes et al. (2004), were used to convert individual body weights in landings to estimates of whole (fresh) body weight. 3.4 Fisher and processor surveys Fisher surveys Lists of registered fishers were obtained from the fisheries services of Province Sud and Province Nord. Additionally, we were introduced to fishers by the processors. We chose a number of representative fishers from the six regions in which the field population surveys were conducted (Figure 10). The three regions in Province Nord were: Boat Pass-Touho on the north-east coast, and Poum-Kaala Gomen and Népoui-Ouaco on the west coast. The three regions in Province Sud were: Poya-Boulouparis and Nouméa on the west coast, and Grand Sud Nouméa in the south. Questionnaires were developed with the cooperation of sociologists at the SPC (Mecki Kronen and Aliti Vuniseya). Many of the questions are in common with those asked by PROCFish/C in their interview with fishers in other Pacific countries. Drafts of the questionnaires were sent to the provinces and ZoNéCo for comment before finalisation (see Appendix B). Before each interview (fishers and processors), we described the project and its objectives, and explained that it was not part of surveillance and that the responses would help the management of their fishery. After this introduction and some other exchanges, the respondents were more receptive to questions and responding honestly. The questionnaires were structured to provide qualitative and quantitative data for analyses; i.e. responses as ticks to multiple choice responses or as numbers. These were filled by project team members of WorldFish Center during interviews with fishers they were not given to fishers for them to complete. Interviewers used cards with drawings of various sized sea cucumbers so fishers could choose drawings for questions regarding the size of sea cucumbers collected rather than guessing lengths and weights. However, a ruler was sometimes used at the request of the respondent. Identification cards with colour photographs of species helped us to align local names of sea cucumbers to scientific names. The interviews also gave time for open discussion. 18
24 Boat Pass - Touho Poum - Kaala-Gomen Ouaco - Népoui Poya - Boulouparis Nouméa Grand Sud Nouméa Figure 10. The regions around la Grande Terre used for grouping fishers interviewed during the project. At the end of each questionnaire, interviewers recorded special notes/comments from the fishers, which were also integrated into the results. The 34 questions cover aspects within the following topics: the type and places of fishing, the catch, the average fishing effort (duration), processing of sea cucumbers by the fishers, economic importance, historical context, and their knowledge and desires about fishery management regulations. Many of the interviews were held in conjunction with the landing surveys, or by accompanying processors to a sale point to meet the fishers. Interviews were held with the fishers and do not reflect households. The intention was to interview a number of fishers from each of the main regions within New Caledonia in which we conducted the sea cucumber population surveys. The fisher questionnaire is given in Appendix B. At the time of the study, there were 78 registered sea cucumber fishers in New Caledonia (61, Province Nord; 17, Province Sud), but not all of these were regularly actively fishing sea cucumbers. We note that there are many unregistered fishers, who collect sea cucumbers occasionally for extra income to their livelihoods, including some youths who collect during holidays for their parents to sell. We interviewed 26 fishers who fished regularly, so the catches should not be extrapolated to registered fishers that just exploited sea cucumbers occasionally. The interviews took place between August and December 2007, and took approximately 30 min. The number of interviewed fishers from the various regions is given in Table 6. We aimed to approximately balance the number of interviews held in the six regions (Table 6). This meant that we interviewed a majority of the registered fishers from Province Sud, but only a small proportion of the registered fishers in Province Nord. The annual harvest was estimated by multiplying the number of boats registered in each region by the average number of fishers per boat (reported by the fisheries services and fishers) and by the average catch per fisher per year for each region. We estimated the average catch per fisher per year from landing surveys, using the average number of fishing days per week and the number of fishing days per year (deduced from fisher interviews). 19
25 Table 6. Number of fishers interviewed in the six study regions around la Grande Terre. Province Region Number of fishers interviewed Nord Boat Pass to Touho 4 Poum to Kaala Gomen 6 Ouaco to Népoui 4 Sud Poya to Boulouparis 6 Nouméa 2 Grand Sud Nouméa 4 Processor surveys Separate questionnaires were developed, in a similar manner, for use in interviews with processors of sea cucumbers (see Appendix C). We defined a processor as someone who regularly buys sea cucumbers (whole, gutted, salted or dried) from fishers and processes or exports the animals. There were nine processors recognised in New Caledonia, of which we interviewed seven. Two of the interviewed processors were in Province Nord and five were in Province Sud. Some of the interviewed processors started their businesses overseas before immigrating to work in New Caledonia. We individually met all processors before interviewing them with a view to improve the relationship and collaborative work. It was very important to be in touch and keep each processor informed on the project progress for better collaboration and coordination of work. Meetings with fishers in some of the distant and isolated areas were possible thanks to this collaboration. For example, in some cases the processors called us to invite us for a trip with them to conduct landing surveys and conduct interviews with fishers. The visit of distant fishers in the Province Nord with a processor was 1 2 day trip. It consisted of a tour of several fishers in one to two areas. Risks of failing to meet fishers were high due to the difficulties in contacting them in some isolated areas. The two other processors in New Caledonia were from regions apart from those we evaluated in the sea cucumber population surveys. Again, the interviews took place between August and December 2007, and took approximately 20 min. The questionnaires to processors posed 25 questions on the following topics: their experience in the industry, zones and problems in the purchase of sea cucumbers, species bought and prices, export context and export prices, and their desires about fishery management regulations. 3.5 Study on growth and movement of sea cucumbers Background A study was launched to assess the growth and medium-term movements of commercially valuable sea cucumbers. The growth rates would allow us to better understand how quickly animals could attain harvestable size, which would be important for rotational closures if small animals were left after a period of fishing. The movement information would show how far they could disperse over 6 12 months, which could help in determining appropriate sizes of reserves to protect breeding populations. In order to achieve the objectives of the study, tags were needed that could identify individual sea cucumbers months later and that would not be harmful to the animals, and which would not modify growth and movement. Previously, we studied the retention and detection of various tag types on Sandfish Holothuria scabra (Purcell et al. 2006). That study indicated that coded wire tags and 20
 tags, inserted in the coelomic cavity of sea cucumbers, as the new tagging method for the present study.")
, crustaceans (Bubb et al.")
26 elastomer implants could not be used to identify individuals easily and that T-bar tags were stressful to the animals and expelled quickly in juveniles. We therefore proposed to try the use of Passive Induced Transponder (PIT) tags, inserted in the coelomic cavity of sea cucumbers, as the new tagging method for the present study. The PIT tags (also called microchips) are the same as used in livestock and pets. They are 12 mm long and return a signal to a decoder to show the individual tag number. Success in the retention and benign effects of PIT tags has been documented for fish (Ombredane et al. 1998, Skov et al. 2005, Woods 2005), crustaceans (Bubb et al. 2002) and sea urchins (Woods and James 2005) but no studies had been published on their use in sea cucumbers. The study was planned in two parts: (1) a preliminary study to trial the PIT tags in two species to see if the rates of retention in the specimens were high enough over 1-month to give confidence in their use over 1 year, and (2) a full study involving tagging of six species, followed by measurements of their growth and movements after 3, 6 and 12 months. Preliminary tagging study Methods The preliminary study commenced at Ilot Maître on 25 April Firstly, we collected 20 individuals of two species with different body morphology and size; Holothuria whitmaei (Black Teatfish) and Actinopyga miliaris (Hairy Blackfish). The H. whitmaei were collected from the reef base on the north west side of the main reef, and the A. miliaris were collected in shallow lagoon seagrass beds just to the north of the island. The animals were placed in bins of seawater on the boat. They were drained for about 1 minute on the deck of the boat before being measured (length and width, to ± 0.5 cm) and weighed (to ± 5 g, with an electronic balance). Immediately after being weighed, one PIT tag was injected into the coelomic cavity on the dorsal surface, about one-third of a body length from the anus. A double T-bar tag was then inserted through the body wall, in the hole from the PIT tag injection, such that one anchor was on the medial surface of the body wall and one anchor was outside the animal. The functioning and individual number of each PIT tag was then verified with a hand-held reader (Figure 11). A B Figure 11. A One PIT tag on the index finger. B The hand-held PIT tag decoder (Loligo Systems ApS). The animals were held briefly in bins with fresh seawater before being placed on the reef in two groups. All of the 20 H. whitmaei were placed within an area of about 20 m 2 on sand-covered pavement in the lagoon next to large rocks where they could find shelter. This is a habitat in which we find H. whitmaei on other reefs and in which we have found this species at Ilot Maître. The A. miliaris were placed in a separate group in shallow seagrass beds, in an area of about 20 m 2 near where they were collected. We also removed untagged A. miliaris from that area. The functioning of the PIT tags underwater was verified using the decoders, through a plastic bag, on several occasions. Eight days after tagging and releasing the sea cucumbers, we returned to the field sites where the two groups had been placed. All 20 individuals of both species were relocated visually. We then recorded whether the animals had retained the T-bar tag, and noted the tag number (Figure 12). The presence of a PIT tag was checked thoroughly using the decoders, as practiced in the previous week. Because few PIT tags were detected (discussed below) we also dissected a couple of individuals, which verified that there were no PIT tags retained in the body cavity. 21

27 Figure 12. A Black Teatfish, Holothuria whitmaei, on the lagoon reef platform, showing an orange T-bar tag (circled) retained in the body wall, 8 days after tagging. Lesson 1: T-bar tags can cause lesions, so these may not be appropriate for studies on growth and movement due to deleterious effects on animal health. PIT microchips were mostly rejected and currently do not appear to be suitable tags for sea cucumbers. Preliminary tagging study Results Only 5 out of the 20 tagged H. whitmaei had retained PIT tags, and only 10 out of the 20 individuals had retained the T-bar tags. Additionally, we observed that about half of the individuals with T-bar tags had infected lesions (white growth and exposed tissue) around the insertion point of the tags. None of the A. miliaris had retained PIT tags, but 12 out of the 20 individuals had retained T-bar tags. Notably, only a couple of the animals with T-bar tags had lesions near the tag insertion points. Based on the low tag retention rates after only 8 days in both species, we concluded that PIT tags were unsuitable for these species, and probably for other related species too. Also, the lesions seen with T-bar tags, and the relatively high loss rate of about half the tags in 8 days, suggested that they were also unsuitable for studies on growth and behaviour. We therefore aborted plans for the larger tagging study, and instead invested resources into landing surveys and a study to determine conversion factors at various stages of processing sea cucumbers (discussed earlier). 3.6 Fishery management workshop From April we conducted a workshop with stakeholders in the sea cucumber fishery at the Northern Province s administrative headquarters (Hôtel de la Province Sud) in Koné. The workshop was attended by six fishers, six processors, the chief and five technicians of the fisheries service of Province Nord, the chief and one technician of the fisheries service of Province Sud, one person from the Environment Service of Province Sud, one scientist from the PROCFish/C program of the SPC, one scientist from the ZoNéCo program, and the three WorldFish Center scientists who coordinated the research of the project. Many more fishers were invited but did not attend. The objectives of the workshop were to 1) overview the principles of fisheries management measures and case histories from other sea cucumber fisheries, (2) present preliminary results from the population surveys, landing surveys and socio-economic surveys, and 3) discuss appropriate management of the sea cucumber fishery in New Caledonia. The workshop was divided into two principal parts: (1) on the first day, we gave oral presentations as a background, and the results of the ZoNéCo project, and (2) on the second day, we presented 22
: 1. Workshop agenda 2.")

28 recommendations for management actions and regulations for the fisheries in Province Nord and Province Sud and discussed with the stakeholders these and other management options. On the first day, the 11 oral presentations were assisted by MS-PowerPoint slide shows on the following topics (in chronological sequence): 1. Workshop agenda 2. General context of sea cucumber fisheries worldwide 3. Examples of sea cucumber fisheries management 4. Principles of management regulations 5. Potential for farming and sea ranching of sea cucumbers in New Caledonia 6. Key management recommendations from international workshops 7. History of sea cucumber fishing in New Caledonia 8. Overview of activities for the ZoNéCo project 9. Project results: sociological surveys 10. Project results: landing surveys 11. Project results: sea cucumber population surveys A B Figure 13. Workshop with stakeholders of the sea cucumber fishery of la Grande Terre. A WorldFish staff leading a discussion. B Stakeholders in the workshop conference room. Photos: Sabine Jobert. On the second day, we gave an annotated presentation of our preliminary recommendations for the management of the sea cucumber fisheries in Province Nord and Province Sud. This was followed by questions from the participants about the ZoNéCo study and management principles. There was a further session of open questions and discussions. The final afternoon was spent in ordered discussion, taking turns for each participant to speak about several key issues: size limits, rotational closures, catch quotas, and fishing closures for certain species. We prepared and distributed sheets at the workshop for identifying the main commercial species of sea cucumbers and giant clams collected in New Caledonia, with common English names and local names (Figure 14). 23
29 Photo Scientific name Local Name English name Photo Scientific name Local Name English n am e Actinopyga echinites L a rouge Deep-water Redfish Holothuria lessoni Le mouton Golden Sandfish Actinopyga lecanora Stonefish Holothuria scabra Le gris Sandfish Actinopyga mauritiana La mauritiana Surf Redfish Holothuria whitmaei Le tété noir Black Teatfish Actinopyga miliaris La noir e boule Hairy Blackfish Stichopus chloronotus L ananas vert Greenfish Actinopyga palauensis Le noir long Deep-water BlackFish Stichopus herrmanni La curry Curryfish Actinopyga spinea Le noir long Burying Blackfish Thelenota ananas L ananas Prickly Redfish B ohads chia argus L a léopard Leopardfish Thelenota anax Le géant Amberfish Holothuria atra Lolly Lollyfish Hippopus hippopus Bénitier rouleur Rolling clam Holothuria edulis Pinkfish Tridacna derasa Smooth giant clam Holothuria fuscogilva Le tété blanc White Teatfish Tridacna maxima Elongated clam Holothuria Elephant L éléphant fuscopunctata Trunkfish Tridacna squamosa Scaly clam Figure 14. Sheet for identification of sea cucumbers and giant clams collected in New Caledonia. Photos: S. Purcell WorldFish Center. 24

30 4. RESULTS 4.1 Underwater population surveys Overall population abundances of sea cucumbers The total abundance of sea cucumbers at the field sites, per square kilometre of reef including all habitats, varied enormously among sites (Figure 15). We considered four species to be of high value: Holothuria fuscogilva, Holothuria scabra, Holothuria lessoni and Holothuria whitmaei. This distinction was in harmony with a poster published by the SPC and with export prices given by fishers (see section 4.3). Likewise, the species of medium value were Actinopyga echinites, Actinopyga miliaris, Actinopyga palauensis, Actinopyga spinea, Actinopyga mauritiana, Stichopus chloronotus, Stichopus herrmanni, and Thelenota ananas. Figure 15. Pie charts of total pooled abundance of all sea cucumber species from each study site, including species of high, medium, and low value (including non-commercial species). The diameter of the pie charts corresponds to the total pooled abundance per square kilometre of reef, including all habitats. One conspicuous feature of most reefs was the dominance of low-value species in the sea cucumber communities. At 54% of sites, low-value species made up more than three-quarters of the individuals we observed in transects. A further obvious finding was the consistently low proportion of high-value species in sea cucumber communities at study sites. Species of medium value were relatively abundant (>10,000 ind.km -2 ) at only 8% of study sites. We also note that in many cases, the abundances of medium-value species are heavily weighted by large populations of Stichopus chloronotus, which is at the low end of the medium-value category. A two-way orthogonal ANOVA test showed that the average pooled abundance of species of high and medium value did not differ between provinces (p = 0.70) or between barrier and lagoonal reefs (p = 0.34). Although many of the sites in fishing reserves had relatively abundant populations of high- and 25
31 medium-value sea cucumbers, some reserve sites did not. This could, in part, be attributed to the fact that some of the reserves are relatively new. Excluding Stichopus chloronotus, which is rarely fished in New Caledonia, the overall abundance of high- and medium-value sea cucumbers was 27% higher at sites in fishing reserves (mean: 1,890 ind.km -2 ) than sites open to fishing (mean: 1,489 ind.km -2 ). However, there was much variation among sites in both groups and this difference was not statistically significant (one-way ANOVA: p = 0.49). Upon closer inspection of Figure 15, it is apparent that barrier reef sites generally held fewer sea cucumbers (all species) per unit area of reef than lagoon reef sites. As striking evidence, the top ten sites with highest pooled abundance of sea cucumbers per square kilometre were all lagoonal sites. A two-way ANOVA test confirmed that total pooled abundance of sea cucumbers was higher at lagoonal sites (p = 0.012) and that, overall, pooled abundances in Province Nord were the same as in Province Sud (p = 0.98). The top three sites of highest pooled abundance of sea cucumbers were Ilot Hiengu (Province Nord), Quatre bancs du Nord and the north-west part of Récif Niagi (Province Sud). At these three sites, pooled abundances reached more than 50,000 ind.km -2 of reef. There were a number of sites in the northern part of Province Nord with abundant populations and most of the populations at sites south of Nouméa were also relatively abundant. Sites in the long-term Integral Réserve Merlet (Récif Komekamé, Récif Oema, Récif Gunoma, and Récif Ua, far south-east) had relatively abundant populations, but it was a surprise that these were not among the most abundant of sites we surveyed. Many sites had sparse sea cucumber populations, even when counting species of low commercial value and non-commercial species. Of note, more than half the sites between Nouméa and Poum on the west coast of la Grande Terre held less than 5,000 ind.km -2. However, one should be cautious about attributing the sparse populations in this section of coast to fishing pressure, since low-value species that are not currently fished were also sparse. Population abundances of individual sea cucumber species Figure 16 illustrates the population abundances per square kilometre of site for each of the species of high and medium value. As discussed, the values should be considered in the context of numbers of individuals of each species per whole reef units, including all habitats. The abundances are therefore down-weighted by low data records, or absence of individuals, in habitats not preferred by the various species. But this approach provides a realistic measure of how many animals were present at the site scale, and these abundance measures pool the estimates of abundance of various species from sightings in multiple habitats on the same site. The pooled abundances (Figures 16 and 17) are therefore a better measure of stock size per unit area of reef than density in particular habitats, since habitats may occupy only a relatively small surface area of reefs. Overview: It is evident from Figure 16 that some commercially valuable species could be found on almost all of the study sites. Secondly, the composition of those species varied markedly among sites. That is, at some sites one or more commercially valuable species were found commonly, but these were much less dominant in the communities of other sites. This result illustrates that the composition of sea cucumber communities varied spatially, at the scale of regions within New Caledonia, and there was no systematic pattern in community structure either along a latitudinal gradient or between barrier and lagoon reefs. Actinopyga echinites: Deep-water Redfish had a relatively confined distribution along la Grande Terre. We recorded them only in Province Sud, at five lagoonal reef sites. At Ilot Maître and Récif U, they were relatively abundant on the reef flat habitat (2,560 and 1,800 ind.km -2, respectively). Actinopyga miliaris: The Hairy Blackfish is a species we recorded only at lagoon sites. It was present at low to moderate abundance at two sites in Province Nord (240 and 1,270 ind.km -2 ) and at three sites in Province Sud (100-1,000 ind.km -2 ). However, A. miliaris is reported by fishers to bury at certain times, so our surveys may have underestimated abundance at some sites. Actinopyga palauensis: The Deepwater Blackfish, or Panning s Blackfish, is a relatively conspicuous species that occurs commonly on reef pavement. It was found mainly at barrier reef sites, but occasionally in the lagoon. It was more common at sites in Province Nord, where occasionally (3 sites) the abundances on barrier reefs were greater than 1,000 ind.km -2 of reef. It was found as shallow as 4 m, but more commonly in 5-15 m depth. Some individuals could perhaps exist at 26
32 depths beyond our SCUBA transects, but the bias is likely to be relatively small compared to the estimated mean abundances. Actinopyga spinea: The Burying Blackfish was found at one-third of the lagoonal reef sites, seeming to prefer softer sediments (but not mud) in which to bury. However, even when buried, the posterior end of the animals is often still evident and can be sighted with some experience. It was found in both provinces and was quite common at three sites, with estimates greater than 1,500 ind.km -2 of reef. Actinopyga mauritiana: The Surf Redfish was found in both provinces, and observed at 40% of sites. However, it has a strong specificity for the crest habitat (discussed in the following section), which represents a relatively small area of sites. For this reason, it was not very abundant at a reef scale, even at the sites where it was recorded. It makes up a small proportion of the total sea cucumber community at sites, and abundance estimates never exceeded 1,000 ind.km -2 of reef and only twice exceeded 500 ind.km -2 of reef. Holothuria fuscogilva: White Teatfish were observed in low abundance at most sites, and it was usually at barrier reefs that we observed them. At most sites, we did not observe them in transects nor outside transects; it was found only at 8 sites. In particular, few H. fuscogilva were recorded in transects at sites in Province Sud. It was found as shallow as 2 m on the reef flat, but most commonly occurs at depths of >10 m. They were found generally on pavement and were conspicuous, even when covered by fine sand. We acknowledge that they can occur deeper than our SCUBA transects (i.e. >25 m) and, for this reason, we likely underestimated abundances somewhat. However, even a 50% underestimation would still suggest that stocks are generally low. Holothuria scabra: The Sandfish was rarely found, mainly because the study sites were lagoon reefs and barrier reefs, whereas its preferred habitat is inshore seagrass beds with muddy-sand substratum. It was found at many inshore sites in the previous WorldFish resource project ( ). It was found only at 1 study site, so we did not include it in Figure 16. Holothuria lessoni: Similar to H. scabra, the Golden Sandfish is mostly an inshore species, but it seems to prefer somewhat coarser sediment and can be found on some lagoon reefs (Conand 1989). It is a large, conspicuous species, but does bury at some localities, probably in the early morning. It was found only at 3 of the study sites, so we have not included it in Figure 15. Previously Holothuria scabra var. versicolor, the Latin binomial for this species was recently changed to H. lessoni (Massin et al. 2009). Holothuria whitmaei: Previously known as H. nobilis in the Pacific, Black Teatfish were present at a majority (62%) of sites. They could be found in several habitats (discussed in the following section) on both lagoon and barrier reefs. At just 4 sites, the total abundance exceeded 1,000 ind.km -2. However, it was never observed in high abundance on reefs. Holothuria whitmaei is sometimes difficult to sight on transects in deeper water in habitats with boulders because it is usually covered with fine sand and can resemble small boulders to inexperienced workers. It also can rest beside rocks or structures during the morning (discussed later), so some of the estimates may be biased downwards, but we argue that this probably represents a small fraction of the estimated means. Stichopus chloronotus: The Greenfish was the most abundant of the medium-value species that we recorded. It was found at half of the sites, and was a significant component of the sea cucumber communities at a number of sites in both provinces. Its populations were present at more than 1,000 ind.km -1 at 15 sites and abundances exceeded 10,000 ind.km -1 at 4 of these (see red asterisks in Figure 16). However, S. chloronotus is a small commercial species (see further section on sizes) and is at the low end of the medium-value class, owing in part to the high amount of water lost during processing. It can reproduce asexually by transverse fission of the body, and the fission products are small (Uthicke 2001a, Conand et al. 2002). Thus, some S. chloronotus could be missed on transects, so estimates at some sites could be biased downward to a small extent. Stichopus herrmanni: The Curryfish is a large and conspicuous species, previously called S. variegatus in the Pacific. It was recorded at 19 lagoon sites, evenly dispersed along la Grande Terre. At 4 of those sites, abundances were between 1,000 and 4,000 ind.km -2. Small individuals 27
33 could possibly be missed on transects in dense seagrass on reef flats, but such habitats rarely occurred at the study sites, so we argue that abundance estimates are probably unbiased. Thelenota ananas: The Prickly Redfish was found at half of the study sites. However, usually it existed in low abundance, with individuals sparsely scattered in only one or two habitats. This is a large and conspicuous species that does not bury and did not appear to shelter, so estimates are probably unbiased. It appears to be a little more abundant in Province Nord, and was found in abundance (>1,000 ind.km -2 ) at only one site (Passe de Koné). As discussed, the low value species were, overall, more abundant on most of the reefs than species of medium and high value. Figure 17 illustrates the estimated abundances of the seven low-value species observed in population surveys; note change in scale of bars compared to Figure 16. These species are collected by fishers in other countries (e.g. Solomon Islands, Philippines, Indonesia, Papua New Guinea), but their low value makes then unattractive for fishers in New Caledonia. Bohadschia argus: The Tigerfish was found at half of the sites in both provinces. It was most commonly found on sand at the base of reef structures in sheltered habitats on lagoon reefs and barrier reefs. It was never very abundant but moderate abundances of 1,000 to 3,000 ind.km -2 were estimated at 6 sites. Bohadschia vitiensis: The Brown Sandfish is a species that inhabits protected deeper lagoon environs of sites with soft fine sand. Owing to this habitat specificity, it was not surprising to have only found it at three sites, and it was not abundant. Holothuria atra: The Lollyfish was the most abundant species of the study. At 15 sites, abundances of H. atra exceeded 10,000 ind.km -2, or 100 ind.ha -1, pooled across all habitats. We note that the morphotype often varied among habitats: the normal form being found on the reef flat and shallow lagoons, the large form being found in deeper water of passes, reef fronts and deeper parts of lagoons, and a textured form occurring on the crest. Holothuria edulis: The Pinkfish was found at 28% of sites, and was found more frequently in reef passes and in deeper lagoon areas and places on the reef slope with sand or rubble. It was rarely very abundant but moderate abundances above 1,000 ind.km -2 were estimated at 6 sites. Holothuria coluber: The Snakefish is a cryptic species that lives under rocks and boulders, namely on the reef flat. It can be mistaken for H. leucospilota by the inexperienced diver. It was found at almost one-quarter of the sites, and sometimes with abundances of more than 1,000 ind.km -2. At only one reef was it very abundant; Ilot Ouao on the north-east coast, where it averaged 5,333 ind.km -2. Holothuria fuscopunctata: The Elephant Trunkfish appeared to be more common in Province Sud than Province Nord but, overall, it was observed at only 14 sites. It is a large and conspicuous species, but perhaps could be confused with H. scabra at a distance because it has similar deep wrinkles in the dorsal body wall. It was very abundant at some sites near Nouméa and some sites further south, where 1,000 to 13,000 could be found per square kilometre of reef. Pearsonothuris graeffei: Curiously, the Blackspotted Sea Cucumber was not found at sites on the west coast. It was quite abundant at one site, Ilot Hiengu, in the north-east. Just one individual was found at a site in the long-term Réserve Intégrale Merlet, in the south-east. 28

34 Figure 16. Bar charts of abundance of commercially valuable sea cucumbers at the study sites. Bar heights are proportional to pooled abundances of each species on each reef site. Note that the pooled standard error estimates are given as an open, dashed, bar behind each solid bar. On a few reefs, the abundances of Stichopus chloronotus were high, so these values and errors for just those bars were divided by 10, and these cases are noted with red asterisks. 29
35 Figure 17. Bar charts of abundance of low-value sea cucumbers at the study sites. Bar heights are proportional to pooled abundances of each species on each reef site. Note that the pooled standard error estimates are given as an open, dashed, bar behind each solid bar. On a few reefs, the abundances of Holothuria atra or Holothuria coluber were high, so these values and errors for just those bars were divided by 10, and these cases are noted with red asterisks. 30
36 Population densities of exploited sea cucumbers in preferred habitats To understand densities of the commercial species at smaller scales, we calculated the average densities of individuals of each species within each of the five habitats, pooling across all sites (Table 7). We also divided the data by reef type, whether lagoon or barrier reef, and calculated average densities of individuals within each habitat for each reef type (Tables 8 and 9). For each species, the habitat in which individuals were, on average (pooling average densities across all sites) most abundant, was nominated as the preferred habitat for that species (using the term loosely). The average densities of individuals of each species in their preferred habitats at each site are provided in Tables 10 to 13. Table 7. All sites: overall average densities of individual sea cucumbers (ha -1 ) of medium and high value in the five habitats; averages density estimates pooled among all 50 reef sites. Habitats with the highest densities of individuals are shaded for each species. Species Crest Lagoon Pass / deep Front slope Reef flat Holothuria fuscogilva Holothuria whitmaei Actinopyga mauritiana Actinopyga miliaris Actinopyga echinites Actinopyga spinea Actinopyga palauensis Stichopus chloronotus Stichopus herrmanni Thelenota ananas Table 8. Lagoonal reef sites: average densities of individual sea cucumbers (ha -1 ) of medium and high value in the five habitats at lagoon sites; averages density estimates pooled among all 30 lagoon sites. Habitats with the highest densities of individuals are shaded for each species. Species Crest Lagoon Pass / deep Front slope Reef flat Holothuria fuscogilva Holothuria whitmaei Actinopyga mauritiana Actinopyga miliaris Actinopyga echinites Actinopyga spinea Actinopyga palauensis Stichopus chloronotus Stichopus herrmanni Thelenota ananas
37 Table 9. Barrier reef sites: average densities of individual sea cucumbers (ha -1 ) of medium and high value in the five habitats at barrier reef sites; averages density estimates pooled among all 20 barrier reef sites. Habitats with the highest densities of individuals are shaded for each species. Species Crest Lagoon Pass / deep Front slope Reef flat Holothuria fuscogilva Holothuria whitmaei Actinopyga mauritiana Actinopyga miliaris Actinopyga echinities Actinopyga spinea Actinopyga palauensis Stichopus chloronotus Stichopus herrmanni Thelenota ananas Estimates of densities of individuals for each sea cucumber species at each site (Tables 10 to 13) could serve, for example, in evaluating whether breeding populations are suitably dense to permit mates to find each other easily. We present estimates per hectare, for convenience of whole numbers and comparisons with other studies. The values should not be interpreted to individuals per 100 m by 100 m areas for all habitats, since the crest and front slope were sometimes less than 100 m wide. Rather, the values should be best interpreted as densities per 10,000 m 2 of habitat in which each species was found most frequently (per unit area), which may be rectangular units. In Tables 10 to 13, we applied graduated shading to densities in the following categories: 0, 1 10, 10 50, , , and >1000 ind.ha -1. The shading serves simply to draw attention to higher densities. We avoided shading to denote states of overfishing, or whether stocks were healthy or depleted, since some population densities could be naturally low at some sites. Also unclear are the minimum densities required for populations of each species to reproduce effectively, because there have been few studies in this field of research for sea cucumbers (discussed further in section 5). But as tentative, and subjective, benchmarks one could consider population densities below 100 ind.ha -1 to be low, and densities below 30 ind.ha -1 to be at, or near, a critical level at which populations will fail to repopulate effectively (i.e. negative rates of per capita population growth). That is, mates may not easily find each other or be close enough for males to successfully fertilise a high proportion of oocytes from females. Of course, these broad benchmarks will be more realistic for some species than others, depending on many factors like pre-spawning movement of adults and fertilisation kinetics. They may serve as a useful guide for resource management in the absence of critical research. We suggest that such interpretations should consider densities in habitats within the theoretical context of meta-population dynamics, whereby dense breeding populations at a few sites supply larvae for recruitment and regeneration of populations at other sites. One could, most tentatively, use these benchmarks for interpreting results of densities for trochus and giant clams, which are presented later. 32
38 Table 10. Densities (ind.ha -1 ) of high- and medium-value sea cucumbers in their preferred habitat at sites in Province Sud. The habitat in which they occurred at highest average (pooling across all sites) density is denoted on the second heading row, and this is the habitat from which mean density if given for that species. P = Pass; RF = Reef flat; C = Crest; L = Lagoon. Shading is graduated darker for higher estimates of density. N Site H. fuscogilva H. whitmaei H. scabra H. lessoni A. mauritiana A. echinites A. miliaris A. spinea A. palauensis S. chloronotus S. herrmanni T. ananas Habitat P P RF RF C RF L P P RF RF P 1 G. R. Aboré N.O 2 G. R. Aboré S 3 R. M'Béré 4 R. N Digoro 5 Quatre bancs Nord 6 R. Snark 7 It M'bé Kouen 8 It Goldfields 9 G. R. Extérieur NW 10 It Konduyo 11 It Maître 12 It Isié 13 R. Tetembia 29 R. Niagi N.O 30 R. Niagi Sud 31 R. Tote 32 It Uaterembi 33 It Ua 34 It Gi 35 R. U 36 Prince de Galles 37 R. Ua 38 R. Komekamé 39 R. Oema R. Gunoma
39 Table 11. Densities (ind.ha -1 ) of high- and medium-value sea cucumbers in their preferred habitat at sites in Province Nord. The habitat in which they occurred at highest average (pooling averages across sites) density is denoted on the second heading row, and this is the habitat from which mean density is given for that species. P = Pass; RF = Reef flat; C = Crest; L = Lagoon. Shading is graduated darker for higher estimates of density. N Site H. fuscogilva H. whitmaei H. scabra H. lessoni A. mauritiana A. echinites A. miliaris A. spinea A. palauensis S. chloronotus S. herrmanni T. ananas Habitat P P RF RF C RF L P P RF RF P 14 P. de Yandé 15 It Yandé 16 P. de Poum 17 It Neba 18 P. de Koné 19 Pt de Koniène Sud 20 Pt de Koniène N.O 21 P. de Muéo 22 P. de Poya Sud 23 P. Poya N.O 24 It Grimault 25 P. Koumac 26 R. Kendec 27 Pt de l'infernet 28 Pt de Karembé 41 R. d'amos 42 R. Balabio 43 Pt. Des Massacres 44 P. Durock 45 P. Coupée 46 P. Touho 47 It. Ouao 48 It Hiengu 49 It Cocotier P. Pouébo
40 Table 12. Densities (ind.ha -1 ) of low-value sea cucumbers in their preferred habitat at sites in Province Sud. The habitat in which they occurred at highest average (pooling across all sites) density is denoted on the second heading row, and this is the habitat from which mean density is given for that species. L = Lagoon; P = Pass; RF = Reef flat. Shading is graduated darker for higher estimates of density. N Site B. argus B. vitiensis P. graeffei H. edulis H. fuscopunctata H. atra H. isuga H. coluber Habitat L L L P P RF RF RF 1 G. R. Aboré N.O 2 G. R. Aboré S 3 R. M'Béré 4 R. N Digoro 5 Quatre bancs Nord 6 R. Snark 7 It M'bé Kouen 8 It Goldfields 9 G. R. Extérieur NW 10 It Konduyo 11 It Maître 12 It Isié 13 R. Tetembia 29 R. Niagi N.O 30 R. Niagi Sud 31 R. Tote 32 It Uaterembi 33 It Ua 34 It Gi 35 R. U 36 Prince de Galles 37 R. Ua 38 R. Komekamé 39 R. Oema R. Gunoma
41 Table 13. Densities (ind.ha -1 ) of low-value sea cucumbers in their preferred habitat at sites in Province Nord. The habitat in which they occurred at highest average (pooling across all sites) density is denoted on the second heading row, and this is the habitat from which mean density is given for that species. L = Lagoon; P = Pass; RF = Reef flat. Shading is graduated darker for higher estimates of density. N Site B. argus B. vitiensis P. graeffei H. edulis H. fuscopunctata H. atra H. isuga H. coluber Habitat L L L P P RF RF RF 14 P. de Yandé It Yandé P. de Poum It Neba P. de Koné Pt de Koniène Sud Pt de Koniène N.O P. de Muéo P. de Poya Sud P. Poya N.O It Grimault P. Koumac R. Kendec Pt de l'infernet Pt de Karembé R. d'amos R. Balabio Pt. Des Massacres P. Durock P. Coupée P. Touho It. Ouao It Hiengu It Cocotier P. Pouébo
42 High-value species: The White Teatfish Holothuria fuscogilva was found most in the pass and deep water habitat at both lagoon and barrier reef sites (Tables 8 and 9). It occurred at higher densities on the barrier reefs. Within the pass and deep water habitat, Holothuria fuscogilva was above 30 ind.ha -1 at only one site (Table 11). Based on these results, population densities of this species appear to be very low. The Black Teatfish Holothuria whitmaei was most dense within the pass and deep water habitat at lagoon sites (Table 8). At barrier reef sites, it was slightly denser on the reef flat habitat than in the passes (Table 9). This variation in habitat specificity is likely a result of sediment types and currents that are different on reef flats between the two reef types. This species has a weak fidelity to particular habitats (Tables 8 and 9) and can be found, on occasions, in most reef habitats. Densities were frequently between 30 and 50 ind.ha -1 (Tables 10 and 11), suggesting that stocks are relatively low, even in its preferred habitat. Medium-value species: Preferring mostly the thin crest habitat on both lagoon and barrier reefs (Tables 8 and 9), the Surf Redfish Actinopyga mauritiana was often found at very low densities. Its subpopulations were denser on the reef crest of barrier reefs than lagoonal reefs. Populations of A. mauritiana were estimated to be in densities above 30 ind.ha -1 on the crest at only 10% of sites. Actinopyga echinites, A. miliaris and A. spinea were found only on lagoonal reefs (Table 8), indicating that they prefer protected, sedimentary sites. Densities were very low at most sites, but dense populations of each species were rarely found (Table 10). Actinopyga echinites occurred mostly on the reef flat, but also could be found in other habitats if substrate was coarse sand with dead coral rubble. Actinopyga miliaris was found mostly on the reef flat and lagoon habitat, but somewhat more densely in the latter. Actinopyga spinea was found most densely on sand in the deep water areas surrounding lagoon reefs, but was also recorded in reef flat and lagoon habitats. Actinopyga palauensis preferred the reef passes and was denser at barrier reef sites. It was also found frequently, at lower densities, on the front slope. Population densities were moderate at only one site (133 ind.ha -1 ; Table 11), whereas at most sites it was not found at densities greater than 50 ind.ha -1. The Greenfish Stichopus chloronotus was found most densely on the reef flat at lagoon and barrier reef sites (Tables 8 and 9). It was also frequently recorded on the reef crest, where wave action was not too strong. High densities, exceeding 500 ind.ha -1, were estimated at three sites (Tables 10 and 11). However, it was more commonly present at densities of ind.ha -1, or lower, on the reef flat. The Curryfish Stichopus herrmanni occurred in many habitats (Table 8) on lagoonal reefs and was most dense in deeper areas surrounding the reefs. It was absent at barrier reef sites (Table 9) and reef crests, so seems to prefer relatively calm environments. Densities were generally low or very low. The Prickly Redfish Thelenota ananas was found most densely in deeper areas surrounding lagoon reefs, and on the exposed slopes of barrier reefs. Populations of T. ananas were generally sparse, and rarely exceeded 50 ind.ha -1. Sizes of sea cucumbers from the study regions The mean sizes of sea cucumbers collected on transects at the study sites varied among regions, depending on the species (Figures 18 to 21). As a broad generality, individuals tended to be larger in the north-west and in the far south than along most of the west coast of la Grande Terre north of Nouméa. This pattern, while not consistent for each species, corresponds to the level of current and past fishing pressure around la Grande Terre; i.e. fishing is probably more intensive along western la Grande Terre where human populations centres are more developed. Tentatively, this suggests that fishing pressure has reduced average sizes of commercially valuable sea cucumbers in the fisheries in the two provinces, in some regions. 37
43 The average sizes (whole body weights) of Actinopyga mauritiana and A. echinites in the six study regions are illustrated in Figure 18. The trends in average sizes for A. mauritiana follow the above description; the average individual sizes were larger in the far north and far south ( g) than between Nouméa and Ouaco on the west coast ( g). As noted in the previous section, A. echinites was not present at many sites, and found solely in Province Sud. The average sizes of species in the blackfish group vary greatly among species (Figure 19). Actinopyga palauensis generally reached larger sizes than the other two species in this group and averaged 1,140 to 1,770 g whole body weight. Actinopyga spinea was larger in the far south and north-west of la Grande Terre (averages: 1,650 and 1,750 g) than between Nouméa and Ouaco (790 1,170 g). Body weights of Actinopyga miliaris averaged 760 g in the far south, but only ~550 g elsewhere. Following the trend, Holothuria fuscogilva was generally larger in the north of la Grande Terre, averaging up to 2,720 g, whereas individuals averaged 1,990 g in the Boulouparis to Poya region further south (Figure 20). Comparatively, Holothuria whitmaei reached smaller sizes, with average weights in regions ranging from 1,450 to 2,180 g. Unlike some other species, individuals were not larger in the far north and far south (Figure 20). The relatively small standard deviations of the average sizes of H. whitmaei show a consistency of sizes among regions. We found a large variation in sizes of Stichopus herrmanni, S. chloronotus and Thelenota ananas among the study regions (Figure 21). In addition, the relatively large standard deviations show that there was much variation in individual sizes for each species within regions. Stichopus chloronotus was larger in the north-east of la Grande Terre (average: 220 g), but elsewhere averaged less than 140 g body weight. Therefore, although abundant, S. chloronotus is generally quite small and of marginal commercial interest in the fishery at present. Stichopus herrmanni averaged 2,140 to 2,450 g in half of the regions, but individuals averaged less than 2,000 g in the other three regions (Figure 21). Thelenota ananas averaged 2,405 to 3,081 g among regions, but again, standard deviations show much variation in sizes within regions. 38


44 Figure 18. Photo plots of mean sizes (whole body weights) of Actinopyga echinites and A. mauritiana from the population surveys in the six study regions. Lengths of images correspond linearly to mean body weights from samples pooled within regions. Sub-posed bars are the standard deviations; adjacent numbers are sample sizes. Figure 19. Photo plots of mean sizes (whole body weights) of Actinopyga spinea, A. miliaris and A. palauensis from the population surveys in the six study regions. Lengths of images correspond linearly to mean body weights from samples pooled within regions. Sub-posed bars are the standard deviations; adjacent numbers are sample sizes. 39

45 Figure 20. Photo plots of mean sizes (whole body weights) of Holothuria fuscogilva and Holothuria whitmaei from the population surveys in the six study regions. Lengths of images correspond linearly to mean body weights from samples pooled within regions. Sub-posed bars are the standard deviations; adjacent numbers are sample sizes. Figure 21. Photo plots of mean sizes (whole body weights) of Stichopus chloronotus, S. herrmanni and Thelenota ananas from the population surveys in the six study regions. Lengths of images correspond linearly to mean body weights from samples pooled within regions. Sub-posed bars are the standard deviations; adjacent numbers are sample sizes. Note change in scale for the different species. 40
46 Morphometric relationships One of the applications of the data on lengths, widths and weights of sea cucumbers we collected along transects is to allow fishery workers to estimate body weight of animals from the length or basal area of the animals. This would be particularly useful in cases where an electronic balance was not available or where it is not easy to measure weight, such as underwater in field surveys or on a rocking boat. We used the length and width measurements to calculate the basal area of the commercially valuable sea cucumbers using the equation for the area of an ellipse: length width Basal Area = π 2 2 We examined the relationships between (1) body length and body weight and (2) basal area and body weight, using the general morphometric equation: y = a x b where: y is body weight (g), x is the body length (cm) or basal surface area (cm 2 ), and a and b are parameters derived from the model. The parameters for converting body length or basal surface area of commercial sea cucumbers to an estimated body weight are given in Table 14. We found and measured only 6 individuals of Actinopyga lecanora, which attributed much to the nonsignificant relationship between body length and weight. Thus, we cannot advocate this relationship for conversions. The equation for converting basal area to body weight was a much better fit to the data, but marginally non-significant. We suggest that it could be used in the absence of other data and encourage others to take more measurements to improve this equation. In all cases, the basal area of the sea cucumbers (using length and width) provided a much better prediction of body weight than length alone (Table 14). On average, the basal area of sea cucumbers explained 69% of the variation in body weight. In other words, the estimation of body weight from basal area will have an average error of 31%. In contrast, the body length of animals was not a very good predictor of their body weight. On average, the length of sea cucumbers explained just 42% of the variation in body weight; i.e. the average error of the estimates was 58% of the body weight. The improvement in estimating body weight using the basal area was pronounced for most species in the genera Actinopyga, Holothuria and Thelenota. In particular, using basal area instead of just body length gave an improvement of at least 50% in the accuracy of estimates of body weight in Actinopyga echinites, A. mauritiana, A. palauensis, and Holothuria fuscogilva. Moreover, using basal area resulted in a 2-fold improvement in accuracy of conversions for A. miliaris A. spinea and H. whitmaei, compared to conversions using length alone. We conclude that body length is a poor estimator of body weight in these species. Basal surface area can be used as a reliable predictor of body weight in most of the species, but explained less than two-thirds of the variation in body weights in A. mauritiana, A. miliaris, H. fuscogilva and H. whitmaei. We therefore recommend that body weight should be measured directly in these four species where possible. The reason for the improvement in estimation of body weight using basal area is simple: as animals contract in length, they increase in width. Thus, the basal area of many sea cucumbers does not change greatly compared to the changes in their length. However, species in the genus Stichopus do not contract as much, when captured, as the species in other genera. This is why basal area added little improvement in the estimation of body weight from estimations using length alone. For Stichopus chloronotus and S. herrmanni, length measurements were almost as good as basal area for estimating body weight. 41
47 As mentioned earlier, weight measurements had some added error due to the rocking of the boat in wavy conditions. Thus, our estimates have more error (i.e. larger r 2 value) than other studies that measured animals on land or in calmer conditions (c.f. Conand 1989). Table 14. Conversion of length and basal surface area of sea cucumbers to whole body weight. The general morphometric equation y = a * x b was used, and the estimated parameters a and b are given for functions for each species that we measured from field surveys. The test significance level (p), proportion of estimated variation explained by the functions (r 2 ), and sample size (n) are also provided. Lengths are in centimetres, area is in square centimetres, and weight is in grams. Species Conversion a b p r 2 n Actinopyga echinites Len-Wt < Area-Wt < Actinopyga lecanora Len-Wt Area-Wt Actinopyga mauritiana Len-Wt < Area-Wt < Actinopyga miliaris Len-Wt < Area-Wt < Actinopyga palauensis Len-Wt < Area-Wt < Actinopyga spinea Len-Wt < Area-Wt < Holothuria fuscogilva Len-Wt Area-Wt Holothuria scabra Len-Wt < Area-Wt < Holothuria lessoni Len-Wt < Area-Wt < Holothuria whitmaei Len-Wt < Area-Wt < Stichopus chloronotus Len-Wt < Area-Wt < Stichopus herrmanni Len-Wt < Area-Wt < Thelenota ananas Len-Wt < Area-Wt <

48 Species richness, dominance and rarity of sea cucumber communities The number of different species observed at sites, or species richness, provides useful insights for conservation management. Species richness is sometimes used as a measure of diversity, while other diversity indices such as the Shannon Weaver Diversity Index account for relative abundances in addition to the number of species. The species richness of sea cucumber communities varied greatly among sites (Figure 22). We observed 10 or more species at one-third of the sites, and there were, on average, 8 species observed per site. This includes non-commercial species or those of low-value, but does not account for very cryptic species such as those predominantly buried throughout the whole day or hidden under boulders. Overall, species richness was not related to the surface area of sites (linear regression: p = 0.76), and was marginally unrelated to the number of transects we surveyed at sites (linear regression: p = 0.07). Figure 22. Bubble plots of total species richness of sea cucumbers at the study sites. The diameter of each bubble corresponds linearly to the total number of species observed at the site, and includes species observed outside transects. It is interesting that, although results of average body sizes suggested lower fishing pressure in the far north and far south of la Grande Terre, the communities were not particularly speciose in those regions. The two sites with the most speciose sea cucumber commmunities were at Ilot Maître (near Nouméa) and Récif Niagi (near Ile Ouen) in Province Sud, where 19 and 16 species were recorded, respectively. A two-way ANOVA found that lagoonal reef sites had significantly greater (p = 0.008) species richness of sea cucumber communities (mean: 9.2 species) than barrier reef sites (mean: 7 species). There was no significant difference in species richness of sites between Provinces Nord and Sud (p = 0.43). The average species richness of sea cucumber communities at reserve sites was identical to species richness of communities in non-reserve (open to fishing) sites. 43
49 Lesson 2: For conservation of sea cucumbers, reserves should be more numerous in lagoon reefs because species richness is expected to be relatively high. Some barrier reef reserves are also needed to protect some breeding populations of species not often found at lagoonal sites. In Province Nord, the sea cucumber communities were not very speciose in the far north-east and north-west. In Province Sud, sea cucumber communities were least diverse at sites between Nouméa and La Foa, where just 4 6 species were often recorded per site. Communities at sites far south of Nouméa, in Les Cinq Iles and near Ile Ouen, were reasonably diverse, with 8 16 species recorded per site. Surprisingly, the sea cucumber assemblages in the long-term Réserve Intégrale Merlet (Récif Komekamé, Récif Oema, Récif Gunoma, and Récif Ua; far south-east) were not overly speciose. At the four sites in that reserve, 7 12 species were observed. We conclude that the relation between apparent fishing pressure and species richness at sites appears inconsistent. Species dominance in field surveys As shown earlier, the numerically dominant species, by far, was the low-valued Holothuria atra. It accounted for half of all animals observed in field surveys (Table 15). As discussed, we observed three morphotypes of this species (normal, deep, crest), which loosely occupy different zones of wave exposure. Based on specimens we sent for analysis, there are no genetic differences among these forms (S. Uthicke, pers. comm.). Twenty years ago, Conand (1989; Table 11 therein) also found that H. atra was the most dominant species, comprising 35% of population numbers in New Caledonia. One must be cautious about comparing our results with those of Conand s, since we surveyed only lagoonal and barrier reefs in this study and methods differ, but the evidence points that community composition has changed markedly in the past two decades. The second-most common species was Stichopus chloronotus. The following species of numerical dominance, Actinopyga echinites, Holothuria isuga and A. spinea, each accounted for 4 5% of observations. But we note that this result is weighted heavily on abundant populations at the Ilot Maître site where we conducted more than twice the average number of transects. Conand (1989) found that A. miliaris made up about 10% of population abundance 20 years ago. Our result of just 2% of overall population abundance for A. miliaris suggests that the relative abundance of this species has declined in New Caledonia. Regarding the more valuable species, some notable findings are evident in Table 15. Although the Black Teatfish Holothuria whitmaei is targeted by fishers and requested by processors, it accounted for just 1.4% of sea cucumbers we observed. More striking, the more valuable White Teatfish Holothuria fuscogilva accounted for only 0.2% of all sea cucumbers we observed. Although Holothuria lessoni (previously H. scabra var. versicolor) is reported to be less littoral than H. scabra and was found to be relatively uncommon 20 years ago (Conand 1989), we recorded it at just 3 sites and 148 of the 150 total observed individuals were from the reserve at Ilot Maître. A genetic study on Holothuria scabra showed that populations in this area cannot be expected to supply larvae to northern populations (Uthicke and Purcell 2004), so we conclude that recruitment of H. scabra may be limited in Province Nord. As discussed, Holothuria scabra represented a low proportion of animals we recorded, in part because we did not survey its preferred habitat (inshore seagrass beds) in this study. Some species we recorded can be considered rare, in terms of their frequency in our field surveys. However, this does not necessarily make them rare species since we may have simply not visited the few sites where they could be common. For example, we found Stichopus naso (Figure 23a) at only one site (Récif Snark) and it was relatively abundant there in deep water. We may also not have surveyed deep or hard-to-access habitats, or at times when they could be found. For example, few Actinopyga lecanora were recorded, but these are sometimes collected by fishers so presumably they know some sites where they can be found. There were six species that can be considered rare in terms of our observations, since we only found one or two individuals: Actinopyga albonigra (Figure 23b), Bohadschia tenuissima (Figure 23c), Holothuria fuscocinerea, Holothuria dofleinii (Figure 6b), Stichopus sp. type pseudohorrens (Figure 6a) and Bohadschia maculisparsa. There are, of course, other species that we have seen in previous studies (e.g. Holothuria flavomaculata) and species known to exist in New Caledonia (see Guille et al. 1986), which were not seen in our surveys. 44
50 Table 15. Numbers of individual sea cucumbers, by species, and their relative composition to the total number of individuals observed in the field surveys. Species No of individuals recorded Proportion of total individuals recorded Holothuria atra 3, Stichopus chloronotus Actinopyga echinites Holothuria isuga Actinopyga spinea Holothuria edulis Holothuria fuscopunctata Holothuria coluber Bohadschia argus Holothuria leucospilota Stichopus herrmanni Holothuria lessoni Actinopyga miliaris Holothuria whitmaei Thelenota ananas Actinopyga palauensis Actinopyga mauritiana Thelenota anax Pearsonothuria graeffei Holothuria fuscogilva Stichopus naso Synapta maculata Actinopyga lecanora Euapta godeffroyi Bohadschia vitiensis Bohadschia similis 3 <0.1 Holothuria scabra 3 <0.1 Holothuria scabra H. lessoni hybrid 3 <0.1 Actinopyga albonigra 2 <0.1 Bohadschia tenuissima 2 <0.1 Holothuria fuscocinerea 1 <0.1 Holothuria dofleinii 1 <0.1 Stichopus sp. type pseudohorrens 1 <0.1 Bohadschia maculisparsa outside transect 0.0 Total 6,

.")


51 A B C Figure 23. Three of the species found at few sites in New Caledonia. A Stichopus naso; B Actinopyga albonigra; C Bohadschia tenuissima. Photos: S. Purcell WorldFish Center. Abundances of giant clams We observed five species of giant clam at the reef sites: Tridacna crocea (not recorded), T. derasa, T. maxima, T. squamosa and Hippopus hippopus (Figure 24). The total pooled abundances of giant clams on the study sites are given in Figure 24. One should consider that the abundance is standardised to square kilometres of reef so that the results are not confounded by the variation in surface area of sites. This presentation mode means that all habitats are included even those for which no giant clams were observed at certain sites. The values should therefore not be interpreted as densities, but are meaningful for understanding stock size for whole reef units. Overall, giant clams (Figure 25) were much less abundant than sea cucumbers on the study reefs (c.f. Figure 15), averaging 1,910 ind.km -2 across all sites. They occurred in each of the five reef habitats, so this measure of pooled abundances at a larger scale is more appropriate than examining densities in separate habitats. Pooled abundances were more than 2,000 ind.km -2 (>20 ha -1 ) at only half of the sites; and at only 3 sites were they estimated to be more numerous than 5,000 ind.km -2 (>50 ha -1 ). At 17 sites, pooled abundance was less than 1,000 ind.km -2 (<10 ha -1 ). A B C D Figure 24 The four species of giant clams recorded in transect surveys. A Tridacna derasa; B T. maxima; C T. squamosa; D Hippopus hippopus. Photos: S. Purcell WorldFish Center. 46
52 Figure 25. Pie charts of abundance of giant clams at the study sites. The diameter (not area) of the pie charts corresponds to the total pooled abundance of giant clams, while the sectors correspond to the contribution of each of the four species to that total abundance. 47
53 Abundances of giant clams were noticeably low at many sites from near Nouméa to La Foa. On average, giant clams were 60% more abundant on barrier reefs than lagoon reefs and a two-way orthogonal ANOVA test showed that this difference was statistically significant (p = 0.04). However, no significant difference existed between Provinces Nord and Sud (p = 0.95). Abundances of giant clams were moderately high at sites in the Réserve Intégrale Merlet (2,900 3,800 ind.km -2 ) but, more importantly, the animals were noticeably larger than most other sites. Although some evidence pointed to a low level of poaching at these sites (recently empty shells), these long-term reserve sites should serve as a useful reference. The most common of the four study species was Tridacna maxima, which usually accounted for more than half of observations of giant clams (Figure 25). Tridacna maxima were found at every site except one. The abundance estimates for T. maxima exceeded 1,000 ind.km -2 at more than half of the sites. Tridacna squamosa and T. derasa were less common, being found at 74% and 36% of sites, respectively. Notably, although T. derasa was found at over one third of sites, abundances (pooled across habitats) were generally quite low. It was only moderately abundant (1,000 2,000 ind.km -2 ) at two sites, which were in the remote south of the lagoon of la Grande Terre. Hippopus hippopus was, by far, the least common of the four species. We found H. hippopus at only 12% of sites, and abundance estimates were just over 1,000 ind.km -2 at only one site. We did not record Tridacna crocea, because it is a small burrowing species that can be numerous elsewhere in the Pacific and not normally fished and eaten by humans in New Caledonia. It was, however, a surprise not to find many T. crocea except at the far north-east sites. In conclusion, we consider the abundances of giant clams to be low or very low at many sites. At 34% of sites, pooled abundances of giant clams were one-third to one-seventy of the size of populations at Récif Gunoma (Réserve Intégrale Merlet), which had the lowest abundance of giant clams of the four study sites in Réserve Intégrale Merlet. The low abundance of Hippopus hippopus at most sites should also be alarming. It is mostly found on reef flats and is not firmly attached to hard substrata, making it easy to be removed by fishers, both professional and recreational. Likewise, Tridacna derasa is a species not well affixed to reef surfaces, and was generally sparse. The results therefore suggest that perhaps just 20% of non-reserve sites have reasonable populations of giant clams and about one-third of sites are moderately to severely depleted in comparison to populations at the reference reserve sites. Densities of trochus (Trochus niloticus) Trochus niloticus were found mainly in the reef crest habitat (Tables 16 and 17). They were occasionally observed in the reef flat and exposed slope habitats, but rarely in the lagoon habitat or in barrier reef passes and deep water. Although in low densities at many sites, trochus were observed at 74% of the study sites. It is worth noting that the estimates of average density of trochus on the reef crest per site are quite imprecise; i.e. the error estimates are relatively large compared to their means (Tables 16 and 17). The low precision of the mean estimates simply reveals that trochus were patchy at a small spatial scale. In other words, there was great variation in counts among transects on the crest within most sites. This does make population assessments more troublesome, since the dense patches can be missed by random sampling, whereas fishers probably search over larger areas of reef crests and then focus their collection effort on the areas where animals are dense. The densities of Trochus niloticus on the crest habitat varied greatly among sites (Figure 26). Population densities at sites in Province Nord were generally low; trochus was present at densities above 1 ind.100 m -2 (or 100 ind.ha -1 ) at only one-fifth of sites. In contrast, more than one-third of sites in Province Sud held densities of trochus above 1 ind.100 m -2 in the reef crest habitat. A two-way ANOVA test (using log(x+1) transformed data) confirmed that the average density of trochus (in the crest habitat) in Province Sud was significantly higher than in Province Nord (p = 0.008). The test also showed that densities of trochus were also significantly higher on barrier reefs than lagoonal reefs (p = 0.001), and this trend was consistent between the two provinces (interaction: p = 0.63). 48
54 Table 16. Average densities of Trochus niloticus (ind.100 m - ²) in the five different study habitats at the field sites in Province Nord. Abbreviations for reef type: B = Barrier reef; L = Lagoonal reef. Standard errors are superscripted after each mean estimate. Site N Site Reef Type Crest Lagoon Pass Slope Reef flat 14 P. de Yandé B It Yandé L P. de Poum B It Neba L P. de Koné B Pt de Koniène Sud L Pt de Koniène N.O L P. de Muéo B P. de Poya Sud B P. Poya N.O B It Grimault L P. Koumac B R. kendec B Pt de l'infernet L Pt de Karembé L R. d'amos L R. Balabio L Pt. Des Massacres L P. Durock B P. Coupée B P. Touho B It. Ouao L It Hiengu L It cocotier L P. Pouébo B
55 Table 17. Average densities of Trochus niloticus (ind.100 m - ²) in the five different study habitats at the field sites in Province Sud. Abbreviations for reef type: B = Barrier reef; L = Lagoonal reef. Standard errors are superscripted after each mean estimate. Site N Site Reef Type Crest Lagoon Pass Slope Reef flat 1 G. R. Aboré N.O B G. R. Aboré S B R. M'Béré B R. N Digoro B Quatre bancs du Nord L R. Snark L It M'bé Kouen L It Goldfields L G. R. Extérieur NW B It Konduyo L It Maître L It Isié L R. Tetembia B R. Niagi N.O L R. Niagi Sud L R. Tote L It Uaterembi L It Ua L It Gi L R. U L Prince de Galles L R. Ua L R. Komekamé B R. Oema L R. Gunoma B
 of the shell drawings corresponds to the estimated density of trochus per 100 m 2 ; the red sub-posed bars denote the standard error of the estimates.")
56 Figure 26. Drawing plots of density of Trochus niloticus on the reef crest at the study sites. The height (not area) of the shell drawings corresponds to the estimated density of trochus per 100 m 2 ; the red sub-posed bars denote the standard error of the estimates. Overall, Trochus niloticus is relatively common in New Caledonia, and can be found at the majority of reef sites. It was observed at 90% of the barrier reef sites in this study. The low densities at some sites may not favour very successful reproduction among males and females. However, while the larval stage is relatively short (3 7 days), many of the larvae produced on one reef could later settle on other nearby reefs. Therefore, the relatively high densities at around one-quarter of sites should be expected to provide larval export for replenishment of many neighbouring reefs. Further information about the biology, ecology and management of trochus can be found in Purcell (2004a). Analyses with environmental parameters As mentioned in section 3.2, we recorded observations on a variety of environmental and biophysical parameters along each transect in addition to the counts of sea cucumbers, giant clams and trochus (see Appendix A). One could easily spend a year on analyses and interpretations of the multitude of possible relationships between these data, but that is largely beyond the scope and resources of this study. Here, we simply pick some key parameters of interest and present a few relatively simple analyses of relationships with the abundances and species richness of the three resource groups at the among-site scale. Since the specificity to the crest habitat was strong in Actinopyga mauritiana and Trochus niloticus, we examine relationships of their density on the crest with environmental/biophysical variables at the scale of transects. A backward multiple linear regression analysis was used to examine relationships between the total abundance of all sea cucumber species and the average complexity, average topographic relief, pooled live coral cover, pooled sediment cover, and pooled fleshy algae cover of reef sites. The final model showed that holothurians were more abundant on reefs with lower topographic relief (β = -0.52, p = 0.009) and higher small-scale surface complexity (β = 0.65, p = 0.001). Overall holothurian abundance was largely unrelated to live coral cover (p = 0.25), sediment cover (p = 0.88) and fleshy algae cover (p = 0.79). 51
57 Even when excluding Stichopus chloronotus, there was no significant relationship between the pooled abundance of high- and medium-value sea cucumbers at sites open to fishing and the distance from the nearest boat ramp (linear regression: p = 0.34). This was true even for an analysis just using the lagoonal sites (p = 0.39), and true when just analysing data from Province Nord (p = 0.78) or Province Sud (p = 0.41). Thus, even the reefs a long way from boat ramps (e.g km) are not havens for large populations of holothurians. Lesson 3: Distance from shore, or boat ramps, does not appear to strongly govern the [commercial] fishing pressure of sea cucumbers on reefs in fisheries where fishers have access to motorised boats that can travel tens of kilometres to distant reefs. A backward multiple linear regression analysis was used to examine relationships between the total abundance of giant clams and the average complexity, average topographic relief, pooled live coral cover, pooled sediment cover, and pooled fleshy algae cover of reef sites. The final model showed that giant clam abundance was related to reef complexity (β = 0.31, p = 0.03) and sediment cover (β = -0.26, p = 0.07), but was not significantly related to topographic relief (p = 55) or the percentage cover of live coral (p = 0.56) or fleshy algae (p = 0.78). Lesson 4: Reefs with a lot of holes and fine structures and overall less sediment tend to have more giant clams than reefs with low surface complexity and lots of areas with sand. In Province Sud the abundance of giant clams at sites open to fishing was positively related to the distance from nearest boat ramps, which explained a little over one-quarter of the variation in estimated abundance (linear regression: β = 0.53, p = 0.03, r 2 = 0.28). However, in Province Nord, abundance of giant clams was unrelated to the distance of sites from the nearest boat ramp (linear regression: p = 0.28, r 2 = 0.05). This is an indication that exploitation pressure, by professional and recreational fishers, has diminished stocks of giant clams closer to boat ramps in Province Sud and it is mostly the distant reefs that have some reprieve from depletion of stock abundance. For various reasons, this relationship does not hold in Province Nord. There was no significant linear relationship between the total abundance of holothurians and the total abundance of giant clams at sites (Pearson s correlation analysis: p = 0.99). Likewise, the best twoparameter non-linear regression model was non-significant (p = 0.19, r 2 = 0.03; Datafit 8.0). Thus, reefs with more sea cucumbers did not have significantly more or fewer giant clams; their abundances were unrelated. Lesson 5: Reefs with lots of sea cucumbers will not necessarily have lots of giant clams. Thus, abundance of one group is not a useful indicator of abundance of the other and the stocks of both groups must be assessed, for example, when needing to choose sites with high abundances of both for placing no-take reserves. We conducted backward multiple linear regression analyses to examine relationships between the densities of Actinopyga mauritiana or Trochus niloticus on the crest transects of barrier reefs and the environmental variables on the transects. The analysis found that the densities of A. mauritiana were related to five environmental variables together (p <0.001), but the overall model explained just 23% of the variation in animal density. The variables were relief (β = 0.19, p = 0.047), complexity (β = 0.29, p = 0.004), and the percentage cover of rubble (β = -0.39, p <0.001), boulders (β = 0.16, p = 0.084) and crustose coralline algae (β = 0.23, p = 0.009). In other words, more A. mauritiana were found on the crest of barrier reefs that had higher topographic relief and fine-scale surface complexity, high occurrence of boulders and low amounts of both coral rubble and crustose coralline algae. The occurrence of A. mauritiana was not related to occurrence of T. niloticus (Pearson s correlation analysis: p = 0.70). The multiple regression analysis for Trochus niloticus showed that four variables could be used together to explain 28% of the variation in density on barrier reef crests. More trochus were found where there was higher small-scale surface complexity (β = 0.22, p = 0.009), and higher 52
58 percentage cover of boulders (β = 0.19, p = 0.025), dead coral (β = 0.37, p <0.001) and crustose coralline algae (β = 0.25, p = 0.003). A backward multiple linear regression analyses showed that the species richness of the holothurian communities was marginally related to the surface complexity and topographic relief of the reef sites (p = 0.079). Several biophysical variables were dropped out of the final model in that analysis: overall (pooled) percentage cover of sediment, live coral and fleshy algae. The final model indicated that holothurian communities were more speciose at sites with lower topographic relief (β = -0.34, p = 0.092) and higher fine-scale surface complexity (β = 0.46, p = 0.025). Lesson 6: Reefs that were mostly flat but with lots of cervices and small outcrops of rocks and boulders tend to promote a higher number of sea cucumber species than reefs with high topographic relief and less small-scale complexity. Limitations of the data and survey methods Consideration of extrapolating abundance One consideration is that the barrier reef sites were situated at the ends of the reefs. This was intentional, in order to have reef pass habitats within the site perimeter and to have easy access by boat to exposed and sheltered habitats. However, it means that population densities may be biased by favourable or unfavourable conditions that are particular to the ends of barrier reefs, namely tidal currents and freshwater. We therefore suggest that any extrapolations of stocks to whole reef units be made using density estimates in each habitat, so that densities from the reef passes (which contributed to the pooled abundances at our study sites) are not used in extrapolations for the middle sections of reefs. As discussed in the Preamble, the project aimed to survey a large number of sites and cover the key habitats within each site. But this broad geographical spread of the sampling effort was, naturally, at the expense of precision of the estimated abundances at sites. Again, the aim was to give ball-park indications of stock size on reef sites, e.g., were they very abundant, common, sparse or rare at sites. The average precision (SE/mean) of abundance estimates for commercially valuable sea cucumbers was 0.29; i.e. the error represented 29% the size of the mean. This includes sites where no animals were found; i.e. where the estimate and errors are zero. Similarly, the average precision for individual giant clam species was 0.37; i.e. the standard error was one-third the size of the abundance estimates. The precision of abundance estimates of trochus at sites was These relatively large errors are, to a large extent, due to the patchy nature of how the animals are distributed in space and the fact that they are common in some habitats but not others. They do not give great confidence in closely estimating stock size at sites, in most cases, but this was anticipated from the onset. Sightability of sea cucumbers Most of the commercially valuable species are, for the most part, visible and do not hide or shelter from view during parts of the day, and are thus easily identified by trained divers. These species include Actinopyga echinites, Actinopyga palauensis, Holothuria atra, Holothuria edulis, Holothuria fuscogilva, Holothuria fuscopunctata, Stichopus chloronotus, Stichopus herrmanni, Thelenota ananas, and Thelenota anax. However, it was understood before the project that populations of some species would be more difficult to quantify due to cryptic or nocturnal behaviour of the animals. For example, Actinopyga mauritiana is known to be more active in the early evening and at low tide, and most of the population shelters some of their body in crevices or under ledges during the morning (Graham and Battaglene 2004). The Snakefish Holothuria coluber is semi-cryptic, hiding the posterior part of its body under coral boulders and can therefore be more difficult to sight in visual surveys. The Stonefish Actinopyga lecanora is also believed to be mostly nocturnal (pers. comm. E. Tardy, SPC, Nouméa). The Black Teatfish Holothuria whitmaei is known to be less active in the morning hours, when a small proportion of the population shelters beside coral boulders (Shiell and Knott 2008). Some species also bury in sediments during some parts of the day at some locations. The Tigerfish Bohadschia argus is known to bury in sediment in the warmest hours of the day at Papua New Guinea 53
59 (Massin and Doumen 1986), but this behaviour appeared to be rarely expressed in New Caledonia. Similarly, the Brown Sandfish Bohadschia marmorata, similar to B. vitiensis in the present study, has been shown to bury in the morning period of the day (Clouse 1997). These observations are similar to those of Mercier et al. (1999) and Wolkenhauer (2008) for the Sandfish Holothuria scabra, but only a part of the population buries while the other individuals remain visible on the surface. Although we observed this for small juvenile Holothuria scabra, our previous research showed that adults did not bury diurnally in the inshore seagrass habitat at Ouano, New Caledonia (S. Purcell, unpubl. data). On the other hand, we have noticed that H. scabra and H. lessoni will bury in the morning and surface in the afternoon at lagoon reef sites with coarser sand, so it is evident that this behaviour is not consistent among sites. Sheltering or burying behaviour may hinder the sightability of some of the population of some species at certain times of the day. This means that visual surveys may underestimate the number of animals present at sites. However, this does not mean that estimates are biased downwards for all species, nor necessarily unrealistic. For example, only 16% of Black Teatfish (Holothuria whitmaei), on average, were hidden in the morning in the study by Shiell and Knott (2008), and many of these were simply beside boulders or reef structures. Such animals would be missed if directly under a diver but visible from the side of the reef structures, as would mostly occur on manta-tows by trained divers in the present project. Likewise, more than half of A. mauritiana individuals were sheltered during morning hours (08:00 12:00) in the study of Graham and Battaglene (2004), but this included animals with part of their body exposed. Thus in many cases, parts of the body of sheltered A. mauritiana could still be easily seen, and others could be sighted if divers take time to search in crevices, which was practiced in the present study. Therefore, we recognise that the visual censuses, using manta-tow in particular, may miss some individuals of the populations and will underestimate abundances. For a few species, such as A. lecanora which is reportedly nocturnal, we may grossly underestimate population abundance. But in most cases, the bias of underestimation appears to represent a relatively small proportion of the animals present at sites. 4.2 Landing surveys Recent evolution of exports Exports of dried bêche-de-mer from New Caledonia have been high this decade, ranging from 35 to 94 tonnes annually (Figure 27), although catches were even higher in some years of the 1980 s (Kinch et al. 2008a). New Caledonia is a significant producer of bêche-de-mer in the Pacific. The annual export volume has generally been higher than Polynesian countries and Vanuatu, but lower than the volume exported from Australia, Papua New Guinea, Solomon Islands or Fiji (Kinch et al. 2008a). Last year (2007), export volume increased 65% from Remarkably, sea cucumbers were the most economically important capture fishery in New Caledonia last year. The exports of bêche-de-mer in 2007 were valued at 414,000,000 XPF, while exports of tuna were valued at 202,000,000 XPF (Institute de la Statistique et des Etudes Economique). In 2007, sea cucumbers (as dried bêche-demer) were the second-most economically important animal export from New Caledonia, after farmed shrimp. The exported volume of 94 tonnes in 2007 corresponds to about 1,000 to 1,500 tonnes of live animals. At a rough average weight of 1 kg per animal, this indicates that about 1 to 1.5 million sea cucumbers were harvested from reefs and inshore habitats of New Caledonia in The composition of species exported from New Caledonia has changed markedly in recent years (Figure 27). Notably, the exports before 2003 were dominated by the Sandfish (Holothuria scabra) and Golden Sandfish (Holothuria lessoni), recorded as other genera. These are species of inshore seagrass beds and lagoonal reefs, collected by wading on reef flats or diving in shallow water. From 2003 onwards, the exports have comprised heavily of Black and White Teatfish (Holothuria whitmaei and H. fuscogilva; sub-genus: Microthele). A number of species of Actinopyga have also been exported more in recent years, such as A. miliaris, A. mauritiana, A. spinea and A. palauensis. Concomitantly, the two sandfish species have made up a smaller proportion of the exports in the past 5 years (Figure 27). 54
60 Quantity (T) Other genera Actinopyga Thelenota Microthele Figure 27. Export quantity (metric tonnes) of sea cucumbers of different genera/sub-genera from New Caledonia from years Source: Direction Régionale des Douanes de Nouvelle Calédonie. Species presently caught by fishers in New Caledonia We observed 17 species in the landings of fishers in Province Nord and Province Sud (Table 18). In concert with recent export data, we measured more Black Teatfish Holothuria whitmaei than any other species in fisher landings. This is not so much a reflection of total animals caught by fishers, because we measured only a representative subset of individuals in landings. It does, however, show that Black Teatfish were very common in landings, accounting for more than one-quarter of our measurements. The Hairy Blackfish Actinopyga miliaris was the next most common species measured in landings, followed by the Sandfish Holothuria scabra (Table 18). The latter finding confirms that although we did not record many Sandfish in field surveys (which were not in the inshore seagrass beds), Sandfish are still one of the most common species collected by fishers. We note that the White Teatfish Holothuria fuscogilva and the Golden Sandfish Holothuria lessoni each made up less than 4% of the individuals we measured. Although these two species are particularly sought after by processors (discussed later), they were relatively uncommon in catches. This, again, suggests that these two species are not abundant and particular consideration should be given to restricting exploitation of these stocks. There were a number of species that each made up less than 1% of the total number of animals we measured in landings (Table 18) but, as discussed, this does not mean they are overfished or rare. Each of the species is collected occasionally by a very small number of fishers, either because only a couple fishers know how to handle and process them or because they were mistakenly taken by inexperienced fishers. 55
61 Table 18. Number and proportion of specimens of each species in the landing surveys. Species Total number measured % of total individuals measured Holothuria whitmaei Actinopyga miliaris Holothuria scabra Actinopyga spinea Actinopyga palauensis Thelenota ananas Actinopyga mauritiana Stichopus herrmanni Actinopyga echinites Holothuria fuscogilva Holothuria lessoni Actinopyga lecanora Bohadschia argus Thelenota anax Holothuria coluber Bohadschia vitiensis Holothuria isuga Total 2, Forms of sea cucumbers in landings A little more than half of the sea cucumbers measured in landings were dried (56%), while one-third (31%) were salted and just 13% were fresh either gutted or whole (live). In the far north of la Grande Terre, a larger proportion of the animals we measured were already dried; 100% in Kaala- Gomen to Poum region and 69% in the Touho to Boat Pass region. This is mainly attributed to the fact that the fishers are much further from processors and cannot easily sell fresh animals, nor store salted animals in large quantities. For this reason, they do their own boiling and drying most of the time. Lesson 7: Fishers in villages remote from processing centres tend to need to fully process their catch of sea cucumbers into dried bêche-de-mer. Thus, training on processing is particularly needed in remote areas. There are a few fishing companies that have much larger boats to access remote reefs and island groups, such as the Surprise Islands and Chesterfield Reefs. Fishers on these boats systematically salt the animals, which are later boiled and dried after returning to la Grande Terre. Sizes of sea cucumbers from fisher landings The data of animal weights collected on landing surveys provided for rigorous comparisons of sizes of fished animals among regions. In this section, we simply explain trends of average sizes for each commercial species among regions, and in the following section make comparisons with field observations on size frequency distributions. As mentioned, weights of specimens from landings were converted to whole body weights as a common unit of measure. Only one Surf Redfish Actinopyga mauritiana was measured from a landing from Touho, and its estimated body weight was 1,520 g. We used conversion equations of A. miliaris (Skewes et al. 2004) 56
62 for converting weights of processed A. mauritiana. Sizes were relatively consistent among individuals within regions (Figure 28). Notably, specimens fished near Nouméa were quite small, averaging just 753 g whole body weight. Elsewhere, the A. mauritiana collected by fishers averaged 982 g. Conand (1989) found that many A. mauritiana do not become mature until they reach fairly large sizes, and her estimates of size at maturity indicate that the W 90 is around 900 g. (W 90 is the estimated whole body weight at which 90% of the sampled population is sexually mature.) This indicates that a large number of the A. mauritiana collected from near Nouméa are immature or recently mature. Coincident with our field surveys, the distribution of Actinopyga echinites appears restricted since it was only collected by fishers in the south (Figure 28). Specimens collected in the far south were larger, averaging 793 g whole body weight. Animals harvested from Nouméa to Poya were variable in size, and averaged 647 g. Conand s (1982 and 1989) studies indicate that this species matures at a relatively small size, with the W 90 at about 230 g. Hence, almost all the A. echinites harvested were above the size at first maturity. The three blackfish species were fished in each of the six study regions of la Grande Terre (Figure 29). Hairy Blackfish Actinopyga miliaris were harvested at a similar size among regions, with average body weight of samples being smallest around Nouméa (825 g) and largest from Boulouparis to Poya (1,042 g). Harvested Burying Blackfish A. spinea varied greatly in size among regions, with quite small animals being harvested from Népoui to Ouaco (average: 392 g) and rather large around Nouméa (average: 1,395 g). Deepwater Blackfish (or Panning s Blackfish ) A. palauensis were caught at a range of sizes within and among the six regions (Figure 29). Harvested specimens were largest from Province Nord (average: 1,680 g) and smallest from Province Sud (average: 1,280 g). The size at first maturity of the three blackfish species is unknown, so one cannot ascertain whether average sizes being fished are above the size at first maturity for each region. However, the A. spinea and A. palauensis harvested from Népoui to Ouaco were quite small and we postulate that many may be under the size at first maturity. As found with our field surveys, White Teatfish Holothuria fuscogilva from the north were larger in landings than those from the south (Figure 30). We used our estimated conversion factors for H. whitmaei (given later) to convert weights of processed H. fuscogilva. The average sizes of fished H. fuscogilva from Nouméa were only 2,340 g, compared to an average weight of 3,480 g from the north-east (Touho to Boat Pass). Conand s (1989) analyses indicate that H. fuscogilva matures at relatively large sizes, with the W 90 estimated at approximately 3,000 g whole weight (or 1,500 g gutted weight). Thus many of the specimens harvested by fishers from the Nouméa region are immature or recently mature. In harmony with findings from field surveys, Black Teatfish Holothuria whitmaei were smaller than White Teatfish within each region. We also found a large variation in sizes of collected H. whitmaei within regions (Figure 30). Average estimated whole body weights of fished H. whitmaei were greater in the far north (2,670 g and 2,630 g) than elsewhere around la Grande Terre (1,950 2,280 g). Given that Conand (1989) found a W 90 size at first maturity of 1,135 g (600 g gutted weight), most of the harvested H. whitmaei were mature. The average sizes of Thelenota ananas varied greatly within regions (Figure 31). Following a trend with H. fuscogilva, A. mauritiana and A. miliaris, the T. ananas harvested from near Nouméa were smallest of the regions (averaging 3,056 g), and harvested size was largest in the north-east (averaging 4,530 g). Given that the W 90 for size at first maturity of T. ananas was determined to be about 2,200 g (Conand 1989), most of the harvested T. ananas were probably mature. However, 45% of T. ananas in landings from Nouméa were smaller than this estimated W 90 size. The harvested Curryfish Stichopus herrmanni were largest from the far south, averaging 3,090 g, while the average body weights elsewhere ranged from 2,200 to 2,440 g (Figure 31). From Conand s (1989) analyses, the W 90 for S. herrmanni appears to be roughly 1,250 g. All S. herrmanni we measured were above this estimated size a first maturity. We did not find any Greenfish Stichopus chloronotus in any of the 54 landings. The Sandfish Holothuria scabra is collected all along the west coast of la Grande Terre (Figure 32), and is significantly smaller than harvested Golden Sandfish Holothuria lessoni. The estimated average whole body weights of H. scabra ranged from 732 to 1,258 g, but we doubt the validity of some of the converted values from dried samples (because of varying degrees of dryness). Harvested H. lessoni ranged from 1,537 to 2,054 g. 57


63 Figure 28. Photo plots of mean sizes (whole body weights) of Actinopyga echinites and A. mauritiana from the landing surveys in the six study regions. Lengths of images correspond linearly to mean body weights from samples pooled within regions. Sub-posed bars are the standard deviations; adjacent numbers are sample sizes. Figure 29. Photo plots of mean sizes (whole body weights) of Actinopyga spinea, A. miliaris and A. palauensis from the landing surveys in the six study regions. Lengths of images correspond linearly to mean body weights from samples pooled within regions. Sub-posed bars are the standard deviations; adjacent numbers are sample sizes. Note change in scale for the different species. 58

64 Figure 30. Photo plots of mean sizes (whole body weights) of Holothuria fuscogilva and Holothuria whitmaei from the landing surveys in the six study regions. Lengths of images correspond linearly to mean body weights from samples pooled within regions. Sub-posed bars are the standard deviations; adjacent numbers are sample sizes. Figure 31. Photo plots of mean sizes (whole body weights) of Stichopus herrmanni and Thelenota ananas from the landing surveys in the six study regions. Lengths of images correspond linearly to mean body weights from samples pooled within regions. Sub-posed bars are the standard deviations; adjacent numbers are sample sizes. Note change in scale for the different species. 59
65 Figure 32. Photo plots of mean sizes (whole body weights) of Holothuria scabra and H. lessoni from the landing surveys in the six study regions. Lengths of images correspond linearly to mean body weights from samples pooled within regions. Sub-posed bars are the standard deviations; adjacent numbers are sample sizes. Note change in scale for the different species. Lesson 8: Field surveys by divers are still needed in conjunction with landing surveys to understand stock abundances. For instance, White Teatfish may still be seen in landings but the preference for this species by fishers and processors biases their prevalence in landings compared to actual abundances. In other words, fishers do not necessarily take sea cucumbers in proportions that they exist on reefs. Thus, field surveys can show depleted abundances where landings may not be able to. Sizes of sea cucumbers from landings of regions beyond la Grande Terre Some of the landings we measured were from sites or regions outside the six study regions of la Grande Terre. Nonetheless, we present results here to show the range of species and sizes of individuals in these landings (Table 19). These results may serve as a useful reference against results from la Grande Terre. In particular, fishing for sea cucumbers has only started within the past 12 months at Maré, where stocks have been exploited little in the past couple decades, to our knowledge. Table 19 shows that the estimated mean body weights of four species were larger from Surprise Islands than from Chesterfield Reefs. Average sizes of landed A. mauritiana from both Surprise Islands and Chesterfield Reefs were much larger than the average size (753 g) from the Nouméa region. Likewise, the average sizes of all three blackfish species (A. miliaris, A. palauensis and A. spinea) from the Surprise Islands were much larger than those landed in Province Nord and Province Sud (c.f. Figure 28). White Teatfish Holothuria fuscogilva landed from the Surprise Islands (Table 19) were similar in size to those landed in Province Nord (c.f. Figure 29). However, those from the Chesterfield Reefs were small in comparison to those from either Province Nord or Province Sud (c.f. Figure 29), and much smaller than the W 90 weight of about 3,000 g at which Conand (1989) found most animals are mature. Thus, H. fuscogilva collected from the Chesterfield Reefs appear to be under the size at maturity. Similarly, 60
66 Black Teatfish H. whitmaei were large in most other regions but small from the Chesterfield Reefs and the average size there was only just above the W 90 size determined by Conand (1989). In comparison to the study regions around la Grande Terre, the Thelenota ananas captured in the Surprise Islands and Chesterfield reefs were relatively small. The average body weights of T. ananas in those areas were only just above the size at first maturity. Table 19. Mean estimated body weights of species measured in landings from Bélep, Maré, Surprise Islands and Chesterfield Reefs. Superscripted values are standard deviation of the mean body weight in grams. Sample sizes are given in bold under each estimate of mean body weight. Species Bélep Maré Actinopyga mauritiana Surprise Islands Chesterfield Reefs body wt. (g) n 7 60 Actinopyga miliaris body wt. (g) 1871 n 1 Actinopyga palauensis body wt. (g) n Actinopyga spinea body wt. (g) n Holothuria fuscogilva body wt. (g) n Holothuria whitmaei body wt. (g) n Thelenota ananas body wt. (g) n Size frequency distributions: landings vs population surveys Visualising the size class distributions of the commercial species provides useful insights into fishing practices and the natural replenishment of populations through inspection of cohorts. For the landing samples, these show whether some small animals are being fished and whether the fishers are selective about the sizes of sea cucumbers they catch. Broad size distributions in field samples, e.g., samples spanned 4 or more size classes, would suggest that there are different aged animals on the reef sites, thus suggesting that recruitment is relatively regular among years. On the other hand, narrow size distributions would suggest that animals are of a similar age and arise from infrequent recruitment pulses. 61

67 We make some comparisons here between the captures by fishers (landings) and our own samples from transect surveys. But we caution that the conversions of processed weights to whole weights of many landed animals were biased, depending on the state of the animals. For instance, if some animals we measured from landings were dried but not very dry, then the converted weight will be overestimated. As a clear example, the equation we used for converting processed weights of Sandfish Holothuria scabra (Skewes et al. 2004) are based on estimations that dried animals are about 6.5% the weight of whole fresh animals. But some dried specimens we measured produced estimates above 2 kg whole body weight, which is unrealistic. If some animals we measured were not fully dried or if they had not been well gutted (and contained sand), then the converted weights will be biased because of the state of the animals, not the validity of the conversion ratios or equations. Likewise, salted animals could vary in weight simply depending on the length of time in salt. Our comparisons in this regard are, therefore, tentative. Lesson 9: Converted weights of sea cucumbers can be biased depending on the state of processing. Whole body weights converted from dried animals will be less biased if the animals are fully dried. Actinopyga echinites was found and fished at a variety of size classes, from 200 to more than 800 g (Figure 33). It probably recruits relatively regularly to southern reefs, but its absence from study sites in Province Nord may suggest that larvae do not disperse very far. It was caught at larger sizes than we measured from field surveys, suggesting that fishers leave smaller individuals. Indeed, one fisher from Nouméa did tell us that he only took medium and large sized animals. Figure 33. Size class distributions of whole body weights (g) of Actinopyga echinites in the six study regions from samples taken within transects of the population surveys and samples from landing surveys (mostly converted values). 62
 of Actinopyga mauritiana in the six study regions from samples taken within transects of the population surveys and samples from landing surveys")
68 Figure 34. Size class distributions of whole body weights (g) of Actinopyga mauritiana in the six study regions from samples taken within transects of the population surveys and samples from landing surveys (mostly converted values). Figure 35. Size class distributions of whole body weights (g) of Actinopyga miliaris in the six study regions from samples taken within transects of the population surveys and samples from landing surveys (mostly converted values). 63
69 Figure 36. Size class distributions of whole body weights (g) of Actinopyga palauensis in the six study regions from samples taken within transects of the population surveys and samples from landing surveys (mostly converted values). Figure 37. Size class distributions of whole body weights (g) of Actinopyga spinea in the six study regions from samples taken within transects of the population surveys and samples from landing surveys (mostly converted values). 64
70 Figure 38. Size class distributions of whole body weights (g) of Holothuria fuscogilva in the six study regions from samples taken within transects of the population surveys and samples from landing surveys (mostly converted values). Figure 39. Size class distributions of whole body weights (g) of Holothuria whitmaei in the six study regions from samples taken within transects of the population surveys and samples from landing surveys (mostly converted values). 65
71 Figure 40. Size class distributions of whole body weights (g) of Stichopus chloronotus in the six study regions from samples taken within transects of the population surveys and samples from landing surveys (mostly converted values). Figure 41. Size class distributions of whole body weights (g) of Stichopus herrmanni in the six study regions from samples taken within transects of the population surveys and samples from landing surveys (mostly converted values). 66
72 Figure 42. Size class distributions of whole body weights (g) of Thelenota ananas in the six study regions from samples taken within transects of the population surveys and samples from landing surveys (mostly converted values). Actinopyga mauritiana collected from field surveys displayed somewhat contracted size frequency distributions in most regions (Figure 34). This may indicate infrequent pulse recruitment. There was also some skewing of the size classes towards the lower end of the size range in samples from Nouméa to Poya. Sizes were broadly similar between our field measurements and the sizes of animals collected by fishers. Actinopyga miliaris showed moderately wide size frequency distributions in most regions (Figure 35). Distributions from the landings indicate that fishers are not collecting small individuals, and the sizes fished were generally at the larger end of the range of those we measured in the field. Actinopyga palauensis were of varied sizes in the samples from field surveys (Figure 36), suggesting relatively regular recruitment. This could also, of course, suggest varied growth rates within sites or within regions. In the north-west, some rather small animals were caught by fishers and more education about size limits is probably best directed there. But, overall, fishers generally collected medium and large sized animals and there is an indication of some selection against small individuals when comparing with animals we collected from the field. Actinopyga spinea was one species that showed marked contraction of size classes (Figure 37), suggesting that recruitment is irregular in this species at most sites. In some cases, fishers were taking small and large individuals, and there does not appear to be much size selectivity. Lesson 10: Based on size-frequency analysis, some species appear to recruit infrequently. Management measures that assume, or rely on, regular recruitment, like rotational fishing closures, will be inappropriate in these cases. Also, this means that recovery of populations from intense fishing may take many years even with source breeding populations in the fishery. Holothuria fuscogilva was collected by fishers at large sizes in Province Nord (Figure 38), and medium and large sizes in Province Sud. We found few small individuals in transect surveys, and they were equally absent in landings. This could suggest that recruitment has been generally very low in recent 67
73 years, but it is also very likely that we simply do not find small H. fuscogilva because they are cryptic until larger sizes (and believed to recruit to shallow zones and migrate to deeper areas as they mature; Reichenbach 1999). The comparisons between size distributions from field surveys and landings indicate some selectivity by fishers towards larger individuals, but we question whether they would actually leave small individuals since H. fuscogilva is highly priced (c.f. landings from Chesterfield Reefs, Table 19). Holothuria whitmaei was harvested by fishers in roughly similar sizes to those we measured in field surveys, but there did appear to be some selectivity by fishers in the far north for larger animals in the populations (Figure 39). In general, fishers harvested a broad range of sizes of H. whitmaei and appear to be taking whatever animals they find of this species. The relatively broad size range of animals we collected in field surveys in most regions suggests some regularity to annual recruitment of this species at sites. Stichopus chloronotus was not present in landings we surveyed, but was a common species found in our field surveys (Figure 40). It was generally present as small animals in relation to the range of sizes it can attain. It is one species that reproduces asexually, giving rise to two individuals of smaller size (Uthicke 1997, 2001a, Conand et al. 2002). Individuals above 400 g body weight were scarce in our surveys. Stichopus herrmanni was harvested at a range of sizes, which broadly corresponded with the size distributions of animals we measured from field surveys (Figure 41). We found a broad range of sizes, suggesting that there were multiple cohorts on reef sites arising from repeated recruitment events; i.e. recruitment does not appear to be infrequent. In some regions, we found some smaller individuals that were not present in landings, suggesting that in at least some regions, fishers are leaving small individuals to grow to larger sizes. The size distribution of S. herrmanni in the Nouméa region is more skewed towards small individuals compared to data from Conand (1993a). This suggests recent recruitment or that fishing impacts near Nouméa have reduced the prevalence of large S. herrmanni near Nouméa in recent years. Thelenota ananas was also generally found at a range of sizes (Figure 42). Fishers generally collected medium and large animals out of the range of available size classes, and comparison with our field data suggests that fishers in some, but not all, regions were leaving the small animals. Our data on size distributions (Figure 41) shows that there are few large animals on the reefs, which may be indicative of regular harvesting of the large size classes. Lesson 11: Analysis of size-frequency distributions can give valuable insights into size selectivity by fishers and recruitment dynamics of populations. Size selectivity by fishers can be best seen by comparing landed sizes to measurements of animals taken by divers during field surveys. Therefore, both sets of data are recommended. Catch Per Unit Effort (CPUE) from landings We estimated Catch Per Unit Effort (CPUE) in landings and from asking fishers what they caught on average now and in the past. Here, we present results from the landings, and we present a comparison with the responses from sociological surveys later. We were careful in the landing surveys and in questionnaires to fishers to ask how many fishers were actually in the water fishing and whether the times they stated included travel time or time in the water. Results here are per person, per hour of fishing i.e. excluding travel time. Although sample size in terms of number of our inspections is relatively low (Table 20), the landings were catches from one to five fishers accumulated over 1 to 20 days. That is, fishers often grouped their catch and processed, or semi-processed, the animals accumulated over many days of fishing. Thus, four landing surveys we conducted of fishers in one region may represent 30 person-days of fishing. On average, the landings were from 2 fishers collecting for 3.8 days. The 54 landing surveys represent 453 fisher-days of collecting sea cucumbers. Only 39% of landing surveys were from one fisher alone. Thus, although sample size of landing surveys is relatively low, the CPUE data from most landings are already averages over good and bad days and across different fishers. 68
74 Table 20. Estimates of average Catch Per Unit Effort (CPUE) per hour of fishing. These are catches of all sea cucumbers from the landing surveys from catches from the six study regions and other regions beyond la Grande Terre. The standard deviations of the estimated CPUE estimates are superscripted. The number of landing surveys used for the estimates (n) and the average fishing duration per day are also given. Region CPUE (kg fisher -1 h -1 ) ±S.D. n Fishing duration (h day -1 ) Bélep 8.4 ± Boat-Pass-Touho 16.2 ± Grand Sud Nouméa 34.9 ± Chesterfield Reefs 28.5 ± Surprise Islands 28.6 ± Maré 9.3 ± Nouméa 39.9 ± Ouaco-Népoui 12.2 ± Poum-Kaala Gomen 9.2 ± Poya-Boulouparis 12.0 ± Table 20 shows that there was a large variation in the average CPUE among regions, ranging from 8 to 40 kg of sea cucumbers per fisher per hour of fishing. Fishers generally had lower CPUE in Province Nord than in Province Sud or outside la Grande Terre. This was surprising considering that field surveys showed better stocks in Province Nord. Our understanding is that one explanation for the higher CPUE rates of fishers in Province Sud is attributed to the fact that many are quite experienced in this fishery or are more organised with larger boats. All of the large boats (>7 m) in this fishery are based in Province Sud. The large standard deviations for landings from the Nouméa region shows that some fishers caught little in the outings from which we sampled while others were very efficient at landing a lot of sea cucumbers in a short time. It is understandable why fishers invest in large boats to travel to sites in the far south of la Grande Terre (Grand Sud Nouméa) and to Surprise Islands and Chesterfield Reefs; the CPUE of fishers averaged 28 to 35 kg h -1 in those areas. Estimated current fishing impact At the Provinces request, we tried to estimate the current fishing impact in each region by comparing the estimated annual quantity of animals harvested with the densities of the sea cucumber stocks estimated from the field surveys. We also included a consideration of animal size in this assessment. Table 21. Average current fishing impact (tonnes of sea cucumbers harvested) per year and key data on fishing capacity in the six study regions. Province Area Number of boats Average fisher/boat Total catch per year (tonnes*) N Boat Pass-Touho N Poum-Kaala Gomen N Ouaco-Népoui S Poya-Boulouparis S Nouméa S Grand Sud Nouméa *Weights in tonnes are of fresh (whole) sea cucumbers. The annual total catch per region is calculated as: number of registered boats x reported number fishers/boat x average CPUE (from landing surveys; in fresh kg fisher -1 day -1 ) x average number of fishing days per week x average number of fishing weeks per year. 69
75 A striking difference between provinces is the number of boats registered for fishing sea cucumbers (Table 21); 5 6 times higher in Province Nord (57 boats) than in Province Sud (10 boats). The average number of fishers per boat was 2.5 in Province Nord against 1.1 in Province Sud. This does not, however, include larger boats from Nouméa with larger crews fishing in regions outside the six study regions of la Grande Terre. The estimated harvests of sea cucumbers are roughly twice as great in Province Nord as in Province Sud (Table 21). The estimated annual harvest from all six study regions combined is 597 tonnes. We believed, from landings and discussion with fishers, that the six study regions provide roughly half of the sea cucumbers harvested from the whole of New Caledonia. That is, we expected that about the same quantity of sea cucumbers would be harvested in total from the regions of the Chesterfield Reefs, Surprise Islands, Bélep, Maré, Isle of Pines and other localities on the east coast of La Grande Terre. Indeed, the estimated annual harvests from our six study regions is very close to half the total reported quantity of exported sea cucumbers from New Caledonia; total national exports converted to wet weight would be 1,000 to 1,500 tonnes annually. This correspondence, between the estimation of harvests from the study regions and the approximate expected proportion of total national exports, suggests that the landing surveys produced realistic estimates of annual harvests. We compared the estimated annual harvests (Table 21) with two stock indicators: (i) the average sitewide density (or abundance, as previously defined) of commercially valuable sea cucumbers (number per square kilometer of reef combining all habitats), excluding Stichopus chloronotus on reefs open to fishing in each of the six study regions; and (ii) the pooled average body size of commercially valuable sea cucumbers (pooling samples from field surveys within each region for medium- and highvalue species, except Stichopus chloronotus which is seldom exploited). We used mean sizes of sea cucumbers from field surveys instead of those from landing surveys to avoid bias in the data from sizeselectivity of fishers. The pooled average size of exploited sea cucumbers ranged from 1,459 to 1,824 g, while the pooled averages of total site-wide density ranged from 1,202 to 10,529 ind.km -2 among regions (Figure 43). There appeared to be a positive relationship between the current annual harvest and population density at whole sites (Figure 43a); the total annual catch tended to be greater where sea cucumbers were more abundant. There also appeared to be a positive relationship, albeit more variable, between the total annual harvest in regions and the average body size of sea cucumbers (Figure 43b). The populations in the Poya-Boulouparis region are clearly in dire straits; average population density was very low and animals were relatively small (Figure 43c). It is not a surprise that the estimated annual exploitation in this region was trivial. In the absence of additional information, such as a time series of catch records from the region, it is not possible to know whether the low population density and small average body size is caused by fishing. A second group, comprising the Poum-Kaala Gomen, Nouméa, and Ouaco-Népoui regions, had a moderate annual harvest and relatively low average population density. The Nouméa region is slightly separated in this group by large average body sizes of animals, some intractable biases notwithstanding (discussed below). The Boat Pass-Touho region differed from other groups by a large annual harvest, owing to a combination of moderate CPUE and moderate to high fishing effort (total days fished per year). One interpretation is that the current high exploitation in the Boat Pass-Touho region exceeds the sustainable level of harvest. Fishers in this region are very dependent on sea cucumbers and appear to have fewer alternative sources of income than fishers in other regions (discussed later), and therefore continue to pressure this resource. In the Grand Sud Nouméa region, average abundances of commercially valuable sea cucumbers were high but the sea cucumbers were small. The moderately low exploitation in this region suggests that these stocks, as a whole, are most robust and arguably in the least danger of being overfished out of the six study regions. Mean individual weight may not be such a useful indicator of stock status: mean body size was low in both Poya-Boulouparis and Grand Sud Nouméa, yet these contained the lowest and highest population densities, respectively, of the six regions (Figure 43c). The mean population density in the Nouméa region is not much higher than in Poya-Boulouparis, yet the mean body weight in Nouméa is the highest of all the regions (Figure 43c). It is difficult to infer the proximate causes of small mean body size in populations. It can be for reasons both negative (high fishing pressure reduces the probability of living to an old age and large size) and 70
76 positive (high rates of recruitment or a build-up in population density can lead to the majority of the population being young or stunted animals, resulting in low estimates of mean weight of individuals in the population). It would be useful to examine the distribution of marine reserves, within which sea cucumber stocks are protected from fishing, around la Grande Terre in relation to population density and mean body size to determine whether stocks might be maintained by recruitment from these reserves. Examining this pattern may be a useful line of research that could lead to a fuller assessment of the conservation role that marine reserves play for sea cucumber (and probably other species) in New Caledonia. A better understanding of the status of the sea cucumber stocks and the impact of fishing could be achieved in two ways: First, if global stock abundance for each region could be estimated, the impact of fishing, measured as the proportion of the total stock harvested annually, could be estimated; this proportion could be compared with estimates of sustainable harvest rates from other countries. Although the total area of the different habitats may be obtained by areal analysis of reef habitat maps (e.g., the Millennium Mapping Program), the habitat range of some sea cucumber species is broad, so that abundance estimates so produced would be very approximate and of low precision. Estimation of global stock abundance should also use a randomised sampling design. Second, a time series of fishery data (catch by species, time spent fishing, fishing location, etc.) can improve assessments by allowing the alternative explanations for the patterns shown in Figure 43 to be evaluated. The discrepancies between average sizes of animals in Figures and the averages in Figure 43 are explained by the absence of small animals from reserves in this analysis. In particular, Ilot Maître had high abundances of many species, but animals were small; these contribute to lower average body sizes of animals in Figures but not in the analysis here. There was also some bias due to small species that we did not observe in surveys at some sites, whereas they down-weight the average estimates of body size at other sites. For example, two relatively small species, Actinopyga echinites and A. miliaris were not recorded on reefs open to fishing in the Nouméa region, so the estimate of average body size in this region is biased upwards. These shortcomings could not be easily reconciled so they should be considered in interpretations of these results. Additionally, our field data for calculating the average body sizes and abundances in this analysis excludes the inshore (mangrove-seagrass) habitats where Holothuria scabra is mostly found thus not all species and habitats giving rise to total catches are included in the estimates of body size and abundance. Again, there were limitations of using data from either field surveys or landing surveys so these estimates should be interpreted tentatively. A final limitation of this analysis is that it only includes current exploitation and is thus just a snapshot from data. A more informative analysis would include historical catches in each region, compiled through fisher and/or processor logbooks, but these data are not yet available. Lesson 12: Clearly, where stocks are depleted and animals are small there will be little potential for exploitation and little incentive for new fishers to engage in the fishery. However, stock status is not necessarily a reliable determinant of how much exploitation will occur in a region. If stocks are moderately abundant, external factors may dictate the level of exploitation. These could include the dependence fishers on marine resources, distance from markets, cultural factors, and family history of fishing. Lesson 13: In order to understand the pressure on resources, one needs data from both sociological surveys and landings to correctly evaluate levels of exploitation. The CPUE alone will not take into account the number of fishing days per year or fishing effort per day. Much of this information could also be gained from analysing data from logbooks of processors and/or fishers. 71
77 Figure 43. Relationships between (A) annual harvest and sea cucumber population density (site-wide), (B) annual harvest and mean body size, and (C) population density of sea cucumbers and mean body size among the six study regions. Data from sites in marine reserves and those of Stichopus chloronotus are not included. 72
78 Conversion of sea cucumbers to bêche-de-mer The study on changes in body lengths and weights of sea cucumbers at various stages of processing provided some reliable estimates of conversion ratios for six species (Table 22). About 30 45% of the body weight is lost in the initial stage of gutting animals. For species that were salted by the processor we worked with, the salting stage decreases the body weight by a further 12 17% of the initial body weight. At that stage, Holothuria lessoni, H. whitmaei and Actinopyga palauensis are about one-half of the initial body weight. In contrast, A. spinea specimens experienced greater weight loss, and were 38% of the initial body weight after salting. The final boiling and drying stages greatly decrease body weight and length (Table 22). There is a large variation in the percentage reduction in weight of animals to the dried bêche-de-mer stage, presumably due to differences in initial content of water in the body tissue of the animals. Dried Holothuria whitmaei, Actinopyga echinites, and A. palauensis were about 11 12% of their initial whole body weights. Dried Holothuria lessoni were about 10% of their initial body weights, while Actinopyga spinea averaged 7% of their initial body weights. Of the species we studied here, Stichopus herrmanni decreased the most in length and lost the most weight during processing into bêche-de-mer; the dried form representing just 3% of the initial whole animal weight. Table 22. Changes in average body length and weight, and their percentage of initial (whole, fresh) measurements, across the different stages of processing selected species of sea cucumbers into bêche-de-mer. Stages: 1 = whole, fresh body; 2 = gutted, fresh; 3 = gutted and salted (after 10 days); 4 = boiled and dried. Sample sizes for each stage are given in Table 5. Body length (cm) Body weight (g) Processing stage: Actinopyga echinites Mean SE ±0.3 ±0.2 ±20 ±14 ±2 % Actinopyga spinea Mean SE ±1 ±1 ±1 ±72 ±39 ±26 ±11 % Holothuria lessoni Mean SE ±1 ±1 ±0.2 ±80 ±50 ±32 ±7 % Stichopus herrmanni Mean SE ±2 ±0.3 ±154 ±5 % Holothuria whitmaei Mean SE ±0.8 ±0.9 ±0.4 ±104 ±45 ±35 ±14 % Actinopyga palauensis Mean SE ±0.7 ±2 ±0.5 ±86 ±61 ±44 ±11 %
79 4.3 Fisher and processor surveys Characteristics of fishers Our surveys centred on people currently fishing sea cucumbers commercially on a regular basis, generally one or more times per week. The fishers were of age between late twenties to late fifties, but mainly in their 40s with an average of 8 years experience in sea cucumber fishing (Table 23). About one out of seven fishers were women. Fishers had a very wide range of experience in harvesting sea cucumbers (Table 23), with some having fished sea cucumbers for 20 or 30 years. Many had recently started fishing sea cucumbers because prices are now more interesting than some other marine resources. Table 23. Characteristics of sea cucumber fishers in Province Nord (PN) and Province Sud (PS). Characteristic Province Nord Province Sud PN and PS N o of fishers surveyed Average age in years (±SD) 36 (±9) 49 (±10) 42 (±12) % women Average years experience fishing sea cucumbers (±SD) 8 (±10) 8 (±8) 8 (±9) Range in experience 3 months to 30 years 1 months to 20 years 1 months to 30 years Sea cucumber fishers of la Grande Terre also, from time to time, fished other reef and inshore resources for additional income (Figure 44). In Province Nord, the other resources that fishers relied mostly on were finfishes and trochus. Only one-fifth of sea cucumber fishers in Province Nord only fished sea cucumbers. Some also collected giant clam and lobsters, but these were most likely sold locally or to small tourist operations in Province Nord. In Province Sud, a majority (75%) of sea cucumber fishers also caught finfishes and many (42%) also fished for spiny lobsters (reef crayfish, Panulirus spp.). The disparity in alternative marine resources between fisher groups in the two provinces is again largely attributed to distance to markets. In Province Sud, fishers can easily sell fresh lobsters to the market in Nouméa, whereas fishers in Province Nord are too far away to transport fresh animals and rely on trochus shell which can be stored for many weeks. 100 Province Nord A 100 Province Sud B Proportion of fishers (%) Sea cucumbers only Giant clams Fish Trochus Lobsters Octopus Crabs Proportion of fishers (%) Sea cucumbers only Giant clams Fish Trochus Lobsters Octopus Crabs Figure 44. Frequency of other resources fished commercially by sea cucumber fishers for additional income in Province Nord and Province Sud. 74
80 Lesson 14: Fishers in villages further from market centres base more of their income generation on resources not needing refrigeration. They therefore have more limited range of income streams for their livelihoods compared to fishers near market centres. Fishing history and perceptions of stock status About one-third of fishers in both provinces have switched to fishing different species in recent years (Table 24). In Province Nord, the switch in species was attributed to both a change in the resource (e.g., animals of the preferred species became smaller or less abundant) and markets (prices or changes in species bought or desired by processors). In Province Sud, all of the fishers who have switched to fishing different species recently did so because of a change in the resource. Table 24. Perceptions about current stock status and historical harvests by fishers. Values are percentages of respondents except for the last two rows. Province Nord Province Sud % fishers who have switched species Reasons - Change in the resource Change in markets or prices Other reasons 0 0 % fishers who have changed fishing sites Reasons - Change in the resource Access to sites Other reasons 0 0 Opinions on stock status - Stocks are increasing Stocks are stable Stocks are declining Stocks are depleted 0 25 Past fishing % who believe harvests were better CPUE in kg fresh wt per day (±SD) 97 (±148) 165 (±117) Average N o years in past (range) 4 (8 months to 10 yr) 9 (16 months to 20 yr) About one-quarter of fishers have recently changed the sites at which they fish sea cucumbers. In most cases, the change in fishing sites was due to a change in the resource; e.g. sea cucumbers no longer abundant at previous fishing sites (Table 24). In Province Nord, three-quarters of fishers who changed sites did so because of access issues, e.g. they were no longer allowed to fish at historical fishing grounds due to customary taboos. Few of the fishers believed stocks of sea cucumbers were increasing, in comparison to their past fishing experience (Table 24). In Province Nord, half of fishers believed that stocks have been declining in recent years, and slightly fewer fishers believed stocks were stable. None of the fishers interviewed in Province Nord thought the sea cucumber stocks were currently in a depleted state. Responses were somewhat less optimistic from fishers in Province Sud; only one-quarter of fishers 75
, showing that analysis of fishers perceptions needs to be at a finer scale than the provincial")
81 thought the stock abundances were stable compared to their past experience, more than one-third thought stocks have been declining, and one-quarter believed stocks were depleted. Interestingly, there were also clear differences in views of stock status among regions (Figure 45), showing that analysis of fishers perceptions needs to be at a finer scale than the provincial level. Fishers were generally in disaccord among and within the different regions in both provinces, probably because fishing pressure and the effects of overfishing has not been homogenous but this could reflect the variation in fishers perceptions of the fishery. At least half of the fishers from the far south and the Boulouparis-Poya region felt stocks were in decline or depleted, but others in those two regions had more optimistic perceptions. Fishers in the Touho-Boat Pass and Nouméa regions were in complete agreement that stocks were in decline. At least half of fishers between Népoui and Poum, western Province Nord, felt stocks were stable or improving. This last point is curious, since many fishers in these two regions are relative newcomers to the sea cucumber fishery. Figure 45. Perceptions by fishers of current stock abundances of sea cucumbers in the six study regions. Of those fishers who believed stocks were declining or depleted, all in Province Nord said the declines were caused by too many fishers. In Province Sud, half believed the declines in stocks were due to too many fishers and the other half believed this was due to previous over-fishing. A small proportion of fishers in both provinces said they believed stocks had declined due to pollution from mines, other pollution, use of new fishing gear or natural causes. While the fishers who believed stocks were in decline or depleted had more experience in this fishery (10.3 years) than those who felt stocks were stable or increasing (5.5 years), there was much variation in experience among the two groups. A two-tailed t-test showed that the difference in average number of years experience in fishing sea cucumbers between these two groups was not statistically significant (t 24 = 1.43; p = 0.17). So, one cannot say that it was generally the more experienced fishers that were pessimistic about stock status. In both provinces, two-thirds of fishers believed that their harvests of sea cucumbers were, on average, better in the past than they are currently. The perceived Catch Per Unit Effort (CPUE) in the past varied widely among respondents and, on average, those from Province Sud believed they were catching more in the past than fishers in Province Nord. However, it was evident that fishers in Province Sud were comparing current catches to those 9 years ago, on average, whereas fishers in Province Nord were comparing current catches to those just 4 years ago. 76
82 Lesson 15: The status (abundance) of stocks cannot be inferred from CPUE alone. For instance, fishers in Nouméa all said they believe stocks have declined near Nouméa but they are generally efficient in fishing and the CPUE is quite high despite some stocks being low, as shown by field surveys. Part of this is because other lower-value species are harvested as stocks of high-value species are depleted, and the lower-value species can be large animals giving high CPUE in terms of harvested weight. Field surveys are therefore needed to ground-truth interpretations from CPUE data. Also, one must consider whether other resources are fished at the same time by fishers, whether fishing methods are similar, and whether the targeted habitats are similar enough to permit meaningful comparisons of CPUE data among fishers of fisher groups. Modes and zones of fishing Fishers did not collect sea cucumbers in the same manner in la Grand Terre (Figure 46). About onethird of fishers in both provinces only collect sea cucumbers by wading on reef flats at low tide (called gleaning ). In many cases, these fishers use a boat to access lagoonal reefs at low tide. About 38% of fishers in Province Nord and 45% of fishers in Province Sud collect sea cucumbers only by free-diving. A smaller proportion of the fishers use both wading and free-diving (Figure 46). This result is quite important, since the licences for fishing sea cucumbers in Province Nord are linked to the possession of a boat. Free-diving & wading 28% Free diving 38% Free-diving & wading 20% Free-diving 45% Wading 34% PN Wading 35% PS Figure 46. Modes of fishing sea cucumber in Province Nord (PN) and Province Sud (PS). Fishers harvested sea cucumbers in a wide range of reef zones (Figure 47). Some harvested from only one zone while others exploited stocks in multiple zones, but the frequency of fishers exploiting each zone was similar between the two provinces. A majority of fishers in both provinces currently collect sea cucumbers from reef flats, which would often involve wading. About half of the fishers accessed the reef slopes and deeper fishing grounds in reef passes. Relatively few fishers collected from the lagoon habitat (sheltered areas leeward of the reef flat) or reef crests. In terms of numbers of fishers, these data suggest that stocks on reef flats, exposed slopes and passes are currently most targeted in la Grande Terre. Proportion of fishers (%) PN Proportion of fishers (%) PS 0 Reef flat Slope Crest Pass/Deep Lagoon 0 Reef flat Slope Crest Pass/Deep Lagoon Figure 47. Proportion of fishers exploiting sea cucumbers in various reef zones in Province Nord (PN) and Province Sud (PS). 77
83 Species targeted by fishers In addition to the landing surveys, our questionnaires to fishers also sought to reveal the range of species harvested in the two provinces. We also asked them to estimate the average sizes of sea cucumbers they collect, of the various species, by nominating diagrams of set sizes that we had predrawn on posters (see Kronen et al. 2007). This avoided misunderstandings about units of measurement. As shown in the landings, fishers collected a wide range of species in both provinces (Figure 48). Fishers that we interviewed in Province Nord collectively harvest 13 species. The same species are also fished in Province Sud, but one or more fishers there collect an additional seven species, mostly of low value: Holothuria coluber, H. edulis, H. atra, H. fuscopunctata, Thelenota anax, Bohadschia argus and B. vitiensis. It was interesting that although we did not find Actinopyga echinites in field surveys or landings in Province Nord, one fisher from Boat Pass (in the far north) said he collected them. Thus, the distribution seems predominantly restricted to Province Sud for this species, but some small populations may exist in Province Nord. Figure 48. Average perceived sizes (fresh body length in cm) of sea cucumbers collected by fishers in (A) Province Nord and (B) Province Sud. 78
84 The interviews with fishers were also valuable in revealing the range of species collected, which cannot always be shown in landings because they are just collected occasionally. In particular, we did not find Stichopus chloronotus in the landings we surveyed, but a small number of fishers in both provinces said they sometimes collect them (Figure 48). Similarly, some fishers in Province Sud said they occasionally collect H. fuscopunctata, H. edulis, and H. atra, but these species were not seen in landings. In both provinces, fishers noted that the largest of the commercially valuable species they collect is Thelenota ananas (Figure 48). On average, fishers in Province Nord believe these are just over 50 cm long whereas fishers in Province Sud believe they catch them at a slightly smaller size. This difference concurred with data from landings, but not our field observations. Likewise, the average size of H. whitmaei that fishers say they catch in Province Nord was larger than the size that fishers say they catch in Province Sud, and this also corresponds with differences in average weights from landing surveys. The fact that we found H. whitmaei to be of similar size in the two provinces does not invalidate the field results, since it may simply mean that fishers in Province Nord are leaving small individuals while those in Province Sud take all that they find. However, the difference in average perceived sizes of sea cucumbers collected between Province Nord and Province Sud did not always match the data from landings. For example, fishers in Province Nord believe they catch larger Holothuria lessoni than fishers in Province Sud, but this was not the case for the landings we surveyed. Likewise, the average size of Stichopus herrmanni that fishers say they catch in Province Nord is larger than those fishers in Province Sud say they collect, but the landing data shows an opposite trend. The comparisons between perceived species and sizes collected by fishers and the landings and field observations provide two valuable lessons for evaluating stocks in New Caledonia and elsewhere. Lesson 16: Unless all landings are well documented, landing surveys cannot be a sole reference for judging the range of species exploited. This should be augmented with fisher interviews. Some species are harvested only occasionally by fishers and declared in interviews, but may be missed in landing surveys. Interviews with fishers can also help to redefine distributions of species indicated by field surveys, e.g. Actinopyga echinites. Lesson 17: Perceptions by fishers of the sizes of animals they captured did not always match the actual landing data. Monitoring programs must also collect landing data to bring more realism into the understanding of sizes collected. Importance of sea cucumbers to revenue While, collectively, the fishers in both provinces also fished other marine resources commercially (Figure 44), this was not the case in all regions nor did sea cucumbers rank similarly to other income sources of fishers among regions (Figure 49). In two regions, Touho-Boat Pass and around Nouméa, the sea cucumber fishers relied most on this resource for their revenue. Thus, fishers in these two areas have a high interest in the sea cucumber fishery. Similarly, sea cucumbers were the primary source of income for three-quarters of the fishers of sea cucumbers in the far south. In the other three study regions, the fishers had other sources of income that were more important sources of revenue than selling sea cucumbers (Figure 49). Nonetheless, sea cucumbers ranked at least second in the revenue sources of those fishers. There were relatively few fishers we interviewed that did not rank sea cucumbers in the top two income sources. Half or more of the fishers we interviewed said they were very satisfied with the prices and income they got from fishing sea cucumbers. One-third of fishers in Province Nord and one-quarter in Province Sud said they were duly satisfied with the income they received from fishing sea cucumbers, while just one-quarter of fishers from Province Sud were unsatisfied. None of the fishers responded that they had difficulty in selling the sea cucumbers they caught. 79
85 Figure 49. Rankings of sea cucumber fishing as a source of income of the fishers interviewed among the six study regions. In Province Nord, a vast majority (86%) of fishers salt the sea cucumbers they catch and boil and dry the animals themselves. They can then store the dried bêche-de-mer and wait for processors to come to buy the product. In contrast, just over half (58%) of fishers in Province Sud salt the sea cucumbers they catch. Two-thirds of fishers in Province Sud dry the sea cucumbers they catch, while one-third sell fresh animals directly to processors. None of the fishers in Province Nord responded that they consume sea cucumbers but one-third from Province Sud said they ate them rarely or sometimes. Fishing effort and travel Generally, fishers in la Grande Terre only spent a few days a week actually fishing for sea cucumbers. In Province Nord, fishers spent 2 days (±1.1 day, s.d.) per week fishing, while fishers in Province Sud spent 3 days (±0.9 day, s.d.) per week fishing, on average. The relatively low number of days fishing could be attributed to three key factors: (1) weather conditions do not permit fishing every day, (2) some days were spent processing the catch, and/or (3) a couple days fishing was enough to get income for their weekly needs. Fishers also commonly ceased fishing sea cucumbers for a short period of the year. Voluntary seasonal cessation of fishing could be due to customary traditions, inclement or cool weather, or competing activities like marriage season (for Melanesians) or vacation period. Fishers in Province Nord had the longer breaks of fishing (4 months ±4 months, s.d.) per year than those in Province Sud (2 months ±2 months, s.d.). Only 20% of fishers in both provinces fished sea cucumbers year round. Only fishers in Province Sud conduct fishing trips longer than one day. About half (58%) of respondents in Province Sud said they conduct long fishing trips, but the number of days they spent at sea varied greatly; average: 6 days (±8 days s.d.). Fishers from the six study regions spent very different amounts of time getting to and from their fishing sites (Figure 50). The fishers in the far south had the greatest round-trip travel times, averaging 9.3 h, because some access remote reefs beyond those around la Grande Terre. In the north-east, fishers spent 3.5 h to get to and from their fishing sites because many of them fished on reefs further north, near Ile Balabio. Fishers in the north-west (Kaala Gomen to Poum region) had the shortest travel times, averaging 40 min by boat each way to access fishing sites. 80
86 Figure 50. Average round-trip time in travel for fishers to fishing sites (clock symbols) and average number of hours fishing (values in bold; per fisher, per day) in the six study regions. The diameter of each clock symbol corresponds to the average round-trip travel time and values to the right of the symbols give the standard error of the estimated mean round-trip time. Fishers north of the Nouméa region spent 4-5 hours fishing per day (Figure 50), on average. In contrast, those in the Nouméa region and in the far south spent 8 hours fishing per day. This was in addition to travel time. We asked fishers about the quantity (in kg) of sea cucumbers that they fished per day, on average, now and in the past. We then compared these responses to the estimates of Catch Per Unit Effort (CPUE, travel time not included) obtained from the landings, the number of fishers and the time fishing (to calculate kg/fisher/day) (Figure 51). In half of the regions, the historical CPUE was greater than current CPUE based on responses of fishers in interviews and their actual landings. The highest historical CPUE was in the Touho to Boat Pass region (north-east), where fishers recalled that they caught, on average, 222 kg of sea cucumbers per day, five years ago. This contrasts sharply with average perceived catches of just 34 kg fisher -1 day -1, and an estimated average CPUE from landings of 59 kg fisher -1 day -1 from the same region. Historical catches were also apparently high in Province Sud (Figure 51), where, on average, fishers estimated that they caught 159, 90 and 190 kg fisher -1 day -1, 4 13 years ago. It was interesting that the average weight of sea cucumbers that fishers in Province Sud said they caught per day generally underestimated the actual weights caught per day that we recorded from landings (Figure 51). This was particularly marked in Nouméa, where fishers caught about three times as much sea cucumbers per day as they said in interviews. This shows that responses from fishers were not always accurate estimates of current CPUE. It was unclear whether this was because the landings we measured were unusually high during the period of our surveys or whether fishers simply underestimated catches in their responses in the interviews. Actual catches from measurements of fishers landings were closer to perceived catches for fishers in Province Nord. 81
 bars.")
87 Figure 51. Average Catch Per Unit Effort (CPUE), in kg fisher -1 day -1, from responses from landing surveys (yellow), about current (blue) and historical (pink) catches from the six study regions. Standard errors of the estimates are given as dashed bars. The average number of years in the past to which fishers refer for historical catches are given as values above the pink (right-most) bars. Estimates of CPUE from landings were highest in the Nouméa and Grande Sud Nouméa regions, where fishers caught an average of 194 and 218 kg fisher -1 day -1, respectively. The catch rates of fishers near Nouméa were discordant with population surveys and their views on resource status. That is, fishers in Nouméa caught large quantities of sea cucumbers per day even though our surveys showed that many medium- and high-value species are low in abundance and all of the fishers said in interviews that the stocks had declined. We note that most fishers in Nouméa had shifted to fishing new species, and these are lower value or at the low end of the medium-value category, and many are large animals (e.g. S. herrmanni). So although CPUE is high near Nouméa, catches are dominated by lower value species and fishers may need to harvest large quantities to satisfy weekly needs. It should also be alarming that fishers from Nouméa and in the far south (Grand Sud Nouméa) appear to be catching more per day than historical catches they reported and that this is linked to a shift towards lower-value species Actual landings per day were lowest in the Népoui to Ouaco region, where the average CPUE was 27 kg fisher -1 day -1. The CPUE was also relatively low in the Kaala Gomen to Poum region, where fishers caught an average of 33 kg fisher -1 day -1. Thus, fishers in the north-west are fishing less intensively than elsewhere they fish for fewer hours per day, few days per week, and return each day with relatively modest amounts of sea cucumbers. They were generally satisfied with the income they gained, and can probably meet their needs with smaller harvests, whereas fishers in Nouméa have higher costs of living and are fishing more intensively. Lesson 18: Estimates of CPUE based on interviews do not always reflect the actual amounts that fishers catch. Landing surveys are a better estimate, since the actual quantities of harvested animals can be measured and the fishing times can be specified. But good replication of landings is needed to avoid potential bias of measuring catches on good or bad days or during seasons when fishers may harvest more or less intensively. 82
88 Lesson 19: Fishers in rural areas appear to have more modest catch rates and will have less impact on the resource than fishers from urban centres. This is probably partly to do with costs of living, which are lower in rural areas, and partly due to a more subsistence mentality of rural fishers. That is, they are content to return from just a few hours of fishing to meet weekly needs, while fishers from cities fish for longer to make high profit. Gender differences in sea cucumber fishing There were large differences in the intensity and fishing modes between men and women, but we interpret the finding cautiously since just four of the 26 fishers we interviewed were women. All of the women fishers were Melanesian, whereas only 45% of the men were Melanesian. Women spent less time fishing sea cucumbers each year (average: 72 days) than men (average: 134 days). However, none of the women fished sea cucumbers as their sole source of revenue they always had other income sources. The women all fished by wading on reef flats, whereas many men also skin-dived to collect sea cucumbers. Three of the four women collected Sandfish Holothuria scabra, whereas just 59% of men collected that species. This suggests that women are more reliant on the inshore resources, and more vulnerable to collapse of inshore populations or management measures that would restrict fishing inshore species. Concomitantly, women spent less time in travel to and from fishing sites (average: 2 h round-trip) than men (average: 4 h round trip). The women generally had lower catch rates than men (based on interview responses). The average CPUE of women was 19 kg day -1 while men caught 54 kg day -1, on average across regions. These should be seen as observations of differences rather than direct comparisons, since fishing strategies and targeted habitats differed between men and women. Views of fishers about resource management In the sea cucumber fishery in Province Nord, there currently are minimum legal size limits (both fresh and dried), general no-take marine reserves, a ban on the use of SCUBA or hookah, and a ban on fishing at night. In Province Sud, the regulations in the sea cucumber fishery are no fishing in reserves, no use of SCUBA or hookah, and no fishing at night. Some local Melanesian tribes also set their own customary rules mostly, this involved taboos of certain sites, but apparently also some species are prohibited by the village chief in a few cases. One-quarter of all fishers knew about customary fishery regulations about sea cucumbers. Surprisingly, 23% of respondents did not know of regulations imposed by the provinces. Of the fishers that were aware of the provincial fishery regulations for collecting sea cucumbers, 24% felt these were inappropriate. Eight fishers said that most other fishers do not respect the fishery rules, five said the rules were respected by most, and the rest were not well informed enough to comment. When asked about what fishery regulations they thought would be best for sea cucumbers in their province, the vast majority of fishers said they wanted fresh size limits (Figure 52). A majority in both provinces also thought rotational fishing closures of different zones would be best. Although 40% of fishers in Province Nord wanted to see marine reserves for the sea cucumber fishery, many fewer fishers in Province Sud wanted this management regulation (Figure 52). This disparity is probably because there are many reserves on lagoon and barrier reefs in Province Sud already, whereas no reefal reserves exist in Province Nord. A minority of fishers wanted to have seasonal closures and a few wanted quotas on the total allowable catch. 83
89 Proportion of fishers (%) Proportion of fishers (%) Taille limite anx frais Taille limite anx secs Aires marines Saison fermeture pêche Fresh size limits Dried size limits Reserves Fishing season Rotations zones de pêche Nb restreint de pêcheurs Espèces interdites de pêche Quota annuel Certains engins interdits Rotational closures Restrict number of fishers Prohibit fishing species Annual quota Limit the gear Limit the size of boat Limite taille du bateau Pêche de nuit interdite Moratoire PN PS Autres Prohibit night fishing Moratorium Others Figure 52. Bar graph of the percentage of respondents in Province Nord (PN) and Province Sud (PS) who wanted various fishery regulations for the sea cucumber fishery. Purchase of sea cucumbers by processors For most of the processors, the Black Teatfish Holothuria whitmaei was the species they most sought after from fishers (Figure 53). The other two species of first choice by processors were H. scabra and H. lessoni. As a species of second choice, more than half of the processors wanted to buy H. fuscogilva. The Black Teatfish was the second choice of processors for whom it was not their first. A H. lessoni 14% H. scabra 14% H. whitmaei 72% B H. fuscogilva 57% H. whitmaei 29% H. scabra 14% Figure 53. Species of first choice (A) and second choice (B) by processors for purchasing from fishers. Values are average proportions of processors who prefer those species. 84

90 Most of the processors said they had problems with the quality of sea cucumbers they purchased. Four out of six processors said that sea cucumbers are occasionally poorly processed by fishers; either the animals were damaged during the cooking process, or not cooked properly, or not dried properly. Four out of six processors said they refused to buy very small sea cucumbers. Only half of the processors offered higher prices for larger sea cucumbers. Four out of six processors said sea cucumbers were larger 5 years ago than they are now. Five out of seven processors export the sea cucumbers they process, and four of them sometimes resell sea cucumbers to other processors. Hong Kong was the principal market to which processors exported bêche-de-mer. Four of the seven processors said that H. whitmaei was the species they most exported. One processor mostly exported H. scabra, another mostly exported A. echinites, and the last processor mostly exported A. miliaris. The Sandfish Holothuria scabra fetched the highest export price for processors (Figure 54). Notably, there was a great variation in the stipulated export price for Sandfish, possibly due to differences in the product quality but this could also reflect variation in market advantage. The average export price of the Golden Sandfish H. lessoni was marginally less valuable. It was followed in value by the White Teatfish Holothuria fuscogilva and the Black Teatfish Holothuria whitmaei. As discussed in earlier sections, the medium-value species mostly exported from New Caledonia are Actinopyga miliaris, A. spinea, A. palauensis, A. mauritiana, Thelenota ananas, Stichopus herrmanni, A. echinites and S. chloronotus (Figure 54). Although S. chloronotus received just marginally lower prices than some other species, it loses a great deal of weight during processing, so the economic return per kilogram of fresh animal is quite low. Figure 54. Average stipulated export value of sea cucumbers of the twelve main species. Note that some processors combine the three blackfish species as one export group. Views of processors about resource management The interviews with processors gave invaluable insights into some major problems currently facing the fishery. All of the processors said they had either been in contact with, or purchased sea cucumbers from, unlicensed fishers. Two-thirds of processors said that the size limits were not always respected by the fishers from whom they bought sea cucumbers. All of the processors wanted to see size limits placed on fresh (whole, unprocessed) animals, but only one processor thought size limits on dried animals was a good management regulation. This was not surprising. Many processors wanted marine reserves as a management regulation for the sea cucumber fishery, especially in Province Nord where there is only one marine reserve (Figure 55). 85
91 All but one processor said they would like to see zonation of the fishing grounds and rotational closures of the zones. About half of the processors said that limits to the number of fishers, speciesspecific closures and a quota on total allowable catch would be appropriate regulations for the fishery. Many, but not all, processors agreed with the current regulation of prohibiting fishing at night. Proportion of processors (%) Proportion of processors (%) PN PS Taille limite anx frais Taille limite anx secs Aires marines Saison fermeture pêche Rotations zones de pêche Nb restreint de pêcheurs Espèces interdites de pêche Fresh size limits Quota annuel Dried size limits Certains engins interdits Reserves Limite taille du bateau Fishing season Pêche de nuit interdite Rotational closures Moratoire Restrict number of fishers Autres Prohibit fishing species Annual quota Limit the gear Limit the size of boat Prohibit night fishing Moratorium Others Figure 55. Bar graph of the percentage of respondents in Province Nord (PN) and Province Sud (PS) who wanted various fishery regulations for the sea cucumber fishery. 86
92 5. RECOMMENDATIONS FOR FISHERIES MANAGEMENT AND WORKSHOP OUTCOMES General goals of management regulations The management plan for the sea cucumber fisheries in Province Nord and Province Sud should be based on some guiding principles about what the stakeholders want out of the fishery. In this case, stakeholders include the fishery services of the provinces, fishers, processors, environmental services of the provinces, scientists, conservation groups, and tourist operators. The first groups are most concerned with performance and sustainable yields of the fishery while the latter groups are most concerned with biodiversity and ecosystem benefits of sea cucumbers. We aimed to apply an Ecosystem Approach to fishery management by considering and discussing both biological and sociological objectives for the fishery with major stakeholder groups (FAO 2003). Resource management, in the present context, is a responsibility at the provincial level in New Caledonia. Hence, the Province Nord and Province Sud issue their own regulations and act independently, but they do seek to harmonise management regulations where practical. We therefore consider two sea cucumber fisheries, since they are currently managed separately. The general management goals for the two fisheries were discussed with stakeholders in the project s workshop in Koné, April This was preceded by discussion of the multiple values of fishery resources that permeate the ecosystem approach to fisheries (FAO 2003). An agreed aim was for the provinces to adapt their current management to better ensure sustained yields for fishers. This means that the exploitation today does not take away potential income resources from future generations in New Caledonia. Many sea cucumber fisheries worldwide have experienced boom-and-bust cycles (Lovatelli et al. 2004), where fishing pressure and revenues increase over several years then the stocks become quickly depleted to states where fishers can no longer make profit and fishing activity ceases for many years. A recent example of this is the sea cucumber fishery in Egypt, which collapsed after just four years of intensive fishing (Lawrence et al. 2004, Hasan 2005). In the context of fishery sustainability, workshop participants agreed that the management schemes should strive for regular harvests year after year. This means having regulations that safeguard the depletion of stocks that would force the provincial fishery services to ban fishing all together. To some, this scenario may seem sensationalist. But the reality is that many national fishery authorities have recently had to instigate moratoriums on fishing sea cucumbers because stocks became depleted through unregulated or imprudent fishing. In the past decade, commercial fishing of sea cucumbers has been banned in Solomon Islands, Palau, Vanuatu, Tonga, and for some species in Fiji and Australia (Kinch et al. 2008). Another concept agreed by participants was the need to maintain the reproductive capacity of sea cucumbers populations on reefs. Sea cucumbers are sedentary and gonochoric i.e. they move relatively slowly and individuals are male or female, not hermaphroditic. This means that they must find each other, or get close to each other, during spawning periods. If animals are too far apart, they may not find mates in spawning periods or the sperm released from males is too far from females to successfully fertilise the oocytes (unfertilized eggs) that they expel. When this occurs, the reproduction from those populations fails to compensate for annual mortality of animals, and the population declines to a point where the animals become locally extinct or reproductively extinct i.e. some individuals may still exist but there is no effective reproduction. This effect is called the Allee effect (Allee 1938), or depensation, and is believed to be a primary cause of collapse of many invertebrate fisheries, particularly sedentary groups (see Stephens et al. 1999, Gascoigne and Lipcius 2004). In some sea cucumber fisheries, negligent over-fishing depleted the populations to levels at which they could not recover, even 50 years after fishing stopped (see Battaglene and Bell 2004). Obviously, it is valuable to know the density at which populations need to be maintained to allow successful reproduction. However, such density thresholds are poorly known for sea cucumbers. Bell et al. (2008) overview the scant research on minimum viable densities for successful fertilization in sea cucumbers and speculate that the threshold densities to avoid depensation for most tropical sea cucumbers will be in the range of 10 to 50 individuals ha -1 over substantial areas, depending on species and location. The management of the sea cucumber fisheries in New Caledonia should therefore evaluate densities of 87
93 adult sea cucumbers of each species and gauge whether sufficient numbers of dense populations exist in the fishery to ensure that populations will be replenished after the losses from fishing. Another management goal should be to maximise the money earned by fishers for each animal collected. This means preventing the capture of small animals, and two germane points should be considered. Firstly, larger animals give greater returns to fishers because they are heavier and the sale price and export price is governed by weight, not numbers of individuals. Secondly, larger bêchede-mer command much higher prices than smaller pieces per kilogram. Thus, a one-kilogram animal may be worth ten times the value of an animal harvested at 250 grams. In this context, minimum legal size limits provide better long term benefits for all stakeholders with commercial interests because the resource is exploited in a way that maximizes profit. In a broader context, fisheries management should ensure that the animals can play their natural role in maintaining ecosystem health. Thus, a precautionary approach links fisheries management intimately with general environmental management (FAO 1996). Sea cucumbers consume detritus, made up of dead organic matter like decaying algae, seagrass and bacteria. They convert these waste materials into animal flesh, that can re-enter the food chain, and they convert some of the organic matter into dissolved nutrients that can be re-used by reef flora (Uthicke 2001b, c). Thus, sea cucumbers play an important role in recycling nutrients in reef systems. Moreover, some species bury into reef sediments at some times of the day and, in doing so, are believed to contribute to sediment health by aerating the surface layers. Therefore, although this has only been demonstrated at very small scales, maintaining adequate numbers of sea cucumbers on reefs should improve the health of the systems. A final management goal should be to maintain and improve the biodiversity values of reef communities. Tourist operators, scientists and conservation groups have interests in communities that are speciose. The management plan for these sea cucumber fisheries should ensure that rare species, or those vulnerable to local extinction, are preserved on each reef. This requires underwater assessments to document species richness and nominate rare species. The responsibility of the management agency is then to prohibit fishing of rare species and maintain biodiversity by closing fishing of certain commercial species that become uncommon. Management of small-scale fisheries WorldFish Center s approach The approach taken by this project in advising the provincial fisheries services about management of their sea cucumber fisheries follows the scheme by Andrew et al. (2007). Their scheme for the diagnosis and management of small-scale fisheries comprises a logical flow of several steps: 1. Gain an understanding of the external environment, which includes trends in world markets, competition with other fisheries or aquaculture production, and social issues nationally. Gauge whether the external factors have a greater impact on the fishery than those internally. 2. Diagnose the fishery, in terms of threats and opportunities. In the current context, this involves: a. an evaluation of the constraints and resources of the fisheries services and partner agencies, b. field studies to understand the distribution and abundance of populations, and geographical variation in adult sizes of animals being fished, c. socio-economic studies to describe and evaluate the users, and their dependence on, and exploitation of, the resource, and d. fishery-dependant analyses of what fishers are catching, their catch rates, and how these vary geographically within the fishery. 3. Inform and interact with the management constituency. Here, Andrew et al. (2007) note that distinctions should be made about the scales and boundaries of management and who has responsibility for various management actions. We consider the management constituency in a broad sense as the managers and users (fishers and processors) since both groups are engaged in the application of management regulations and management activities. The interaction should involve participation in interpreting the diagnosis of the fishery and in decisions about how it should be managed. 88
94 4. Develop a management plan and test it. This starts with establishing the desired outcomes of the management (i.e. what are the goals?). Decisions are then made about what management regulations are best suited to the fishery to achieve the outcomes and what actions are needed by the managers to implement and sustain them. The last phase involves a critical appraisal some time later (e.g., some years after implementing the management rules) of whether the management scheme delivered the desired outcomes. For example, the fishery service should see if the average size of exported sea cucumbers is larger and whether breeding populations are returning to healthier densities. This approach is needed especially when biological and ecological information on the species is limited, as is the general case for sea cucumbers. 5. Re-assess the social-ecological system and feedback the assessment to revisit earlier steps. Fishery managers should look at sustainability in terms of the resilience of the social-ecological system and assess whether it has evolved to an undesirable configuration. The final step of the management scheme should involve some feedback to earlier steps through a process of adaptive management. That is, if the social configuration of the fishery (e.g., dependence or fishing effort) or the ecological configuration (e.g., abundance or diversity of the resource) have evolved in a negative way, then re-diagnose the threats and opportunities and revise the management plan. Along the approach proposed by Andrew et al. (2007), we strongly advocate a process of adaptive management for the sea cucumber fisheries in New Caledonia. We believe it will be far better to develop, implement, test and modify a management plan based on the results of this study than to try to perfect a management plan with further studies and delay the implementation. Fishers and processors should also be consulted so they understand that the process will be adaptive, based on the outcomes and their experiences. Participatory development of management for la Grande Terre s sea cucumber fishery We incorporated the views of fishers and processors in our management recommendations in two ways. Firstly, we asked structured questions about current and future management in interviews with fishers and processors. These were then analysed to help us to understand what these stakeholders wanted. Secondly, fishers and processors were invited to participate in a national workshop to interpret and discuss the project s findings, and to discuss the advantages and constraints of management options. Great attention was paid in the workshop to describe the external environment of the fishery, principles of fisheries management, and applications of different management regulations in other countries. It was the wish of the fisheries services that we firstly present our preliminary recommendations, then discuss these and ask for the opinions of the participants on whether these should be applied and what other regulations could be suitable. Management recommendations from the project Our recommendations are guided by the general goals outlined in the previous section. We also point out that the WorldFish Center is not a conservation organisation, but a research organisation with the livelihoods of fishers as a central driver. The recommendations are based on findings from the different research components of the project and published results and accounts from other similar fisheries. We propose two sets of management recommendations: (1) actions that we believe should be taken by the fisheries services, and (2) fishery regulations that should be imposed on the fishers and processors. Some actions and regulations are already being applied in other countries, and we do not present these as new ideas. Some others are already being applied in New Caledonia and the point here is that we endorse them and encourage the provinces to continue applying them to these fisheries. Some management regulations have been applied to sea cucumber fisheries in other countries, but we do not advocate their use here, and discuss reasons in the following section. 89
95 A Actions by the provincial fisheries services 1. Strengthen education and communication with fishers This does not suggest that fishers are idiots if they are unaware of the fishery rules (as questioned by one participant in the workshop). The fact is, almost one-quarter of the fishers we interviewed said that they did not know the provincial fishery regulations. It is best to view this as a need for more interactions between fisheries officers and fishers, than a lack of comprehension by fishers. An education plan should also be more than just a campaign to tell fishers and processors about the fishery rules. The Provinces already communicate with fishers and processors, and this should be formally scheduled to ensure that all fishers are told the fishery regulations and each receives some face-to-face education about sea cucumbers, the fishery, and the status of stocks. It should involve discussion between fishery technicians, or their agents, and fishers about the growth and reproductive biology of the species in non-scientific terms. The education program should ensure that fishers understand how stocks replenish themselves after being fished, how old animals are that they are fishing, and the sizes at which animals mature. Only through this understanding will they appreciate the need for size limits and fishing reserves and be prepared to respect them. All of the stakeholders should be educated to understand why the fishery regulations are in place and how each regulation acts to improve the benefits for all stakeholders. A communication plan should set a periodicity by which fishery officers and other agents interact with fishers. Fishers and processors should be helped to receive newsletters, both local and regional, and information aids like identification guides. Feedback should be gathered from the fishers about changes in the species, sizes, catch rates, and sites where they fish, and this is best done using organised data sheets so the information can be later compiled and shared. The communication strategy should also work the other way to inform fishers about new studies or the evolution in exports or resource densities. 2. Instruct and train customs officers to record exports for species separately It has been a recurrent key recommendation from international workshops that exports of bêche-de-mer from countries must be recorded by species, not species groups (see Lovatelli et al. 2004, Friedman et al. 2008, FAO in prep.). Export data is easy and cost-effective to collect when compared to field data or sociological surveys. It can provide valuable insights into changes in the amount and species being collected by fishers, which can serve as cost-effective indicators of overfishing. However, it is impossible to use export data as indicators for assessing evolution in fishing when records are taken for species groups instead of species. The weights of exported bêche-de-mer must be recorded for each species. Unfortunately, exports of bêche-de-mer from New Caledonia are recorded only in broad categories of species groups. This is inadequate for fishery management, and does not conform to the standards requested by the United Nations-FAO for global monitoring of fishery captures (Lovatelli et al. 2004). While it is true that dried sea cucumbers are difficult to identify, this task can be made easy with some brief training by fishery officers. Identification of bêche-de-mer is not an impossible task we and all of the processors we met can easily distinguish species based on dried animals. A poster and plastic identification cards are also available to customs officers to help them recall names of species based on dried bêche-de-mer, and a new global guidebook will soon be published by the United Nations-FAO that provides photos of dried specimens. 3. Help to improve the quality of processing by fishers Some of the value of bêche-de-mer is attributed to the size of the animals but much of the value can be gained or lost through the boiling and drying stages. Profit will be lost if sea cucumbers are handled roughly, boiled too long or too hot, or not dried well enough. 90
96 Processors are quite aware of good techniques for handling, boiling and drying sea cucumbers to achieve a top quality bêche-de-mer. But some fishers do not use good processing methods, and this was a frequent complaint of processors in our interviews. The fishery services should promote the training of fishers in optimum methods of processing sea cucumbers into bêche-demer and this should involve practical workshops organised by the fishery service. Improved processing by fishers will allow greater value adding to harvested animals and increase the overall economic gains from the same amount of captured animals. At the same time, it will avoid wasted value of bêche-de-mer that can come with poor processing. While many processors simply want to buy uncooked sea cucumbers so they can do the boiling and drying themselves, this is not always practical in cases where fishers are far from processing centres. Processors should be encouraged to help fishers to process the product better, since this will elevate the standard of exports from the country and give a better reputation for New Caledonian bêche-de-mer in general. 4. Develop a schedule for surveillance and inspections The fisheries service and the environment services of Province Nord and Province Sud should establish a periodicity for inspecting catches and exports of sea cucumbers. It should be made clear who will do the inspections and how often. Inspecting processed and semi-processed sea cucumbers at processing centres will generally be easier than inspecting landings of fishers. There are many fewer processors, and they are easier to contact than fishers. Inspecting the sizes and species of sea cucumbers at processing centres will force processors to buy only animals that are sanctioned by the management plan. The processors will naturally impose these same restrictions on the product they buy from fishers. Thus, fishers will be forced to leave certain species and small animals because all processors will refuse to buy them, rather than through the risk of being inspected by government agents. Nonetheless, some inspections of fishers should also take place, and a number of these inspections should be scheduled each year. Enforcement of the fishery regulations (recommended below) should be strict and severe. The environment service should establish penalties for the sale or purchase of animals that are under the size limit or on a list of prohibited species, and for the sale or purchase of sea cucumbers from unlicensed fishers. Firm penalties will benefit processors, the stocks, and eventually fishers too. 5. Develop a plan for monitoring wild stocks and fishing The fishery service should commit to conducting a predetermined number of landing surveys every year. These are not time consuming, and require little equipment and technical capacity. We recommend each fishery service in each province of New Caledonia to conduct at least 20 surveys of landings annually through visits to fishers or processors. The form in Appendix E can be used for recording data. The data should be entered into a database and analysed each year to examine changes in CPUE, species collected and size frequencies of the animals. We also encourage the fishery service to re-interview fishers every 3 years. Apart from the questionnaire, there is no equipment needed, and fishery technicians will require only brief training in how to conduct the interviews. Again, the data should be analysed to see if there has been an evolution in the dependency on the resource, or in the species and sites being fished, or in the desired management by fishers. This is a crucial step in the feedback process that helps to refine and adapt the management plan (as discussed earlier). Surveying the sea cucumber populations in the field requires a great deal of equipment and some technical competence. We recommend that the fishery services schedule to re-census sites every 5 years. There should also be predefined limits of acceptable stock abundance and predetermined actions to take if stocks have declined lower than the limits. Some new sites, not covered in the current project, could be surveyed in addition to re-censusing some of the same sites described here. Some of the field work could be outsourced to experts, or a monitoring unit of trained fishery officers could be established among provinces for conducting these and other surveys. The field evaluations will provide a basis for removing some species from the list of 91
97 permitted species if stocks appear depleted, and conversely for reinstating other species onto the list if their populations have recovered to predetermined levels at which they could be fished again. B Regulations imposed on fishers 6. Introduce more reserves to preserve some breeding populations We start by just giving a perspective from the Great Barrier Reef Marine Park in Queensland. It contains the world s largest barrier reef lagoon, somewhat similar to the barrier reef lagoon in New Caledonia. Prior to 2005, 5% of the reefs were protected as no-take reserves. However, degradation of the reefs and over-fishing (even some sea cucumber species) prompted the marine park authority to implement a Representative Areas Program (RAP), which now protects 33% of all habitats within the entire length of the marine park. The existing barrier reef and lagoonal reserves in Province Sud are suitable and provide a number of refuges for breeding populations of reef species. However, there are no permanent reserves protecting the inshore seagrass beds and mangrove systems. We believe there should be several new reserves situated in this zone in Province Sud. This would help to protect breeding stocks of some inshore species, especially the Sandfish Holothuria scabra that is heavily fished in la Grande Terre and has been exported much in recent years. In the case of the reserve at Ouano, this could simply involve extending the boundaries of the existing reserve to include some of the inshore seagrass beds within the sheltered bay. Other reserves in seagrass beds could be sited in the Bay of Saint Marie, and another at Paita. Some other reserves on lagoonal reefs further south of Nouméa would be beneficial for example, Ilot Uatérembi in Les Cinq Iles. In contrast, there is a large inshore reserve in Province Nord, but no reserves on lagoonal reefs or barrier reefs. Our results show that some of both reef types must be protected, since some species are almost only found on barrier reefs, and vice-versa. Reserves on some of the reefs would allow breeding populations of reef species to build up at those sites and act as sources of larvae that could replenish populations on nearby reefs. New reserves should thus be spaced apart, rather than all in one area. More site visits would be useful to select the best reefs for reserves, since our study was by no means comprehensive. We suggest that reserves could be placed at Passe de Koné (sud), Coupée de l Alliance (sud), Passe de Poum (nord), Plateau de Karembé, part of Plateau des Massacres, Passe de Touho (nord), Passe de Muéo (sud), Ilot Ouao, and part of Récif Balabio. A pertinent point about setting marine reserves for sea cucumbers, trochus and giant clams is that they do not need to be very big or encompass the entire reef, as far as the ecology of these taxa is concerned. None of the sea cucumbers we studied were what you could call fast movers. We conducted a comprehensive study of the movement of Sandfish Holothuria scabra and modeled the dispersal of juveniles to propose sizes of no-take reserves (Purcell and Kirby 2006). Although Sandfish can move a couple metres per day, there was no indication of directed migration and movement was random over short time frames, such that most animals were predicted to move less than a few hundred metres in their lifetime. Therefore, we suggest that reserves of a couple of hundred hectares (i.e. a couple of square kilometers) would probably be sufficient for preserving and promoting breeding populations of sea cucumbers, giant clams and trochus that could serve as sources of larvae for fished sites. A network of medium-sized marine reserves, as advocated by Purcell and Kirby (2006), would be best for spreading risks of recruitment failure from one site to another. Following from the lesson in Queensland, it would also be prudent to consider a much larger scheme of reserves that would contain one-quarter to one-third of the available habitat for sea cucumbers and other marine biota Impose conservative size limits for fresh (unboiled) and dried sea cucumbers As agreed with stakeholders in the workshop, minimum legal size limits should be placed on both dried and fresh sea cucumbers. Sizes will be much easier to verify on the dried product (bêche-de-mer) than on fresh animals. However, fishers generally agreed that size limits should also apply to live animals, rather than caught, gutted or salted animals. A simple plastic ruler
98 with graduations corresponding to size limits of species would be the easiest tool for fishers to use to verify sizes of animals in the water. This could easily have small colour photographs next to the graduation marks. Body length rather than body weight seemed the preferred metric by stakeholders to regulate minimum size limits. The minimum legal size limits should best be based on studies on the size at first sexual maturity of sea cucumbers, rather than opinions by fishers and processors about what are good sized animals. The most comprehensive of these is the doctoral thesis of Chantal Conand (1989) and Conand (1993b), which give estimates for size at first maturity. As a minimum, the L 90 (estimated body length at which 90% of the population is mature) from the size-at-maturity analysis curves could be used as the minimum legal size. As best practice, the size limits should be large enough such that animals can have at least one year to spawn after reaching maturity. Therefore, a more conservative approach would be to add some centimetres to the L 90 so that most animals have a year of protection before reaching legal fishing size. The equivalent size of dried animals can be calculated using conversion equations in Skewes et al. (2004), and the conversion factors determined by Conand (1989, 1990) and presented in this report. There may be some benefit in grouping species that have similar estimated size limits, rather than having many different sizes for fishers and processors to remember. This will involve a trade-off between loss of some rigor of the optimum size based on size-at-maturity studies and gains in simplicity of the size limits. For example, there are about 15 species that are fished in New Caledonia but perhaps these could be allocated into 6 to 8 size-limit groups. 8. Establish a list of species permitted to be caught and sold There are some species that are naturally very uncommon (i.e. rare ) in New Caledonia and others that appear to have become uncommon through excessive fishing. We observed that both groups of species are fished in New Caledonia; i.e. some fishers do occasionally collect a few individuals of rare species even ones that we have not recorded in this study. A list of species permissible for capture, sale and export should therefore be established and set in the management plan. It should also seem logical to fishers that only common species should be exploited. Species that are naturally very uncommon, or rare, should be prohibited from capture to preserve biodiversity on reefs; a goal of management discussed above and an explicit consideration for the precautionary approach to fishery management (FAO 1996). Likewise, species with depleted stocks should also be prohibited from capture to allow some years for their breeding populations to recover to abundance levels that can again withstand some light fishing pressure. In order to avoid ambiguity as to the origin of processed sea cucumbers for export, it would be best for all provinces to establish the same list of permissible species. Those species not on the list should not be collected, sold, purchased or exported. Fishers and processors should also understand that the list will be re-evaluated periodically species may be added or removed depending on field population surveys. Examples of species-specific prohibition can be found in the fisheries in Torres Strait (currently prohibiting fishing of Holothuria scabra, H. whitmaei and Actinopyga mauritiana) and Great Barrier Reef (currently prohibiting fishing of Holothuria whitmaei) (Kinch et al. 2008a, T. Skewes, pers. comm.). There were several species that appear to be naturally rare, at least in terms of our transect surveys, and some for which we did not find any individuals but they are reported to exist in New Caledonia. Several of these very uncommon species could be large enough and have thick enough body walls to be of interest to fishers. We believe the following should be excluded from the list of species permitted to be captured and exported: Stichopus sp. type pseudohorrens (see Figure 6a), Thelenota rubralineata (uncertain of existence in New Caledonia), Actinopyga albonigra, Actinopyga caerulea (Samyn et al. 2006; c.f. A. crassa in Guille et al. 1986), and Actinopyga flammea. Three other commercial species, Holothuria fuscogilva, Holothuria lessoni and Actinopyga lecanora, have been targeted by fishers, and population abundances appear very low from our field surveys. This evidence suggests they should be excluded from the list of species permitted to be captured and exported. Many fishers at the project s workshop also said the first of these two species appear depleted and should be prohibited. Studies by Uthicke (2004) and Uthicke et al. (2003) show that Black Teatfish Holothuria whitmaei have slow rates of recruitment and 93
99 that recovery of populations from fishing may take decades. Uthicke (2004) reported that annual catches of less than 5% of virgin biomass resulted in depleted stocks of H. whitmaei (then called H. nobilis) in the large Great Barrier Reef fishery in Queensland. Also, after populations were depleted from fishing, repeated surveys suggested poor recovery of the stocks two years after imposing a ban on fishing this species (Uthicke 2004). Some species are, therefore, rather vulnerable to over-exploitation and should be management conservatively, in ways that maintain sufficient breeding populations on reefs so populations can replenish themselves after losses from fishing. Populations of Actinopyga mauritiana, A. miliaris and Holothuria scabra also appear low to very low at most localities, but there are still a small number of dense or moderately dense breeding sub-populations. A conservative measure would be to ban fishing of these species now. Alternatively, the provinces could impose large minimum size limits on these species in particular, and monitor stocks in the coming years. At the next review of the list of permissible commercial species, these three species should be evaluated in close detail. The advantage of species-specific closures is that fishers can still collect other species. We encourage an adaptive process by which species can be added or removed depending on new information about stocks. We also recommend a conservative approach; that is, remove species from the list of those that fishers can collect if stocks appear low don t wait until stocks are very depleted. This will avoid the need for restocking, which is a very costly intervention that has its own problems of altering the natural genetic variation of populations and hurdles of research on release strategies (see Purcell 2004b). The list of species permissible for capture, sale and export could include the following 15 species: Actinopyga echinites, A. mauritiana, A. miliaris, A. palauensis, A. spinea, Bohadschia argus, B. similis, Holothuria atra, H. coluber, H. edulis, H. scabra, H. whitmaei, Stichopus chloronotus, S. herrmanni, and Thelenota ananas. 9. Fishers licensed and buyers licensed As is currently practiced, all commercial fishers must obtain a licence from the fishery services in order to sell marine animals and catch more than the recreational boat limits. This is sensible for any fishery. Moreover, it would be best to have separate permits or concessions for collecting and selling sea cucumbers in particular. This is the case in Province Nord, but not in Province Sud, where only a general fishing licence is required. The separate permits for fishing sea cucumbers would serve to better regulate the impact of fishing, since this would mean that not all fishers can harvest sea cucumbers. That is, it would limit opportunistic shifting of resources by fishers. The fishery service would also better know who is fishing this resource, which would simplify the communication of information about this fishery. It should not be unreasonable to expect payment for licences for exclusive privilege to exploit public resources, and this is a principle of the Ecosystem Approach to Fisheries (FAO 2003). Likewise, buyers, processors and exporters should be licensed for those activities. Annual permits are issued to processors in Province Nord but not currently in Province Sud (where, ironically, most processors work). In the same way as for fishers, a licence for processors and the obligation to submit logbooks would aid in the regulation and communication of the fishery. For example, those fishers or processors who do not comply with regulations (e.g. fail to submit logbooks, are caught with undersized animals, or are caught with prohibited species) could be refused a licence the following year. Although processors in Province Nord are supposed to submit logbooks each trimester, none have yet been submitted, and there is no such obligation in Province Sud and as a result, no data on quantities, species, and zones of capture. Given the value and significance of this fishery in New Caledonia, much more emphasis should be placed on obtaining and analyzing these data to provide time-series analyses of evolution in catches among the regions. 10. Limited entry restrict the number of licensed fishers About one-quarter of fishers and one quarter of processors said in interviews that they wanted to see limits on the number of fishers licensed to collect and sell sea cucumbers. In the workshop, most of the fishers said they felt there were too many fishers in the fishery. 94
100 While our data shows that stocks of some species are relatively healthy, stocks of many others appear vulnerable to being depleted if fishing effort is not reduced. We recommend that the provinces restrict the number of licences issued to fishers as a means of reducing total fishing effort. In particular, there has been an explosion of interest in fishing sea cucumbers in Province Nord in recent years and the number of special concessions for fishing them has increased dramatically. Based simply on the average population abundances of sea cucumbers, we believe the number of licences for fishing sea cucumbers should be restricted to somewhere in the order of licences in Province Sud and licences in Province Nord, best separated by region within each province. At present, both provinces issue fishing licences attributed to a boat and the name of a captain. However, there are three problems with this modality: (1) boats can then be loaded with numerous fishers, which diminishes the control on effort through restriction of the number of licences, (2) although the captain is nominated and can be contacted about fishery rules, other fishers that accompany him/her are unknown, making communication and education about fishery rules more difficult, and (3) artisanal fishers without boats are forced to collect illegally and sell their product on the black market. The third point was highlighted by some participants at the workshop as a serious limitation. We therefore encourage the provinces to consider a scheme where licences are issued to fishers, not necessarily associated with a boat, and that all those collecting sea cucumbers must be licensed not just the captain. In the project workshop, fishers recommended that reducing the number of licensed fishers could be done through inspection of annual logbooks and only renewing licences to fishers that were seriously fishing sea cucumbers; i.e. fishers regularly collecting sea cucumbers. However, we believe that this should not mean only issuing licences to fishers that intensively fish sea cucumbers, or those which only fish sea cucumbers. It will be far better for fishers to be able to harvest other resources, so that they have some resilience to changes in the markets or resource, than to encourage fishers to only exploit one resource. A different approach would be to impose the size limits, species-specific closures and reporting rules and renew licences only to those fishers that adhere to the regulations. Some fishers also suggested in the workshop that the licences should be prioritised to those with licences already and refused for persons that have salaried jobs. 11. Catch reporting and sale reporting by fishers and processors Obviously, the fishery will be best managed if the fishery services have accurate and timely data on catches. This data can show variations in CPUE and species captured over time and among locations. This should best be achieved by forcing fishers to complete logbooks of daily catches and submit them each semester or year as a condition of licence renewal. As mentioned earlier, all of the processors said they had either been in contact with, or purchased sea cucumbers from, unlicensed fishers. This makes management harder since the number of fishers is unknown and not everyone can be informed about the fishery regulations. Fishing by unlicensed fishers also undermines fishers confidence in the way in which the fishery is managed and their willingness to adhere to regulations. For example, they can start to ask why should I be restricted to catching certain sizes and reporting if others are not?. One way to reduce the incidence of unlicensed fishing is to oblige processors to complete purchase receipts provided by the fishery service each time they buy sea cucumbers. The processors should record the fisher s name and licence number and have the fisher sign the receipt. In theory, unlicensed fishers should then not be able to sell to processors. The receipts should include weights for each species of animal sold, and these measurements are generally made by the processors anyway. The provinces should be strict about the non-renewal of licences to fishers and non-renewal of buyers licences if reporting is inadequate. If all processors believe that the rules will be applied to all, then they will be more likely to refuse purchasing sea cucumber if they know that other processors cannot buy them either. 95
101 12. Set limits on boat size There is a common trend in sea cucumber fisheries in the Pacific and Indian Oceans for fishing to become more industrialized through the use of larger boats (Friedman et al. 2008). This has a three-fold impact on the fishery. Firstly, large boats can access reefs further offshore, so there are no longer distant refuges with large boats in the fishery. Secondly, larger boats have teams of fishers and can stay overnight at sea, so the fishing time and intensity per day increases dramatically compared to a couple of fishers in small boats. Thirdly, fishing companies that buy large boats are more dependant on fishing to pay the capital costs of the boat (i.e. repay bank loan) so their fishers are obligated to keep fishing even when the resource declines. This last point is important, since at least some sea cucumbers have been shown to recover slowly from intensive fishing, as discussed earlier. The fishery in New Caledonia has evolved in the past decade to include more boats of large size, i.e. > 7 m. Our data shows that these boats collect more sea cucumbers per day per fisher than the small-scale fishers of the coast (see Table 20). We believe the Province Nord and Province Sud should consider limiting the industrialization of the fishery by: 1) limiting the size of boats that can be used by any fisher to less than 7 m, or 2) issuing a special licence for boats above 7 m and limiting the number of these licences issued in the fishery to one or two boats per province. Limiting industrial-type fishing will, in turn, promote and safeguard artisanal scale fishing, which has been the norm in New Caledonia for more than 160 years. Other regulations could be imposed instead of, or in addition to the above suggestions; the key point is to limit the number of large boats with teams of fishers that spend long periods at sea. Precautionary management involves explicit consideration to avoid overdevelopment of harvesting capacity (FAO 1996). Also, promoting artisanal-type fishing, i.e. small boats and fishers collecting for short amount of time, will spread the social and economic benefits derived from fishing. This aim is advocated by the United Nations-FAO in the precautionary approach to fishing technology (FAO 1996). 13. Retain gear restrictions There are currently some restrictions in New Caledonia on the gear (equipment) that can be used by fishers to catch sea cucumbers. In both provinces, fishers are forbidden to use SCUBA or hookah gear. They are also forbidden to use torches to fish at night. We fully endorse these current regulations, and they are consistent with the Precautionary Approach to Fishery Technology (FAO 1996). Although not currently used, it would be wise to impose restrictions on other gear so that fishers are not able to start using or testing them. We recommend a regulation that sea cucumbers can only be collected by hand. This means forbidding the use of nets or dredges and spears or bombs to collect the animals. The banning of these gears will allow protection of some breeders in deep water and would prevent fishers from using gear that could be destructive to the benthos. Management issues and perspectives from stakeholders There were three management regulations, suggested by some fishers in the interviews and in the workshop that we do not recommend for this fishery. These are catch quotas (or Total Allowable Catch, or TAC ), seasonal closures and rotational closures. Catch quotas have been used in other fisheries, e.g., Northern Territory, Torres Strait and Queensland fisheries in Australia (Kinch et al. 2008a), and the national fishery in Papua New Guinea (Kinch et al. 2008b). However, they are managed only where there are few fishers and where reporting and monitoring of catches is regular (e.g. monthly). In Papua New Guinea, the catch quota for the fishery was exceeded in several years by fishers because the reporting was insufficient and there are so many fishers that it was impossible to communicate to fishers when the quotas were reached (Kinch et al. 2008b). In principle, catch quotas should be based on a reasonable estimate of the total standing stock of the resource in the fishery and a reasonable estimate of the fishing mortality that the stock 96
102 can sustain without diminishing population size. At least the first requirement is rarely known for sea cucumbers, and not yet determined for the fisheries in Province Nord and Province Sud. An even more important hurdle with quotas is determining whether they are set per person (individual quotas) or apply to the whole fishery. Having a quota for the whole fishery (a global quota), instead of individual quotas, means that industrialised fishers can catch the majority of the catch early and leave other small-scale fishers without a livelihood for the rest of the year after the quota has been reached. As agreed by all but one fisher in the workshop, the allocation and equity of individual quotas among fishers is also problematic. The provinces fisheries services also mentioned that quotas would be hard to administer, since these would require regular receipt of logbooks and entry of catch data to determine when the quota was reached. Currently, logbooks from fishers are collected just once per year in Province Nord and only very recently collected each trimester in Province Sud. Seasonal closures can be used in other types of fisheries for two purposes: (1) to prevent fishing of animals during seasons when they are more vulnerable to capture, such as when animals aggregate to spawn or move to exposed sites on reefs to spawn, and (2) to limit the amount of days in a year that fishers have to collect the animals. The first use does not apply to the vast majority of sea cucumbers, because they do not aggregate (other than in loose pairs or trios) nor move to more visible places on the reef to spawn. The second is fine, except that it deprives fishers of earning an income for some months. As shown in this study (Figure 49), many fishers rely on sea cucumbers as their primary source of income. Also, many fishers already abstain from fishing for several months of the year and our sociological surveys showed this was more prevalent in Province Nord; so de facto seasonal fishing closures already exist to varying degrees. Rotational closures are used in some well-organised fisheries where there are few fishing groups and where there are clear access rights over fishing grounds. Examples of rotational closures in sea cucumber fisheries can be found at the Great Barrier Reef in Queensland (Lowden 2005) and in western Canada (C. Hand, pers. comm.). As mentioned by many fishers in the workshop, rotational closures would be problematic for a number of reasons. The most cited problem was how to manage the surveillance of the fishing zones where there are many fishers and many of the sites are many kilometres offshore. Another commonly argued problem was the resources needed by the provinces to demarcate, and mark, the various fishing zones. It was also mentioned in the workshop that zoning for annual rotational closures would mean the fishers in a locality were all fishing in a smaller area each year, so quotas would need to be set for each zone to ensure the resource was not depleted. Another fisher mentioned that the resource would need to be monitored so that densities did not diminish, which poses a logistic and capacity requirement on the provinces to do field surveys more regularly. Lesson 20: Workshops with all stakeholders are needed to educate them about the biological or logistic constraints of different fishery regulations. In some cases, as shown with rotational fishing closures in this study, the workshop discussions can help to change the minds of fishers or other stakeholders and gain better acceptance of the management plan. 97
103 Management advice on giant clam and trochus The field surveys showed that giant clams and trochus can be found on most reefs. However, abundances of giant clams were generally quite low. In Province Sud, the positive relationship between the abundances of giant clams and the distance from the nearest boat ramp suggests that recreational and professional fishing pressure is causing a depletion of the resource. Our interpretation is that giant clams were abundant at just 3 of the 50 study sites (>5,000 ind.km -2 ; or 50 ind.ha -1 ). They were in low to moderate abundance (1,000 to 5,000 ind.km -2 ) at 60% of the study sites, and abundances were gravely low (<1000 ind.km -2 ) at 34% of sites. Comparisons with reserve sites indicate that fishing impact has depleted stocks of giant clams on one-third of the study reefs. We also observed that giant clams in long-term reserves were noticeably larger than at sites open to fishing. Given that giant clams take many years to reach sexual maturity, we believe the stocks of giant clams in New Caledonia are at risk of further depletion unless radical management measures are soon set in place to preserve abundances and sizes of breeding animals. Also, Hippopus hippopus and Tridacna derasa were uncommon and densities at our study sites were generally very low. We propose four recommendations for the management of giant clams in New Caledonia: 1. Ban the sale of giant clam meat or shells. That is, ban commercial harvesting. 2. Ban the collection of Hippopus hippopus and Tridacna derasa. The shells of these species are somewhat similar to each other, and different from other giant clams, so the identification to recreational fishers should be relatively easy. 3. If a complete ban on recreational capture is not possible (e.g., socially unacceptable), then at least restrict recreational harvesting to one animal (of Tridacna maxima or T. squamosa) per boat, or per person if fishers are accessing from the shore. 4. Set minimum size limits on T. maxima and T. squamosa that can be collected recreationally. The size limits should consider published results on size at first maturity and the fact that fishers will cut the meat out of the shell. We consider trochus (Trochus niloticus) to be moderately abundant to abundant at many sites. They existed at densities greater than 50 ind.ha -1 on the reef crest habitat at one-fifth of the study sites. Purcell (2004a) proposed this density as a guiding threshold below which breeding animals may not reproduce successfully and should not be fished. Thus, there appears to be a number of relatively healthy breeding populations, particularly in Province Sud. We believe that fishing can continue under the current management using minimum size limits, so long as catches and exports are inspected to ensure that fishers comply with the regulations. 98
104 6. CONCLUSIONS The sea cucumber fisheries in Province Nord and Province Sud are multi-species in nature. The resource needs fisheries management plans that consider the perpetuity of each species in the context of metapopulation structure of stocks. The project s field surveys showed that the community composition varied greatly among reef sites and that sea cucumbers were not abundant at all reef sites. Resource managers should seek to ensure that there are at least some sites in each region around la Grande Terre that have dense breeding populations. These populations can act as source sites for neighbouring reefs where abundances may be low. There were few study sites where valuable sea cucumbers were very abundant. Some commercial species were quite infrequent in our field surveys and are sought after by processors. Our study suggests that populations of Holothuria fuscogilva, Holothuria lessoni and Actinopyga lecanora are too low to support further exploitation, and should be closed to fishing. Twenty years ago, Conand (1989) noted that H. fuscogilva was found in all regions of New Caledonia and 6 19% of sites within regions, but we did not find it at study sites in the far south or at sites near Nouméa. Populations of Actinopyga mauritiana, A. miliaris and Holothuria scabra appear low and will need to be managed prudently to safeguard stocks from dwindling to levels where they cannot easily be repopulated naturally. Giant clams were low in abundance at many sites, and populations of two species can be considered depleted to gravely low levels. In the Philippines, uncontrolled fishing caused giant clams to virtually disappear from many regions forcing public agencies to invest in costly restocking (Gomez and Mingoa-Licuanan 2006). Strict and urgent management regulations are needed to safeguard these stocks from collapse on la Grande Terre. In comparison, stocks of Trochus niloticus were healthy at a number of sites, and can probably still sustain fishing under prudent management. Our field surveys and fishery-dependent surveys show that at least 17 species of sea cucumber are collected by fishers and about 10 to 12 of these are collected commonly. The species of high value are sought after by processors, but at least Holothuria fuscogilva and H. lessoni were not well represented in the landings of fishers. This tends to suggest that stocks of these two species are depleted, in line with results from our field studies. The fishers are generally older men, but some women also collect sea cucumbers. Many fishers who collect sea cucumbers, particularly those in the north-west and near Nouméa, rely on fishing sea cucumbers as their principal source of income. Most fishers want to see new management regulations, and most are in favour of minimum legal size limits. A critical problem is unlicensed fishers collecting sea cucumbers opportunistically, and this issue must be addressed by the fishery services as a matter of priority. Fishers in areas remote to processors tend to do boiling and drying of sea cucumbers themselves. This means they spend more time on the value-adding of the product and forego some time fishing in order to do processing. Training in processing is most needed in such cases. Also, this means that fishers near to processing centres are likely to sell fresh animals more often to processors, so they need to fish more intensely because they do not earn money from the processing activity. Some animals are collected at a small size, near or below the size at first maturity estimated by Conand (1989, 1993b). This means there is some recruitment overfishing. Size limits must be large enough to protect animals to maturity and allow them at least another year to contribute to spawning. The taking of small animals was more evident in the remote north, so more education of fishers by fishery officers is needed there. Sea cucumber stocks in Province Sud seem, at present, more impacted by fishing than in Province Nord. This conclusion comes from field surveys, landing surveys, and questionnaire-based interviews with fishers. Field surveys showed low population abundances of some species. Landing surveys showed that some small individuals are taken. Many Actinopyga mauritiana and Thelenota ananas harvested by fishers from sites near Nouméa were near or below the size at first maturity (W 90 ). Our socio-economic surveys showed that most fishers have switched species recently due to changes in the resource. Two-thirds of fishers in Province Sud believe that stocks have declined recently or are depleted. However, fishing effort of these fishers is often greater than fishers in Province Nord. That is, the belief that stocks have declined has not prompted fishers to harvest less per day or fish less per year. Moreover, many fishers in Province Sud are now harvesting low-value species, as shown in 99
105 landings and interviews. These trends are all indicators of a major shift in the resource (see Friedman et al. 2008). Conservative management regulations are therefore urgently needed in Province Sud. Some species, namely Holothuria fuscogilva and Actinopyga mauritiana, seem overfished at the Chesterfield Reefs, based on landed body sizes. Sizes of captured Thelenota ananas are also fairly small. Fishers are now collecting a significant proportion of small individuals that are either recently mature or immature. We believe the Chesterfield Reefs should be closed to fishing sea cucumbers. The Surprise Islands appear to still have large animals, compared to those caught from la Grande Terre. Stocks there may still be relatively healthy, but population surveys should be conducted to have some baseline estimates of population abundance. We propose a suite of management actions and management regulations that we believe can be employed with the current resources of the provinces and will be respected generally by fishers. The 13 key recommendations consist of actions that should be undertaken by the fisheries service as well as regulations that should be imposed on fishers. The management actions include (1) educating and communicating with fishers, (2) separating export records by species, (3) helping fishers to be better trained in processing sea cucumbers, (4) planning the frequency of inspections of catches and enforcing the regulations strictly, and (5) developing a plan for monitoring sea cucumber stocks through landing surveys, interviews with fishers and in-water field surveys. The further recommendations for fishery regulations are to (6) establish many more reserves for protecting breeding populations, (7) set minimum legal size limits on dried and fresh animals, (8) establish a list of species permitted to be caught, sold and exported, (9) license fishers to collect sea cucumbers specifically, (10) limit the number of licences issued to fishers, (11) demand that fishers report their catches in a logbook and that buyers report sales signed by fishers, (12) limit the number of large boats in the fishery (i.e. capacity limitation), and (13) continue to limit the gear that can be used to collect sea cucumbers and also limit the future use of new fishing gears. The key pieces of advice after these specific points are to develop a new management plan as soon as possible even if it is not perfect, and adapt the management plan over time through feedback from the social-ecological system. We believe that the sea cucumber fisheries in Province Nord and Province Sud are in a relatively uncommon position that stocks are not yet at levels where the entire fishery needs to be closed for many years. Severe stock depletion of valuable species is the current position in many of New Caledonia s neighbouring countries. Sea cucumber stocks in New Caledonia are no less vulnerable to overfishing than those of its neighbours. They have been buffered from overfishing by the large areas of habitat provided by New Caledonia s immense lagoon and reef system, but increased number of fishers in recent years will quickly overcome the buffer of scale. The perpetuity of these resources relies now on swift and conservative fishery regulations and vigilant efforts by the fisheries services of the provinces to communicate regularly with fishers and monitor the evolution of the resource. 100
106 7. REFERENCES Allee WC The social life of animals. WW Norton & Company, INC. Andrew NL, Béné C, Hall SJ, Allison EH, Heck S, Ratner BD Diagnosis and management of small-scale fisheries in developing countries. Fish and Fisheries 8: Battaglene SC, Bell JD The restocking of sea cucumbers in the Pacific Islands. In: Bartley DM, Leber KL (Eds.), Case Studies in Marine Ranching. FAO Fisheries Technical Paper 429: Bell JD, Purcell SW, Nash WJ Restoring small-scale fisheries for tropical sea cucumbers. Ocean and Coastal Management 51: Bubb DH, Lucas MC, Thom TJ, Rycroft P The potential use of PIT telemetry for identifying and tracking crayfish in their natural environment. Hydrobiologia 483: Clouse RM Burying behaviour in an Indo-Pacific sea cucumber, Bohadschia marmorata: a circadian, not circatidal rhythm. Micronesica 30(2): Conand C Reproductive cycle and biometric relations of Actinopyga echinites (Echinodermata: Holothuroidea) from the lagoon of New Caledonia, western tropical Pacific. International Echinoderms Conference, Tampa Bay. Lawrence JM (ed.): Conand C Les holothuries Aspidochirotes du lagon de Nouvelle Calédonie: biologie, écologie et exploitation. Etudes et thèses. Editions de l ORSTOM Paris, 393 p. Conand C The fishery resources of Pacific island countries. Part 2: Holothurians. FAO Fisheries Technical Paper 272.2, Rome. Conand C. 1993a. Ecology and reproductive biology of Stichopus variegatus an Indo-Pacific coral reef sea cucumber (Echinodermata: Holothuroidea). Bulletin of Marine Science 52(3): Conand C. 1993b. Reproductive biology of the holothurians from the major communities of the New Caledonian lagoon. Marine Biology 116: Conand C, Uthicke S, Hoareau T Sexual and asexual reproduction of the holothurian Stichopus chloronotus (Echinodermata): a comparison between La Réunion (Indian Ocean) and east Australia (Pacific Ocean). Invertebrate Reproduction and Development 41: FAO Precautionary approach to capture fisheries and species introductions. FAO Technical Guidelines for Responsible Fisheries. No. 2. FAO, Rome. 54 p. FAO The ecosystem approach to fisheries. FAO Technical Guidelines for Responsible Fisheries. No. 4. Suppl. 2. FAO, Rome. 112 p. FAO. Technical guidelines for management of sea cucumber fisheries. FAO, Rome (in preparation). Friedman K, Purcell S, Bell J, Hair C Sea cucumber fisheries: A manager s toolbox. ACIAR Monograph No. 135, Australian Centre for International Agricultural Research, Canberra. 32 p. Gascoigne J, Lipcius RN Allee effects in marine systems. Marine Ecology Progress Series 269: Gomez ED, Mingoa-Licuanan SS Achievements and lessons learned in restocking giant clams in the Philippines. Fisheries Research 80(1): Graham JC, Battaglene SC Periodic movement and sheltering behaviour of Actinopyga mauritiana (Holothuroidea: Aspidochirotidae) in Solomon Islands. SPC Bêche-de-mer Information Bulletin 19: Guille A, Laboute P, Menou J-L Guide des étoiles de mer, oursins et autres échinodermes du lagon de Nouvelle Calédonie. Editions de l ORSTOM Paris 25, 238 p. Hasan MH Destruction of a Holothuria scabra population by overfishing at Abu Rhamada Island in the Red Sea. Marine Environmental Research 60: Kinch J, Purcell S, Uthicke S, Friedman K. 2008a. Population status, fisheries and trade of commercially important sea cucumbers in the Western Central Pacific. In: Toral-Granda V., 101
107 Lovatelli A., Vasconcellos M. (eds.) Sea cucumbers. A global review on fisheries and trade. FAO Fisheries and Aquaculture Technical Paper. No Rome, FAO. pp Kinch J, Purcell S, Uthicke S, Friedman K. 2008b. Papua New Guinea: a hot spot of sea cucumber fisheries in the Western Central Pacific. In: Toral-Granda V., Lovatelli A., Vasconcellos M. (eds.) Sea cucumbers. A global review on fisheries and trade. FAO Fisheries Technical Paper. No. 516: Kronen M, Stacey N, Holland P, Magron F, Power M Socioeconomic Fisheries Surveys in Pacific Islands: a manual for the collection of a minimum dataset. Reef Fisheries Observatory, PROCfish/C and Cofish Programme. Secretariat of the Pacific Community. Lawrence AJ, Ahmed M, Hanafy M, Gabr H, Ibrahim A, Gab-Alla AA-FA Status of the sea cucumber fishery in the Red sea the Egyptian experience. Advances in sea cucumber aquaculture and management. FAO Fisheries Technical Paper 463: Leeworthy G, Skewes T The hip-chain transect method for underwater visual census (UVC). SPC Bêche-de-mer Information Bulletin 26: 5-6. Lovatelli A, Conand C, Purcell S, Uthicke S, Hamel J-F, Mercier A Advances in sea cucumber aquaculture and management. FAO, Rome. Lowden R Management of Queensland sea cucumber stocks by rotational zoning. SPC Bêchede-mer Information Bulletin 22: 47. Massin C, Doumen C Distribution and feeding of epibenthic holothuroids on the reef flat of Laing Island (Papua New Guinea). Marine Ecology Progress Series 31: Massin C, Uthicke S, Purcell SW, Rowe FWE, Samyn Y Taxonomy of the heavily exploited Indo-Pacific sandfish complex (Echinodermata: Holothuriidae). Zoological Journal of the Linnean Society 155: Mercier A, Battaglene SC, Hamel J-F Daily burrowing cycle and feeding activity of juvenile sea cucumbers Holothuria scabra in response to environmental factors. Journal of Experimental Marine Biology and Ecology 239: Ombredane D, Baglinière JL, Marchand F The effects of Passive Integrated Transponder tags on survival and growth of juvenile brown trout (Salmo trutta L.) and their use for studying movement in a small river. Hydrobiologia 371/372: Purcell SW 2004a. Management options for restocked Trochus fisheries. In: Stock enhancement and sea ranching: developments, pitfalls and opportunities. Leber KM, Kitada S, Blankenship HL, Svåsand T (eds): Purcell SW. 2004b. Criteria for release strategies and evaluating the restocking of sea cucumbers. Advances in sea cucumber aquaculture and management. FAO Fisheries Technical Paper 463: Purcell SW, Blockmans BF, Nash WJ Efficacy of chemical markers and physical tags for largescale release of an exploited holothurian. Journal of Experimental Marine Biology and Ecology 334(2): Purcell SW, Kirby DS Restocking the sea cucumber Holothuria scabra: sizing no-take zones through individual-based movement modelling. Fisheries Research 80: Reichenbach N Ecology and fishery biology of Holothuria fuscogilva (Echinodermata: Holothuroidea) in the Maldives, Indian ocean. Bulletin of Marine Science 64: Samyn Y, Vandenspiegel D, Massin C A new Indo-West Pacific species of Actinopyga (Holothuroidea: Aspidochirotida: Holothuriidae). Zootaxa 1138: Shiell GR, Knott B Diurnal observations of sheltering behaviour in the coral reef sea cucumber Holothuria whitmaei. Fisheries Research 91: Skewes T, Smith L, Dennis D, Rawlinson N, Donovan A, Ellis N Conversion ratios for commercial bêche-de-mer species in Torres Strait. Australian Fisheries Management Authority Torres Strait Research Program Final Report. Skov C, Brodersen J, Brönmark C, Hansson L-A, Hertonsson P, Nilsson PA Evaluation of PITtagging in cyprinids. Journal of Fish Biology 67:
108 Stephens PA, Sutherland WJ, Freckleton RP What is the Allee effect? Oikos 87(1): Uthicke S Seasonality of asexual reproduction in Holothuria (Halodeima) atra, H. (H.) edulis and Stichopus chloronotus (Holothuroidea: Aspidochirotida) on the Great Barrier Reef. Marine Biology 129: Uthicke S. 2001a. Influence of asexual reproduction on the structure and dynamics of Holothuria (Halodeima) atra and Stichopus chloronotus populations of the Great Barrier Reef. Marine and Freshwater Research 52: Uthicke S. 2001b. Interactions between sediment-feeders and microalgae on coral reefs: grazing losses versus production enhancement. Marine Ecology Progress Series 210: Uthicke S. 2001c. Nutrient regeneration by abundant coral reef holothurians. Journal of Experimental Marine Biology and Ecology 265: Uthicke S Overfishing of holothurians: lessons from the Great Barrier Reef. Advances in sea cucumber aquaculture and management. FAO Fisheries Technical Paper 463: Uthicke S, Purcell S Preservation of genetic diversity in restocking of the sea cucumber Holothuria scabra investigated by allozyme analysis. Canadian Journal of Fisheries and Aquatic Sciences 61: Uthicke S, Welch D, Benzie JAH Slow growth and lack of recovery in overfished holothurians on the Great Barrier Reef: evidence from DNA fingerprints and repeated large-scale surveys. Conservation Biology 18: Wolkenhauer SM Burying and feeding activity of adult Holothuria scabra (Echinodermata: Holothuroidea) in a controlled environment. SPC Bêche-de-mer Information Bulletin 27: Woods CM Evaluation of VI-alpha and PIT-tagging of the seahorse Hippocampus abdominalis. Aquaculture International 13: Woods CM, James PJ Evaluation of passive integrated transponder tags for individually identifying the sea urchin Evechinus chloroticus (Valenciennes). Aquaculture Research 36:
109 104
110 APPENDIX A DATA SHEETS FOR FIELD SURVEYS 105
111 Species measurements Date: Site: Observer: H T # l w wt l w wt l w wt l w wt l w wt l w wt l w wt l w wt l w wt l w wt H = habitat T# = transect number l = length w = width wt = weight
112 Boat Data Sheet Location Date Wind Cloud Comments Observer Tow No Manta Observer Time Habitat (SL, C, RF, P, L) Begin position End Position Lat. S Long. E Lat. S Long. E Way points Tow length Tow Speed Mean Trnsct depth
113 108
114 Appendix B (English translation of French questionnaire) WorldFish Sea Cucumber Fisher Questionnaire New Caledonia Interviewer: Date: / / Time start: Fisher name: Gender: female: male: age: Town/place of residence: Type and location of fishing 1. Do you only fish commercially for sea cucumbers or do you also fish other resources? Only sea cucumbers : Other resources too: If other resources too, which ones? Giant clams: Fish: Trochus: Crayfish (Spiny lobster): Octopus: Crab: Other: Now we are only asking about sea cucumbers: 2. What type of fishing do you do for sea cucumbers? Diving: Gleaning by wading in shallow water: Netting or harpooning from boat: 3. On which reefs have you mostly fished sea cucumbers in the past year (show chart)? 4. What parts of the reef do you collect sea cucumbers? Reef flat: Slope: Crest: Passes or deep water: On sandy areas in the lagoon: Other: 109
115 The catch 5. Which species and sizes of sea cucumbers do you mostly collect? Size class H. scabra (gris): A. palauensis (La noire): H. lessoni (mouton): A. mauritiana (Mauritiana): H. coluber (SnakeFish): A. lecanora: H. edulis (PinkFish): S. chloronotus (Ananas vert): H. atra (LollyFish): S. herrmanni (La curry): H. whitmaei (Tété noir): S. horrens: H. fuscogilva (Tété blanc): T. ananas (Ananas): H. fuscopunctata (L éléphant): T. anax: A. echinites (La Rouge): B. argus (Léopard): A. spinea (Noir long): B. similis: A. miliaris (La Boule): P. graeffei: Size class Fishing effort 6. Over the past year, how many days would you have fished each week, on average? Days/week 7. Were there some months that you didn t fish, and if so how many? Mo/y not fishing If you didn t fish some months, why? 8. Are your fishing trips longer than just one day? Yes No If yes, how many days per fishing campaign? 9. How do you get to the fishing site? Days/campaign: Walking: Car: Own boat: Someone else s boat: If someone else s boat, do you pay them for taking you there? No: Yes: CFP/trip. 10. Now we just want to know about your transport time. On your fishing trips, how many hours are spent to get to and from the fishing sites; i.e. not including the fishing time? hours. 11. During your fishing days, how many hours per day would you spend in the water collecting sea cucumbers? hours. 12. On a normal day during the past year, how many people would you fish sea cucumbers with? Are all of them fishing too? Yes No number fishing 13. During the past year, what weight of fresh sea cucumbers would you normally catch on average per day? kg. Is this gutted weight? Yes No 110
116 Processing 14. Do you gut the sea cucumbers? Yes: No: If yes, when? Immediately: After returning to land: 15. Do you boil the sea cucumbers you collect? Yes: No: 16. Do you salt them? Yes: No: 17. Do you boil and dry them? All the time: Most of the time: Only sometimes: Never: 18. Do you eat sea cucumbers: Often Sometimes Rarely Never Economic importance 19. Can you rank which sources of income you get most of your money from and which you get less money from? 1 is most important Agriculture: Salary: Small artisanal business: Fishing sea cucumbers: Fishing other resources: Government support (indemnités): Money given from family members: Other: 20. Are you satisfied with the income you get from sea cucumber fishing? Very Mostly Not very No 21. Do you have any impediments to selling the sea cucumbers you catch? No Yes If yes: Limited buyers Transport problems Other 22. If you could no longer fish sea cucumbers (for example, the stocks disappear or fishing is forbidden), which source of income above do you think would become most important? 111
117 Fishing history 23. For how many years have you been fishing sea cucumbers? years. 24. In the first years when you started fishing sea cucumbers, did you collect the same species that you collect now, or were they different species? Same: Different: If different, why? Resource change Market Other 25. In the past, were you fishing different areas? No: Yes: (sites). If yes, why? Resource change Access to site Other 26. What do you think about the status of sea cucumber stocks in New Caledonia? Increasing Stable Declining Badly depleted If declining or depleted, why do you think so? Stocks declining as a natural change Change in fishing strategies/gear Too much broodstock fished out in past Too many fishers now Pollution from mines Pollution from cities or other human influences Other: 27. Did you used to catch more sea cucumbers per day? Yes: No: If yes, what weight of sea cucumbers could you catch on a good day? kg. 28. What was the average weight of sea cucumbers you used to catch per day? kg. How many years ago was that? years. Management 29. Are there customary (village-imposed) management regulations in your fishing zone? Yes: No: If yes, which one or ones? Seasons of prohibited fishing Area closures for a year or years Access rights to certain areas for certain fishers Minimum size limit Prohibited species 112
118 30. Are you aware of the fishing regulations for sea cucumbers in your Province? Yes: No: 31. Do you think the current regulations are good? Yes: No: 32. Do you think the current regulations are respected by most fishers? Yes: No: If no, what regulations are infringed? Reserves Size limits Seasons Unlicensed 33. What fishery regulations do you think would be good for the sea cucumber fishery here? Size limits: fresh: dried: Reserves or No-Take Zones Seasons or ban fishing for part of year Rotational closures (e.g. allow fishing on each reef every 4 years) Restrict number of fishers Prohibit fishing of some species Annual quota (total wt that can be fished in a province) Limit the gear used e.g. no SCUBA Limit the size of boat that can be used Prohibit night fishing Moratorium (ban) on fishing Others: 34. Who do you think should enforce the regulations? Province: Commune: Tribu: Fishers: 35. Would you like to participate in a workshop with us in Noumea early next year to develop fishery management for sea cucumbers in New Caledonia? Yes: No: Additional information: Time finished: 113
119 114
120 Appendix C (English translation of French questionnaire) WorldFish Sea Cucumber Processor Questionnaire New Caledonia Interviewer: Date: / / Time start: Processor Name: female: male: age: Town/place of residence: Purchase 1. For how many years have you been processing sea cucumbers? 2. Do you own a boat used by fishermen to collect for sea cucumbers? Yes: No: 3. Do you (personally) dive to collect sea cucumbers? Often: Sometimes: Never: 4. What regions do the sea cucumbers you process come from? NE (Touho - Balabio) Belep NW (Koné - Poum) Surprise CW (Moindo - Franco) Chesterfields SW (Ile Ouen - Ouano) Ouvéa SE (Yaté Canala) Lifou Ile des Pins Mare Other 5. Do all the fishers from whom you buy sea cucumbers have a license? Yes: Unsure: No: 6. Can you rank, in order of number of individuals (1 = most), the form of sea cucumbers you buy? Dried Gutted and Salted Fresh and gutted Fresh whole 7. Over the past year, from how many fishermen would you have bought sea cucumbers? 8. Are there any common problems you experience with the sea cucumbers you buy? None Some too small Damaged Not well preserved or salted Not the species you want 115
121 9. Do you offer higher prices to fishers for the larger individuals for any species? Yes: No: If yes, which species? 10. Do you reject small or undersized sea cucumbers? Always: Sometimes: Never: 11. Do you reject damaged sea cucumbers? Yes: Sometimes: No: 12. Do you have set prices for each species of sea cucumber you buy? Yes: No: 13. What price per kg do you give to fishers for the main species you process? (If No to previous question, can they give average for each species?) Species Grade Price (CFP/kg) Form Fresh Salted Dried Which two species do you seek most from fishers? / 15. Which species do you export most? 16. Which species do you export second most? 116
122 Export 17. Do you export beche-de-mer yourself? (i.e. You are the one to ship out of New Caledonia?) Yes, always: Sometimes: Never: If yes, where do export to? If sometimes or never, where are the buyer(s) from? 18. What form do you export sea cucumbers? Dried (bêche-de-mer) Frozen Salted 19. Can you indicate the average price that you sell (export) the following species for? CFP/kg State Dried Salted A. miliaris A. palauensis A. spinea A. echinites A. mauritiana H. scabra H. lessoni H. fuscogilva H. whitmaei S. herrmanni S. chloronotus T. ananas 20. Do you sometimes sell to a different exporter from N.C.? Yes: No: 21. How would you compare the size of sea cucumbers you process now to those 5 years ago? Smaller now: Same size: Larger now: 117
123 Management 22. Are you aware of the minimum legal sizes for sea cucumbers in your Province? Yes: No: 23. Do you think the current size limits are good? Yes: No: 24. Do you think the current regulations are respected by most fishers? Yes: No: If no, what regulations are infringed? Reserves Size limits Seasons Unlicensed 25. What fishery regulations do you think would be good for the sea cucumber fishery here? Size limits: Fresh: Dried: Reserves or No-Take Zones Seasons or ban fishing for part of year Rotational closures (e.g. allow fishing on each reef every 4 years) Restrict number of fishers Prohibit fishing of some species Annual quota (total wt that can be fished in a province) Limit the gear used e.g. no SCUBA Limit the size of boat that can be used Prohibit night fishing Moratorium (ban) on fishing Others: 26. Would you like to participate in a workshop with us in Noumea early next year to develop fishery management for sea cucumbers in New Caledonia? Yes: No: Additional information: Time finished: 118
124 LANDING CATCH SURVEY DATASHEET Date: Fisher name: Recorder: Collection sites or area: Number of fishers: Total catch (kg): Hrs spent fishing: Hrs diving/day: Hrs spent travelling to site: Form of product: Fresh: Salted: Dried: Gutted: Species Est:kg of catch Measurment Wt. Wid Len Wt. Wid Len Wt. Wid Len Wt. Wid Len Wt. Wid Len Wt. Wid Len Wt. Wid Len Ind 1 Ind 2 Ind 3 Ind 4 Ind 5 Ind 6 Ind 7 Ind 8 Ind 9 Ind10 Ind11 Ind12 Ind13 Ind14 Ind15 Ind16 Ind17 Ind18 Ind19 Ind20 Ind21 Ind22 Ind23 Ind24 Ind25 Len = Length (cm ±0.5 cm) Wid = width (cm ±0.5 cm) Wt. = weight (grams) Comments: 119


125 Guide d utilisation de la feuille de débarquement Voici quelques précisions ainsi que quelques conseils utiles sur la façon de remplir ce tableau. C est à vous de remplir ce tableau et non aux pêcheurs. N oubliez pas que ce document complété pourra aider votre pêcherie! 1. Le matériel : un crayon de papier foncé (2B à 4B), une gomme, une règle de 50 cm et une balance pesant jusqu à 5 kg si possible. Si vous pouvez, pensez à prendre une carte marine de la région. 2. Notez les informations clairement. 3. Le nom du pêcheur : si vous n arrivez pas à le savoir ou que vous oubliez de le mettre, mettez le nom du village ou de l endroit ou la personne exerce. 4. La zone de pêche : Essayez d obtenir le nom du récif (par ex. «Récif N Digoro») ou au moins le nom de la zone même si elle est un peu étendue : par ex. «zone de Bourail». 5. Nombre de pêcheurs : il correspond au nombre de personnes ayant collectées les holothuries, celles restées à bord ne comptent pas. Sachez tourner la question de façon à ce qu il n y ait pas d ambigüité à ce sujet (cela vous permettra de calculer la prise par unité d effort). 6. La durée de la pêche : elle correspond à la durée de la campagne de pêche, donc l unité sera la journée de pêche sauf si la campagne est de 1 journée, alors il faudra que cette durée soit égale au temps passé à collecter plus le temps de trajet. 7. Les espèces : il faut impérativement que ce soit des noms scientifiques: ex A. miliaris pour Actinopyga miliaris et non «noir boule». En effet, les noms communs sont différents selon les localités. De plus, le même nom commun est parfois utilisé pour plusieurs espèces bien distinctes. 8. La composition : elle peut être de deux formes : soit vous indiquez une quantité en Kg pour chaque espèce (si le professionnel ne peut vous donner le renseignement faute de connaissance et de différenciation des espèces, c est à vous d estimer cette quantité). Essayez de ne pas revenir de cette «enquête» avec des «trous» dans votre formulaire. L autre solution est d estimer la quantité par espèce en pourcentage par rapport à la prise totale. Dans ce cas, pensez que la totalité de votre ligne doit forcément faire 100% et qu il vous reviendra, peut être, d estimer la prise totale. 9. Les mesures : Pour que votre échantillonnage soit correct il vous faut prendre la longueur et la largeur ou la longueur et le poids (si les animaux sont trop abîmés par l éviscération) mais le mieux c est encore les trois. Lorsque vous mesurez une holothurie, vous devez prendre la mesure dans le milieu de la face ventrale. Pour la largeur, si l animal est éviscéré/vidé, essayez de reconstituer sa forme originelle pour ne pas fausser la mesure. Faites une mesure à 0.5 cm prêt. Enfin, essayez de mesurer entre 10 et 20 individus de chaque espèce (si la prise le permet). Actinopyga mauritiana Face dorsale (ci-dessus) et face ventrale (ci-dessous). Points de mesure Points de mesure de la longueur Mesure de la longueur chez H. fuscogilva 120
126 APPENDIX E STUDY SITES WITH TRANSECT POSITIONS Legend for transects on aerial/satellite photos Symbol of beginning or end of transect Crest transect Front slope transect Reef flat transect Lagoon transect Pass or deep substrata transect Scale Coordinates of site Altitude of aerial/satellite photo 121


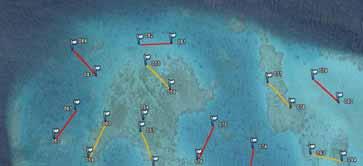

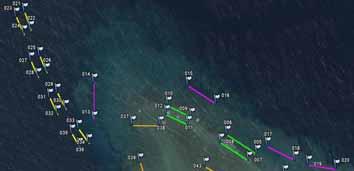
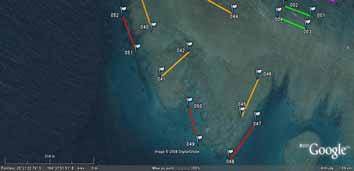
127 Récif Balabio PN Récif Thaavaam PN Récif d Amos PN Passe de Pouébo PN 122


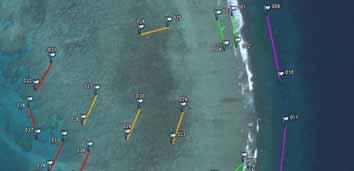

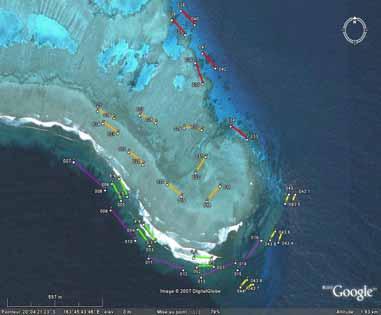
128 Ilot Hiengu PN Ilot Ouao PN Passe de Touho PN Passe de Yandé PN 123


129 Ilot Yandé PN Ilot Neba PN Passe de Poum PN Plateau de l Infernet PN 124


130 Passe de Koumac PN Plateau de Karembé PN Récif de Kendec PN Coupée de l Alliance PN 125


131 Plateau des Massacres PN Passe du Durock PN Plateau de Koniène N.O. PN Plateau de Koniène Sud PN 126


132 Passe de Koné PN Ilot Grimault PN Passe de Muéo PN Passe de Poya N.O. PN 127


133 Passe de Poya Sud PN Passe de Ouarai récif N Digoro PS Ilot Konduyo PS Grand Récif Extérieur N.W. PS 128


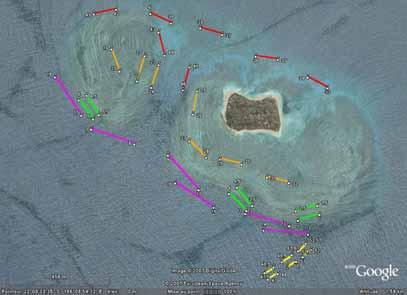
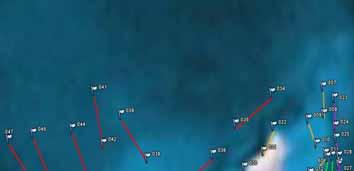
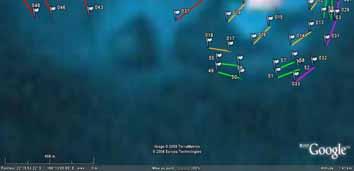
134 Ilot Isié PS Récif Tetembia PS Ilot Goldfields PS Ilot M bé Kouen PS 129


135 Récif M Béré PS Ilot Maître PS Grand Récif Aboré N.O. PS Quatre bancs du Nord PS 130


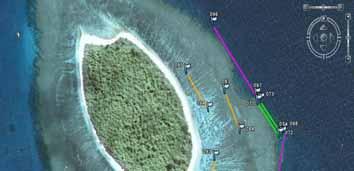

136 Récif Snark PS Grand Récif Aboré S. PS Récif Tote ` PS Ilot Uaterembi PS 131


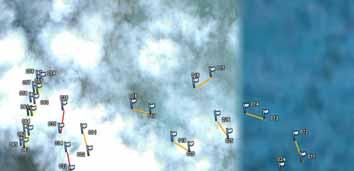
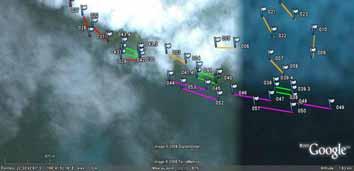
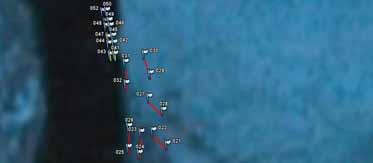
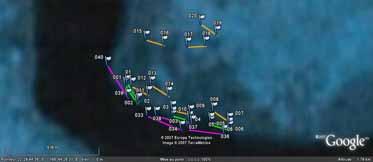
137 Ilot Ua PS Ilot Gi PS Récif U PS Récif Niagi N.O. PS 132


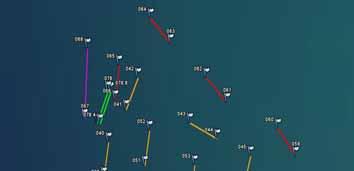
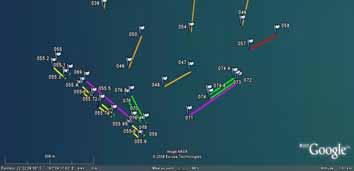
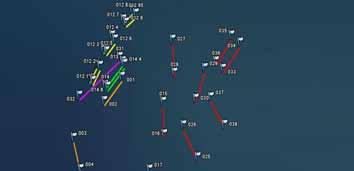
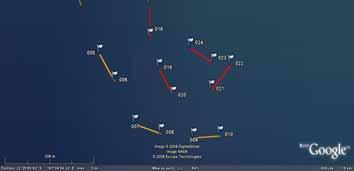
138 Récif Niagi Sud PS Récif Cap Prince de Galles PS Récif Komekamé PS Récif Ua PS 133


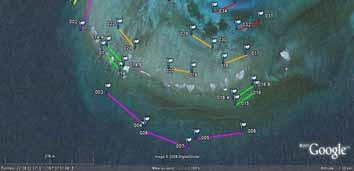
139 Récif Oema PS Récif Gunoma PS 134
Use of hatcheries to increase production of sea cucumbers
 Secretariat of the Pacific Community 6 th SPC Heads of Fisheries Meeting (9 13 February 2009, Noumea, New Caledonia) Background Paper 4 Original: English Use of hatcheries to increase production of sea
DISTRIBUTION AND ABUNDANCE OF COMMERCIAL BECHE-DE-MER ON TORRES STRAIT. B.G. Long. Tim Skewes. June 1997 REPORT MR-GIS 97/6
 DISTRIBUTION AND ABUNDANCE OF COMMERCIAL BECHE-DE-MER ON TORRES STRAIT B.G. Long Tim Skewes June 1997 REPORT MR-GIS 97/6 TORRES STRAIT BECHE-DE-MER 2 Introduction Beche-de-mer is once again an important
Comanaging small-scale sea cucumber fisheries in New Caledonia and Vanuatu using stock biomass estimates to set spatial catch quotas
 Environmental Conservation 40 (4): 367 379 C Foundation for Environmental Conservation 2013 Comanaging small-scale sea cucumber fisheries in New Caledonia and Vanuatu using stock biomass estimates to set
BICHLAMAR PROJECT Sea Cucumber Stock Assessment in Vanuatu
 BICHLAMAR PROJECT 2011-2012 Sea Cucumber Stock Assessment in Vanuatu Final Report March 2012 Jayven HAM, Marc LEOPOLD, Pascal DUMAS Vanuatu Fisheries Department PMB 9045 Port Vila, Vanuatu TABLE OF CONTENTS
Field Protocol for Monitoring Coral Reef Fisheries Resources in Belize
 Field Protocol for Monitoring Coral Reef Fisheries Resources in Belize Charles A. Acosta, PhD Wildlife Conservation Society Glover s Reef Marine Research Station P.O. Box 272 Dangriga, Belize and Department
BECHE DE-MER NEWS. Beche-de-mer species of commercial value - an update. Page 2 SPC Beche-de-mer Information Bulletin # 2 November 1990
 Page 2 SPC Beche-de-mer Information Bulletin # 2 November 199 BECHE DE-MER NEWS Beche-de-mer species of commercial value - an update Of the 1,2 species of holothurians, only a few species, mostly of the
Torres Strait Hand Collectables, 2009 survey: Sea cucumber
 Torres Strait Hand Collectables, 2009 survey: Sea cucumber Wealth from Oceans Flagship FINAL REPORT March 2010 Tim Skewes Nicole Murphy Ian McLeod Elliot Dovers Charis Burridge Wayne Rochester ii ACKNOWLEDGEMENTS
Improvements in bêche-de-mer fishery through sustainable harvesting in Fiji Islands: An overview
 Improvements in bêche-de-mer fishery through sustainable harvesting in Fiji Islands: An overview RoveenaVandanaChand 1, Ravinesh Ram 2 and Paul C. Southgate 2 1. School of Biological and Chemical Sciences,
Glossary. Beche-de-mer
 73 Glossary Beche-de-mer Capacity (capacity in management institution) Decision control rules Depleted stock Ecosystem Effort Exploitation Fishery Fishing meaning spade of the sea, this term refers to
Marine Invertebrates of the South Pacific: An Examination of the Trade
 Marine Invertebrates of the South Pacific: An Examination of the Trade A TRAFFIC Network report October 1995 Summary Given that aquatic habitat far exceeds land mass in the South Pacific, marine species
Citizen Science Based Survey GBR Far North Dive Trip 2016 April 18-26
 Citizen Science Based Survey GBR Far North Dive Trip 2016 April 18-26 Chris Roelfsema Karen Johnson Douglas Stetner Trevor Baerenger Peran Brady May 2016 GBR Far North Citizen Science Trip 5 May 2016 1
Jontila: Actinopyga spinea in Palawan. Research Notes
 Research Notes Possible occurrence of the sea cucumber Actinopyga spinea (Cherbonnier 1980) in Arreceffi Island, Honda Bay, Puerto Princesa City, Palawan, Philippines Jean Beth S. Jontila College of Fisheries
Tracking Juvenile Summer Flounder
 Tracking Juvenile Summer Flounder East Coast MARE Materials For the leader: Whiteboard Markers (different colors) For each group: Copies of student group packets Copies of student worksheet Overview Scientists
The importance of giant clam fisheries management and trade to the Pacific
 The importance of giant clam fisheries management and trade to the Pacific Regional Management of Sustainable Fisheries for Giant Clams (Tridacnidae) and CITES Capacity Building Workshop Nadi, Fiji Islands
The status of the sea cucumber fishery in Batiki District, Lomaiviti, Fiji
 8 SPC Beche-de-mer Information Bulletin #34 May 2014 The status of the sea cucumber fishery in Batiki District, Lomaiviti, Fiji Abstract Watisoni Lalavanua 1, *, Ilisoni Tuinasavusavu 1 and Peni Seru 1
SURVEYS OF TROCHUS, HOLOTHURIA, GIANT CLAMS AND THE
 SURVEYS OF TROCHUS, HOLOTHURIA, GIANT CLAMS AND THE CORAL COMMUNITIES AT ASHMORE REEF, CARTIER REEF AND MERMAID REEF, NORTHWESTERN AUSTRALIA: 2003 MAX REES, JAMIE COLQUHOUN, LUKE SMITH AND ANDREW HEYWARD
SOUTH PACIFIC COMMISSION. TWENTY-SECOND REGIONAL TECHNICAL MEETING ON FISHERIES (Noumea, New Caledonia, 6-10 August 1990)
") Page 1 ORIGINAL : ENGLISH SOUTH PACIFIC COMMISSION TWENTY-SECOND REGIONAL TECHNICAL MEETING ON FISHERIES (Noumea, New Caledonia, 6-10 August 1990) STOCK STATUS OF SKIPJACK TUNA IN THE WESTERN TROPICAL
Page 1 ORIGINAL : ENGLISH SOUTH PACIFIC COMMISSION TWENTY-SECOND REGIONAL TECHNICAL MEETING ON FISHERIES (Noumea, New Caledonia, 6-10 August 1990) STOCK STATUS OF SKIPJACK TUNA IN THE WESTERN TROPICAL
OBSERVING CORALS and ALGAE:
 5 OBSERVING CORALS and ALGAE: MANTA TOW, SNORKEL SURVEY, and POINT-INTERCEPT TRANSECT A. Manta Tow Definition A manta tow survey is the observation of an underwater area of good visibility by a snorkeler
Case Study 3. Case Study 3: Cebu Island, Philippines MPA Network 10
 Case studies of mpa networks Case Study 3: Cebu Island, Philippines MPA Network 10 Location and background Cebu Island in the Philippines lies in the center of the Visayan Islands, known as an area high
UNIVERSITY OF CAMBRIDGE INTERNATIONAL EXAMINATIONS General Certificate of Education Advanced Subsidiary Level and Advanced Level
 UNIVERSITY OF CAMBRIDGE INTERNATIONAL EXAMINATIONS General Certificate of Education Advanced Subsidiary Level and Advanced Level *2677524077* MARINE SCIENCE 9693/03 Structured Questions May/June 2013 Paper
Cambridge International Examinations Cambridge International Advanced Subsidiary and Advanced Level
 Cambridge International Examinations Cambridge International Advanced Subsidiary and Advanced Level *8637380180* BIOLOGY 9700/53 Paper 5 Planning, Analysis and Evaluation May/June 2018 1 hour 15 minutes
CONTENTS. Reef Walks...5 Trochus Swim Surveys...6 BÊCHE-DE-MER SURVEYS...6 Reef Walks...6 Manta Tows...6 Timed Swims...7 RESULTS...
 DISCLAIMER This report has been produced for the sole use of the party who requested it. The application or use of this report and of any data or information (including results of experiments, conclusions,
BASELINE SURVEY, VISUAL - SITE SPECIFIC
 BASELINE SURVEY, VISUAL - SITE SPECIFIC Introduction As stated in SEPA s policy and in the Fish Farm Manual (1998), scientific data are required by SEPA in order to assess the existing condition on the
Monitoring the length structure of commercial landings of albacore tuna during the fishing year
 SCTB15 Working Paper ALB-5 Monitoring the length structure of commercial landings of albacore tuna during the 2001 2002 fishing year Linda Griggs National Institute of Water and Atmospheric Research Ltd.
Present Status of Holothurian Fisheries in Mullaitivu Coastal Waters in North-East Region of Sri Lanka.
 Tropical Agricultural Research Vol. 28 (3): 216 222 (2017) Present Status of Holothurian Fisheries in Mullaitivu Coastal Waters in North-East Region of Sri Lanka. K. Veronika *, U. Edrisinghe 1, K. Sivashanthini
SOUTH PACIFIC COMMISSION TWENTY-THIRD REGIONAL TECHNICAL MEETING ON FISHERIES (Noumea, New Caledonia, 5-9 August 1991)
") SPC/ Fisheries 23/Information Paper.5 24 July 1991 ORIGINAL: ENGLISH SOUTH PACIFIC COMMISSION TWENTY-THIRD REGIONAL TECHNICAL MEETING ON FISHERIES (Noumea, New Caledonia, 5-9 August 1991) COUNTRY STATEMENT
SPC/ Fisheries 23/Information Paper.5 24 July 1991 ORIGINAL: ENGLISH SOUTH PACIFIC COMMISSION TWENTY-THIRD REGIONAL TECHNICAL MEETING ON FISHERIES (Noumea, New Caledonia, 5-9 August 1991) COUNTRY STATEMENT
Regional Management of Sustainable Fisheries for Giant Clams (Tridacnidae) and CITES Capacity Building Workshop
 and CITES Capacity Building Workshop") Regional Management of Sustainable Fisheries for Giant Clams (Tridacnidae) and CITES Capacity Building Workshop Nadi, Fiji Islands 4 to 7 August 2009 French Polynesia case study of giant clam management
Regional Management of Sustainable Fisheries for Giant Clams (Tridacnidae) and CITES Capacity Building Workshop Nadi, Fiji Islands 4 to 7 August 2009 French Polynesia case study of giant clam management
Analysis of Catch Quota for Kemedukl and Maml in Palauan Water
 Analysis of Catch Quota for Kemedukl and Maml in Palauan Water Project: Stock Assessment for Humphead Wrasse and Bumphead Parrotfish Alan Friedlander and Haruko Koike Fisheries Ecology Research Lab University
Assessment Summary Report Gulf of Mexico Red Snapper SEDAR 7
 Assessment Summary Report Gulf of Mexico Red Snapper SEDAR 7 Stock Distribution: Red snapper are found throughout the Gulf of Mexico, the Caribbean Sea, and from the U.S. Atlantic Coast to northern South
Weedy Seadragon Ecology Project. Annual Report Underwater Research Group of NSW Fish Ecology Lab, UTS
 Weedy Seadragon Ecology Project Annual Report 2015 Underwater Research Group of NSW Fish Ecology Lab, UTS 1. Summary UTS and URG forged an informal partnership in 2015, to further the seadragon research
John Brewer Reef Sunferries-Townsville
 John Brewer Reef Sunferries-Townsville Latitude: 18 57.364S Longitude: 146 57.375E Date: 31-1-4, 1-2-4 and 24.3.4 Florent Cade 24 SITE DESCRIPTION John Brewer Reef is a mid shelf reef situated approximately
SMOOTH HAMMERHEAD SHARK (HHS)
") SMOOTH HAMMERHEAD SHARK (HHS) (Sphyrna zygaena) HHS1 1. FISHERY SUMMARY Smooth hammerhead sharks (Sphyrna zygaena) are not currently managed under the QMS. No assigned fishing allowances exist. However,
SMOOTH HAMMERHEAD SHARK (HHS) (Sphyrna zygaena) HHS1 1. FISHERY SUMMARY Smooth hammerhead sharks (Sphyrna zygaena) are not currently managed under the QMS. No assigned fishing allowances exist. However,
Can trawling effort be identified from satellite-based VMS data?
 Not to be cited without prior reference to the author International Council for the Exploration of the Seas Theme session N: Technologies for monitoring fishing activities and observing catch Can trawling
REPUBLIC OF VANUATU FISHERIES ACT [CAP 315]
![REPUBLIC OF VANUATU FISHERIES ACT [CAP 315]](/thumbs/94/121809956.jpg "REPUBLIC OF VANUATU FISHERIES ACT [CAP 315]") REPUBLIC OF VANUATU FISHERIES ACT [CAP 315] Fisheries Regulations (Amendment) Order No. " of 2014 In exercise ofthe powers conferred on me by section 79 of the Fisheries Act [CAP 315], I, the Honourable
REPUBLIC OF VANUATU FISHERIES ACT [CAP 315] Fisheries Regulations (Amendment) Order No. " of 2014 In exercise ofthe powers conferred on me by section 79 of the Fisheries Act [CAP 315], I, the Honourable
Papua New Guinea sea cucumber and beche-de-mer identification cards
 8 (Echinodermata: Holothuroidea) at La Paz Bay. M.Sc. Thesis. Centre of Research and Advanced Studies (CICIMAR), National Polytechnic Institute, Mexico, 88 p. Herrero-Perezrul M.D., H. Reyes Bonilla, F.
Three Rivers Cockle Abundance Survey Report April 2016
 Three Rivers Cockle Abundance Survey Report April 16 May 16 Crown Copyright WG 2884 ISBN digital 978-1-4734-669-6 1. Introduction The annual Three Rivers Estuaries cockle abundance survey was conducted
Legendre et al Appendices and Supplements, p. 1
 Legendre et al. 2010 Appendices and Supplements, p. 1 Appendices and Supplement to: Legendre, P., M. De Cáceres, and D. Borcard. 2010. Community surveys through space and time: testing the space-time interaction
FINAL REPORT TO QUEENSLAND FISHERIES MANAGEMENT AUTHORITY
 SURVEY OF HOLOTHURIA SCABRA (SANDFISH) ON WARRIOR REEF, TORRES STRAIT FINAL REPORT TO QUEENSLAND FISHERIES MANAGEMENT AUTHORITY Timothy Skewes Charis Burridge Burke Hill PO Box 120 Cleveland, Q 4163 Ph
Seven months in the life of a Pacific bigeye tuna. Bruno Leroy
 Seven months in the life of a Pacific bigeye tuna Bruno Leroy Introduction: This article presents the initial results obtained through recovery of electronic tags placed in bigeye tuna (Thunnus obesus).
Nearshore Habitat Mapping in Puget Sound Using Side Scan Sonar and Underwater Video
 Nearshore Habitat Mapping in Puget Sound Using Side Scan Sonar and Underwater Video Dana Woodruff, Paul Farley, Amy Borde, John Southard, Ron Thom Battelle Marine Sciences Laboratory Jim Norris Marine
Recovery of Coral Populations at Helen Reef Atoll after a Major Bleaching Event
 Recovery of Coral Populations at Helen Reef Atoll after a Major Bleaching Event Yimnang Golbuu 1, Jay Andrew 1, Geory Mereb 1, Robert van Woesik 2 1 Palau International Coral Reef Center 2 Florida Institute
Analysis of Variance. Copyright 2014 Pearson Education, Inc.
 Analysis of Variance 12-1 Learning Outcomes Outcome 1. Understand the basic logic of analysis of variance. Outcome 2. Perform a hypothesis test for a single-factor design using analysis of variance manually
Coastal and Marine Resources Research Program
 Coastal and Marine Resources Research Program The Coastal and Marine Resources Research Program (CMRRP) strives to equip developing countries with the means to increase the productivity of inshore fisheries
Two types of physical and biological standards are used to judge the performance of the Wheeler North Reef 1) Absolute standards are measured against
 Absolute standards are measured against") 1 Two types of physical and biological standards are used to judge the performance of the Wheeler North Reef 1) Absolute standards are measured against fixed value at Wheeler North Reef only 2) Relative
1 Two types of physical and biological standards are used to judge the performance of the Wheeler North Reef 1) Absolute standards are measured against fixed value at Wheeler North Reef only 2) Relative
Proposals for improved figures in the tropical tunas executive summaries
 IOTC 21 SC18 13 Proposals for improved figures in the tropical tunas executive summaries By Alain Fonteneau 1 and Francis Marsac 2 Summary In this paper, we undertake a critical review of the figures included
SEA CUCUMBER AQUACULTURE RESEARCH
 BECHE-DE-MER MARKET IN THE PACIFIC REGION Bêche-de-mer Evisceration, boiling, dry Sandfish 95% weight loss 1800 1600 Export of sea cucumbers (fresh/frozen/dried/salted/in brine) from Pacific countries*
Reef Check Australia. Magnetic Island Season Report 2016
 Reef Check Australia Season Report 16 Reef Check Foundation Ltd. (Australia) www.reefcheckaustralia.org PO Box 134 George St Brisbane QLD 43 This report should be cited as: M. Welch, J. Salmond and J.
While the fishing standing stock at Wheeler North Reef has been consistently below the 28 ton requirement, data from last summer s survey showed that
 1 While the fishing standing stock at Wheeler North Reef has been consistently below the 28 ton requirement, data from last summer s survey showed that it increased by 88% in 2014. This raises the question
Video-Based Mapping of Oyster Bottom in the Upper Piscataqua River, Sturgeon Creek, and Spruce Creek
 University of New Hampshire University of New Hampshire Scholars' Repository PREP Reports & Publications Institute for the Study of Earth, Oceans, and Space (EOS) 1-21-2009 Video-Based Mapping of Oyster
Managing sea cucumber fisheries with an ecosystem approach
 58 5.6.2 Bans or moratoria Definition A long-term cessation or prohibition of fishing, i.e. for periods >1 year. In contrast with other permanent closures like MPAs or No-take zones, bans or moratoria
Oceanic Society Reef Research Team: Nicole Crane, Avigdor Abelson, Peter Nelson, Giacomo Bernardi, Michelle Paddack, Kate Crosman
 The coral reef of Tamil (Yap, FSM): Preliminary ecological assessment of reef state and fish assemblages, and potential of conservation for sustainable use Report compiled by vigdor belson, Peter Nelson
Technical and Financial Proposal
 Technical and Financial Proposal Marine Survey of Montego Bay Marine Park Assessment of Reef Health for Management Recommendations Dayne Buddo Ph.D. Marine Ecologist April 24, 2014. Marine Survey Montego
IFFO RS V2.0 FISHERY ASSESSMENT METHODOLOGY AND TEMPLATE REPORT. Fishery Under Assessment. Date. Assessor
 IFFO RS V2.0 FISHERY ASSESSMENT METHODOLOGY AND TEMPLATE REPORT Fishery Under Assessment Date Assessor IFFO RS Ltd, Unit C, Printworks, 22 Amelia Street, London, SE17 3BZ, United Kingdom Application details
Stillwater Status Report: Lough Muck, County Donegal
 LOUGHS AGENCY OF THE FOYLE CARLINGFORD AND IRISH LIGHTS COMMISSION Stillwater Status Report: Lough Muck, County Donegal Stillwater Fish Stock Survey Loughs Agency of the Foyle Carlingford and Irish Lights
Oyster Bed Mapping in the Great Bay Estuary,
 University of New Hampshire University of New Hampshire Scholars' Repository PREP Reports & Publications Institute for the Study of Earth, Oceans, and Space (EOS) 6-26-2013 Oyster Bed Mapping in the Great
Eastern Shore Islands Area of Interest Community Newsletter
 Eastern Shore Islands Area of Interest Community Newsletter Fall 2018 1ỊNTRODUCTION In addition to information on our Fisheries and Oceans Canada (DFO) website, we have now created a seasonal, community
Michael Tenorio Michael Trianni
 Michael Tenorio Michael Trianni This project would not have been possible without the support of many over the years, and this presentation reflects their dedication Alvin Fitial Anthony Flores Bob Coldeen
Summary of Research within Lamlash Bay No-Take Zone - Science report for COAST July
 Summary of Research within Lamlash Bay No-Take Zone - Science report for COAST July 2013 - *Picture of a spider crab (Macropodia spp) inside a plumose anemone. Taken within Lamlash Bay No-Take Zone by
Preliminary results of SEPODYM application to albacore. in the Pacific Ocean. Patrick Lehodey
 SCTB15 Working Paper ALB-6 Preliminary results of SEPODYM application to albacore in the Pacific Ocean Patrick Lehodey Oceanic Fisheries Programme Secretariat of the Pacific Community Noumea, New Caledonia
Factors influencing production
 Fisheries Reading: Miller Ch. 15 Supplementary: Levinton, Ch. 18 Krkošek et al. Epizootics of wild fish induced by farm fish. Proceedings of the National Academy of Sciences (2006) vol. 103 (42) pp. 15506
Conservation Limits and Management Targets
 Conservation Limits and Management Targets Setting conservation limits The use of conservation limits (CLs) in England and Wales (E&W) has developed in line with the requirement of ICES and NASCO to set
Information Paper for SAN (CI-4) Identifying the Spatial Stock Structure of Tropical Pacific Tuna Stocks
 Identifying the Spatial Stock Structure of Tropical Pacific Tuna Stocks") Current knowledge, key uncertainties and future research directions for defining the stock structure of skipjack, yellowfin, bigeye and South Pacific albacore tunas in the Pacific Ocean Information Paper
Current knowledge, key uncertainties and future research directions for defining the stock structure of skipjack, yellowfin, bigeye and South Pacific albacore tunas in the Pacific Ocean Information Paper
Survey Technique for Underwater Digital Photography with Integrated GPS Location Data
 Survey Technique for Underwater Digital Photography with Integrated GPS Location Data Tim Siwiec: United States Environmental Protection Agency Abstract This survey technique is an inexpensive method of
New Millennium Dive Expeditions
 New Millennium Dive Expeditions 15030 N Timberline Drive Reno, NV 89511 (775)850-2510 * nmde@att.net www.nmde.org Project Report July 12, 2013: Phase 1 of 2 (Phase 2: August 26 th 30 th, 2013) Supporting
Seismic Survey Designs for Converted Waves
 Seismic Survey Designs for Converted Waves James A. Musser* GMG/AXIS Inc., Denver, CO 1720 Red Cloud Road, Longmont, CO, 80501, USA jmusser@gmg.com ABSTRACT Designing converted wave 3D surveys is considerably
Declaration of Panama City
 CFMC/OSPESCA/WECAFC/CRFM 1 Working Group on Queen Conch (QCWG) Panama City, Panama, 23 25 October 2012 Declaration of Panama City The Members of the CFMC/OSPESCA/WECAFC/CRFM Working Group on Queen Conch:
Sea Star Wasting Syndrome Protocols for Subtidal Surveys
 Sea Star Wasting Syndrome Protocols for Subtidal Surveys February 13, 2014 Value of Citizen Science Monitoring in the subtidal Involving citizen scientists to survey the nearshore subtidal for evidence
Marine Conservation and Research Expedition Training, Examination and Certification Summary
 Marine Conservation and Research Expedition Training, Examination and Certification Summary Introduction This document summarizes the current training schedule and materials being used at the two Marine
Sustainability Assessment of the Torres Strait Sea Cucumber Fishery
 Cooperratti ive Researrch Centtrre fforr Torrrres Sttrrai itt Torres Strait Research Program Sustainability Assessment of the Torres Strait Sea Cucumber Fishery CRC-TS Project Task Number: T1.4 Timothy
Variation in postharvest processing of sea cucumbers by fishers and commercial processors among three Pacific Island countries
 58 Variation in postharvest processing of sea cucumbers by fishers and commercial processors among three Pacific Island countries Abstract Steven W. Purcell 1, Poasi Ngaluafe 2, Karibanang T. Aram 3, Watisoni
Resort and Dive Operation Management, Marine Biology Support, Programmes and Training.
 Helen Sykes & Stuart Gow Mail: PO Box 2558 Government Buildings SUVA, Fiji Islands Tel: (679) 336 3625 or 359 2136 Email: resortsupport@connect.com.fj Resort and Dive Operation Management, Marine Biology
REVISION OF THE WPTT PROGRAM OF WORK
 REVISION OF THE WPTT PROGRAM OF WORK IOTC 2016 WPTT18 08 Rev 1 PREPARED BY: IOTC SECRETARIAT 1, 3 OCTOBER 2016 PURPOSE To ensure that the participants at the 18 th Working Party on Tropical Tunas (WPTT18)
Socioeconomic Profile and Spatial Analysis of Fisheries in the three central California National Marine Sanctuaries
 Socioeconomic Profile and Spatial Analysis of Fisheries in the three central California National Marine Sanctuaries Overview and Assessment of CDFG Fisheries Data for use in the Joint Management Plan Review
Understanding shelf-break habitat for sustainable management of fisheries with spatial overlap
 Understanding shelf-break habitat for sustainable management of fisheries with spatial overlap Alan Williams Caleb Gardner Franziska Althaus Bruce Barker David Mills Final Report to the Fisheries Research
Agenda Item Summary BACKGROUND. Attachment 1
 Agenda Item Summary Attachment 1 BACKGROUND Oregon s recreational abalone fishery was suspended by emergency rule beginning January 1, 2018. This suspension was due to 1) low densities of red abalone,
YELLOWFIN TUNA (Thunnus albacares)
") WETJENS DIMMLICH / W FACTSHEET APRIL 2015 WF SFI Smart Fishing Initiative (SFI): species overview YELLOWFIN TUNA (Thunnus albacares) Region: Indian Ocean IOTC status 2014: not subject to overfishing [1]
WETJENS DIMMLICH / W FACTSHEET APRIL 2015 WF SFI Smart Fishing Initiative (SFI): species overview YELLOWFIN TUNA (Thunnus albacares) Region: Indian Ocean IOTC status 2014: not subject to overfishing [1]
Stillwater Status Report: Lough Muck, County Tyrone
 LOUGHS AGENCY OF THE FOYLE CARLINGFORD AND IRISH LIGHTS COMMISSION Stillwater Status Report: Lough Muck, County Tyrone Stillwater Fish Stock Survey Loughs Agency of the Foyle Carlingford and Irish Lights
UNIVERSITY OF CAMBRIDGE INTERNATIONAL EXAMINATIONS General Certificate of Education Ordinary Level
 UNIVERSITY OF CAMBRIDGE INTERNATIONAL EXAMINATIONS General Certificate of Education Ordinary Level *3373524824* STATISTICS 4040/23 Paper 2 October/November 2013 Candidates answer on the question paper.
Matthew Bryant Rodrigues Mentor: Dr. David Bybee Brigham Young University - Hawaii - Department of Biological Sciences December 10, 2013 BIOL 494
 Reproductive periodicity of the Sea Cucumber Holothuria atra (Echinodermata: Holothuroidea) in the Coastal Waters of Laie, Hawai i Matthew Bryant Rodrigues Mentor: Dr. David Bybee Brigham Young University
Trawl fishery management of Eastern Arabian Sea
 Trawl fishery management of Eastern Arabian Sea Dr. A.P.Dineshbabu, Central Marine Fisheries Research Institute, India Existing management practices Seasonal closure of fishery: The regulations for closed
Hello, my name is Speck. I am a Spotted Sea Trout and live in estuaries and in waters along the coast of the Atlantic Ocean.
 Hello, my name is Speck. I am a Spotted Sea Trout and live in estuaries and in waters along the coast of the Atlantic Ocean. Hi, my name is Spot and I am, well, a Spot, named for my spot just behind my
Cambridge International Examinations Cambridge Ordinary Level
 Cambridge International Examinations Cambridge Ordinary Level *3365325931* ENVIRONMENTAL MANAGEMENT 5014/21 Paper 2 May/June 2018 1 hour 30 minutes Candidates answer on the Question Paper. No Additional
WORKING GROUP ON STOCK ASSESSMENTS 5 TH MEETING DOCUMENT SAR-5-08 TARGET SIZE FOR THE TUNA FLEET IN THE EASTERN PACIFIC OCEAN
 INTER-AMERICAN TROPICAL TUNA COMMISSION COMISIÓN INTERAMERICANA DEL ATÚN TROPICAL WORKING GROUP ON STOCK ASSESSMENTS 5 TH MEETING LA JOLLA, CALIFORNIA (USA) 11-13 MAY 2004 DOCUMENT SAR-5-08 TARGET SIZE
Falmouth and St.Austell pspa bird bycatch analysis report year
 Natural England Commissioned Report NECR231 Falmouth and St.Austell pspa bird bycatch analysis report year 1-2014 First published 20 April 2017 www.gov.uk/natural-england Foreword Natural England commission
Blue cod 5 (BCO5) pot mesh size review
 pot mesh size review") Blue cod 5 (BCO5) pot mesh size review Discussion Document MPI Discussion Paper No: 2017/01 Prepared for public consultation by the Ministry for Primary Industries ISBN No: 978-1-77665-454-3 (o) ISSN No:
Blue cod 5 (BCO5) pot mesh size review Discussion Document MPI Discussion Paper No: 2017/01 Prepared for public consultation by the Ministry for Primary Industries ISBN No: 978-1-77665-454-3 (o) ISSN No:
Application of a New Method for Monitoring Lake Trout Abundance in Yukon: Summer Profundal Index Netting (SPIN)
") Application of a New Method for Monitoring Lake Trout Abundance in Yukon: Summer Profundal Index Netting (SPIN) Prepared by: Lars Jessup Nathan Millar November 2011 Application of a New Method for Monitoring
Application of a New Method for Monitoring Lake Trout Abundance in Yukon: Summer Profundal Index Netting (SPIN) Prepared by: Lars Jessup Nathan Millar November 2011 Application of a New Method for Monitoring
Opleiding Informatica
 Opleiding Informatica Determining Good Tactics for a Football Game using Raw Positional Data Davey Verhoef Supervisors: Arno Knobbe Rens Meerhoff BACHELOR THESIS Leiden Institute of Advanced Computer Science
SAC-08-10a Staff activities and research plans. 8 a Reunión del Comité Científico Asesor 8 th Meeting of the Scientific Advisory Committee
 SAC-08-10a Staff activities and research plans 8 a Reunión del Comité Científico Asesor 8 th Meeting of the Scientific Advisory Committee IATTC RESEARCH PROGRAM Four programs: A. Stock Assessment; B. Biology
Policy Instruments for Fisheries Management and the Concept of Fisheries Refugia
 REVERSING ENVIRONMENTAL DEGRADATION TRENDS Policy Instruments for Fisheries Management and the Concept of Fisheries Refugia Christopher Paterson, UNEP/GEF South China Sea Project REVERSING ENVIRONMENTAL
Report on a Salmon Survey in the Waterford Estuary in 2010
 Report on a Salmon Survey in the Waterford Estuary in 2010 Dr. P. Gargan Inland Fisheries Ireland June 2011 1 Contents 1. Introduction 3 2. Proposal for a Survey in Waterford estuary in 2010 3 3. Survey
Appendix 9 SCUBA diving in the sea
 Appendix 9 SCUBA diving in the sea Firth of Clyde Forum SMRTS2015 Final Report 195 March 2016 Appendix 9 SCUBA diving in the sea Table A9.1: Summary of sample confidence levels Responses Spatial data Questionnaire
ATLANTIC STATES MARINE FISHERIES COMMISSION. Winter Flounder Abundance and Biomass Indices from State Fishery-Independent Surveys
 ATLANTIC STATES MARINE FISHERIES COMMISSION Winter Flounder Abundance and Biomass Indices from State Fishery-Independent Surveys Technical Committee Report to the Winter Flounder Management Board February
For next Thurs: Jackson et al Historical overfishing and the recent collapse of coastal ecosystems. Science 293:
 For next Thurs: Jackson et al. 2001. Historical overfishing and the recent collapse of coastal ecosystems. Science 293: 629-637. Resource: means of supplying a want or deficiency, from French resourdre
Preliminary analysis of yellowfin tuna catch, effort, size and tagging data using an integrated age-structured model
 Preliminary analysis of yellowfin tuna catch, effort, size and tagging data using an integrated age-structured model Introduction John Hampton Secretariat of the Pacific Community Noumea, New Caledonia
Spatial Methods for Road Course Measurement
 Page 1 of 10 CurtinSearch Curtin Site Index Contact Details Links LASCAN Spatial Sciences WA Centre for Geodesy COURSE MEASUREMENT This page is a summary of results of some of the research we have recently
FISHERIES REGULATIONS
 PAPUA NEW GUINEA FISHERIES REGULATIONS 2 0 0 5 The Coastal Fisheries Management and Development Project is funded by the PNG government through a concessionary loan by the Asian Development Bank PAPUA
Population Parameters and Their Estimation. Uses of Survey Results. Population Terms. Why Estimate Population Parameters? Population Estimation Terms
 Population Parameters and Their Estimation Data should be collected with a clear purpose in mind. Not only a clear purpose, but a clear idea as to the precise way in which they will be analysed so as to
Catch per unit effort of coastal prawn trammel net fishery in Izmir Bay, Aegean Sea
 Research Article Mediterranean Marine Science Volume 10/1, 2009, 19-23 Catch per unit effort of coastal prawn trammel net fishery in Izmir Bay, Aegean Sea O. AKYOL and T. CEYHAN Faculty of Fisheries, Ege
STOCK STATUS OF SOUTHERN BLUEFIN TUNA
 7 th Expert Consultation on Indian Ocean Tunas, Victoria, Seychelles, 9-14 November, 1998 STOCK STATUS OF SOUTHERN BLUEFIN TUNA Tsuji, S. 1 Introduction The Commission for the Conservation of Southern
Management of beche-de-mer fisheries in the Western Province of Papua New Guinea by Paul Lokani 1, Philip Polon 2 & Ray Lari 2
 7 Management of beche-de-mer fisheries in the Western Province of Papua New Guinea by Paul Lokani 1, Philip Polon 2 & Ray Lari 2 INTRODUCTION The tropical fisheries for beche-de-mer are centered in the