Textbook Development for SDGs, STEM, and Energy by Cross-border Education
|
|
|
- Pierce Gilbert
- 5 years ago
- Views:
Transcription


1 APEC Khon Kaen International Symposium XII 9-12 September 2017 Innovation of Mathematics Education through Lesson Study Textbook Development for SDGs, STEM, and Energy by Cross-border Education The case of Indonesia Wahyudi & Russasmita Sri Padmi SEAMEO Regional Center for QITEP in Mathematics
2 BACKGROUND As a continuation of APEC-Tsukuba and UNESCO (MGIEP) International Conference XI, which was held in Tokyo, February 9-12, 2017, Indonesia and Thailand have embarked on Cross-Border Lesson Study together. The cross-border lesson study was conducted on August 8, Tasks using APEC Energy Database. The preparation start in the beginning of June
3 LESSON STUDY STUDY Teaching materials; consider long term goals for students. PLAN Research Lesson, Unit, Anticipate students thinking REFLECT On Lesson Data and the implication of teaching and learning DO Research Lesson, collect data (Lewis, 2016)
4 PHASE 1: STUDY
5 CONSIDERATION PRIOR TO DESIGNING THE LESSON Theme set during APEC- Tsukuba meeting APEC energy database Curriculum of statistics in Indonesia and Thailand Lesson Plan
6 THE THEME OF THE LESSON Imagine hidden variables and relations through the questioning the graphs, and appreciate the significance of being able to analyze the situation and predict the future by using them.

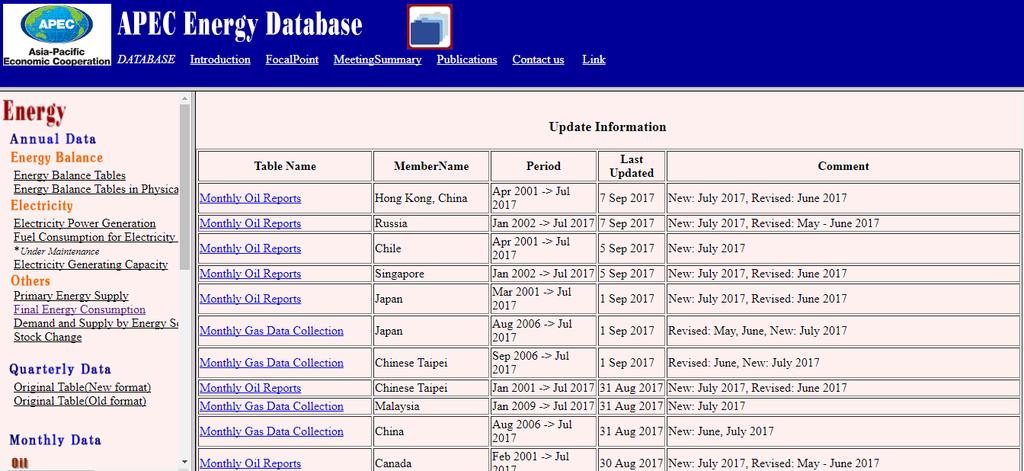
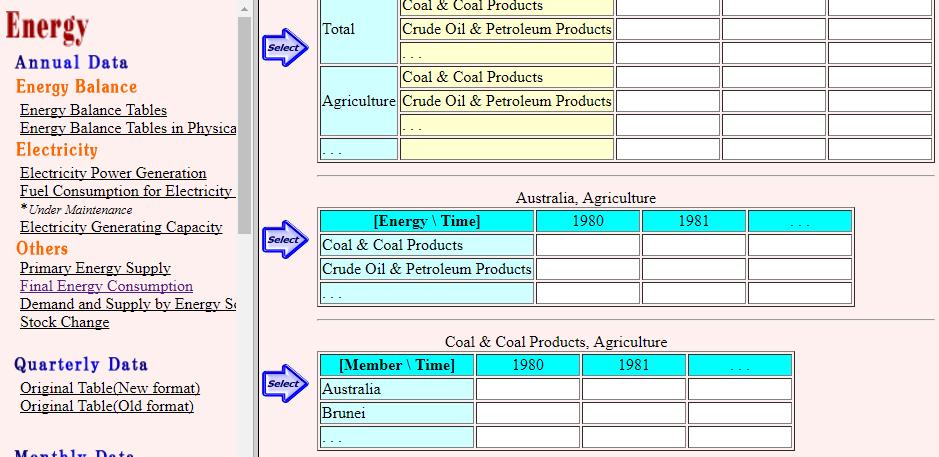


7 APEC DATABASE
8 CURRICULUM ON STATISTICS IN INDONESIA Grade 7 Types of data Representing data Grade 8 Measures of central tendency Probability Grade 9
9 PHASE II: PLAN
10 TIMELINE DATE ACTIVITIES 22 May 21 July, 2017 Desining lesson plan 2 June 23 July 2017 Discussing and editing lesson plan together between Thailand and Indonesia via and video call July, 2017 Prepare for Cross Border Lesson study 1 and 8 August, 2017 Cross-border Lesson study between Thailand and Indonesian students Writing of the Report
11 INDONESIAN TEAM Researchers Dr. Wahyudi Ms. Russasmita Sri Padmi Ms. Fina Hanifa Hidayati Ms. Mutiatul Hasanah Model teacher Darto Staffs Mr. Deni Saputra Mr. Febriarto Mr. Agus
12 THAILAND TEAM Maitree Inprasith Nalumon Inprasith Auijit Pattanajak Narumon Changsri Phuangthong Poonrueng Prapawadee Suwannatrai
13 THE LESSON PLAN Title: The Cost of Our Bright World Grade: 9 Topic: Statistics (in the context of energy) Materials: Worksheets 1.1 and 1.2 (for students) PowerPoint presentation (for teacher) Graph paper or graphing software (Ms. Excel) projector and screen A3 graphing paper. WebEx meeting room and internet connection SDG to be addressed: SDG 13: take urgent action to combat climate change and its impacts. SDG 7: ensure access to affordable, reliable, and sustainable energy for all.
14 LESSON OBJECTIVES represent and describe energy-related data in the form of tables, graph, and charts interpret data in the context of energy explain the correlation between different energy consumption and CO 2 emission
15 OVERVIEW OF THE TASK Focus was on The data of electricity consumption and CO 2 emission. Analyzing data visually, mainly through the shape of the graph. Meeting 1 (Worksheet 1) The students compare electricity consumption of Indonesia and Thailand using APEC Energy Database. This meeting is conducted separately in each country. Meeting 2 (Worksheet 2) The students investigate the primary source of energy used to generate electricity and how it is related to CO 2 emission. This meeting is connected via WebEx.

16 Worksheet 1 THE COST OF OUR BRIGHT WORLD How much electricity do Indonesia and Thailand use? Which country, between Thailand and Indonesia, consume more electricity? What could be the reason behind this phenomenon?

17 Worksheet 1 THE COST OF OUR BRIGHT WORLD How much electricity do Indonesia and Thailand use? The table on the right shows electricity comparison of Thailand and Indonesia during the period Represent the data in the form of line graph; blue pen for Indonesia and red pen for thailand. You can also plot it on Microsoft Excel and then copy it to the grid provided below. Use the graph to help you answer the given questions in the following pages. Data can be accessed online at: database/database-top.html There are two sections of the worksheet: DESCRIBING DATA and INTERPRETING DATA.
18 INTERPRETING DATA 1 By looking at the graph, describe the differences and similarities between electricity consumption of Thailand and Indonesia. 2 The following are the population count of Indonesia and Thailand from 1990 to Source: 3 Do you agree that the consumption of electricity is related to the number of people living in the country? Explain your reason. What do you think is the factor that influence the amount of electricity consumption of a country? Explain.
19 Worksheet 2 THE COST OF OUR BRIGHT WORLD Does electricity consumption cause air pollution? Total electricity Consumption (in ktoe) Total Production of CO 2 in kt Indonesia Thailand Indonesia Thailand #REF! Can you observe any relation between electricity consumption and production of CO 2?


20 The students are going to investigate data from the following countries.
21 Graph 1 Total Electricity consumption (in ktoe) China Indonesia Thailand United States of America source:
22 Graph 2 SOURCE OF ENERGY TO CREATE ELECTRICITY The following are pie charts depicting source of energy for electricity in What can you conclude? Indonesia China USA Thailand source:
23 Graph 3 Coal Consumption for Power Generation (in ktoe) China Indonesia Thailand United States of America source:
24 Graph 4 Total CO 2 Emission in kt China Indonesia Thailand United States of America source:
25 INTERPRETING DATA 1 Observe Graph 1. For China and USA, their electricity consumption is going up. However, in Graph 4, CO 2 production of China is going up while USA s CO 2 production is going down. What do you think is the cause behind these phenomenon? Explain your answer. Use the graph to support your reasoning. 2 Does higher electricity consumption influence higher CO 2 production? Explain your assumptions.

26 PHASE III: DO
 4 Pakem 32")

27 OUR STUDENTS 34 grade 8 students from SMPN (Junior High School) 4 Pakem 32 grade 8 students from Demonstration School of Khon Khaen University (Mo Ding Dang)


28 LESSON DAY 1 August 1, 2017
29 LESSON DAY 1 August 1, 2017
30 EXAMPLE OF STUDENTS ANSWER: MEETING 1 Indonesian students


31 LESSON DAY 2 August 8, 2017
32 VIDEO: MEETING 2
33 EXAMPLE OF STUDENTS ANSWER: LESSON DAY 2

34 PHASE IV: REFLECT
35 REFLECTION The students were enthusiastic and greatly enjoyed the lesson. They can understand the world through mathematics lesson by investigating real life, raw data from reliable sources. The lesson opens the possibility for the use of ICT which is completely new to Indonesian education: connectivity. The study needs to be implemented in more than one cycle to accommodate the revision.
36 REFLECTION Internet connection was a big obstacle. Even though most of the time teachers and students can speak English well, sometimes words are hard to comprehend due to internet connection. Recording the sound of the room makes it hard to understand through internet.
37 SUGGESTION FOR THE NEXT LESSON STUDY: For internet, it is recommended to use LAN/cable connection. The broadcast should be provided with subtitles. It is recommended that instead of recording the sound of the room, the microphone should be connected through the internet instead.

38 WHAT DO THE STUDENT THINK? What did they like about the lesson? What do they want to improve from the lesson?
39 Thank you.
Textbook Development for SDGs, STEM, and Energy by Cross-border Education
 APEC Tsukuba and UNESCO (MGIEP) International Conference XII February 7-12, 2018 Innovation of Mathematics Education through Lesson Study Textbook Development for SDGs, STEM, and Energy by Cross-border
GRADE LEVEL(S): Grade 4, Grade 5
: Grade 4, Grade 5") WRITTEN BY; TITLE: George Skip Toops Step It Up!! GRADE LEVEL(S): Grade 4, Grade 5 TIME ALLOTMENT: One lesson, 30 50 minutes long depending on how many students are in the class. Students will have some
WRITTEN BY; TITLE: George Skip Toops Step It Up!! GRADE LEVEL(S): Grade 4, Grade 5 TIME ALLOTMENT: One lesson, 30 50 minutes long depending on how many students are in the class. Students will have some
! Problem Solving Students will use past Olympic statistics and mathematics to predict the most recent Olympic statistics.
 Title: Running Into Statistics Brief Overview: Since the 1996 Olympics took place close to home, they were a major topic of discussion all over the region. Students have traditionally been interested in
Investigation: Buoyancy
 Grades 4 6 Physical Science Investigation: Buoyancy Objective: To understand that when an object is submerged in a liquid, the liquid provides an upward force (buoyancy) on it. What is a force gauge or
USING A CALCULATOR TO INVESTIGATE WHETHER A LINEAR, QUADRATIC OR EXPONENTIAL FUNCTION BEST FITS A SET OF BIVARIATE NUMERICAL DATA
 USING A CALCULATOR TO INVESTIGATE WHETHER A LINEAR, QUADRATIC OR EXPONENTIAL FUNCTION BEST FITS A SET OF BIVARIATE NUMERICAL DATA Jackie Scheiber RADMASTE, Wits University Jackie.scheiber@wits.ac.za Target
TEACHER GUIDE LOWER PRIMARY
 TEACHER GUIDE LOWER PRIMARY The Australian Olympic Committee s PyeongChang 2018 resource provides an opportunity for teachers in Australian Primary Schools to celebrate the PyeongChang 2018 Winter Olympic
Overview. Learning Goals. Prior Knowledge. UWHS Climate Science. Grade Level Time Required Part I 30 minutes Part II 2+ hours Part III
 Draft 2/2014 UWHS Climate Science Unit 3: Natural Variability Chapter 5 in Kump et al Nancy Flowers Overview This module provides a hands-on learning experience where students will analyze sea surface
Section 5 Critiquing Data Presentation - Teachers Notes
 Topics from GCE AS and A Level Mathematics covered in Sections 5: Interpret histograms and other diagrams for single-variable data Select or critique data presentation techniques in the context of a statistical
Unit 4 Lesson 3 Earth s Tides. Copyright Houghton Mifflin Harcourt Publishing Company
 Florida Benchmarks SC.8.N.1.1 Define a problem from the eighth grade curriculum using appropriate reference materials to support scientific understanding, plan and carry out scientific investigations of
Standard 3.1 The student will plan and conduct investigations in which
 Teacher Name: Tammy Heddings Date: April 04, 2009 Grade Level: 3-6 Subject: Science Time: 30 minutes Concept: Scientific Investigation Topic: Variables SOLs: Standard 3.1 The student will plan and conduct
F I N D I N G K A T A H D I N :
 F I N D I N G K A T A H D I N : An Online Exploration of Maine s Past LOBSTER ROLL!* Lesson 7.3 Objective: Students will collect data by playing a game that illustrates the delicate ecological balance
Canadian Exploratory Olympics Sites Lesson Plan
 Submitted by: Jesse Sandstrom Date: July 2, 2007 Canadian Exploratory Olympics Sites Lesson Plan Description: Students will assume the role of an Olympic exploratory member in hopes of finding possible
Factors that affect the motion of a vehicle along a surface
 SPECIMEN GENERAL CERTIFICATE OF SECONDARY EDUCATION TWENTY FIRST CENTURY SCIENCE ADDITIONAL SCIENCE A Unit A154: (controlled assessment) PHYSICS A Unit A184 (controlled assessment) A154 A184 Factors that
The Math and Science of Bowling
 The Report (100 : The Math and Science of Bowling 1. For this project, you will need to collect some data at the bowling alley. You will be on a team with one other student. Each student will bowl a minimum
Is lung capacity affected by smoking, sport, height or gender. Table of contents
 Sample project This Maths Studies project has been graded by a moderator. As you read through it, you will see comments from the moderator in boxes like this: At the end of the sample project is a summary
save percentages? (Name) (University)
 (University)") 1 IB Maths Essay: What is the correlation between the height of football players and their save percentages? (Name) (University) Table of Contents Raw Data for Analysis...3 Table 1: Raw Data...3 Rationale
1 IB Maths Essay: What is the correlation between the height of football players and their save percentages? (Name) (University) Table of Contents Raw Data for Analysis...3 Table 1: Raw Data...3 Rationale
GLOBE Data Explorations
 Rainfall in the GLOBE Africa Region: A GLOBE Data Exploration Purpose Through explorations of GLOBE rain depth data from Africa, students learn about seasonal patterns in locations affected by monsoons.
Where have all the Salmon Gone?
 Where have all the Salmon Gone? Lesson Overview In this lesson, students will participate in a simulation activity that illustrates the lifecycle of salmon in order to appreciate the different obstacles
AUSTRALIAN TEAMS OVER TIME
 LEVEL Upper primary AUSTRALIAN TEAMS OVER TIME DESCRIPTION In these activities, students learn about the number of athletes who have represented Australia in the Olympics, with a focus on the previous
The Hudson s Ups and Downs
 The Hudson s Ups and Downs Students will interpret line graphs of Hudson River water levels to learn about tides and tidal cycles in the estuary. Objectives: Students will read line graphs to: examine
Make a Marigram. Overview: Targeted Alaska Grade Level Expectations: Objectives: Materials: Whole Picture: Grades 9-12
 Make a Marigram Overview: In this lesson, students briefly examine the use of acoustics for data collection then use Microsoft Excel to analyze tide gauge data. Basic knowledge of Microsoft Excel is recommended.
b. Graphs provide a means of quickly comparing data sets. Concepts: a. A graph can be used to identify statistical trends
 Baseball Bat Testing: Subjects: Topics: data. Math/Science Gathering and organizing data from an experiment Creating graphical representations of experimental data Analyzing and interpreting graphical
Teaching Notes. Contextualised task 35 The 100 Metre Race
 Contextualised task 35 The 100 Metre Race Teaching Notes This activity involves interpreting data presented in different forms to compare speed, distance and time. The aim is to find who might win a race
Lesson 3: Which fish should I eat?
 Lesson 3: Which fish should I eat? Objectives: Students will know how to answer the question, Are some fish less harmful to eat from the Hudson River than others? and be able to provide evidence to support
Myra Miller Pheasant and the China Connection. Provided by the South Dakota Art Museum Brookings, South Dakota
 Myra Miller Pheasant and the China Connection Provided by the South Dakota Art Museum Brookings, South Dakota South Dakota Artists Curriculum Unit Unit of Study: Myra Miller, painter Title of Lesson Plan:
Battle of the Waves Sound vs Light
 Battle of the Waves Sound vs Light By: Vaneesha Persad, Katelyn Johnson, and Heather Miller Focus on Inquiry The student will collect, analyze, and interpret data to develop an understanding of how the
Surf Clams: Latitude & Growth
 Surf Clams: Latitude & Growth East Coast MARE Materials For the leader: Projector Whiteboard to project data graph onto For the activity: Copy of data table Copy of map Computer program to graph in or
Tracking Juvenile Summer Flounder
 Tracking Juvenile Summer Flounder East Coast MARE Materials For the leader: Whiteboard Markers (different colors) For each group: Copies of student group packets Copies of student worksheet Overview Scientists
Modern and Ancient Tides
 Modern and Ancient Tides A lesson plan to be used in conjunction with the Modern and Ancient Tides poster and booklet available from the Indiana Geological Survey. Overview Students will discover how tides
NCCP Swimming 301 Course Summary
 1 INTRODUCTION 3:30 This module provides coaches with an overview of the 301 course, what is expected of the coaches and most importantly what coaches can expect to get out of attending the 301 course.
In this lesson, students determine the speed of a tsunami using tsunami time travel maps and Google Earth.
 Speedy Tsunami Overview: In this lesson, students determine the speed of a tsunami using tsunami time travel maps and Google Earth. Targeted Alaska Grade Level Expectations: Science [] SA1.1 The student
Sustianable Seafood Delight
 Sustianable Seafood Delight Lesson Focus: Ocean resources and sustainability Learning objectives: Students will understand what a sustainable population and fishery is and how they can be impacted by human
box and whisker plot 3880C798CA037B A83B07E6C4 Box And Whisker Plot 1 / 6
 Box And Whisker Plot 1 / 6 2 / 6 3 / 6 Box And Whisker Plot In descriptive statistics, a box plot or boxplot is a method for graphically depicting groups of numerical data through their quartiles.box plots
Number crunch. Number crunch. Activity overview. Time required. Materials. Preparation. Activity steps. Key Learning Area Mathematics English
 Activity overview Students engage in a series of activities designed to demonstrate the important role numbers play in communicating information. Students will investigate the scoring systems used in a
Spirit Lesson 3 Robot Wheelies Lesson Outline Content: Context: Activity Description:
 Spirit Lesson 3 Lesson Title: Robot Wheelies Draft Date: July 13, 2008 1 st Author: Deb Hipnar 2 nd Author: Rachel Neurath Algebra Topic: Formulas: Circumference, Distance Grade Level: Upper Elementary,
California Pedestrian and Bicycle Safety Curriculum
 California Pedestrian and Bicycle Safety Curriculum A standards-based curriculum project of the California Healthy Kids and After School Resource Center and the California Safe Routes to School Technical
Science. The Bruins I.C.E. School
 The Bruins I.C.E. School Lesson 1: Physical Benefits of Ice Hockey Lesson 2: Protecting Bones Lesson 3: Changing Equipment Lesson 4: Playing in the System Lesson 5: GOAL! Worksheets Included: Please see
Box-and-Whisker Plots
 Lesson 75 Objectives Calculate quartile values for a data set Create a box-and-whisker plot Quartiles and Box-and-Whisker Plots Richard recorded the number of people that attended his team s minor league
TEACHING VOCABULARY THROUGH FLY SWATTER GAME. (An Experimental Research at the Second Grade Students of SMP N 2 Baturraden in Academic Year 2013/2014)
") TEACHING VOCABULARY THROUGH FLY SWATTER GAME (An Experimental Research at the Second Grade Students of SMP N 2 Baturraden in Academic Year 2013/2014) A THESIS Submitted to the English Department as a Partial
TEACHING VOCABULARY THROUGH FLY SWATTER GAME (An Experimental Research at the Second Grade Students of SMP N 2 Baturraden in Academic Year 2013/2014) A THESIS Submitted to the English Department as a Partial
2004 Wave Propagation
 2004 Wave Propagation Overview: Students generate waves in containers of varying shapes and predict the relative arrival times for waves to reach different edges of the containers. Students record observations
Descriptive Statistics Project Is there a home field advantage in major league baseball?
 Descriptive Statistics Project Is there a home field advantage in major league baseball? DUE at the start of class on date posted on website (in the first 5 minutes of class) There may be other due dates
Your web browser (Safari 7) is out of date. For more security, comfort and. the best experience on this site: Update your browser Ignore
 is out of date. For more security, comfort and. the best experience on this site: Update your browser Ignore") Your web browser (Safari 7) is out of date. For more security, comfort and Activitydevelop the best experience on this site: Update your browser Ignore Fisheries and Seafood Consumption How do the locations
Your web browser (Safari 7) is out of date. For more security, comfort and Activitydevelop the best experience on this site: Update your browser Ignore Fisheries and Seafood Consumption How do the locations
The Willingness to Walk of Urban Transportation Passengers (A Case Study of Urban Transportation Passengers in Yogyakarta Indonesia)
") The Willingness to Walk of Urban Transportation Passengers (A Case Study of Urban Transportation Passengers in Yogyakarta Indonesia) Imam Basuki 1,a 1 Civil Engineering Program Faculty of Engineering -
The Willingness to Walk of Urban Transportation Passengers (A Case Study of Urban Transportation Passengers in Yogyakarta Indonesia) Imam Basuki 1,a 1 Civil Engineering Program Faculty of Engineering -
Investigating the Speed of Earthquake Waves
 Earthquakes Laboratory Investigation TEACHER NOTES Investigating the Speed of Earthquake Waves Key Concept Earthquakes produce primary and secondary waves, which travel at different speeds. The time between
Engineering Design Challenge. Mapping the Ocean Floor
 Engineering Design Challenge Project Title: Project Source: Project Submitter: Mapping the Ocean Floor NOAA, http://tinyurl.com/boydlek STEM Improvement Lesson Development Team Grade Level/Subject: Math,
Grade: 8. Author(s): Hope Phillips
: Hope Phillips") Title: Tying Knots: An Introductory Activity for Writing Equations in Slope-Intercept Form Prior Knowledge Needed: Grade: 8 Author(s): Hope Phillips BIG Idea: Linear Equations how to analyze data from
Title: Tying Knots: An Introductory Activity for Writing Equations in Slope-Intercept Form Prior Knowledge Needed: Grade: 8 Author(s): Hope Phillips BIG Idea: Linear Equations how to analyze data from
Statistical Analysis Project - How do you decide Who s the Best?
 Statistical Analysis Project - How do you decide Who s the Best? In order to choose the best shot put thrower to go to IASAS, the three candidates were asked to throw the shot put for a total of times
Bubble Technology, Part 2: How Are Bubble Blowers Different?
 Bubble Technology, Part 2: How Are Bubble Blowers Different? In this investigation, you will show what you have been learning about bubbles. You have already made observations and predictions - trying
Acknowledgement: Author is indebted to Dr. Jennifer Kaplan, Dr. Parthanil Roy and Dr Ashoke Sinha for allowing him to use/edit many of their slides.
 Acknowledgement: Author is indebted to Dr. Jennifer Kaplan, Dr. Parthanil Roy and Dr Ashoke Sinha for allowing him to use/edit many of their slides. Topic for this lecture 0Today s lecture s materials
FASTER, HIGHER, STRONGER LEVEL 4 - Year 5/6 WHAT DOES IT MEAN TO BE AN OLYMPIAN?
 LEVEL 4 - Year 5/6 WHAT DOES IT MEAN TO BE AN OLYMPIAN? 1 LEVEL 4 YEAR 5/6 KEY CONCEPT Athletes who aspire to compete in the Olympic Games must uphold Olympic values. FOCUSING QUESTIONS 1. Why do athletes
Bivariate Data. Frequency Table Line Plot Box and Whisker Plot
 U04 D02 Univariate Data Frequency Table Line Plot Box and Whisker Plot Univariate Data Bivariate Data involving a single variable does not deal with causes or relationships the major purpose of univariate
Growth: Humans & Surf Clams
 Growth: Humans & Surf Clams East Coast MARE Materials For the leader: Projector Whiteboard to project data graph onto White paper & markers For the activity: Copy of data table Copy of map Class graphing
Exemplar for Internal Achievement Standard. Mathematics and Statistics Level 1
 Exemplar for Internal Achievement Standard Mathematics and Statistics Level 1 This exemplar supports assessment against: Achievement Standard Investigate a given multivariate data set using the statistical
Box-and-Whisker Plots
 7.2 Box-and-Whisker Plots Essential Question How can you use a box-and-whisker plot to describe a data set? Drawing a Box-and-Whisker Plot 3 9 23 62 3 Numbers of First Cousins 0 3 9 3 45 24 8 0 3 3 6 8
The Bruins I.C.E. School Math 3 rd 5 th Grade Curriculum Materials
 The Bruins I.C.E. School Math 3 rd 5 th Grade Curriculum Materials Lesson 1: Line Plots Lesson 2: Bar Graphs Lesson 3: Mean, Median, Mode, Range, Maximum and Minimum Lesson 4: Classifying Angles Lesson
Classroom Activity: Population Study Game (Oh, Deer!)
") Classroom Activity: Population Study Game (Oh, Deer!) Subject: Biology/Ecology Grades: 6-12 Standards: See end of lesson plan Time: 20 minutes (can last longer depending on how many rounds you play) Materials:
Classroom Activity: Population Study Game (Oh, Deer!) Subject: Biology/Ecology Grades: 6-12 Standards: See end of lesson plan Time: 20 minutes (can last longer depending on how many rounds you play) Materials:
FISHING SUSTAINABILITY FOR NICOLE SAITO SIXTH-EIGHTH GRADE THREE 60 MIN. PERIODS HAWAI I STANDARD BENCHMARKS AND VALUES ETHNOMATHEMATICS
 FISHING FOR SUSTAINABILITY BY NICOLE SAITO How can we design a system that we can use to monitor the size of various fish in Hawai i s near-shore waters? MIDDLE SCHOOL SIXTH-EIGHTH GRADE TIMEFRAME THREE
Gas Laws. Essential Learning Outcomes: 1. Change can be measured. 2. Changes can occur within a substance that alters its identity.
 Gas Laws Gas Laws: Gases and pressures affect our lives every day. From the weather we experience to the air we breathe, it all has to do with gases and pressures. Why do we have wind? Why do we have the
Learning Outcomes (How achievement will be demonstrated by pupils) See Unit of Work
 See Unit of Work") Topic: Badminton Key Processes These are the essential skills and processes in PE that pupils need to learn to make progress within KS3 badminton. Learning Outcomes (How achievement will be demonstrated
Topic: Badminton Key Processes These are the essential skills and processes in PE that pupils need to learn to make progress within KS3 badminton. Learning Outcomes (How achievement will be demonstrated
Prerequisite skills: The students need have a basic understanding of scatter plots.
 Objective: Students will investigate the g-forces. Students will then create scatter plots given data in a table. Students will then use the graphs to analyze the data and make predictions about who will
Welcome to Step Outside with Togo & Nogo a road safety training resource for year 2 children
 Step Outside With Togo & Nogo, Teachers Guide Minimum System Specification, Pentium II Processor, Pentium IIII preferred, 256MB of physical memory, Minimum resolution of 800 x 600 16 bit colour 24 bit
TEAMING WITH INSECTS ENTOMOLOGY LEVEL 1 GRADES 3-5
 TEAMING WITH INSECTS ENTOMOLOGY LEVEL 1 GRADES 3-5 The Teaming with Insects curriculum is written for youth who enjoy learning about science and nature. The 4-H Entomology project offers many educational
Kids Ride the Bus. A Comprehensive Lesson Plan. Traffic Jamming
 Kids Ride the Bus A Comprehensive Lesson Plan A Comprehensive Lesson Plan Overview This environmental activity introduces students in grades 2 5 to the concept and reality of traffic congestion. They will
Lesson Plan 1 Topic of the lesson: Didactic perspective/ problem Learning targets Time Teaching phase Contents/ Comment
 Basketball Lesson Plan 1 Topic of the lesson: Basketball Didactic perspective/ problem: Basketball in a FL Learning targets: the pupils should: - get to know bilingual sports lessons - acquire basketball
The Bruins I.C.E. School
 The Bruins I.C.E. School Lesson 1: Area and Volume of a Cylinder Lesson 2: Using and Applying the Pythagorean Theorem Lesson 3: Investigating patterns of association in bivariate data Lesson 4: Investigating
Load Charts Annotated Instructor s Guide. Module MODULE OVERVIEW PREREQUISITES OBJECTIVES PERFORMANCE TASKS MATERIALS AND EQUIPMENT LIST
 Load Charts Annotated Instructor s Guide Module 21301-05 MODULE OVERVIEW This module discusses the importance of load charts and charts that apply to different configurations. It includes on-rubber, on-outrigger,
How Fast Can You Throw?
 Name Date Period How Fast Can You Throw? Directions: Find a spot 40 feet from a wall and mark it with a piece of chalk. From that point, you will throw the ball 5 times with your right hand, and then five
NHL & NHLPA Future Goals Program Hockey Scholar TM
 Curriculum Guide NHL & NHLPA Future Goals Program Hockey Scholar TM Your local NHL team has made it all the way to the Stanley Cup Final and now you just need to win 4 games to bring home the cup! You
Memo. Pat Hogan, USA Swimming Club Development Managing Director NEW MEMBERSHIP CATEGORY RECOMMENDATIONS
 Memo To: From: 2017 USA Swimming House of Delegates Pat Hogan, USA Swimming Club Development Managing Director RE: NEW MEMBERSHIP CATEGORY RECOMMENDATIONS Date: August 28, 2017 At the 2017 USAS Convention
Practice Test Unit 06B 11A: Probability, Permutations and Combinations. Practice Test Unit 11B: Data Analysis
 Note to CCSD HS Pre-Algebra Teachers: 3 rd quarter benchmarks begin with the last 2 sections of Chapter 6 (probability, which we will refer to as 6B), and then address Chapter 11 benchmarks (which will
Turbulence and How to Avoid It
 Turbulence and How to Avoid It Lesson Overview Wind turbines work best when they are exposed to consistent winds moving with constant speed and direction. Turbulence ( swirling winds ) causes problems.
DO YOU KNOW WHO THE BEST BASEBALL HITTER OF ALL TIMES IS?...YOUR JOB IS TO FIND OUT.
 Data Analysis & Probability Name: Date: Hour: DO YOU KNOW WHO THE BEST BASEBALL HITTER OF ALL TIMES IS?...YOUR JOB IS TO FIND OUT. This activity will find the greatest baseball hitter of all time. You
Ol Red Has Seen it All!
 Ol Red Has Seen it All! A Louisiana History lesson focusing on the past, present, and future importance of the Red River Louisiana Social Studies Content Standards: H-1D-M4 Locating and describing Louisiana
Stats 2002: Probabilities for Wins and Losses of Online Gambling
 Abstract: Jennifer Mateja Andrea Scisinger Lindsay Lacher Stats 2002: Probabilities for Wins and Losses of Online Gambling The objective of this experiment is to determine whether online gambling is a
The High School Math Project Focus on Algebra. Bottles and Divers. (Rates of Change)
") The High School Math Project Focus on Algebra Bottles and Divers (Rates of Change) Objective Students calculate the rate of change between two points on a curve by determining the slope of the line joining
The High School Math Project Focus on Algebra Bottles and Divers (Rates of Change) Objective Students calculate the rate of change between two points on a curve by determining the slope of the line joining
REACH REACH. STEM: Good Jobs Now and for the Future, by Commerce s Economics and Statistics Administration,
 STEM & Sailing Does this program have value to me? Can I implement some of the curriculum? Where/How can I implement these modules? Will I try it? How can I work with a US Sailing member organization?
Please ignore references to the curriculum packet in the narrative. Thank you and I hope your students enjoy the River Unit. Resources Recommended
 The Penobscot Nation Cultural and Historic Preservation Department s Curriculum Packet was originally designed as 12 separate units. Included with these units were the resources needed. Some resources
C est à toi! Level Two, 2 nd edition. Correlated to MODERN LANGUAGE CURRICULUM STANDARDS DEVELOPING LEVEL
 Communication Communicate in Languages other than English C est à toi! Level Two, 2 nd edition Correlated to MODERN LANGUAGE CURRICULUM STANDARDS DEVELOPING LEVEL Standard 1.1 Students engage in conversations,
Mathematics Assessment Program. Middle School Mathematics. Time Allowed Section A - 40 minutes; Section B - 40 minutes
 Mathematics Assessment Program MS - 3 Middle School Mathematics Time Allowed Section A - 40 minutes; Section B - 40 minutes These tasks give you a chance to show what you know and how you reason, and to
Introduction. Level 1
 Introduction Game Analysis is the second teaching and learning resource in the Science Through Sport series. The series is designed to reinforce scientific and mathematical principles using sport science
Dissecting data. Amanda Bromilow Virginia Institute of Marine Science. Grade Level Middle School. Subject area Life, Environmental, or Marine Science
 Dissecting data Amanda Bromilow Virginia Institute of Marine Science Grade Level Middle School Subject area Life, Environmental, or Marine Science This work is sponsored by the National Estuarine Research
7 th International Conference on Wind Turbine Noise Rotterdam 2 nd to 5 th May 2017
 7 th International Conference on Wind Turbine Noise Rotterdam 2 nd to 5 th May 2017 Sound power level measurements 3.0 ir. L.M. Eilders, Peutz bv: l.eilders@peutz.nl ing. E.H.A. de Beer, Peutz bv: e.debeer@peutz.nl
Provided by TryEngineering -
 Provided by TryEngineering - Lesson Focus Lesson focuses on sports engineering and advanced materials development. Students work in a team to devise a racquet out of everyday materials that can consistently
Become a Marine Biologist for the Day
 Become a Marine Biologist for the Day Grade: 9-12 Subject: Social Studies Duration: One three lessons Objectives It is expected that students will: Demonstrate an ability to present and interpret geographic
Rules Modernization FAQs March 2018 Update
 Rules Modernization FAQs March 2018 Update Background Questions 1. What was the motivation to modernize the Rules of Golf? The Rules of Golf are normally revised in a regular four-year cycle that allows
Prior Knowledge: Students should have an understanding that plants and animals compete for resources such as food, space, water, air and shelter.
 Science Lesson Plan Form Teacher: 4 th Grade Lesson: Predator/Prey SPI: 2.1 Science Goal: Recognize the impact of predation and competition on an ecosystem. What is the big idea of this standard? All life
A sunshade for the polar bear - a pedagogical programme on climate change (grade of age about 5-7 years)
") A sunshade for the polar bear 1 A sunshade for the polar bear - a pedagogical programme on climate change (grade of age about 5-7 years) Grade: Relation to curriculum: Duration: Keywords: pre-school /
A sunshade for the polar bear 1 A sunshade for the polar bear - a pedagogical programme on climate change (grade of age about 5-7 years) Grade: Relation to curriculum: Duration: Keywords: pre-school /
Beaver Fever. Adapted From: Oh Deer, Project Wild K-12 Activity Guide, Project WILD, p
 Beaver Fever Carrying Capacity Adapted From: Oh Deer, Project Wild K-12 Activity Guide, Project WILD, p. 36-40 Grade Level: Basic or intermediate Duration: Approximately 30 to 45 minutes depending on discussion.
A Study of Olympic Winning Times
 Connecting Algebra 1 to Advanced Placement* Mathematics A Resource and Strategy Guide Updated: 05/15/ A Study of Olympic Winning Times Objective: Students will graph data, determine a line that models
Lesson 14: Modeling Relationships with a Line
 Exploratory Activity: Line of Best Fit Revisited 1. Use the link http://illuminations.nctm.org/activity.aspx?id=4186 to explore how the line of best fit changes depending on your data set. A. Enter any
Educator Companion Guide
 All-Star Virtual Field Trip Educator Companion Guide Targeted Grade Level: 6-9 Overview The NBA All-Star Game is a basketball exhibition game hosted every February by the NBA, matching a mix of the league's
Lesson Plan: Bats and Stats
 Lesson Plan: Bats and Stats Lesson Designer: Leslie Knicl, Jefferson Middle School, 1115 S. Crescent, Champaign, IL 61821, knicle@cmi.k12.il.us Background: With the home run race consuming the sports news
Performance Task # 1
 Performance Task # 1 Goal: Arrange integers in order. Role: You are a analyzing a Julie Brown Anderson s dive. Audience: Reader of article. Situation: You are interviewing for a job at a sports magazine.
University of Victoria Campus Cycling Plan Terms of Reference. 1.0 Project Description
 University of Victoria Campus Cycling Plan Terms of Reference 1.0 Project Description The Campus Cycling Plan, a first for the University, will provide a comprehensive and coordinated approach to support
Oh Deer! Objectives. Background. Method. Materials
 Oh Deer! Objectives Students will (1) identify and describe food, water, and shelter as three essential components of habitat; (2) describe factors that influence carrying capacity; (3) define limiting
Journal of Chemical and Pharmaceutical Research, 2014, 6(3): Research Article
: Research Article") Available online www.jocpr.com Journal of Chemical and Pharmaceutical Research 2014 6(3):304-309 Research Article ISSN : 0975-7384 CODEN(USA) : JCPRC5 World men sprint event development status research
Available online www.jocpr.com Journal of Chemical and Pharmaceutical Research 2014 6(3):304-309 Research Article ISSN : 0975-7384 CODEN(USA) : JCPRC5 World men sprint event development status research
SOUTH PACIFIC COMMISSION. TWENTY-SECOND REGIONAL TECHNICAL MEETING ON FISHERIES (Noumea, New Caledonia, 6-10 August 1990)
") Page 1 ORIGINAL : ENGLISH SOUTH PACIFIC COMMISSION TWENTY-SECOND REGIONAL TECHNICAL MEETING ON FISHERIES (Noumea, New Caledonia, 6-10 August 1990) STOCK STATUS OF SKIPJACK TUNA IN THE WESTERN TROPICAL
Page 1 ORIGINAL : ENGLISH SOUTH PACIFIC COMMISSION TWENTY-SECOND REGIONAL TECHNICAL MEETING ON FISHERIES (Noumea, New Caledonia, 6-10 August 1990) STOCK STATUS OF SKIPJACK TUNA IN THE WESTERN TROPICAL
Evaluation copy. Wind Chill. computer OBJECTIVES MATERIALS
 Wind Chill Computer 28 A nice breeze can cool you down on a hot day or send a chill through you on a day that is already cold. Wind carries heat away from our bodies making us feel cooler. This phenomenon
Title: Solubility of Gas A Daily Experience. Subject: Chemistry. Grade Level: 10 th 12 th
 Title: Solubility of Gas A Daily Experience Subject: Chemistry Grade Level: 10 th 12 th Rational or Purpose: This lesson brings an everyday life experience to students knowledge on solubility of gas in
The Status Quo of Olympic Education in Japan
 20 The Status Quo of Olympic Education in Japan A Case Study in a University PE Class NAOFUMI MASUMOTO - JAPAN It may be said that Japanese people like the Olympic Games, as they record the second largest