Specifications and information are subject to change without notice. Up-to-date address information is available on our website.
|
|
|
- Myron Ross
- 5 years ago
- Views:
Transcription
1
2 Specifications and information are subject to change without notice. Up-to-date address information is available on our website. web:

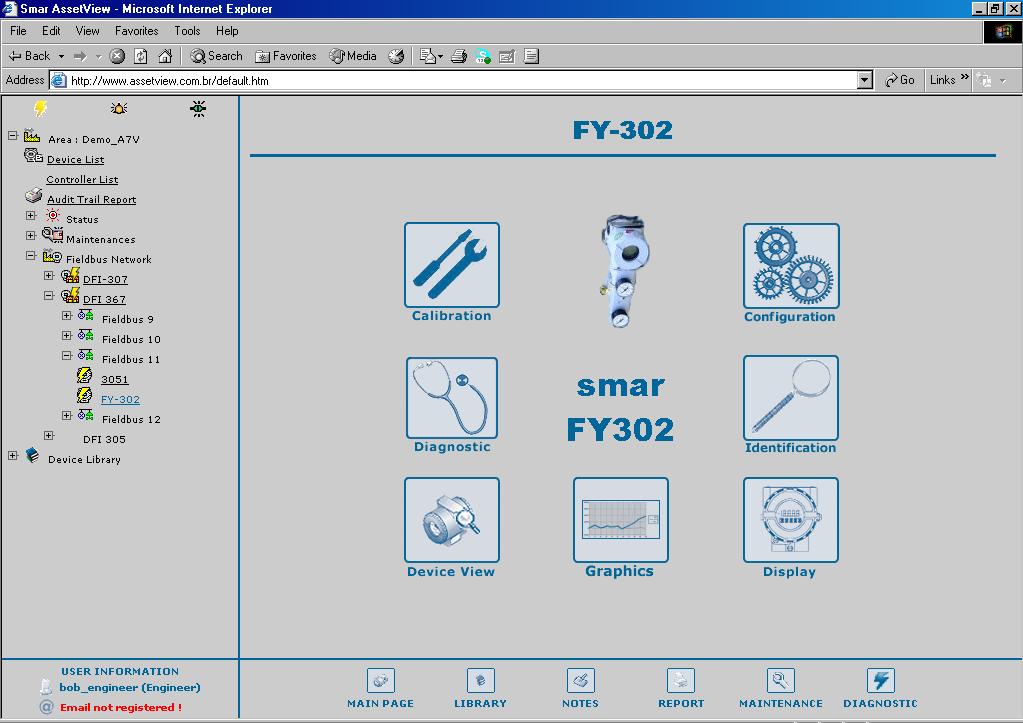
3 FY302 AssetView IHM FY302 - ASSETVIEW HMI FY302 Home Page This manual describes the pages developed for FY302 maintenance using AssetView. The figure below shows the options from FY302 initial page. Figure 1. FY302 Home Page The following sub-sections will describe each one of the pages developed for the device maintenance. FY302 Identification Page This page displays relevant information about the positioner. The user can easily identify and specify the positioner in the physical plant. 3

4 User s Manual Figure 2. Identification Page Device TAG DEVICE ID MANUFACTURER DEVICE TYPE DEVICE REVISION DD REVISION HARDWARE REVISION FIRMWARE REVISION DEVICE SERIAL NUMBER MAINBOARD SERIAL NUMBER MODULE SERIAL NUMBER ORDERING CODE Indicates the associated tag to the positioner in the physical plant. The tag can have up to 32 characters. Indicates the identification code of the positioner. This code can have up to 32 characters. Identifies the positioner manufacturer. Identifies the positioner type for a specific manufacturer. Indicates the positioner revision. Indicates the DD revision. Indicates the positioner hardware revision. Indicates the positioner firmware revision. Indicates the positioner serial number. Indicates the main board serial number. Indicates the serial number of the positioner transducer module. Indicates the positioner ordering code. Actuator ACT MAIN ID Indicates the identification number of the actuator manufacturer. ACT MODEL NUM ACTUATOR SERIAL NUMBER Indicates the identification number of the actuator model. Indicates the actuator serial number. Valve VALVE MAIN ID VALVE MODEL NUM VALVE SERIAL NUMBER Indicates the identification number of the valve manufacturer. Indicates the identification number of the valve model. Indicates the valve serial number. 4

5 FY302 AssetView HMI FY302 Configuration Page There are a few parameters in the FY302 transducer block that can be used in the predictive and proactive maintenance. Some of them can be read online, while other parameters require that the process to stop or the plant control to be set to manual. It is possible to detect performance decreasing comparing the current parameters with standard values and therefore determine the predictive and proactive maintenance. The user can check the general diagnostic status in the FY302 Diagnostic Page. Operational Statistics (OEs) are data stored in the device that inform its usage, abnormal behaviors, or number of times that a specific condition occurred, such as total valve travel (odometer), total of reversals and maximum deviation limit between the valve position and the set point. Using the FY302 Configuration Page, the user can set limit conditions for the operational statistics. If a specific OE reaches the limit value, the device notifies the system and this notification is highlighted in the Diagnostic Page. Figure 3. Configuration Page 5
6 User s Manual Device Operation Mode Indicates the operation mode for the device: OOS AUTO MAN CAS If this mode is selected, the value of Mode Block parameter will be Out of Service for the Resource, Transducer and Analog Output blocks. If this mode is selected, the value of Mode Block parameter will be Auto for the Resource, Transducer, Display and Analog Output blocks. If this mode is selected, the value of Mode Block parameter will be Manual for the Analog Output block, and Auto for the Resource, Transducer and Display blocks. If this mode is selected, the value of Mode Block parameter will be Cas for the Analog Output block, and Auto for the Resource, Transducer and Display blocks. Deviation Alert DEVIATION ENABLED DEVIATION TIME Enables checking the difference between the current valve position and the desired set point. If this difference exceeds the dead band for more than a given time period, an alert will be generated and will remain active until this difference decreases. This time period is in seconds. The valve must exceed the dead band during this time period before generating an alert. DEVIATION DEAD BAND Indicates the magnitude of the valve deviation value (in percentage). An alert is generated when the valve exceeds this value during a given time period. The user can check the status of this diagnostic alarm in the FY302 Diagnostic Page, in Deviation Limit Exceeded. Reversal Alert REVERSAL It indicates the number of times that the valve changes the direction according to the movement. The reversal total is increased when the valve changes the direction. When the total of movement exceeds the specified limit an alarm is generated. REVERSAL ENABLED REVERSAL LIMIT REVERSAL DEAD BAND Enables checking the difference between the reversal total and an established limit. An alert is generated when the reversal total exceeds this limit. If it is false the counter will not be increased (Reversal Count). Indicates the reversal total limit. An alert is generated when the reversal total exceeds this limit. Enter a reversal value lower than the limit to acknowledge the alert. Indicates the magnitude of the valve movement value (in percentage). This value is used to increase the reversal total. The user can check the general diagnostic status in the FY302 Diagnostic Page. See the following example. 6


7 FY302 AssetView HMI Figure 4. Reversal Alert The user can check the alarm generated in the FY302 Diagnostic Page: Figure 5. Advanced Diagnostics Note that the variable Reversals in the Valve Totals area exceeded the limit specified. The alarm is indicated in red in the Advanced Status area. Travel Accum Alert TRAVEL (odometer) It indicates the equivalent number of full strokes. The travel is increased when the number of changes exceeds the dead band value. It is used to indicate that the diaphragm needs to be replaced and the actuator needs overhaul. TRAVEL ENABLED TRAVEL LIMIT TRAVEL DEAD BAND Enables checking the difference between the odometer and an established limit. An alert is generated when the odometer exceeds this limit. Indicates the odometer value limit. An alert is generated when the odometer exceeds this limit. Enter an odometer value lower than the limit to acknowledge the alert. Indicates the magnitude of the valve movement value (in percentage). This value is used to increase the odometer. The user can check the status of this diagnostic alarm in the FY302 Diagnostic Page, in Travel Limit Exceeded. 7

8 User s Manual Sensor Pressure Alert An alert is generated every time the input pressure exceeds the limit. The user can check the general diagnostic status in the FY302 Diagnostic Page. HIGH LIMIT LOW LIMIT Indicates the maximum limit of the input pressure. Indicates the minimum limit of the input pressure. NOTE An alarm will be generated when the input pressure is lower than Low Limit (Supply pressure too low), and another one will be generated when it exceeds High Limit (Supply pressure too high) limit. These alarms only will be generated when the sensor pressure is installed. Travel Control The valve travel conditions will be based on the parameters below. CHARACTERIZATION TYPE CURVE BYPASS CURVE LENGTH FINAL VALUE CUTOFF LOW FINAL VALUE CUTOFF HIGH TRAVEL LIMIT LOW TRAVEL LIMIT HIGH Valve characterization type: LINEAR: the real position will be represented as a linear chart with the desired position. TABLE: the user can characterize the real positions according to its application. EP25, EP33, and EP50: the EP (Equal Percentage) curves provide a larger travel only for wide set point variation. QO25, QO33, and QO50: the QO (Quick Open) curves provide a larger travel for narrow set point variation. Enables/disables the curve. Indicates the number of points that will be used to define the curve. If FINAL VALUE is less than this value the valve is forced to be fully closed. FINAL VALUE is the value of the desired position. If FINAL VALUE is greater than this value the valve is forced to be fully open. FINAL VALUE is the value of the desired position. Odometer lower limit. Odometer upper limit. The user can check the general diagnostic status in the FY302 Diagnostic Page. In the Characterization Type parameter select the Table option, and the table will appear. To configure the points that define the characterization curve, click the link Curve X/ Curve Y, as indicated below: Figure 6. Characterization Curve 8


9 FY302 AssetView HMI Type the points of the curve and click Submit to send the values to the device. Click Configuration link to return to the configuration page. Figure 7. Points Table FY302 Diagnostics Page This page displays the device status. Figure 8. Diagnostic Page 9
10 User s Manual Valve Totals STROKES REVERSALS TRAVEL (odometer) Indicates the number of times that the valve fully opens and closes. Indicates the number of times that the valve changes the direction according to the movement. The number of reversals is increased when the valve changes the direction and the movement exceeds the dead band. Indicates the equivalent number of full strokes. The travel is increased when the number of changes exceeds the dead band value. It is used to indicate that the diaphragm needs to be replaced and the actuator needs overhaul. Valve Performance CLOSING TIME OPENING TIME Indicates the time period (in seconds) that the valve spent to go from fully opened to fully closed. This time is used to indicate a problem with the actuator, diaphragm leak and problem with the pneumatic tube. Indicates the time period (in seconds) that the valve spent to go from fully closed to fully opened. This time is used to indicate a problem with the actuator, diaphragm leak and problem with the pneumatic tube. Valve Position POSITION Indicates the current valve position. Temperature HIGHEST TEMPERATURE LOWEST TEMPERATURE CURRENT TEMPERATURE Indicates the highest temperature value measured by the positioner temperature sensor. Indicates the lowest temperature value measured by the positioner temperature sensor. Indicates the temperature value measured by the positioner temperature sensor. Advanced Status Shows the status of the continuous diagnostic, including the conditions of the mechanical module. MAGNET NOT CENTRALIZED OR NOT DETECTED SLOW VALVE MOVEMENT OR LOW AIR SUPPLY TEMPERATURE OUT OF RANGE BASE NOT TRIMMED OUTPUT MODULE NOT INITIALIZED OR NOT CONNECTED DEVIATION LIMIT EXCEEDED Automatic alarm: the magnet is not centralized or it was not detected. Automatic alarm: there is a slow valve movement or low air supply. Automatic alarm: the temperature is out of range. Automatic alarm: the base is not trimmed. Automatic alarm: the output module is not connected to the circuit board or it was not initialize. This alarm indicates the Deviation Limit configured in the configuration page was exceeded. TRAVEL LIMIT EXCEEDED This alarm indicates the odometer counter limit configured in the configuration page was exceeded. REVERSAL LIMIT EXCEEDED This alarm indicates the Reversal Limit configured in the configuration page was exceeded. 10
11 Sensor Pressure SENSOR PRESSURE IN FY302 AssetView HMI Indicates the input pressure sensor reading. SENSOR PRESSURE OUT1 Indicates the pressure sensor reading of the output 1. SENSOR PRESSURE OUT2 Indicates the pressure sensor reading of the output 2. Sensor Pressure Status SENSOR PRESSURE STATUS Indicates the status of the input pressure sensor. Status Shows the continuous diagnostic of the device status, including the condition of function block, electronic and the mechanical module. All of the alarms are automatic, that is, the device will notify the user even if the alarm has not been configured. BLOCK CONFIGURATION ERROR LINK CONFIGURATION ERROR SIMULATE ACTIVE LOCAL OVERRIDE DEVICE FAULT STATE SET DEVICE NEEDS MAINTENANCE SOON INPUT FAILURE/PROCESS VARIABLE HAS BAD STATUS OUTPUT FAILURE MEMORY FAILURE LOST STATIC DATA LOST NV DATA READ BACK CHECK FAILED DEVICE NEEDS MAINTENANCE NOW POWER UP OUT-OF-SERVICE GENERAL ERROR CALIBRATION ERROR CONFIGURATION ERROR Indicates error in the hardware and software components associated to the block. Indicates the error in the link configuration. Indicates that the device is on simulation mode. Indicates that the device is being operated manually. Indicates that the device is in safe fault state condition. Internal diagnostic according to the user configuration or device internal checking has detected that the device will need maintenance soon. Condition of the process variable is BAD. Indicates a failure in the output that could be due to the electronic or the mechanical module. Indicates an electronic failure according to the internal checking process, such as an incorrect checksum detected in the main memory. Indicates that the device lost data from the flash or the EEPROM memory. Indicates that the device lost data from the RAM memory. Indicates a discrepancy in the reading of return value. This may have been caused by a hardware failure. Internal diagnostic according to the user configuration or device internal checking has detected that the device needs maintenance. Indicates that the device has finished the initial operation procedure. Indicates that the function block is out of service. An error has occurred and could not be classified as one of the errors below. An error occurred during the device calibration or a calibration error has been detected during the device operation. An error occurred during the device configuration or a configuration error has been detected while operating the device. 11

12 User s Manual ELECTRONIC FAILURE MECHANICAL FAILURE I/O FAILURE DATA INTEGRITY ERROR SOFTWARE ERROR ALGORITHM ERROR An electronic component has failed. A mechanical component has failed. I/O failure has occurred. Indicates that data stored in the system may be no longer valid, because the checksum of the data in the RAM memory has failed when compared to the data in the non-volatile memory. The software has detected an error that may have been caused by a deviation to a wrong routine, an interruption, a lost pointer, etc. The algorithm used in the transducer block generated an error, such as, a data overflow. FY302 Graphics Page This page allows the user to configure the FY302 graphs. Select the type of the graph, type the delay time to get the desired position (Delay) and click New Graph. 12 Figure 9. Graphics Page Remember that this procedure must be executed when the process stops or the plant control is set to manual. Movements of opening and closing may interfere in the process. AssetView will set the Resource and Transducer Mode blocks to Auto to draw the chart. The mode block values will be restored at the end of this process. CHARACTERIZATION This chart will show the behavior of the current valve position compared to the desired value. AssetView will generate the desired value. The user can analyze the behavior of the valve response, such as stuck and stress. It will be easier to set the positioner parameters in the Calibration page, such as the Servo_Gain and the Servo_Reset, according to the application tuning and the positioner dynamic response. This chart helps the preventive and predictive maintenance because the user can save the curves and compare them later. Performance results are related to the chosen characterization type, Servo gains and Servo reset parameters.


13 FY302 AssetView HMI Remember that the response curve will depend on the response inertia of the valve analyzed. For slow valves, the time configured must be longer because it takes longer for the valve to reach the desired position. See the example below: Figure 10. Characterization Graph Click Compare to compare characterization charts. On the Type Graph menu, select Characterization. Select the moment for the valve position VP1 and another moment for the valve position VP2. Click Compare to conclude. See the example below: Figure 11. Comparing Graphs STEP RESPONSE: This chart will show the behavior of the current valve position and the desired position related to the time. It is an easier way to check the tuning between the servo PID and the positioner. The user can analyze the behavior of the valve response, such as stuck and stress. It helps the preventive and predictive maintenance because the user can save the curves and compare them later. 13


14 User s Manual Performance results are related to the chosen characterization type, Servo gains, Servo reset parameters and the valve inertia (slow or fast valve response). After configuring the Delay, set the value for the Setpoint and click Write to start. This chart allows the user observe it ranging in time during the analysis. Figure 12. Step Response Graph Click Compare to compare the valve response charts. On the Type Graph menu, select Step Response. Select the moment to be compared and click Compare to conclude. See the example below: Figure 13. Comparing Graphs VALVE SIGNATURE This chart will show the behavior of the position related to the output pressure. The desired value will be generated by AssetView. This chart allows the user to analyze the behavior of the valve response according to the air pressure. For example, the user can save the chart during the installation or commissioning, and then, compare the current chart with the one saved before. It will be possible to check if more pressure is necessary to establish the same position. If it is true, it means that there is a mechanical stuck. 14


15 FY302 AssetView HMI NOTE The chart Valve Signature will be plotted only if the FY302 has the pressure sensor. Performance results are related to the chosen characterization type, Servo gains, Servo reset parameters and input pressure. See the example below: Figure 14. Valve Signature Graph Click Compare to compare the valve response charts. On the Type Graph menu, select Valve Signature. Select the moment to be compared and click Compare to conclude. See the example below: Figure 15. Comparing Graphs HYSTERESIS: This chart will show the hysteresis behavior of the valve when moving the valve from fully closed to fully opened, and vice-versa. It lets the user analyze the behavior of the valve response, such as stuck and stress. It helps the preventive and predictive maintenance because the user can save the curves and compare them later. Performance results are related to the chosen characterization type, Servo gains and Servo reset parameters. 15

 related to the time.")
16 User s Manual Remember that the response curve will depend on the response inertia of the valve analyzed. For slow valves the time configured must be longer because it takes longer for the valve to reach the desired position. Figure 16. Hysteresis Graph Click Compare to compare the valve response. On the Type Graph menu, select Hysteresis. Select the moments to be compared, and click Compare to conclude. See the example below: Figure 17. Comparing Graphs TRAVEL DEVIATION This chart will show the behavior of the error accumulated in the process (between the current valve position and the desired position) related to the time. It allows the user analyze the behavior of the valve response, such as stuck and stress. It helps the preventive and predictive maintenance because the user can save the curves and compare them later. The value that appears in the histogram is the arithmetic average of 10 acquisitions. In stuck conditions the error accumulated tends to increase because the instantaneous error increases. This fact can be verified since the servo PID action increases. 16


17 FY302 AssetView HMI Figure 18. Travel Deviation Graph AS FOUND AS LEFT This chart allows the user to store the device status before executing a calibration procedure. The user can save the chart of the set point related to the Primary Value. After executing the calibration, generate the chart again with the same characteristics to analyze the deviation. Figure 19. As Found As Left Graph Select the Deviation option to show the error values for each point written in the device. Click Compare to compare the valve response. On the Type Graph menu, select As Found As Left. Select the moments to be compared, and click Compare to conclude. See the following example: 17

18 User s Manual Figure 20. Comparing Graphs 18

19 FY302 AssetView HMI FY302 Calibration Page This page displays configuration data used in the calibration procedures. Device Operation Mode Indicates the operation mode for the device: Figure 21. Calibration Page OOS AUTO MAN CAS If this mode is selected, the value of the Mode Block parameter will be Out of Service for the Resource, Transducer, and Analog Output blocks. If this mode is selected, the value of the Mode Block parameter will be Auto for the Resource, Transducer, Display, and Analog Output blocks. If this mode is selected, the value of the Mode Block parameter will be Manual for the Analog Output block, and Auto for the Resource, Transducer, and Display blocks. If this mode is selected, the value of the parameter Mode Block will be Cas for the Analog Output block, and Auto for the Resource, Transducer and Display blocks. 19
20 User s Manual Valve Settings TYPE FAULT STATE FAULT STATE TIME AIR TO VALVE ACT The user configures the valve type: linear or rotary. Safe fault value (in percentage). Indicates the time before the valve changes to the safe fault value (in seconds). Air condition to open or close. Action type: direct or reverse. The options are: Invert, SP tracks PV if Man, SP tracks PV if LO, SP tracks RCas or Cas if LO or Man, Increase to close, Faultstate Type, Faultstate restart, Target to Man, PV for BKCal_Out, Low Cutoff. Tuning Settings RATE DOWN RATE UP KP TR SERVO PID DEAD BAND SERVO PID BYPASS BACKUP RESTORE Configures the set point step-down rate (in percentage) related to the time. Configures the set point step-up rate (in percentage) related to the time. Servo PID proportional gain. Servo PID integral time. Set the Servo PID dead band. It should not be changed by the user. Enables/disables the Servo PID. Enables save and restore the calibration, setup and important configuration data. It is recommended to run the backup process with the option Sensor Data Backup after the auto-calibration process (setup). Calibration Information MIN SPAN UNIT METHOD LOCATION DATE WHO Indicates the smallest difference allowed between the calibration upper position and the calibration lower position. Indicates the calibration unit, always in percentage. Indicates the calibration method. When leaving the factory, the device is calibrated according to the manufacturer criteria. If the user calibrates the positioner, it will indicate that the user executed the calibration. Indicates the location of calibration, such as a laboratory, area 1, etc. Indicates the date of the executed calibration. Indicates the person responsible for the executed calibration. Position Scale EU 0% EU100% UNITS INDEX Indicates the lower limit for the input scale of the position variation. Indicates the upper limit for the input scale of the position variation. Indicates the engineering unit: percentage (%), radian (rad) or millimeter (mm). 20

21 Temperature Calibration CAL TEMPERATURE FY302 AssetView HMI Indicates the last temperature calibration value of the positioner temperature sensor. The user must type the reference temperature and the device will be calibrated with this value. Note the - 40 to 85 º C limits when executing the calibration. SECONDARY VALUE UNIT Indicates the unit related to the temperature. Advanced Setup TSO FINAL VALUE CUTOFF LOW FINAL VALUE CUTOFF HIGH If FINAL VALUE is less than this value the valve is forced to be fully closed. FINAL VALUE is the value of the desired position. If FINAL VALUE is greater than this value the valve is forced to be fully opened. FINAL VALUE is the value of the desired position. Set Point Limits SP LO LIMIT SP HI LIMIT Set point lower limit of the AO Block. Set point upper limit of the AO Block. Flow Char CHARACTERIZATION TYPE CURVE BYPASS CURVE LENGTH Valve characterization type: LINEAR: the real position will be represented as a linear chart with the desired position. TABLE: the user can characterize the real positions according to the application. EP25, EP33, and EP50: the EP (Equal Percentage) curves provide a larger travel only for wide set point variation. QO25, QO33, and QO50: the QO (Quick Open) curves provide a larger travel for narrow set point variation. Enables/disables the curve. Indicates the number of points that will be used to define the curve. After selecting the table, the user must type the input and output values in percentage. To configure the points that define the characterization curve, click the link Curve X/ Curve Y, as indicated in the following figure. The table with the points will open: Figure 22. Configuring the Characterization Curve 21
 before connecting it to the process.")
22 User s Manual Figure 23. Points Table Type the curve points and click Submit to send the values to the device. Click Calibration link to return to the calibration page. User Calibration NOTE Whenever the positioner is installed to a valve, it is necessary to execute the auto-calibration procedure (setup) before connecting it to the process. The setup procedure will move the valve searching for the physical limits of the position. The user must install the positioner when the valve is isolated from the process and air is directly applied to it using a manual regulator. Match the arrow of the magnetic part with the arrow of the positioner transducer module when the valve is at 50.0%. This procedure is crucial for the properly operation of the positioner. For further details consult the FY302 manual. The setup procedure is necessary even before the lower or upper position calibration. LOWER POS CALIBRATION POINT This method is used when the user wants to calibrate the 0 and the 100% limits differently from the physical limits set during the setup process. Use this procedure in applications that involve Splitter Range conditions. When this method is selected, a message box appears warning the user that this procedure must be executed when the process stops or the plant control is set at manual. Opening and closing movements may interfere in the process. 22

23 FY302 AssetView HMI Figure 24. Configuring the Mode Block Click OK and complete the information about the calibration, indicating the location of the calibration, the date and the person responsible for the calibration: Figure 25. Calibration Data The valve will move to the lower position. The message shown in the figure below appears. Wait until the valve stabilizes the position, and click Ok to continue. Figure 26. Stabilizing the Position Check the current physical position of the lower limit, which is indicated in the actuator scale, and type this value in the New Position text field: Figure 27. Valve New Position Suppose that the value read in the actuator scale is 10.0%. After the user types this value and click Ok, the positioner will correct the lower position (set at around 0%). Negative values for the position will execute the correction in the opposite direction of the movement. 23

24 User s Manual Verify the scale and indicate if the correction was successful or the calibration procedure must be executed again. Figure 28. Checking the Calibration If the correction was successful, click No. Otherwise, if the calibration is not suitable, click Yes. The user can execute the correction. It is possible to lie to the positioner about the value read from the actuator scale. In this way, the positioner will be calibrated lower, according to the user necessities. It is possible to save the calibration in the EEPROM memory of the positioner transducer module, which is recommended. Click Yes to save the calibration data. Figure 29. Saving Calibration Data UPPER POS CALIBRATION POINT This method is similar to the Lower Pos Calibration procedure described above. It is used when the user wants to calibrate the 0 and the 100% limits differently from the physical limits set during the setup process. Use this procedure in applications that involve Splitter Range conditions. When this method is selected, a message box appears warning the user that this procedure must be executed when the process stops or the plant control is set at manual. Opening and closing movements may interfere in the process. Figure 30. Configuring the Mode Block Click OK and complete the information about the calibration, indicating the location of the calibration, the date and the person responsible for the calibration: 24

.")
25 FY302 AssetView HMI Figure 31. Calibration Data The valve will move to the upper position. The message shown in the following figure appears. The user must wait until the valve stabilizes the position and click Ok to continue. Figure 32. Stabilizing the Position Check the current physical position of the upper limit, which is indicated in the actuator scale, and type this value in the New Position text field: Figure 33. Valve New Position Suppose the value read in the actuator scale is 90.0%. After the user types this value and click Ok, the positioner will correct the upper position (set at around 100%). Negative values for the position will execute the correction in the opposite direction of the movement. Verify the scale and indicate if the correction was successful or the calibration procedure must be executed again. Figure 34. Checking the Calibration If the correction was successful, click No. Otherwise, if the calibration is not suitable, click Yes. The user can execute the correction. It is possible to lie to the positioner about the value read from the actuator scale. In this way, the positioner will be calibrated higher, according to the user necessities. 25


26 User s Manual It is possible to save the calibration in the EEPROM memory of the positioner transducer module, which is recommended. Click Yes to save the calibration data. Figure 35. Saving Calibration Data SETUP When this method is selected, a message box appears warning the user that this procedure must be executed when the process stops or the plant control is set at manual. Opening and closing movements may interfere in the process. Please refer to the FY302 manual for setup details. Figure 36. Configuring the Mode Block Click OK and the valve will move searching for the lower and upper physical position. Depending on the valve inertia this process may take a few minutes. Figure 37. Valve Movement The progress bar indicates the procedure progress. The user can also verify the setup status. A message box will appear indicating that the Setup process is completed. 26


27 FY302 AssetView HMI Figure 38. Concluding the Calibration At the end of the setup, it will be possible to save the data: Figure 39. Saving Calibration Data SETUP REPORT This option provides an analysis of the data stored during the last Setup process. The data has information about the HALL and the PIEZO sensors. It is useful to report a problem during the Setup process. There are cases where the Setup process is executed and the valve is stuck or the input pressure is too low to allow the valve movement. In this case, the process will be finalized with Time Out and the lower and upper values of the HALL sensor will be practically the same, which indicates no movement. Another example is the voltage condition of the PIEZO sensor that must be between 30 and 60V in a stable condition and a fixed position. If the voltage is out of this range the mechanical calibration will be necessary at the PIEZO sensor. Figure 40. Setup Report Click Ok. The figure below shows the Setup Report options: Figure 41. Report Data 27

28 User s Manual Pot DC: VALUE Digital Hall Value: VALUE HIGHEST CAL HALL VALUE LOWEST CAL HALL VALUE DA Output Value: VALUE HIGHEST CAL DA VALUE LOWEST CAL DA VALUE STATUS Piezo: VALUE STATUS The constant DC value for piezo sensor. Indicates the current value of the HALL sensor according to the current position. Upper value of the HALL sensor calibrated during the Setup process or Upper Pos Calibration process. Lower value of the HALL sensor calibrated during the Setup process or Lower Pos Calibration process. Indicates the current value of the D/A converter. Upper value of the D/A converter calibrated during the Setup process or Upper Pos Calibration process. Lower value of the D/A converter calibrated during the Setup process or Lower Pos Calibration process. Status of the D/A converter value. Indicates the value of the PIEZO sensor voltage. Indicates the status of the PIEZO sensor voltage. PRESSURE SENSOR CALIBRATION: Selecting this method the user can calibrate the pressure sensors, when they are installed in the positioner. These installations depend on the positioner version. When this method is selected, a message box appears warning the user that this procedure must be executed when the process stops or the plant control is set at manual. Opening and closing movements may interfere in the process. Figure 42. Checking the Sensor Pressure In the same window is possible select the sensor that will be calibrated and the respective calibration (upper or lower). Click Next to continue. 28


29 FY302 AssetView HMI A message will appear indicating the pressure values. The selected pressure and calibration will be shown according to measured pressure. Click Next to confirm that the pressure and calibration are correct. Otherwise, do the corrections, click Submit, and then, Next. Figure 43. Sensor Calibration Data It is possible to save the calibration in the EEPROM memory of the sensor module, just select the option. Click Next and a window will appear to complete the information about the calibration location, the date and the person responsible for the calibration: Click Ok to finish the configuration. Figure 44. Sensor Calibration Data TEMPERATURE CALIBRATION: Selecting this method the user can calibrate the temperature sensor. Click the Temperature Calibration option and the following window will appear: 29


30 User s Manual Figure 45. Calibrating the temperature Verify if the temperature is correct. Otherwise, it can be changed in the Cal Temperature field. Click Next and the following window will appear. Figure 46. Temperature Calibration Data Click OK and complete the information about the calibration, indicating the location of the calibration, the date and the person responsible for it. OVERRIDE: Selecting this method, the user can verify the desired position according to a previous Set Point. The message box will appear warning the user about the safe procedures. Figure 47. Configuring the Mode Block Click Next to start the process. Select the set point value, and click Ok. 30


31 FY302 AssetView HMI Figure 48. Selecting the Set Point DYNAMIC VALUES: Selecting this method the user can verify the dynamic values of the device. Figure 49. Dynamic Values 31

32 User s Manual FY302 Display Page The user can save the data shown in the device's display. Figure 50. Display Page Display Options BLOCK TAG PARAMETER SUB INDEX MNEMONIC INC DEC DECIMAL POINT NUMB ACCESS ALPHA NUM Shows the tags list for the available instantiated blocks. Shows the list of available parameters to be displayed in the LCD for the selected block in the Block Tag option. Indicates the sub-index of the selected parameter. Indicates the mnemonic of the selected parameter in the Parameter option. Indicates the value to be added or subtracted when acting in the parameter via local adjustment. Indicates the number of digits after the decimal point that will be shown in the LCD. The user can select the access type of the selected parameter: monitoring or action. Indicates if the alphanumeric field will be used for mnemonic or for value. FY302 Device View Page The user can monitor the device's data opening the Device View page. 32

33 FY302 AssetView HMI Diagnostic and Maintenance for Positioners Figure 51. Device View Page With AssetView, the user can take advantage of the digital information provided by fieldbus and HART protocols. The AssetView is a powerful tool for configuring the parameters of positioners and control valves, assisting the control system management and the predictive maintenance. It provides the information about the network, online performance tests (charts and trends), positioners configuration/calibration, performance monitoring and online diagnostics. The user can also analyze the data stored from several periods ( as found, as left ), reconcile configurations according to the application needs, and print reports for later analysis. With AssetView, the user can act and control the process stability and its variation by viewing the entire process control, then optimizing the use of devices and assuring a continuous improvement for the system operation. The main goals are to provide a low-cost maintenance, guarantee the continuous and operational functionality of the devices with performance levels accepted by the application process control, minimize the efforts for the corrective maintenance and adapt the system for a safe and reliable operational expansion. The use of the AssetView starts during the devices commissioning and the process startup, when the user creates the database to be used as reference. The initial database is periodically compared to the current data. In this initial process, the network tuning is optimized according to the processes. The charts and trends will be used. The diagnostics online monitoring allows the user to easily detect the status of the positioners and control valves. In the Calibration Page, the user can execute the Auto Setup and calibrate the position, assuring the operation performance of the positioners and control valves. Preventive and Predictive Maintenance for Positioners The status of the positioners and valves must be followed periodically through the Diagnostics Page, for predictive maintenance purposes. The tracking can minimize maintenance costs, because the maintenance will focus on the devices that really need maintenance, and in that way it will be possible to plan and reduce the plant idle time. Configuring the process to manual or off-line, it is possible monitoring and testing the performance to evaluate the general operation condition of the positioners and control valves. 33
34 User s Manual The positioners service and calibration are executed to assure the control precision and the best valves performance. These procedures are executed when the process stops or in Manual mode, and it is not necessary to remove the valves from the process. The analyses and the services suggested by the analysis results are reported right after the tests, and all of the results can be saved in the maintenance database. For example, the analysis can indicate valve stuck. After analyzing the tests, it is possible to create a time reference between the calibrations or maintenance of the positioners, actuators and valves. For the positioners, the tests may indicate the actions needed, such as gain adjustments, improvement of the air system or tuning adjustment. The frequency criterion and the analyses system are essential for the information acknowledgement, so the information stored can be useful for the proactive maintenance. After the calibration, it will be necessary to check the valve signature and verify the dynamic response. If the result is not acceptable, it will be necessary to analyze the valve/actuator and positioner/valve conditions to find the best parameterization. If the control valves tested continue to report control problems, the valve designs should also be analyzed. The design will be based on the minimum, medium and extreme conditions of the process. This phase must be conducted by an application engineer or an expert technician. The great advantage of the digital technology is the qualitative information, not only the process values, in addition to the online monitoring of the valve operation conditions and to the online analysis of the performance curves and deviations. The technology used in the FY302 positioner provides powerful diagnostic algorithms and, through AssetView, it also provides powerful resources for the predictive analyses. The positioner has characterization resources (tables, QO and QE curves), input and output pressure monitoring, temperature monitoring, travel control, strokes control, reversals control, input signals, set point, deviation, etc. With AssetView, it is possible to do online diagnostics safely, without interrupting the process. It is possible to configure the travel limits, strokes, reversals, and alarms. With these features the user can track the device condition and prevent problems in the process. The information are read and saved in the tool history for a specific configuration, helping to plan and execute the maintenance. The AssetView can be accessed from anywhere because it was built on Web technology. It is recommended to generate the charts before and after maintenance to register the status of the positioner, the valve, the actuator and the database. The database will be analyzed later to assist the user to decide the period of time needed between maintenances, delaying the following maintenance and reducing the idle time of the device. AssetView and the Proactive Maintenance Because of the resources available in the positioner and the online monitoring, it is possible to implement the proactive maintenance, determining the problems and their causes. The potential diagnostic of the field devices allows monitoring and conditions register, such as valve stress. Through the diagnostics, the plant technicians execute the proactive maintenance based on the online information, before the problem occurs, not waiting for the maintenance planned, avoiding and reducing the idle time of the plant. The proactive maintenance in the FY302 is implemented by configuring the alarms in the FY302 Configuration Page, such as Reversal, Deviation and Travel. After configuring the alarms, the user can view the alarms in the FY302 Diagnostics Page according to the previous configuration, such as Reversal Limit Exceed, Deviation Limit Exceed and Travel Limit Exceed. The alarms that were not configured by the user are also displayed in the Diagnostics Page, such as Slow Valve Movement or Low Air Supply, Base not Trimmed, Output Module not Initialized or not Connected, etc. 34
Specifications and information are subject to change without notice. Up-to-date address information is available on our website.
 www.smar.com Specifications and information are subject to change without notice. Up-to-date address information is available on our website. web: www.smar.com/contactus.asp LD302 - AssetView HMI LD302
Data Sheet T 8389 EN. Series 3730 and 3731 Types , , , and. EXPERTplus Valve Diagnostic
 Data Sheet T 8389 EN Series 3730 and 3731 Types 3730-2, 3730-3, 3730-4, 3730-5 and Type 3731-3 Electropneumatic Positioners EXPERTplus Valve Diagnostic Application Positioner firmware to detect potential
Series 3730 and Series 3731 EXPERTplus Valve Diagnostics with Partial Stroke Test (PST)
") Series 3730 and Series 3731 EXPERTplus Valve Diagnostics with Partial Stroke Test (PST) Application Positioner firmware for early detection of control valve faults giving maintenance recommendations. Valid
Series 3730 and Series 3731 EXPERTplus Valve Diagnostics with Partial Stroke Test (PST) Application Positioner firmware for early detection of control valve faults giving maintenance recommendations. Valid
Operating Instructions EB EN. Series 373x Electropneumatic Positioner Type 373x-5 EXPERT + with FOUNDATION fieldbus communication
 Series 373x Electropneumatic Positioner Type 373x-5 EXPERT + with FOUNDATION fieldbus communication Fig. 1 Valve diagnostics with TROVIS-VIEW Operator Interface Operating Instructions EB 8388-5 EN Firmware
The benefits of the extended diagnostics feature. Compact, well-proven, and flexible
 ABB MEASUREMENT & ANALYTICS TECHNICAL INFORMATION PositionMaster EDP300 Extended Diagnostics Compact, well-proven, and flexible The benefits of the extended diagnostics feature The PositionMaster EDP300
2600T Series Pressure Transmitters Plugged Impulse Line Detection Diagnostic. Pressure Measurement Engineered solutions for all applications
 Application Description AG/266PILD-EN Rev. C 2600T Series Pressure Transmitters Plugged Impulse Line Detection Diagnostic Pressure Measurement Engineered solutions for all applications Increase plant productivity
Device Description User Manual Logix 520MD Positioners
 Device Description User Manual Logix 520MD Positioners GENERAL INFORMATION... 3 INTRODUCTION... 3 QUALIFIED PERSONNEL... 3 USING THIS DOCUMENT... 3 TERMS CONCERNING SAFETY... 3 1 STATUS... 4 1.1 CMD SOURCE...
Valve Communication Solutions Axiom
 Axiom Detect automated valve problems... before they shut down your process Reasons for Automated On/Off Valve Failures Monitor Fail Solenoid Fail Actuator Fail Coupling Break Too Slow Leaking Sticking
USER MANUAL. Intelligent Diagnostic Controller IDC24-A IDC24-AF IDC24-AFL IDC24-F IDP24-A * IDP24-AF * IDP24-AFL * IDP24-F * 1/73
 USER MANUAL Intelligent Diagnostic Controller IDC24-A IDC24-AF IDC24-AFL IDC24-F IDP24-A * IDP24-AF * IDP24-AFL * IDP24-F * *) Require software ID: DID-SW-001 1/73 Table of contents 1 General... 3 1.1
Ultima. X Series Gas Monitor
 Ultima X Series Gas Monitor Safety Manual SIL 2 Certified " The Ultima X Series Gas Monitor is qualified as an SIL 2 device under IEC 61508 and must be installed, used, and maintained in accordance with
STICTION: THE HIDDEN MENACE
 STICTION: THE HIDDEN MENACE How to Recognize This Most Difficult Cause of Loop Cycling By Michel Ruel Reprinted with permission from Control Magazine, November 2000. (Most figures courtesy of ExperTune
ACV-10 Automatic Control Valve
 ACV-10 Automatic Control Valve Installation, Operation & Maintenance General: The Archer Instruments ACV-10 is a precision automatic feed rate control valve for use in vacuum systems feeding Chlorine,
CHEMICAL ENGINEERING LABORATORY CHEG 239W. Control of a Steam-Heated Mixing Tank with a Pneumatic Process Controller
 CHEMICAL ENGINEERING LABORATORY CHEG 239W Control of a Steam-Heated Mixing Tank with a Pneumatic Process Controller Objective The experiment involves tuning a commercial process controller for temperature
Life Cycle Benefits: Maintenace (Control Valve Diagnostic and Field Device Diagnostic Management)
") Life Cycle Benefits: Maintenace (Control Valve Diagnostic and Field Device Diagnostic Management) Yasushi Kudo Yamatake Corporation Aaron Chen Azbil Taiwan Contents I. Prologue II. Possibilities of CV
Life Cycle Benefits: Maintenace (Control Valve Diagnostic and Field Device Diagnostic Management) Yasushi Kudo Yamatake Corporation Aaron Chen Azbil Taiwan Contents I. Prologue II. Possibilities of CV
COMPRESSOR PACK SUCTION CONTROLLER TYPE: LP41x
 Electrical Installation Requirements Care should be taken to separate the power and signal cables to prevent electrical interference and possible damage due to inadvertent connection. SUPPLY E L N LN2
Fisher FIELDVUE DVC6200f Digital Valve Controller PST Calibration and Testing using ValveLink Software
 Instruction Manual Supplement DVC6200f Digital Valve Controller Fisher FIELDVUE DVC6200f Digital Valve Controller PST Calibration and Testing using ValveLink Software The test procedure contained in this
Description of Device Parameters Proline Prowirl 200 HART. Vortex flowmeter. Products Solutions Services. Main menu Language.
 GP01019D/06/EN/02.15 71308256 Valid as of version 01.02.zz (Device firmware) Products Solutions Services of Device Parameters Proline Prowirl 200 HART Vortex flowmeter XXXXXXXXX 20.50 Main menu 0104-1
BAPI Pressure Line of Products - FAQs
 Table of Contents 1. Several manufacturers produce pressure transmitters, why should I purchase from BAPI?... p. 2 2. BAPI makes several styles of pressure transmitters. What are the features of each?...
Controlling the prefeeder
 Controlling the prefeeder A prefeeder is a modulating device of some kind, controlling the material flow into the belt feeder infeed. You need it for three reasons: 1. The material can not be sheared at
Installation and Operation Manual
 Manual Static pressure transducer with controller Differential static pressure transducer with analog output and optional PI control mode Large diaphragm element with differential transformer Transducer
PositionMaster EDP300 Extended Diagnostics. Compact, well-proven, and flexible
 Change from one to two columns Technical Information TI/EDP300_ED-EN Rev. A PositionMaster EDP300 Extended Diagnostics Compact, well-proven, and flexible The benefits of the extended diagnostics feature
HART Communications Board
 - HART Communications Board (Highway Addressable Remote Transducer) User Manual Document No. Sensidyne, LP. 1000 112 th Circle N, Suite 100 St. Petersburg, Florida 33716 USA 800-451-9444 +1 727-530-3602
TR Electronic Pressure Regulator. User s Manual
 TR Electronic Pressure Regulator Page 2 of 13 Table of Contents Warnings, Cautions & Notices... 3 Factory Default Setting... 4 Quick Start Procedure... 5 Configuration Tab... 8 Setup Tab... 9 Internal
SIL Safety Manual. ULTRAMAT 6 Gas Analyzer for the Determination of IR-Absorbing Gases. Supplement to instruction manual ULTRAMAT 6 and OXYMAT 6
 ULTRAMAT 6 Gas Analyzer for the Determination of IR-Absorbing Gases SIL Safety Manual Supplement to instruction manual ULTRAMAT 6 and OXYMAT 6 ULTRAMAT 6F 7MB2111, 7MB2117, 7MB2112, 7MB2118 ULTRAMAT 6E
A4s Operation Manual
 A4s Operation Manual Safety Instruction Please read this manual carefully, also with related manual for the machinery before use the controller. For installing and operating the controller properly and
1. Functional description. Application program usage. 1.1 General. 1.2 Behavior on bus voltage loss and bus voltage. 1.
 Application program usage product family: Product type: Manufacturer: Name: Order-No.: Valve actuators Constant valve actuator Siemens Valve actuator AP 562/02 5WG1 562-7AB02 Commissioning For commissioning
Positioner type Smart Valve Positioner with diagnostic functions. Presented By: Mr. Gourishankar Saharan. Product management Jens Bargon / V42
 Positioner type 3730-5 Smart Valve Positioner with diagnostic functions Presented By: Mr. Gourishankar Saharan Product management Jens Bargon / V42 Product overview P Process V Valves l Control Valves
Richards Industries Basic Siemens PS2 Positioner Functions
 Basic Siemens PS2 Positioner Functions Wiring 1 Supply Pressure Use clean, dry instrument air for the supply pressure. In general, on valves that are normally closed, you need 35-40 psi of supply pressure
A4 Operation Manual. Fig.1-1 Controller Socket Diagram
 A4 Operation Manual Safety Instruction Please read this manual carefully, also with related manual for the machinery before use the controller. For installing and operating the controller properly and
MARKET OUTLOOK. Power Chemicals Petroleum Water/Wastewater Oil & Gas Pulp & Paper and more
 FALL 2004 VOLUME 16, NO. 4 2005 MARKET OUTLOOK Power Chemicals Petroleum Water/Wastewater Oil & Gas Pulp & Paper and more PLUS: Powerful Products for the Power Industry Valves in Bioprocessing Smart Control
SSL. Smart Valve Positioner.
 Smart Valve Positioner Smartest valve control device meeting a dynamic performance and a precise setting with a piezoelectric technology and an optimized auto-calibration program Features Auto-Calibration
Single Pressure/ vacuum decay leak rate, loss, rate of loss, or occlusion tests with standard Cv valves.
 Application Bulletin: #167 Date: November 2009 BLACKBELT PRINCIPALS OF OPERATION INSTRUMENT CONFIGURATIONS Depending on the types of tests required and resolution and repeatability desired, the Sentinel
Control Valve Training Course Program
 Control Valve Training Course Program FINAL CONTROL AND REGULATE Control Valves LEARNINGPATH At the foundation of any process are the field devices that measure and control the flow of air, steam, water,
Partial Stroke Testing for SRD991 and SRD960
 Technical Information 09.11 TI EVE0105 PST-(en) Partial Stroke Testing for SRD991 and SRD960 Final control elements in Emergency Shutdown (ESD) applications such as ON-OFF-, Blow Down and Venting-Valves
2600T Series Pressure Transmitter Models 264DC Differential and 264HC Gage Level Transmitters. Kent-Taylor
 INDUSTRIAL INSTRUMENTS AND CONTROLS SPECIALIST Kent-Taylor 2600T Series Pressure Transmitter Models 264DC Differential and 264HC Gage Level Transmitters Features Include Base accuracy : ±0.075% Span limits
A Planning Guide for Effective Use HART Implementations. December 2012 (D103278X012)
") FIELDVUE Instruments A Planning Guide for Effective Use HART Implementations December 2012 (D103278X012) You've purchased a FIELDVUE instrument...now what??? How do you get the most value out of it? Where
FIELDVUE Instruments A Planning Guide for Effective Use HART Implementations December 2012 (D103278X012) You've purchased a FIELDVUE instrument...now what??? How do you get the most value out of it? Where
SSR. Smart Valve Positioner.
 Smart Valve Positioner Smartest valve control device meeting a dynamic performance and a precise setting with a piezoelectric technology and an optimized auto-calibration program Features Auto-Calibration
Datasheet: K-30 ASCII Sensor
 Datasheet: K-30 ASCII Sensor The K30 ASCII sensor is a low cost, infrared and maintenance free transmitter module intended to be built into different host devices that require CO2 monitoring data. The
Using the CONVAL software for the petrochemical plant control valves checking. Case study
 Using the CONVAL software for the petrochemical plant control valves checking. Case study C. Patrascioiu, G. Stamatescu, C. Lazar Abstract In the paper there are presented the researches into field of
Three Columns Gas Chromatograph Analysis Using Correlation between Component's Molecular Weight and Its Response Factor
 Three Columns Gas Chromatograph Analysis Using Correlation between Component's Molecular Weight and Its Response Factor Anwar Sutan, Metco Services Ltd. Charles Johnson, Metco Services Ltd. Jason Laidlaw,
LABORATORY EXERCISE 1 CONTROL VALVE CHARACTERISTICS
 Date: Name: LABORATORY EXERCISE 1 CONTROL VALVE CHARACTERISTICS OBJECTIVE: To demonstrate the relation between valve stem position and the fluid flow through a control valve, for both linear and equal
OPERATION MANUAL F Y C A L M E
 OPERATION MANUAL F Y C A L M E smar www.smar.com Specifications and information are subject to change without notice. Up-to-date address information is available on our website. web: www.smar.com/contactus.asp
MIL-STD-883G METHOD
 STEADY-STATE LIFE 1. PURPOSE. The steady-state life test is performed for the purpose of demonstrating the quality or reliability of devices subjected to the specified conditions over an extended time
Safety Manual VEGAVIB series 60
 Safety Manual VEGAVIB series 60 Contactless electronic switch Document ID: 32002 Contents Contents 1 Functional safety... 3 1.1 General information... 3 1.2 Planning... 4 1.3 Adjustment instructions...
WMO LABORATORY INTERCOMPARISON OF RAIN INTENSITY GAUGES
 WMO LABORATORY INTERCOMPARISON OF RAIN INTENSITY GAUGES Christophe ALEXANDROPOULOS and Muriel LACOMBE Météo-France, Direction des Systèmes d Observation, BP 202-78195 Trappes France christophe.alexandropoulos@meteo.fr
CF8-W-Disp-CO. User manual. CO 2 / CO sensor with built-in general purpose controller
 User manual CF8-W-Disp-CO CO 2 / CO sensor with built-in general purpose controller General The IAQ-sensor product CF8-W-Disp-CO is used to measure indoor air carbon dioxide and carbon monoxide concentrations.
Safety Manual VEGAVIB series 60
 Safety Manual VEGAVIB series 60 NAMUR Document ID: 32005 Contents Contents 1 Functional safety... 3 1.1 General information... 3 1.2 Planning... 4 1.3 Adjustment instructions... 6 1.4 Setup... 6 1.5 Reaction
This manual provides necessary requirements for meeting the IEC or IEC functional safety standards.
 Instruction Manual Supplement Safety manual for Fisher Vee-Ball Series Purpose This safety manual provides information necessary to design, install, verify and maintain a Safety Instrumented Function (SIF)
Hardware Triaxial and Consolidation Testing Systems Pressure Measurement and Control
 25 GDS Helpsheet Hardware Triaxial and Consolidation Testing Systems Pressure Measurement and Control World Leaders in Computer Controlled Testing Systems for Geotechnical Engineers and Geologists 1. Digital
Autopilot setup. VRF (Virtual Rudder Feedback) calibration. Software setup NSS evo2 Installation Manual
 calibration. Software setup NSS evo2 Installation Manual") Autopilot setup Verifying the autopilot connection When an AC12N, AC42N, or SG05 is connected to the NSS evo2 system, the NSS evo2 will automatically detect the autopilot and an Autopilot menu icon will
Autopilot setup Verifying the autopilot connection When an AC12N, AC42N, or SG05 is connected to the NSS evo2 system, the NSS evo2 will automatically detect the autopilot and an Autopilot menu icon will
OIL & GAS. 20th APPLICATION REPORT. SOLUTIONS for FLUID MOVEMENT, MEASUREMENT & CONTAINMENT. Q&A: OPEC Responds to SHALE BOOM
 Process VARIABILITY & Equipment RELIABILITY Are PROCESS SAFETY & CYBERSECURITY Related? Q&A: OPEC Responds to SHALE BOOM 20th 1995-2015 SOLUTIONS for FLUID MOVEMENT, MEASUREMENT & CONTAINMENT special section
Title: Standard Operating Procedure for Elemental and Organic Carbon (EC and OC) using Non-Dispersive Infrared Detection (NDIR)
 using Non-Dispersive Infrared Detection (NDIR)") Procedure No: SOP-025 Revision No: 1.0 (January 21, 2011) Page No.: 1 of 8 1. INTRODUCTION AND SCOPE To obtain timely data for the purpose of air quality assessment, air quality trend reporting and to
Procedure No: SOP-025 Revision No: 1.0 (January 21, 2011) Page No.: 1 of 8 1. INTRODUCTION AND SCOPE To obtain timely data for the purpose of air quality assessment, air quality trend reporting and to
Roller AC Servo System
 Safely Instruction Roller AC Servo System HMI-15 User Manual Please read this manual carefully, also with related manual for the machinery before use the controller. For installing and operating the controller
Connect with Confidence NO POWER NO PROBLEM
 Connect with Confidence NO POWER NO PROBLEM The ideal solution to implement wireless sensor monitoring in IoT applications where power is not available. At last, there s a roll-out ready way to implement
AHE58/59 AC Servo System
 AHE58/59 AC Servo System HMI-12 User Manual Safely INstruction Please read this manual carefully, also with related manual for the machine head before use. For perfect operation and safety, installing
KEM Scientific, Inc. Instruments for Science from Scientists
 KEM Scientific, Inc. Instruments for Science from Scientists J-KEM Scientific, Inc. 6970 Olive Blvd. St. Louis, MO 63130 (314) 863-5536 Fax (314) 863-6070 E-Mail: jkem911@jkem.com Precision Vacuum Controller,
Using Modbus Protocol with the ALTUS Net Oil Computer. Instruction Manual
 Using Modbus Protocol with the ALTUS Net Oil Computer Instruction Manual November 2000 Using Modbus Protocol with the ALTUS Net Oil Computer Instruction Manual November 2000 For technical assistance,
FUEL GAS FIRING CONTROL RJ (Dick) Perry Safety Systems Consultant 6 June 2016
 Perry Safety Systems Consultant 6 June 2016") INTRODUCTION Fired equipment such as Heaters and Boilers, normally have to comply with either NFPA 85/86 or API 556 for North America and some other countries which apply such standards, or EN 746-2 for
INTRODUCTION Fired equipment such as Heaters and Boilers, normally have to comply with either NFPA 85/86 or API 556 for North America and some other countries which apply such standards, or EN 746-2 for
628 Differential Pressure Decay Leak Tester
 628 Differential Pressure Decay Leak Tester The 628 puts Uson s industry leading differential pressure decay sensitivity in your hands and in your budget with no compromise in quality, reliability, and
REASONS FOR THE DEVELOPMENT
 7 Series 7 Series +24VDC VDC OUTPUT MICROPROCESS. E P IN EXH OUT 7 Series 7 ø,8 8 7 Series 9 5 8 9 7 Series Display features The proportional regulator has a 3 /2 digit display and a three-pushbutton
Instruction Manual. BZ7002 Calibration Software BE
 Instruction Manual BZ7002 Calibration Software BE6034-12 Index _ Index Index... 2 Chapter 1 BZ7002 Calibration Software... 4 1. Introduction... 5 Chapter 2 Installation of the BZ7002... 6 2. Installation
Advanced Pump Control for Irrigation Applications
 Advanced Pump Control for Irrigation Applications Paul Nistler VFD Applications Engineer And Julian Atchia Director of Research and Development SJE Rhombus 22650 County Hwy 6 Detroit Lakes MN 56502 Executive
Gerald D. Anderson. Education Technical Specialist
 Gerald D. Anderson Education Technical Specialist The factors which influence selection of equipment for a liquid level control loop interact significantly. Analyses of these factors and their interactions
Characterizers for control loops
 Characterizers for control loops By: F. G. Shinskey (May 1999) Introduction Commercial controllers such as the PID series (proportional, integral, derivative, and their combinations) are linear devices
Application Block Library Fan Control Optimization
 Application Block Library Fan Control Optimization About This Document This document gives general description and guidelines for wide range fan operation optimisation. Optimisation of the fan operation
Digital Vacuum Regulator
 Temperature Control for Research and Industry Digital Vacuum Regulator User s Manual Model DVR-280 INDEX SECTION PAGE 1. QUICK OPERATING INSTRUCTIONS............................. 3 KEM-NET DATA LOGGING
Additel761 Series Firmware Updates
 Additel761 Series Firmware Updates 2018-09-03 APC V01.XX Vertions before APC V01.03(Included) APC V01.04 APC V01.05 APC V01.06 APC V01.07 APC V01.08 APC V01.09 APC V01.10 APC V01.11 APC V01.12 APC V01.13
DeZURIK. KSV Knife Gate Valve. Safety Manual
 KSV Knife Gate Valve Safety Manual Manual D11035 August 29, 2014 Table of Contents 1 Introduction... 3 1.1 Terms... 3 1.2 Abbreviations... 4 1.3 Product Support... 4 1.4 Related Literature... 4 1.5 Reference
Code Basic module and level control complete with optionals code
 AUTOMATION AND PROCESS CONTROL MPCT - Modular Process Control Trainer Code 916960 Basic module and level control complete with optionals code 916961-916962-916963-916964-916965 1. General Didacta proposes
A Semi-Automated Functional Test Data Analysis Tool
 A Semi-Automated Functional Test Data Analysis Tool Peng Xu, Philip Haves, Moosung Kim Lawrence Berkeley National Lab Synopsis The growing interest in commissioning is creating a demand that will increasingly
Industrial Compressor Controls Standard Custom
 Technical Seminars 2012 Industrial Compressor Controls Standard Custom CONTROLLING the power of ENERGY 1 TM 2 Woodward Compressor Controls Small Steam Turbine Driven Compressors (ITCC) 3 Simple Compressor
User Manual. asense miii. / CO sensor with built-in general purpose controller
 Gas and Air Sensors User Manual asense miii CO 2 / CO sensor with built-in general purpose controller General The IAQ-sensor product asense miii is used to measure indoor air carbon dioxide and carbon
Hydronic Systems Balance
 Hydronic Systems Balance Balancing Is Misunderstood Balancing is application of fundamental hydronic system math Balance Adjustment of friction loss location Adjustment of pump to requirements By definition:
Session One: A Practical Approach to Managing Safety Critical Equipment and Systems in Process Plants
 Session One: A Practical Approach to Managing Safety Critical Equipment and Systems in Process Plants Tahir Rafique Lead Electrical and Instruments Engineer: Qenos Botany Site Douglas Lloyd Senior Electrical
User manual CF8-D/W-IN
 User manual CF8-D/W-IN General The sensor CF8-D/W-IN is used to measure the carbon dioxide concentration inside incubators. All functions can be modified from a PC with the communication cable. UMA 48
Preparation for Salinity Control ME 121
 Preparation for Salinity Control ME 121 This document describes a set of measurements and analyses that will help you to write an Arduino program to control the salinity of water in your fish tank. The
BUBBLER CONTROL SYSTEM
 BUBBLER CONTROL SYSTEM Description: The LDBCS is a fully automatic bubbler system, which does liquid level measurements in water and wastewater applications. It is a dual air compressor system with, air
CONTROL VALVE TESTING
 The optimal functioning of the Control valve not only exists of sufficient body & seat tightness, but more important, the total "performance" of the valve and its controls! For an accurate and reliable
APPLICATION NOTES DELOMATIC 4, DM-4 GAS
 APPLICATION NOTES DELOMATIC 4, DM-4 GAS Emission control Lambda sensor p/t regulation Combustion chamber temperature regulation Emission control configuration Emission control curve Document no.: 4189340653C
Reliability of Safety-Critical Systems Chapter 3. Failures and Failure Analysis
 Reliability of Safety-Critical Systems Chapter 3. Failures and Failure Analysis Mary Ann Lundteigen and Marvin Rausand mary.a.lundteigen@ntnu.no RAMS Group Department of Production and Quality Engineering
1 STARTUP Overview Buttons Basics of Control Resetting Faults and Alarms OPERATION...
 Operation & Service Manual 940126-0002 pco 3 Programmable Logic Controller Contents 1 STARTUP...1 1.1 Overview... 1 1.1.1 Buttons... 1 1.1.2 Basics of Control... 1 1.2 Resetting Faults and Alarms... 2
Design Envelope Booster. Sequence of operation
 Design Envelope Booster Sequence of operation File No: 62.835 Date: february 11, 2015 Supersedes: 62.835 Date: july 11, 2014 sequence of operation Design Envelope Booster 2 general The packaged domestic
The HumiPyc - Model 1 - Gas Pycnometer; Density, Moisture, Permeation Analyzer; RH sensor Calibrator
 The HumiPyc - Model 1 - Gas Pycnometer; Density, Moisture, Permeation Analyzer; RH sensor Calibrator Designed, built, and supported by InstruQuest Inc. Temperature controlled, multi-technique volumetric
User Manual. asense VAV. CO 2 / temperature sensor with built-in general purpose controller
 Gas and Air Sensors User Manual asense VAV CO / temperature sensor with built-in general purpose controller General The IAQ-sensor product asense VAV is used to measure indoor air carbon dioxide concentration
Cascade control. Cascade control. 2. Cascade control - details
 Cascade control Statistical Process Control Feedforward and ratio control Cascade control Split range and selective control Control of MIMO processes 1 Structure of discussion: Cascade control Cascade
PART 5 - OPTIONS CONTENTS 5.1 SYSTEM EXPANSION 5-3
 PART 5 - OPTIONS CONTENTS Para Page 5.1 SYSTEM EXPANSION 5-3 5.2 SENSORS 5-3 5.2.1 Trim Angle Sensor 5-3 5.2.2 Mast Rotation Sensor 5-3 5.2.3 Heel Angle Sensor 5-3 5.2.4 Barometric Pressure Sensor 5-3
DeZURIK. KGC Cast Knife Gate Valve. Safety Manual
 KGC Cast Knife Gate Valve Safety Manual Manual D11036 August 29, 2014 Table of Contents 1 Introduction... 3 1.1 Terms... 3 1.2 Abbreviations... 4 1.3 Product Support... 4 1.4 Related Literature... 4 1.5
Chapter 5: Methods and Philosophy of Statistical Process Control
 Chapter 5: Methods and Philosophy of Statistical Process Control Learning Outcomes After careful study of this chapter You should be able to: Understand chance and assignable causes of variation, Explain
955730_1 4/17/18. FlowSense Operator s Guide For Gen2 20/20 SeedSense Displays
 955730_1 4/17/18 FlowSense Operator s Guide For Gen2 20/20 SeedSense Displays Contents System Setup and Operation...3 Configuring Monitor for FlowSense...3 FlowSense Setup...4 Liquid Alerts...8 Monitoring
4.5 Diagnosis Diagnosticdisplay. Operation
 4.5 Diagnosis 4.5.1 Diagnosticdisplay No. Abbreviation Meaning To access the diagnostic display in automatic or manual mode, press all three buttons for at least two seconds. Thisfollowingtablegivesanoverviewofthevaluesthatcanbe
Hydro-Control V User Guide
 Hydro-Control V User Guide Hydronix Part no: HD0193 Version 2.3.0 Revision date: July 2006 1 COPYRIGHT Neither the whole or any part of the information contained in nor the product described in this documentation
Sequence of Operations
 MAGNUM Condensing Unit Software 5580 Enterprise Pkwy. Fort Myers, FL 33905 Office: 239-694-0089 Fax: 239-694-0031 Sequence of Operations MAGNUM Chiller V8 software www.mcscontrols.com MCS Total Solution
COMPARISON OF DIFFERENTIAL PRESSURE SENSING TECHNOLOGIES IN HOSPITAL ISOLATION ROOMS AND OTHER CRITICAL ENVIRONMENT APPLICATIONS
 COMPARISON OF DIFFERENTIAL PRESSURE SENSING TECHNOLOGIES IN HOSPITAL ISOLATION ROOMS AND OTHER CRITICAL ENVIRONMENT APPLICATIONS APPLICATION NOTE LC-136 Introduction Specialized spaces often times must
SIDRA INTERSECTION 6.1 UPDATE HISTORY
 Akcelik & Associates Pty Ltd PO Box 1075G, Greythorn, Vic 3104 AUSTRALIA ABN 79 088 889 687 For all technical support, sales support and general enquiries: support.sidrasolutions.com SIDRA INTERSECTION
theben Continuous valve actuator CHEOPS drive CHEOPS drive As of: Jul-11 (Subject to change without notice) Page 1 of 41
 Page 1 of 41") Continuous valve actuator CHEOPS drive CHEOPS drive 731 9 200 As of: Jul-11 (Subject to change without notice) Page 1 of 41 Contents 1 Functional characteristics... 4 1.1 Benefits... 4 1.2 Hardware versions...
Continuous valve actuator CHEOPS drive CHEOPS drive 731 9 200 As of: Jul-11 (Subject to change without notice) Page 1 of 41 Contents 1 Functional characteristics... 4 1.1 Benefits... 4 1.2 Hardware versions...
ECL Comfort 110, application 131 (valid as of software version 2.00)
") Operating Guide ECL Comfort 110, application 131 (valid as of software version 2.00) English version www.danfoss.com How to navigate? Adjust temperatures and values. Switch between menu lines. Select /
Operating Guide ECL Comfort 110, application 131 (valid as of software version 2.00) English version www.danfoss.com How to navigate? Adjust temperatures and values. Switch between menu lines. Select /
Copeland Discus with CoreSense Diagnostics January 2011
 Copeland Discus with CoreSense Diagnostics January 2011 Slide 1 1/27/2011 5:48 PM Discus with CoreSense Diagnostics Case Studies Supermarket In Columbus, Ohio Saves $4,500 With Discus with CoreSense Diagnostics
Reset Volume Controller 2 Reversing Relay 3 Air Valve Actuator 4 Lower-of-Two-Pressures Relay 4 Diverting Relay 5 Higher-of-Two-Pressures Relay 5
 Item Page Reset Volume Controller 2 Reversing Relay 3 Air Valve Actuator 4 Lower-of-Two-Pressures Relay 4 Diverting Relay 5 Higher-of-Two-Pressures Relay 5 Gradual Switch 6 Electric / Pneumatic (E.P.)
FRDS GEN II SIMULATOR WORKBOOK
 FRDS GEN II SIMULATOR WORKBOOK Trotter Control Inc 2015 Document# Revision Revised 9001-0038 FRDS GEN II Simulator Workbook E 02/15/2015 by DC FRDS GEN II Simulator Workbook This workbook is a follow-on
Smart performance with innovative and ever-strong coil drive even under harsh working environments
 Smart Valve Positioner SS2 inear / Rotary Smart performance with innovative and ever-strong coil drive even under harsh working environments Easy and quick auto-calibration Detecting RA (reverse acting)