Distribution Statement A: Approved for public release; distribution is unlimited.
|
|
|
- Derek Greene
- 5 years ago
- Views:
Transcription
1 Distribution Statement A: Approved for public release; distribution is unlimited. Analysis and Modeling of Acoustic and Environmental Measurements from Underwater Detonation Training Events on the Pu`uloa Underwater Detonation Range, O`ahu, Hawai`i by Peter H. Dahl, Lee H. Shannon 1, Alex Soloway, David R. Dall Osto, and Dara Farrell 1 Naval Facilities Engineering Command, Engineering and Expeditionary Warfare Center, Pearl Harbor, HI 7 April 2017 Applied Physics Laboratory University of Washington 1013 NE 40 th Street Seattle, WA
2 ACKNOWLEDGMENTS Funding for this effort was provided by the Commander, Pacific Fleet Environmental Readiness Division and arranged by Julie Rivers. The effort was coordinated by Sean Hanser, Naval Facilities Engineering Command, Pacific. The authors thank the active duty sailor of U.S. Navy Mobile Diving and Salvage Unit ONE, Company 1-8 led by LT Chris Price for their pivotal role in deploying and recovering our autonomous instrumentation, and in executing the underwater detonation events in close coordination with the science teams. We also thank Michael Parker of Parker Marine Corporation for his ready and able assistance in the field. 2
3 EXECUTIVE SUMMARY A team of researchers (Peter Dahl, Dara Farrell, David Dall Osto, and Alex Soloway) from the Applied Physics Laboratory of the University of Washington (APL-UW), working in cooperation with Lee Shannon of Naval Facilities Engineering Command Engineering and Expeditionary Ware Center (NAVFAC EXWC) and LT Chris Price of U.S. Navy Mobile Diving and Salvage Unit ONE, Company 1-8, conducted studies on the acoustic levels and propagation from explosive sources at the U.S. Navy Pu`uloa Underwater Detonation (UNDET) Range at Pearl Harbor, HI ( N W). This report provides equations to the Commander, Pacific Fleet Environmental Readiness Division to calculate expected levels of the underwater sound field created from explosive sources that may be applied to environmental characterization or UNDET training mission planning on the Pu`uloa Range with respect to possible noise exposure to marine mammals and turtles. The equations derived from actual experimental observation of UNDETs are for peak acoustic pressure and sound exposure level (SEL), which are the key metrics for determining the zone of influence (ZOI) for marine mammal mitigation. Of particular note is that the equations generated from this work contain variables and ratios familiar to military explosives experts in their normal course of operations, providing terms that almost seamlessly translate to operational use requiring no advanced physics or mathematics training to use at the tactical level. The report also provides a comprehensive summary of the data analysis involving acoustic transmission loss and energy flux density from explosive sources, to set the stage for continuing university research in underwater sound propagation. The report describes the experiment plan covering the 3-day field operation (17 19 May 2016) involving repeated measurements from explosive sources with net explosive weights (NEW) of 5, 10, and 17.6 lbs. Estimates of peak pressure, SEL, energy flux density, and transmission loss were calculated from the data. The plan addressed the Pu`uloa Range site bathymetry by conducting measurements in both the cross-shore and alongshore directions. Our analysis shows that underwater sound levels from explosive sources detonated on the seabed in the shallow Pu`uloa Range are considerably less than sound levels resulting from comparable mid-water detonations in deeper water. The physical basis behind these observed lower levels is not, as yet, fully understood. Therefore, we present two sets of equations for UNDET mission and mitigation planning on the Pu`uloa Range. The first set was developed to describe the metrics of peak pressure and SEL at other U.S. Navy training ranges, e.g., off Virginia (Virginia Capes Operating Area) and San Diego (Silver Strand Training Complex). This set is referred to here as the upper bound equations. upper bound for peak pressure re log / 274 upper bound for SEL log / /
4 report. The second set is derived from the May 2016 Pu`uloa Range data as described in this Pu`uloa-based equation for peak pressure re log / 297 Pu`uloa-based equation for SEL log /. / 234 (left) Comparison of the empirical mode (solid line) that describes peak pressure as a function of range from source (R in m) and net explosive weight (W in kg) with Pu`uloa data (symbols). The dashed line is the corresponding upper bound equation. (right) The same comparison involving SEL. The four equations presented in this report thus provide options to the Pu`uloa Range operator: upper bounds can be assessed using the two previously published equations, which will result in a larger ZOI, or assessments can be made using the new data-driven equations, which will result in a smaller ZOI for a given threshold. Predictions based on these equations should be avoided for scenarios outside the range of data sampled. This can summarized as peak pressure exceeding 220 db re 1 Pa, and maximal range exceeding 3000 m. 4
5 1. INTRODUCTION A team of researchers (Peter Dahl, Dara Farrell, David Dall Osto, and Alex Soloway) from the Applied Physics Laboratory of the University of Washington (APL-UW), working in cooperation with Lee Shannon of Naval Facilities Engineering Command Engineering and Expeditionary Ware Center (NAVFAC EXWC) and LT Chris Price of U.S. Navy Mobile Diving and Salvage Unit ONE, Company 1-8, conducted studies on the acoustic levels and propagation from explosive sources at the U.S. Navy Pu`uloa Underwater Detonation (UNDET) Range at Pearl Harbor, HI ( N W). This report provides equations to the Commander, Pacific Fleet Environmental Readiness Division to calculate expected levels of the underwater sound field created from explosive sources that may be applied to environmental characterization or UNDET training mission planning on the Pu`uloa Range with respect to possible noise exposure to marine mammals and turtles. The equations derived from actual experimental observation of UNDETs are for peak acoustic pressure and sound exposure level (SEL), which are the key metrics for determining the zone of influence (ZOI) for marine mammal monitoring. Of particular note is that the equations generated from this work contain variables and ratios familiar to military explosives experts in their normal course of operations, providing terms that almost seamlessly translate to operational use requiring no advanced physics or mathematics training to use at the tactical level. It also provides a comprehensive summary of the data analysis involving acoustic transmission loss (TL). Research continues on the nature of underwater sound propagation on the Pu`uloa Range and the Hawaii Range Complex in general, and the extent to which detonation of explosive sources in close proximity to a hard seabed influences the total sound energy. This is the final report by APL-UW for the NAVSEA task (0064): Detailed Analysis and Modeling of Acoustic and Environmental Measurements from Underwater Detonation Training Events on the Pu`uloa Underwater Detonation Range (NAVSEA contract #N D-6318). It represents a follow up to a preliminary report issued in July 2016 for the same contract, task (0045): Underwater Noise Level and Propagation Measurements of Underwater Detonation Training Events on the Pu`uloa Underwater Detonation Range in the Hawaii Complex. The report is organized as follows: Section 2 describes the basic measurement plan covering the three days of field operations, May 2016, on the Pu`uloa UNDET Range. The environmental measurements relating to water column sound speed and sea surface directional waves are summarized in Section 3. Section 4 describes the acoustic measurements, beginning with a review of underwater sound from explosive sources including the concept of scaled range. Here, previously published equations for the metrics peak pressure and SEL are presented; it is shown that these equations provide upper or conservative bounds for these metrics related to the Pu`uloa Range. Section 4 reviews sound energy flux density and TL from explosive sources and presents measures of these quantities in the cross-shore and alongshore directions. It is shown that underwater sound levels from explosive sources detonated on the seabed on the shallow, Pu`uloa Range are considerably less than those resulting from comparable mid-water detonations in deeper water. 5

6 Section 5 presents new empirical equations for peak pressure and SEL based on the Pu`uloa Range data from the May 2016 tests. The four equations presented in this report thus provide options to the Pu`uloa Range operator: upper bounds can be assessed using the two previously published equations, which will result in a larger ZIO, or assessments can be made using the new data-driven equations, which will result in a smaller ZOI for a given threshold. 2. MEASUREMENT PLAN The at-sea phase of the Pu`uloa Range field trial occurred over a 3-day period, May 2016, during which acoustic recordings were made from three explosive charges of identical weight that were detonated each day, providing an opportunity to evaluate repeatability in the explosion process. Explosive charges weighing 5, 17.6, 10 lbs (not including the detonation cord) were detonated underwater on 17, 18, and 19 May, respectively. These weights correspond to netexplosive weight (NEW) exclusive of detonation cord. An itemization of all explosive material used in each test is provided by the mission brief prepared by LT Price (Appendix). The acoustic experiment geometry at the Pu`uloa Range required deployment of measurement instruments with respect to the UNDET site (Figure 1). The strategy was to measure underwater sound originating from the UNDET site simultaneously from two directions: one aligned with a cross-shore direction (Figure 2) and one aligned parallel to the shore (Figure 3), approximately following an isobath over which depths were 8 10 m. Figure 1. Map of the measurement geometry and bathymetry for the 3-day Pu`uloa Range trial in May 2016, showing locations of the UNDET source, charter vessel and deployment of vertical line array (white triangle), and the two autonomous recording tripod systems (green and orange triangles). Note the orange system was repositioned closer to the UNDET site on day 3. 6


7 Figure 2. The measurement configuration in the cross-shore direction. A vertical line array (VLA) of nine hydrophones, separation 2 m, was deployed from a charter vessel that was moored at this site. Also shown is a directional wave buoy deployed near the vessel. (Depths and ranges shown are nominal; precise values for each location at the time of each UNDET event, because of tidal dependence, are provided in Table 1.) Figure 3. The measurement configuration in the alongshore direction. Two autonomous hydrophone systems were deployed; one system (orange) was positioned 750 m down range from the UNDET (moved to 500 m on day 3). The second (green) system, was placed at range 1500 m, and consisted of dual hydrophones, one with high sensitivity and other with low sensitivity. (Depths and range shown are nominal; precise values for each location at the time of each UNDET event, because of tidal dependence, are provided in Table 1.) 7

8 For the cross-shore direction the motor vessel Ho`oponopono (chartered from Parker Marine Corporation, Honolulu, HI) was used as the primary research platform. Ho`oponopono anchored at a station located approximately 900 m offshore from the UNDET site, where water depth was approximately 18 m. From the chartered vessel, acoustic measurements were made using a vertical line array (VLA) of nine hydrophones (model ITC 1042) with separation 2 m and spanning nearly the entire water column at the anchorage site. Hydrophone sensitivity for the VLA depended on the particular hydrophone and its cabling (documented for each hydrophone), with nominal receive sensitivity of 206 db re 1 V/ Pa. Additionally, conductivity-temperature-depth (CTD) recordings were made from the research vessel to determine sound speed as a function of depth using a SonTek YSI CastAway CTD, and directional sea surface wave measurements were made with a 40-cm Directional Waverider buoy (Datawell DWR-G4) deployed near the VLA mooring. For the alongshore direction, two autonomous hydrophone systems (Loggerhead Instruments) were deployed along a line parallel to the shoreline that intersected the UNDET site and the two hydrophone locations. One system (Figure 1, orange triangles) was positioned 750 m down range from the UNDET (moved to 500 m on day 3), with a receive sensitivity of 220 db re 1 V /μpa. The second system (Figure 1, green triangle) was placed at range 1500 m and consisted of dual hydrophone systems, one with high sensitivity ( 170 db re 1 V /μpa) and one with low sensitivity ( 220 db re 1 V /μpa), enabling measurements over a dynamic range >100 db. The second system (see Figure 4) enabled studies of ambient noise conditions immediately before, during, and after an UNDET event; it also provides recording details of the low-level precursor signal that arrives prior to the direct, high-level signal. The high sensitivity portion of the system was designed for ongoing background ambient noise studies [1]. Figure 4. Photograph of the autonomous recording system (see Figure 1 green triangle, dual system) deployed at range 1500 from the UNDET site showing U.S. Navy divers from CO 1-8 making final adjustments on the deployment. 8
9 Table 1. Ranges and depths of UNDET and instruments. The hydrophone depths at each tripod and at the VLA site were measured with Hobo water level loggers. Date Site Water Depth (m) Site Range(m) Hydrophone Depth (m) 17 May UNDET N/A Orange Tripod Green Tripod VLA 18.6* May UNDET N/A Orange Tripod Green Tripod VLA 18.8* May UNDET N/A Orange Tripod Green Tripod VLA 18.5* ENVIRONMENTAL MEASUREMENTS Three estimates of the sound speed profile (Figure 5) taken approximately 24 h apart show sound speed to be nearly constant with depth, within m/s. Consistent sound speed is expected for this shallow water environment because of mixing from wave action. Directional wave conditions measured at the VLA site on 17 May (Figure 6) show waves of frequency ~ 0.18 Hz originating from about 135 o, and a low-frequency swell component (frequency 0.1 Hz) originating from about 180 o. The root-mean-square wave height is 0.33 m and the significant wave height is 1.34 m. Directional wave conditions measured on 18 and 19 May were in good agreement with those from 17 May (data not shown). 9

10 May May May 4 Depth (m) Sound Speed (m/s) Figure 5. Sound speed versus depth measured at the VLA site taken on 17, 18, and 19 May between 2030 and 2200 UTC. Sound speed is nearly constant with depth, within m/s. Figure 6. Directional wave conditions measured at the VLA site on 17 May. Directional wave spectrum showing waves (frequency ~ 0.18 Hz) originating from about 135 o, and a lowfrequency swell component (frequency 0.1 Hz) originating from about 180 o. The root-meansquare wave height is 0.33 m and the significant wave height is 1.34 m. 10
11 4. ACOUSTIC MEASUREMENTS 4.1 Underwater explosions and the underwater sound field Peak acoustic pressure and sound exposure level As a result of experimental measurements emerging from World War II, a semi-empirical equation for predicting peak underwater sound pressure from underwater sound explosions was developed as a function of range R from the source divided by charge weight W to the one-third power, or R/W 1/3, referred to as scaled range [2]. The use of scaled range evolved from the method of dimension and similarity as applied to explosions of spherically-shaped material, and originally involved the weight of TNT due to the historical and continued use of TNT as a reference for energy output from high explosives [3]. To apply scaled range to other forms of explosives, a TNT equivalence coefficient is used. For example, the coefficient for C4 explosives as used in this study is The weight of the explosives multiplied by its particular coefficient yields the NEW, and this value is used in subsequent calculations involving scaled range. Our recent study [3] of the underwater sound from explosive sources provides further details on the concept of scaled range. Two empirical equations are relevant to this report. The historical semi-empirical equation for peak sound pressure is defined as the maximum of the absolute value of the sound pressure signal over the duration of the signal. Expressing this equation in terms of db re 1 Pa, the peak pressure is: re log / 274 (1) Analysis in this report shows that the May 2016 Pu`uloa Range data fall well below Eq. 1 in terms of peak pressure. We propose Eq. 1 be used as an upper or conservative bound for the Pu`uloa Range for the peak pressure estimate in db as a function of range (in m) and NEW expressed in kg. The second equation is related to energy flux density and is defined as the sound exposure level (SEL) computed by first computing a time integral of the squared acoustic pressure. To more precisely specify the integration time interval T, a standard method [4] first identifies the duration (Figure 7) of the signal that contains 90% of the energy. Upon finding this duration the integral of the squared pressure is taken over time T with the result expressed in db re 1 μpa 2 s. The empirical equation for SEL (which is Eq. 5 from [3]) is: log / /. 219 (2) Analysis in this report shows that the May 2016 Pu`uloa Range data fall well below Eq. 2 in terms of SEL. As with Eq. 1, we propose this Eq. 2 be used as an upper or conservative bound for the Pu`uloa Range for the SEL in db as a function of range estimate (in m) and NEW expressed in kg. 11
12 Figure 7. Time history of an explosion (top) and the resulting time history of its cumulative energy (bottom). Red lines indicate the start and end times of the window containing 90 percent of the waveform energy Seabed and sea surface effects The multiple processes that ensue immediately after an underwater explosion and as these relate to underwater sound are summarized by Weston [2]. Of particular relevance to the Pu`uloa Range tests is the relatively shallow depth of the explosive detonations (< 10 m), and that these detonations occurred on a seabed consisting of relatively hard, fossilized coral and coral limestone, so-called pavement areas (see Figure 4). Sea surface manifestations of underwater explosions are usually related to cavitation, except in very shallow, intense explosions where there is an upward plume of spray produced by the upward rush of gas from the explosion. Cavitation happens because the negative pressure upon surface reflection of the shock wave exceeds the tensile strength of water. For deeper explosions, or smaller explosive charges, the sea surface manifestation of cavitation usually takes the form of a darkened, wrinkled surface often referred to as the black ring [2, 4] (Figure 8). For the shallower explosion depths representative of the Pu`uloa Range detonations, the sea surface manifestation is more pronounced owing to the larger cavitation area on the sea surface, which can also impact the overall strength of the propagating acoustic signal [2]. This type of large cavitation area from an underwater explosion carried out on the Pu`uloa Range (not part of our May 2016 tests) has been observed (Figure 8). 12
 (right) Photograph of a large cavitation from an underwater explosion carried out on the Pu`uloa Range.")
 from the explosive initiation train, which consists of a very small detonation just below the sea surface.")
13 Figure 8. (left) Photograph of a black ring phenomenon taken in the Yellow Sea in August 1996 for a 38-g (0.038 kg) NEW charge detonated at depth 50 m. (Photograph by Peter H. Dahl, University of Washington.) (right) Photograph of a large cavitation from an underwater explosion carried out on the Pu`uloa Range. The cavitation area caused by the main charge on the bottom is approximately delineated by the two vertical arrows. The water spout is caused by the detonation cord (see Appendix A) from the explosive initiation train, which consists of a very small detonation just below the sea surface. (Photograph by Lee Shannon, NAVFAC EXWC.) Energy flux density and transmission loss In addition to peak pressure and SEL, we process each explosion pressure signal into the form of an energy flux density. Energy flux density is the quantity divided by the sound speed and density of water, and assumes dimensions of erg/cm 2 when expressed in cgs units. We compute an average acoustic energy flux density within 1/3-octave frequency bands. A model [6] is then used to compute the equivalent energy flux density as exists hypothetically at range 1 m from the UNDET source. (Note that upon dividing each value of the energy flux density function by the 1/3-octave bandwidth in Hz, the result is an energy flux spectrum [2].) This model depends on the source depth, which for the Pu`uloa Range is the same as the water depth at the UNDET location, and the NEW in kg. The difference between the model and measured energy flux density in a given 1/3-octave band is known as the transmission loss [2], expressed in db re 1 m. Transmission loss (TL) is a valuable diagnostic for comparing measurements based on the different NEW of 5, 10, and 17.6 lbs. Because the Pu`uloa Range detonations had a large cavitation area on the sea surface (Figure 8) and were in close proximity to a hard seabed, it is highly likely that the source model [6] underestimates total explosive yield as a function of range. Some evidence for this is provided by results reported from the SoCal Range off Silver Strand, San Diego [7]; there, received peak pressures for off-bottom detonations were consistently and substantially greater than for on-bottom placements (typically about 6 db difference). Other studies [8, 9] report similar results if the explosion was near an obstacle, the bottom, or was otherwise partly contained. 13
14 Therefore, the TL estimates reported here are likely to be over-estimates of TL. That said, the TL estimates provide a valuable indication of propagation conditions and a comparison between the cross-shore propagation (with increasing depth to the VLA site, nominal range 900 m) and alongshore propagation (at the same but shallower depth) to the tripod sites near ranges 500, 750, and 1500 m. 4.2 Cross-shore measurements: VLA The cross-shore measurements at the VLA site (Figures 9 11) were made on 17 May (5 lbs NEW, 3 tests), 18 May (17.6 lbs NEW, 2 tests), and 19 May (10 lbs NEW, 3 tests). Note that the third test on 18 May possibly had an incomplete detonation; results from this test are not part of this analysis. The peak pressure and SEL for each test as a function of VLA hydrophone depth (left-hand plots, Figures 9 11) show a high degree of repeatability between tests. The greatest variance between tests was recorded by the shallowest hydrophone, which was less than 2 m deep, where small changes in instantaneous depth due to wave action influenced the results. Data from the eight deeper hydrophones show a high degree of consistency and can be averaged to derive new empirical equations for peak pressure and SEL. The energy flux results (lower right plots, Figures 9 11) follow the same color code as the left-hand plot with the smallest energy flux values recorded again by the shallowest hydrophone (< 2 m depth). Mean energy flux (linear mean, result expressed in decibels) taken over an average of the eight lower hydrophones and three tests (black symbols) are subtracted from a mode for energy flux at range 1 m from the source, yielding TL (upper right, Figures 9 11). The TL for the three different NEW cases (Figures 9 11) are comparable, whereas estimates of energy flux are not (although they can be scaled using R/W 1/3 as demonstrated by Weston [2]). When plotted together, the three TL curves differ by no more than about 1 db, which suggests an average can be taken. As a benchmark, TL for spherical spreading of sound at the VLA range (~ 900 m) equals 20 log 10 (900) or about 59 db (Figures 9 11, dotted line). The TL is considerably greater than the 59 db value associated with spherically spreading; this result is anticipated given that the model of source level is likely an overestimate owing to the close proximity of the detonation to the seabed and surface. Within the frequency band between about 100 and 400 Hz there is a significant increase in TL, suggesting that energy in this frequency band is undergoing higher attenuation. This effect remains under study; increased TL may be explained by modelling the seabed as a thin sand layer overlaying a limestone half-space [10]. 14
15 Figure 9. Summary of cross-shore measurements made at the VLA site on 17 May. (left) Peak pressure and sound exposure level (SEL) for the 3 and 5-lb NEW detonations versus measurement depth on the VLA (for some depths the symbols overlap). (lower right) Energy flux in third-octave bands corresponding to the nine hydrophones and three tests. Color code is the same as the left-hand plot, with the lowest energy flux values for the shallowest hydrophone depth (< 2 m). Mean energy flux taken over an average of the eight lower hydrophones, and three tests, is shown by the black symbols. (upper right) Transmission loss as computed by subtracting the mean energy flux from a model for energy flux corresponding to range 1 m. The model is derived from Chapman [6] and assumes a 2.27 kg NEW detonated at 10.3 m depth. 15
16 Figure 10. Summary of cross-shore measurements made at the VLA site on 18 May. (left) Peak pressure and sound exposure level (SEL) for the two 17.6-lb NEW detonations versus measurement depth on the VLA. (lower right) Energy flux in third-octave bands corresponding to the nine hydrophones and two tests. Color code is the same as the left hand plot, with the lowest energy flux values for the shallowest hydrophone depth (< 2 m). Mean energy flux taken over an average of the eight lower hydrophones, and two tests, is shown by the black symbols. (upper right) Transmission loss as computed by subtracting the mean energy flux from a model for energy flux corresponding to range 1 m. The model is derived from Chapman [6] and assumes a 17.6 lb NEW detonated at 10.3 m depth. 16
17 Figure 11. Summary of cross-shore direction measurements made at the VLA site on 19 May. (left) Peak pressure and sound exposure level (SEL) for the three 10-lb NEW detonations versus measurement depth on the VLA. (lower right) Energy flux in third-octave bands corresponding to the nine hydrophones and two tests. Color code is the same as the left-hand plot, with the lowest energy flux values for the shallowest hydrophone depth (< 2 m). Mean energy flux taken over an average of the eight lower hydrophones, and two tests, is shown by the black symbols. (upper-right) Transmission loss as computed by subtracting the mean energy flux from a model for energy flux corresponding to range 1 m. The model is derived from Chapman [6] and assumes a 4.53 kg NEW detonated at 10.3 m depth. 4.3 Alongshore measurements: Bottom deployed tripods The alongshore measurements using the two bottom deployed tripod systems (Figures 12 14) are summarized in chronological order as for the cross-shore measurements. In this case measurements are made at only one depth, though as shown with the VLA results, the acoustic data are relatively independent of depth with the exception of the upper 2 m of the water column. As with the VLA results, TL is computed based on the average of the three detonations (or two detonations for the 18 May data). Two features emerge from the TL results. The first is the evolution of TL with range from the UNDET site, with the three ranges, 513 m, 758 m, and 1503 m (representing the planned ranges of 500, 750 and 1500 m), showing a gradual change in TL with range. There is also a TL maximum over the approximate Hz frequency band, though it is less apparent than that for the cross-shore results. Finally, the data measured at range 1503 m affords a comparison of three detonation NEWs made at one range, and like the cross-shore results at the 17
18 VLA site, TL for the alongshore direction at range 1503 m is relatively consistent over all three detonations. Figure 12. Summary of alongshore direction measurements made at the two tripod sites at 758 m (left) and 1503 m (right) on 17 May. Lower plot for each case: Energy flux in third-octave bands corresponding to the three tests. Upper plot for each case: Transmission loss (TL) as computed by subtracting the mean energy flux (based on average of the three tests) from a model for energy flux corresponding to range 1 m. The model is derived from Chapman [6] and assumes a 4.27 kg NEW detonated at 10.3 m depth. Figure 13. Summary of alongshore direction measurements made at the two tripod sites at 758 m (left) and 1503 m (right) on 18 May. Lower plot for each case: Energy flux in third-octave bands corresponding to the two tests. Upper plot for each case: Transmission loss (TL) as computed by subtracting the mean energy flux (based on average of the three tests) from a model for energy flux corresponding to range 1 m. The model is derived from Chapman [6] and assumes a 7.98 kg NEW detonated at 10.3 m depth. 18
19 Figure 14. Summary of alongshore direction measurements made at the two tripod sites at 513 m (left) and 1503 m (right) on 18 May. Lower plot for each case: Energy flux in third-octave bands corresponding to the three tests. Upper plot for each case: Transmission loss (TL) as computed by subtracting the mean energy flux (based on average of the three tests) from a model for energy flux corresponding to range 1 m. The model is derived from Chapman [6] and assumes a 4.54 kg NEW detonated at 10.3 m depth. 4.4 Transmission loss: Cross-shore versus alongshore Three independent estimates of TL made at the nominal cross-shore range of 900 m and alongshore range of 1500 m (Figure 15, upper) support the notion that Pu`uloa Range data are amenable to analysis using scaled range. This conclusion is based on the observation that the TL estimates are highly consistent (in the context of typical field estimates of TL that can readily vary by +/ 5 db) yet are based on significantly different explosive charges. The issue relating to the source model and proximity of the explosive source to boundaries still applies (i.e., the model represents a suspended charge while the Pu`uloa results are for a bottom charge), so these estimates of TL should be viewed only as a relative measure. Nevertheless, the consistency between different NEW motivates the averaging of curves (Figure 15, lower), allowing some assessment of the differences between propagation conditions in the alongshore and cross-shore directions. In this view it is possible to observe the evolution of TL with range in the alongshore direction and there is a slight tendency for the enhanced TL region to shift to lower frequencies with increasing range. (Note that increased TL for frequencies less than about 50 Hz is likely associated with the effects of modal waveguide cut-off.) In the crossshore direction the enhanced TL region is more pronounced. Reasons for this are not yet clear, but these data will be subject to continued study to understand low-frequency shallow water propagation over coral and limestone seabeds. 19
20 Figure 15. (upper) Estimates of TL in the cross-shore and alongshore directions made using three different explosive charge weights. (lower) Averaged TL for all sites measured at the Pu`uloa Range, for example, the green and black represent averages of the corresponding data shown in the upper plot. 5. PEAK PRESSURE AND SOUND EXPOSURE LEVEL EQUATIONS All evidence suggests that the underwater sound field resulting from UNDET operations on the Pu`uloa Range will exhibit levels (in both peak pressure and SEL) that are considerably less than comparable levels measured in a more open ocean environment. This is because the Pu`uloa Range detonations are generally carried out in close proximity to a hard seabed that reduces the acoustic yield at longer ranges [see 7, 8, 9] and because there is greater transmission loss, particularly within the important frequency band of Hz, which may be an attenuation effect caused by the seabed [see 10] or the sea surface. The Pu`uloa Range measurements tend to obey the general relations associated with scaled range. That is, for measurements made at different ranges R from the source and with different NEW, W values still collapse onto a single line and are amenable to scaling by R/W 1/3. TL estimates are consistent at three difference NEW (Figure 15). Accordingly, a new empirical relation for peak pressure based on the May 2016 Pu`uloa Range data is: 20
21 re log / 297, (3) where R is expressed in m and W in kg. A comparison (Figure 16) between the Pu`uloa Range data and Eq. 3 yields an rms decibel error of 3.6 db. Figure 16. Comparison of the empirical model, Eq. 3, that describes peak pressure as a function of range from source (R in m ) and net explosive weight (W in kg) with Pu`uloa Range data. The dashed line is Eq. 1 in this report (see also Soloway and Dahl [3] for non-decibel version) and can be taken to represent an upper bound for peak pressure. is: Similarly, a new empirical relation for SEL based on the May 2016 Pu`uloa Range data log / /. 234, (4) where R is expressed in m and W in kg. A comparison (Figure 17) between the Pu`uloa Range data and Eq. 4 yields an rms decibel error of 3.1 db. 21
22 Figure 17. Comparison of the empirical model, Eq. 4, that describes SEL as a function of range from source (R in m) and net explosive weight (W in kg) with Pu`uloa Range data. The dashed line is Eq. 2 in this report (originating from Soloway and Dahl [3]) and can be taken to represent an upper bound for SEL. The new empirical equations from the May 2016 Pu`uloa Range data, Eq. 3 for peak pressure and Eq. 4 for SEL, when combined with the upper bound counterparts (Eq. 1 and Eq. 2) provide options to the Pu`uloa Range operator. The upper bound equations result in a larger ZOI, or assessments can be made using the new data-driven equations, which will result in a smaller ZOI for a given threshold. Predictions based on these equations should be avoided for scenarios outside the range of data sampled. This can summarized as peak pressure exceeding 220 db re 1 Pa, and maximal range exceeding 3000 m. 22
23 REFERENCES [1] D. M Farrell, L. H. Shannon, P. H. Dahl, and D. R. Dall'Osto, Point measurements of ambient biological noise before, during, and after multiple underwater detonation events over coral substrate off the southern coast of Oahu, Hawai'i. Presentation at the 5th Joint Meeting Acoustical Society of America and Acoustical Society of Japan, Honolulu, Hawaii, 28 November 2 December [2] D. E. Weston, Underwater explosions as acoustic sources. Proc..Phys. Soc. LXXVI, 2, , [3] A. G. Soloway and P. H. Dahl, Peak sound pressure and sound exposure level from underwater explosions in shallow water. J. Acoust. Soc. Am., 136, , [4] P. T. Madsen, M. Johnson, P. J. O. Miller, N. A. Soto, J. Lynch, and P. Tyack, Quantitative measures of air-gun pulses recorded on sperm whales (Physeter macrocephalus) using acoustic tags during controlled exposure experiments. J. Acoust. Soc. Am., 120, , [5] H. Kolsky, J. P. Lewis, M. T. Sampson, A. C. Shearman and C. I. Snow, Splashes from underwater explosions. Proc. Roy. Soc. A Math. Phys. Sci., 196, , [6] N.R. Chapman, Source levels of shallow explosive charges, J. Acoust. Soc. Am. 84, No. 2, , [7] NSWC/Anteon Corp., Inc., Very Shallow Water Explosion Tests at Naval Amphibious Base, Coronado, CA and San Clemente Island, CA: Conditions, Result and Model Predictions [8] J. M. Brett and G. Yiannakopolous, A study of explosive effects in close proximity to a submerged cylinder. Int. J. Impact Eng., 35, , [9] J. R. Krieger and G. L. Chahine, Acoustic signals of underwater explosions near surfaces. J. Acoust. Soc. Am., 118, , [10] A. G. Soloway, P. H. Dahl, and L. H. Shannon, Sound exposure level and energy spectral density of underwater explosions in shallow water over a coral substrate off the southern coast of Oahu, Hawai'i. Presented at the 5th Joint Meeting Acoustical Society of America and Acoustical Society of Japan, Honolulu, Hawaii, 28 November 2 December

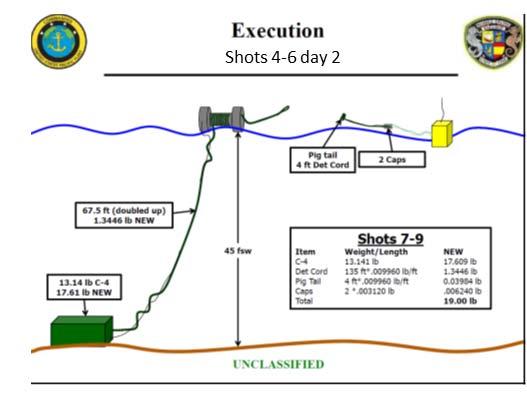
24 APPENDIX Figure A1. Shot plan configuration detailing the net explosive weight (NEW) each of three days of field tests on the Pu`uloa Range. Schematics are from the MDSU ONE CO 1-8 brief by LT Chris Price. (Slides modified slightly to reflect order of the days, which was changed from the original brief to correspond to the actual sequence) 24
25 25
Final Report: Measurements of Pile Driving Noise from Control Piles and Noise-Reduced Piles at the Vashon Island Ferry Dock
 Final Report: Measurements of Pile Driving Noise from Control Piles and Noise-Reduced Piles at the Vashon Island Ferry Dock By Peter H. Dahl, Jim Laughlin, and David R. Dall Osto Executive Summary Underwater
Final Report. Prepared By: Alexander G. Soloway Dept. of Mechanical Engineering, University of Washington, Seattle, Washington.
 Final Report Noise Source Level and Propagation Measurement of Underwater Detonation Training at the Silver Strand Training Complex, Naval Base Coronado, Coronado, CA Submitted to: Naval Facilities Engineering
Caltrans compendium of underwater sound data from pile driving 2014 update
 Caltrans compendium of underwater sound data from pile driving 2014 update Richard RODKIN 1 ; Keith POMMERENCK 2 1 Illingworth & Rodkin, Inc., United States 2 Illingworth & Rodkin, Inc., United States
ARA PROJECT Prepared by: Peter T. Dzwilewski Applied Research Associates, Inc Shaffer Parkway Littleton, Colorado 80127
 ARA PROJECT 001974 WATER SHOCK PREDICTION FOR EXPLOSIVE REMOVAL OF OFFSHORE STRUCTURES: UNDERWATER CALCULATOR (UWC) VERSION 2.0 UPDATE BASED UPON FIELD DATA Prepared by: Peter T. Dzwilewski Applied Research
Examples of Carter Corrected DBDB-V Applied to Acoustic Propagation Modeling
 Naval Research Laboratory Stennis Space Center, MS 39529-5004 NRL/MR/7182--08-9100 Examples of Carter Corrected DBDB-V Applied to Acoustic Propagation Modeling J. Paquin Fabre Acoustic Simulation, Measurements,
Mine Neutralization Exercise (MINEX) Sound Measurement Trial
 Sound Measurement Trial") Mine Neutralization Exercise (MINEX) Sound Measurement Trial Submitted to: Naval Facilities Engineering Command Atlantic under HDR Environmental, Operations and Construction, Inc. Contract No. N62470-10-D-3011,
Mine Neutralization Exercise (MINEX) Sound Measurement Trial Submitted to: Naval Facilities Engineering Command Atlantic under HDR Environmental, Operations and Construction, Inc. Contract No. N62470-10-D-3011,
Use of a low power, airgun sound source to accurately determine sound. Transmission Loss characteristics at the proposed Robin Rigg. Windfarm site.
 Submitted to: Submitted by: The Scottish Executive On behalf of: Mr M J Swanwick Mr S J Parvin EON-UK Subacoustech Ltd Westwood Way Chase Mill Westwood Business Park Winchester Road Coventry Bishop s Waltham
Centre for Marine Science and Technology
 Centre for Marine Science and Technology Prediction of underwater noise associated with the operation of a drilling rig in the Great Australian Bight Prepared for: BP Developments Australia Pty Ltd Prepared
Minimal influence of wind and tidal height on underwater noise in Haro Strait
 Minimal influence of wind and tidal height on underwater noise in Haro Strait Introduction Scott Veirs, Beam Reach Val Veirs, Colorado College December 2, 2007 Assessing the effect of wind and currents
The Evolution of Vertical Spatial Coherence with Range from Source
 The Evolution of Vertical Spatial Coherence with Range from Source Peter H. Dahl Applied Physics Laboratory and Mechanical Engineering Dept. University of Washington Research sponsored by U.S. Office of
Benefit of ESTCP/SERDP Research Program on Underwater Explosive Safety
 Benefit of ESTCP/SERDP Research Program on Underwater Explosive Safety Timothy W. Shelton, PE Supervisory Research Hydraulic Engineer ERDC CHL Oct 2017 DoD has very few options for disposing UXO recovered
Underwater Sound Level Report: I-90 Keechelus Lake Avalanche Bridge Blasting
 I-90 SNOQUALMIE PASS EAST Underwater Sound Level Report: I-90 Keechelus Lake Avalanche Bridge Blasting Prepared by: Jim Laughlin Washington State Department of Transportation Office of Air Quality and
Measured broadband reverberation characteristics in Deep Ocean. [E.Mail: ]
![Measured broadband reverberation characteristics in Deep Ocean. [E.Mail: ]](/thumbs/90/101823179.jpg "Measured broadband reverberation characteristics in Deep Ocean. [E.Mail: ]") Measured broadband reverberation characteristics in Deep Ocean Baiju M Nair, M Padmanabham and M P Ajaikumar Naval Physical and Oceanographic Laboratory, Kochi-682 021, India [E.Mail: ] Received ; revised
Measured broadband reverberation characteristics in Deep Ocean Baiju M Nair, M Padmanabham and M P Ajaikumar Naval Physical and Oceanographic Laboratory, Kochi-682 021, India [E.Mail: ] Received ; revised
High-Frequency Scattering from the Sea Surface and Multiple Scattering from Bubbles
 High-Frequency Scattering from the Sea Surface and Multiple Scattering from Bubbles Peter H. Dahl Applied Physics Laboratory College of Ocean and Fisheries Sciences University of Washington Seattle, Washington
Acoustic Focusing in Shallow Water and Bubble Radiation Effects
 Acoustic Focusing in Shallow Water and Bubble Radiation Effects Grant B. Deane Marine Physical Laboratory, Scripps Institution of Oceanography UCSD, La Jolla, CA 92093-0238 Phone: (858) 534-0536 fax: (858)
Underwater noise and offshore windfarms
 Underwater noise and offshore windfarms Dr Jeremy Nedwell, Mr John Langworthy and Mr Daren Howell BWEA Conference 4/3/04 Subacoustech reference: 544R0503, COWRIE Copyright. Aim of study To evaluate the
Anthropogenic Noise and the Marine Environment
 Anthropogenic Noise and the Marine Environment R. Hillson and H.-J. Shyu Information Technology Division Introduction: The impact of anthropogenic noise on the marine environment is a subject of increasing
Janek LAANEARU and Aleksander KLAUSON Department of Mechanics, Tallinn University of Technology
 seminar in Tallinn, 5.01.013 PRINCIPAL UNDERWATER NOISE SOURCES IN BALTIC SEA AND METRICS USED IN NOISE LEVEL ASSESSMENT Janek LAANEARU and Aleksander KLAUSON Department of Mechanics, Tallinn University
Nortek Technical Note No.: TN-021. Chesapeake Bay AWAC Evaluation
 Nortek Technical Note No.: TN-021 Title: Chesapeake Bay AWAC Evaluation Last Edited: October 5, 2004 Authors: Eric Siegel-NortekUSA, Chris Malzone-NortekUSA, Torstein Pedersen- Number of Pages: 12 Chesapeake
Cruise Report Marine Mammal and Sea Turtle Observer UNDET Monitoring Hawaii Range Complex: 3 April 2014
 January 15, 2015 Cruise Report Marine Mammal and Sea Turtle Observer UNDET Monitoring Hawaii Range Complex: 3 April 2014 Prepared for: Commander, U.S. Pacific Fleet Prepared by: Naval Facilities Engineering
Description of Underwater Noise Attenuation System Design Unit 2. New NY Bridge Project
 New NY Bridge Project Description of Underwater Noise Attenuation System (NAS) Design Unit 2 Description of Underwater Noise Attenuation System Design Unit 2 for the New NY Bridge Project Revision 1 May
COMPARISON OF CONTEMPORANEOUS WAVE MEASUREMENTS WITH A SAAB WAVERADAR REX AND A DATAWELL DIRECTIONAL WAVERIDER BUOY
 COMPARISON OF CONTEMPORANEOUS WAVE MEASUREMENTS WITH A SAAB WAVERADAR REX AND A DATAWELL DIRECTIONAL WAVERIDER BUOY Scott Noreika, Mark Beardsley, Lulu Lodder, Sarah Brown and David Duncalf rpsmetocean.com
Characterizing The Surf Zone With Ambient Noise Measurements
 Characterizing The Surf Zone With Ambient Noise Measurements LONG-TERM GOAL Grant Deane Marine Physical Laboratory Scripps Institution of Oceanography La Jolla, CA 93093-0213 phone: (619) 534-0536 fax:
Habitat Use and Behavioral Monitoring of Hawaiian Monk Seals in Proximity to the Navy Hawaii Range Complex
 Project Annual Report Habitat Use and Behavioral Monitoring of Hawaiian Monk Seals in Proximity to the Navy Hawaii Range Complex Report Period: July 2011 June 2012 Submitted by: Kenady Wilson, Scientist
An underwater explosion is an explosion where the point of detonation is below the surface of the water.
 Underwater Explosion 1 Introduction An underwater explosion is an explosion where the point of detonation is below the surface of the water. Underwater explosion are categorized in accordance with their
Offshore platforms survivability to underwater explosions: part I
 Computational Ballistics III 123 Offshore platforms survivability to underwater explosions: part I A. A. Motta 1, E. A. P. Silva 2, N. F. F. Ebecken 2 & T. A. Netto 2 1 Brazilian Navy Research Institute,
Final Cruise Report Marine Mammal Observer UNDET Monitoring Hawaii Range Complex, April, 2011
 213 APPENDIX I. Cruise Report, Marine Mammal Observer UNDET Monitoring Hawaii Range Complex, August 12, 2011 Final Cruise Report Marine Mammal Observer UNDET Monitoring Hawaii Range Complex, 26-27 April,
STOPPING THE UNDERWATER DIVER THREAT
 STOPPING THE UNDERWATER DIVER THREAT Dr. Robert F. De La Croix and Mr. Juergen G. Keil A non-lethal, scalable deterrent solution Updated from original article published in Maritime Technology Reporter,
Assessment of cumulative Sound Exposure Levels (SEL) for marine piling events
 for marine piling events") Assessment of cumulative Sound Exposure Levels (SEL) for marine piling events P A Lepper 1, S P Robinson 2, M A Ainslie 3, P D Theobald 2, C A F de Jong 4 1 Loughborough University, Leicestershire, U K,
Assessment of cumulative Sound Exposure Levels (SEL) for marine piling events P A Lepper 1, S P Robinson 2, M A Ainslie 3, P D Theobald 2, C A F de Jong 4 1 Loughborough University, Leicestershire, U K,
Noise Experiment #2. Marine Physical Laboratory Scripps Institution of Oceanography La Jolla, CA February 22 February 2010
 Noise Experiment #2 Marine Physical Laboratory Scripps Institution of Oceanography La Jolla, CA 92093-0701 16 February 22 February 2010 1. Objective The objective of the noise experiment is to observe
PRINCIPAL UNDERWATER NOISE SOURCES IN BALTIC SEA AND METRICS USED IN NOISE LEVEL ASSESSMENT
 Tallinn meeting 25.01.2013 PRINCIPAL UNDERWATER NOISE SOURCES IN BALTIC SEA AND METRICS USED IN NOISE LEVEL ASSESSMENT Janek LAANEARU and Aleksander KLAUSON Department of Mechanics, Tallinn University
DEPARTMENT OF THE NAVY DIVISION NEWPORT OFFICE OF COUNSEL PHONE: FAX: DSN:
 M/W/SEA WARFARE CENTERS NEWPORT DEPARTMENT OF THE NAVY NAVAL UNDERSEA WARFARE CENTER DIVISION NEWPORT OFFICE OF COUNSEL PHONE: 401 832-3653 FAX: 401 832-4432 DSN: 432-3653 Attorney Docket No. 99558 Date:
DEPARTMENT OF THE NAVY DIVISION NEWPORT OFFICE OF COUNSEL PHONE: FAX: DSN:
 IMAVSBA WARFARE CENTERS NEWPORT DEPARTMENT OF THE NAVY NAVAL UNDERSEA WARFARE CENTER DIVISION NEWPORT OFFICE OF COUNSEL PHONE: 401 832-3653 FAX: 401 832-4432 DSN: 432-3653 Attorney Docket No. 85031 Date:
Inter-comparison of wave measurement by accelerometer and GPS wave buoy in shallow water off Cuddalore, east coast of India
 Indian Journal of Geo-Marine Sciences Vol. 43(1), January 2014, pp. 45-49 Inter-comparison of wave measurement by accelerometer and GPS wave buoy in shallow water off Cuddalore, east coast of India Sisir
PUV Wave Directional Spectra How PUV Wave Analysis Works
 PUV Wave Directional Spectra How PUV Wave Analysis Works Introduction The PUV method works by comparing velocity and pressure time series. Figure 1 shows that pressure and velocity (in the direction of
Does Depth Matter? Examining Factors that could Influence the Acoustic Identification of Odontocete Species on Bottom-Moored Recorders
 DISTRIBUTION STATEMENT A. Approved for public release; distribution is unlimited. Does Depth Matter? Examining Factors that could Influence the Acoustic Identification of Odontocete Species on Bottom-Moored
Increased streamer depth for dual-sensor acquisition Challenges and solutions Marina Lesnes*, Anthony Day, Martin Widmaier, PGS
 Increased streamer depth for dual-sensor acquisition Challenges and solutions Marina Lesnes*, Anthony Day, Martin Widmaier, PGS Summary The towing depth applicable to dual-sensor streamer acquisition has
Waves, Bubbles, Noise, and Underwater Communications
 Waves, Bubbles, Noise, and Underwater Communications Grant B. Deane Marine Physical Laboratory, Scripps Institution of Oceanography UCSD, La Jolla, CA 92093-0238 phone: (858) 534-0536 fax: (858) 534-7641
Marine Renewables Industry Association. Marine Renewables Industry: Requirements for Oceanographic Measurements, Data Processing and Modelling
 Marine Renewables Industry Association Marine Renewables Industry: Requirements for Oceanographic Measurements, Data Processing and Modelling October 2009 Table of Contents 1. Introduction... 1 2. Measurements
MEASUREMENT OF LONG-TERM AMBIENT NOISE AND TIDAL TURBINE LEVELS IN THE BAY OF FUNDY
 MEASUREMENT OF LONG-TERM AMBIENT NOISE AND TIDAL TURBINE LEVELS IN THE BAY OF FUNDY 11 th European Conference on Underwater Acoustics, 3 July 2012 Bruce Martin 1, Andrew Gerber 2, Christopher Whitt 1,
STANDARD SCORES AND THE NORMAL DISTRIBUTION
 STANDARD SCORES AND THE NORMAL DISTRIBUTION REVIEW 1.MEASURES OF CENTRAL TENDENCY A.MEAN B.MEDIAN C.MODE 2.MEASURES OF DISPERSIONS OR VARIABILITY A.RANGE B.DEVIATION FROM THE MEAN C.VARIANCE D.STANDARD
I. Monitoring and Adaptive Management Approach. Potential Effects, Monitoring Studies & Mitigation
 I. Monitoring and Adaptive Management Approach Define the problem or management objective. Determine potential effects of the project on indicator species. Emphasis on examining potentially negative, rather
UNDERWATER SOUND LEVELS ASSOCIATED WITH PILE DRIVING AT THE CAPE DISAPPOINTMENT BOAT LAUNCH FACILITY, WAVE BARRIER PROJECT
 WASHINGTON STATE PARKS CAPE DISAPPOINTMENT WAVE BARRIER PROJECT UNDERWATER SOUND LEVELS ASSOCIATED WITH PILE DRIVING AT THE CAPE DISAPPOINTMENT BOAT LAUNCH FACILITY, WAVE BARRIER PROJECT Prepared by: Jim
Marine Mammal Acoustic Tracking from Adapting HARP Technologies
 DISTRIBUTION STATEMENT A: Approved for public release; distribution is unlimited. Marine Mammal Acoustic Tracking from Adapting HARP Technologies Sean M. Wiggins and John A. Hildebrand Marine Physical
SCIENCE OF TSUNAMI HAZARDS
 SCIENCE OF TSUNAMI HAZARDS ISSN 8755-6839 Journal of Tsunami Society International Volume 31 Number 2 2012 SEA LEVEL SIGNALS CORRECTION FOR THE 2011 TOHOKU TSUNAMI A. Annunziato 1 1 Joint Research Centre,
SEISMIC SURVEY GREENLAND 2014 Underwater sound propagation for North East Greenland offshore seismic survey
 TGS February 2014 SEISMIC SURVEY GREENLAND 2014 Underwater sound propagation for North East Greenland offshore seismic survey Appendix: NEG14 modelling results Mark Mikaelsen PROJECT Seismic Survey Greenland
TRANSPORT OF NEARSHORE DREDGE MATERIAL BERMS
 Proceedings of the 6 th International Conference on the Application of Physical Modelling in Coastal and Port Engineering and Science (Coastlab16) Ottawa, Canada, May 10-13, 2016 Copyright : Creative Commons
INSTRUMENT INSTRUMENTAL ERROR (of full scale) INSTRUMENTAL RESOLUTION. Tutorial simulation. Tutorial simulation
 INSTRUMENTAL RESOLUTION. Tutorial simulation. Tutorial simulation") Lab 1 Standing Waves on a String Learning Goals: To distinguish between traveling and standing waves To recognize how the wavelength of a standing wave is measured To recognize the necessary conditions
Lab 1 Standing Waves on a String Learning Goals: To distinguish between traveling and standing waves To recognize how the wavelength of a standing wave is measured To recognize the necessary conditions
Acoustical approach to analysis of energy conversions in an oscillating bubble
 6. 8. října 2009 Acoustical approach to analysis of energy conversions in an oscillating bubble Karel Vokurka a, Silvano Buogo b a Physics Department, Technical University of Liberec, Studentská 2, 461
High Ping Rate Profile Water Mode 12
 Application Note FSA-014 (October 2008) Revised October 2008 High Ping Rate Profile Water Mode 12 Introduction Water Mode 12 is the result of the continued evolution of the signal processing within our
Acoustic Propagation Prediction in Shallow Water
 Acoustic Propagation Prediction in Shallow Water Justin P. Hoffman 1, John D. Penrose 1, and Darryl R. McMahon 2 1 Curtin University of Technology, 2 Defence Science and Technology Organisation, Australia.
TRIAXYS Acoustic Doppler Current Profiler Comparison Study
 TRIAXYS Acoustic Doppler Current Profiler Comparison Study By Randolph Kashino, Axys Technologies Inc. Tony Ethier, Axys Technologies Inc. Reo Phillips, Axys Technologies Inc. February 2 Figure 1. Nortek
Underwater measurement of photosynthetically active radiation
 Underwater measurement of photosynthetically active radiation Mark Blonquist, Damon Nitzel, and Bruce Bugbee Apogee Instruments, Inc., Logan, Utah Introduction Quantum sensors (photosynthetically active
inter.noise 2000 The 29th International Congress and Exhibition on Noise Control Engineering August 2000, Nice, FRANCE
 Copyright SFA - InterNoise 2000 1 inter.noise 2000 The 29th International Congress and Exhibition on Noise Control Engineering 27-30 August 2000, Nice, FRANCE I-INCE Classification: 4.5 THE PROPAGATION
COMPARISON OF CONTEMPORANEOUS WAVE MEASUREMENTS WITH A SAAB WAVERADAR REX AND A DATAWELL DIRECTIONAL WAVERIDER BUOY
 31 Bishop Street, Jolimont Western Australia 6014 T +61 8 9387 7955 F +61 8 9387 6686 E info@rpsmetocean.com W rpsmetocean.com & rpsgroup.com.au COMPARISON OF CONTEMPORANEOUS WAVE MEASUREMENTS WITH A SAAB
Currents measurements in the coast of Montevideo, Uruguay
 Currents measurements in the coast of Montevideo, Uruguay M. Fossati, D. Bellón, E. Lorenzo & I. Piedra-Cueva Fluid Mechanics and Environmental Engineering Institute (IMFIA), School of Engineering, Research
Waves, Bubbles, Noise and Underwater Communications
 DISTRIBUTION STATEMENT A: Approved for public release; distribution is unlimited. Waves, Bubbles, Noise and Underwater Communications Grant B. Deane Marine Physical Laboratory Scripps Institution of Oceanography
2016 International Perforating Symposium May Galveston, Texas
 IMESAFR - QRA Tool Perforating Gun Safety Analysis 2016 International Perforating Symposium May 9-11 - Galveston, Texas Who is the Institute of Makers of Explosives? Safety and Security Association for
Wave-Current Interaction in Coastal Inlets and River Mouths
 DISTRIBUTION STATEMENT A. Approved for public release; distribution is unlimited. Wave-Current Interaction in Coastal Inlets and River Mouths Tim T. Janssen Department of Geosciences, San Francisco State
Task 16: Impact on Lummi Cultural Properties
 Gateway Pacific Terminal Vessel Traffic and Risk Assessment Study Task 16: Impact on Lummi Cultural Properties Prepared for Pacific International Terminals, Inc. Prepared by The Glosten Associates, Inc.
Appendix E Cat Island Borrow Area Analysis
 Appendix E Cat Island Borrow Area Analysis ERDC/CHL Letter Report 1 Cat Island Borrow Area Analysis Multiple borrow area configurations were considered for Cat Island restoration. Borrow area CI1 is located
SPIRIT III Radiometer Saturation Effect
 Utah State University DigitalCommons@USU Space Dynamics Lab Publications Space Dynamics Lab 1-1-1997 SPIRIT III Radiometer Saturation Effect Joseph J. Tansock Follow this and additional works at: https://digitalcommons.usu.edu/sdl_pubs
Effect on Marine Life by Noise of Offshore Wind Farm S.JIANG 1 & J.P. HOU 1
 5th International Conference on Advanced Design and Manufacturing Engineering (ICADME 2015) Effect on Marine Life by Noise of Offshore Wind Farm S.JIANG 1 & J.P. HOU 1 1 Third Institute of Oceangraphy,SOA,Xiamen,Fujian,China
High Frequency Acoustical Propagation and Scattering in Coastal Waters
 High Frequency Acoustical Propagation and Scattering in Coastal Waters David M. Farmer Graduate School of Oceanography (educational) University of Rhode Island Narragansett, RI 02882 phone: (401) 874-6222
Measurement of underwater noise arising from marine aggregate operations
 Loughborough University Institutional Repository Measurement of underwater noise arising from marine aggregate operations This item was submitted to Loughborough University's Institutional Repository by
Wave Prediction in the Santa Barbara Channel
 Wave Prediction in the Santa Barbara Channel OCS Study MMS 2001-055 Final Technical Summary Final Study Report U.S. Department of the Interior Minerals Management Service Pacific OCS Region Wave Prediction
Waves, Bubbles, Noise, and Underwater Communications
 Waves, Bubbles, Noise, and Underwater Communications Grant B. Deane Marine Physical Laboratory, Scripps Institution of Oceanography UCSD, La Jolla, CA 92093-0238 phone: (858) 534-0536 fax: (858) 534-7641
POWER Quantifying Correction Curve Uncertainty Through Empirical Methods
 Proceedings of the ASME 2014 Power Conference POWER2014 July 28-31, 2014, Baltimore, Maryland, USA POWER2014-32187 Quantifying Correction Curve Uncertainty Through Empirical Methods ABSTRACT Christopher
Proceedings of Meetings on Acoustics
 Proceedings of Meetings on Acoustics Volume 9, 2010 http://acousticalsociety.org/ 159th Meeting Acoustical Society of America/NOISE-CON 2010 Baltimore, Maryland 19-23 April 2010 Session 1pBB: Biomedical
Air-Sea Interaction Spar Buoy Systems
 DISTRIBUTION STATEMENT A: Distribution approved for public release; distribution is unlimited Air-Sea Interaction Spar Buoy Systems Hans C. Graber CSTARS - University of Miami 11811 SW 168 th Street, Miami,
MEASUREMENTS OF UNDERWATER EXPLOSION PERFORMANCES BY PRESSURE GAUGE USING FLUOROPOLYMER
 MEASUREMENTS OF UNDERWATER EXPLOSION PERFORMANCES BY PRESSURE GAUGE USING FLUOROPOLYMER Kenji MURATA, Katsuhiko TAKAHASHI, Yukio KATO* NOF Corporation 61-1 Kitakomatsudani, Taketoyo-cho, Chita-gun, Aichi
Biological & Behavioral Response Studies of. Marine Mammals in Southern California, BRS.org. Photos taken under NMFS permit #
 Biological & Behavioral Response Studies of Marine Mammals in Southern California, 2015 ( SOCAL- 15) www.socal- BRS.org Photos taken under NMFS permit #14534-2 1 SOCAL- 15 OVERVIEW SOCAL- 15 continues
Pacific Missile Range Facility (PMRF) Species Verification and Satellite Tagging Test: January Post-Test Report
 Species Verification and Satellite Tagging Test: January Post-Test Report") Pacific Missile Range Facility (PMRF) Species Verification and Satellite Tagging Test: January 2012 Post-Test Report POC: David J. Moretti Naval Undersea Warfare Center Division Newport: Marine Mammal
Pacific Missile Range Facility (PMRF) Species Verification and Satellite Tagging Test: January 2012 Post-Test Report POC: David J. Moretti Naval Undersea Warfare Center Division Newport: Marine Mammal
Wave research at Department of Oceanography, University of Hawai i
 Wave research at Department of Oceanography, University of Hawai i Hawaii wave climate. Directional waverider buoys around Hawaii. Past and present wave-related research projects. Effect of tides on wave
COMPARISON OF DEEP-WATER ADCP AND NDBC BUOY MEASUREMENTS TO HINDCAST PARAMETERS. William R. Dally and Daniel A. Osiecki
 COMPARISON OF DEEP-WATER ADCP AND NDBC BUOY MEASUREMENTS TO HINDCAST PARAMETERS William R. Dally and Daniel A. Osiecki Surfbreak Engineering Sciences, Inc. 207 Surf Road Melbourne Beach, Florida, 32951
An Observational and Modeling Study to Quantify the Space/Time Scales of Inner Shelf Ocean Variability and the Potential Impacts on Acoustics
 DISTRIBUTION STATEMENT A. Approved for public release; distribution is unlimited. An Observational and Modeling Study to Quantify the Space/Time Scales of Inner Shelf Ocean Variability and the Potential
EFFECTS OF SIDEWALL OPENINGS ON THE WIND LOADS ON PIPE-FRAMED GREENHOUSES
 The Seventh Asia-Pacific Conference on Wind Engineering, November 8-12, 29, Taipei, Taiwan EFFECTS OF SIDEWALL OPENINGS ON THE WIND LOADS ON PIPE-FRAMED GREENHOUSES Yasushi Uematsu 1, Koichi Nakahara 2,
Methodologies for broadband reverberation data processing and analysis
 Indian Journal of Geo-Marine Sciences Vol. 44(2), February 2015, pp. 245-251 Methodologies for broadband reverberation data processing and analysis Baiju M. Nair* Naval Physical Oceanographic Laboratory,
Sontek RiverSurveyor Test Plan Prepared by David S. Mueller, OSW February 20, 2004
 Sontek RiverSurveyor Test Plan Prepared by David S. Mueller, OSW February 20, 2004 INTRODUCTION Sontek/YSI has introduced new firmware and software for their RiverSurveyor product line. Firmware changes
Acoustic Seaglider for Beaked Whale Detection
 DISTRIBUTION STATEMENT A: Approved for public release; distribution is unlimited. Acoustic Seaglider for Beaked Whale ion Neil M. Bogue and Jim Luby Applied Physics Laboratory University of Washington
Technical Note AN EMPIRICAL. METHOD FOR DESIGN OF BREAKWATERS AS SHORE PROTECTION STRUCTURES
 CETN III-23 (Rev 3/95) Coastal Engineering Technical Note AN EMPIRICAL. METHOD FOR DESIGN OF BREAKWATERS AS SHORE PROTECTION STRUCTURES PURPOSE: To present an empirical method that can be used for preliminary
Special edition paper
 Development of a Track Management Method for Shinkansen Speed Increases Shigeaki Ono** Takehiko Ukai* We have examined the indicators of appropriate track management that represent the ride comfort when
FFI RAPPORT BROADBAND INVERSION AND SOURCE LOCALIZATION OF VERTICAL ARRAY DATA FROM THE L-ANTENNA EXPERIMENT IN EIDEM Ellen Johanne
 FFI RAPPORT BROADBAND INVERSION AND SOURCE LOCALIZATION OF VERTICAL ARRAY DATA FROM THE L-ANTENNA EXPERIMENT IN 1999 EIDEM Ellen Johanne FFI/RAPPORT-2002/02565 FFIBM/786/115 Approved Horten 28. June 2002
SR 411, Lexington Bridge Underwater Noise Monitoring Results
 Northwest Region 157 Dayton Avenue North P.O. Box 3331 Seattle, WA 98133-971 Washington State Department of Transportation Douglas B. MacDonald Secretary of Transportation September 21, 26 (26) 44-4 TTY:
Technical Brief - Wave Uprush Analysis Island Harbour Club, Gananoque, Ontario
 Technical Brief - Wave Uprush Analysis RIGGS ENGINEERING LTD. 1240 Commissioners Road West Suite 205 London, Ontario N6K 1C7 October 31, 2014 Table of Contents Section Page Table of Contents... i List
from ocean to cloud HEAVY DUTY PLOUGH PERFORMANCE IN VERY SOFT COHESIVE SEDIMENTS
 HEAVY DUTY PLOUGH PERFORMANCE IN VERY SOFT COHESIVE SEDIMENTS Geoff Holland, Sarah Dzinbal (Alcatel-Lucent Submarine Networks) Email: geoff.holland@alcatel-lucent.com Alcatel-Lucent Submarine Networks
Hydroacoustic surveys of Otsego Lake s pelagic fish community,
 Hydroacoustic surveys of Otsego Lake s pelagic fish community, 2010 1 Holly A. Waterfield 2 and Mark Cornwell 3 INTRODUCTION Hydroacoustic surveys were conducted in May and November 2010 to estimate pelagic
USE OF THE EXCEEDANCE CURVE APPROACH IN OCCUPIED BUILDING RISK ASSESSMENT
 USE OF THE EXCEEDANCE CURVE APPROACH IN OCCUPIED BUILDING RISK ASSESSMENT Kieran J Glynn, Advisor Major Accident Risk, BP, UK The exceedance curve approach was developed following the issue of the 2003
WindProspector TM Lockheed Martin Corporation
 WindProspector TM www.lockheedmartin.com/windprospector 2013 Lockheed Martin Corporation WindProspector Unparalleled Wind Resource Assessment Industry Challenge Wind resource assessment meteorologists
Shot-by-shot directional source deghosting and directional designature using near-gun measurements
 H1-1-3 Shot-by-shot directional source deghosting and directional designature using near-gun measurements Neil Hargreaves, Rob Telling, Sergio Grion Dolphin Geophysical, London, UK Introduction In this
Supplementary materials
 Supplementary materials I. Pressure sensor calibration Our analysis is based on identification of the onset and offset of the inhalation relatively to the electrophysiological recordings. Onset and offset
EXPERIMENTAL RESULTS OF GUIDED WAVE TRAVEL TIME TOMOGRAPHY
 18 th World Conference on Non destructive Testing, 16-20 April 2012, Durban, South Africa EXPERIMENTAL RESULTS OF GUIDED WAVE TRAVEL TIME TOMOGRAPHY Arno VOLKER 1 and Hendrik VOS 1 TNO, Stieltjesweg 1,
Introduction to Underwater Acoustics Simulator. Poul Kronborg Product Area Owner, Marine MIKE Software Products DHI
 Introduction to Underwater Acoustics Simulator Poul Kronborg Product Area Owner, Marine MIKE Software Products DHI pok@dhigroup.com Module Overview for Marine MIKE Software: Release 2014 Hydrodynamics
Measurement of Underwater Sound Source Levels from Ships
 CSSRC Your true partner in maritime Measurement of Underwater Sound Source Levels from Ships Pang Yezhen, Wu Wenwei CHINA SHIP SCIENTIFIC RESEARCH CENTER China Ship Scientific Research Center Wuxi,China,
SCIENTIFIC COMMITTEE SEVENTH REGULAR SESSION August 2011 Pohnpei, Federated States of Micronesia
 SCIENTIFIC COMMITTEE SEVENTH REGULAR SESSION 9-17 August 2011 Pohnpei, Federated States of Micronesia CPUE of skipjack for the Japanese offshore pole and line using GPS and catch data WCPFC-SC7-2011/SA-WP-09
Coastal Wave Energy Dissipation: Observations and Modeling
 Coastal Wave Energy Dissipation: Observations and Modeling Jeffrey L Hanson US Army Corps of Engineers Field Research Facility USACE Field Research Facility Kent K. Hathaway US Army Corps of Engineers
139 South Meals, Suite 202 Drive, P.O. Box 3089 Valdez, Alaska / Fax 907/
 139 South Meals, Suite 202 Drive, P.O. Box 3089 Valdez, Alaska 99686 907/835-5957 Fax 907/835-5926 Date: March 9, 2010 Subject: Analysis of SAFETUG Wave Spectra with Respect to PWS Wave Conditions Project
E. Agu, M. Kasperski Ruhr-University Bochum Department of Civil and Environmental Engineering Sciences
 EACWE 5 Florence, Italy 19 th 23 rd July 29 Flying Sphere image Museo Ideale L. Da Vinci Chasing gust fronts - wind measurements at the airport Munich, Germany E. Agu, M. Kasperski Ruhr-University Bochum
"Real-Time Vertical Temperature, and Velocity Profiles from a Wave Glider"
 DISTRIBUTION STATEMENT A. Approved for public release; distribution is unlimited. "Real-Time Vertical Temperature, and Velocity Profiles from a Wave Glider" Luca Centurioni Scripps Institution of Oceanography
DUXBURY WAVE MODELING STUDY
 DUXBURY WAVE MODELING STUDY 2008 Status Report Duncan M. FitzGerald Peter S. Rosen Boston University Northeaster University Boston, MA 02215 Boston, MA 02115 Submitted to: DUXBURY BEACH RESERVATION November