AUDIO-VISUAL AND HYDROACOUSTIC OBSERVATIONS OF THE DEAD SEA CALIBRATION EXPERIMENT. Yefim Gitterman and Avi Shapira. Geophysical Institute of Israel
|
|
|
- Madlyn Day
- 6 years ago
- Views:
Transcription
1 AUDIO-VISUAL AND HYDROACOUSTIC OBSERVATIONS OF THE DEAD SEA CALIBRATION EXPERIMENT Yefim Gitterman and Avi Shapira Geophysical Institute of Israel Sponsored by the Defense Threat Reduction Agency Contract No.DSWA01-97-C-0151 ABSTRACT Three chemical charges of 500, 2060 and 5000 kg were detonated in November, 1999 in the Dead Sea at water depth of about 70 m (480 m below the ocean level). The main objective of the experiment was to calibrate the seismic travel times at local and regional distances. Using a specially designed recording system and GPS measurements, it was possible to provide an accuracy of 5 milliseconds for the detonation time and few meters for the location. However, the actual location accuracy was reduced to 50 meters due to strong variable undercurrents and winds in the Dead Sea. The source parameters of the explosions are: Date Origin Time (GMT) Coordinates Charge, kg Magnitude M L m b :00: '58.804"N 35 26'26.242"E :59: '01.800"N 35 26'24.000"E :00: '00.995"N 35 26'28.760"E (Note: The GII is not estimating m b magnitudes for event of m b <4.0) The experiment was video taped. The video and audio tracks provide a live presentation of interesting effects such as the cavitation hat, arrivals of the shock waves and the bubble pulsations at the raft, where the camera was placed, and water uplift at the detonation point. The video clips also provide a rough estimation of the shock wave propagation time to the surface and to the raft and contribute to verification of the charge depth and explosion-to-raft distance. One of the main objectives of the explosions was to characterize the specific seismic source by observation of radiated energy in the close vicinity. Two piezoelectric sensors, located at a distance of about 700 m from the shot point and at water depth of m, provided unique pressure measurements of the water shock waves. The measured peak pressures significantly exceeded the expected values from an equal TNT charge in ocean water due to enhanced acoustic impedance of the supersaline Dead Sea water. Analysis of different phases and arrival times on the records provided identification of surface ( ghost ) and bottom reflections and contributed to the verification of the experiment configuration. The shock wave energy was calculated utilizing the wave energy flux density equation, recorded pressure-time functions and unusual properties (density and acoustic velocity) of the Dead Sea water. The energy percentage was estimated relative to the energy of the explosive material used in the experiment. This is not the first time that explosions have been carried out in the Dead Sea; it is, however, the first time that a seismic source with an equivalent magnitude of about 4.0 on the Richter scale has been artificially generated in the area. Unique observations of underwater shot phenomena and shock waves in the particular Dead Sea water were obtained. The experiment is also unique for this region since it has precise information on coordinates and origin time of an explosion being recorded over 2500 km beyond the borders of Israel. Key Words: Dead Sea, underwater explosion, travel time calibration, audio-video clip, water shock wave
2 OBJECTIVE The overall objective of the Dead Sea explosions was to calibrate the seismic travel times at local and regional distances in the Middle East and East Mediterranean region, to calibrate regional and IMS stations and provide data for the improvement of the CTBT monitoring capabilities with the IMS. The specific objectives of the presented research relate to quantifying the coupling and the specific seismic source characterization of the explosions, including analysis of audio and video recordings, observation of radiated energy in close vicinity and measuring shock wave pressure in the unique Dead Sea settings. RESEARCH ACCOMPLISHED 1. Charge design and detonation technique. Based on results of preliminary small test explosions of 25 kg at depths m, it was decided to use a combined detonation technique: electric fuses and detonating cord (fuse) with multiple initiation points, and to limit the charges to the depth of 70 m. Parameters of the explosions are presented in Table 1. The charge unit design is shown on Figure 1. Sample photographs of the charges are presented in Figure 2. The primer blasting agent, CHEN AMON explosive, based on Ammonium Nitrate, has density gr/cm 3, which is higher than the Dead Sea water density gr/cm 3 (Anati, 1997), and detonation velocity 5500 m/sec. The Rotex detonating fuse (cord) 10,5 was used, which detonates at a velocity higher than 6500 m/sec. 2. Measurement of origin times and coordinates. In the first shot, a small seismic sensor was attached to the charge and provided accurate determination of the origin time. During the second shot, the sensor got disconnected from the recording system, and the O.T. estimation is based on measuring the relative propagation time of shock waves to piezoelectric sensors (see Chapter 4 below) and the absolute GPS time of the waves arrival to a hydrophone, co-located with the sensors. For the largest explosion we recorded the exact moment of detonating electric fuses, connected to detonating cord, which initiated the charge. The finite detonation time of the cord of the length of about m is estimated to be 10 msec (~ 70m/7000m/sec), was also considered. The timing in the recording system was continuously synchronized with GPS. Using 500 samples per second digitizer, we obtain accuracy better than 5 msec. The differential GPS system Magellan provided an accuracy of few meters in determining the location coordinates. Nevertheless, due to strong variable underwater currents and winds in the Dead Sea (especially during the second shot), we estimate the actual accuracy to be about 50 m, corresponding to possible drifting of the charge around the anchor. Table 1. Parameters of the calibration underwater explosions in the Dead Sea, charge depth H=70-73m, the sea depth ~260 m (Ground Truth Information rank GT0). Date Origin time (O.T.), GMT Location, GPS Magellan :00: N E :59: :00: N E N E Total charge kg Charge components, kg Initiation of the charge (using electric fuse - EF, and detonating cord - DC) chen Accelerator amon Red TNT chen +PETN EF connected to DC on the water surface and at depth near the charge EF connected to DC (length about m) on the water surface EF connected to DC (length about m) on the water surface Comments After detonation failure on 9.11, two additional TNT units were submerged (10.11) near the main charge An impressive water uplift about 15 m was observed 5-7 sec after the detonation 3. Audio-visual records of the explosions. The experiment was video taped. A home camera was placed on the raft that was hosting all measurement equipment and the initiation systems, at a distance of several hundred meters from the shots. The video and audio tracks provided observations and rough time measurements of interesting physical phenomena, such as a cavitation hat, arrivals of the shock waves and the bubble pulsations near the raft. The video clips also provided a rough estimation of the shock wave propagation time to the surface and to the raft and contribute to verification of the charge depth and explosion-to-raft distance.
, and 833 kg for 11.11.99 (total of 6 units). Fig. 2.")
 the 5000 kg charge consisted of six units of about 833")
3 Fig. 1. Design of the charge unit, containing 500 kg of explosives for the explosion on and (total of 4 units), and 833 kg for (total of 6 units). Fig. 2. Sample photographs of the charges of the three explosions: (a) the 500 kg charge unit was used also for the 2060 kg charge; (b) the 5000 kg charge consisted of six units of about 833 kg each.


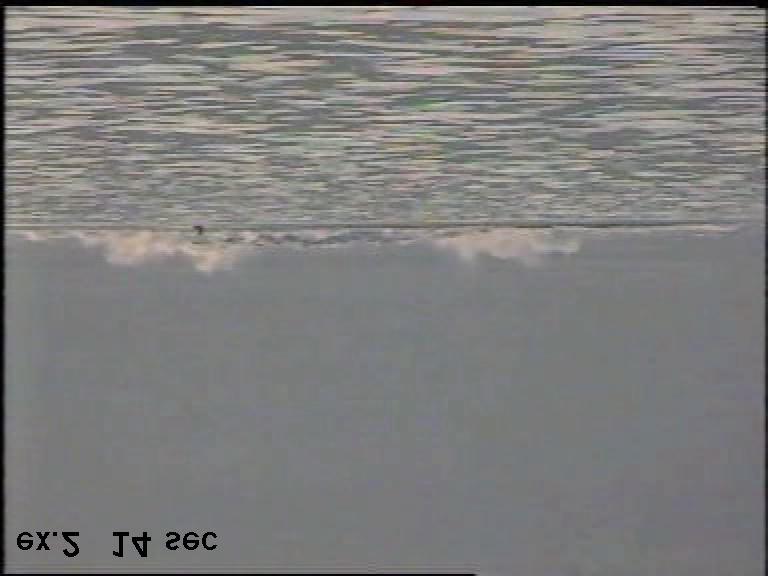
4 Fig.3. Snapshots from the video-record of the 2060 kg explosion
5 The video-recording rate is 25 fps (frames per second). This rate facilitates time measurement accuracy of about 40 msec. Figure 3 shows snapshots of the 2060 kg explosion, where following phenomena can be observed: a) "Cavitation hat", created when the direct shock wave arrivals to the water surface. An initial sign of the cavitation strip can be revealed at about 40 msec after initiation, ant this estimation fits well the propagation time t c = 70m/1770m/s = sec. The frames 80, 120 and 200 msec show an evolution of the cavitation process; b) The camera went out of focus by the shock wave impact upon the raft at about 440 msec after detonation, yielding an estimation that the raft distance from the shot is ~775 m. This estimation corresponds well to the estimation obtained from hydroacoustic recordings (see Table 3); c) The focus distortion is repeated after ~0.5 sec (at the 920 msec snapshot) due to the gas bubble pulsation, which is close to the predicted and measured from seismic spectra bubble pulse period (Table 3); d) Water uplift by the gases rise, in the time window 9-14 sec; e) Appearance of yellow gases explosive s detonation products, during sec, in the area displaced to the right from the epicenter. These displaced gases are also an evidence to the strong underwater currents in the Dead Sea, which prevented location accuracy better than 50 m of the charge. The video-record of the largest explosion 5000 kg has the impressive audio-track providing several specific audible signals, produced by the gas bubble pulsation, with intervals little less than 1.0 sec. It corresponds well to the estimation made from seismic records, of the bubble pulse period of about 0.8 sec (Table 3). 15 sec. videoclip of the 5000 kg shot ex3_15sec.mpg 4. Types of water shock waves. The water pressures were measured by Sadwin Engineering Consultancy using type 138A01 piezoelectric underwater blast sensors manufactured by PCB Piezotronics. The pressure-time history was recorded by a computer system with 250 khz response for each channel used. The record duration was only 0.7 sec due to some restrictions of computer memory and disc space. The full record of the largest explosion is plotted on Fig.4. The measurement gage was located at the distance of about 600 m and at the depth of 30 m. Fig.4. Pressure-time history of the largest explosion. The primary or direct wave P1, and surface-reflected P2 waves can be easily identified, whereas interpretation of P3 and P4 phases meets some difficulties discussed in Chapter 5 below. The cepstral simulation and inversion algorithm for analysis of regional seismic recordings of underwater explosions (Baumgardt, 2000) allows to separate out the band modulation of the surface reflection, yielding a negative cepstral peak at about 0.15 seconds period from the narrow band (20 Hz) EIL and MRNI seismic data of the Dead Sea shots. The optimal search inversions program returned very low values of the best matching reflection coefficient, sometimes on the order of -0.3 to -0.4 (D. Baumgardt, personal communication), which corresponds in some way to the water pressure measurements (Fig.4) showing the amplitude of the surface reflected wave about half of that of the primary shock wave amplitude.
 = 1770.6/(4*70) = 6.32Hz, and period is 0.158 sec, fitting well to the cepstral peak.")
6 The acoustic velocity in the Dead Sea has a high value C w = m/sec (Anati, 1997), supporting the interpretation that the 0.15 sec cepstral peak is caused by the surface reflection. The fundamental frequency in this case is f r = C w /(4*h) = /(4*70) = 6.32Hz, and period is sec, fitting well to the cepstral peak. In the ISN spectra, this surface reflection maximum is merged with the 5 th harmonic of the bubble fundamental frequency f b5 = f b 5 = = 6.4 Hz, causing enhanced maximums at about 6.46 Hz. 5. Verification of distances and depths. Based on the experiment configuration and arrival times of different phases measured from recordings of the shock waves, we tried to verify estimations of the source-sensor distance r, charge depth h and sea depth H in the shot point area. Travel times of different phases as measured from recordings of piezoelectric sensors and auxiliary hydrophones (which allowed kinematic estimations only) are presented in Table 2. Table 2. Arrival (travel) times of different water shock waves. Charge, kg Sensor type Sensor depth, h s, m Arrival time from the initiation moment, sec Surface P3 P4 1 st reflected t 3 t 4 bubble P2, t s pulse Direct wave P1, t d 2 nd bubble pulse 500 hydroph hydroph piezoel hydroph * piezoel * - time from the charge detonation moment The required parameters were estimated from combinations of simple kinematic equations, under the assumption that the shock wave velocity is constant along the whole propagation path (C w = m/s): r i /C w = t i - t (1) where index i corresponds to different waves, r i is the propagation path and depends on h and H, t i is the arrival time (relative the initiation moment), and t is a delay of a shot caused by the detonation cord with unknown length and detonation velocity (>6500 m/sec), which connects the initiation point on the water surface and the charge at depth. The detailed bathymetric map of the Dead Sea (Hall, 1993) shows (see Fig. 5), that the sea depth in the experiment area is H= m. Fig.5. Bathymetric chart of the Dead Sea and the explosion site. The water surface level is -415 m.
7 The phase analysis results can be summarized as follows: 1. For both shots 2 and 3 the estimated delay t is sec, a reasonable value considering the detonation cord length of about m and detonation velocity m/s. It is confirmed by a similar time difference of the direct wave arrivals to the hydrophone and the piezoelectric sensors during shot 3 (see Table 2). 2. The interpretation of phase P3 (see also Fig. 6) as the bottom-transmitted wave and P4 as the bottom-reflected wave, provides the sea depth estimate H=265 m, which corresponds well to the batymetric map estimation. However, the very high amplitudes and short duration of phase P3 contradict the theoretical description of the bottom-transmitted wave as a slow-raising and low amplitude wave, and correspond much better to the bottom-reflected wave (see, for example, USACE, 1991). Thus this interpretation is based only on kinematic features of the observed phases. 3. The interpretation of phase P3 as the bottom-reflected wave and P4 as the surface-bottom reflection provide a rather different estimate of the sea depth H=212 m. This interpretation is based on both kinematic and dynamic features of the observed waves, but is in disagreement with the batymetric map (another discrepancy is that surface-bottom reflection should be negative due to reflection from the water surface). The difference can not be related to estimation errors, and at the moment we can not provide any reasonable explanation and make a choice between the two interpretations. 4. The bubble period was estimated as the average time interval between the 1 st and 2 nd bubble pulses. 5. The distance values are very close to the preliminary estimations (Progress Report No. 26, 1999). A little increased charge depth estimation h=73.5 m for the 5000 kg shot seems to be reasonable, possibly due to long-drown rope and a charge-center shift. Fig. 6. Complex form of the P3 phase for the shot 5000 kg. Obtained estimates of the shot configuration parameters and the bubble period are presented in Table 3. Table 3. Shot configuration parameters and bubble periods estimated from shock wave travel times. Charge, Shot depth Sea depth, Hypocentral Bubble period Comments kg h, m H, m distance r, m T b, sec no precise piezoelectric measurements , r is for two gages separated by 25 m (or 212) H estimate depends on phase interpretation

8 6. Enhanced peak pressures. For the largest shot of 5000 kg, the main blasting agent CHEN AMON was about 97% of the total charge weight (see Table 1). According to the manufacturer estimation the explosive energy is about 80% of TNT. Nevertheless, the measured peak pressures significantly exceeded the expected values from an equal TNT charge in ocean water (see Table 4, Fig. 7). USACE (1991) and Joachim and Welch (1997), in a form similar to that provided by Cole (1948), give the relationships: P(t) = P m e -(t-ta)/q (2) P m (MPa) = 53.1 (W 1/3 (kg)/r (m) ) 1.13 (3) t a = r/c w (4) Q (s) = W 1/3 R s 0.18 (5) R s (m/kq 1/3 ) = r/w 1/3 (6) where P m is the peak pressure, t a is the arrival time, Q is the time constant, W is the equivalent weight, in kg, of TNT, detonated in ocean/lake water, r is the lateral distance in m, C w is the sonic velocity in water, m/sec. Fig. 7. Peak water pressure vs distance for underwater explosions of TNT in the ocean water and measurements of the Dead Sea shots. The peak pressure values in Table 4 and Fig. 7 are calculated by Eq. 3. This observation of the enhanced pressures for the Dead Sea shots can be attributed to the acoustic impedance of the supersaline Dead Sea water being about 40% higher than in the ocean and, thus, yielding a much stronger shock waves impact (see also Eq. 7). Table 4. Parameters of the shock waves for the explosions on and Explosive weight, kg 2060 Distance R, m Sensor depth, m Peak pressure, kpa Estimated from eq.(3) Measured Ratio measured/estimated
9 Estimation of the shock wave energy. Shock wave energy flux density is calculated as (Cole, 1948): E DS = Z DS -1 P 2 (t)dt (7) where Z DS is the Dead Sea water acoustic impedance, Z DS =ρ DS C DS =1236kg/m m/sec, and P(t) is the curve-fit equation (see Fig. 8) with estimated time constant Q DS = sec: P DS (t) = 1.23 exp[-(t )/q DS ] (in MPa) (8) Integral in (7) is calculated from the arrival time t a = sec to t=t a +6.7Q (Cole, 1948). The full shock wave energy can be calculated (at distance r=618 m) as: ta + 6.7Q E DS = ( exp( ( t ) / Q )) dt = 1219 Zw ta E s = E DS 4πr 2 = erg joul 2 / m Fig.8. Primary and surface-reflected shock waves and the curve-fit equation. Specific energy of the explosive CHEN AMON, used in the experiment, according to the manufacturer specifications: 1000 cal/gr = erg/kg, and the full explosive energy is: E e = erg. Then the share energy estimate for the primary shock wave is estimated to be E s /E e = 27.5% 8. Preliminary estimation of the TNT equivalent. It is assumed that the primary shock wave energy flux for the Dead Sea shot (W=5000 kg of CHEN AMON) E DS equals the shock wave energy flux E OC for the equivalent TNT charge W T exploded in the ocean water: E DS = E OC (9) The value E OC is calculated from Eq. (3,5,7): E OC = Z OC -1 [53.1(W T 1/3 /r) 1.13 exp(-t/q OC )] 2 dt (10) where the impedance for the ocean water is Z OC =1030kg/m m/sec, and Q OC depends on W T, as in Eq. (5). The value E DS is calculated from Eq. (7,8): E DS = Z -1 DS [1.23 exp(-t/q DS )] 2 dt (11) Finally, the TNT equivalent to the 5000 kg charge of CHEN AMON exploded in the Dead Sea is determined from Eq.(9-11) as:
10 W T = 4010 kg This value corresponds to the manufacturer estimation of the explosive CHEN AMON energy as about 80% of TNT.
11 11 CONCLUSIONS AND RECOMMENDATIONS The video and audio tracks present interesting phenomena such as the cavitation hat, arrivals of the shock waves and the bubble pulsations at the raft, and water uplift at the detonation point. The video clips also provid a rough estimation of the shock wave propagation time to the surface and to the raft and contribut to verification of the charge depth and explosion-to-raft distance. The measured peak pressures significantly exceed the expected values from an equal TNT charge in ocean water due to enhanced acoustic impedance of the super saline Dead Sea water. Analysis of different phases and arrival times on the records enables the identification of surface ( ghost ) and bottom reflections and contributed to the verification of the experiment configuration. The shock wave energy was calculated utilizing the wave energy flux density equation, recorded pressure-time functions specific for the Dead Sea water. These observations could also provide preliminary estimations of the shock energy share relative to the explosive energy, and TNT equivalent of the shots. This is not the first time that explosions have been carried out in the Dead Sea; it is, however, the first time that a seismic source with an equivalent magnitude of about 4.0 on the Richter scale has been artificially generated in the area. The experiment is also unique for this region since it has precise source information of a seismic event that was recorded over 2500 km beyond the borders of Israel. ACKNOWLEDGEMENTS Many individuals and institutions supported the Dead Sea calibration experiment and contributed to its success at different stages. Special thanks to Dr. A. Dainty of the DTRA of the US Department of Defense, for full financial and diplomatic support of the experiment in the politically high-sensitive area. Thanks to Eng. E.Hausirer of Explosive Manufacturing Industries (1997) Ltd, Israel, for crucial assistance during the experiment. The Earth Sciences Research Administration of the Israel Ministry of National Infrastructures donated the piezoelectric sensors for measuring water shock waves. Thanks to the Israel Atomic Energy Commission and to the Arms Control Division of the Ministry of Defense, Israel, for their great support. Thanks to Dr. M. Abelson of the Geological Survey of Israel who provided an elaborated report about a potential environmental impact of the planned explosions. Special thanks to the Israel Defense Forces and the Police of Israel for their assistance in conducting the explosions. The management and numerous personnel of the Geophysical Institute of Israel provided financial and technical support throughout the experiment. REFERENCES Anati, D.A., The hydrography of a hypersaline lake. In: The Dead Sea (The Lake and its setting). Ed. T.M. Niemi, Z. Ben-Avraham and J.R. Gat. Baumgardt, D., Seismic Characterization of the November 8, 10, and 11, 1999 Dead Sea Underwater Chemical Calibration Explosions Using Cepstral Modeling and Inversion, Spring 2000 AGU meeting, Washington. Cole, R. H., Underwater explosions, Princeton University Press, Dead Sea Calibration explosions: Operations and Preliminary Data, Progress Report No.26 on Contract No. DSWA01-97-C-0151, GII Report No. 591/61/97(26), December, Hall, J. K., The GSI Digital Terrain Model (DTM) completed. In: R. Bogoch and Y. Eshet (eds.), GSI Current Research: V., Jerusalem, Joachim, C. E. and C. R. Welch, 1997, Underwater shocks from blasting, In: Proceedings of the 23 rd Annual Conference on Explosive and Blasting Technique, Las Vegas, Nevada. International Society of Explosive Engineers, Cleveland, OH, U.S Army, Corps of Engineers (USACE), Underwater blast monitoring. Engineer Technical Letter No (FR). Washington, D.C. 9p.
AUDIO-VISUAL AND HYDROACOUSTIC OBSERVATIONS OF THE DEAD SEA CALIBRATION EXPERIMENT. Yefim Gitterman and Avi Shapira. Geophysical Institute of Israel
 AUDIO-VISUAL AND HYDROACOUSTIC OBSERVATIONS OF THE DEAD SEA CALIBRATION EXPERIMENT Yefim Gitterman and Avi Shapira Geophysical Institute of Israel Sponsored by the Defense Threat Reduction Agency Contract
SEISMIC CHARACTERIZATION OF THE NOVEMBER 8, 10, AND 11, 1999 DEAD SEA UNDERWATER CHEMICAL CALIBRATION EXPLOSIONS USING CEPSTRAL MODELING AND INVERSION
 SEISMIC CHARACTERIZATION OF THE NOVEMBER 8, 10, AND 11, 1999 DEAD SEA UNDERWATER CHEMICAL CALIBRATION EXPLOSIONS USING CEPSTRAL MODELING AND INVERSION Douglas R. Baumgardt and Angelina Freeman ENSCO, Inc.
Study on Intensity of Blast Wave Generated from Vessel Bursting by Gas Explosion
 5 th ICDERS August 7, 15 Leeds, UK Study on Intensity of Blast Wave Generated from Vessel Bursting by Gas Explosion Matsunaga, T., Mogi, T., Dobashi, R. Graduated School of Engineering, The University
An underwater explosion is an explosion where the point of detonation is below the surface of the water.
 Underwater Explosion 1 Introduction An underwater explosion is an explosion where the point of detonation is below the surface of the water. Underwater explosion are categorized in accordance with their
Examples of Carter Corrected DBDB-V Applied to Acoustic Propagation Modeling
 Naval Research Laboratory Stennis Space Center, MS 39529-5004 NRL/MR/7182--08-9100 Examples of Carter Corrected DBDB-V Applied to Acoustic Propagation Modeling J. Paquin Fabre Acoustic Simulation, Measurements,
Paper 2.2. Operation of Ultrasonic Flow Meters at Conditions Different Than Their Calibration
 Paper 2.2 Operation of Ultrasonic Flow Meters at Conditions Different Than Their Calibration Mr William Freund, Daniel Measurement and Control Mr Klaus Zanker, Daniel Measurement and Control Mr Dale Goodson,
Offshore platforms survivability to underwater explosions: part I
 Computational Ballistics III 123 Offshore platforms survivability to underwater explosions: part I A. A. Motta 1, E. A. P. Silva 2, N. F. F. Ebecken 2 & T. A. Netto 2 1 Brazilian Navy Research Institute,
AN ANALYSIS ON HIGH PRESSURE DYNAMIC CALIBRATORS USED IN THE DEFENSE AREAS
 AN ANALYSIS ON HIGH PRESSURE DYNAMIC CALIBRATORS USED IN THE DEFENSE AREAS Sung Soo HongPresenter Agency for Defense Development, Taean, 357-942, South Korea sungsoo@add.re.kr Abstract Up to now, there
Calculation of the Internal Blast Pressures for Tunnel Magazine Tests
 Calculation of the Internal Blast Pressures for Tunnel Magazine Tests by Kevin Hager Naval Facilities Engineering Service Center Pt Hueneme, CA and Naury Birnbaum Century Dynamics, Inc. San Ramon, CA ABSTRACT
MEASUREMENTS OF UNDERWATER EXPLOSION PERFORMANCES BY PRESSURE GAUGE USING FLUOROPOLYMER
 MEASUREMENTS OF UNDERWATER EXPLOSION PERFORMANCES BY PRESSURE GAUGE USING FLUOROPOLYMER Kenji MURATA, Katsuhiko TAKAHASHI, Yukio KATO* NOF Corporation 61-1 Kitakomatsudani, Taketoyo-cho, Chita-gun, Aichi
LOW PRESSURE EFFUSION OF GASES adapted by Luke Hanley and Mike Trenary
 ADH 1/7/014 LOW PRESSURE EFFUSION OF GASES adapted by Luke Hanley and Mike Trenary This experiment will introduce you to the kinetic properties of low-pressure gases. You will make observations on the
Acoustical approach to analysis of energy conversions in an oscillating bubble
 6. 8. října 2009 Acoustical approach to analysis of energy conversions in an oscillating bubble Karel Vokurka a, Silvano Buogo b a Physics Department, Technical University of Liberec, Studentská 2, 461
Application of Simulation Technology to Mitsubishi Air Lubrication System
 50 Application of Simulation Technology to Mitsubishi Air Lubrication System CHIHARU KAWAKITA *1 SHINSUKE SATO *2 TAKAHIRO OKIMOTO *2 For the development and design of the Mitsubishi Air Lubrication System
Seismic Sources. Seismic sources. Recorders. Requirements; Principles; Onshore, offshore. Digitals recorders; Analog-to-Digital (A/D) converters.
 converters.") Seismic Sources Seismic sources Requirements; Principles; Onshore, offshore. Recorders Digitals recorders; Analog-to-Digital (A/D) converters. Reading: Reynolds, Section 4.5 Telford et al., Section 4.5
Seismic Sources Seismic sources Requirements; Principles; Onshore, offshore. Recorders Digitals recorders; Analog-to-Digital (A/D) converters. Reading: Reynolds, Section 4.5 Telford et al., Section 4.5
Walk - Run Activity --An S and P Wave Travel Time Simulation ( S minus P Earthquake Location Method)
") Walk - Run Activity --An S and P Wave Travel Time Simulation ( S minus P Earthquake Location Method) L. W. Braile and S. J. Braile (June, 2000) braile@purdue.edu http://web.ics.purdue.edu/~braile Walk
Walk - Run Activity --An S and P Wave Travel Time Simulation ( S minus P Earthquake Location Method) L. W. Braile and S. J. Braile (June, 2000) braile@purdue.edu http://web.ics.purdue.edu/~braile Walk
LOW PRESSURE EFFUSION OF GASES revised by Igor Bolotin 03/05/12
 LOW PRESSURE EFFUSION OF GASES revised by Igor Bolotin 03/05/ This experiment will introduce you to the kinetic properties of low-pressure gases. You will make observations on the rates with which selected
Currents measurements in the coast of Montevideo, Uruguay
 Currents measurements in the coast of Montevideo, Uruguay M. Fossati, D. Bellón, E. Lorenzo & I. Piedra-Cueva Fluid Mechanics and Environmental Engineering Institute (IMFIA), School of Engineering, Research
Module 03 Accident modeling, risk assessment and management Lecture 04 Explosions
 Health, Safety and Environmental Management in Offshore and Petroleum Engineering Prof. Srinivasan Chandrasekaran Department of Ocean Engineering Indian Institute of Technology, Madras Module 03 Accident
SCIENCE OF TSUNAMI HAZARDS
 SCIENCE OF TSUNAMI HAZARDS ISSN 8755-6839 Journal of Tsunami Society International Volume 31 Number 2 2012 SEA LEVEL SIGNALS CORRECTION FOR THE 2011 TOHOKU TSUNAMI A. Annunziato 1 1 Joint Research Centre,
Sea State Analysis. Topics. Module 7 Sea State Analysis 2/22/2016. CE A676 Coastal Engineering Orson P. Smith, PE, Ph.D.
 Sea State Analysis Module 7 Orson P. Smith, PE, Ph.D. Professor Emeritus Module 7 Sea State Analysis Topics Wave height distribution Wave energy spectra Wind wave generation Directional spectra Hindcasting
SEASONDE DETECTION OF TSUNAMI WAVES
 SEASONDE DETECTION OF TSUNAMI WAVES Belinda Lipa, John Bourg, Jimmy Isaacson, Don Barrick, and Laura Pederson 1 I. INTRODUCTION We here report on preliminary results of a study to assess the capability
Chapter 11 Waves. Waves transport energy without transporting matter. The intensity is the average power per unit area. It is measured in W/m 2.
 Chapter 11 Waves Energy can be transported by particles or waves A wave is characterized as some sort of disturbance that travels away from a source. The key difference between particles and waves is a
Shearwater GeoServices. Increasing survey productivity and enhancing data quality February 2017 Steve Hepburn Acquisition Geophysicist
 Shearwater GeoServices Increasing survey productivity and enhancing data quality February 2017 Steve Hepburn Acquisition Geophysicist Shearwater GeoServices - Full Geophysical Service Company Marine Processing
Measured broadband reverberation characteristics in Deep Ocean. [E.Mail: ]
![Measured broadband reverberation characteristics in Deep Ocean. [E.Mail: ]](/thumbs/90/101823179.jpg "Measured broadband reverberation characteristics in Deep Ocean. [E.Mail: ]") Measured broadband reverberation characteristics in Deep Ocean Baiju M Nair, M Padmanabham and M P Ajaikumar Naval Physical and Oceanographic Laboratory, Kochi-682 021, India [E.Mail: ] Received ; revised
Measured broadband reverberation characteristics in Deep Ocean Baiju M Nair, M Padmanabham and M P Ajaikumar Naval Physical and Oceanographic Laboratory, Kochi-682 021, India [E.Mail: ] Received ; revised
Calculating the Effect of Surface or Underwater Explosions on Submerged Equipment and Structures
 Calculating the Effect of Surface or Underwater Explosions on Submerged Equipment and Structures C. David Sulfredge, Robert H. Morris, and Robert L. Sanders Oak Ridge National Laboratory, Building 5700,
ARA PROJECT Prepared by: Peter T. Dzwilewski Applied Research Associates, Inc Shaffer Parkway Littleton, Colorado 80127
 ARA PROJECT 001974 WATER SHOCK PREDICTION FOR EXPLOSIVE REMOVAL OF OFFSHORE STRUCTURES: UNDERWATER CALCULATOR (UWC) VERSION 2.0 UPDATE BASED UPON FIELD DATA Prepared by: Peter T. Dzwilewski Applied Research
Sontek RiverSurveyor Test Plan Prepared by David S. Mueller, OSW February 20, 2004
 Sontek RiverSurveyor Test Plan Prepared by David S. Mueller, OSW February 20, 2004 INTRODUCTION Sontek/YSI has introduced new firmware and software for their RiverSurveyor product line. Firmware changes
Explosive Fittings Testing
 Explosive Fittings Testing BFM Global Ltd. May 2012 EXCELLENCE IS A MINIMUM REQUIREMENT Contents 1. Summary... 3 2. Description of Samples... 4 3. Equipment... 4 4. Test Plan and Methodology... 5 4.1.
PROPAGATION OF LONG-PERIOD WAVES INTO AN ESTUARY THROUGH A NARROW INLET
 PROPAGATION OF LONG-PERIOD WAVES INTO AN ESTUARY THROUGH A NARROW INLET Takumi Okabe, Shin-ichi Aoki and Shigeru Kato Department of Civil Engineering Toyohashi University of Technology Toyohashi, Aichi,
Analysis of Pressure Rise During Internal Arc Faults in Switchgear
 Analysis of Pressure Rise During Internal Arc Faults in Switchgear ASANUMA, Gaku ONCHI, Toshiyuki TOYAMA, Kentaro ABSTRACT Switchgear include devices that play an important role in operations such as electric
SPIRIT III Radiometer Saturation Effect
 Utah State University DigitalCommons@USU Space Dynamics Lab Publications Space Dynamics Lab 1-1-1997 SPIRIT III Radiometer Saturation Effect Joseph J. Tansock Follow this and additional works at: https://digitalcommons.usu.edu/sdl_pubs
Temperature, salinity, density, and the oceanic pressure field
 Chapter 2 Temperature, salinity, density, and the oceanic pressure field The ratios of the many components which make up the salt in the ocean are remarkably constant, and salinity, the total salt content
DETRMINATION OF A PLUNGER TYPE WAVE MAKER CHARACTERISTICE IN A TOWING TANK
 The 9 th International Conference on Coasts, Ports and Marine Structures (ICOPMAS 2010) 29 Nov.-1 Dec. 2010 (Tehran) DETRMINATION OF A PLUNGER TYPE WAVE MAKER CHARACTERISTICE IN A TOWING TANK sayed mohammad
23 RD INTERNATIONAL SYMPOSIUM ON BALLISTICS TARRAGONA, SPAIN APRIL 2007
 23 RD INTERNATIONAL SYMPOSIUM ON BALLISTICS TARRAGONA, SPAIN 16-20 APRIL 2007 AN INVESTIGATION INTO THE INTERRELATION BETWEEN THE INTERNAL AND EXTERNAL BALLISTICS OF FIRING A TP-T TANK AMMUNITION M. H.
High-Resolution Measurement-Based Phase-Resolved Prediction of Ocean Wavefields
 DISTRIBUTION STATEMENT A. Approved for public release; distribution is unlimited. High-Resolution Measurement-Based Phase-Resolved Prediction of Ocean Wavefields Dick K.P. Yue Center for Ocean Engineering
inter.noise 2000 The 29th International Congress and Exhibition on Noise Control Engineering August 2000, Nice, FRANCE
 Copyright SFA - InterNoise 2000 1 inter.noise 2000 The 29th International Congress and Exhibition on Noise Control Engineering 27-30 August 2000, Nice, FRANCE I-INCE Classification: 4.5 THE PROPAGATION
CFD Simulation and Experimental Validation of a Diaphragm Pressure Wave Generator
 CFD Simulation and Experimental Validation of a Diaphragm Pressure Wave Generator T. Huang 1, A. Caughley 2, R. Young 2 and V. Chamritski 1 1 HTS-110 Ltd Lower Hutt, New Zealand 2 Industrial Research Ltd
Dynamics of bubble rising at small Reynolds numbers
 MATEC Web of Conferences 3, 01004 ( 015) DOI: 10.1051/ matecconf/ 015301004 C Owned by the authors, published by EDP Sciences, 015 Dynamics of bubble rising at small Reynolds numbers Vladimir Arkhipov
BLOCKAGE LOCATION THE PULSE METHOD
 BLOCKAGE LOCATION THE PULSE METHOD Presented by John Pitchford Pitchford In-Line Author James Pitchford ABSTRACT Pipeline blockages can result from a number of different mechanisms: wax or solid hydrates
The Estimation Of Compressor Performance Using A Theoretical Analysis Of The Gas Flow Through the Muffler Combined With Valve Motion
 Purdue University Purdue e-pubs International Compressor Engineering Conference School of Mechanical Engineering The Estimation Of Compressor Performance Using A Theoretical Analysis Of The Gas Flow Through
Seismic Survey Designs for Converted Waves
 Seismic Survey Designs for Converted Waves James A. Musser* GMG/AXIS Inc., Denver, CO 1720 Red Cloud Road, Longmont, CO, 80501, USA jmusser@gmg.com ABSTRACT Designing converted wave 3D surveys is considerably
INSTRUMENT INSTRUMENTAL ERROR (of full scale) INSTRUMENTAL RESOLUTION. Tutorial simulation. Tutorial simulation
 INSTRUMENTAL RESOLUTION. Tutorial simulation. Tutorial simulation") Lab 1 Standing Waves on a String Learning Goals: To distinguish between traveling and standing waves To recognize how the wavelength of a standing wave is measured To recognize the necessary conditions
Lab 1 Standing Waves on a String Learning Goals: To distinguish between traveling and standing waves To recognize how the wavelength of a standing wave is measured To recognize the necessary conditions
Wave Energy Atlas in Vietnam
 Wave Energy Atlas in Vietnam Nguyen Manh Hung, Duong Cong Dien 1 1 Institute of Mechanics, 264 Doi Can Str. Hanoi, Vietnam nmhungim@gmail.com; duongdienim@gmail.com Abstract Vietnam has achieved remarkable
E. Agu, M. Kasperski Ruhr-University Bochum Department of Civil and Environmental Engineering Sciences
 EACWE 5 Florence, Italy 19 th 23 rd July 29 Flying Sphere image Museo Ideale L. Da Vinci Chasing gust fronts - wind measurements at the airport Munich, Germany E. Agu, M. Kasperski Ruhr-University Bochum
ISOLATION OF NON-HYDROSTATIC REGIONS WITHIN A BASIN
 ISOLATION OF NON-HYDROSTATIC REGIONS WITHIN A BASIN Bridget M. Wadzuk 1 (Member, ASCE) and Ben R. Hodges 2 (Member, ASCE) ABSTRACT Modeling of dynamic pressure appears necessary to achieve a more robust
Final Report: Measurements of Pile Driving Noise from Control Piles and Noise-Reduced Piles at the Vashon Island Ferry Dock
 Final Report: Measurements of Pile Driving Noise from Control Piles and Noise-Reduced Piles at the Vashon Island Ferry Dock By Peter H. Dahl, Jim Laughlin, and David R. Dall Osto Executive Summary Underwater
BOTTOM MAPPING WITH EM1002 /EM300 /TOPAS Calibration of the Simrad EM300 and EM1002 Multibeam Echo Sounders in the Langryggene calibration area.
 BOTTOM MAPPING WITH EM1002 /EM300 /TOPAS Calibration of the Simrad EM300 and EM1002 Multibeam Echo Sounders in the Langryggene calibration area. by Igor Kazantsev Haflidi Haflidason Asgeir Steinsland Introduction
USE OF THE EXCEEDANCE CURVE APPROACH IN OCCUPIED BUILDING RISK ASSESSMENT
 USE OF THE EXCEEDANCE CURVE APPROACH IN OCCUPIED BUILDING RISK ASSESSMENT Kieran J Glynn, Advisor Major Accident Risk, BP, UK The exceedance curve approach was developed following the issue of the 2003
MODEL OF IMPACT UNDERWATER DETONATION
 Journal of KONES Powertrain and Transport, Vol. 19, No. 2 2012 MODEL OF IMPACT UNDERWATER DETONATION Andrzej Grzdziela Polish naval Academy Mechanical Electrical Faculty Smidowicza Street 69, 81-103 Gdynia,
1. What are the differences and similarities among transverse, longitudinal, and surface waves?
 Assignment Waves Reading: Giancoli, Chapters 11, 12, 22, 24 Holt, Chapters 12, 14 Objectives/HW The student will be able to: 1 Define, apply, and give examples of the following concepts: wave, pulse vs.
Malta Survey activities
 Malta Survey activities Malta 19 September 2016 L. Facchin OGS National Institute of Oceanography and Experimental Geophysics Offshore Multibeam (MBES) Sub bottom profiling (SBP: Chirp or Boomer) Multichannel
Flow in a shock tube
 Flow in a shock tube April 30, 05 Summary In the lab the shock Mach number as well as the Mach number downstream the moving shock are determined for different pressure ratios between the high and low pressure
Lecture 8 questions and answers The Biological Pump
 Lecture 8 questions and answers The Biological Pump (1) How long would it take a particle of about 2micron in size and a density of 1.5 g/cm 3 to get to the bottom of the sea (4000m)? How do particles
2016 International Perforating Symposium May Galveston, Texas
 IMESAFR - QRA Tool Perforating Gun Safety Analysis 2016 International Perforating Symposium May 9-11 - Galveston, Texas Who is the Institute of Makers of Explosives? Safety and Security Association for
WATER HYDRAULIC HIGH SPEED SOLENOID VALVE AND ITS APPLICATION
 WATER HYDRAULIC HIGH SPEED SOLENOID VALVE AND ITS APPLICATION Akihito MITSUHATA *, Canghai LIU *, Ato KITAGAWA * and Masato KAWASHIMA ** * Department of Mechanical and Control Engineering, Graduate school
Acoustic Emission of Bubbly Flow and Its Size Distribution Spectrum
 Proceedings of Acoustics 1 - Fremantle 1-3 November 1, Fremantle, Australia Acoustic Emission of Bubbly Flow and Its Size Distribution Spectrum ABSTRACT Li Chen (1, Shane Wood (, Stephen Moore (1 and Binh
High-Frequency Scattering from the Sea Surface and Multiple Scattering from Bubbles
 High-Frequency Scattering from the Sea Surface and Multiple Scattering from Bubbles Peter H. Dahl Applied Physics Laboratory College of Ocean and Fisheries Sciences University of Washington Seattle, Washington
Supplementary materials
 Supplementary materials I. Pressure sensor calibration Our analysis is based on identification of the onset and offset of the inhalation relatively to the electrophysiological recordings. Onset and offset
APPROACH RUN VELOCITIES OF FEMALE POLE VAULTERS
 APPROACH RUN VELOCITIES OF FEMALE POLE VAULTERS Peter M. McGinnis, Physical Education Department, SUNY College at Cortland, Cortland, New York INTRODUCTION Running speed is an important determinant of
Electronics the Art of Blasting turned Blasting Science. Sandy Tavelli / John Alkins
 Electronics the Art of Blasting turned Blasting Science Sandy Tavelli / John Alkins The Search for a Better Way Detonator technology has evolved over the decades from goose quills filled with black powder
Wave phenomena in a ripple tank
 Wave phenomena in a ripple tank LEP Related topics Generation of surface waves, propagation of surface waves, reflection of waves, refraction of waves, Doppler Effect. Principle Water waves are generated
Lab 1: Pressure and surface tension. Bubblers, gravity and the mighty paper clip.
 Lab 1: Pressure and surface tension. Bubblers, gravity and the mighty paper clip. CEE 3310 - Summer 2012 SAFETY The major safety hazard in this laboratory is a shock hazard. Given that you will be working
Waves, Bubbles, Noise, and Underwater Communications
 Waves, Bubbles, Noise, and Underwater Communications Grant B. Deane Marine Physical Laboratory, Scripps Institution of Oceanography UCSD, La Jolla, CA 92093-0238 phone: (858) 534-0536 fax: (858) 534-7641
The Science of Quantitative Risk Assessment for Explosives Safety
 The Science of Quantitative Risk Assessment for Explosives Safety By John Tatom (Manager, Explosives Safety Group, A-P-T Research, Inc. Quantitative risk assessment (QRA) tools, as described in the QRA
Friction properties of the face of a hand-held tennis racket
 Available online at www.sciencedirect.com Procedia Engineering 34 (2012 ) 544 549 9 th Conference of the International Sports Engineering Association (ISEA) Friction properties of the face of a hand-held
Air-Sea Interaction Spar Buoy Systems
 DISTRIBUTION STATEMENT A: Distribution approved for public release; distribution is unlimited Air-Sea Interaction Spar Buoy Systems Hans C. Graber CSTARS - University of Miami 11811 SW 168 th Street, Miami,
Experimental investigation of the check valve behaviour when the flow is reversing
 EPJ Web of Conferences, (7) DOI:./ epjconf/7 EFM Experimental investigation of the valve behaviour when the flow is reversing D. Himr a,v.habán, M. Hudec, and V. Pavlík Brno University of Technology, Faculty
INTERNATIONAL HYDROGRAPHIC SURVEY STANDARDS
 INTERNATIONAL HYDROGRAPHIC SURVEY STANDARDS by Gerald B. MILLS 1 I. Background The International Hydrographic Organization (IHO) traces its origin to the establishment of the International Hydrographic
Characteristics of Confined Blast Loading in Unvented Structures
 International Journal of Protective Structures Volume 2 Number 1 2011 21 Characteristics of Confined Blast Loading in Unvented Structures Yi Hu, Chengqing Wu*, Matthew Lukaszewicz, Jonathan Dragos, Jiajing
Lab 1c Isentropic Blow-down Process and Discharge Coefficient
 058:080 Experimental Engineering Lab 1c Isentropic Blow-down Process and Discharge Coefficient OBJECTIVES - To study the transient discharge of a rigid pressurized tank; To determine the discharge coefficients
Shot-by-shot directional source deghosting and directional designature using near-gun measurements
 H1-1-3 Shot-by-shot directional source deghosting and directional designature using near-gun measurements Neil Hargreaves, Rob Telling, Sergio Grion Dolphin Geophysical, London, UK Introduction In this
WindProspector TM Lockheed Martin Corporation
 WindProspector TM www.lockheedmartin.com/windprospector 2013 Lockheed Martin Corporation WindProspector Unparalleled Wind Resource Assessment Industry Challenge Wind resource assessment meteorologists
14/10/2013' Bathymetric Survey. egm502 seafloor mapping
 egm502 seafloor mapping lecture 10 single-beam echo-sounders Bathymetric Survey Bathymetry is the measurement of water depths - bathymetry is the underwater equivalent of terrestrial topography. A transect
Observations of noise generated by nonlinear internal waves on the continental shelf during the SW06 experiment
 Observations of noise generated by nonlinear internal waves on the continental shelf during the SW06 experiment A. Serebryany¹ ², A. Newhall¹, and J. Lynch¹ ¹ Woods Hole Oceanographic Institution, ² Andreyev
Caltrans compendium of underwater sound data from pile driving 2014 update
 Caltrans compendium of underwater sound data from pile driving 2014 update Richard RODKIN 1 ; Keith POMMERENCK 2 1 Illingworth & Rodkin, Inc., United States 2 Illingworth & Rodkin, Inc., United States
MODELING OF THERMAL BEHAVIOR INSIDE A BUBBLE
 CAV2001:sessionB6.002 1 MODEING OF THERMA BEHAVIOR INSIDE A BUBBE Boonchai ERTNUWAT *, Kazuyasu SUGIYAMA ** and Yoichiro MATSUMOTO *** *, ***Dept. of Mechanical Engineering, The University of Tokyo, Tokyo,
An innovative technology for Coriolis metering under entrained gas conditions
 An innovative technology for Coriolis metering under entrained gas conditions Coriolis mass flowmeters are usually only used for single-phase fluids, i.e. either liquids or gases, since it has been found
Transactions on Ecology and the Environment vol 12, 1996 WIT Press, ISSN
 Open boundary condition for unsteady open-channel flow K. Mizumura Civil Engineering Department, Kanazawa Institute of Technology, 7-1 Ogigaoka, Nonoichimachi, Ishikawa Pref. 921, Japan Abstract Initial
Development of Fluid-Structure Interaction Program for the Mercury Target
 Chapter 4 Epoch Making Simulation Development of Fluid-Structure Interaction Program for the Mercury Target Project Representative Chuichi Arakawa Authors Chuichi Arakawa Takuma Kano Ryuta Imai Japan Atomic
Waves, Bubbles, Noise, and Underwater Communications
 Waves, Bubbles, Noise, and Underwater Communications Grant B. Deane Marine Physical Laboratory, Scripps Institution of Oceanography UCSD, La Jolla, CA 92093-0238 phone: (858) 534-0536 fax: (858) 534-7641
FIRE PROTECTION. In fact, hydraulic modeling allows for infinite what if scenarios including:
 By Phil Smith, Project Manager and Chen-Hsiang Su, PE, Senior Consultant, Lincolnshire, IL, JENSEN HUGHES A hydraulic model is a computer program configured to simulate flows for a hydraulic system. The
SUBMERGED VENTURI FLUME. Tom Gill 1 Robert Einhellig 2 ABSTRACT
 SUBMERGED VENTURI FLUME Tom Gill 1 Robert Einhellig 2 ABSTRACT Improvement in canal operating efficiency begins with establishing the ability to measure flow at key points in the delivery system. The lack
Sensitivity of storm waves in Montevideo (Uruguay) to a hypothetical climate change
 to a hypothetical climate change") Vol. 9: 81-85,1997 1 CLIMATE RESEARCH Clim Res I Published December 29 Sensitivity of storm waves in Montevideo (Uruguay) to a hypothetical climate change Eugenio Lorenzo*, Luis Teixeira Instituto de Mecanica
Vol. 9: 81-85,1997 1 CLIMATE RESEARCH Clim Res I Published December 29 Sensitivity of storm waves in Montevideo (Uruguay) to a hypothetical climate change Eugenio Lorenzo*, Luis Teixeira Instituto de Mecanica
Lab #1 Pressure: Bubblers and Water Balloons CEE 331 Fall 2003
 CEE 331 Lab 1 Page 1 of 9 SAFETY Lab #1 Pressure: Bubblers and Water Balloons CEE 331 Fall 2003 Laboratory exercise based on an exercise developed by Dr. Monroe Weber-Shirk The major safety hazard in this
Conventional vs. GeoStreamer Data De-ghosting: The Haltenbanken Dual Streamer Case study
 A Publication of Petroleum Geo-Services Vol. 9 No. 7 July 2009 Conventional vs. GeoStreamer Data De-ghosting: The Haltenbanken Dual Streamer Case study Introduction The Haltenbanken dual streamer data
TEST REPORT. Solamatrix Inc. GLASS-GARD GGL1200 Multi-ply Window Film and Wetglaze Anchoring System on Single 6mm (1/4 ) Annealed Glass.
 Annealed Glass.") TEST REPORT Solamatrix Inc. GLASS-GARD GGL1200 Multi-ply Window Film and Wetglaze Anchoring System on Single 6mm (1/4 ) Annealed Glass. Class 3B US General Services Administration Explosion Resistant Standard
TEST REPORT Solamatrix Inc. GLASS-GARD GGL1200 Multi-ply Window Film and Wetglaze Anchoring System on Single 6mm (1/4 ) Annealed Glass. Class 3B US General Services Administration Explosion Resistant Standard
ROSE-HULMAN INSTITUTE OF TECHNOLOGY Department of Mechanical Engineering. Mini-project 3 Tennis ball launcher
 Mini-project 3 Tennis ball launcher Mini-Project 3 requires you to use MATLAB to model the trajectory of a tennis ball being shot from a tennis ball launcher to a player. The tennis ball trajectory model
Cooling Characteristics of GM-type Pulse Tube Refrigerator with Neon as Working Gas
 Cooling Characteristics of GM-type Pulse Tube Refrigerator with Neon as Working Gas J. Ko, Y.J. Hong, H. Kim, H. Yeom, S.J. Park, D.Y. Koh Korea Institute of Machinery & Materials Daejeon, Korea (S), 305-343
Inter-comparison of wave measurement by accelerometer and GPS wave buoy in shallow water off Cuddalore, east coast of India
 Indian Journal of Geo-Marine Sciences Vol. 43(1), January 2014, pp. 45-49 Inter-comparison of wave measurement by accelerometer and GPS wave buoy in shallow water off Cuddalore, east coast of India Sisir
Users Group Conference 2018
 Users Group Conference 2018 Compressor Analysis Special Circumstances Tracy Wimberly Sr. Reciprocating Equipment Analyst, Windrock 1 Topics, top compressor questions Ultrasound Baseline Cat Eyes Leak Index
CORRELATION BETWEEN SONAR ECHOES AND SEA BOTTOM TOPOGRAPHY
 CORRELATION BETWEEN SONAR ECHOES AND SEA BOTTOM TOPOGRAPHY JON WEGGE Norwegian Defence Research Establishment (FFI), PO Box 115, NO-3191 Horten, Norway E-mail: jon.wegge@ffi.no False alarms resulting from
Gravity wave effects on the calibration uncertainty of hydrometric current meters
 Gravity wave effects on the calibration uncertainty of hydrometric current meters Marc de Huu and Beat Wüthrich Federal Office of Metrology METAS, Switzerland E-mail: marc.dehuu@metas.ch Abstract Hydrometric
Lab 12 Standing Waves
 b Lab 12 Standing Waves What You Need To Know: Types of Waves The study of waves is a major part of physics. There are quite a few types of waves that can be studied. Depending on who you have for lecture
Fail Operational Controls for an Independent Metering Valve
 Group 14 - System Intergration and Safety Paper 14-3 465 Fail Operational Controls for an Independent Metering Valve Michael Rannow Eaton Corporation, 7945 Wallace Rd., Eden Prairie, MN, 55347, email:
Proceedings of Meetings on Acoustics
 Proceedings of Meetings on Acoustics Volume 9, 2010 http://acousticalsociety.org/ 159th Meeting Acoustical Society of America/NOISE-CON 2010 Baltimore, Maryland 19-23 April 2010 Session 1pBB: Biomedical
MODELING&SIMULATION EXTRAPOLATED INTERNAL ARC TEST RESULTS: A COUPLED FLUID-STRUCTURAL TRANSIENT METHODOLOGY
 MODELING&SIMULATION EXTRAPOLATED INTERNAL ARC TEST RESULTS: A COUPLED FLUID-STRUCTURAL TRANSIENT METHODOLOGY Jérôme DOUCHIN Schneider Electric France Jerome.douchin@schneider-electric.com Ezequiel Salas
Chapter 7. SCIIB Pressure Sensor Performance Evaluations: Experiments, Results and Discussions
 : Experiments, Results and Discussions This chapter will summarize the experiments and results associated with the development of the single-mode fiber-based SCIIB pressure sensor system. We will start
Cover Page for Lab Report Group Portion. Pump Performance
 Cover Page for Lab Report Group Portion Pump Performance Prepared by Professor J. M. Cimbala, Penn State University Latest revision: 02 March 2012 Name 1: Name 2: Name 3: [Name 4: ] Date: Section number:
BERNOULLI EFFECTS ON PRESSURE.ACTIVATED W ATER LEVEL GAUGES
 International Hydrographic R eview, Monaco, LV (2), July 1978. BERNOULLI EFFECTS ON PRESSURE.ACTIVATED W ATER LEVEL GAUGES by Langley R. MUIR Ocean and Aquatic Sciences, Central Region, Burlington, Ontario,
CONSTRUCTION OF LNG RECEIVING TERMINAL ON THE SAINT LAWRENCE TIDAL CURRENT CONDITIONS IN THE LEVIS AREA
 RABASKA PROJECT CONSTRUCTION OF LNG RECEIVING TERMINAL ON THE SAINT LAWRENCE TIDAL CURRENT CONDITIONS IN THE LEVIS AREA FINAL REPORT MARCH 2006 N/Réf. : 24237.360 3075, ch. des Quatre-Bourgeois Sainte-Foy