Geopacks Flowmeter (MFP51) Geopacks Advanced Flowmeter (MFP126)
|
|
|
- Herbert Matthews
- 5 years ago
- Views:
Transcription
 Geopacks Advanced Flowmeter")
1 Operation Manual Stream Flowmeters Geopacks Flowmeter (MFP51) Geopacks Advanced Flowmeter (MFP126)
2
3 CONTENTS 1.0 Key Components 1.1 Impeller Stick Basic Flowmeter Advanced Flowmeter Operating Instructions 2.1 Impeller Stick with Basic Flowmeter Impeller Stick with Advanced Flowmeter Steam Flow Velocity 3.1 Theoretical Background Describing Flows Sediment Transport Studying Streams some fieldwork suggestions 4.1 Recording Stream Velocity Plotting the Channel Cross-Section Calculating Stream Discharge Plotting Flow Patterns within a Stream Calibration 5.1 Impeller Stick Calibration 16 Appendix I Care of your Flowmeter 18 Appendix II Safety Considerations: BE AWARE BE SAFE 19 Appendix III Calibration Chart 20 Appendix IV Data Collection Sheets 21 Appendix V Resources 22
4
5 1.0 Key Components 1.1 Impeller Stick The impeller stick is used for measuring water velocity and consists of: An IMPELLER and coupled SENSOR in which a switch opens and closes as the impeller is rotated by the flow of water Four 250 mm long tube sections which slot together to make a 1m stick Three riser rods which when slotted singly or in combination, allow the impeller to be elevated above the stream bed at fixed heights 250 mm, 125 mm and 75 mm or combinations of these A 1m long cable which connects to a flowmeter (see below) 1.2 Basic Flowmeter The basic Flowmeter is an electronic device that counts signals (pulses) from the impeller stick proportional to velocity. The total number of counts per unit of time (normally one minute) can be converted into a velocity value by referring to a calibration chart or using a formula. The unit has the following features: An LCD (liquid crystal display) counter; A socket for the jack plug connection A three way switch on which the switch positions are: - NEUTRAL centre switch position - START flick the switch DOWN - STOP flick back to centre - RESET (to zero) UP to the top position - NEUTRAL centre position again The act of inserting the jack plug from the impeller stick turns the meter ON. Having inserted the jack the value in the LCD should read 0. If greater than 0, move the switch to the UP position and rotate the impeller fractionally to close the relay to reset at 0, and then move the switch to the neutral position. 1
6 1.3 Advanced Flowmeter The LCD display on this instrument gives an average velocity in m/s or mph for WATER. There is no need to time your measurements using this instrument; nor do you have to use a calibration chart. To operate the instrument: Select a stream flow impeller. Insert the jack plug from the flow impeller into the socket. Select WATER and mph or ms -1 with the rotary dial Initiate motion of the sensor in the water Switch the instrument ON using the slide switch on the left side of the unit The display should read and there will be a flashing colon between the 00 s. If the colon does not flash, replace the battery. When using the impeller stick, the display will not change for 10 seconds, after which an average velocity will be shown in the units selected (mph or ms -1 ). This delay is known as the Integration Time. The value shown will be held for 2 seconds (no flashing colon) then for a further 10 seconds until a new average is obtained. Naturally, a number of averages should be obtained to build up a full picture of flow rates at each point. 2
7 2.0 Operating Instructions 2.1 Impeller Stick with Basic Flowmeter Slot the rods of the IMPELLER unit together and point the impeller up into the flow of moving water at the required depth (Figure 1a). Use one or more of the three riser rods to elevate the impeller off the stream bed if necessary (figure 1b). Figure 1a Impeller Stick in the flow Figure 1b Using Riser Rods When the impeller is turning at the correct depth (which will depend on the purpose of your measurements), flick the switch down to the start position and hold for 60 seconds (best to have a time keeper at hand!). Stop the count (CENTRE position) at the correct time and note the count value. Determine the flow speed via the graph provided (see section 5.1, page 17 and Appendix III). Alternatively, the flow speed (V), in m/s is given by the following formula in which C is the number of counts per minute: Water Velocity (V) m/s = C Zero the counter UPPER switch position (turn impeller slightly, if necessary, to close the impeller relay) and return to CENTRE switch position ready for further measurements. 3
8 2.2 Impeller with Advanced Flowmeter Connect the IMPELLER to the meter BEFORE turning the instrument on. Select WATER and mph or m/s and initiate movement by immersing the IMPELLER in moving water with the impeller pointing upstream. NOW switch the instrument ON with the switch on the left hand side of the unit. Note the flashing colon. With the IMPELLER stick attached and WATER selected, the colon will flash for 10 seconds before a value is displayed; it will then stop flashing for 2 seconds before flashing again for 10 seconds and displaying a revised value. The values represent average velocity in either m/s or mph as selected; the 10 second period represents the period over which the average was taken (integration time). The first reading will almost always be low and should de disregarded. WARNING: do not change your selection without switching the instrument off and waiting 10 seconds before switching it back on again. Repeated operation of the ON/OFF and Selector Switches is likely to cause erroneous readings to be displayed. If the colon fails to flash at all; change the battery. Battery life should be approximately 80 hours with a top quality PP3 9V alkali battery or equivalent. To change the battery, remove the sliding cover on the back of the case. Be careful not to lose the battery cover, as these cannot be replaced separately from the counter unit case. The unit should be kept dry and SHOULD NOT be immersed in water. 4
9 3.0 Stream Flow Velocity 3.1 Theoretical Background A moving fluid exhibits certain important features. The flow velocity of a fluid depends upon the cross-sectional area of the flow and upon the quantity of fluid, which passes through that area in unit time. This is known as the DISCHARGE and illustrates the Principle of the Continuity of MASS. Figure 2 River Cross-sections and Flow Velocity In the river channel depicted in Figure 2 the volume of water, which passes through section Y 1 in a second, is the DISCHARGE (Q) and will be given by: Q = a. b. V 1 and similarly at section Y 2 Q = c. d. V 2 In these equations, a and c are the widths and b and d are the depths of the channel at the two sections, and V 1 and V 2 are the flow velocities. Since the same DISCHARGE (Q) passes through both of the sections then flow velocity relates to the difference between a. b and c. d (the cross-sectional area) ; i.e. if the channel becomes either narrower or shallower then the flow velocity increases and vice versa. This principle explains many of the variations in the river channel morphology and in flow velocity. It is therefore important that this principle be understood by anyone undertaking serious fieldwork measurements in rivers. This could be demonstrated by measuring channel cross-sectional area and discharge at a number of different sections along a short stretch of river. 5


10 3.2 Describing Flows To understand the flow characteristics within streams of moving water it is helpful to construct STREAM LINES and VECTOR LINES. Figure 3 shows how Stream Lines depict possible paths of a single fluid particle. Figure 3 Stream Lines in a flow around a meander Vector Lines represent both the flow direction and velocity. The longer and broader the line the greater the flow velocity. Vector lines convey useful information about the stream flow characteristics. Figure 4 Vector Lines in a flow around meander 6

11 In this diagram the short thin arrows represent the slower areas of the stream and the long, thick lines the regions of faster flow. 3.3 Sediment Transport The amount of sediment and maximum particle size that can be transported by moving water is related to the flow velocity. Therefore, measurements of velocity obtained using the flowmeter can be used to determine the maximum size of sediment particles, which may be transported by the flow (Figure 5). Figure 5 Erosion Velocities for Water The chart, which has been derived from a mass of accumulated observed data, shows that for a given flow velocity there are a range of behavioural possibilities for sediment particles lying on the bed, or entrained within the flow, of a stream. For example, at a measured flow velocity of 100 cm/s (1 m/s) silt and sand (through not compacted clay) will be eroded from the stream bed and transported downstream. At the same velocity, all sediment particles finer than 1mm, which were already in motion, will continue in motion. Where the stream velocity falls below 10 cm/s (0.1 m/s), due to, say, a widening of the channel, sediment particles greater than 1mm diameter will be deposited. Thus, a stream flowmeter can be a valuable observation tool when used in sediment transportation studies. Observed flow velocities can be traced on the graph and the corresponding maximum particle size, which can be transported at the velocity, can be determined. 7
 Measuring tape Ranging pole Clipboard and pen Data collection sheets Working in groups of")
12 4.0 Studying Streams Some fieldwork suggestions 4.1 Recording Stream Velocity Equipment Needed: Geopacks stream flowmeter Stopwatch (if using Basic flowmeter) Measuring tape Ranging pole Clipboard and pen Data collection sheets Working in groups of two or three, students make rapid progress provided they work efficiently, know their objectives and have thoroughly prepared the ground. For example, one student works in, or above the stream with the meter while a second student uses a stopwatch to control the velocity recording time. A third member of the group records the data, such as notes on the site, distance from the bank from which the measurements are being taken, also the depth of reading, recording time, and finally of course, the number of counts per minute or velocity. Measurements of the distance from the banks and the position of the meter in the stream are vital. For systematic collection of stream velocity data, the position of the meter readings should always be recorded with reference to one bank DISTANCE OUT. For example, in larger channels this may be determined by attaching a tape to the waist or belt of the student working in the stream with the meter. By standing on the bank, and holding the tape out horizontally across the channel one person can determine the position of the meter from the bank. Figure 6 Measuring Distance Out using tape attached to student s belt In smaller channels it maybe more convenient to stretch the tape measure across the channel horizontally from the bank to bank. The ends of the tape can be attached to ranging poles on the bank. 8
13 Figure 7 Measuring Distance Out using tape stretched between poles Depth of measurement (DISTANCE DOWN) can easily be measured if the flowmeter tubes are simply calibrated beforehand using tape or water-resistant paint or ink, or more accurately, by using a staff. In estimating water depth, please note that each section of the flowmeter stem is 250 mm long. Total water depth from surface to bed (sometimes called the WET READING) can be measured with the impeller stick if less than 1 metre. It is useful to have an elastic band or some other device on the impeller stick which can be moved up and down the stem to the water level. This allows a reasonably accurate estimate of depth to be made visually. Alternatively, if calculating the position of 0.6 of the depth (see section 4.3) for mean water column velocity measurement, the band can be moved to the appropriate position along the stem. 4.2 Plotting the Channel Cross-Section This is essential for meaningful stream velocity recording. A plan or map of the stream cross-section at each point where measurements are to be made forms the basis for recording observations. One method of measuring and plotting the channel form is by stretching a tape measure across the channel as described above. Depths can be measured vertically down from the tautly stretched tape to the stream bed (or channel perimeter) see Figure 8. Measurements of channel widths and depths are then recorded using data sheet provided. At regular intervals along the tape, two measurements should be noted. Firstly, the distance from the tape to the ground or water surface known as the DRY READING. Secondly, the WET READING should be recorded. This is the depth of the water at each point. This depth can be measured using the calibrated stem of the flowmeter, but more accurately by using a rule or staff. The greater the number of measurements taken at each cross-section, the more accurate the representation of the channel. 9
 that: DISCHARGE (Q) = Cross-Sectional Area x Flow Velocity So, if the cross section area of a channel was 1 m 2 and the rate of flow was measured at 1 m/s, then the")

14 Figure 8 Measuring & Plotting the Channel Cross-Section 4.3 Calculating Stream Discharge In section 3.1 it was demonstrated (Figure 2) that: DISCHARGE (Q) = Cross-Sectional Area x Flow Velocity So, if the cross section area of a channel was 1 m 2 and the rate of flow was measured at 1 m/s, then the Discharge Q would be 1 m 3 /s (1 cumec). If, after heavy rain the channel area increased to 2 m 2 and the flow velocity to 1.5 m/s then the discharge (Q) would be 3 m 3 /s or 3 cumec. Discharge is a very important variable. Unfortunately, it is not always easy to measure. Figure 9a Semi-Circular Channel Figure 9b Rectangular Channel Calculating discharge in the case of either the semi-circular channel (Figure 9a) or the rectangular channel (Figure 9b) is relatively simple. In the semi-circular channel, if we take: Radius of Channel (r) = 1 m Cross-sectional area (Δ) = π 2 ) 2 = 1.57m 2 Mean Velocity (V) = 1 m/s Discharge (Q) = Δ x V = 1.57 m 3 /s Similarly, in the rectangular channel, if the: Depth (d) = 1 m Width (w) = 1.5 m Cross-sectional (Δ) = 1.5m 2 Mean Velocity (V) = 1 m/s Discharge (Q) = Δ x V = 1.50 m 3 /s 10


15 In a real-life situation, however, the channel geometry will be far from regular. Figure10a Irregular Stream Channel Cross-Section In these cases, the calculation of the cross-sectional area is more complex as the following example shows: Figure 10b Calculating the Cross-Sectional Area of a irregular Channel In this Example, the channel area beneath the water line has been divided into three triangular shapes. The largest triangle is whole, while the other two approximate the geometry of the area which they respectively cover by a judicious mix of inclusion and exclusion. By finding the area of each triangle by the formula: Area of Triangle = (Length of Base) x (Half the Height) It is possible to calculate the cross-sectional area of the channel by summing the areas of the triangles (the values used are notional, for illustration only): Area of triangle A = 1.00 m 2 Area of triangle B = 0.15 m 2 Area of triangle C = 0.30 m 2 Total Channel Area = 1.45 m 2 11
16 Unfortunately, there remains the problem of measuring the flow velocity in the channel. Because of friction with the bed and banks (the WETTED PERIMETER) and because of internal turbulence, stream velocity varies from point to point. Large numbers of observations under controlled conditions suggest that in water depths of less than 0.6m, a reliable average velocity can be recorded at a point, which is 0.6 of the depth of the water below the surface. At this depth the faster surface flow is averaged out against the slower bed flow and this figure is an acceptable EMPIRICAL GUIDELINE (i.e. one derived from observation and experiment under a variety of circumstances). A quick way of finding 0.6 of the depth requires a special piece of equipment a rubber band! Follow this simple procedure: Step 1 Step 2 Step 3 Step 4 Step 5 Step 6 Step 7 Figure 11 rest impeller base on stream bed. mark the water surface level with finger and thumb. remove stick from the water keeping water surface mark. visually estimate (or measure) 0.4 of the distance down the stick between the water surface mark and the base. place a mark (e.g. rubber band) at this point. submerge the impeller stick to this point on the stem. the impeller will be approximately at the 0.6 of the depth from the surface down. Finding 0.6 of the depth But the problems aren t over yet! In the semi-circular and rectangular channel sections shown in Figures 9a and 9b, an impeller placed in the centre of the channel at 0.6 of the depth, would give a reasonable average flow velocity. In the real-life section shown in figure 10b, the channel geometry is much less regular. Where should the mean velocity be measured? The most likely choice would probably be in the vicinity of the label letter A 12
17 Thus, if the flow velocity (V) at this point was recorded as being 1 m/s and with a crosssectional area of 1.45 m 2 then the DISCHARGE (Q) would be 1.45 m 3 /s To do the job properly however, it would be necessary to make a series of average flow velocity measurements, and this would require the channel cross-section to be subdivided into a series of columns like those in Figure 12. Figure 12 Constructing Water Columns in a Stream Cross-Section Figure 12 shows a stream cross-section which is 2 m wide. The section has been subdivided into columns (WATER COLUMNS) 0.25 m wide. According to the geometry of the channel, each column consists of a triangle and/or a rectangle. The area of each column has been calculated using the techniques described earlier and using the scale provided on the diagram. At an appropriate point within each column, the flow velocity would be measured with an impeller. A set of hypothetical velocities and the area measurements are displayed in Table 1, along with the calculations necessary to determine DISCHARGE (Q). Table 1 Table of Measurements and Calculations for the Cross-Section Col.1 Col.2 Col.3 Col.4 Col.5 Col.6 Col.7 Col.8 Cols 1-8 Area Area Area Cross-Section area (m 2 ) V Mean Velocity (m/s) Q Discharge (m 3 /s) In the Table, Area 1 refers to rectangles and Area 2 to triangles From the table: The total cross-sectional area has been calculated as 1.27 m 2 The mean flow velocity through the section is 0.58 m/s The total discharge (Q) through the section is 0.86 m 3 /s 13
 though adjustments for changes in depth and in-channel geometry due to erosion and deposition must be made.")
18 These procedures ensure that the best possible results are obtained from fieldwork. Once the hard work of surveying the channel section has been done, the profile can be used repeatedly under varying circumstances (e.g. before and after heavy rain) though adjustments for changes in depth and in-channel geometry due to erosion and deposition must be made. The exact position of the cross-section(s) must be fixed by inserting discrete stakes into the river banks. 4.4 Plotting Flow Patterns within a Stream Using the cross-section channel profile(s) constructed for discharge measurements (or survey some new sections), it is possible to collect data to illustrate the internal flow characteristics of channelled flow. There are a number of techniques, most common being the construction of ISOVELS or CHOROPLETHS. Isovels are lines joining points of equal velocity and Choropleths involve shaded areas of like and unlike velocity. Figure 13 Showing internal flow patterns Isovels (above) & Choropleths Key: dark shades = high velocity; light shades = low velocity The isovels and choropleths represent lines and areas of equal velocity respectively. The highest velocity occurs usually in the centre of the channel near to the surface, while it is often lower nearer the bed and banks (Figure 13). However, the pattern displayed by the isovels and choropleths also reflects the shape of the channel i.e. its width, depth and symmetry (Figure 13). The spacing of the isovels and choropleths represents the velocity gradient. Both methods can be effective in showing internal flow patterns. The degree of refinement depends on the number of readings which are taken the more the better. Three values must be collected at each point distance out from one or other bank; depth; and velocity at that point. The stream cross-section must be surveyed as meticulously as possible for the calculation of discharge and readings are collected systematically in a transect across the stream channel. Instead of taking just one velocity reading 0.6 of the depth, a number of readings are taken at regular points within the water column. 14

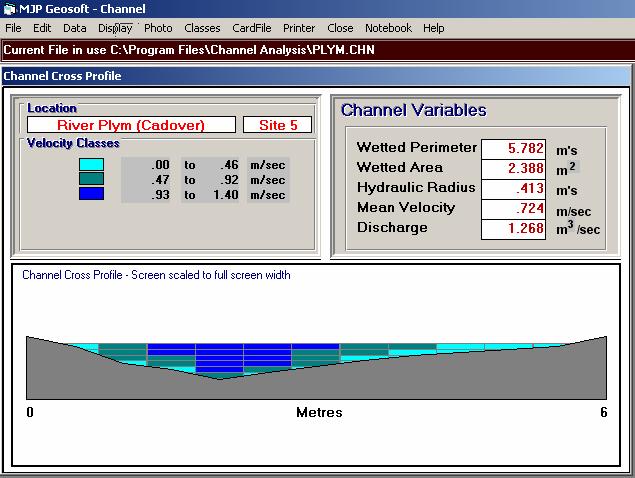
19 Figure 14 Data collection grid for Isovel and Choropleth Construction In Figure 14, the + signs indicate the midpoint of each cell in the grid. Typically a grid would consist of cells 0.25 m wide and m deep. The size is determined by the size and scale of the channel and degree of accuracy required. Table 2 Stream Velocity Data collected in Cells Stream Velocity In m/s Depth Col.1 Col.2 Col.3 Col.4 Col.5 Col.6 Col.7 Col.8 to to to to to Cells are 0.25 wide and 0.125m deep The data shown in this grid are ideally suited to constructing choropleths. For a representative and refined Isovel construction, at least twice as many velocity readings would be required (typically in a grid with 0.1 by 0.1 m cells). Geopacks publishes a computer software package called Channel Analysis which not only plots choropleths from fieldwork data but also draws channel cross-sections and calculates discharge among a wide range of other functions. For details see Appendix V. 15
20 5.0 Calibration The impeller stick has been carefully calibrated under laboratory conditions. The formula and graph from what we call the Calibration Data are essential for users of the Basic Flowmeter with impeller stick. The Advanced Flowmeter has the relevant calibration data built into the electronics so that direct velocity data is generated in m/s or mph as selected. 5.1 Impeller Stick Calibration The impeller sticks have been calibrated in a flume where the velocity of water flow can be strictly controlled by combined variations in discharge, gradient and weir height adjustments. Flow rate was monitored by a miniature Nixon electronic flowmeter and an Ott flowmeter. The formula required to convert counts per minute (C) recorded by the Basic Flowmeter to water velocity (V) in m/s is: Water Velocity (V) m/s = C Alternative units can be calculated using the following conversion factors: m/s to kph x 3.60 m/s to mph x 2.24 m/s to ft/s x 3.28 Values in this manual are given in metres per second (m/s). The formula can be entered into a spreadsheet or other computer program and used to convert counts per minute into the desired unit of velocity. Alternatively, a Calibration Chart can be used. The chart (Figure 15) is reproduced in laminated format with this manual for use in the field. 16
21 Figure 15 Calibration Chart for Water Velocity Water Velocity (m/s) V = C m/s to kph x 3.60 m/s to mph x 2.24 m/s to ft/s x Counts per minute (C) 17
22 Appendix I CARE OF YOUR FLOWMETER Check your equipment before you start work. BEFORE leaving for fieldwork check your equipment as follows: Switch on the meter by plugging the impeller into the socket (use the ON-OFF switch on the Advanced flowmeter) If nothing is displayed, check the batteries are correctly fitted. Batteries are accessed in the Basic flowmeter by undoing the small cross-headed screws on the back of the unit (try not to lose the screws!). On the Advanced flowmeter, un-clip the battery cover on the back of the instrument (take care not to lose the cover). Fit new batteries if necessary: always carry spares ( AAA for the Basic average life several months: PP3 (9 volt) for the Advanced average life 80 hours continuous use). Although your flowmeter has been designed for use by fieldwork parties under a wide range of conditions and is reasonably robust, it can be damaged by rough treatment or immersion in water. Should either meter be immersed in water, REMOVE the batteries IMMEDIATELY; the basic meter can be left open to dry in a warm room, do not attempt to open the Advanced meter but leave it to dry slowly. Should the flowmeter (impeller stick and/or meter) be damaged or otherwise malfunction we can repair/replace damaged parts at a very reasonable cost and will also provide repairs under guarantee. Please telephone Geopacks on and ask for Technical Product Manager prior to returning the meter. GEOPACKS Unit 4A, Hatherleigh Industrial Estate Holsworthy Road Hatherleigh Devon EX20 3LP We can also customise your Flowmeter for any special requirements. We recommend that the moving parts be lubricated with WD 40, or similar, after each field session. Also, the battery should be removed if the equipment is not being used for any length of time YOUR FLOWMETER IS GUARANTEED AGAINST DEFECTS IN MATERIALS AND WORKMANSHIP FOR 12 MONTHS FROM THE DATE OF PURCHASE. 18
23 Appendix II Safety Considerations BE AWARE BE SAFE When undertaking fieldwork in and around streams, please heed the following safety first points: 1. Never work alone. Let someone responsible know where and when you will be working; and don t go elsewhere. 2. Always work with others 3 is a sensible minimum. 3. Never work in fast flowing or deep water - as a general guide FAST means greater than 0.5 m/s and DEEP means where the water level comes above the knee. 4. Always survey the stream for: unstable banks, dangerous obstacles on the bed, overhanging trees and other common-sense dangers. 5. Never risk HYPOTHERMIA wear warm, waterproof clothes and even in summer, have these to hand stream water can be very cold, almost all year round. If you don t know what the term HYPOTHERMIA means, please seek advice, it is a life threatening, though avoidable, medical condition caused by loss of body heat due to cold and wet and or exhausting conditions. 6. Always take the utmost precaution when attempting to cross streams if in doubt, don t. 7. Never attempt to cross or work in streams prone to flash floods. BE AWARE BE SAFE 19
24 Appendix III Calibration Chart The large chart enclosed have been laminated for your convenience. Please make photocopies for your records in case the original become mislaid or damaged in use. Enclosed water calibration chart - laminated 20
25 Appendix IV Data Collection Sheets Insert units of measurement as appropriate (e.g. m and m/s) V.1 For use with Geopacks Basic Flowmeter stream velocity V.2 For use with Geopacks Advanced Flowmeter stream velocity Enclosed 1 each of the above sheets, laminated 21
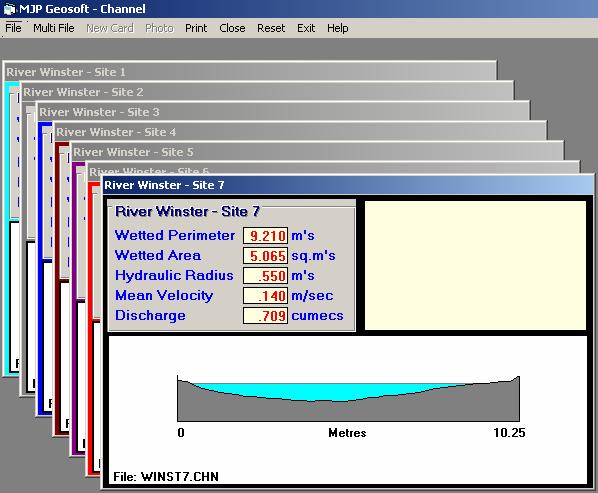
26 Appendix V Resources Geopacks manufactures and distributes a wide range of products associated with the flowmeter discussed in this manual. We have measuring tapes, stop watches, ranging poles, a wide range of other survey equipment, as well as the more specialized items described below. Of particular interest are the following products but be sure to ask for our full Geopacks catalogue if you don t already have a copy; our address and telephone number given in Appendix 1. Videos: Studying Rivers, a Practical Approach a 60 minute compilation for teachers and students. Practical guidance in using the flowmeter to test simple hypotheses moving on to develop skills in plotting internal flow characteristics and undertake full scale discharge measurements. Based on fieldwork in South Wales but incorporating background material from other locations especially the Colorado Plateau area of the American South West. PAL for VHS; GPV (plus VAT where appropriate). Studying Sediment in Motion, a Practical Approach 45 minutes of instruction and demonstration on how to measure sediment transportation in streams and in moving air using flowmeter/anemometers. Filmed on location in South Wales, the video aims at students in the 13 to 18-age range of the UK education system (KS3 through GCSE to A level) through a series of staged experiments. Laboratory follow-up to fieldwork is especially emphasised in this compilation. PAL for VHS; GPV (plus VAT where appropriate). Computer Software: Channel Analysis for WINDOWS by Rick Cope. The Essential software tool for guiding, processing, presenting the fruits of your river based field studies. Channel Analysis has been written for Windows by Rick Cope, a geography teacher well known for his expertise in field studies. This is available in single user, 2 10 users, or 11+ users. Please contact Geopacks for more information and Costs. Some illustrations from Channel Analysis appear on the following pages. Please note the last illustration which highlights the unique facility in this program for storing card file data clips on a whole range of river features. 22

27 23

28 24
29 Water Velocity Calibration Chart V = C+0.05 m/s to kph x 3.60 m/s to mph x 2.24 m/s to ft/s x 3.28 Counts per minute (C) Water Velocity (m/s)
30
31 Obs Distance Depth Counts/ Velocity Obs Distance Depth Counts/ Velocity # Out Minute (C) (V) # Out Minute (C) (V) V.1 For use with the Geopacks Flowmeter for Stream Velocity (users may copy this sheet)
32
33 Obs Distance Depth Velocity Obs Distance Depth Velocity Obs Distance Depth Velocity # Out (V) # Out (V) # Out (V) V.2 For use with the Geopacks Advanced Flowmeter for Stream Velocity (users may copy this sheet)
Flow Rate Sensor Product Number: ENFLO-A254A
 imagine explore learn Flow Rate Sensor Product Number: ENFLO-A254A Overview One of the highlights of any science class is the opportunity to get out of the classroom for field work. The Flow sensor gives
Exercise 2-3. Flow Rate and Velocity EXERCISE OBJECTIVE C C C
 Exercise 2-3 EXERCISE OBJECTIVE C C C To describe the operation of a flow control valve; To establish the relationship between flow rate and velocity; To operate meter-in, meter-out, and bypass flow control
ANSWERS TO QUESTIONS IN THE NOTES AUTUMN 2018
 ANSWERS TO QUESTIONS IN THE NOTES AUTUMN 2018 Section 1.2 Example. The discharge in a channel with bottom width 3 m is 12 m 3 s 1. If Manning s n is 0.013 m -1/3 s and the streamwise slope is 1 in 200,
Experiment (13): Flow channel
: Flow channel") Experiment (13): Flow channel Introduction: An open channel is a duct in which the liquid flows with a free surface exposed to atmospheric pressure. Along the length of the duct, the pressure at the surface
Experiment (13): Flow channel Introduction: An open channel is a duct in which the liquid flows with a free surface exposed to atmospheric pressure. Along the length of the duct, the pressure at the surface
Lab 1: Pressure and surface tension. Bubblers, gravity and the mighty paper clip.
 Lab 1: Pressure and surface tension. Bubblers, gravity and the mighty paper clip. CEE 3310 - Summer 2012 SAFETY The major safety hazard in this laboratory is a shock hazard. Given that you will be working
Walk - Run Activity --An S and P Wave Travel Time Simulation ( S minus P Earthquake Location Method)
") Walk - Run Activity --An S and P Wave Travel Time Simulation ( S minus P Earthquake Location Method) L. W. Braile and S. J. Braile (June, 2000) braile@purdue.edu http://web.ics.purdue.edu/~braile Walk
Walk - Run Activity --An S and P Wave Travel Time Simulation ( S minus P Earthquake Location Method) L. W. Braile and S. J. Braile (June, 2000) braile@purdue.edu http://web.ics.purdue.edu/~braile Walk
Advanced Hydraulics Prof. Dr. Suresh A. Kartha Department of Civil Engineering Indian Institute of Technology, Guwahati
 Advanced Hydraulics Prof. Dr. Suresh A. Kartha Department of Civil Engineering Indian Institute of Technology, Guwahati Module - 4 Hydraulic Jumps Lecture - 1 Rapidly Varied Flow- Introduction Welcome
SUBMERGED VENTURI FLUME. Tom Gill 1 Robert Einhellig 2 ABSTRACT
 SUBMERGED VENTURI FLUME Tom Gill 1 Robert Einhellig 2 ABSTRACT Improvement in canal operating efficiency begins with establishing the ability to measure flow at key points in the delivery system. The lack
The Discussion of this exercise covers the following points:
 Exercise 3-2 Orifice Plates EXERCISE OBJECTIVE In this exercise, you will study how differential pressure flowmeters operate. You will describe the relationship between the flow rate and the pressure drop
A Review of the Bed Roughness Variable in MIKE 21 FLOW MODEL FM, Hydrodynamic (HD) and Sediment Transport (ST) modules
 and Sediment Transport (ST) modules") A Review of the Bed Roughness Variable in MIKE 1 FLOW MODEL FM, Hydrodynamic (HD) and Sediment Transport (ST) modules by David Lambkin, University of Southampton, UK 1 Bed roughness is considered a primary
A Review of the Bed Roughness Variable in MIKE 1 FLOW MODEL FM, Hydrodynamic (HD) and Sediment Transport (ST) modules by David Lambkin, University of Southampton, UK 1 Bed roughness is considered a primary
Pedometer with PC download. Model: FB322 OVERVIEW FRONT VIEW INDEX
 OVERVIEW FRONT VIEW Pedometer with PC download INDEX Model: FB322 Introduction...1 Overview...1 Front view...1 Back view battery compartment...1 LCD screen...1 Getting started...2 Setting the device...2
Water Weir Flow Controller. Introduction. Safety Precautions. Mounting the Hardware
 57007-88 Introduction Safety Precautions This instruction sheet describes how to set up and use the Hach (Figure 1). A water weir is a device that raises or diverts water to regulate the flow. Hach s water
Hygea Ultrasonic Validation Kit
 Hygea Ultrasonic Validation Kit Ultrawave s Hygea Ultrasonic Validation kit contains the tools and accessories required to perform Validation and Periodic testing of your ultrasonic cleaning bath. Designed
Cover Page for Lab Report Group Portion. Pump Performance
 Cover Page for Lab Report Group Portion Pump Performance Prepared by Professor J. M. Cimbala, Penn State University Latest revision: 02 March 2012 Name 1: Name 2: Name 3: [Name 4: ] Date: Section number:
Lab #1 Pressure: Bubblers and Water Balloons CEE 331 Fall 2003
 CEE 331 Lab 1 Page 1 of 9 SAFETY Lab #1 Pressure: Bubblers and Water Balloons CEE 331 Fall 2003 Laboratory exercise based on an exercise developed by Dr. Monroe Weber-Shirk The major safety hazard in this
Cover Page for Lab Report Group Portion. Head Losses in Pipes
 Cover Page for Lab Report Group Portion Head Losses in Pipes Prepared by Professor J. M. Cimbala, Penn State University Latest revision: 02 February 2012 Name 1: Name 2: Name 3: [Name 4: ] Date: Section
Movement and Position
 Movement and Position Syllabus points: 1.2 plot and interpret distance-time graphs 1.3 know and use the relationship between average speed, distance moved and 1.4 describe experiments to investigate the
APPENDIX B HYDRAULIC DESIGN DATA FOR CULVERTS
 TM 5-820-4/AFM 88-5, Chap 4 APPENDIX B HYDRAULIC DESIGN DATA FOR CULVERTS B-1. General. a. This appendix presents diagrams, charts, coefficients and related information useful in design of culverts. The
Instructions for using the PRECISION DIGITAL PITCH GAUGE 2008, Precision Analytical Instruments, Inc. Congratulations!
 10857 Millington Court Blue Ash, OH 45242 513-984-1600 (voice), 513-984-4090 (fax) email Doug@ToolsForAnalysis.com Instructions for using the PRECISION DIGITAL PITCH GAUGE 2008, Precision Analytical Instruments,
Fluid Flow. Link. Flow» P 1 P 2 Figure 1. Flow Model
 Fluid Flow Equipment: Water reservoir, output tubes of various dimensions (length, diameter), beaker, electronic scale for each table. Computer and Logger Pro software. Lots of ice.temperature probe on
STATIONARY SPRINKLER IRRIGATION SYSTEM
 STATIONARY SPRINKLER North Carolina Cooperative Extension Service North Carolina State University STATIONARY SPRINKLER General Guidelines Operating an irrigation system differently than assumed in the
Constant Pressure Inlet (CCN) Operator Manual
 Operator Manual") Constant Pressure Inlet (CCN) Operator Manual DOC-0125 Revision J 2545 Central Avenue Boulder, CO 80301-5727 USA C O P Y R I G H T 2 0 1 1 D R O P L E T M E A S U R E M E N T T E C H N O L O G I E S, I
Constant Pressure Inlet (CCN) Operator Manual DOC-0125 Revision J 2545 Central Avenue Boulder, CO 80301-5727 USA C O P Y R I G H T 2 0 1 1 D R O P L E T M E A S U R E M E N T T E C H N O L O G I E S, I
FLOW MEASUREMENT (SEMI-SUBMERGIBLE OBJECT METHOD)
") Page 83 of 232 OKLAHOMA CONSERVATION COMMISSION WATER QUALITY DIVISION STANDARD OPERATING PROCEDURE FLOW MEASUREMENT (SEMI-SUBMERGIBLE OBJECT METHOD) Page 84 of 232 1.0 PROCEDURAL SECTION 1.1 Scope and
Page 83 of 232 OKLAHOMA CONSERVATION COMMISSION WATER QUALITY DIVISION STANDARD OPERATING PROCEDURE FLOW MEASUREMENT (SEMI-SUBMERGIBLE OBJECT METHOD) Page 84 of 232 1.0 PROCEDURAL SECTION 1.1 Scope and
Questions. theonlinephysicstutor.com. facebook.com/theonlinephysicstutor. Name: Edexcel Drag Viscosity. Questions. Date: Time: Total marks available:
 Name: Edexcel Drag Viscosity Questions Date: Time: Total marks available: Total marks achieved: Questions Q1. A small helium balloon is released into the air. The balloon initially accelerates upwards.
Integral type Differential pressure flowmeter VNT Series
 Integral type Differential pressure flowmeter VNT Series OUTLINE VH series Wafer-Cone differential pressure flowmeter and high precision differential pressure transmitter are integrated into one flowmeter.
Science in Sport. 106 How fast is the wind speed? Read. Count/Tachometer Any EASYSENSE. Sensors: Loggers: Logging time: EasyLog
 Sensors: Loggers: Count/Tachometer Any EASYSENSE Science in Sport Logging time: EasyLog 106 How fast is the wind speed? Read When an Olympic or world record is set, the rules for it to stand are quite
The Challenge of Wave Scouring Design for the Confederation Bridge
 13: Coastal and Ocean Engineering ENGI.8751 Undergraduate Student Forum Faculty of Engineering and Applied Science, Memorial University, St. John s, NL, Canada MARCH 2013 Paper Code. (13 - walsh) The Challenge
Anatomy of a Homer. Purpose. Required Equipment/Supplies. Optional Equipment/Supplies. Discussion
 Chapter 5: Projectile Motion Projectile Motion 17 Anatomy of a Homer Purpose To understand the principles of projectile motion by analyzing the physics of home runs Required Equipment/Supplies graph paper,
GEOL 106: Earthquake Country Activity 08: Discharge Measurements. Name: Date:
 Name: Date: Discharge Calculation Discharge = Velocity X Area or Q = VA Calculate the Discharge for the measurements shown at the right. Q = Discharge Measurement Do not collect water samples in the area
Digital Melting Point Apparatus
 Digital Melting Point Apparatus Heating Plateau Ramping Start/Stop Plateau set Ramp stop Hold User Guide Version 1.1 Heating Viewing tube Sample Chamber IEC power inlet socket Power on/off Temperature
Perimeter. Name. 22 Topic 17. Reteaching Find the perimeter of the figure below.
 Perimeter Reteaching 1-1 Find the perimeter of the figure below. 15 m x 4 ft 4 ft 2 ft y 2 ft 5 ft 6 m 20 ft Reteaching 1-1 By using a formula: There are two equal lengths and equal widths, so you can
Recognise that some mechanisms, including levers, pulleys and gears, allow a smaller force to have a greater effect
 MODULE 7 FEEL THE FORCE Key vocabulary: lever, pivot, push, pull, mechanism, machine, force, fulcrum LESSON 8: HOW CAN WE USE LEVERS TO HELP US? LESSON SUMMARY: This lesson introduces mechanisms devices
APPLICATION NOTE. AN-9608 July 2001 SEEPAGE MEASUREMENT IN AN OPEN CHANNEL THROUGH A WEIR
 APPLICATION NOTE AN-9608 July 2001 SEEPAGE MEASUREMENT IN AN OPEN CHANNEL THROUGH A WEIR 1 Introduction Seepage of water through, around or under a dam is expected in all embankment dams and even in concrete
Fluid Machinery Introduction to the laboratory measurements
 Fluid Machinery Introduction to the laboratory measurements Csaba H s (csaba.hos@hds.bme.hu) Ferenc Hegedus (hegedusf@hds.bme.hu) February 21, 2014 1 Requirements related to the measurement part of the
Engineering Design Challenge. Mapping the Ocean Floor
 Engineering Design Challenge Project Title: Project Source: Project Submitter: Mapping the Ocean Floor NOAA, http://tinyurl.com/boydlek STEM Improvement Lesson Development Team Grade Level/Subject: Math,
EXAMPLES (OPEN-CHANNEL FLOW) AUTUMN 2018
 AUTUMN 2018") EXAMPLES (OPEN-CHANNEL FLOW) AUTUMN 2018 Normal and Critical Depths Q1. If the discharge in a channel of width 5 m is 20 m 3 s 1 and Manning s n is 0.02 m 1/3 s, find: (a) the normal depth and Froude number
EXAMPLES (OPEN-CHANNEL FLOW) AUTUMN 2018 Normal and Critical Depths Q1. If the discharge in a channel of width 5 m is 20 m 3 s 1 and Manning s n is 0.02 m 1/3 s, find: (a) the normal depth and Froude number
Grit chambers are basin to remove the inorganic particles to prevent damage to the pumps, and to prevent their accumulation in sludge digestors.
 Home Lecture Quiz Design Example Grit Chambers Types of Grit Chambers Aerated Grit Chamber Principle of Working of Grit Chamber Design of Grit Chambers Primary Sedimentation Grit Chambers Grit chambers
1. In most economical rectangular section of a channel, depth is kept equal to
 Objective questions:- 1. In most economical rectangular section of a channel, depth is kept equal to a. One-fourth of the width b. Three times the hydraulic radius c. Hydraulic mean depth d. Half the width
Hours / 100 Marks Seat No.
 17421 15116 3 Hours / 100 Seat No. Instructions (1) All Questions are Compulsory. (2) Answer each next main Question on a new page. (3) Illustrate your answers with neat sketches wherever necessary. (4)
Flow in a shock tube
 Flow in a shock tube April 30, 05 Summary In the lab the shock Mach number as well as the Mach number downstream the moving shock are determined for different pressure ratios between the high and low pressure
How to Measure R7.1. Reference. I. Linear dimensions
 How to Measure Written by Connie Russell I. Linear dimensions Measuring linear dimensions (the distance between two points) is usually associated with using a ruler or a tape measure. For measuring objects
Khosla's theory. After studying a lot of dam failure constructed based on Bligh s theory, Khosla came out with the following;
 Khosla's theory After studying a lot of dam failure constructed based on Bligh s theory, Khosla came out with the following; Following are some of the main points from Khosla's Theory From observation
3. GRADUALLY-VARIED FLOW (GVF) AUTUMN 2018
 AUTUMN 2018") 3. GRADUALLY-VARIED FLOW (GVF) AUTUMN 2018 3.1 Normal Flow vs Gradually-Varied Flow V 2 /2g EGL (energy grade line) Friction slope S f h Geometric slope S 0 In flow the downslope component of weight balances
3. GRADUALLY-VARIED FLOW (GVF) AUTUMN 2018 3.1 Normal Flow vs Gradually-Varied Flow V 2 /2g EGL (energy grade line) Friction slope S f h Geometric slope S 0 In flow the downslope component of weight balances
Instruction Manual. Pipe Friction Training Panel
 Instruction Manual HL 102 Pipe Friction Training Panel 100 90 80 70 60 50 40 30 20 10 HL 102 Instruction Manual This manual must be kept by the unit. Before operating the unit: - Read this manual. - All
THERMALLING TECHNIQUES. Preface
 DRAFT THERMALLING TECHNIQUES Preface The following thermalling techniques document is provided to assist Instructors, Coaches and Students as a training aid in the development of good soaring skills. Instructors
Ermenek Dam and HEPP: Spillway Test & 3D Numeric-Hydraulic Analysis of Jet Collision
 Ermenek Dam and HEPP: Spillway Test & 3D Numeric-Hydraulic Analysis of Jet Collision J.Linortner & R.Faber Pöyry Energy GmbH, Turkey-Austria E.Üzücek & T.Dinçergök General Directorate of State Hydraulic
CEE 345, Part 2, Winter 2012, Final Exam Solutions (Open Channel Flow)
") CEE 45, Part, Winter 0, Final Exam Solutions (Open Channel Flow). (a) (8) List and briefl describe the forces that must be considered in an analsis of flow in a trapezoidal channel with a slope of 0.006.
CEE 45, Part, Winter 0, Final Exam Solutions (Open Channel Flow). (a) (8) List and briefl describe the forces that must be considered in an analsis of flow in a trapezoidal channel with a slope of 0.006.
Best Practice for Calibrating LTH Conductivity Instruments
 Application Note Best Practice for Calibrating LTH Conductivity Instruments As accurate process measurement becomes an everyday requirement it is vital to be able to calibrate conductivity instruments
Perilous Plunge. Activity Guide PITSCO. Ideas Solutions V0708
 Perilous Plunge PITSCO & Ideas Solutions S T E M Activity Guide 59779 V0708 Perilous Plunge Activity Guide Introduction... 3 Science Activity Give em the Hooke!... 4 Exploring Hooke s Law.... 5 Technology
Large-scale Field Test
 Vaskinn 1 Large-scale Field Test Kjetil Arne Vaskinn kav@trh.statkraftgroner.no Statkraft Grøner AS SUMMARY The objective the controlled failure of large-scale embankment is to monitor and record the failure
2O-2 Open Channel Flow
 Iowa Stormwater Management Manual O- O- Open Channel Flow A. Introduction The beginning of any channel design or modification is to understand the hydraulics of the stream. The procedures for performing
Run Course Measurement Manual 2010 Edition. International Triathlon Union Run Course Measurement Manual
 Run Course Measurement Manual 2010 Edition 79 1.1. Introduction This document is based on the contents of the International Association of Athletics Federation (www.iaaf.org) and the Royal Spanish Federation
Jeddah Knowledge International School. Science Revision Pack Answer Key Quarter 3 Grade 10
 Jeddah Knowledge International School Science Revision Pack Answer Key 2016-2017 Quarter 3 Grade 10 Name: Section: ANSWER KEY- SCIENCE GRADE 10, QUARTER 3 1 1. What are the units for mass? A Kilograms
ISO 748 INTERNATIONAL STANDARD. Hydrometry Measurement of liquid flow in open channels using currentmeters
 INTERNATIONAL STANDARD ISO 748 Fourth edition 2007-10-15 Hydrometry Measurement of liquid flow in open channels using currentmeters or floats Hydrométrie Mesurage du débit des liquides dans les canaux
REAL LIFE GRAPHS M.K. HOME TUITION. Mathematics Revision Guides Level: GCSE Higher Tier
 Mathematics Revision Guides Real Life Graphs Page 1 of 19 M.K. HOME TUITION Mathematics Revision Guides Level: GCSE Higher Tier REAL LIFE GRAPHS Version: 2.1 Date: 20-10-2015 Mathematics Revision Guides
Advanced Hydraulics Prof. Dr. Suresh A. Kartha Department of Civil Engineering Indian Institute of Technology, Guwahati
 Advanced Hydraulics Prof. Dr. Suresh A. Kartha Department of Civil Engineering Indian Institute of Technology, Guwahati Module - 4 Hydraulics Jumps Lecture - 4 Features of Hydraulic Jumps (Refer Slide
TEK-THERMAL 1700B. Thermal Mass Flowmeter. FLOW. Technology Solutions
 Technology Solutions TEK-THERMAL 1700B Thermal Mass Flowmeter FLOW www.tek-trol.com Flow Level Temperature Pressure Valves Analyzers Accessories TekValSys Introduction Tek-Thermal 1700B Thermal Mass Flowmeters,
Measuring Flow with. Centre County PaSEC. QC Team July P a g e
 Measuring Flow with Centre County PaSEC QC Team July 2018 1 P a g e Safety Considerations We are responsible for our own safety, but we also need to be ready to assist our teammates. Safety measures and
CHEMICAL ENGINEERING LABORATORY CHEG 239W. Control of a Steam-Heated Mixing Tank with a Pneumatic Process Controller
 CHEMICAL ENGINEERING LABORATORY CHEG 239W Control of a Steam-Heated Mixing Tank with a Pneumatic Process Controller Objective The experiment involves tuning a commercial process controller for temperature
River Study Fieldwork Sheets
 River Study Fieldwork Sheets Name Date Group Team Site Upper Valley 1 Lower Valley 1 Upper Valley 2 Lower Valley 2 IMPORTANT In order for data to be collected accurately and safely it is vital that you
Drilling Efficiency Utilizing Coriolis Flow Technology
 Session 12: Drilling Efficiency Utilizing Coriolis Flow Technology Clement Cabanayan Emerson Process Management Abstract Continuous, accurate and reliable measurement of drilling fluid volumes and densities
The speed of an inline skater is usually described in meters per second. The speed of a car is usually described in kilometers per hour.
 The speed of an inline skater is usually described in meters per second. The speed of a car is usually described in kilometers per hour. Speed How are instantaneous speed and average speed different? Average
Mark Scheme (Results) Summer 2009
 Summer 2009") Mark Scheme (Results) Summer 2009 GCSE GCSE Mathematics (Linear) - 1380 Paper: 1380_2F 2 NOTES ON MARKING PRINCIPLES 1 Types of mark M marks: method marks A marks: accuracy marks B marks: unconditional
Mark Scheme (Results) Summer 2009 GCSE GCSE Mathematics (Linear) - 1380 Paper: 1380_2F 2 NOTES ON MARKING PRINCIPLES 1 Types of mark M marks: method marks A marks: accuracy marks B marks: unconditional
Installation, operating and maintenance Instructions for Seemag bypass level indicator
 Issue: S Date: 05-09-14 Type G35 General information The Seetru bypass magnetic level indicator, abbreviate SEEMAG, serves to show the filling level of fluids in tanks, basins, tubes etc. The Seemag operates
BERNOULLI EFFECTS ON PRESSURE.ACTIVATED W ATER LEVEL GAUGES
 International Hydrographic R eview, Monaco, LV (2), July 1978. BERNOULLI EFFECTS ON PRESSURE.ACTIVATED W ATER LEVEL GAUGES by Langley R. MUIR Ocean and Aquatic Sciences, Central Region, Burlington, Ontario,
Heat Engine. Reading: Appropriate sections for first, second law of thermodynamics, and PV diagrams.
 Heat Engine Equipment: Capstone, 2 large glass beakers (one for ice water, the other for boiling water), temperature sensor, pressure sensor, rotary motion sensor, meter stick, calipers, set of weights,
Experimental Investigation on Changes of Water Surface Profile with Gaussian Shaped Bottom and Side Roughness
 Experimental Investigation on Changes of Water Surface Profile with Gaussian Shaped Bottom and Side Md. Rafiue Islam a, Shariful Islam b*, Md. Abdul Qaiyum Talukder c, S. M. Rezwan Hossain d Abstract Bed
How Fast Is Your Toy Car?
 SCIENCE EXPERIMENTS ON FILE Revised Edition 6.15-1 How Fast Is Your Toy Car? Daniela Taylor Topic Motion, calculating speed Time 1 hour! Safety Please click on the safety icon to view the safety precautions.
Copyright 2004 by the Thomas G. Faria Corporation, Uncasville CT No part of this publication may by reproduced in any form, in an electronic
 Copyright 2004 by the Thomas G. Faria Corporation, Uncasville CT No part of this publication may by reproduced in any form, in an electronic retrieval system or otherwise, without the prior written permission
ITTC Recommended Procedures and Guidelines
 Page 1 of 6 Table of Contents 1. PURPOSE...2 2. PARAMETERS...2 2.1 General Considerations...2 3 DESCRIPTION OF PROCEDURE...2 3.1 Model Design and Construction...2 3.2 Measurements...3 3.5 Execution of
HI 2314 HI 2315 HI 23151
 Instruction Manual HI 2314 HI 2315 HI 23151 Multi-Range Conductivity Meters for Laboratories www.hannainst.com Dear Customer, Thank you for choosing a Hanna Instruments product. Please read this instruction
BC Ministry of Forests. March Fish Stream Crossing Guidebook. Forest Practices Code of British Columbia.
 FRST 557 Lecture 7c Bridges and Culverts: Water Velocity and Discharge Lesson Background and Overview: The previous two lessons presented methods for estimating water volume flow at a particular site and
Episode 320: Superposition
 Episode 320: Super This episode introduces the basic idea of super of waves, explaining what happens when two or more waves meet. Summary Discussion: Recapping wave ideas. (10 minutes) Demonstration: Waves
OFFICE OF STRUCTURES MANUAL FOR HYDROLOGIC AND HYDRAULIC DESIGN CHAPTER 11 APPENDIX B TIDEROUT 2 USERS MANUAL
 OFFICE OF STRUCTURES MANUAL FOR HYDROLOGIC AND HYDRAULIC DESIGN CHAPTER 11 APPENDIX B TIDEROUT 2 USERS MANUAL APRIL 2011 APRIL 2011 Page 1 Preface TIDEROUT 2, Build 1.22 dated June 29, 2006 is the current
Hydrostatics Physics Lab XI
 Hydrostatics Physics Lab XI Objective Students will discover the basic principles of buoyancy in a fluid. Students will also quantitatively demonstrate the variance of pressure with immersion depth in
Introduction to Pumps
 Introduction to Pumps 1 Introduction to Pumps 1.0 INTRODUCTION There are many different types of pump now available for use in pumped fluid systems. A knowledge of these pump types and their performance
GCSE 9-1 Higher Edexcel Set C Paper 1 - Non Calculator
 Name: GCSE 9-1 Higher Edexcel Set C Paper 1 - Non Calculator Equipment 1. A black ink ball-point pen. 2. A pencil. 3. An eraser. 4. A ruler. 5. A pair of compasses. 6. A protractor. Guidance 1. Read each
Friday 13 June 2014 Morning
 H Friday 13 June 2014 Morning GCSE APPLICATIONS OF MATHEMATICS A382/02 Applications of Mathematics 2 (Higher Tier) *3053050410* Candidates answer on the Question Paper. OCR supplied materials: None Other
Hydrogen Bubble Flow Visualization Unit UVF
 Technical Teaching Equipment Hydrogen Bubble Flow Visualization Unit UVF PROCESS DIAGRAM AND UNIT ELEMENTS ALLOCATION ISO 9001: Quality Management (for Design, Manufacturing, Commercialization and After-sales
DFT Valves. Selecting Control Valves
 DFT Valves Selecting Control Valves Evaluating Process Conditions in Control Valve Selection A one-size-fits-all approach is not the best way to go about choosing the proper control valve for a particular
PHYS 101 Previous Exam Problems
 PHYS 101 Previous Exam Problems CHAPTER 14 Fluids Fluids at rest pressure vs. depth Pascal s principle Archimedes s principle Buoynat forces Fluids in motion: Continuity & Bernoulli equations 1. How deep
2. RAPIDLY-VARIED FLOW (RVF) AUTUMN 2018
 AUTUMN 2018") 2. RAPIDLY-VARIED FLOW (RVF) AUTUMN 2018 Rapidly-varied flow is a significant change in water depth over a short distance (a few times water depth). It occurs where there is a local disturbance to the
2. RAPIDLY-VARIED FLOW (RVF) AUTUMN 2018 Rapidly-varied flow is a significant change in water depth over a short distance (a few times water depth). It occurs where there is a local disturbance to the
OWNER S MANUAL. AXD 530 MicroManometer
 OWNER S MANUAL AXD 530 MicroManometer Limitation of Warranty and Liability Seller warrants that this product, under normal use and service as described in the operator's manual, shall be free from defects
Flowmeter Shootout Part II: Traditional Technologies
 Flowmeter Shootout Part II: Traditional Technologies How to Choose Among Turbine, Positive Displacement, Thermal, Variable Area, and Open Channel Using Paradigm Cases By Jesse Yoder February 22, 2001 This
American Weigh Scales, Inc. BLADE Series D i g i t a l P o c k e t S c a l e BLADE-550. User Manual BLADE-400 BLADE-1000
 American Weigh Scales, Inc. BLADE Series D i g i t a l P o c k e t S c a l e BLADE-50 BLADE-400 BLADE-550 BLADE-1000 User Manual Blade Series Manual Thank you for purchasing the American Weigh BLADE-Series
OPERATION MANUAL DIVE CALIPER NOT SCALE / IF IN DOUBT ASK* *ALL UNITS IN MM/DEGREES UNLESS SPECIF. Dive Caliper General DC-051
 NOT SCALE / IF IN DOUBT ASK* DIVE CALIPER OPERATION MANUAL *THIS INFORMATION IS THE PROPERTY OF ZEBRA-TECH LTD. ALL RIGHTS RESERVED.* *ALL UNITS IN MM/DEGREES UNLESS SPECIF SURFACE F 3.2 Ra UNLESS S Part
MAGNETIC MINI EXERCISE BIKE SF-B0418 USER MANUAL
 MAGNETIC MINI EXERCISE BIKE SF-B018 USER MANUAL IMPORTANT! Please retain owner s manual for maintenance and adjustment instructions. Your satisfaction is very important to us, PLEASE DO NOT RETURN UNTIL
EARTH SCIENCE 5.9 (WIND) WEATHER
 WEATHER") EARTH SCIENCE 5.9 (WIND) WEATHER Video Notes Key Points: 1. According to the video, what two factors cause wind: a. b. 2. Fill in the blanks from this quote from the video: Energy from the Sun heats the,
EARTH SCIENCE 5.9 (WIND) WEATHER Video Notes Key Points: 1. According to the video, what two factors cause wind: a. b. 2. Fill in the blanks from this quote from the video: Energy from the Sun heats the,
Mini-Pro CO2 Sensor User s Manual - ANALOG MODEL -
 Mini-Pro CO2 Sensor User s Manual - ANALOG MODEL - Table of Contents 1. Introduction 3 2. Instrument Setup 4 2.1 Instrument Checklist 4 2.2 Optional Accessories 4 2.3 Gas Concentration Ranges Available
EC214 EC215 - EC215R Bench Conductivity Meters
 Instruction Manual EC214 EC215 - EC215R Bench Conductivity Meters http://www.hannainst.com These Instruments are in Compliance with the CE Directives Dear Customer, Thank you for choosing a Hanna Instruments
Air Ball! Evaluation copy
 Air Ball! Computer 24 Do you ever wonder how the National Basketball Association (NBA) decides how much air should be in the basketballs used during a game? The NBA measures the pressure inside the ball
Figure 1: Hydrostatic Pressure Forces Are Perpendicular to the Surface
 Pressure Hulls and Canisters 2 Cornerstone Electronics Technology and Robotics III (Notes primarily from Underwater Robotics Science Design and Fabrication, an excellent book for the design, fabrication,
Before we start. Copyright William C Cromer 2015
 Before we start Welcome to this preview of the Cromer Constant Head Permeameter. In Microsoft PowerPoint, the preview is best viewed as a full-screen Slide Show presentation. If your current view is smaller,
Exercise 3. Power Versus Wind Speed EXERCISE OBJECTIVE DISCUSSION OUTLINE. Air density DISCUSSION
 Exercise 3 Power Versus Wind Speed EXERCISE OBJECTIVE When you have completed this exercise, you will know how to calculate the power contained in the wind, and how wind power varies with wind speed. You
Free Surface Flow Simulation with ACUSIM in the Water Industry
 Free Surface Flow Simulation with ACUSIM in the Water Industry Tuan Ta Research Scientist, Innovation, Thames Water Kempton Water Treatment Works, Innovation, Feltham Hill Road, Hanworth, TW13 6XH, UK.
AIRFLOW GENERATION IN A TUNNEL USING A SACCARDO VENTILATION SYSTEM AGAINST THE BUOYANCY EFFECT PRODUCED BY A FIRE
 - 247 - AIRFLOW GENERATION IN A TUNNEL USING A SACCARDO VENTILATION SYSTEM AGAINST THE BUOYANCY EFFECT PRODUCED BY A FIRE J D Castro a, C W Pope a and R D Matthews b a Mott MacDonald Ltd, St Anne House,
AUTOMATIC DREDGING PROFILE AND CONTOUR CONTROL
 AUTOMATIC DREDGING PROFILE AND CONTOUR CONTROL Jay Wise 1 ABSTRACT Phillips and Jordan, a leading excavating and disaster recovery contractor, was faced with the challenge to manage a civil contract involving
FL M FLUME FOR HYDRAULIC BENCH
 This equipment is designed to study the behavior of fluids in open channels by conducting a wide range of practices and experiences. HIGHLIGHTS Possibility of negative and positive channel slope. Various
TAC-100A DIVER NAVIGATION BOARD OPERATIONS MANUAL. RJE International, Inc. RJE International, October 20, TAC-100A Revision 3
 TAC-100A DIVER NAVIGATION BOARD OPERATIONS MANUAL RJE International, Inc. YOUR SOURCE FOR DIVER NAVIGATION AND UNDERWATER RELOCATION EQUIPMENT RJE International, October 20, 2010 12 TAC-100A Revision 3
WIND CLIPPER KTS ILLUM SCALE INC DEC CLIPPER WIND SYSTEM
 CLIPPER WIND KTS ILLUM SCALE DEC INC CLIPPER WIND SYSTEM TABLE OF CONTENTS INTRODUCTION PRE-TEST OF INSTRUMENT INSTALLING THE MASTHEAD SENSOR UNIT INSTALLING THE DISPLAY NORMAL OPERATION CHANGING THE