PORTSMOUTH HARBOR AND PISCATAQUA RIVER NEW HAMPSHIRE AND MAINE NAVIGATION IMPROVEMENT STUDY FEASIBILITY REPORT APPENDIX G
|
|
|
- Jessica Owen
- 6 years ago
- Views:
Transcription
1 PORTSMOUTH HARBOR AND PSCATAQUA RVER NEW HAMPSHRE AND MANE NAVGATON MPROVEMENT STUDY FEASBLTY REPORT APPENDX G TURNNG BASN TDAL HYDRODYNAMC ANALYSS HYDROLOGC & HYDRAULC APPENDX
2
3 PORTSMOUTH HARBOR PSCATAQUA RVER TURNNG BASN TDAL HYDRODYNAMC ANALYSS HYDROLOGC & HYDRAULC APPENDX TABLE OF CONTENTS SECTON PAGE NO. 1.0 EXECUTVE SUMMARY NTRODUCTON STUDY AREA EXSTNG TURNNG BASN 3. a. Existing Turning Basin Features and Operation 3. b. Turning Basin Regulations per EM (31 May 2006) 3. i. Turning Basin Size 3. ii. Features 3. iii. Depth 4. iv. Shoaling 4. c. Design Vessel for Proposed Turning Basin PROPOSED TURNNG BASN ALTERNATVES METHODOLOGY 5. a. Data Collection / Field Activities 5. b. ADCP Data Collection 7. c. Data Limitations 9. d. Numerical Modeling 9. i. Model Selection 9. ii. Coastal Modeling System (CMS) Development & Calibration 9. e. Model Alternative Results 11. Portsmouth Harbor, NH Navigation mprovement Study G-i Draft Feasibilty Report Appendix G - Hydrologic and Hydraulic
4 PORTSMOUTH HARBOR PSCATAQUA RVER TURNNG BASN TDAL HYDRODYNAMC ANALYSS HYDROLOGC & HYDRAULC APPENDX TABLE OF CONTENTS SECTON PAGE NO. 7.0 CONCLUSON REFERENCES 13. FGURES PAGE NO. FGURE 1 Turning Basin Alternatives 5. FGURE 2 Tide Gauge Locations (WHG, 2009) 6. FGURE 3 Measured Tide Elevation (WHG, 2009) 7. FGURE 4 Boat Based ADCP Transects (WHG, 2009) 8. FGURE 5 Measured Currents (WHG, 2009) 8. FGURE 6 CMS Grid Domain 9. FGURE 7 Modeled and Measured Tide Comparison at Station P1 10. FGURE 8 Modeled and Measured Current Magnitude at Transect FGURE 9 Location of Observation Points 11. FGURE 10 Average Recorded Currents at Low Slack Tide and High Slack Tide (Knots) 12. Portsmouth Harbor, NH Navigation mprovement Study G-ii Draft Feasibilty Report Appendix G - Hydrologic and Hydraulic
5 PORTSMOUTH HARBOR PSCATAQUA RVER TURNNG BASN TDAL HYDRODYNAMC ANALYSS HYDROLOGC & HYDRAULC APPENDX TABLE PAGE NO. TABLE 1 MODELED MAXMUM CURRENT SPEEDS / 11. MODELED AVERAGE CURRENT SPEEDS 12. ATTACHMENT 1.Woods Hole Group, nc. Contract No. W912WJ-09-D FNAL REPORT FOR ADCP AND TDE DATA COLLECTON PORTSMOUTH HARBOR AND PSCATAQUA RVER PORTSMOUTH, NEW HAMPSHRE October 2009 Portsmouth Harbor, NH Navigation mprovement Study G-iii Draft Feasibilty Report Appendix G - Hydrologic and Hydraulic
6 PORTSMOUTH HARBOR PSCATAQUA RVER TURNNG BASN TDAL HYDRODYNAMC ANALYSS HYDROLOGC & HYDRAULC APPENDX 1.0 EXECUTVE SUMMARY This H&H analysis analyzed the tidal hydrodynamics of the study area at the existing turning basin at the upstream end of the federal navigation channel along the Piscataqua River in accordance with turning basin design standards contained in EM (31 May 2006). Woods Hole Group, under contract to USACE NAE, collected 2 months of tide data, and collected Accoustic Doppler Current Profiler (ADCP) data along four transects over two 12.5 hour tide cycles in June 2009 across the navigation channel to be used in the development and calibration of the two-dimensional mathematical model of the harbor. The modeling effort evaluated both the existing and alternative improvement conditions and determined that the current magnitude (speed) did not measurably increase or decrease for any of the alternatives. The difference in current between the existing conditions and the different turning basin alternatives are within the error of the field data and model capabilities, which indicate that increasing the width of the turning basin would not increase or decrease the current magnitude within the turning basin area. Further analysis of the recorded ADCP data reveals that the average current magnitude recorded in 3-minute intervals over the tide cycle does not exceed the maximum allowable current of 1.5 knot per the turning basin regulation (EM ) within 60-minutes of the low slack tide or high slack tide. Portsmouth Harbor, NH Navigation mprovement Study G-iv Draft Feasibilty Report Appendix G - Hydrologic and Hydraulic
7 2.0 NTRODUCTON This document includes the hydrologic and hydraulic (H&H) analysis for the Portsmouth Harbor and Piscataqua River New Hampshire and Maine Navigation mprovement Study, in accordance with Corps Regulations (ER and ER , Planning Guidance). This study was initiated at the request of the State of New Hampshire, Pease Development Authority, Division of Ports and Harbors, the study sponsor, and authorized by Section 436 of the Water Resources Development Act of 2000 (P.L ): The Secretary shall conduct a study to determine the feasibility of modifying the project for navigation, Portsmouth Harbor and Piscataqua River, Maine and New Hampshire, authorized by section 101 of the River and Harbor Act of 1962 (76 Stat. 1173) and modified by section 202(a) of the Water Resources Development Act of 1986 (100 Stat. 4095) to increase the authorized width of turning basins in the Piscataqua River to 1,000. This H&H analysis will investigate the tidal hydrodynamics of the study area with the authorized turning basin width located at the upstream end of the federal navigation channel in the Piscataqua River. The basis for this investigation will include developing a numerical model to evaluate the altered geometry at the turning basin and the impacts to tidal hydrodynamics at several points within the harbor. These hydrodynamics include the river current magnitude (speed) and tide elevation. 3.0 STUDY AREA The Portsmouth Harbor is a deep draft harbor located 45 miles northeast of Boston, Massachusetts and 37 miles southwest of Portland, Maine. The Piscataqua River runs through the harbor and includes a federally maintained navigation channel of 35 feet at mean low water and a minimum width of 400 feet. The channel extends from deep water in Portsmouth Harbor (river mile 2.6) upstream to just north of the Sprague terminal in Newington, New Hampshire (river mile 8.8). The harbor has one of the fastest flowing currents of commercial harbors in northeastern United States with tidal currents reaching speeds of up to 5 knots (5.75 miles per hour). The size of the ships that can navigate within the harbor is restricted by several features of the river, including the current, the width of the Sarah Long Bridge, and the turning basin diameter. n 2011, 3.1 million tons of cargo worth $1.7 billion was transferred in and out of the harbor to southern Hampshire, eastern Vermont and southern Maine. The Piscataqua River flows southeast through the towns of Eliot and Kittery, Maine, and Dover, Newington, Portsmouth, and New Castle, New Hampshire forming the boundary between New Hampshire and Maine. The river is tidally influenced and spans 13-miles long between its headwater at the confluence of the Salmon Falls and Cocheco Rivers in Dover, New Hampshire Portsmouth Harbor, NH Navigation mprovement Study G-1 Draft Feasibilty Report Appendix G - Hydrologic and Hydraulic
8 and its mouth at the Gulf of Maine. The drainage basin is approximately 1,495 square miles encompassing five rivers that flow into the Great Bay, a 6,000 acre estuary that discharges into the Piscataqua River headwater in Dover, New Hampshire. The Portsmouth, New Hampshire area has a temperate climate in the summer months and often severe climate in the winter months. n the winter, coastal storms frequently bring snow mixed with rain with high winds prevailing northwesterly 4.0 EXSTNG TURNNG BASN a. Existing Turning Basin Features and Operation. The existing turning basin is located at the northern end of the federal navigation channel near the Sprague terminal in Newington, New Hampshire. Existing Operations: Currently, all turns take approximately 10 minutes and take place during slack conditions. Slack conditions occur when the current is at its lowest speed coinciding with both peak and low tide. Turns that take place near low slack tide begin 30 minutes before low tide with 30 minutes of ebb remaining. Currents during these conditions are approximately 1.0 knots. High slack turns begin 50 minutes before high slack with 50 minutes of flood remaining. Currents during this condition are approximately knots. The ability to turn ships may be affected by severe weather conditions, such as noreasters and hurricanes, as they change the physical characteristics of the river. b. Turning Basin Regulations per EM (31 May 2006). The basin enables the ships to reverse direction and allow an outbound sailing transit. During normal conditions, pilots use tugs to bring the ship about as well as prevailing currents and wind conditions to help maneuver the ship. The pilot strategy may be different on flood or ebb tide and may change with wind direction or the presence of shoals, rocks, docks, etc. The turning basin will be designed to provide sufficient area to allow the design ship to turn around using ship bow and stern thrusters (if available). i. Turning Basin Size. The size of the turning basin should provide a minimum turning diameter of at least 1.2 times the length of the design ship where prevailing currents are knots or less. The basin should be elongated along the prevailing current direction when currents are greater than 1.5 knots and designed according to tests conducted on a ship simulator. ii. Features. Where traffic conditions permit, the turning basin should use the navigation channel as part of the basin area. The shape of the basin is usually trapezoidal or elongated trapezoidal with the long side coincident with the prevailing current direction and the channel edge. The short side will be at least equal to the design multiple (1.2 or 1.5, depending on Portsmouth Harbor, NH Navigation mprovement Study G-2 Draft Feasibilty Report Appendix G - Hydrologic and Hydraulic
9 current) times the ship length. The ends will make angles of 45 degrees or less with the adjacent edge of the channel, depending on local shoaling tendencies. iii. Depth. Normally, the depth of the turning basin should be equal to the channel depth leading or adjacent to the basin proper. This is done to prevent any possibility of confusion by the channel project users that could cause grounding accidents. The normal dredging tolerance and advance maintenance are included in the depth of the basin.. iv. Shoaling. A turning basin will tend to increase shoaling rates above normal channel rates because of the increase of the channel cross-sectional area, which modifies current patterns. ncreased shoaling in the basin could cause modifications in shoaling patterns farther downstream or upstream. c. Design Vessel for Proposed Turning Basin. Based on the limitations of the existing navigation channel (width, bridges, turns and river currents), the Pilots have determined that the largest vessel that could access the upper turning basin is a maximum length of 800-ft. Vessels of this size typically have a beam of approximately 118-ft. Therefore, this has been selected as the design vessel at the time of this study. 5.0 PROPOSED TURNNG BASN ALTERNATVES. The proposed basin alternatives are presented in Figure 1. These alternatives include various basin diameters and drift, which will be evaluated based on the recorded and modeled currents of the river during optimum turning conditions and federal regulation EM (31 May 2006). Portsmouth Harbor, NH Navigation mprovement Study G-3 Draft Feasibilty Report Appendix G - Hydrologic and Hydraulic
 data along four transects across the navigation channel to be")
10 Figure 1. Turning Basin Alternatives 6.0 METHODOLOGY a. Data Collection / Field Activities. Woods Hole Group under contract to USACE NAE, collected 2 months of tide data and collected Accoustic Doppler Current Profiler (ADCP) data along four transects across the navigation channel to be used in the development and calibration of the two-dimensional model of the harbor. The tide data was collected over the spring tide during First, time-series of water surface elevations (WSE) were obtained from two (2) locations over approximately one month at the Piscataqua River site (Figure 1). Measurements were collected directly at the turning basin (Station P2 near the Sprague Energy Terminal at River Road in Newington, NH), and approximately 3.3 miles downstream of the turning basin (Station P1 near the State of New Hampshire, Division of Ports and Harbors, DPH, Market Street Terminal in Portsmouth, NH). Data recorded from these two tide gauges was subsequently compared to data from the National Oceanic and Atmospheric Administration (NOAA) NOS station in Portland, Maine to identify the tidal attenuation in the system, as well as ground truth the observed data. (WHG, 2009). Portsmouth Harbor, NH Draft Feasibilty Report G-4 Navigation mprovement Study Appendix G - Hydrologic and Hydraulic
 at the DPH Market Street Terminal (station P1), while the red line presents the time series of the WSE (ft, NAVD88) at the Sprague")
11 Figure 2. Tide Gauge Locations (WHG, 2009) Figure 2 presents the results of the atmospherically corrected and vertical referenced tidal observations obtained from the Piscataqua River gauges. The blue line presents the time series of the WSE (ft, NAVD88) at the DPH Market Street Terminal (station P1), while the red line presents the time series of the WSE (ft, NAVD88) at the Sprague Energy Terminal (station P2). The two stations are plotted together for comparison of the upstream and downstream locations. The observations show that there is some tidal attenuation that occurs between these two stations, as the tidal wave propagates in the River. During the spring tide, approximately feet of tidal attenuation occurs between the two stations, while during the neap tide, approximately feet of tidal attenuation occurs. The tide lags approximately minutes between the two stations during high tide. This can also be explained that the high tide occurs at the Sprague Energy P2 location approximately minutes after high tide occurs at the DPH Market Street Terminal. A portion of the collected tide signal is provided in the following figure. A slight phase and amplitude difference is discernible between the two gauges. Portsmouth Harbor, NH Navigation mprovement Study G-5 Draft Feasibilty Report Appendix G - Hydrologic and Hydraulic

12 Figure 3. Measured Tide Elevations (WHG, 2009) b. ADCP Data Collection. Currents were collected by performing boat transects over a 12 hour tide cycle. The location of these transects is shown below in Figure 4 and Figure 5. A plot of the average recorded current during low slack tide and high slack tide conditions is shown in Figure 10, following a discussion of the modeling effort and analysis of current magnitude (speed) during the turning basin alternatives. Portsmouth Harbor, NH Navigation mprovement Study G-6 Draft Feasibilty Report Appendix G - Hydrologic and Hydraulic
 Figure 5.")

13 Figure 4. Boat Based ADCP Transects (WHG, 2009) Figure 5. Measured Currents (WHG, 2009). Portsmouth Harbor, NH Navigation mprovement Study G-7 Draft Feasibilty Report Appendix G - Hydrologic and Hydraulic

14 c. Data Limitations. The analysis is limited by the sparse bathymetry data available outside the navigation channel. Significant effort was made to incorporate other bathymetry data including prior NOAA survey data but a large portion of the river was interpolated from navigation charts. d. Numerical Modeling. i. Model Selection. Several two-dimensional numerical models developed and supported by the USACE and ERDC were considered for this analysis. Preliminary efforts made using the RMA-2 and ADH models; however, both of these models had difficulty calibrating and remaining stable throughout the model runs and were ultimately abandoned. ii. Coastal Modeling System (CMS) Development & Calibration. CMS, developed by USACE and ERDC Coastal & Hydraulics Laboratory (CHL) was selected to evaluate the study area. The CMS software package consists of several individual numerical models and their supporting software in one system. t is a finite-element numerical model that computes both hydrodynamics (water levels and current flow values under any combination of tide, wind, surge, waves and river flow). A non-uniform grid was constructed to cover the entirety of the river, 42 km in the alongshore and 18 km cross shore. The flow model was driven from temporarily offset tides derived from the Portsmouth Gauge (Station # ) and waves from the offshore CDP Buoy (160). Stream gauge forcing was also provided by prior field observations by NAE. The CMS model ran stable, showed proper model calibration and was able to effectively perform the alternative runs. Figure 6. CMS Grid Domain Portsmouth Harbor, NH Navigation mprovement Study G-8 Draft Feasibilty Report Appendix G - Hydrologic and Hydraulic
15 Model calibration was checked using water levels collected from the 2009 field effort. As shown in the following figure, the phase of the measured and modeled water elevation shows good correlation however the model is slightly over predicting the amplitude of the tide. Water Elevation, MSL (m) 3 2 Modeled and Measured Tide Comparison 1 0 0:00-1 0:00 0:00 0:00-2 Time CMS Output P1 Validator Figure 7. Modeled and Measured Tide Comparison at Station P1 The measured current magnitude (speed) was compared with the simulated currents over each transect. Figure 8 shows Transect 1 current comparison with units of meters/second (m/s) as computed by the CMS model. The model is in phase with the measured currents; however, slightly under predicts the current amplitude. Therefore, additional evaluation of the measured currents, converted from units of m/s to knots, was conducted confirming that the average current magnitude at low slack tide and high slack tide are less than the 1.5 knot allowable per regulation EM (31 May 2006) as discussed in Section 7.0 and presented in Figure 10. Current Magnitude (m/s) Modeled and Measured Current Magnitude Comparison Current Mag Scalar Transect 1 Shifted :00 AM 4:48 AM 9:36 AM 2:24 PM 7:12 PM 12:00 AM Time Figure 8. Modeled and Measured Current Magnitude at Transect 1 Portsmouth Harbor, NH Navigation mprovement Study G-9 Draft Feasibilty Report Appendix G - Hydrologic and Hydraulic
 were placed in the approximate center of the channel and turning basin and were also the approximate midpoint of")
16 e. Model Alternative Results. n order to compare and assess alternative performance, four observation points (nodes) were placed in the approximate center of the channel and turning basin and were also the approximate midpoint of the boat based ADCP survey transects. The maximum and average current speeds were extracted at each point for each alternative and compared. These observation points are shown in the following figure as points overlain on the model grid. Figure 9. Location of Observation Points The analysis of the existing and the alternative conditions determined that the current magnitude (speed) did not vary significantly, for all three alternatives. The difference in current between the existing conditions and the different turning basin alternatives are within the error of the field data and model capabilities which indicates that the change in the turning basin would not significantly impact the current during low slack tide or high slack tide. See Table 1. Table 1. Modeled Current Speeds Alternative Existing Conditions Maximum Current Speed, m/s (knots) Node 1 Node 2 Node (2.24) 1.15 (2.24) 1.16 (2.25) 1.16 (2.25) 1.16 (2.25) 1.18 (2.29) 1.19 (2.31) 1.19 (2.31) 1.10 (2.13) 1.08 (2.10) 1.09 (2.11) 1.07 (2.08) Node (2.11) 1.07 (2.08) 1.06 (2.06) 1.06 (2.06) Portsmouth Harbor, NH Draft Feasibilty Report G-10 Navigation mprovement Study Appendix G - Hydrologic and Hydraulic
17 Average Current Speed, m/s (knots) Alternative Node 1 Node 2 Node 3 Node 4 Existing Conditions 0.61 (1.19) 0.60 (1.17) 0.60 (1.17) 0.59 (1.15) (1.19) 0.61 (1.19) 0.59 (1.15) 0.56 (1.09) (1.19) 0.61 (1.19) 0.59 (1.15) 0.55 (1.07) (1.21) 0.61(1.19) 0.58 (1.13) 0.54 (1.05) 7.0 CONCLUSON. Upon determination by the modeling analysis that increasing the basin diameter does not increase or decrease the current magnitude (speed), it can be concluded that the turning schedule allowable at low slack tide and high slack tide will be unchanged. Further analysis of the recorded ADCP tide data is presented in Figure 10. Approximately 45 data points (measuring current) were collected along each transect within a 3-minute time period during an entire 12.5 hour tide cycle. This data was averaged for each 3-minute period as the tide approached both low and high slack tide and confirms the current does not exceed the minimum 1.5 knot regulation EM (31 May 2006) within the turning basin as described in section 4.1.a and 4.1.b High Slack Tide (knots) Low Slack Tide (knots) 7:397:457:487:538:038:088:118:168:268:318:348:398:468:518:548:599:06 Typical Time (minutes) Average Recorded Curerent Speed (knots) Figure 10. Average Recorded Currents at Low Slack Tide and High Slack Tide (knots) Portsmouth Harbor, NH Navigation mprovement Study G-11 Draft Feasibilty Report Appendix G - Hydrologic and Hydraulic
18 8.0 REFERENCES. Woods Hole Group (2009). Final Report for ADCP and Tide Data Collection Portsmouth Harbor and Piscataqua River, Portsmouth, New Hampshire. Portsmouth Harbor, NH Navigation mprovement Study G-12 Draft Feasibilty Report Appendix G - Hydrologic and Hydraulic


19 FNAL REPORT FOR ADCP AND TDE DATA COLLECTON PORTSMOUTH HARBOR AND PSCATAQUA RVER PORTSMOUTH, NEW HAMPSHRE Contract No. W912WJ-09-D Prepared For: United States Army Corp of Engineers New England District 696 Virginia Road Concord, MA Prepared By: Woods Hole Group, nc. 81 Technology Park Drive East Falmouth, MA October 2009
20 This page left intentionally blank
21 FNAL REPORT FOR ADCP AND TDE DATA COLLECTON PORSTMOUTH HARBOR AND PSCATAQUA RVER PORTSMOUTH, NEW HAMPSHRE October 2009 Prepared for: Department of the Army New England District Corps of Engineers 696 Virginia Road Concord, MA Prepared by: Woods Hole Group, nc. 81 Technology Park Drive East Falmouth, MA 02536
22 This page left intentionally blank
23 Woods Hole Group TABLE OF CONTENTS 1.0 NTRODUCTON TDE DATA COLLECTON ADCP DATA COLLECTON SURVEY REGON AND DATES EQUPMENT DESCRPTON SURVEY TECHNQUE DATA PROCESSNG TECHNQUES SURVEY RESULTS Data Files Color Contour Plots of Current Structure Depth Averaged Velocities Final Report ADCP and Tide Data Collection Deliver Order 0009 Portsmouth Harbor and Piscataqua River W912WJ-09-D-0001 Portsmouth, New Hampshire i October 2009
24 Woods Hole Group LST OF FGURES Figure 1. Tide gauge locations within the study area of Piscataqua River....1 Figure 2. Photograph of tide gage located at station P2, Sprague Energy Terminal in Newington, NH, during a spring low tide....2 Figure 3. Atmospheric pressure data obtained from National Oceanic and Atmospheric Administration (NOAA) station # (Wells, ME)....4 Figure 4. Measured water surface elevation in the Piscataqua River, New Hampshire from June 22 to July 22, Figure 5. Measured water surface elevation from the Piscataqua River and NOAA s verified water surface elevation from Portland, ME....5 Figure 6. Location of ADCP transects in the Piscataqua River....7 Figure 7. The current velocities, presented in color contour plots, observed during the deployment survey (June 23, 2009) for Transect Y4. The upper panel presents the north/south velocity component, while the lower panel presents the east/west velocity component Figure 8. Depth-averaged current results for the transects of Loop Y during the June 23, 2009 survey LST OF TABLES Table 1. nstrument deployment summary....3 Table 2. Survey dates, locations, frequency, and temporal coverage of the ADCP transects...6 Table 3. Example data file format for data files provided on the companion CD to this report....9 LST OF APPENDCES Appendix A Field Notes... A-1 Appendix B Tide Data Benchmarking...B-1 Appendix C ADCP Transect and Loop Summary...C-1 Final Report ADCP and Tide Data Collection Deliver Order 0009 Portsmouth Harbor and Piscataqua River W912WJ-09-D-0001 Portsmouth, New Hampshire ii October 2009
 data and associated tide data observed in the Piscataqua River region near Portsmouth, New Hampshire.")
25 Woods Hole Group 1.0 NTRODUCTON This brief report presents the boat-based Acoustic Doppler Current Profiler (ADCP) data and associated tide data observed in the Piscataqua River region near Portsmouth, New Hampshire. The data were collected within the Piscataqua River as part of the Piscataqua River Turning Basin deepening/widening study. The overall scope of study by the United States Corps of Engineers (USACE) includes the development of a twodimensional hydrodynamic model of the region. The data presented herein are intended to be used to assist in the calibration and validation of the model. Woods Hole Group (WHG) was responsible for collecting these measurements for the U.S. Army Corps of Engineers under task order contract number W912WJ-09-D TDE DATA COLLECTON Time-series of water surface elevation were obtained from two (2) locations over approximately one month at the Piscataqua River site (Figure 1). This report and the associated files on the companion CD, present the tide data and the data collection procedures and instrumentation. These observations can be used to analyze and define the tidal fluctuations in the region(s), as well as define boundary conditions and calibration points in the development of a hydrodynamic model. Figure 1. Tide gauge locations within the study area of Piscataqua River. Final Report ADCP and Tide Data Collection Deliver Order 0009 Portsmouth Harbor and Piscataqua River W912WJ-09-D-0001 Portsmouth, New Hampshire 1 October 2009
, and approximately 3.")
26 Woods Hole Group Deployment locations on the Piscataqua River were chosen to measure the surface water fluctuations directly at the turning basin location (Station P2 near the Sprague Energy Terminal at River Road in Newington), and approximately 3.3 miles downstream of the turning basin location (Station P1 near the State of New Hampshire, Division of Ports and Harbors (DPH) Market Street Terminal in Portsmouth). These locations were selected by the United States Army Corps of Engineers to characterize the local tidal changes that occur through the lower portion of the system, and to provide boundary condition and calibration information for a hydrodynamic modeling effort. Figure 2 shows the tide gage located at the Sprague Energy Terminal (Station P2) at a spring low tide. The photograph illustrates the deployment methodology used to secure the tide gage to the dock piling to ensure the gage remained submerged under the full tidal range. Copies of the field notes from the deployment and recovery of the tide gages is included in Appendix A. Figure 2. Photograph of tide gage located at station P2, Sprague Energy Terminal in Newington, NH, during a spring low tide. Final Report ADCP and Tide Data Collection Deliver Order 0009 Portsmouth Harbor and Piscataqua River W912WJ-09-D-0001 Portsmouth, New Hampshire 2 October 2009
27 Woods Hole Group The data from these two tide gauges was subsequently compared to data from the National Oceanic and Atmospheric Administration (NOAA) NOS station in Portland, Maine to identify the relative tidal attenuation in the system, as well as ground truth the observed data. Table 1 presents the recording interval and frequency of the deployed tide gauges, as well as their exact positions recorded via GPS. Table 1. nstrument deployment summary. Tide Station Location (description) GPS Location (State Plane feet, NAD83 ) Log nterval (minutes) Began Recording Ended Recording Piscataqua: DPH Market Street Terminal Piscataqua: Sprague Energy Terminal northing: easting: northing: easting: /22/2009 7/22/ /22/2009 7/22/2009 Tidal pressures were measured using Sea-Bird SBE37-SM MicroCAT conductivity, temperature and pressure gauges. Each of these instruments measured conductivity, temperature and pressure at set intervals, in this case, every six minutes. Pressure data were downloaded using a personal computer and associated software packages. Each tide gauge measured the pressure above the instrument, which is a combination of the weight of the water and weight of the atmosphere. n order to analyze the tide data (gauge pressure), the atmospheric pressure needs to be removed from the measured signal. The data collected was pressure corrected using regional atmospheric pressure data from the National Oceanic and Atmospheric Administration (NOAA) station in Wells, Maine. This raw barometric pressure data used for this correction is presented in Figure 3. Gaps in the NOAA barometric pressure record were filled by interpolating between the temporal adjacent observations. Subsequently, this tide pressure data were converted to water surface elevation using the hydrostatic relationship based on the density of water. n order to reference the tide gauges to a common vertical datum, tide data from each gauge was referenced to the NAVD 1988 vertical datum. The tide gauges were surveyed in directly to the instruments pressure port via an RTK-GPS survey and verified with local benchmark information. Appendix B presents the results of the survey and adjustment of the tide gage to the NAVD 1988 vertical datum. Final Report ADCP and Tide Data Collection Deliver Order 0009 Portsmouth Harbor and Piscataqua River W912WJ-09-D-0001 Portsmouth, New Hampshire 3 October 2009
28 Woods Hole Group Figure 3. Atmospheric pressure data obtained from National Oceanic and Atmospheric Administration (NOAA) station # (Wells, ME). Figure 4 presents the results of the atmospherically corrected and vertical referenced tidal observations obtained from the Piscataqua River gages. The blue line presents the time series of water surface elevation (feet, NAVD88) at the DPH Market Street Terminal (station P1), while the red line presents the time series of water surface elevation (feet, NAVD88) at the Sprague Energy Terminal (station P2). The two stations at Piscataqua River are plotted together for comparison of the tides at the upstream and downstream locations. The observations show there is some tidal attenuation that occurs between the two stations, as the tidal wave propagates in the River. During the spring tide, approximately feet of tidal attenuation occurs between the two stations, while during the neap tide, approximately feet of tidal attenuation occurs. The phase shift (lag) between high tide at the two stations ranges from approximately minutes. n other words, high tide occurs at the Sprague Energy location approximately minutes after high tide occurs at the DPH Market Street Terminal. Figure 5 presents the observed data from Piscataqua River stations, along with the National Oceanic and Atmospheric Administration stations at Portland, ME. The NOAA data are provided as a regional reference to the collected data at local stations on the Piscataqua River. All tide data, including the NOAA station data, is provided on the companion CD to this report in the Tide Data directory. Final Report ADCP and Tide Data Collection Deliver Order 0009 Portsmouth Harbor and Piscataqua River W912WJ-09-D-0001 Portsmouth, New Hampshire 4 October 2009


29 Woods Hole Group Figure 4. Measured water surface elevation in the Piscataqua River, New Hampshire from June 22 to July 22, Figure 5. Measured water surface elevation from the Piscataqua River and NOAA s verified water surface elevation from Portland, ME. Final Report ADCP and Tide Data Collection Deliver Order 0009 Portsmouth Harbor and Piscataqua River W912WJ-09-D-0001 Portsmouth, New Hampshire 5 October 2009
30 Woods Hole Group 3.0 ADCP DATA COLLECTON n support of the development of the hydrodynamic model and design criteria for the Piscataqua River Turning Basin deepening/widening study, Woods Hole Group, nc. measured the tidal currents at selected locations in the River during two spring tide conditions. The observations were obtained using an Acoustic Doppler Current Profiler (ADCP) mounted to a small survey vessel. Data were collected through complete lunar semi-diurnal tidal cycles (12.4 hours), once in June and once in July. Each transect was traversed from shoreline to shoreline in a direction perpendicular to the channel. The resulting data sets offer an unparalleled view of the temporal variation in spatial structure of tidal currents through the waterway. This chapter details the survey instrumentation and methods used to perform the measurements. Data representing high-resolution measurements of tidal current structure at these sample locations are also presented. The results are presented in both time series format (spatially averaged results), as well as full color contours of current velocity components for selected stages of the tide. The complete data set and associated figures are also provided in the companion CD to this report in the ADCP Survey Data directory. 3.1 SURVEY REGON AND DATES The surveys for the Piscataqua River location were performed on June 23 and July 21, Four (4) transects were surveyed near the turning basin in the Piscataqua River offshore of the Sprague Energy Terminal, as shown in Figure 6. These four transects formed a reasonable depiction of the currents across the cross-section of the Piscataqua River at this location and adequately represent the current regime in this area. The transects were surveyed continuously throughout the day, travelling in the direction of the arrows indicated on Figure 6. A majority of the transect lines were navigable throughout the tidal cycle; however, the far north/northeast ends of the transect lines were too shallow to survey, and were non-navigable even for the small survey vessel. Table 2 presents the survey dates, locations, transect repetition period and temporal coverage for each transect line. Table 2. Transect D Survey dates, locations, frequency, and temporal coverage of the ADCP transects. Easting, Northing Transect Start (State Plane NAD83, feet) Easting, Northing Transect End (State Plane NAD83, feet) June 23, 2009 Survey Frequency (minutes) # of Transects July 21, 2009 Survey Frequency (minutes) # of Transects , , ~4 32 ~ , , ~ ~ , , ~3 32 ~ , , ~3 32 ~3 29 Final Report ADCP and Tide Data Collection Deliver Order 0009 Portsmouth Harbor and Piscataqua River W912WJ-09-D-0001 Portsmouth, New Hampshire 6 October 2009
31 Woods Hole Group Transect 2 Transect 1 Transect 3 Transect 4 Figure 6. Location of ADCP transects in the Piscataqua River. 3.2 EQUPMENT DESCRPTON Measurements were obtained with a broadband 1200 Khz Acoustic Doppler Current Profiler (ADCP) manufactured by Teledyne/RDnstruments of San Diego, CA. The ADCP was mounted rigidly to the starboard rail of the survey vessel, the 24-foot Privateer. Position information was provided by a Trimble 4000-series differential GPS. The ADCP is capable of high-resolution measurements of the spatial structure of current flow beneath the instrument transducer. When mounted to a moving platform, such as a small vessel, a detailed picture of the current characteristics can be obtained. Repeating the transects at regular time intervals throughout a complete tidal cycle offers an unparalleled determination of the temporal variation in tidal current structure in the study area. The ADCP measures currents using acoustic pulses emitted individually from four angled (at 20 from the vertical) transducers in the instrument. The instrument listens to the backscattered echoes from discrete depth layers in the water column. The returned echoes, reflected from ambient sound scatters (plankton, debris, sediment, etc.), are compared in the frequency domain to the original emitted pulse. The change in frequency (doppler shift) between the emitted versus the reflected pulse is directly proportional to the speed of the water parallel to the individual beam. For example, an echo of lower frequency indicates water moving away from the transducer while an echo of higher frequency indicates water moving toward the transducer. By combining the doppler velocity components for at least three of the four directional beams, the current Final Report ADCP and Tide Data Collection Deliver Order 0009 Portsmouth Harbor and Piscataqua River W912WJ-09-D-0001 Portsmouth, New Hampshire 7 October 2009
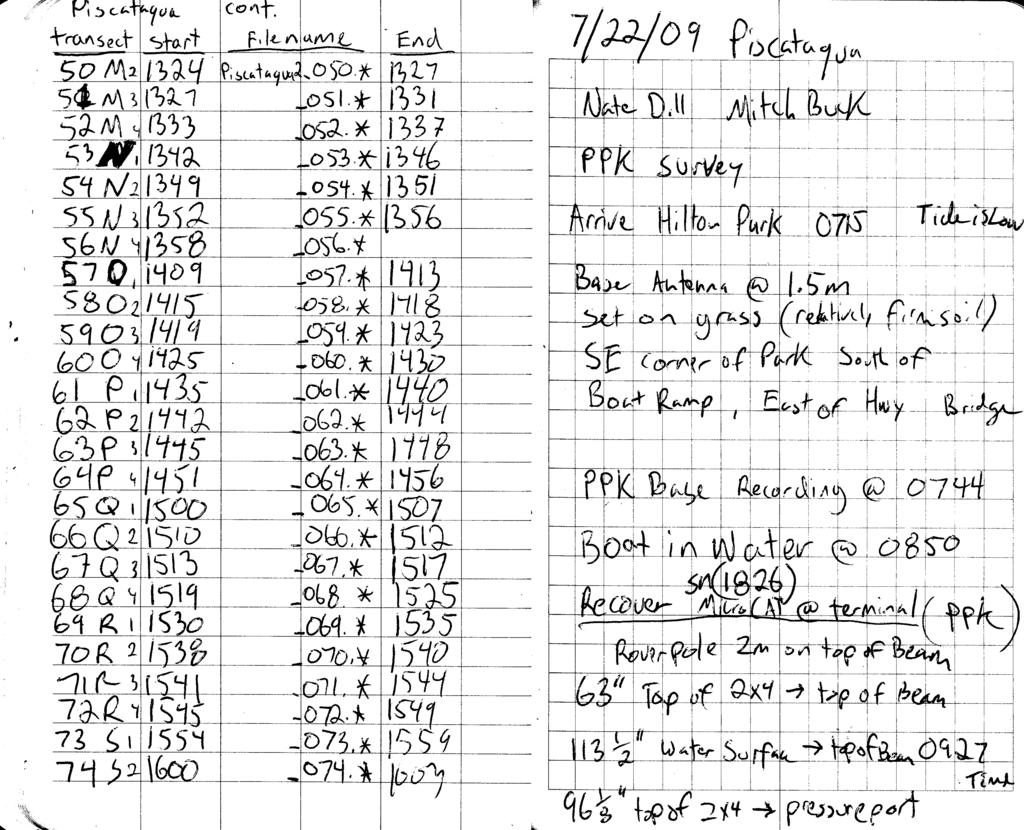
32 Woods Hole Group velocities can be transformed to an orthogonal earth coordinate system in terms of east, north, and vertical components of current velocity. Vertical resolution is gained using a technique called range-gating. Returning pulses are divided into discrete bins based on discrete time intervals following the emission of the original pulse. With knowledge of the speed of sound, the discrete time intervals reflect the range (or depth) of each discrete bin from the transducer face. The collection of accurate current data with an ADCP requires the removal of the speed of the transducer (mounted to the vessel) from the estimates of current velocity. This is performed by bottom tracking or, using the doppler shift to measure simultaneously the velocity of the transducer relative to the bottom. Bottom tracking allows the ADCP to record absolute versus relative velocities beneath the transducer. n addition, the accuracy of the current measurements can be compromised by random errors (or noise) inherent to this technique. mprovements in the accuracy of each measurement are achieved typically by averaging several individual pulses together. These averaged results are termed ensembles ; the more pings used in the average, the lower the standard deviation of the random error. For these studies each ensemble took approximately 1.8 seconds to collect. The vertical resolution was set to 50 centimeters (approximately 19.7 inches), or one velocity observation per every 50 centimeters (approximately 19.7 inches) of water depth. The first measurement bin was centered approximately 2.7 feet from the surface, allowing for the transducer draft as well as an appropriate blanking distance between the transducer and the first measurement. The transducer was set 1.2 feet below the surface to prevent the transducer from coming out of the water due to potential waves and boat wakes. Position information was collected by Hypack, an integrated navigation software package running on a PC computer, linked to a Trimble 4000-series differential GPS. Position updates were available every 1 second, and raw position data was also sent to the ADCP laptop to assist in verifying the clock synchronization between the GPS and ADCP. 3.3 SURVEY TECHNQUE The transect lines presented in Figure 6 were surveyed throughout the 12.4 hour tidal cycle and the completion of each set of transects represented a loop. These loops were repeated throughout the survey period to depict the changing effects of the current regime throughout the tidal cycle. Each repetition of the loop was performed in the same direction to assure consistent results. Position data for each transect were recorded using Hypack, with the GPS signals distributed to both the Hypack computer and the ADCP recording computer for later comparison. ADCP data were recorded in binary format on the computer hard disk. Data recording was begun as the vessel neared the start of each line and was terminated at the end of each line. Copies of the field notes recorded throughout each of the ADCP surveys are presented in Appendix A. A summary of transects and loops is also Final Report ADCP and Tide Data Collection Deliver Order 0009 Portsmouth Harbor and Piscataqua River W912WJ-09-D-0001 Portsmouth, New Hampshire 8 October 2009
33 Woods Hole Group presented in Appendix C, which includes the start and stop time of each transect, the associated recorded file names, and any comments during the survey. 3.4 DATA PROCESSNG TECHNQUES The survey resulted in two types of data: current velocity and vessel position. The ADCP data for a single transect consisted of velocity components at every depth bin for every ensemble. n addition, the raw ADCP (binary) files also include ancillary data such as correlation magnitudes, echo amplitudes, percent good pings, and error velocities (among others). These data can be used to recalculate velocities, as well as assure quality of the results. Each ensemble also includes header information such as the ensemble number, time of the ensemble, and water temperature. Position data were recorded as time-northing-easting. The northing-easting pairs were referenced to State Plane Coordinates, NAD 1983 (feet). The raw ADCP data were converted to ASC files using Teledyne/RD s proprietary software to a user-defined data format. Subsequently, the ensemble profiles must be merged with the position data to assign a unique x-y pair to every ensemble. This merging operation is done using time and GPS position as the common link between the GPS and ADCP data files. By searching for the unique position at a specific time for each of the data sets, an accurate x-y location was assigned to each ensemble. Further numerical processing was performed to calculate the depth-averaged cross-sectional plots. 3.5 SURVEY RESULTS Data Files Detailed ASC data files, which provide every ensemble of data collected along each transect, are provided on the companion CD in the ADCP survey directory and as indicated in Appendix C. A sample ensemble data set is presented as Table 3. Table 3. Date and Time (EST) Example data file format for data files provided on the companion CD to this report. Easting (NAD83, feet) Northing (NAD83, feet) Depth (feet) Ve (ft/s) Vn (ft/s) Magnitude (ft/s) Direction (radians) 23-Jun :31: Jun :31: Jun :31: Jun :31: Jun :31: Jun :31: Jun :31: Jun :31: Final Report ADCP and Tide Data Collection Deliver Order 0009 Portsmouth Harbor and Piscataqua River W912WJ-09-D-0001 Portsmouth, New Hampshire 9 October 2009
34 Woods Hole Group 23-Jun :31: Jun :31: Jun :31: Jun :31: Jun :31: Jun :31: Jun :31: Jun :31: Jun :31: Jun :31: Jun :31: Jun :31: Jun :31: Jun :31: Jun :31: Jun :31: Jun :31: Jun :31: NaN NaN Jun :31: NaN NaN NaN NaN NaN 23-Jun :31: NaN NaN NaN NaN NaN 23-Jun :31: NaN NaN NaN NaN NaN The data files contain information along each transect line throughout depth. The first column is the date and time of the observation, the second and third columns are the easting and northing coordinate of the observation (in NAD 1983, feet), the fourth column is the center of each depth bin (in feet), the fifth column is the east component of velocity (in feet/second), the sixth column is the north component of velocity, the seventh column is the magnitude of the current, and the eighth column is the current direction (in radians with 0 being north). The NaN s in the last rows indicate bad results for depth bins below the bottom; these data are ignored. Some of the deepest bins have NaN s in the easting and northing velocity components as well. The bottom bins can become contaminated by the higher amplitude echoes reflected near the bottom and should be discounted Color Contour Plots of Current Structure Color contour plots for every transect observed during each survey for both sites are presented in the companion CD to this report. The color contour plots represent measured conditions at the time of the survey. Each pair of plots present the spatial structure of flow through the transect at a discrete time period. Viewing a series of these plots for sequential stops through a complete tidal cycle can offer a unique understanding of how the spatial structure of flow varies with time. Figure 7 presents and example color contour plot for the June 23 Survey (transect Y4) during an ebb tide. Final Report ADCP and Tide Data Collection Deliver Order 0009 Portsmouth Harbor and Piscataqua River W912WJ-09-D-0001 Portsmouth, New Hampshire 10 October 2009

35 Woods Hole Group Figure 7. The current velocities, presented in color contour plots, observed during the deployment survey (June 23, 2009) for Transect Y4. The upper panel presents the north/south velocity component, while the lower panel presents the east/west velocity component. Each figure consists of two panels: the top panel presents the north/south component of velocity through the transect, the bottom panel presents the east/west component of velocity through the transect. The directions are referenced to magnetic north. For example, positive north velocities represent water flowing in a northerly direction. Negative velocities represent water flowing to the south. Positive east velocities represent water flowing to the east; negative east velocities represent flow to the west. The vertical axis for each plot is depth (in feet), representing the depth of the water column. The horizontal axis represents distance across the transect line. A distance of zero (0) indicates the start of the line, while the end of the transect is indicated by the maximum distance. The color bar to the right of each plot indicates the magnitude of the north and east current velocities (in feet/second). Strong northerly and easterly flow is indicated by deep red; strong southerly and westerly flow is indicated by deep blue. White areas of Final Report ADCP and Tide Data Collection Deliver Order 0009 Portsmouth Harbor and Piscataqua River W912WJ-09-D-0001 Portsmouth, New Hampshire 11 October 2009
36 Woods Hole Group each plot indicate regions below the bottom; therefore, this provides a crude indication of the channel bathymetry outlined by the white areas below the color-filled spaces. For example, Figure 7 shows a strong south/southeast flow occurring at approximately 1730 on June 23, 2009 along transect 4 occurring during the ebb tide. The strongest flow occurs in the southwest portion of the transect, with maximum current magnitudes of approximately 7-8 feet/second (comprised of a maximum easterly component of approximately 5 to 6 feet/second and a maximum southerly component of approximately 5-6 feet/second). Figure 7 is provided as an example. The complete data set is presented on the companion CD in the ADCP survey directory. Overall, the differences between the deployment and recovery ADCP surveys are minimal, as the data collected during each survey occurred during similar spring tide conditions. The tidal flow is relatively consistent and the current is concentrated in the River s main channel in the area of the ADCP survey. The current is also relatively uniform in depth and consists of strong flood and ebb currents that are clearly defined from times of slack low and slack high water. At this particular location, maximum current magnitudes during a flood tide are approximately 6-7 feet/second, while during an ebb tide, maximum currents are approximately 7-8 feet/second. The direction of the current aligns with the direction of the main channel in the River and forms a predictable pattern Depth Averaged Velocities The velocities at selected nodes across each transect were determined for each time step. Each transect was divided into eight (8) equal-length subsections; the center of each subsection was labeled individually as node 1 through node 8. For each node, verticallyand horizontally-averaged (east and north) velocity components were calculated for each time step. The vertical average of each ensemble consisted of the mean velocity for all valid bins. The validity of the bottom bin measurements was determined by comparing the standard deviation of bottom values to the standard deviation of mid-column measurements. f the standard deviation at the bottom was more than twice the standard deviation of mid-column measurements, the bottom bin was discarded from the calculation. f the bottom value was within the limits defined by adjacent measurements, the value was included in the calculation. The horizontal average included all verticallyaveraged ensemble velocities within each nodal subsection. The result of this averaging procedure was a series of values showing the average velocity magnitude and direction for each loop of transects. n addition, the nodal averages included the average time of all ensembles in the subsection, average water depth of all ensembles in the subsection, and x-y position of each node. The values for each contiguous loop were plotted as arrows on separate georeferenced maps to show the current characteristics during each time step. Figure 8 shows an example from the June 23, 2009 ADCP survey for loop Y, observed from 1718 to 1733 hours during an ebb tide. Each yellow vector presents the magnitude and direction of the horizontally and depthaveraged currents along a transect line. The length of the vector corresponds to the magnitude of the current, relative to the scale arrow shown at the top of the plot. The plot Final Report ADCP and Tide Data Collection Deliver Order 0009 Portsmouth Harbor and Piscataqua River W912WJ-09-D-0001 Portsmouth, New Hampshire 12 October 2009
 provide a time series of the depth-averaged current patterns for the Piscataqua River survey location. Figure 8.")
37 Woods Hole Group shows an overall characterization of the flow patterns in the vicinity of the turning basin. The series of loop figures (presented on the companion CD in the ADCP survey directory) provide a time series of the depth-averaged current patterns for the Piscataqua River survey location. Figure 8. Depth-averaged current results for the transects of Loop Y during the June 23, 2009 survey. Additionally, a similar method was used to output a depth-averaged velocity (magnitude and direction) at every 25 feet along a transect line, as requested in the RFP. These data files are provided on the companion CD in the ADCP Survey directory, and the file name nomenclature is presented in Appendix C. Final Report ADCP and Tide Data Collection Deliver Order 0009 Portsmouth Harbor and Piscataqua River W912WJ-09-D-0001 Portsmouth, New Hampshire 13 October 2009
38
39 APPENDX A FELD NOTES Final Report ADCP and Tide Data Collection Deliver Order 0009 Portsmouth Harbor and Piscataqua River W912WJ-09-D-0001 Portsmouth, New Hampshire A-1 October 2009
Cb. d,.. f\ 15 -:: :!i'd..:r~ 'h.r..l.:ut'\--~ _h1-.d1 XJJ:._u -1--l,{L--------r- ~ --4~- - - ~... ' :- oj - -m- -t@~\"'1.t P.u~, ;t.,~ \"h'\"_\"-k: ::-r-~~bl---:~-4<1\"h S,N l e_25.")
40 ~~~-- ~ w (J(Ji') ~:.J?... X!:! A J /_- _trj~. ti.dq_ 0,{: 8~2- j., 4 j_s 6 _;3_ - ' ---j----' T ""---t---~ b_ek_w_ Too o_f ST:e.EL - B~b~ t-" _.~--t ~ 51 f-~_vc,._e Y~r.:xl ()Cb. d,.. f\ 15 -:: :!i'd..:r~ 'h.r..l.:ut'\--~ _h1-.d1 XJJ:._u -1--l,{L r- ~ --4~- - - ~... ' :- oj - -m- -t@~"'1.t P.u~, ;t.,~ "h'"_"-k: ::-r-~~bl---:~-4<1"h S,N l e_ "---r' p.--6-s.lt-l.1~: N _y a 10 ( s _t\~ r- V\ 1 o =r c~ l45:.. ff i \1\J ~ fl, "\:~::_ ~, p S C. A- T 71~2.. \ t "="-R=-~ 6~(;-~ j~ (} v N_11Eb'l '~J r~~ ~ ~_Q_c...~ ~ 2-x~t:_. ) _l?'n~ '\.. /t ~.'WJ.~ v ' t:e.._l} ~.-----""----\-- 2 X-:.!-J ~ -- E tc.r,.. _fj_b b.i> - J,.,:,..,i. ftb_i2 &-.C..iffu.'\ r-~..p.}..., ~ -~ - _L...l!iJ" L-- ~P! 'r_/.." ~L \ _., '1laF ~~..-.n -'1"" i-+--t--t-r---r---r--r !J t---t---t--r--t--t t-t~~ ~~~~~-~++~~-rtlt-ltll\11\.,
41
42 '!_- _\_ ~ -~~-"~- A~1 ~8_ -:J ---~-=--~-- 8_d_1 -~-=4. --~~-=--~--- ~_C._... ~'*-- -- ~-D :- _1 ~-}.._:- 2~ _!)_.:::_L~l) ~-~1 (=_L_ - f-2, ~ ::.4-- _ Qj_l g~~ l_s ~- _; ~s;;_~va -----f--~_l E_1_~~---- Q_'l?d-: f sc~~~v'"'"~ ~2-- 0(13J!Thj-_=-,,~,~~-..~~~ ~--- _f~ ~ b_4 '-~- _!!13._&~- f' ~~r~{: ----!~-~---- C ~ 3_j ~5.2 P~s ~4~~~
43 lpop, ~~ 1Jl>tl (::, - \ <?1--L.. ~-3 ~ -'\ H- \ -!-\_ -z.. H - 3 H -4 r- \ _"!- :J- 2- _;T-3 3"-4 k- t J<> z. ll. -1 K-4 -L-J L-_-l k'3 L-L\-_ --pt\1.--( 9 1'~~ Q ~ _O_CJ5t b?~') 695-t:t /OO(o!01_7_ 0_2-Cf 1_0~~ lo41 ro4~ tot)~ 1058 s\-dl """~ 0~18 _Q9-~1-- 09"58 ~,~~ - -_.o2.b..j&: 100, 10'17?0 ~~ 1oz( V ~AGivA -- _()2.:1. -~ P~CA.,AGNA... 9~ * p~cj0.7a&t)~ _6:1_q Jf!' ~">~>AG~A - _o_1_<~... ~ --. tsca!-ao.v(.\ _,";/. ~ ~ >\~~T'AQvA ~-()j~--~- --? l S CAS" AG.J4 ld~j..- --::0_}3 ~-:"'- - D~B /04~! "~ a 0 ( 10 Z- lozz-?.~~.o.qoja ~<_~~ *- 1 ~CArA,GVA, DOl- P'~(.Jr:>.orA$Vt>- ~0'14,}1' ~a~a -:-P~a,:i._~--- "'~~<A4 -"~C..:-1'-. p,'sc/lr1"'p.et..vf.+ o3'1. ~
44 M- \ r -z.z.:~ M :_l ~ ---- f M""'; /lt\-4!!_:, _N-~ N,. 3 N_-1 0 -' 0-L i),~ U>--N>-c;.:hiA - oc;rt.lt 1;~..,...001~ ---~~ l.s~~r:.j;a ~;9.~ 0-3 o--4 ')-- \) ~ J... - ~-,.; p ~-- - Q_~? -_Q_ -_3 _ g w_±_ i2.. - \2..-' \~ -4 t4l0 t4l(o i'il~ _ J1~_2 14 '3 \,~ 3g 14 it\ '44.t; ) ~~~7- _1?!±1_ ---l---'-v-'~ -1~~4- _j}_~"])~!_gfq( _ -'~~1--- J1J~-
45 / u.p '( ~<~f;; 4~~ \,0 ~? 1'~ '\'\ y.,\?r, p,~-m..oua 5-\ j45to 11;"0D -07'>. ~ s-z... rs-o-z... t')o~.,i~~ -dj'=>._~ 5-3 )Cb )D~.- c.1? 7.. ~- y,<:,t:.a,-p.,._.q,j~ " Sc:A~c:.?vAs -4'- ')09 /t;jlf _07<i".~ r- \ 1":)2.0 _0)9.~ p.,.~va fsv't T-2- ;t;zlo JS"''Z-9 _O'CP 1'f' T-~ -4 /t;"2 't /?'3l {~32- (~>5 p, su"-\a t:i.~4a.-ob.~ ~ S~~ -0~2,q:; " i' osu;w-aa,vjt -c::>~lc>- ~ ;" ~AOVA. ~ \ /G7 17 J(o'Z.l -9f!!J-. ~ V-2 /f.t,z,~!6~ -090.Jtlt' v-~ 1(., zr; ib21 V-4 flo 2<[( r(o "3v Pl~~r.>.{JJ>. yos(ft;:raq/a {)o's 4~ ln Qllf-.,_09J. ~... 09Z-~ w. /637 t&4l i?\~a.:.ov.&r -09.'3 K. Pi.-s~auA- L(-1 1~40 '~41- _Of;!}. o, ~ A..r'A-Q.JA u.-z... 1~%!t?'4-~. -~4~~. i,l- ~ /rs--1-<6 ts-51,-_o~s--1'. t' ~o.q~ \A-f!<;;52--. j'{'(~. ~''SG>-l"PtGGJA- "i>~qj w -~ /@4"S troqt{ -~...;f JMUYf'AO.~ vj --3 //;4(! //;45{ _ufj'l * p, ~r;ea.g~ vj --1 1/Ak ~$'].., -~.i!f. ijtsc.~a&v~ ~ - Jf:J'?e,, oz.,. -o~n"".l'.,~sta't-4qva i -z \704- i1bb -0%." ~Sl %A-l\A ~../~ \O(p ilab _uq~.~ l'l,)larj-~ ~ 1 l/09 \ 1l z._... l. '! ~~ --
46 ~-~- ----~-
47 ,--,--~----! ~ i... r v:p1"..,,pt.:( ~-:OJ~ ~ ~9--v f\t"~ 11N"' ~~ ~,.,t'f/1--'f!. /z--a-.7. ~-#,.-~ 5 Pctz.\- (c~l~ ~ ,,joon"'agva a-1 fcjcf i'tu...-- [-- otl..~_"jf' r ---+i CJt1,.qi(. f:,.aj&f lit 4 ~ - "'~ h- \w i=~ {_ )f-. ln,- f'fr t:.'lk / A_ n:: t.;:lla ia, '-"'... ta ~0_\~.~- [- - {1t':CJ'n~.11 A -~'1. a-; r:t2~ t9z,'/ [t:.-t /93/ ltt2:~ _w-_l lq?r.~ t94z. &6~ ~[j -~-~ : lf ~ f...() -- ~--- ' J -- _OL1.--'J._Jf> c') <J' r...::ra-<"".lo "" \LC'-~---- 'PrS<~li,-~A -~ )rl.l a ~- ~.. _ c--- '! z.~f- p,; [ft. ~ r rs 'A lfj ~,( -~~ :t: _7'2:: a Jl.l..._Q\_~''L~ t?tsavr"agh.l\.. (':~ r.z.. 111s ~ ~ ~ lv (.., ~ C'.~ ,z. YY-""2- t94'/ tc)'+1 _o,-?..o.~ ;:;;~g P~Wt/llr c 1-.- lc- 'f'etl f--f 112 Val '-"'k. S d.! ~ [e,.., ~' - r. f/ fc:... F ff--_~4 --- bn~ - _._. --~ i~'lt {qt)( JO,.t;V - "' -... _Ql"l;.l.~ ;ce~f Pa~v~ -0_\.~'L-~ -9'-~ <f_~\.,s(}.a_,~ _ ~ ~ ~ '~ ct!. " 1- ';.i~ 1~ S"~ ~ ~ ~ftfj.t - - ~ la'! -!~ ~~ ge, (~ 6! ;~..A.-.::!. 1 ~ 4 ~~ i , 1- "-"' :... "'~ c <,.A rll lo ; -, 1 S"4 ~t: ~g til- J [7 z. - ""-- l i.. i 1... \ ~ it:s ~ r1' ~! -., ~,.e ~ i,.jl 1~ l'\1 ~ e. :./1 c:::. b1 ;> (;:: r>.jl~ A :C> ~- 0 ~\A ~ (A>! -!:> i ~- 1-~ f:' ~ 1-"- --.:~ ~ 't:" ~c l...}:: ~ ~ - nl> '.. rd p t.'-p'" 2 ~ '\- ~ e~ ~ ~~ = Q.lol ~~> f---.,. '*',,.:::; r,.., "':rl"'...:-l lt.i: "'M. '\ B R jep'- 1--,_ f/..cil- i5 '(:'(); ~ h! - i _QO) 1\) ~ Q j ~ 9 F~ fc.a. D:tJ,a "l~ ~'4E k- ' ~ ') ~!?" p of== r:ln c;j r -=~ ~ r--- " f / ~,.f ~.1~ JS ~!.-, J 1/ ~ J.,_~,~ - r\.\! _~,
48 ~ ~ - - ~ - [! j i rl..-- _, (> --- ',! ;r l\f... ~SC 7 ;;_, oq p_; ') ( u..t-g\t~ -,-- l t - 1 l~lb l r 1/ h l Ar v f 1 rtcj lt\~~t_ /t 1/ r ;V J)~t '1-' :! : r o~ lfv_j i () Lur~- d "\ U'-J1 '"-" / ~~ -jp:- 1 ] -1 ~--,tv\ f~)_fj ~~~ ~v v- 1~ r;( \..., ',-_ 1'-',\. f.n a (f)jaj 0~-~--- v '! CCLLA-- ~- _1 l-7 ~~ tl <n~ ~"- ;lh.., "b1 ul L _J _ j_ A (,JJ}eu_j t---t------l -t-- --i----j - T ~ --st~ \~ C'6' -1/_ ~~ l D CAVt llrj ~\ (') 4 - JZ_ fem Pr ~A -:::: ll,h{ AJM rn l fj Vl 'v ~ &~~- 1 ~,v -- ij ~-l ~--- iwj-1. -.J_//\ b " , _.,.. 1 ~~* --~'t-1- + \ 1, ' ---+-'- ~----r--! -~--- r--i~--~-----j.!. L. j &Sb lllm op )._ A Ul)~ (,of t t~(f- TT. + i ' t ~ i!-1----~. -r-- --~.. ~~ L' -- ~ --, r!'",, \.j j AlA'\.11 r t~"' ~ f'f..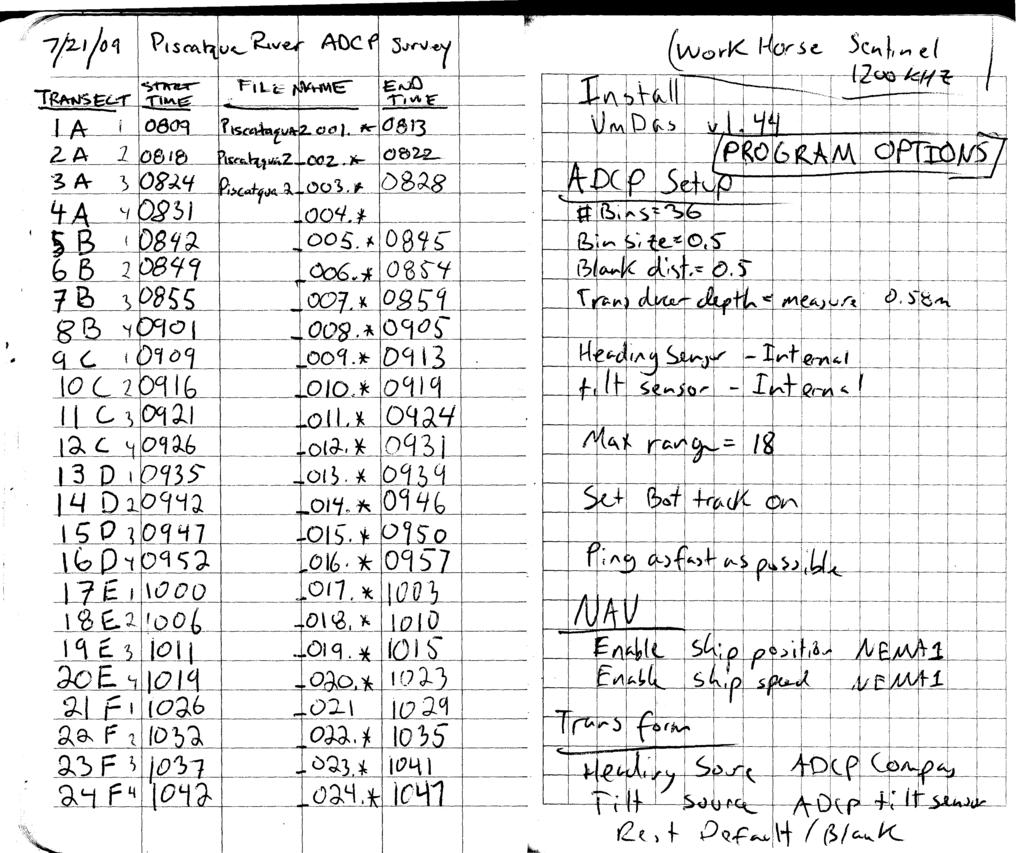
49
50 j ----.d~~ l J ~ =~~D+-~~-~----- =~~ r---r------t j------f=l-~~...~------~-- 1 '.Jf- 7 c u...---_ r _, <. i "'- ' l) ~,-.,JV~f-V, ~lj / A 1./ ("\ \... \ ~ \ ~ ~ ( - )- -..,r- i \--
51
~ p - ~ r J i t-j 5e _41\~ k!jr 1-, 1<~1 c ~... ( bv\ \-c p L ~-U,. in ll~ ~ (1~ S'~ \U~l A\" rh-u \ /~ t&~ rn ~ --- \) ( ' ~c.! ) ~ c.k.. ('\\"\" 1..... Je ; ci:.t.i i w- ~\"\ rr,.")
52 i ~' l(l t/ 0 f1 (?... 1 Ml L( ~ ("+ t [t:jj 1 ~... ~ 5 ff\ ~;;.c; ~i- ~;~ ' ~ f -'-...! -~ \.! i i - 11! f A -f re.. k,r:f ~C) rflj (lt +- ~ s1 f v 1 '- - ~e w (~ D v"t ~ }v'h... J-~ - e.. vh. ~en!,)~ p - ~ r J i t-j 5e _41\~ k!jr 1-, 1<~1 c ~... ( bv\ \-c p L ~-U,. in ll~ ~ (1~ S'~ \U~l A" rh-u \ /~ t&~ rn ~ --- \) ( ' ~c.! ) ~ c.k.. ('\"" Je ; ci:.t.i i w- ~"\ rr,.,r ~ 6" Hi',,-:a lt tl len\. ).. ~ l~va\,~o<aj 1'--' 1-~~ v...j,. \ ( k~:t ""' OA t' la,\.;~ lr, M 1f.P ((J;J la. &1 ~J ~lj\ 1-\., ' "' ' r~ "n.o. ~lr.:. vllanu,. i i i (\ la\\ ~...; - J./1-! ~~At hr! \ll ")' '()t.. d.--c k-t... r\'1\ "".St. l...j ( ~w...si~v ok.. L ~N\~ sc..,-~tt~l) {~c~~~<--~ '"" f'~,h '-. Cc~~"" ~., w Lt\1)c_f' ~~.-. s v\,le\l-...~.
NEED FOR SUPPLEMENTAL BATHYMETRIC SURVEY DATA COLLECTION
 305 West Grand Avenue, Suite 300 Montvale, New Jersey 07645 Phone 201.930.9890 Fax 201.930.9805 www.anchorqea.com M EMORANDUM To: Caroline Kwan and Nica Klaber U.S. Environmental Protection Agency Region
TRIAXYS Acoustic Doppler Current Profiler Comparison Study
 TRIAXYS Acoustic Doppler Current Profiler Comparison Study By Randolph Kashino, Axys Technologies Inc. Tony Ethier, Axys Technologies Inc. Reo Phillips, Axys Technologies Inc. February 2 Figure 1. Nortek
Impact of Dredging the Lower Narrow River on Circulation and Flushing
 Impact of Dredging the Lower Narrow River on Circulation and Flushing Craig Swanson Ph.D. Swanson Environmental Alex Shaw Ocean Engineering, URI Prof. Malcolm L. Spaulding Ocean Engineering, URI 29 January
Hydraulic Modeling Analysis
 Final Report Photograph: http://www.newington-dover.com Newington to Dover, New Hampshire Prepared for: Vanasse Hangen Brustlin, Inc. 6 Bedford Farms Drive, Suite 607 Bedford, New Hampshire 03110-6532
: Hydrodynamic input for 2D Vessel Simulations (HY- 0027)
") Technical Note To : Christian Taylor (PoHDA) From : Rohan Hudson Cc : Ben Gray Date : 1/04/2015 (Final Draft) Subject : Hydrodynamic input for 2D Vessel Simulations (HY- 0027) Introduction This Technical
Technical Note To : Christian Taylor (PoHDA) From : Rohan Hudson Cc : Ben Gray Date : 1/04/2015 (Final Draft) Subject : Hydrodynamic input for 2D Vessel Simulations (HY- 0027) Introduction This Technical
Sontek RiverSurveyor Test Plan Prepared by David S. Mueller, OSW February 20, 2004
 Sontek RiverSurveyor Test Plan Prepared by David S. Mueller, OSW February 20, 2004 INTRODUCTION Sontek/YSI has introduced new firmware and software for their RiverSurveyor product line. Firmware changes
OFFICE OF STRUCTURES MANUAL FOR HYDROLOGIC AND HYDRAULIC DESIGN CHAPTER 11 APPENDIX B TIDEROUT 2 USERS MANUAL
 OFFICE OF STRUCTURES MANUAL FOR HYDROLOGIC AND HYDRAULIC DESIGN CHAPTER 11 APPENDIX B TIDEROUT 2 USERS MANUAL APRIL 2011 APRIL 2011 Page 1 Preface TIDEROUT 2, Build 1.22 dated June 29, 2006 is the current
ENVIRONMENT AGENCY GREAT OUSE AND 100 FT DRAIN QUARTERLY BATHYMETRIC SURVEY DECEMBER 2013 SITE SURVEY REPORT NO. H6787
 ENVIRONMENT AGENCY GREAT OUSE AND 100FT DRAIN QUARTERLY BATHYMETRIC SURVEY DECEMBER 2013 NO. H6787 LONGDIN & BROWNING (SURVEYS) LIMITED CHERRY TREE HOUSE CARMARTHEN ROAD SWANSEA SA1 1HE H6787 1 Measured
Evaluation of June 9, 2014 Federal Emergency Management Agency Flood Insurance Study for Town of Weymouth, Norfolk, Co, MA
 Evaluation of June 9, 2014 Federal Emergency Management Agency Flood Insurance Study for Town of Weymouth, Norfolk, Co, MA Prepared For: Woodard & Curran 95 Cedar Street, Suite 100 Providence, RI 02903
Currents measurements in the coast of Montevideo, Uruguay
 Currents measurements in the coast of Montevideo, Uruguay M. Fossati, D. Bellón, E. Lorenzo & I. Piedra-Cueva Fluid Mechanics and Environmental Engineering Institute (IMFIA), School of Engineering, Research
Appendix E Cat Island Borrow Area Analysis
 Appendix E Cat Island Borrow Area Analysis ERDC/CHL Letter Report 1 Cat Island Borrow Area Analysis Multiple borrow area configurations were considered for Cat Island restoration. Borrow area CI1 is located
Appendix 5: Currents in Minas Basin. (Oceans Ltd. 2009)
") Appendix 5: Currents in Minas Basin (Oceans Ltd. 29) Current in Minas Basin May 1, 28 March 29, 29 Submitted To: Minas Basin Pulp and Power P.O. Box 41 53 Prince Street Hansport, NS, BP 1P by 22, Purdy
Appendix 5: Currents in Minas Basin (Oceans Ltd. 29) Current in Minas Basin May 1, 28 March 29, 29 Submitted To: Minas Basin Pulp and Power P.O. Box 41 53 Prince Street Hansport, NS, BP 1P by 22, Purdy
WOODFIBRE LNG VESSEL WAKE ASSESSMENT
 Woodfibre LNG Limited WOODFIBRE LNG VESSEL WAKE ASSESSMENT Introduction Woodfibre LNG Limited (WLNG) intends to build a new LNG export terminal at Woodfibre, Howe Sound, British Columbia. WLNG has engaged
Data Collection and Processing: Elwha Estuary Survey, February 2013
 Data Collection and Processing: Elwha Estuary Survey, February 2013 Ian Miller, WA Sea Grant Olympic Peninsula Field Office, 1502 E. Lauridsen Blvd #82, Port Angeles, WA 98362 immiller@u.washington.edu
Evaluation of the Klein HydroChart 3500 Interferometric Bathymetry Sonar for NOAA Sea Floor Mapping
 Evaluation of the Klein HydroChart 3500 Interferometric Bathymetry Sonar for NOAA Sea Floor Mapping Yuhui Ai, Straud Armstrong and Dean Fleury L-3 Communications Klein Associates, Inc. 11 Klein Dr. Salem,
GNSS Technology for the Determination of Real-Time Tidal Information
 GNSS Technology for the Determination of Real-Time Tidal Information Benjamin Kidder C-Nav Positioning Solutions European region Outline of Topics Covered Introduction to Tides Past and Present Methods
CALCASIEU SALINITY STRUCTURES. HYDRODYNAMIC MODELING (To Support Design of Salinity Barriers)
") CALCASIEU SALINITY STRUCTURES HYDRODYNAMIC MODELING (To Support Design of Salinity Barriers) Presentation Overview 1 2 3 4 5 Project Overview and CEA Circulation Modeling Vessel Hydrodynamics Modeling
CALCASIEU SALINITY STRUCTURES HYDRODYNAMIC MODELING (To Support Design of Salinity Barriers) Presentation Overview 1 2 3 4 5 Project Overview and CEA Circulation Modeling Vessel Hydrodynamics Modeling
Figure 4, Photo mosaic taken on February 14 about an hour before sunset near low tide.
 The Impact on Great South Bay of the Breach at Old Inlet Charles N. Flagg and Roger Flood School of Marine and Atmospheric Sciences, Stony Brook University Since the last report was issued on January 31
Nortek Technical Note No.: TN-021. Chesapeake Bay AWAC Evaluation
 Nortek Technical Note No.: TN-021 Title: Chesapeake Bay AWAC Evaluation Last Edited: October 5, 2004 Authors: Eric Siegel-NortekUSA, Chris Malzone-NortekUSA, Torstein Pedersen- Number of Pages: 12 Chesapeake
14/10/2013' Bathymetric Survey. egm502 seafloor mapping
 egm502 seafloor mapping lecture 10 single-beam echo-sounders Bathymetric Survey Bathymetry is the measurement of water depths - bathymetry is the underwater equivalent of terrestrial topography. A transect
Volume and Shoreline Changes along Pinellas County Beaches during Tropical Storm Debby
 Volume and Shoreline Changes along Pinellas County Beaches during Tropical Storm Debby Ping Wang and Tiffany M. Roberts Coastal Research Laboratory University of South Florida July 24, 2012 Introduction
STUDY REPORT W&AR-03 RESERVOIR TEMPERATURE MODEL ATTACHMENT B DON PEDRO RESERVOIR BATHYMETRIC STUDY REPORT
 STUDY REPORT W&AR-03 RESERVOIR TEMPERATURE MODEL ATTACHMENT B DON PEDRO RESERVOIR BATHYMETRIC STUDY REPORT DON PEDRO RESERVOIR BATHYMETRIC STUDY REPORT Prepared for: TURLOCK IRRIGATION DISTRICT MODESTO
Preliminary Wake Wash Impact Analysis Redwood City Ferry Terminal, Redwood City, CA
 Technical Memorandum Preliminary Wake Wash Impact Analysis Redwood City Ferry Terminal, Redwood City, CA 1. Introduction The following preliminary wake wash impact analysis was initiated by the Port of
Coastal Sediment Transport Modeling Ocean Beach & San Francisco Bight, CA
 1 Coastal Sediment Transport Modeling Ocean Beach & San Francisco Bight, CA Honghai Li and Lihwa Lin Engineering Research and Development Center U.S. Army Corps of Engineers Frank Wu, Lisa Andes, and James
Table 1. Sequence of bubble and dredging tests with prevailing tide stage and number of bucket cycles recorded for each test.
 Table 1. Sequence of bubble and dredging tests with prevailing tide stage and number of bucket cycles recorded for each test. Test Tide Dredge Orientation 1 Date Time # Bucket Cycles Bubble 1 Flood North
Effect of Hydrodynamics on Sediment Transport near a Coastal Inlet
 ICHE 2014, Hamburg - Lehfeldt & Kopmann (eds) - 2014 Bundesanstalt für Wasserbau ISBN 978-3-939230-32-8 Effect of Hydrodynamics on Sediment Transport near a Coastal Inlet H. Li, M. Brown, J. Rosati & Z.
The Impact on Great South Bay of the Breach at Old Inlet Charles N. Flagg School of Marine and Atmospheric Sciences, Stony Brook University
 The Impact on Great South Bay of the Breach at Old Inlet Charles N. Flagg School of Marine and Atmospheric Sciences, Stony Brook University The previous report provided a detailed look at the conditions
Comparisons of Physical and Numerical Model Wave Predictions with Prototype Data at Morro Bay Harbor Entrance, California
 Comparisons of Physical and Numerical Model Wave Predictions with Prototype Data at Morro Bay Harbor Entrance, California by Robert R. Bottin, Jr. and Edward F. Thompson PURPOSE: This Coastal and Hydraulics
Structure and discharge test cases
 Chapter 28 Structure and discharge test cases 28.1 Introduction Three test case have been implemented to test the performance and applicability of the structures and discharges modules. drythin Simulates
DRAFT. October 17, 2014 File No Mr. Brendhan Zubricki Town Administrator Essex Town Hall 30 Martin Street Essex, MA.
 GZA GeoEnvironmental, Inc. Engineers and Scientists October 17, 2014 File No. 18.0171857.00 Mr. Brendhan Zubricki Town Administrator Essex Town Hall 30 Martin Street Essex, MA. 01929 DRAFT Re: Essex River
HURRICANE SANDY LIMITED REEVALUATION REPORT UNION BEACH, NEW JERSEY DRAFT ENGINEERING APPENDIX SUB APPENDIX D SBEACH MODELING
 HURRICANE SANDY LIMITED REEVALUATION REPORT UNION BEACH, NEW JERSEY DRAFT ENGINEERING APPENDIX SUB APPENDIX D SBEACH MODELING Rev. 18 Feb 2015 1 SBEACH Modeling 1.0 Introduction Following the methodology
CONSTRUCTION OF LNG RECEIVING TERMINAL ON THE SAINT LAWRENCE TIDAL CURRENT CONDITIONS IN THE LEVIS AREA
 RABASKA PROJECT CONSTRUCTION OF LNG RECEIVING TERMINAL ON THE SAINT LAWRENCE TIDAL CURRENT CONDITIONS IN THE LEVIS AREA FINAL REPORT MARCH 2006 N/Réf. : 24237.360 3075, ch. des Quatre-Bourgeois Sainte-Foy
DUXBURY WAVE MODELING STUDY
 DUXBURY WAVE MODELING STUDY 2008 Status Report Duncan M. FitzGerald Peter S. Rosen Boston University Northeaster University Boston, MA 02215 Boston, MA 02115 Submitted to: DUXBURY BEACH RESERVATION November
APPENDIX D-2. Sea Level Rise Technical Memo
 APPENDIX D-2 Sea Level Rise Technical Memo 2185 N. California Blvd., Suite 500 Walnut Creek, CA 94596 (925) 944-5411 Fax: (925) 944-4732 www.moffattnichol.com DRAFT MEMORANDUM To: From: Neil Nichols,
The Continuing Evolution of the New Inlet
 The Continuing Evolution of the New Inlet Charles N. Flagg, Roger Flood and Robert Wilson School of Marine and Atmospheric Sciences, Stony Brook University It is now a year plus since super storm Sandy
Hydrologic Feasibility of Storm Surge Barriers
 Hydrologic Feasibility of Storm Surge Barriers Malcolm J. Bowman, School of Marine and Atmospheric Sciences State University of New York, Stony Brook, NY. Presented at Against the Deluge: Storm Surge Barriers
SURFACE CURRENTS AND TIDES
 NAME SURFACE CURRENTS AND TIDES I. Origin of surface currents Surface currents arise due to the interaction of the prevailing wis a the ocean surface. Hence the surface wi pattern (Figure 1) plays a key
APPENDIX A Hydrodynamic Model Qualicum Beach Waterfront Master Plan
 Page 1 of 21 CLIENT: Town of Qualicum Beach PROJECT: SIGNATURE DATE CONTRIBUTORS : M. Marti Lopez REVIEWED BY : P. St-Germain, EIT APPROVED BY: J. Readshaw, P.Eng ISSUE/REVISION INDEX Issue Details Code
Water circulation in Dabob Bay, Washington: Focus on the exchange flows during the diurnal tide transitions
 Water circulation in Dabob Bay, Washington: Focus on the exchange flows during the diurnal tide transitions Jeong-in Kang School of Oceanography University of Washington (206) 349-7319 nortiumz@u.washington.edu
High Frequency Acoustical Propagation and Scattering in Coastal Waters
 High Frequency Acoustical Propagation and Scattering in Coastal Waters David M. Farmer Graduate School of Oceanography (educational) University of Rhode Island Narragansett, RI 02882 phone: (401) 874-6222
ENGINEERING STUDY OF INLET ENTRANCE HYDRODYNAMICS: GRAYS HARBOR, WASHINGTON, USA
 Cialone, M.A., and Kraus, N.C. (2001). Engineering Study of Inlet Entrance Hydrodynamics: Grays Harbor, Washington, USA. Proceedings of Coastal Dynamics 01, ASCE, Reston, VA, 413-422. ENGINEERING STUDY
HYDROGRAPHIC AND SITE SURVEY REPORT
 HYDROGRAPHIC AND SITE SURVEY REPORT Proposed Pen Site at Dounie, Sound of Jura Prepared for: Kames Fish Farming Ltd Kilmelford Argyll PA34 4XA Tel: +44 (0)1631 720699 TransTech Limited www.transtechltd.com
National Maritime Center
 National Maritime Center Providing Credentials to Mariners (Sample Examination) Page 1 of 16 Choose the best answer to the following Multiple Choice Questions. 1. On U.S. charts, you can tell if a named
Examples of Carter Corrected DBDB-V Applied to Acoustic Propagation Modeling
 Naval Research Laboratory Stennis Space Center, MS 39529-5004 NRL/MR/7182--08-9100 Examples of Carter Corrected DBDB-V Applied to Acoustic Propagation Modeling J. Paquin Fabre Acoustic Simulation, Measurements,
Hydrographic Surveying Methods, Applications and Uses
 Definition: Hydrographic Surveying Methods, Applications and Uses It is the branch of surveying which deals with any body of still or running water such as a lake, harbor, stream or river. Hydrographic
Little Spokane River Stream Gage Report: Deadman Creek, Dragoon Creek, and the West Branch of the Little Spokane River
 Little Spokane River Stream Gage Report: Deadman Creek, Dragoon Creek, and the West Branch of the Little Spokane River June 2010 Spokane County Conservation District N. 210 Havana St. Spokane, WA 99202
Response of a Newly Created Marsh-Wetland Affected by Tidal Forcing, Upland Discharge, and Groundwater Interaction
 Response of a Newly Created Marsh-Wetland Affected by Tidal Forcing, Upland Discharge, and Groundwater Interaction Mouth of Columbia River, Cape Disappointment State Park, Washington 12 Hans R. Moritz
Compiled by Uwe Dornbusch. Edited by Cherith Moses
 REPORT ON WAVE AND TIDE MEASUREMENTS Compiled by Uwe Dornbusch. Edited by Cherith Moses 1 Aims...1 2 Summary...1 3 Introduction...1 4 Site selection...1 5 Wave recorder settings...2 6 Results...2 6.1 Water
Comparison of Predicted and Measured Shoaling at Morro Bay Harbor Entrance, California
 Comparison of Predicted and Measured Shoaling at Morro Bay Harbor Entrance, California by Edward F. Thompson, Inocencio P. DiRamos, and Robert R. Bottin, Jr. PURPOSE: This Coastal and Hydraulics Engineering
COMPARISON OF CONTEMPORANEOUS WAVE MEASUREMENTS WITH A SAAB WAVERADAR REX AND A DATAWELL DIRECTIONAL WAVERIDER BUOY
 COMPARISON OF CONTEMPORANEOUS WAVE MEASUREMENTS WITH A SAAB WAVERADAR REX AND A DATAWELL DIRECTIONAL WAVERIDER BUOY Scott Noreika, Mark Beardsley, Lulu Lodder, Sarah Brown and David Duncalf rpsmetocean.com
DQM Annual Hopper QA Checks
 DQM Annual Hopper QA Checks The following document is intended to be a guide for conducting annual Dredge Quality Management quality assurance checks on hopper dredges. The procedures should provide general
ISOLATION OF NON-HYDROSTATIC REGIONS WITHIN A BASIN
 ISOLATION OF NON-HYDROSTATIC REGIONS WITHIN A BASIN Bridget M. Wadzuk 1 (Member, ASCE) and Ben R. Hodges 2 (Member, ASCE) ABSTRACT Modeling of dynamic pressure appears necessary to achieve a more robust
Applications of ELCIRC at LNEC
 stratification in the Guadiana estuary tidal propagation in the Óbidos lagoon Lígia Pinto Anabela Oliveira André B. Fortunato 2 O utline Stratification in the Guadiana estuary The Guadiana estuary Objectives
N. Robinson and A. Pyne
 ISSN 0375 8192 March 2004 Antarctic Data Series No 26 WATER COLUMN CURRENT PROFILE ANALYSIS FROM BENEATH THE MCMURDO ICE SHELF AT WINDLESS BIGHT AND UNDER THE SEA ICE IN GRANITE HARBOUR, ANTARCTICA N.
Real Time Surveying GPS and HYDRO Software for Tide and Swell Compensation
 Real Time Surveying GPS and HYDRO Software for Tide and Swell Compensation by Mr Michael Walker, B.Surv. (Otago) HYDRO Division Trimble Navigation New Zealand Ltd. Abstract This paper focuses on the use
Training program on Modelling: A Case study Hydro-dynamic Model of Zanzibar channel
 Training program on Modelling: A Case study Hydro-dynamic Model of Zanzibar channel Mayorga-Adame,C.G., Sanga,I.P.L., Majuto, C., Makame, M.A., Garu,M. INTRODUCTION Hydrodynamic Modeling In understanding
FINAL REPORT APPENDIX A. Physical Description of the Shubenacadie River
 FINAL REPORT APPENDIX A Physical Description of the Shubenacadie River Smart Solutions for Engineering, Science and Computing Physical Description of the Shubenacadie River Martec Technical Report # TR-07-12
Inlet Management Study for Pass-A-Grille and Bunces Pass, Pinellas County, Florida
 Inlet Management Study for Pass-A-Grille and Bunces Pass, Pinellas County, Florida Final Report Submitted By Ping Wang, Ph.D., Jun Cheng Ph.D., Zachary Westfall, and Mathieu Vallee Coastal Research Laboratory
13. TIDES Tidal waters
 Water levels vary in tidal and non-tidal waters: sailors should be aware that the depths shown on the charts do not always represent the actual amount of water under the boat. 13.1 Tidal waters In tidal
Tidal regime along Vietnam coast under impacts of sea level rise
 VNU Journal of Science, Earth Sciences 28 (2012) 133-139 Tidal regime along Vietnam coast under impacts of sea level rise Tran Thuc, Duong Hong Son* Vietnam Institute of Meteorology, Hydrology and Environment
Simulation of hydraulic regime and sediment transport in the Mekong delta coast
 Simulation of hydraulic regime and sediment transport in the Mekong delta coast 1. Introduction Coastal erosion in the Mekong Delta has been recorded in recent years and the erosion rate has been increasing
CHAPTER 134 INTRODUCTION
 CHAPTER 134 NEW JETTIES FOR TUNG-KANG FISHING HARBOR, TAIWAN Chi-Fu Su Manager Engineering Department Taiwan Fisheries Consultants, Inc. Taipei, Taiwan INTRODUCTION Tung-Kang Fishing Harbor, which is about
Plan B Dam Breach Assessment
 Plan B Dam Breach Assessment Introduction In support of the Local Sponsor permit applications to the states of Minnesota and North Dakota, a dam breach analysis for the Plan B alignment of the Fargo-Moorhead
Interim Operating Procedures for SonTek RiverSurveyor M9/S5
 Hydroacoustics Technical Working Group: Task 2.3 Fully operationalize auto-adapting ADCPs Interim Operating Procedures for SonTek RiverSurveyor M9/S5 P Campbell, E. Jamieson, F Rainville, A Du Cap, 2014
APPENDIX C. Fluvial and Tidal Hydraulics Report
 APPENDIX C Fluvial and Tidal Hydraulics Report BUENA VISTA LAGOON ENHANCEMENT PROJECT FLUVIAL AND TIDAL HYDRAULICS ANALYSES Prepared for: SANDAG 401 B Street, Suite 800 San Diego, California 92101 Contact:
Bathymetry Data Collection for Subaqueous Soil Mapping. Maggie Payne 2 nd National Workshop on Subaqueous Soils Rhode Island August 9-12, 2010
 Bathymetry Data Collection for Subaqueous Soil Mapping Maggie Payne 2 nd National Workshop on Subaqueous Soils Rhode Island August 9-12, 2010 Overview of Method Collect tide data Collect bathymetry data
SAND BOTTOM EROSION AND CHANGES OF AN ACTIVE LAYER THICKNESS IN THE SURF ZONE OF THE NORDERNEY ISLAND
 SAND BOTTOM EROSION AND CHANGES OF AN ACTIVE LAYER THICKNESS IN THE SURF ZONE OF THE NORDERNEY ISLAND Kos'yan R. 1, Kunz H. 2, Podymov l. 3 1 Prof.Dr.,The Southern Branch of the P.P.Shirshov Institute
Technical Brief - Wave Uprush Analysis Island Harbour Club, Gananoque, Ontario
 Technical Brief - Wave Uprush Analysis RIGGS ENGINEERING LTD. 1240 Commissioners Road West Suite 205 London, Ontario N6K 1C7 October 31, 2014 Table of Contents Section Page Table of Contents... i List
Hydrodynamic Modeling of Tides and Hurricane Storm Surge for Pre- and Post-Dredging Conditions in the Lower St. Johns River, Florida
 Hydrodynamic Modeling of Tides and Hurricane Storm Surge for Pre- and Post-Dredging Conditions in the Lower St. Johns River, Florida Matthew V. Bilskie 1 1 PhD Student, University of Central Florida, Department
City of Port Aransas Shoreline Analysis and Improvements
 City of Port Aransas Shoreline Analysis and Improvements FINAL Technical Report August 24, 2016 Submitted To: City of Port Aransas Prepared for: City of Port Aransas This document is intended for planning
Tutorial for the. Total Vertical Uncertainty Analysis Tool in NaviModel3
 Tutorial for the Total Vertical Uncertainty Analysis Tool in NaviModel3 May, 2011 1. Introduction The Total Vertical Uncertainty Analysis Tool in NaviModel3 has been designed to facilitate a determination
Nearshore Placed Mound Physical Model Experiment
 Nearshore Placed Mound Physical Model Experiment PURPOSE: This technical note describes the migration and dispersion of a nearshore mound subjected to waves in a physical model. The summary includes recommendations
Figure 1 Example feature overview.
 1. Introduction This case focuses on the northeastern region of Onslow Bay, NC, and includes an initial shoreline, regional contour, wave gauges, inlets, dredging, and beach fills. Most of the features
Completion of Hydrometric Survey Notes (HSN)
") Completion of Hydrometric Survey Notes (HSN) Hydrometric Survey Notes provide a place to record results and applied proper procedures for tasks undertaken in the field, such as levelling, measurements,
Completion of Hydrometric Survey Notes (HSN) Hydrometric Survey Notes provide a place to record results and applied proper procedures for tasks undertaken in the field, such as levelling, measurements,
1 st Tidal and Water Level Working Group Meeting DHN, Niteroi, Brazil 31/03/09 02/04/09 Vertical Offshore Reference Framework (VORF) Chris Jones
 Chris Jones") 1 st Tidal and Water Level Working Group Meeting DHN, Niteroi, Brazil 31/03/09 02/04/09 Vertical Offshore Reference Framework (VORF) Chris Jones United Kingdom Hydrographic Office Presentation Structure
1 st Tidal and Water Level Working Group Meeting DHN, Niteroi, Brazil 31/03/09 02/04/09 Vertical Offshore Reference Framework (VORF) Chris Jones United Kingdom Hydrographic Office Presentation Structure
Barge MM 46 Response Natchez, MS Lower Mississippi River Mile Marker 363
 UNCLASSIFIED Barge MM 46 Response Natchez, MS Lower Mississippi River Mile Marker 363 UNCLASSIFIED RRT Activation: Type of Product & Amount spilled: Cause of Spill: None Catalytic Cracked Clarified Oil
CORPS FACTS. Harbor Dredging U.S. ARMY CORPS OF ENGINEERS BUILDING STRONG
 CORPS FACTS Harbor Dredging U.S. ARMY CORPS OF ENGINEERS BUILDING STRONG Disaster Response Sedimentation in the channel is caused by the normal cycle of silt movement, erosion from high water or heavy
AUTOMATIC DREDGING PROFILE AND CONTOUR CONTROL
 AUTOMATIC DREDGING PROFILE AND CONTOUR CONTROL Jay Wise 1 ABSTRACT Phillips and Jordan, a leading excavating and disaster recovery contractor, was faced with the challenge to manage a civil contract involving
Study of Passing Ship Effects along a Bank by Delft3D-FLOW and XBeach1
 Study of Passing Ship Effects along a Bank by Delft3D-FLOW and XBeach1 Minggui Zhou 1, Dano Roelvink 2,4, Henk Verheij 3,4 and Han Ligteringen 2,3 1 School of Naval Architecture, Ocean and Civil Engineering,
STUDIES ON THE TRANQUILITY INSIDE THE GOPALPUR PORT
 STUDIES ON THE TRANQUILITY INSIDE THE GOPALPUR PORT INTRODUCTION Sundar. V 1, Sannasiraj. S. A 2 and John Ashlin. S 3 Gopalpur port is an artificial harbor located in Odisha state. The geographical location
OPERATIONS SEAFARER CERTIFICATION GUIDANCE NOTE SA MARITIME QUALIFICATIONS CODE. Deck: Chart Work
 Page 1 of 6 Compiled by Approved by Chief Examiner Syllabus Committee: 26 February 2013 OPERATIONS SEAFARER CERTIFICATION GUIDANCE NOTE SA MARITIME QUALIFICATIONS CODE Deck: Chart Work Page 2 of 6 COLUMN
Sonar Bathymetry: Waquoit Bay NERR
 Sonar Bathymetry: Waquoit Bay NERR Determining the Functional Shallow Water Limitation for an Arrival Based Sonar Frederick A. Hegg Teledyne Benthos, Inc. 49 Edgerton Drive North Falmouth, MA 02556 fhegg@teledyne.com
CLAM PASS ANNUAL RESTORATION & MANAGEMENT PLAN TIDAL ANALYSIS ELEMENT REPORT NO. 13
 CLAM PASS ANNUAL RESTORATION & MANAGEMENT PLAN TIDAL ANALYSIS ELEMENT REPORT NO. 13 Submitted to: Pelican Bay Services Division Prepared by: Humiston & Moore Engineers H&M File No. 13-078 November 2012
METHODS PAPER: Downstream Bathymetry and BioBase Analyses of Substrate and Macrophytes
 Mactaquac Aquatic Ecosystem Study Report Series 2015-006 METHODS PAPER: Downstream Bathymetry and BioBase Analyses of Substrate and Macrophytes Ben Wallace, Jae Ogilvie and Wendy Monk 17 February 2015
E4014 Construction Surveying. Hydrographic Surveys
 E4014 Construction Surveying Hydrographic Surveys Charts And Maps Hydrographic Chart an information medium and a tool for maritime traffic for the safety and ease of navigation contains information on
Homework 2a Bathymetric Charts [based on the Chauffe & Jefferies (2007)]
![Homework 2a Bathymetric Charts [based on the Chauffe & Jefferies (2007)]](/thumbs/73/69074241.jpg "Homework 2a Bathymetric Charts [based on the Chauffe & Jefferies (2007)]") 14 August 2008 MAR 110 HW-2a: ex1bathymetric Charts 1 2-1. BATHYMETRIC CHARTS Homework 2a Bathymetric Charts [based on the Chauffe & Jefferies (2007)] Nautical charts are maps of a region of the ocean
14 August 2008 MAR 110 HW-2a: ex1bathymetric Charts 1 2-1. BATHYMETRIC CHARTS Homework 2a Bathymetric Charts [based on the Chauffe & Jefferies (2007)] Nautical charts are maps of a region of the ocean
Video-Based Mapping of Oyster Bottom in the Upper Piscataqua River, Sturgeon Creek, and Spruce Creek
 University of New Hampshire University of New Hampshire Scholars' Repository PREP Reports & Publications Institute for the Study of Earth, Oceans, and Space (EOS) 1-21-2009 Video-Based Mapping of Oyster
SUBMERGED VENTURI FLUME. Tom Gill 1 Robert Einhellig 2 ABSTRACT
 SUBMERGED VENTURI FLUME Tom Gill 1 Robert Einhellig 2 ABSTRACT Improvement in canal operating efficiency begins with establishing the ability to measure flow at key points in the delivery system. The lack
Prediction of Nearshore Waves and Currents: Model Sensitivity, Confidence and Assimilation
 Prediction of Nearshore Waves and Currents: Model Sensitivity, Confidence and Assimilation H. Tuba Özkan-Haller College of Oceanic and Atmospheric Sciences Oregon State University, 104 Ocean Admin Bldg
Passage Key Inlet, Florida; CMS Modeling and Borrow Site Impact Analysis
 Passage Key Inlet, Florida; CMS Modeling and Borrow Site Impact Analysis by Kelly R. Legault and Sirisha Rayaprolu PURPOSE: This Coastal and Hydraulics Engineering Technical Note (CHETN) describes the
Marine Renewables Industry Association. Marine Renewables Industry: Requirements for Oceanographic Measurements, Data Processing and Modelling
 Marine Renewables Industry Association Marine Renewables Industry: Requirements for Oceanographic Measurements, Data Processing and Modelling October 2009 Table of Contents 1. Introduction... 1 2. Measurements
CMS Modeling of the North Coast of Puerto Rico
 CMS Modeling of the North Coast of Puerto Rico PRESENTED BY: Dr. Kelly Rankin Legault, Ph.D., P.E. 1 Dr. Alfredo Torruella, Ph.D. 2 1 USACE Jacksonville District 2 University of Puerto Rico October 2016
Technical Brief - Wave Uprush Analysis 129 South Street, Gananoque
 Technical Brief - Wave Uprush Analysis 129 South Street, Gananoque RIGGS ENGINEERING LTD. 1240 Commissioners Road West Suite 205 London, Ontario N6K 1C7 June 12, 2013 Table of Contents Section Page Table
Chapter 11 Tides. A tidal bore is formed when a tide arrives to an enclosed river mouth. This is a forced wave that breaks.
 Chapter 11 Tides A tidal bore is formed when a tide arrives to an enclosed river mouth. This is a forced wave that breaks. Tidal range can be very large Tide - rhythmic oscillation of the ocean surface
Waves, Bubbles, Noise, and Underwater Communications
 Waves, Bubbles, Noise, and Underwater Communications Grant B. Deane Marine Physical Laboratory, Scripps Institution of Oceanography UCSD, La Jolla, CA 92093-0238 phone: (858) 534-0536 fax: (858) 534-7641
Long-Term Performance of an AWAC Wave Gage, Chesapeake Bay, VA
 Long-Term Performance of an AWAC Wave Gage, Chesapeake Bay, VA P. T. Puckette G. B. Gray Evans-Hamilton, Inc. 3319 Maybank Highway Johns Is, SC 29455 USA Abstract- Evans-Hamilton, Inc. deployed a Nortek
SeaSmart. Jonathan Evans
 SeaSmart A new approach for rapid, on-site resource assessment at potential tidal stream energy array sites using MAS Marine Solutions for the Deep Data World Jonathan Evans Presentation Outline Marine
Nearshore Dredged Material Placement Pilot Study at Noyo Harbor, CA
 1 Nearshore Dredged Material Placement Pilot Study at Noyo Harbor, CA Noyo Cove N 2011 National Conference on Beach Preservation Technology 9-11, February 2011 Lihwa Lin, Honghai Li, Mitchell Brown US
Wind Flow Validation Summary
 IBHS Research Center Validation of Wind Capabilities The Insurance Institute for Business & Home Safety (IBHS) Research Center full-scale test facility provides opportunities to simulate natural wind conditions
STATIONARY SPRINKLER IRRIGATION SYSTEM
 STATIONARY SPRINKLER North Carolina Cooperative Extension Service North Carolina State University STATIONARY SPRINKLER General Guidelines Operating an irrigation system differently than assumed in the