TREASURE ISLAND PUBLIC USE MONITORING FINAL REPORT MONITORING SURVEYS
|
|
|
- Neil McDaniel
- 5 years ago
- Views:
Transcription

 412-9446 October")
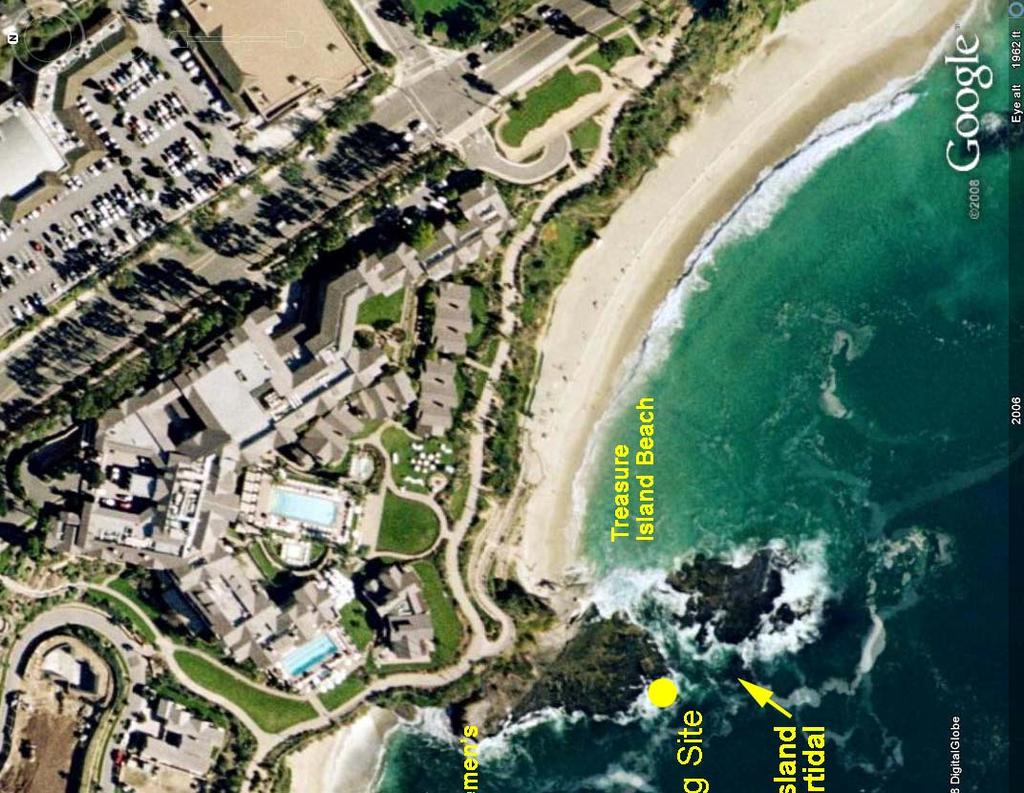
1 TREASURE ISLAND PUBLIC USE MONITORING FINAL REPORT MONITORING SURVEYS Marine Resources Monitoring Program Prepared for: City of Laguna Beach Water Quality Division 505 Forest Avenue, Laguna Beach, CA Contact: Will Holoman, Senior Water Quality Specialist (949) Prepared by: PMB 327, 3334 E. Coast Highway, Corona del Mar, CA Contact: Rick Ware, Senior Marine Biologist (949) October 12 th, 2008
2 TABLE OF CONTENTS Section Page 1.0 INTRODUCTION METHODS RESULTS Physical Site Conditions Number of People and Time Spent at Treasure Island Public Use Activities Public Use Activities Time Sequence Analysis Other Observational Data Sets DISCUSSION Implementation of Resources Protection Measures Management Recommendations LITERAURE CITED LIST OF PREPARERS LIST OF MAPS Page 1 Visitor Use Monitoring Station on the Treasure Island Rocky Intertidal Site... 2 LIST OF FIGURES Page 1 Precipitation in Laguna Beach Swell Height Data, Numbers of Groups and Numbers of People Per Hour, Numbers of Groups and Numbers of People Per Day, People Per Hour During Weekend and Weekday Survey Periods Onshore Activities Bay By Year, Offshore Activities Bay by Survey, Offshore Fishing and Other Recreational Activities, Commercial and Recreational Fishing Activity By Survey In-Water Recreational Activities By Survey, Time Block Analysis of Public Use Activities, Mussel Collection, Sport Fishing, Commercial Fishing, and Spear Fishing Activity, Estimated Number of People Visiting Treasure Island Rocky Intertidal Habitat Comparison of Visitor Use at Other Tidepools in California Seasonal Trends in Visitor Use Intensity i
3 LIST OF PHOTOGRAPHS Page 1 Tide pool signage at the base of the Goff Beach Access Ramp Tide pool signage location behind the Treasure Island Beach Access Ramp Possible area to relocate tide pool signage to achieve better public awareness of tide pool laws and regulations at the downcoast entrance to Treasure Island LIST OF TABLES Page 1 Weather Conditions, Comparison of Minimum and Maximum Daily Visitor Use Intensity Collecting, Fishing, Diving, and Marine Mammal Observations Raw Estimates of Public Use Numbers at Corona del Mar (Robert C. Badham Marine Park) And at Treasure Island LIST OF APPENDICES 1 Pre-and-Post Resort Opening Use Intensity Data, May 2002 through Dec Pre-and-Post Resort Opening Weekend and Weekday Data 3 Pre-and Post Resort Opening Public Use Activity Data 4 Number of Groups and Individuals Per Hour, Year 1-5 Monthly Public Use Graphics ii
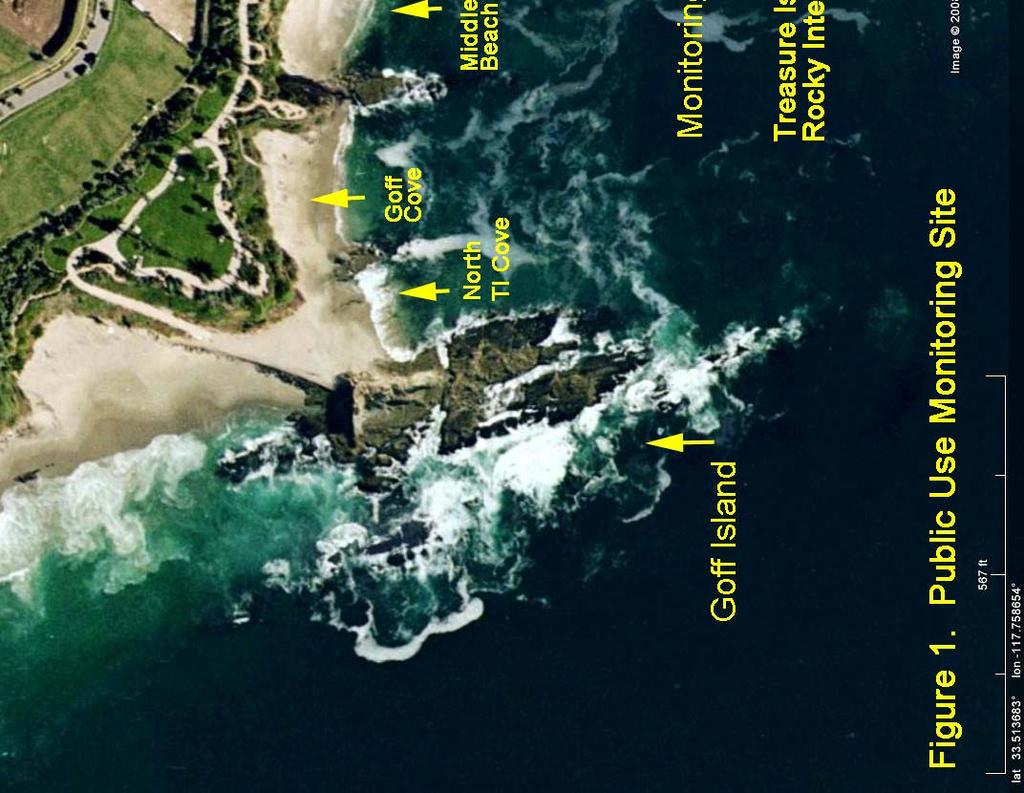
4 PUBLIC USE SURVEYS OF THE SHORELINE AND WATERS OF TREASURE ISLAND 1.0 INTRODUCTION (CRM) conducted public use surveys at Treasure Island, Laguna Beach, California between May 2002 and December This program was conducted as part of the Treasure Island Marine Resources Monitoring Program for the construction and operation of the Montage Resort (Coastal Resources Management 1999), under contract to the City of Laguna Beach. The purpose of the investigation was to assess public use intensity and activities prior to and following the opening of the Montage Resort to assist in the long-term management of Treasure Island marine biological resources. This report focuses on public use intensity and the types of activities that visitors engage in while on the shoreline, or in the nearshore waters in the vicinity of Treasures Island and Goff Island between May 2002 through December 2006 and incorporates the data collected during both the pre-resort opening monitoring surveys (May 2002 to February 2003 and four years following the opening of the Montage Resort (February 2003 to December 2006). 2.0 METHODS Field surveys were conducted along the shoreline between Goff Island and Treasure Island between 0800 to 1600 hours four times a month between May 2002 and December Two weekend days and two weekdays were surveyed each month. During the majority of surveys, a single observer was able to conduct the surveys although during peak summer use periods a second observer assisted the primary observer. The primary observer was positioned on an elevated backshore platform located on Treasure Island Beach (Photograph 1). From this vantage point the observer could record the number of visitors and their shoreline use habitats between Goff Island and the downcoast end of Treasure Island Beach at the downcoast ramp to the Montage Resort. The only blind spot was the west (upcoast) side of Goff Island behind Goff Rock. Data were collected by the observer in two-hour time blocks. The types of data collected included visitor use intensity and activity types. Visitor use intensity data included the number of groups and individuals within a group, and the duration of stay for both groups and individuals. Activity types that were recorded included Tidepooling, intertidal animal/plant collecting (physically removing organisms and taking them from tidepools), handling intertidal organisms (physically removing organisms and putting them back into the tidepools), trampling (walking over intertidal habitat where organisms were 1
5 2
6 present), commercial and sport fishing offshore of Treasure Island, sport fishermen along the shoreline of Treasure Island and Goff Island, spear fishing, personal water craft (PWC) usage, swimming, snorkeling and SCUBA diving, sitting/sunbathing, beach exercising, and photography. Occasionally during high peak use periods, it was impossible to accurately record the total number of people using the beaches. Therefore, people counts were made during 15 minute intervals, throughout each hour. The highest counts were then used to determine the number of people and groups on site during those time periods. Other data collected during the field surveys included site conditions (swell height estimated, general weather conditions, and the lowest tide level during the survey), biological information (gray whale, bottlenose dolphin, and California sea lion sightings), and illegal collection of plants and animals. Field data were tabulated on pre-formatted data forms. Field data were then checked for errors, and entered into Excel spread sheets. Summary statistical information developed for the program were calculated for group size, numbers of individuals, group and individual time spent at the beach, and for each type of monitored public use activity. 3.0 RESULTS Number of Surveys. A total of 218 surveys were conducted over five years of monitoring. These included 33 during the pre-operational period of the Montage Resort (May 2003-February 2003), 48 during Year 2 (February 2003-February 2004), 47 in Year 3 (February 2004-February 2005), 51 in Year 4 (February 2005-February 2006) and 39 in Year 6 (February 2006-December 2006). Of the total 218 surveys, 109 (50%) occurred during weekdays and 109 (50%) occurred during weekends. 3.1 SITE PHYSICAL CONDITIONS Weather Conditions. Table 1 summarizes the weather conditions during the five-years of surveys. Surveys were conducted under clear skies between 33% and 47.1% of the time, while overcast conditions were encountered between 31.3% and 45.5% of the time. Remaining surveys were conducted during mixed, sunny- to -overcast conditions. Surveys were not conducted during rainfall events. Year/Number of Surveys General Weather Table 1. General Weather Conditions During Surveys 2002 n=33 % 2003 n=48 % 2004 n=47 % 2005 n=51 % 2006 n=39 % Sunny Overcast Mixed
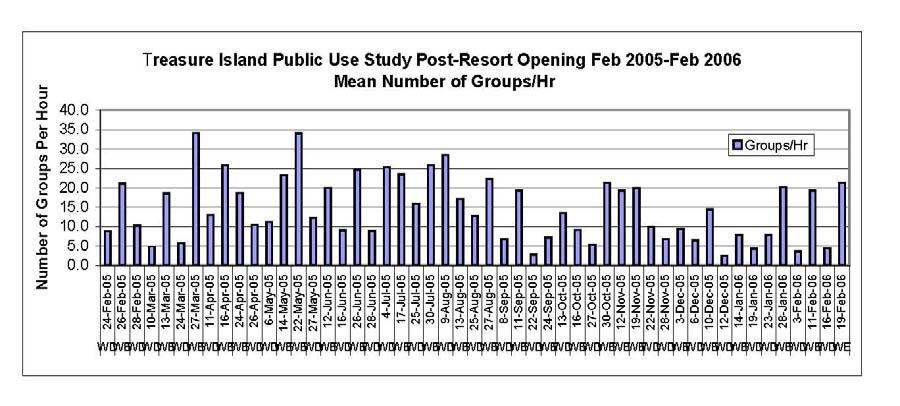
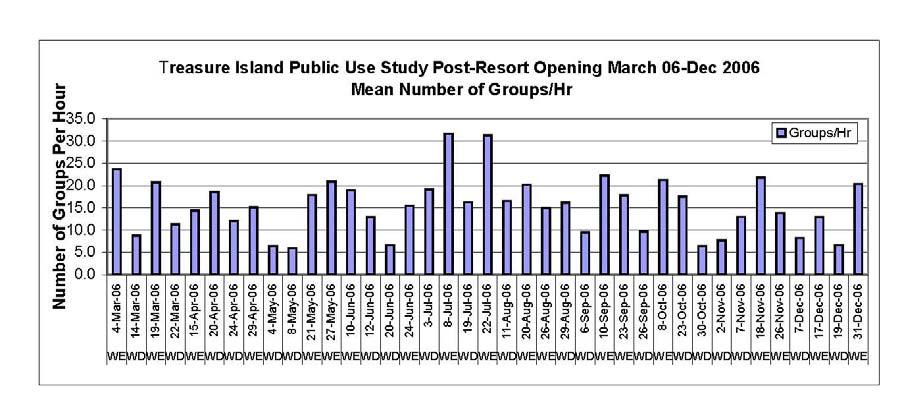
7 Precipitation. Figure 1 illustrates the amount of rainfall between 2002 and The amount of rainfall varied between one of the lowest rainfall years on record ( , 2.83 inches) to one of the highest rainfall years on record ( , inches). Figure 1. Rainfall Amount (Inches) July 2002-June 2003 Precipitation in Laguna Beach, OC Monitoring Station FIPS06059, Laguna Beach, CA Source: Weather Source.com 8.14 July 2003-June July 2004-June July 2005-June 2006 Inches of Precipitation 2.83 July 2006-June 2007 Rainfall Year (July through June) Tides. Surveys were conducted over the course of eight-hour days, and therefore, the tidal conditions during the surveys were highly variable. The average lowest tide during the 218 surveys was 1.1 (ft) Mean Lower Low Water (MLLW) and ranged from -1.7 to 2.3 ft, while the average highest tide during the surveys was 4.5 ft, ranging from 3.6 to 6.9 ft MLLW was based on NOAA tidal datum information for Corona del Mar, California. Swell and Surf Conditions. The range of swell and surf conditions (summarized by size classes) during the 218 surveys are shown in Figure 2. One to three foot (1-3 ft) surf was frequently encountered, although surf in the 1-2 ft, 2-3, and 2-4 ft surf classes were also common. These size classes accounted for 89.9% of the conditions during the 218 surveys. Periodic high wave episodes between five and eight feet were encountered 22 times (10.1%) between August 2002 and February During these periods, few individuals were in the tidepools. Beginning in 2004, when surf conditions or tide conditions were dangerous to swimmers and tide poolers, City of Laguna Beach Lifeguards would close off the rocky areas to prevent injuries and drownings. 3.2 NUMBER OF PEOPLE AND TIME SPENT AT TREASURE ISLAND Figure 3 illustrates the number of groups per hour during the pre resort (2002) and postresort opening period ( ). Figure 4 illustrates the number of groups and visitors on a daily basis. Tabular data for each year are presented in Appendices 1-3. Graphics, by year, are presented in Appendix 4. 4
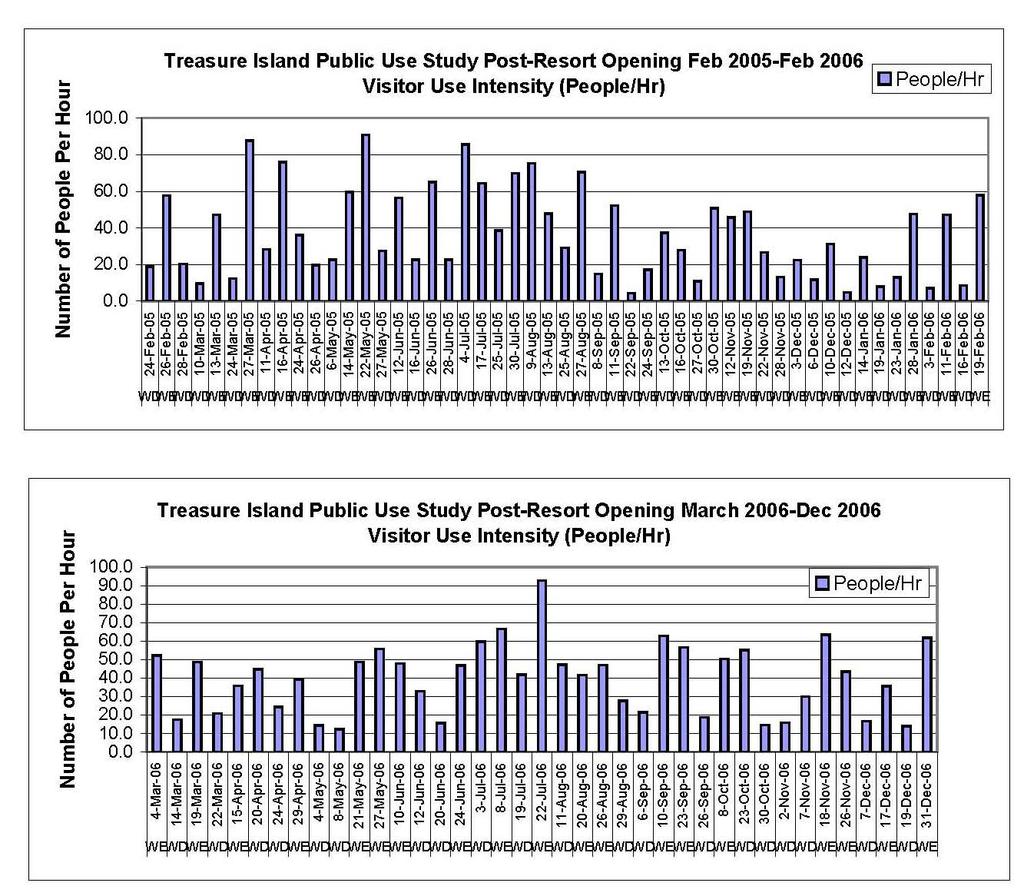
8 Figure 2. Swell/Surf Heights, Pre-Montage Opening. The number of public visitor-groups observed at Treasure Island ranged from 1.4 to 16.9 groups/hr, averaging 7.4/hr (n=33 surveys); highest numbers of groups occurred during the summer, and numbers declined during the early winter period with the exception of low tide periods in November and December Average group size was 2.1 individuals. On a daily basis, the number of groups that visited the shoreline during the pre-opening period of the Montage Resort was 58.9 (Figure 4). The mean number of people/hr (visitor use intensity) during the pre-opening period was 16.8, and ranged between 2.4 to 48.5 on 24 Jan 2003 and 8 June 2002, respectively. Visitors spent, on the average, 21.9 minutes (n=33 days) at the beach but the variation in time spent on the beach varied between a few minutes to several hours. On a daily basis, the average number of visitors during the pre-opening period was (Figure 4). Post-Montage Opening. During the year following the opening of the Montage Resort the number of groups and visitors increased over three-fold (Figures 3 and 4) compared to pre-resort opening surveys. The number of groups/hr averaged 23.1 and ranged between 3.4 (20 Feb 03 immediately before the resort opened) and 61 on 4 July 03. The number of visitors/hr during 2003 averaged 55.2 (441 per day), and ranged between 5.6 on 20 Feb 2003 to a maximum of on 13 July 2003 (48 to 1,168 visitors per day). 5
9 Figure 3. Number of Groups and Number of People Per Hour During Each of the Monitoring Years 6
10 Figure 4. Number of Groups and Number of People Per Day During Each of the Monitoring Years Duration of stay decreased slightly from 21.9 minutes in the pre-opening period compared to 19.8 minutes after the resort was opened. On a daily average, the mean number of individuals within each group was only slightly larger after the opening of the resort (2.2, n=48 surveys) than before the resort was opened (2.1, n=33 surveys). In the four years following the opening of the Montage Resort ( ), visitor use was between 2.2 and 2.7 times greater than the pre-opening survey (Figures 3 and 4). Group size ranged between 14.7 to 17.5 groups/hr (117.4 to groups/day) visitor use intensity varied between 37.1/hr to 44.7/hr (297 to visitors/day). Compared to the first year after the opening of the resort (2003), the numbers of groups and visitors in 7
11 declined to between 72% and 81% of the 2003, first-year, post resort opening values (Figure 3 and 4). Mean group size increased linearly between 2002 and 2006, between 2.1 visitors per group (2002) to 2.4 individuals per group (2006). The number of minutes each group spent on the shoreline was 21.9 prior to the opening, and ranged from 19.6 (2003) to 21.6 (2005). In addition, visitor use patterns at Treasure Island shifted from high use intensity primarily during summer prior to the opening of the resort, to year-around use following the opening of the resort between 2003 and 2006 (Appendix 4). Post-summer use of the beach between Memorial Day and Labor Day decreased during both pre-and postopening periods although use intensity generally remained higher after the resort was opened than before the resort was opened (Appendix 4). Weekend Vs Weekday Use. An analysis of weekend and weekday visitor use intensity during each monitoring year, and by survey is shown in Figure 5. Trend analysis indicated that visitor use climbed significantly during both weekends and weekdays following the opening of the resort in 2003, followed by a slight decline in visitor use in the following three post-resort opening surveys (Figure 5). All post-resort visitor use intensity values were higher than pre-resort year values, although the greatest degree of change in visitor use occurred during the weekends compared to the pre-resort opening period. Weekday use was on the average, twice as high in the four years of post-resort opening surveys compared to pre-resort weekday monitoring surveys, ranging between 1.7 times higher in 2005 to 2.7 times higher in Post-resort weekend use was on the average 3 times greater than before the resort was opened, ranging between 2.5 times greater in 2005 to 3.5 times greater in Peak weekday and weekend use occurred in the year following the opening of the resort on February 2003, with weekday averages of 36.7 visitors/hour and weekend averages of 70.9 visitors per hour. While the yearly average weekend use of the Treasure Island shoreline was consistently greater than during the weekdays (Figure 5), individual survey data results indicated that weekend use was not consistently higher than weekdays on a survey-to-survey basis. During the pre-resort monitoring period, weekend use was 1.5 times higher than weekday use. In the following four years of monitoring after the resort was opened, visitors used Treasure Island, on the average, twice as often on weekends than on weekdays, ranging from 1.9 to 2.6 times greater in 2003 and 2004, respectively. Pre-resort opening minimum and maximum visitor use intensity (Table 3) ranged from a low of 2.5/hr in December 2002, to a maximum visitor use intensity of 48.2 in June Post-resort opening number of visitors on a survey basis ranged from as low as 3.5/hr in December 2004, to a high of 146/hour in July 2003 (Table 3). 8
, 2002-2006 Year Weekend Low Weekend High Weekday Low Weekday High 2002 2.5 (Dec) 48.5 (June) 4.")
12 Figure 5. Comparison of Weekday and Weekend Public Use Intensity by Monitoring Year and Survey Table 2. Minimum and Maximum Daily Visitor Use Intensity (Visitors Per Hour), Year Weekend Low Weekend High Weekday Low Weekday High (Dec) 48.5 (June) 4.5 (Oct) 27 (June) (Pre-Resort Opening) (Dec) (July) 9.6 (Oct) (July) Resort opened February 22-23, (Dec) 105 (Mar/July) 9.8 (Feb) 71.8 (Aug) (Sept) 90.9 (May) 4.4 (Sept) 85.5 (July) (Dec) 92.6 (July) 12.3 (May) 59.6 (July 9
13 3.3 PUBLIC USE ACTIVITIES Onshore Activities. Tidepooling and other recreational activities observed during the five-years of monitoring are shown in Figure 6, by survey year and in Figure 7 by weekend and weekday surveys. Activities included general tidepooling (visitor present in rocky intertidal habitat) and then tidepooling subsets that included organism collecting and handling, and trampling. Although collecting and handling data were separately tallied, their combined tally is reported individually as well as combined, because the ability to distinguish between the two behaviors was sometimes limited. The amount of tidepooling activity (number of people tidepooling per hour) was substantially greater during the post-resort opening surveys, when the range of visitors/hr varied between 24 (2005) and 27.6 (2004) compared to the post-resort opening period use at 6.6/hr (Figure 6). This represented a four-fold increase in the amount of tidepooling activity compared to the pre-resort opening period. On a survey basis however, the number of visitors varied between less than 1/hr during winter periods to nearly 70/hr during spring and summer periods. High numbers were also observed during fall-to-early winter low tide periods (Figure 7). The amount of organism collecting decreased from an average of 2.3 times/hr prior to the opening of the resort to between 0.3 to 0.5 times/hr during the four post-resort opening monitoring surveys. This represented a substantial decline in the amount of collecting compared to the 2002 pre-resort opening surveys. Handling organisms, and returning the organisms to the tidepools averaged 0.9 times/hr prior to the resort opening, and increased to between 4 and 5.4 times greater during the post-resort opening surveys, averaging 5.6 times greater in the post-resort opening periods. Combined, the amount of organism collecting and handling doubled between the pre-andpost resort opening periods; handling accounting for most of the observed changes. This combined group of activities varied between 3.2 times/hr (pre-opening) to a maximum of 5.9 times/hour in the first year following the resort opening (Figure 6). The amount of collecting and handling however, decreased incrementally during each successive year of post-resort opening monitoring, between 2004 and However, there was an overall 5.7 fold increase in the amount of combined collecting and handling activity compared to the pre-resort opening period. Trampling of intertidal habitats, defined by visitors walking over soft-bodied organisms and algae, doubled between the pre-and-post resort opening period 4.6/hr (2002) to 10.2 times/hr (2003). Concurrent with the observed decrease in collecting and handling following peak levels in 2003, trampling also incrementally decreased between 2004 and 2006, by nearly one-third compared to the 2003 peak trampling period. Levels of onshore, sandy beach recreational use (sitting/sunbathing, exercising, taking photographs, and dog walking) are presented in Figure 6 and 7 that illustrate greater shoreline beach use following the opening of the resort. Sunbathing/beach sitting on the increased by a factor of 5.5 between 2003 and 2006, compared to the period prior to the 10

14 resort opening. Increase factors for other activities were: exercising, 5x; photography, 17x; and dog walking, 3x. These activities displayed high rates during spring and summer weekend days although the shoreline was actively utilized for each of these activities year around. Figure 6. Onshore Activities, By Year

15 Figure 7. Onshore Activities, By Survey Note: Solid lines are polynomial trend lines 12
 to a low of 0.1/hr in 2004 and 2005.")
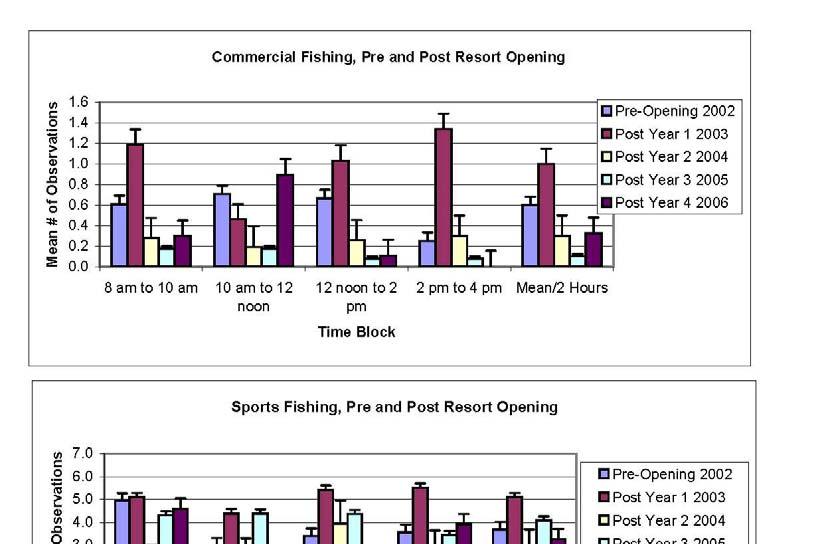
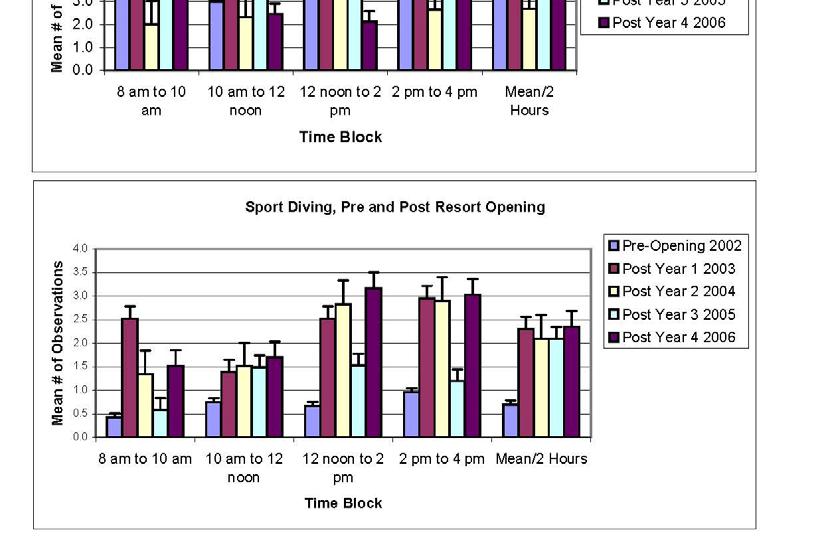
16 Figure 7 (Continued) Fishing Activities. The amount of commercial fishing vessel activity ranged from 0.2 times/hr (during the pre-resort opening period and during the post-report 2003 and 2006 surveys) to a low of 0.1/hr in 2004 and Non-fishing periods in general, reflected the closure of the commercial lobster fishing season between mid-march to early October (Figure 9) although pots were observable throughout the exclusion period and commercial fishing vessels were observed year around. Numerous traps were set along the periphery of the Treasure Island rocky intertidal platform and Goff Reef platforms. Commercial fishing habitats did not differ between weekends and weekdays. Offshore sport fishing was not affected by the opening of the resort (Figure 8), but did fishing activity did increase during the weekends. It was however, a year-around activity (Figure 9). Sport fishing vessels out of Dana Point regularly fished Goff Reef, as did recreational fishermen in private vessels. Shoreline fishing activity occurred primarily on Goff Island and the western and southern edge of the main Treasure Island intertidal reef platform. Additional information regarding shoreline fishing is described in Section 3.5. Offshore Recreational Activity. Diving (SCUBA and snorkeling), the use of personal water craft (kayaks, wave runners, surfboards, paddleboards, and sailboats), and swimming were common but low-intensity, in-water activities at Treasure Island throughout all five monitoring years (Figure 8). Each of these activities increased once 13
.")
17 Figure 8. Offshore Fishing Activity and Other Recreational Activities the resort was opened. Diving activity increased 2.5 times compared to pre-resort opening with greater numbers occurring on weekends compared to weekdays (Figure 10). The use of personal water craft increased by an average factor of 3, and swimming in the Treasure Island coves increased nearly 4 times compared to the pre-resort opening survey. These activities were generally seasonal, occurring more in spring and summer and during the weekends compared to weekdays. 14

18 Figure 9. Commercial and Recreational Fishing Activity By Survey PUBLIC USE ACTIVITY TIME SEQUENCE ANALYSIS Figure 11 illustrates shoreline and offshore activities in the recorded two-hour time blocks between 8 am to 4 pm. Following the opening of the resort, there was a temporal shift in beach activity from the early morning to the mid-to-late afternoon time periods. The data indicate that general tidepooling activities increased during all periods except for the 8 am to 10 am time period, and that tidepooling was most common during the afternoon. Similarly, trampling and collecting/handling activity, sunbathing/beach sitting, photography, and sport diving occurred at peak levels mid-to-later in the afternoon. Exercising occurred throughout the day. Activities that were not time-dependent and which did not exhibit increases in use intensity included commercial and sport fishing activities. These were independent of any shoreline activities associated with beach access or the Montage Resort. 15

19 Figure 10. In-Water Recreational Activities By Survey


20 Figure 11. Time Block Analysis of Treasure Island Activities, n=33 surveys 2002; 48 surveys 2003; 47 surveys 2004; 51 surveys Year 4; and 39 surveys
21 Figure 11 (Continued) 18
22 3.5 OTHER OBSERVATIONAL DATA SETS A summary of specific activities and marine mammal observations made during each of the five year of monitoring is presented in Table 3. Figure 12 illustrates yearly trends for mussel collecting, shore fishing, offshore recreational fishing, commercial lobstering, and spear fishing. These observations, tallied through the course of each of the field surveys represented a separate survey effort beyond the tallying of data within time blocks. Recorded activities included mussel collecting, the number of people fishing from the shoreline, sports fishermen from vessels, the number of commercial lobster fishing vessels, diving spear fishermen (with or without SCUBA), marine mammal observations, and SCUBA deaths observed around Treasure Island. California Mussel Collecting. Mussels (Mytilus californianus) are used as a source of bait for shore fishermen who use fresh bait rather than bringing store-bought frozen bait or worms. This activity promotes additional loss of mussels and the community of invertebrates and algae associated with the mussel bed because it weakens the capability of mussels to hold on to rocky substrate and leaves mussels more susceptible to the effects of wave action. The seaward edges of rock platforms on Treasure Island rocky intertidal platform, the headlands of Middlemen s Cove, and Goff Island show patterns of mussel clearing. Incidences of mussel collecting averaged 1.6/day prior to the opening of the resort, and ranged from 1.5/day (2006) to 3.6/day (2003) in the four post-resort opening monitoring surveys with an increase factor of 1.4. The frequency of mussel collecting declined between 2004 and 2006, to levels observed prior to the opening of the resort (Table 3). On a daily basis, up to 25 incidences/day were recorded over the fiveyear monitoring period. Shore Fishing. Shore fishing occurred primarily off the seaward edge of the Treasure Island rocky intertidal platform and Goff Island, but some fishermen fished off the sandy beaches in the coves. The intensity of shore fishing increased by a factor of 1.9 during the four post-resort monitoring surveys, with fishing intensity varying between a minimum of 3.9 fishermen/day prior to the opening of the resort, to a maximum of 10.5 fishermen/day in the months following the opening of the resort (Table 3). In each successive post-resort opening survey between 2004 and 2006, shore fishing intensity exceeded the pre-resort opening levels. The maximum number of shore fishermen observed was 33/day in March, Species commonly observed caught by shore fishermen included kelp bass (Paralabrax clathratus), barred sand bass (P. nebulifer), and black perch (Embiotoca jacksoni). Two incidences of fishermen catching and keeping garibaldi (Hypsypops rubicundus) were recorded, both on Goff Island. These incidences were reported by the field observers to California Department of Fish and Game warden. 19
23 Table 4. Collecting, Fishing, Diving, and Marine Mammal Observations Total Number and Average Per Day For Each Observation Year May February 2003 February February 2004 February February 2005 February February 2006 March Dec 2006 All Years n=33 surveys n=48 surveys n=47 surveys n=51 surveys n=39 surveys n= 218 surveys OBSERVATION Mussel Collecting 53 (1.6 per day) 173 ( 3.6 day) 91 (1.9/day) 90 (1.8/day) 53 (1.5 day) 460(2.1/day) Sports Fishermen on 128 (3.9/day) 504 (10.5/day) 204 (4.3/day) 416 (8.2/day) 233 (6.0/day) 1485 (6.8/day) the Shoreline of Treasure Island and Goff Island Sports Fishermen 221 (7.1/day) 254 (5.3/day) 218 (4.6/day) 310 (6.1/day) 138 (3.5/day) 1141 (5.2/day) Offshore of Treasure Island and Goff Island Commercial Lobster 43 (1.4/day) 66 (1.4/day) 46 (1/day) 13 (0.3/day) 63 (1.6/day) 231 (1.1/day) Fishing Vessels Number of Diving 30 (1.3/day) 85 (1.8/day) 65 (1.4/day) 106 (2.1/day) 84 (2.2/day) 370 (1.7/day) Spear Fishermen Gray Whale 7 (0.2/day) 15 (0.3/day) 3 (0.1/day) 14 (0.3/day) 17 (0.4/day) 56 (0.3/day) Sightings Bottlenose Dolphin 13 (0.4/day) 50 (1/day) 21 (0.4/day) 47 (0.9/day) 17 (0.4/day) 148 (0.7/day) Sightings Sea Lion Sightings 6 (0.2/day) 12 (0.3/day) 22 (0.5/day) 19 (0.4/day) 24 (0.6/day) /day) SCUBA Death incident (0.005/day) City 20of Laguna Beach Treasure Island


24 Figure 12. Mussel Collection, Sport Fishing, Commercial Fishing, and Spear Fishing Activity, Sports Fishermen Offshore. The number of fishermen observed on party boats offshore of Goff Reef was lower in each of the post-resort monitoring surveys than the pre-resort monitoring surveys. Offshore fishing intensity varied from a maximum of 7.1 fishermen/day in 2002, to a minimum of 3.5 fishermen/day in Up to 70 fishermen were recorded on a single day, offshore of Goff Island in February Commercial Lobster Fishing Vessels. The number of commercial lobster fishing vessels trips around the Treasure Island reefs averaged 1.1 vessels/day for the four year post resort monitoring survey effort, ranging from 0.3/day in 2004 to 1.6/day in The pre-resort value for number of commercial fishing vessels in the area (1.4/day) was exceeded only once in the post-resort monitoring period (2006, 1.6/day). Up to 27 vessel trips were observed during a single survey at the beginning of lobster season in October Spear Fishermen (Diving). Both spear guns and pole spears were used by divers (snorkelers and on SCUBA), although pole spears appeared to be used more often. Also, spear fishermen tended to be teenagers who often fished in groups. In once instance spear fishers were observed to shoot undersized fish. Spear fishing increased an average of 1.5 times over the pre-resort opening value (1.3 spear fishermen/day), ranging from 1.4 spear fishermen/day in 2004, to a maximum of 2.2 fishermen/day in A maximum of 13 spear fishermen were observed during a single survey, in June These observations indicated that mussel collecting and sport fishing activities along the shoreline remained elevated throughout the four post resort monitoring years, whereas the numbers of party boat fishermen and commercial lobster vessel trips were lower than, or equal the level of activity prior to the opening of the resort. 21
25 Marine Mammals. Two hundred and thirty two marine mammals were sighted during the five years of shoreline monitoring (Table 3), including 56 gray whales (Eschrichtius robustus, 0.3/day), 148 bottlenose dolphins (Tursiops truncatus, 0.7/day), and 83 sea lions (Zalophus californicus, 0.4/day). The number of marine mammal sightings was greatest during the second and fourth monitoring year, each at 1.6 mammals/day. 22
26 4.0 DISCUSSION Public use of the Treasure Island shoreline and nearshore waters was monitored prior to the opening of the Montage Resort (May 2002 through February 20 th, 2003), and during four post-resort opening years between February 21 st, 2003 and December 31 st, 2006 as part of the City of Laguna Beach Marine Resources Management Program. The effort included a total of 1,744 hours of observational surveys over 218 days that produced a substantial data base of information of how the public utilized the Treasure Island shoreline and nearshore waters prior to and following the opening of the Montage Resort. Treasure Island s shoreline and waters were used by the public year-around during the five-year monitoring program. The demographics included a mix of local southern California residents and out-of-area visitors to Laguna Beach. The ability of the public to access the shoreline was a major factor that influenced public use of the tidepools. The area where the Montage Resort and Spa now resides was previously a private a mobile home park that severely limited public access to the beach below. The City of Laguna Beach and the Montage Resort and Spa developed an open space component allowing for extensive public access on the Montage property, as well as the shoreline below the cliff. The shoreline is now highly accessible from the Montage Resort by two paved ramps, a stairway to Midldlemen s Beach, and by walking along the sandy beach upcoast or downcoast to Treasure Island. Previously, access other than for the residents and guests of the mobile home park was limited primarily to using the beach route. Visitors are attracted to the Treasure Island shoreline because of a diverse mix of geographic and biological features. The high cliffs provide unobstructed panoramic views of the coastline, Catalina Island, and the Pacific Ocean. Child-friendly sandy beaches, protected coves, and rocky intertidal platform reefs are easily accessible from the sandy beach. Once on the shoreline, the public participated in a range of passive and active recreation of which tidepool exploring and sunbathing were the common activities. The shallow reefs and sandy nearshore waters were fished from the shoreline s rocky platforms and sandy beaches, as well as from fishing vessels out of Dana Point or Newport harbors. Water sports such as SCUBA diving, snorkeling, and the use of personal water craft (kayaks, wave runners, paddleboards, and small sailboats) occurred regularly in the vicinity of Treasure Island. The nearshore reefs of Treasure Island as well as the deeper Goff Island Reef supported commercial lobster fishing. Projected numbers of people who visited Treasure Island in each year of the monitoring are shown in Figure 13 to illustrate the change in public usage prior to and following the opening of the Montage Resort. This data is not a strict census, but rather provides a relative indication of changes in public use over the five-year monitoring period relative to the length of the Treasure Island shoreline (61 meters, Kido and Murray, 1999). The data suggest that prior to the opening of the resort in 2002/2003, approximately 31,235 people/100 meters of shoreline participated in tidepool activities at Treasure Island, After the resort was opened, that number increased to between 113,583 to people/100 meters of rocky shoreline. Comparative analysis using other studies numbers is difficult, since the methodologies have been different (Ambrose and Smith 2006, Kido and 23
27 Murray, 1999; Rosaler, 2007; Tenera, Figure 14 summarizes visitor use numbers for other areas along the California Coast. Table 5 summarizes the numbers of people estimated to use Robert C. Badham Marine Park (Little Corona) tidepools between 2004 and Figure 13. Estimated Number of Tidepool Visitors to Treasure Island, Per 100 Meters of Shoreline Estimated Number of People Visiting Treasure Rocky Intertidal Habitat (All Elevations) Between May 2002 and December 2006 Based Upon Number of Individuals Observed Per Day During Each Survey Number of Tide Pooler Visitors Per 100 M of Shoreline 140, , ,000 80,000 60,000 40,000 20, , , , , , Figure 14. Comparison of Visitor Use at Other Tidepools in California. Source: Kido and Murray in: Rosaler, 2007) 24
28 Table 5. Raw Estimates of Public Use Numbers at Corona del Mar (Robert C. Badham Marine Park) And at Treasure Island Source: Amy Stine, City of Newport Beach Refuge Supervisor and CRM, this report Year Number Breakdown 4,000 in classes plus 1,000 not in classes 8,000-10,000 students, 73, 000 not in classes 8,000-10,000 students, 73, 000 not in classes 8,000-10,000 students, 73, 000 not in classes 8,000-10,000 students, 73, 000 not in classes Little Corona Total 5,000 83,000 max 83,000 max 83,000 max 83,000 max Methods of Counts Numbers from school visits that go through reservations Numbers from school visits that go through reservations. Numbers from school visits that go through reservations. Numbers from school visits that go through reservations. Numbers from school visits that go through reservations. Treasure Island 19,272 71,248 80,592 70,080 73,876 Methods of Count Timed counts of all tide pool areas for four, 2-hour period; standardized to counts per day and year Timed counts of all tide pool areas for four, 2-hour periods; standardized to counts per day and year Timed counts of all tide pool areas for four, 2-hour periods; standardized to counts per day and year Timed counts of all tide pool areas for four, 2-hour periods; standardized to counts per day and year Timed counts of all tide pool areas for four, 2-hour periods; standardized to counts per day and year 25
29 Using different methodologies, both Kido and Murray (2003) and Rosaler (2007) suggested that Treasure Island is one of the most intensely used rocky intertidal shorelines along the southern California Coast. This study suggests that numbers are extremely high compared to other areas and if not the most intensively used sites, it ranks among the top of the list of other well-visited rocky intertidal sites in southern California. The combination of increased public access through a series of paved ramps, adequate parking, and the attractiveness of the shoreline s features resulted in a sustained increase in the number of people who (1) visited Treasure Island s shoreline as well as the number of people that (2) engaged in tidepooling and other activities over the four-year post resort monitoring period compared to the pre-resort opening period. Table 4 summarizes the level of changes recorded between the pre-and-post resort monitoring surveys. An increase in public use of the shoreline and nearshore waters will exert greater environmental pressures on tide pool and fishery resources. These pressures include an increase in the illegal collection of tide pool plants and animals, picking up and handling tide pool organisms, trampling vegetation and tide pool organisms, legal and illegal sport fishing from the shoreline, and increased levels of spear fishing while SCUBA or skin diving. These increases translate into increased pressure on the health, diversity, abundance, and community composition of both intertidal and subtidal biological resources. Visitors used Treasure Island year-around with peak numbers occurring over the summer months (Figure 14). However, visitor use was moderate throughout winter, spring, and autumn despite cooler temperatures and a reduction of tourists. The opening of the resort in 2003 however, moderated the reduction of visitors during off-peak times compared to pre-resort opening periods and contributed to the year-around use of the shoreline and tidepools. Significant rainfall (over 28 inches) occurred during the July 2004-June 2005 rainfall season. This may have contributed to a reduction in observed use intensity and behaviors of beach-goers, fishermen, and those engaged in water activities during the October 2004 through March 2005 period. Low tide periods attract visitors to the tidepools particularly between October and March, but higher tides between March and September during the day did not result in lower beach usage or the tidepooling activity. In fact, because the tides are higher during peak summer periods, the density of tide poolers will increase in the mid-to-high tide zones placing a greater degree of trampling pressure on these habitats and organisms. Weekend days are the busiest year-around, although visitor use during summer weekdays is constant and high. During the fall, weekdays can also exhibit high visitor use due to the abundance of afternoons with low-tides. 26
30 Table 4. Observed Changes in Public Use Patterns at Treasure Island, Average Increase or Decrease in Activity Level Post-Montage Resort Opening (n=33 surveys, 10 months) vs Activity (n=185 surveys, 48 months) (less than 1.0 is a decrease) Number of people/hr at Treasure Island 2.7x Number of people/hr tidepooling 3.8x Handling/collecting organisms 5.7x Trampling soft-bodied organisms and plants 1.7x Mussel collecting 1.4x Shore fishing 1.9x Offshore Sport Fishing 0.7x Commercial Lobster Fishing 0.8 x SCUBA/snorkeling 2.5x Use of personal water craft 2.9x Swimming 3.9x Sunbathing/sitting on shoreline 6x Dog walking 3x Photography 17.1 Figure 15. Seasonal Trends in Visitor Use Intensity Number of People Per Hour By Month May 2002-December 2006 n=218 surveys Mean Number of People Per Hour Jan Jan Feb Feb Mar Mar Apr Apr May Jun Jun Jun Jul Jul Month People/Hr Poly. (People/Hr) Aug Aug Sep Sep Oct Oct Nov Nov Dec Dec Dec 27
31 Year-around human pressures such as trampling, removing and replacement organisms from their habitat, and illegally collecting shoreline resources is occurring at levels that are greater than those measured prior to the opening of the Montage Resort and Spa (Table 4). These impacts can decrease abundances of both plants and animals which result in lower densities and altered age sizes within a population, and changes in intertidal community structure (Murray et al. 1999; Kido and Murray 2003, Zedler 1978). These losses also lessen educational opportunities for children and the public s enjoyment of tidepool areas. 4.1 IMPLEMENTATION OF RESOURCE PROTECTION MEASURES FOR TREASUR ISLAND During the last five years, elements of the City s Treasure Island Marine Resources Monitoring Plan (Coastal Resources Management, 2000) were implemented by the City of Laguna Beach and the Montage Resort and Spa to (1) establish a greater degree of tide pool enforcement through the use of lifeguards and a full-time City of Newport Beach Marine Protection Officer (2) establish a tide pool docent and education program at Treasure Island, and (3) post tide pool etiquette signage throughout the tide pool areas. Progress in the implementation of these items are discussed below. Public Safety and Enforcement. From a public safety perspective, the City of Laguna Beach s Marine Safety Department established lifeguard stations at Goff Beach and downcoast at Treasure Island Beach. This has assisted in increasing public awareness of tide pool collection laws and also increasing the level of public safety. During large swell events and/or high tide, the Treasure Island tidepools are closed off to the public by the lifeguards. This activity in effect, provides some measure of protection not only for the public, but temporarily for the marine resources during high tides. The City implemented a Marine Protection Officer program in Among the many duties, the MPO has educational duties providing talks to schools, as well as enforcement duties patrolling the City of Laguna Beach shoreline. The MPO is also actively involved in the management of intertidal areas, who has the authority to ticket violators of State tide pool regulations under Public Resource Code 36710(a): This code says: it is unlawful to injure, damage, take or possess any living or nonliving marine resources for commercial exploitation purposes. Any human that would compromise protection of the species of interest, natural community or habitat, or geological, cultural or recreational features, may be restricted by the designating entity or managing agency. All other uses are allowed, including scientific collection with a permit, research, monitoring and public recreation (including recreational harvest, unless otherwise restricted). Public use, enjoyment and education are encouraged, in a manner consistent with protecting resource values However, enforcing tide pool regulations are difficult to enforce (personal communications Calla Allison, City of Laguna Beach Marine Protection Officer and Jeff Rosaler, Ocean Laguna Foundation, R. Ware, pers. observations). Although the City adopted a new ordinance that states it is unlawful to disturb the tidepool habitat which 28
32 assists to clarify jurisdictional issues, (Rosaler, 2007), the ability of the MPO to respond to specific violations called in by the Tidepool Educators, CRM field biologists during public use surveys, or others that call in for assistance is extremely limited because of the MPO s need to be patrolling the entire Laguna Beach shoreline. When present however, the MPO has proven effective at curtailing adverse uses of the tidepools at Treasure Island (R. Ware, pers. obs, S. Whitaker, pers. obs.) The public is encouraged to report illegal collecting activities by contacting the City of Laguna Beach Marine Protection Officer (949) or the California Department of Fish and Game CALTIP Hotline Number (see below). The CALTIP program is a confidential secret witness program to encourage the public to provide the Department of Fish and Game factual information leading to the arrest of poachers and polluters. The caller is eligible for a cash reward if his/her information leads to a citation or an arrest. The toll free telephone number operates 24 hours a day, 7 days a week. To report unlawful activity, call CalTIP at DFG-CALTIP ( ). The public can access the Department of Fish and Game website to obtain additional information at ( Public Education. Increased public education was identified in the Treasure Island Marine Resources Management Plan as being a key component the long-term management of Treasure Island s marine resources (Coastal Resources Management, 2000). Beginning in 2003 the Ocean Laguna Foundation began providing general education for the public at the Treasure Island Seashore, through their Tidewater Docent program (Ocean Laguna Foundation, 2006). The volunteer run program had volunteer Tidewater Docents onsite up to 20 times a month, for a period of three hours a day. In June, 2006, a Tidepool Educator program was started in June of 2006 by the Ocean Laguna Foundation (Rosaler, 2007). The program provides on site education to the general public concerning the intertidal areas of Treasure Island and Goff Island. This program is a response to the need for continual enforcement and education of the Treasure Island Intertidal ecosystem. One full time position was created to over see the project, and two part time positions were filled to provide extra help during high use time periods. The Tidepool Educators provided increased awareness of the protection of the area as well as in depth knowledge of the organisms and ecology of the ecosystem. A total of 1,544 hours was spent by educators on-site from June 2006 through May During that period 29,363 visitors were observed and 18,268 were approached by program staff for educational interaction (Rosaler, 2007). Over the course of the year, the staff witnessed 1,205 infractions of the City s posted tidepool rules and handed out tide pool etiquette brochures. Tidepool Educators were on-site whenever the tide was below 2.5 feet. The CRM surveys, conducted in a different manner with a different purpose, took into account all levels of the tidal zones and surveys were conducted eight hours a day, four times a month. August saw the greatest amount of people on-site (73/hr). The fall, especially September stayed busy with over 34 people per hour, comparable to July (37) and surpassing June (23). The remainder of the year stayed relatively busy with December-May having a surprisingly steady rate of visitation throughout the year. 29
33 Public use monitoring data collected during this study between indicated that while there has been a substantial increase in tidepooling activity and shore fishing, some behaviors of visitors have been modified over the last few years related to reduced collecting, handling, and trampling activity. Although levels are still higher than that observed prior to the opening of the resort, this trend may correlate to the implementation of the Ocean Laguna Tidewater Docent Program and the Tidewater Educator Program which appears to in part, has had a positive influence on visitors that may have resulted in less direct take of organisms and a better awareness of the marine environment. Tide Pool Signage. Tide pool information signs have been installed at the base of ramps leading to the beaches at Goff Beach, Middleman Beach, and Treasure Island. Examples of signage are shown in Photographs 1 and 2. These placard signs are offset to the side of the ramps; many people may bypass the information. The small signs at Goff Island are located immediately in front of the tidepools and are in better locations to inform the public of tide pool regulations. While the larger tidepools signs at the base of the ramps are informative, they are not optimally placed for all visitors (i.e., for the public that do not use the hotel s access ramp to get to the tidepools and access Treasure Island tidepools from upcoast and downcoast beaches (i.e., Aliso Beach). Additionally, the signs do not address the multi-cultural nature of the southern California s population, which is multi-lingual. 4.2 MANAGEMENT RECOMMENDATIONS Elevated levels of public use at Treasure Island require that the site be actively managed to reduce the potential for long-term, adverse effects on marine intertidal and subtidal resources. The following recommendations are suggested to assist in protecting and enhancing Treasure Island marine resources. Public Safety and Enforcement Expansion of the Marine Protection Officer Program is recommended to enhance the ability to apply uniform marine protection throughout coastal Laguna Beach. Due to the extremely high numbers of visitors, a local MPO specific to the local Treasure Island and South Laguna area would assist in curtailing tide pool code violations. Publicize the arrest and prosecution of individuals who flagrantly violate tide pool collecting and sport fishing laws in Marine Life Parks Public Education The Ocean Laguna Tidepool Educator program is an asset to Treasure Island. This program should be maintained and enhanced to provide additional outreach to visitors to Treasure Island, particularly during summer periods, fall and autumn low tides, and holidays. 30


34 Signage Recommendations set forth in the Treasure Island Marine Management Plan (CRM 2001) suggest that some signage be posted in languages other than English because Orange County is an extremely diverse cultural community. CRM strongly suggests that at least two signs be added, one in Spanish, and one in Vietnamese. Reaching non-english speaking residents is important, since many visitors who come to fish (for subsistence or recreation) and enjoy the tidepools may not speak English as their first language, and who may not understand or know about local tide pool and fishing regulations. Improve the ability of people to read the signs, and their effectiveness in getting the message across to the public. CRM suggests that signs could be relocated closer to the tidepools (Photograph 3), and perhaps, printed on both sides of the signage. Photograph 1. Tide pool signage at the base of the Goff Beach Access Ramp 31


35 Photograph 2. Tide pool signage location behind the Treasure Island Beach Access Ramp Photograph 3. Possible area to relocate tide pool signage to achieve better public awareness of tide pool laws and regulations at the downcoast entrance to Treasure Island 32
36 5.0 LITERATURE CITED Coastal Resources Management Treasure Island marine resources management plan. Laguna Beach, Ca. Prepared for the Athens Group, Phoenix, Az. July Kido, Janine S. and Stephen N. Murray Variation in owl limpet Lottia gigantea population structures, growth rates, and gonadal production on southern California rocky shores. Mar Ecol Prog Ser 257: Murray, Stephen N., T Denis, J. Kido, and J. Smith Human visitation and the frequency and potential effects of collecting on rocky intertidal populations in southern California marine reserves. Cal Coop Fish Invest Rep 40: Rosaler, Jeffrey, Laguna Ocean Foundation Tidepool Education. Interpretive Program at the Treasure Island Seashore. Prepared for Montage Resort and Spa, Laguna Beach, California. 25 pp. plus appendices State of California Public Resource Code, Chapter 7. Articles 1 and 2. Marine Managed Areas Improvement Act LIST OF PREPARERS Rick Ware, Principal Investigator Stephen Whitaker, Staff Marine Biologist/Field Team Leader 33
37 APPENDIX 1 Pre Resort Opening Use Intensity Survey May 02-Feb 03 Day Type Date # of Groups Groups/Hr People/Day Mean Size Total Time (min) Min/Grip People/Hr People Per Day 1 WE 25-May WE 26-May WE 8-Jun WE 29-Jun WD 30-Jun WD 9-Jul WE 18-Jul WD 20-Jul WE 2-Aug WE 10-Aug WD 25-Aug WE 30-Aug WD 8-Sep WD 25-Sep WD 27-Sep WD 29-Sep WD 11-Oct WD 24-Oct WE 25-Oct WD 26-Oct WE 12-Nov WD 23-Nov WE 27-Nov WE 30-Nov WD 1-Dec WE 12-Dec WD 14-Dec WE 18-Dec WE 11-Jan WD 12-Jan WD 24-Jan WD 29-Jan WD 6-Feb Survey Day Type Date # of Groups Groups/Hr People Per Day Mean Size Total Time Min/Grip People/Hr People Per Day Total Mean Std Dev Number of Surveys Lower Range Upper Range Median
38 Survey Feb 03- Feb 04 Appendix 1 (Continued) Post-Resort Opening, Year 2 Surveys Survey Type Date # of Groups Groups/Hr N Per /Day Mean Size Total Time (min) Min/Grip People/Hr People/Day 34 WD 2/20/ WE 2/22/ WE 2/23/ WD 3/7/ WD 3/19/ WE 3/23/ WE 3/29/ WD 4/8/ WE 4/12/ WD 4/16/ WE 4/19/ WD 5/15/ WE 5/24/ WD 5/26/ WE 5/31/ WE 6/15/ WD 6/20/ WD 6/23/ WE 6/28/ WD 7/4/ WE 7/13/ WD 7/24/ WE 7/27/ WD 8/13/ WE 8/17/ WD 8/27/ WE 8/31/ WD 9/1/ WD 9/16/ WE 9/20/ WE 9/28/ WD 10/10/ WE 10/18/ WE 10/25/ WD 10/31/ WD 11/14/ WE 11/16/ WD 11/26/ WE 11/30/ WE 12/13/ WE 12/14/ WD 12/16/ WE 12/20/ WD 1/6/
39 78 WD 1/9/ WE 1/18/ WE 1/24/ WE 2/7/ Summary Post-Resort Year 2 # of Groups #Groups/Hr N/Day Mean Size Duration (min) Min/Grip People/Hr People/Day Total Mean Std Dev Number of Surveys Lower Range Upper Range Median
40 Survey Number Feb 04-Feb 05 Appendix 1 (Continued) Post Resort Opening Year 3 Surveys Day Type Date Groups #Groups/Hr Total N Mean Size Duration (min) Min/Grip People/Hr 82 WD 2/20/ WD 2/27/ WE 2/29/ WE 3/13/ WD 3/22/ WD 3/23/ WE 3/28/ WE 4/3/ WD 4/16/ WD 4/21/ WE 4/24/ WE 5/15/ WD 5/17/ WE 5/29/ WD 6/14/ WE 6/20/ WE 6/26/ WD 6/28/ WD 7/7/ WE 7/17/ WE 7/24/ WD 7/26/ WD 8/10/ WE 8/21/ WE 8/29/ WD 8/31/ WE 9/12/ WD 9/16/ WD 9/20/ WE 9/25/ WD 10/15/ WD 10/22/ WE 10/24/ WE 10/30/ WE 11/14/ WD 11/17/ WD 11/23/ WE 11/28/ WE 12/5/ WD 12/8/ WE 12/11/ WD 12/13/ WE 1/2/ WD 1/5/ WD 1/13/ WE 1/15/ WE 2/13/
41 Summary Post-Resort Year 3 Groups #Groups/Hr Total N Mean Size Duration (min) Min/Grip People/Hr Total Mean Std Dev Number of Surveys Lower Range Upper Range Median
42 Appendix 1 (Continued) Post Resort Opening Year 4 Surveys Survey Number Feb 05-Feb 06 Day Type Date # of Groups Group Per Hour Total N Mean Size Duration (min) Min/Grip People/Hr 129 WD 24-Feb WE 26-Feb WD 28-Feb WD 10-Mar WE 13-Mar WD 24-Mar WE 27-Mar WD 11-Apr WE 16-Apr WE 24-Apr WD 26-Apr WD 6-May WE 14-May WE 22-May WD 27-May WE 12-Jun WD 16-Jun WE 26-Jun WD 28-Jun WD 4-Jul WE 17-Jul WD 25-Jul WE 30-Jul WD 9-Aug WE 13-Aug WD 25-Aug WE 27-Aug WD 8-Sep WE 11-Sep WD 22-Sep WE 24-Sep WD 13-Oct WE 16-Oct WD 27-Oct WE 30-Oct WE 12-Nov WE 19-Nov WD 22-Nov WD 28-Nov WE 3-Dec WD 6-Dec WE 10-Dec WD 12-Dec WE 14-Jan WD 19-Jan
43 174 WD 23-Jan WE 28-Jan WD 3-Feb WE 11-Feb WD 16-Feb WE 19-Feb Summary Post-Resort Year # of Groups Group Per Hr Total N Mean Size Duration (min) Min/Grip People/Hr SUMMARY Total Mean Std Dev Number of Surveys Lower Range Upper Range Median
44 Appendix 1 (Continued) Post Resort Opening Year 5 Surveys March-Dec 06 Survey Number Day Type Date # of Groups Groups/Hr Total N Mean Size Duration Min/Grip People/Hr 180 WE 4-Mar WD 14-Mar WE 19-Mar WD 22-Mar WE 15-Apr WD 20-Apr WD 24-Apr WE 29-Apr WD 4-May WD 8-May WE 21-May WE 27-May WE 10-Jun WD 12-Jun WD 20-Jun WE 24-Jun WD 3-Jul WE 8-Jul WD 19-Jul WE 22-Jul WD 11-Aug WE 20-Aug WE 26-Aug WD 29-Aug WD 6-Sep WE 10-Sep WE 23-Sep WD 26-Sep WE 8-Oct WD 23-Oct WD 30-Oct WD 2-Nov WD 7-Nov WE 18-Nov WE 26-Nov WD 7-Dec WE 17-Dec WD 19-Dec WE 31-Dec
45 Summary Post- Resort Year All Surveys # of Groups Groups/Hr Total N Per Day Mean Size Duration Min/Grip People/Hr Total Mean Std Dev Number of Surveys Lower Range Upper Range Median % CI
46 APPENDIX 2 Weekday and Weekend Public Use Comparison PRE-OPENING WEEKEND SURVEYS Year 1 Day Type Date # of GroupsGroups/Hr Total N Mean Total Time (Min) Min/Grip People/Hr WE May 25, WE May 26, WE June 8, WE June 29, WE July 18, WE August 2, WE August 10, WE August 30, WE October 25, WE November 12, WE November 27, WE November 30, WE December 12, WE December 18, WE January 11, Total Mean/Day Std Dev Number of Survey Days Lower Range Upper Range
47 PRE-OPENING WEEKDAY SURVEYS Year 1 Day Type Date # of Groups #Groups/Hr Total N Mean Total Time (Min) Min/G rip People/Hr WD June 30, WD July 9, WD July 20, WD August 25, WD September 8, WD September 25, WD September 27, WD September 29, WD October 11, WD October 24, WD October 26, WD November 23, WD December 1, WD December 14, WD January 12, WD January 24, WD January 29, WD February 6, Total Mean/Day Std Dev Number of Survey Days Lower Range Upper Range Median
48 POST-RESORT OPENING, YEAR 2 WEEKEND BREAKDOWN Day Type Date # of Groups #Groups/Hr Total People (N) Mean Total Time (Min) Min/Grip People/Hr WE 22-Feb WE 23-Feb WE 23-Mar WE 29-Mar WE 12-Apr WE 19-Apr WE 24-May WE 31-May WE 15-Jun WE 28-Jun WE 13-Jul WE 27-Jul WE 17-Aug WE 31-Aug WE 20-Sep WE 28-Sep WE 18-Oct WE 25-Oct WE 16-Nov WE 30-Nov WE 13-Dec WE 14-Dec WE 20-Dec WE 18-Jan WE 24-Jan WE 7-Feb # of Groups #Groups/Hr Total People (N) Mean Total Time (Min) Min/Grip People/Hr Total Mean/Day Std Dev Number of Survey Days Lower Range Upper Range Median
49 RESORT POST OPENING, YEAR 3 SURVEYS WEEKDEND DATA, FEBRUARY 2004-FEBRUARY 2005 Day Type Date Groups #Groups/Hr Total N Mean Size Duration (min) Min/Grip People/Hr WE 2/29/ WE 3/13/ WE 3/28/ WE 4/3/ WE 4/24/ WE 5/15/ WE 5/29/ WE 6/20/ WE 6/26/ WE 7/17/ WE 7/24/ WE 8/21/ WE 8/29/ WE 9/12/ WE 9/25/ WE 10/24/ WE 10/30/ WE 11/14/ WE 11/28/ WE 12/5/ WE 12/11/ WE 1/2/ WE 1/15/ WE 2/13/ Groups #Groups/Hr Total N Mean Size Duration (min) Min/Grip People/Hr Total Mean Std Dev Number of Surveys Lower Range Upper Range Median
50 RESORT POST OPENING, YEAR 3 SURVEYS WEEKDAY DATA, FEBRUARY 2004-JANUARY 2005 Day Type Date Groups #Groups/Hr Total N Mean Size Duration (min) Min/Grip People/Hr WD 2/20/ WD 2/27/ WD 3/22/ WD 3/23/ WD 4/16/ WD 4/21/ WD 5/17/ WD 6/14/ WD 6/28/ WD 7/7/ WD 7/26/ WD 8/10/ WD 8/31/ WD 9/16/ WD 9/20/ WD 10/15/ WD 10/22/ WD 11/17/ WD 11/23/ WD 12/8/ WD 12/13/ WD 1/5/ WD 1/13/ Groups #Groups/Hr Total N Mean Size Duration (min) Min/Grip People/Hr Total Mean Std Dev Number of Surveys Lower Range Upper Range Median
51 Survey Number 2005 YEAR 4 POST-RESORT OPENINING BREAKDOWN WEEKDAY Day Total N Type Date # of Groups Groups/Hr Per Day Mean Size Duration Min/Grip People/Hr 129 WD 24-Feb WD 28-Feb WD 10-Mar WD 24-Mar WD 11-Apr WD 26-Apr WD 6-May WD 27-May WD 16-Jun WD 28-Jun WD 4-Jul WD 25-Jul WD 9-Aug WD 25-Aug WD 8-Sep WD 22-Sep WD 13-Oct WD 27-Oct WD 22-Nov WD 28-Nov WD 6-Dec WD 12-Dec WD 19-Jan WD 23-Jan WD 3-Feb WD 16-Feb Weekday Groups #Groups/Hr Total N Mean Size Duration (min) Min/Grip People/Hr SUMMARY Total Mean Std Dev Number of Surveys Lower Range Upper Range Median
52 Survey Number 2005 YEAR 4 POST-RESORT OPENING WEEKEND BREAKDOWN Day Total N Type Date # of Groups Groups/Hr Per Day Mean Size Duration Min/Grip People/Hr 130 WE 26-Feb WE 13-Mar WE 27-Mar WE 16-Apr WE 24-Apr WE 14-May WE 22-May WE 12-Jun WE 26-Jun WE 17-Jul WE 30-Jul WE 13-Aug WE 27-Aug WE 11-Sep WE 24-Sep WE 16-Oct WE 30-Oct WE 12-Nov WE 19-Nov WE 3-Dec WE 10-Dec WE 14-Jan WE 28-Jan WE 11-Feb WE 19-Feb Weekend Groups #Groups/Hr Total N Mean Size Duration (min) Min/Grip People/Hr SUMMARY Total Mean Std Dev Number of Surveys Lower Range Upper Range Median
53 2006 Weekday Breakdown, Year 5 Post-Resort Opening Survey Number Day Type Date # of Groups Mean Size Duration Min/Grip People/Hr 181 WD 14-Mar WD 22-Mar WD 20-Apr WD 24-Apr WD 4-May WD 8-May WD 12-Jun WD 20-Jun WD 3-Jul WD 19-Jul WD 11-Aug WD 29-Aug WD 6-Sep WD 26-Sep WD 23-Oct WD 30-Oct WD 2-Nov WD 7-Nov WD 7-Dec WD 19-Dec Weekday Surveys # of Groups Mean Size Duration Min/Grip People/Hr Total Mean Std Dev Number of Surveys Lower Range Upper Range Median % CI
54 Survey Number Day Type Date 2006 Year 5 Weekend Breakdown # of Groups Mean Size Duration Min/Grip People/Hr 180 WE 4-Mar WE 19-Mar WE 15-Apr WE 29-Apr WE 21-May WE 27-May WE 10-Jun WE 24-Jun WE 8-Jul WE 22-Jul WE 20-Aug WE 26-Aug WE 10-Sep WE 23-Sep WE 8-Oct WE 18-Nov WE 26-Nov WE 17-Dec WE 31-Dec Weekend # of Groups Mean Size Duration Min/Grip People/Hr Total Mean Std Dev Number of Surveys Lower Range Upper Range Median % CI
55 52
56 APPENDIX 3. Pre-Resort Opening Public Use Activity (n=33 surveys) Sitting Tidepooling Collecting Handling Trampling Comm. Fish. Sport Fishing Total Mean/Day Std Dev Median Lower Range Upper Range Freq of Occ % of Observations Diving Exercising Photography Dog PWC Swimming Walking Total Mean/Day Std Dev Median Lower Range Upper Range Freq of Occ % of Observations
57 Year 2 Post-Resort Opening Public Use Activities (n=48 surveys) Time Period Sitting Tidepooling Collecting Handling Trampling Comm. Fish. Sport Fishing Total Mean/Day Std Dev Median Lower Range Upper Range Freq of Occ % of Observations Time Period Diving Exercising Photography Dog PWC Swimming Walking Total Mean/Day Std Dev Median Lower Range Upper Range Freq of Occ % of Observations
58 Year 3 Post Resort Opening Public Use Activities Breakdown (n=47 surveys) Sitting Tidepooling Collecting Handling Trampling Comm. Fish. Total Mean Std Dev Median Lower Range Upper Range Freq of Occ % of Observations Sport Fishing Diving Exercising Photography Dog Walking PWC Swimming Total Mean Std Dev Median Lower Range Upper Range Freq of Occ % of Observations
59 56
60 YEAR 4 Post-Resort Opening Public Use Activities Breakdown n=51 surveys Sitting Tidepooling Collecting Handling Trampling Comm. Fish. Total Mean Std Dev N Min Max Median % CI Sport Fishing Diving Exercising Photography Dog Walking PWC Swimming Total Mean Std Dev N Min Max Median % CI
61 YEAR 5 POST RESORT OPENING PUBLIC USE ACTIVITIES BREAKDOWN N=39 SURVEYS Sitting Tidepooling Collecting Handling Trampling Comm. Fish. Total Mean Std Dev N Min Max Median % CI Total Sport Fishing Diving Exercising Photography Dog Walking PWC Swimming Total Mean Std Dev N Min Max Median % CI


62 Appendix 4. Number of Groups Per Hour,
63 60

64 Appendix 5. Visitor Use Intensity,
65 . 62
Orange County MPA Watch A n n u a l R e p o r t
 Orange County MPA Watch 2 0 1 5 A n n u a l R e p o r t WHAT IS AN MPA? Marine Protected Areas (MPAs) are discrete geographic marine or estuarine areas designed to protect or conserve marine life and habitat.
Orange County MPA Watch A n n u a l R e p o r t
 Orange County MPA Watch 2 0 1 4 A n n u a l R e p o r t WHAT IS AN MPA? Marine Protected Areas (MPAs) are discrete geographic marine or estuarine areas designed to protect or conserve marine life and habitat.
Orange County MPA Watch M o n i t o r i n g H u m a n U s a g e
 Orange County MPA Watch M o n i t o r i n g H u m a n U s a g e WHAT IS AN MPA? Marine Protected Areas (MPAs) are discrete geographic marine or estuarine areas designed to protect or conserve marine life
Orange County MPA Watch 2016 A n n u a l R e p o r t
 Orange County MPA Watch 2016 A n n u a l R e p o r t WHAT IS AN MPA? Marine Protected Areas (MPAs) are discrete geographic marine or estuarine areas designed to protect or conserve marine life and habitat.
Orange County MARINE PROTECTED AREAS
 Orange County MARINE PROTECTED AREAS Orange County Coastkeeper QUARTERLY REPORT 7/1/2013 9/30/2013 WHAT IS THE OC MPA WATCH PROGRAM? The Orange County Marine Protected Area (OC MPA) Watch Program enlists
Orange County MARINE PROTECTED AREAS
 Orange County MARINE PROTECTED AREAS Orange County Coastkeeper QUARTERLY REPORT 1/1/ 2013 3/30/12 2013 WHAT IS THE OC MPA WATCH PROGRAM? The Orange County Marine Protected Area (OC MPA) Watch Program enlists
4 th Quarter 2014 Report OC MPA Watch Program Orange County Coastkeeper
 4 th Quarter 2014 Report OC MPA Watch Program Orange County Coastkeeper Intro January 1 st, 2012 was the implementation date for the South Coast MPAs from Point Conception to the Mexican border. The Orange
Orange County MARINE PROTECTED AREAS 3 rd Quarter 2015 Report
 Orange County MARINE PROTECTED AREAS 3 rd Quarter 2015 Report Page 1 of 7 WHAT IS THE OC MPA WATCH PROGRAM? The Orange County Marine Protected Area (OC MPA) Watch Program enlists volunteers, community
Orange County MARINE PROTECTED AREAS 2 nd Quarter 2016 Report
 Orange County MARINE PROTECTED AREAS 2 nd Quarter 2016 Report Page 1 of 7 WHAT IS THE OC MPA WATCH PROGRAM? The Orange County Marine Protected Area (OC MPA) Watch Program enlists volunteers, community
Orange County MPA Watch Program Quarterly Report (Jan 1 March 31, 2012)
") Orange County MPA Watch Program Quarterly Report (Jan 1 March 31, 2012) What is the OC MPA Watch Program? The Orange County Marine Protected Area (OC MPA) Watch Program enlists volunteers, community groups
Orange County MPA Watch Program Quarterly Report (Jan 1 March 31, 2012) What is the OC MPA Watch Program? The Orange County Marine Protected Area (OC MPA) Watch Program enlists volunteers, community groups
Enforcement and Compliance within South Coast Marine Protected Areas
 STATE OF THE CALIFORNIA SOUTH COAST SUPPLEMENTAL REPORT ENFORCEMENT AND COMPLIANCE Enforcement and Compliance within South Coast Marine Protected Areas Proper enforcement of, and compliance with, marine
3. Haystack Rock (Cannon Beach)
") 3. Haystack Rock (Cannon Beach) Site Description: 0.4 miles of intertidal habitat and offshore rocks at Cannon Beach. Haystack Rock is located at approximately 45.8845 N, 123.9680 W, next to (and accessible
3. Haystack Rock (Cannon Beach) Site Description: 0.4 miles of intertidal habitat and offshore rocks at Cannon Beach. Haystack Rock is located at approximately 45.8845 N, 123.9680 W, next to (and accessible
Eelgrass Survey Reporting Form 2222 Channel Road Newport Beach, CA Eelgrass (Zostera marina) Survey
 Survey") Eelgrass Survey Reporting Form 2222 Channel Road Newport Beach, CA 92660 Eelgrass (Zostera marina) Survey Survey Date: July 19th, 2013 Report Date: July 26 th, 2013 Prepared by: Coastal Resources Management,
Eelgrass Survey Reporting Form 2222 Channel Road Newport Beach, CA 92660 Eelgrass (Zostera marina) Survey Survey Date: July 19th, 2013 Report Date: July 26 th, 2013 Prepared by: Coastal Resources Management,
Properties. terc.ucdavis.edu 8
 Physical Properties 8 Lake surface level Daily since 1900 The lowest lake level on record was 6,220.26 feet on Nov. 30, 1992. Since 1900, lake level has varied by more than 10 feet. Lake level typically
Agenda Item Summary BACKGROUND. Attachment 1
 Agenda Item Summary Attachment 1 BACKGROUND Oregon s recreational abalone fishery was suspended by emergency rule beginning January 1, 2018. This suspension was due to 1) low densities of red abalone,
To Fish or Not to Fish? A role-playing activity based on the Marine Reserves process at the Channel Islands National Marine Sanctuary
 To Fish or Not to Fish? A role-playing activity based on the Marine Reserves process at the Channel Islands National Marine Sanctuary Introduction This role playing activity is designed to teach you about
STATUS REPORT FOR THE SUBMERGED REEF BALL TM ARTIFICIAL REEF SUBMERGED BREAKWATER BEACH STABILIZATION PROJECT FOR THE GRAND CAYMAN MARRIOTT HOTEL
 August 23 STATUS REPORT FOR THE SUBMERGED REEF BALL TM ARTIFICIAL REEF SUBMERGED BREAKWATER BEACH STABILIZATION PROJECT FOR THE GRAND CAYMAN MARRIOTT HOTEL performed by Lee E. Harris, Ph.D., P.E. Consulting
Balance in the Bay. An introduction to ecosystem-based management and the Monterey Bay market squid fishery.
 Balance in the Bay An introduction to ecosystem-based management and the Monterey Bay market squid fishery. Original Artwork Ray Troll & NOAA/2008 Fisheries Management Sustaining the greatest number of
Habitat Fact Sheets. Rocky habitats are dominated by seaweeds and often mussels, which rely on the rocks for attachment.
 Habitat Fact Sheets Habitats in the Gulf of Maine serve many important roles for the environment and for humans as well. These include: cycling nutrients, filtering pollution, trapping sediments, storing
City of Encinitas Beach Attendance Report 2016
 City of Encinitas Beach Attendance Report 2016 Moonlight State Beach, July 2016 1 Introduction Since 2004, the City of Encinitas has intermittently employed counting technology to measure beach attendance.
Coastal and marine recreation in New England is ingrained in the region s economic and
 RECREATION Coastal and marine recreation in New England is ingrained in the region s economic and social fabric. Recreation on the ocean and coast includes many of New Englanders most time-honored and
ASSESSMENT OF ARTISANAL FISHING GEARS IMPACT ON KING FISH (Scomberomorus commerson) IN THE KENYAN MARINE ECOSYSTEM.
 IN THE KENYAN MARINE ECOSYSTEM.") ASSESSMENT OF ARTISANAL FISHING GEARS IMPACT ON KING FISH (Scomberomorus commerson) IN THE KENYAN MARINE ECOSYSTEM. Isaac Wafula Barasa. Division of Marine and Coastal Fisheries Kenya Fisheries Service.
ASSESSMENT OF ARTISANAL FISHING GEARS IMPACT ON KING FISH (Scomberomorus commerson) IN THE KENYAN MARINE ECOSYSTEM. Isaac Wafula Barasa. Division of Marine and Coastal Fisheries Kenya Fisheries Service.
Reducing Risk of Whale Entanglements in Oregon Dungeness Crab Gear
 Session 3 Reducing Risk of Whale Entanglements in Oregon Dungeness Crab Gear CaseID: 20150703Mn NMFS MMHSRP Permit #: 18786 Overview West Coast Information Framing the problem Summary of West Coast large
Compiled by Uwe Dornbusch. Edited by Cherith Moses
 REPORT ON WAVE AND TIDE MEASUREMENTS Compiled by Uwe Dornbusch. Edited by Cherith Moses 1 Aims...1 2 Summary...1 3 Introduction...1 4 Site selection...1 5 Wave recorder settings...2 6 Results...2 6.1 Water
2015 Winnebago System Walleye Report
 215 Winnebago System Walleye Report Adam Nickel, Winnebago Gamefish Biologist, March 216 As winter passes in the rear view mirror, it won t be long until the spring rush of the 216 walleye run is here.
Case Study 3. Case Study 3: Cebu Island, Philippines MPA Network 10
 Case studies of mpa networks Case Study 3: Cebu Island, Philippines MPA Network 10 Location and background Cebu Island in the Philippines lies in the center of the Visayan Islands, known as an area high
Purple Sea Urchin Barrens
 Purple Sea Urchin Barrens Nancy, Cassie and Jessica Pattern Sea Urchins existing in two stable states. Crevices along coastlines feeding on kelp litter that drifts by Emerged from the crevices creating
West Coast Rock Lobster. Description of sector. History of the fishery: Catch history
 West Coast Rock Lobster Description of sector History of the fishery: The commercial harvesting of West Coast rock lobster commenced in the late 1800s, and peaked in the early 1950s, yielding an annual
COASTAL HABITATS & FISHERY RESOURCES CORON, PALAWAN
 COASTAL HABITATS & FISHERY RESOURCES CORON, PALAWAN FISHERY RESOURCES Similar to municipalities of Taytay and El Nido, the coastal habitats and fishery resources of the municipality of Coron are continuously
Brian Cheuvront, Ph.D. SAFMC Deputy Executive Director for Management
 Brian Cheuvront, Ph.D. SAFMC Deputy Executive Director for Management
2016 West Coast Entanglement Summary
 March 2017 2016 West Coast Entanglement Summary Overview of Entanglement Data west coast region MMHSRP Permit #18786 In 2016, 71 separate cases of entangled whales were reported off the coasts of Washington,
CALIFORNIA DEPARTMENT OF FISH AND WILDLIFE RECOMMENDATIONS ON ADDITIONAL WINTER-RUN PROTECTIONS IN 2016 OCEAN FISHERIES
 Agenda Item E.1 CDFW Supplemental Report April 216 CALIFORNIA DEPARTMENT OF FISH AND WILDLIFE RECOMMENDATIONS ON ADDITIONAL WINTER-RUN PROTECTIONS IN 216 OCEAN FISHERIES In April 215, CDFW recommended
COASTAL MANAGER PERCEPTIONS OF NORTH CAROLINA BEACH VISITOR EXPERIENCES. Chris Ellis, Coastal Resources Management, East Carolina University
 COASTAL MANAGER PERCEPTIONS OF NORTH CAROLINA BEACH VISITOR EXPERIENCES Chris Ellis, Coastal Resources Management, East Carolina University Introduction This paper is part of a larger dissertation for
SARASOTA BAY ESTUARY PROGRAM OYSTER HABITAT MONITORING RESULTS: YEAR 1. Jay R. Leverone
 SARASOTA BAY ESTUARY PROGRAM OYSTER HABITAT MONITORING RESULTS: YEAR 1 by Jay R. Leverone Mote Marine Laboratory 1600 Ken Thompson Parkway Sarasota, Fl 34236 to Gary Raulerson Sarasota Bay Estuary Program
page - Laboratory Exercise #5 Shoreline Processes
 page - Laboratory Exercise #5 Shoreline Processes Section A Shoreline Processes: Overview of Waves The ocean s surface is influenced by three types of motion (waves, tides and surface currents). Shorelines
Analysis of the Red Light Camera Program in Garden Grove, CA By Jay Beeber, Executive Director, Safer Streets L.A., Member ITE
 Analysis of the Red Light Camera Program in Garden Grove, CA By Jay Beeber, Executive Director, Safer Streets L.A., Member ITE The following report is a detailed discussion of the Red Light Camera (RLC)
Monitoring Surfing Quality below the Jordan River Generating Station (Year 2)
") Jordan River Project Water Use Plan Monitoring Surfing Quality below the Jordan River Generating Station (Year 2) Reference: JORMON#5 Monitoring Surfing Quality Below the Jordan River Generating Station
Jordan River Project Water Use Plan Monitoring Surfing Quality below the Jordan River Generating Station (Year 2) Reference: JORMON#5 Monitoring Surfing Quality Below the Jordan River Generating Station
National Report on Large Whale Entanglements
 National Report on Large Whale Entanglements Confirmed in the United States in 2017 In 2017, 76 confirmed cases of large whale entanglements were documented along the coasts of the United States. Seventy
Japan s report on Paragraph 13, CMM
 Japan s report on Paragraph 13, CMM2016-04 1 Introduction: Overview of Japanese PBF fisheries 2 PBF Catch by fishing gear in Japan 1952 1954 1956 1958 1960 1962 1964 1966 1968 1970 1972 1974 1976 1978
Appendix G Whitewater Recreation Flow Study Plan
 Appendix G Whitewater Recreation Flow Study Plan Study Plan Whitewater Recreation Flow Study Grandfather Falls Hydroelectric Project FERC Project No. 1966 March 2013 An Integrys Energy Group Company Section
Two types of physical and biological standards are used to judge the performance of the Wheeler North Reef 1) Absolute standards are measured against
 Absolute standards are measured against") 1 Two types of physical and biological standards are used to judge the performance of the Wheeler North Reef 1) Absolute standards are measured against fixed value at Wheeler North Reef only 2) Relative
1 Two types of physical and biological standards are used to judge the performance of the Wheeler North Reef 1) Absolute standards are measured against fixed value at Wheeler North Reef only 2) Relative
Delaware Chapter Surfrider Foundation - Indian River Inlet Monitoring
 Delaware Chapter Surfrider Foundation - Indian River Inlet Monitoring In 2012, the Delaware Surfrider Foundation Chapter formed the Surf Quality and Access Committee to focus on issues such as surf spot
Drownings in Hawaii, A review of death certificates by the Injury Prevention and Control Program, Hawaii DOH
 Drownings in Hawaii, 99-97. A review of death certificates by the Injury Prevention and Control Program, Hawaii DOH There were 6 drownings in the state over the 5-year period, with no apparent trend over
no-take zone 1 of 5 Channel Islands National Marine Sanctuary, California
 This website would like to remind you: Your browser (Apple Safari 4) is out of date. Update your browser for more security, comfort and the best experience on this site. Encyclopedic Entry no-take zone
Travel and Rider Characteristics for Metrobus
 Travel and Rider Characteristics for Metrobus 040829040.15 Travel and Rider Characteristics for Metrobus: 2012-2015 Overview The Miami Dade County Metropolitan Planning Organization (MPO) conducted a series
Agenda Item G.1.a Supplemental CDFW Report 2 September 2015
 Agenda Item G.1.a Supplemental CDFW Report 2 September 2015 CALIFORNIA DEPARTMENT OF FISH AND WILDLIFE REPORT ON PACIFIC BLUEFIN MONITORING AND MANAGEMENT ACTIVITIES FOR RECREATIONAL AND COMMERCIAL FISHERIES
Justification for Rainbow Trout stocking reduction in Lake Taneycomo. Shane Bush Fisheries Management Biologist Missouri Department of Conservation
 Justification for Rainbow Trout stocking reduction in Lake Taneycomo Shane Bush Fisheries Management Biologist Missouri Department of Conservation December 14, 2017 Lake Taneycomo was formed by the construction
Charter Boat Fishing in Lake Michigan: 2017 Illinois Reported Harvest
 Illinois Department of Natural Resources Division of Fisheries Charter Boat Fishing in Lake Michigan: 2017 Illinois Reported Harvest Steven R. Robillard Illinois Department of Natural Resources Lake Michigan
History and Status of the Oregon Dungeness Crab Fishery
 History and Status of the Oregon Dungeness Crab Fishery History and Status of the Oregon Dungeness Crab Fishery by Darrell Demory Oregon Department of Fish and Wildlife Oregon Department of Fish and Wildlife
Factors affecting Rocky Intertidal Zonation Patterns
 Factors affecting Rocky Intertidal Zonation Patterns Intertidal Zones Immersion in seawater Emmersion in Air Tidal Patterns Biobands of intertidal algae and Animals Diversity determined in part by the
Natural Bridges Field Trip Activity
 Natural Bridges Field Trip Activity This is due in class on MONDAY- March 1 - not in sections! Name TA: NOTE ON THE GRADING OF THIS ASSIGNMENT: Many of the questions below (especially in the tidepool part)
DEPARTMENT OF FISHERIES. COMMUNITY PERCEPTIONS RESEARCH May 2013
 DEPARTMENT OF FISHERIES COMMUNITY PERCEPTIONS RESEARCH May 2013 This page has been intentionally left blank for double-sided printing. CONTENTS RECAPPING THE OBJECTIVES... 4 METHODOLOGY... 5 TESTS OF STATISTICAL
CA Department of Fish and Wildlife
 CA Department of Fish and Wildlife Mission The Mission of the Department of Fish and Wildlife is to manage California's diverse fish, wildlife, and plant resources, and the habitats upon which they depend,
Wave Prediction in the Santa Barbara Channel
 Wave Prediction in the Santa Barbara Channel OCS Study MMS 2001-055 Final Technical Summary Final Study Report U.S. Department of the Interior Minerals Management Service Pacific OCS Region Wave Prediction
Charter Boat Fishing in Lake Michigan: 2015 Illinois Reported Harvest
 Illinois Department of Natural Resources Division of Fisheries Charter Boat Fishing in Lake Michigan: 2015 Illinois Reported Harvest Steven R. Robillard Illinois Department of Natural Resources Lake Michigan
Marine Debris from Land to Sea: Holistic Characterization, Reduction and Education Efforts in New Hampshire
 Marine Debris from Land to Sea: Holistic Characterization, Reduction and Education Efforts in New Hampshire ABSTRACT Over time, the focus of marine debris research and work has shifted away from simply
95 Express Annual Operations Report: Fiscal Year
 95 Express Annual Operations Report: Fiscal Year 2014-2015 General The 95 Express Program completed its sixth full Fiscal Year of operations in June 2015. For the FDOT, its Fiscal Year (FY) is from July
To Fish or Not to Fish?
 ? This role-playing activity is based on the Marine Reserves process at the Channel Islands National Marine Sanctuary and explores the complex decision-making process for establishing marine protected
Establish interim harvest reductions that end overfishing and rebuild the spawning stock biomass by 2015.
 Interim Management Measures for Achieving Sustainable Harvest I. Issue Establish interim harvest reductions that end overfishing and rebuild the spawning stock biomass by 2015. II. Background The 2009
Traffic Safety Plan Traffic Safety Plan 2015
 Traffic Safety Plan 2015 Purpose Airdrie s last Traffic Safety Plan was created in 2011. The 2015 Traffic Safety Plan is a revised model of the traffic operations for the City of Airdrie. The purpose of
Affects of Tides on Lateral Coastal Access at. Las Varas Ranch. Gaviota, California. Photos Courtesy of California Coastal Records Project
 Affects of Tides on Lateral Coastal Access at Las Varas Ranch Gaviota, California Photos Courtesy of California Coastal Records Project September 18, 2014 Santa Barbara County Trails Council 1 As part
Proportion (%) of Total UK Adult Population (16+)s. Participating in any Watersports Activity
 of Total UK Adult Population (16+)s. Participating in any Watersports Activity") Proportion (%) of Total UK Adult Population (16+)s Participating in any Watersports Activity Headlines Participation in any activities up 2.1% point 14.3m UK adults participating Highest volume recorded
Proportion (%) of Total UK Adult Population (16+)s Participating in any Watersports Activity Headlines Participation in any activities up 2.1% point 14.3m UK adults participating Highest volume recorded
Redd Dewatering and Juvenile Salmonid Stranding in the Lower Feather River,
 Redd Dewatering and Juvenile Salmonid Stranding in the Lower Feather River, 2005-2006 Interim Report for NOAA Fisheries Prepared by: California Department of Water Resources Division of Environmental Services
Redondo Beach Boat Launch Ramp Facility
 Redondo Beach Boat Launch Ramp Facility Feasibility Report for the California Department of Boating and Waterways 2015 Grant Cycle For the City of Redondo Beach Submitted by March 13, 2014 Table of Contents
Whose Beach Is It Anyway? Managing Seals at Children s Pool, La Jolla CA. James H. Lecky Southwest Region, National Marine Fisheries Service
 Whose Beach Is It Anyway? Managing Seals at Children s Pool, La Jolla CA James H. Lecky Southwest Region, National Marine Fisheries Service Harbor seals have been hauling out and pupping on a public beach
Remote Monitoring of Dolphins and Whales in the High Naval Activity Areas in Hawaiian Waters
 DISTRIBUTION STATEMENT A: Approved for public release; distribution is unlimited. Remote Monitoring of Dolphins and Whales in the High Naval Activity Areas in Hawaiian Waters Whitlow W. L. Au and Marc
Atlantic States Marine Fisheries Commission
 Atlantic States Marine Fisheries Commission 1050 N. Highland Street Suite 200A-N Arlington, VA 22201 703.842.0740 703.842.0741 (fax) www.asmfc.org MEMORANDUM TO: FROM: American Lobster Management Board
Wisconsin 511 Traveler Information Annual Usage Summary January 3, Wisconsin 511 Phone Usage ( )
") Wisconsin 511 Traveler Information 211 Annual Usage Summary January 3, 212 Overall to-date Summary 36 months of operation 1,16,63 total calls the 1 Million mark was passed on December 3, 212 3,627,527
Wisconsin 511 Traveler Information 211 Annual Usage Summary January 3, 212 Overall to-date Summary 36 months of operation 1,16,63 total calls the 1 Million mark was passed on December 3, 212 3,627,527
Atlantic Coast of Long Island, Jones Inlet to East Rockaway Inlet, Long Beach Island, NY Construction Update
 Atlantic Coast of Long Island, Jones Inlet to East Rockaway Inlet, Long Beach Island, NY Construction Update June 2016 US Army Corps of Engineers Project Purpose Three specific damage mechanisms of coastal
Appendix 9 SCUBA diving in the sea
 Appendix 9 SCUBA diving in the sea Firth of Clyde Forum SMRTS2015 Final Report 195 March 2016 Appendix 9 SCUBA diving in the sea Table A9.1: Summary of sample confidence levels Responses Spatial data Questionnaire
IMPLEMENTING REGULATIONS OF THE WILDLIFE CONSERVATION LAW. Authorized by the Republic of China Wildlife Conservation Law, amended October 29, 1994.
 IMPLEMENTING REGULATIONS OF THE WILDLIFE CONSERVATION LAW Authorized by the Republic of China Wildlife Conservation Law, amended October 29, 1994. CHAPTER I: INTRODUCTION Section 1. The following regulations
6 th Meeting of the Scientific Committee Puerto Varas, Chile, 9-14 September 2018
 6 th Meeting of the Scientific Committee Puerto Varas, Chile, 9-14 September 218 SC6-Doc24 China s Annual Report, part II (Jumbo squid) Gang Li, Bilin Liu, Luoliang Xu & Xinjun Chen Annual Report of China
Redondo Pier Alternate Site Activity
 Name: Section: Redondo Pier Alternate Site Activity (Fisherman s Wharf, Redondo Beach, CA 90277) Lab 14C-1 The purpose of this activity is for you to participate in water sampling. We will examine ocean
Recommendations for Pennsylvania's Deer Management Program and The 2010 Deer Hunting Season
 Recommendations for Pennsylvania's Deer Management Program and The 2010 Deer Hunting Season March 7, 2010 Prepared for The Pennsylvania Game Commission Board of Commissioners By John Eveland RECOMMENDATIONS
CHAPTER 8 ASSESSMENT OF COASTAL VULNERABILITY INDEX
 124 CHAPTER 8 ASSESSMENT OF COASTAL VULNERABILITY INDEX 8.1 INTRODUCTION In order to assess the vulnerability of the shoreline considered under this study against the changing environmental conditions,
Stony Creek Creel Census
 Stony Creek Creel Census conducted for Division of Fisheries Illinois Department of Conservation 600 North Grand Ave. West Springfield, IL 62706 by R. Weldon Larimore, Principal Investigator Jack A. Swanson,
County of Orange Resources and Development Management Department Harbors, Beaches and Parks. Strategic Plan. HBP Strategic Plan Workshop 1.
 County of Orange Resources and Development Management Department Harbors, Beaches and Parks Strategic Plan HBP Strategic Plan Workshop 1 v18 PRESENTATION OUTLINE Harbors, Beaches & Parks (HBP) History
Warm-up # 7 A day 5/17 - B day 5/18 UPDATE YOUR TABLE OF CONTENTS
 Warm-up # 7 A day 5/17 - B day 5/18 UPDATE YOUR TABLE OF CONTENTS Question: List all examples of surface water on Earth. Answer: Rivers and streams, lakes and reservoirs, (ponds) wetlands, estuaries and
Eastern Shore Islands Area of Interest Community Newsletter
 Eastern Shore Islands Area of Interest Community Newsletter Fall 2018 1ỊNTRODUCTION In addition to information on our Fisheries and Oceans Canada (DFO) website, we have now created a seasonal, community
Wildlife Ad Awareness & Attitudes Survey 2015
 Wildlife Ad Awareness & Attitudes Survey 2015 Contents Executive Summary 3 Key Findings: 2015 Survey 8 Comparison between 2014 and 2015 Findings 27 Methodology Appendix 41 2 Executive Summary and Key Observations
STUDY PERFORMANCE REPORT
 STUDY PERFORMANCE REPORT State: Michigan Project No.: F-53-R-14 Study No.: 486 Title: Assessment of lake trout populations in Michigan s waters of Lake Michigan. Period Covered: April 1, 1997 to March
Volume and Shoreline Changes along Pinellas County Beaches during Tropical Storm Debby
 Volume and Shoreline Changes along Pinellas County Beaches during Tropical Storm Debby Ping Wang and Tiffany M. Roberts Coastal Research Laboratory University of South Florida July 24, 2012 Introduction
A Survey of Biodegradable and Non Biodegradable Debris on. Dominica s Coastal Zones
 A Survey of Biodegradable and Non Biodegradable Debris on Dominica s Coastal Zones Heather edina, Heather Woods, ichele Horner, Patricia Jimenez, Zac Zemanek Dominica 2011 Abstract: This report is a summary
U.N. Gen. Ass. Doc. A/CONF.164/37 (8 September 1995) <http://daccessdds.un.org/doc/undoc/gen/n95/274/67/pdf/n pdf?openelement>.
 <http://daccessdds.un.org/doc/undoc/gen/n95/274/67/pdf/n pdf?openelement>.") Agreement for the Implementation of the Provisions of the United Nations Convention on the Law of the Sea Of 10 December 1982 Relating to the Conservation and Management of Straddling Fish Stocks and Highly
Agreement for the Implementation of the Provisions of the United Nations Convention on the Law of the Sea Of 10 December 1982 Relating to the Conservation and Management of Straddling Fish Stocks and Highly
Volunteer and Internships Programs ECUADOR
 Volunteer and Internships Programs ECUADOR Equilibrio Azul is a non-for profit organization created in 2005 to protect the marine resources of Ecuador. Our mission is to integrate local communities, governmental
Characterising the status of the Western Port recreational fishery in relation to biodiversity values: Phase 1 Greg Jenkins and Simon Conron
 Characterising the status of the Western Port recreational fishery in relation to biodiversity values: Phase 1 Greg Jenkins and Simon Conron November 2015 1 Contents Executive Summary... 7 Introduction...
Understanding the Impacts of Culvert Performance on Stream Health
 Understanding the Impacts of Culvert Performance on Stream Health Kristin Thomas Aquatic Ecologist Michigan Trout Unlimited Transportation and the Environment Conference 12/5/2018 Importance of adequately
Standardized catch rates of U.S. blueline tilefish (Caulolatilus microps) from commercial logbook longline data
 from commercial logbook longline data") Standardized catch rates of U.S. blueline tilefish (Caulolatilus microps) from commercial logbook longline data Sustainable Fisheries Branch, National Marine Fisheries Service, Southeast Fisheries Science
Standardized catch rates of U.S. blueline tilefish (Caulolatilus microps) from commercial logbook longline data Sustainable Fisheries Branch, National Marine Fisheries Service, Southeast Fisheries Science
REPORT ON RED-LIGHT MONITORING SYSTEMS
 REPORT ON RED-LIGHT TRAFFIC CONTROL SIGNAL MONITORING SYSTEMS Prepared by the New Jersey Department of Transportation November 2011 Executive Summary Public Law 2007, Chapter 348 (P.L. 2007, c.348), signed
New Jersey Coastal Zone Overview. The New Jersey Beach Profile Network (NJBPN) 3 Dimensional Assessments. Quantifying Shoreline Migration
 3 Dimensional Assessments. Quantifying Shoreline Migration") New Jersey Coastal Zone Overview The New Jersey Beach Profile Network (NJBPN) Objectives Profile Locations Data Collection Analyzing NJBPN Data Examples 3 Dimensional Assessments Methodology Examples Quantifying
New Jersey Coastal Zone Overview The New Jersey Beach Profile Network (NJBPN) Objectives Profile Locations Data Collection Analyzing NJBPN Data Examples 3 Dimensional Assessments Methodology Examples Quantifying
Inlet Specific and Seasonal Variation in Vessel Use Patterns: The case of the Northeast Florida Region
 Inlet Specific and Seasonal Variation in Vessel Use Patterns: The case of the Northeast Florida Region Nancy Montes Robert Swett University of Florida Automatic Identification System (AIS) Ships 300 or
SAN DIEGUITO WETLANDS RESTORATION PROJECT 08 JANUARY 2018 BEACH PROFILES CITY OF DEL MAR, CALIFORNIA. Data Report
 SAN DIEGUITO WETLANDS RESTORATION PROJECT 08 JANUARY 2018 BEACH PROFILES CITY OF DEL MAR, CALIFORNIA Data Report Prepared by Coastal Environments, Inc. 2166 Avenida de la Playa, Suite E La Jolla, CA 92037
New Zealand Fisheries Assessment Research Document 98/21. Not to be cited without permission of the authork) Malcolm Clark
 Malcolm Clark") Not to be cited without permission of the authork) New Zealand Fisheries Assessment Research Document 98/21 A summary of commercial catch and effort information for orange roughy (Hoplostethus atlanticus)
Not to be cited without permission of the authork) New Zealand Fisheries Assessment Research Document 98/21 A summary of commercial catch and effort information for orange roughy (Hoplostethus atlanticus)
COMPARISON OF FIXED & VARIABLE RATES (25 YEARS) CHARTERED BANK ADMINISTERED INTEREST RATES - PRIME BUSINESS*
 CHARTERED BANK ADMINISTERED INTEREST RATES - PRIME BUSINESS*") COMPARISON OF FIXED & VARIABLE RATES (25 YEARS) Fixed Rates Variable Rates FIXED RATES OF THE PAST 25 YEARS AVERAGE RESIDENTIAL MORTGAGE LENDING RATE - 5 YEAR* (Per cent) Year Jan Feb Mar Apr May Jun Jul
COMPARISON OF FIXED & VARIABLE RATES (25 YEARS) Fixed Rates Variable Rates FIXED RATES OF THE PAST 25 YEARS AVERAGE RESIDENTIAL MORTGAGE LENDING RATE - 5 YEAR* (Per cent) Year Jan Feb Mar Apr May Jun Jul
Yellow Perch. Rainy River (Mar. 1, 2019 Apr. 14, 2019) (NEW) Lake of the Woods and Fourmile Bay. Catch and release fishing is allowed during this time
 (NEW) Lake of the Woods and Fourmile Bay. Catch and release fishing is allowed during this time") LAKE OF THE WOODS and RAINY RIVER INFORMATION December 1, 2018 April 14, 2019 Lake of the Woods is a border water, shared with the Canadian provinces of Manitoba and Ontario. The Minnesota portion of Lake
LAKE OF THE WOODS and RAINY RIVER INFORMATION December 1, 2018 April 14, 2019 Lake of the Woods is a border water, shared with the Canadian provinces of Manitoba and Ontario. The Minnesota portion of Lake
Analysis of 2015 Trail Usage Patterns along the Great Allegheny Passage
 Analysis of 2015 Trail Usage Patterns along the Great Allegheny Passage Prepared for the Allegheny Trail Alliance, August 2016 By Dr. Andrew R. Herr Associate Professor of Economics Saint Vincent College
Hana Community FAD Project Report
 Hana Community FAD Project Report Prepared April 28 Updated December 29 I. Introduction Hana is a small, isolated community located in east Maui, Hawaii. In 2, Hana s population was determined to be 79
Tracking Juvenile Summer Flounder
 Tracking Juvenile Summer Flounder East Coast MARE Materials For the leader: Whiteboard Markers (different colors) For each group: Copies of student group packets Copies of student worksheet Overview Scientists
Lee E. Harris, Ph.D., P.E. Assoc. Professor of Ocean Engineering. Doug Bowlus and Ashley Naimaster Ocean Engineering Graduate Students
 FLORIDA TECH OCEAN ENGINEERING PROFESSOR LEE HARRIS AND HIS GRADUATE STUDENTS ASSIST WITH POST-HURRICANE IVAN CORAL REEF RESTORATION IN THE CAYMAN ISLANDS Lee E. Harris, Ph.D., P.E. Assoc. Professor of
A review of 2015 fatal collision statistics as of 31 December 2015
 A review of fatal collision statistics as of 31 December This report summarises the main trends in road fatalities that have emerged in. This has been prepared by the Road Safety Authority following analysis