The Anatomy and Analysis of a Typical Pedestrian / Bicycle Crash Event
|
|
|
- Chester Horn
- 5 years ago
- Views:
Transcription
1 The Anatomy and Analysis of a Typical Pedestrian / Bicycle Crash Event Mike W. Reade, CD Forensic Reconstruction Specialists Inc. Institute of Police Technology and Management University of North Florida Adjunct Instructor Abstract A pedestrian crash investigation can be one of the most challenging and yet rewarding investigations to undertake. As with any investigation, trying to figure out where the area of impact is located can be very difficult and at times impossible to establish. During the collision sequence, a pedestrian will undergo a very dramatic and sudden change in velocity in a very short time. As the colliding vehicle and pedestrian interact, the pedestrian s upper body will either, wrap around the vehicle s front profile, or the pedestrian s body will be projected forward and along a level trajectory, or takeoff. After impact, a brief carry distance, the pedestrian released from the vehicle. Once the airborne phase is completed, the pedestrian will touch down on the road surface and commence to slide, roll or tumble to its final rest position. During this phase, the pedestrian experiences a significant ground impact that results in a sudden speed loss. This paper will break down a typical pedestrian crash event into meaningful collision phases and look at other factors that may influence your overall reconstruction analysis. INTRODUCTION A typical crash involves a pedestrian who is either, walking, running or riding a bicycle when the impact occurs. In bicycle collisions, the bicyclist s center of mass can be below or above the vehicle s front leading edge (hood height) when impact occurs. Although collision vehicles can be braking before, at/after impact, or not at all, the crash test data [1] researched as part of this paper, shows there are no significant differences in the final calculations regardless of driver action. When a braking vehicle strikes a pedestrian, there can be some vehicle/suspension loading which may show a slight widening of the vehicle s tiremark(s). Should this occur, it will be helpful to investigators when locating where the pedestrian and the vehicle was positioned at impact. The nature of crash scene evidence is delicate and it can be destroyed by passing vehicles, the first responders, or any witness willing to assist. To preserve the trace evidence, investigators 1

2 would be wise to limit access to the roadway as soon after the event as possible. All too often, this evidence can play a vital role later in the final analysis. A typical pedestrian crash event will result in the pedestrian s body conforming or wrapping to the vehicle s front profile during the impact phase and before the airborne phase starts. This type of collision is referred to as a Wrap Trajectory [2, 3]. Here, the vertical height to the pedestrian s center of mass must be located above the front leading edge (hood height) of the striking vehicle. The crash test data suggests the pedestrian s projectile velocity is less than 100% of the striking vehicle at impact. Figure 1 shows an example of a wrap test trajectory. Figure 1 - Wrap Trajectory Test Albuquerque, NM, August 2009 The other pedestrian trajectory occurs when the pedestrian s center of mass is below the vehicle s front leading edge (hood height). This collision type is referred to as a Forward Projection Trajectory [2, 3]. With the pedestrian s center of mass below the vehicle s hood height, one would expect the pedestrian to acquire nearly 100% of the vehicle s striking speed. Figure 2 shows an example of a forward projection trajectory test. Clearly, when the pedestrian s center of mass below the front leading edge, the pedestrian can be accelerated to the vehicle s striking speed. Investigators should be aware the pedestrian s body may become trapped on the vehicle at any time during the impact and carry phase. To address these concerns, it is necessary to conduct a full crash scene documentation of all trace evidence. 2

3 Figure 2 - Forward Projection Trajectory Test - Wisconsin, August 2009 After reviewing several crash test videos, it is clear that pedestrians do not immediately become airborne upon impact. Rather, during the wrap or the forward projection phase, the pedestrian is carried a short distance before the airborne phase commences. As part of each IPTM (Institute of Police Technology and Management) Pedestrian/Bicycle Crash Investigation Course, the test data which is collected from each course is helpful when analyzing when analyzing this type of collision. ANALYSIS METHODS After investigators have located the area of impact, they measure the total distance from first impact to the pedestrian s final rest position, or the Total Throw Distance. This distance includes the Impact, Carry, Airborne, Ground Impact and Pedestrian Sliding Phases. For this research, the many calculations were performed using the PEDBIKE 2000 Plus - Pedestrian/Bicycle Specialty software [4]. 3
4 This paper will focus on the work of Dr. John Searle [5, 6, 7] as expressed in his research. The Searle Minimum Formula can be adjusted to address each topic as required. (Refer to Appendix A for an explanation of variables used in each formula.) Vin= + μm2gsμ 12(1) PEDESTRIAN CRASH PHASES & ANALYSIS Pre-Crash Phase The pre-crash phase involves the movement of both the vehicle and the pedestrian. It is important to note that regardless what each party is doing before impact, the same amount of time is used for each unit to reach impact during any time and distance calculations. Should any of the participants brake before impact then investigators will need to consider the amount of pre-impact speed loss in their final speed results. Once the vehicle s speed at the start of braking is determined, a further time and distance analysis will allow investigators to place each participant at a location where the driver s perception and reaction is likely to have occurred. Pre-Crash Analysis During the pre-crash phase, the investigator must account for any speed loss by using the slide to stop formula. V = 2fgd (2) Where the results V are expressed in feet per second and f is the roadway friction value, g is the gravitational acceleration and d is the distance in feet that the vehicle skids on the road surface. Once the pre-crash speed loss is determined, investigators can combine these results with any post-impact speed calculations using a combined speed formula. V = V 2 + V 2 (3) C 1 2 Where the results V C are expressed in feet per second, and V 1 represents the pre-impact speed loss in feet per second while V 2 represents the pedestrian s throw distance results in feet per second following the collision. 4


5 Impact Phase This phase involves the actual contact between thee vehicle and the pedestrian. When a pedestrian on foot is involved, there may be some evidence of shoe scuff to show where the impact area is located. However, all too often, this evidence is not clearly identifiable to the naked eye. If present, collecting this field evidence can be difficult. Figure 3: Impact Graphic from Visual Statement EdgeFX Software The pedestrian trajectory is determined at impact. If the pedestrian ss center of mass is below the vehicle s hood height, then the pedestrian is projected directly forward as a Forward Projection trajectory. The other pedestrian trajectory is a Wrap trajectory where the pedestrian s center of mass is above the vehicle s hood height. Carry Distance Phase The carry distance phase is part of the impact phase because the pedestrian is still in contact with the vehicle as the pedestrian is accelerated forwardd in the direction of vehicle travel. During the impact and the carry distance phases, the pedestrian s upper body will wrap onto the vehicle s hood. The many crash videos reviewed suggests the pedestrian s head is accelerated downward toward the vehicle s hood as the lower part of the body is accelerated in the direction of vehiclee travel. 5

![test dummy [8] or pedestrian will wrap to the vehicle s front](/docs-images/87/96816478/images/6-2.jpg "profile.")


 before the pedestrian releases from the vehicle")


6 (Figure 4: Carry Phase Graphic from Visual Statement EdgeFX Software Impact & Carry Distance Analysis Upon impact, the crash test dummy [8] or pedestrian will wrap to the vehicle s front profile. As the pedestrian s head accelerates toward the vehicle s hood, the lower body is carried forward while staying in contact with the vehicle. Searle s research [7] suggests this distance to be in the order of 2.62 feet (0. 8 meters). The physical data analyzed from controlled crash testing suggests the pedestrian does not stay in contact with the vehicle for a long time or distance [9]. This test data suggests the pedestrian is carried for 3.2 feet (1 meter) before the pedestrian releases from the vehicle and the airborne phase commences. Becausee of the short pedestrian carry distance before the airborne phase starts, the pedestrian s total throw distance from impact to final rest should in theory, be reduced by the carry distance. However, it is not possible to measuree the actual carry distance to make this adjustment. Therefore, investigators have two, to reduce the pedestrian s total throw distance by the carry distance, or not. 2gsDVmμ = options,21(4) + μ in)cond and µ Where the results V min are expressed in feet per sec µ is the pedestrian s friction value, g is the gravitational acceleration, s is the pedestrian s total throw distance in feet and D is the pedestrian s carry distance in feet from impactt to the start of the airborne phase. 6
 before the pedestrian becomes airborne.")
 and the shortest carry distance seen was 0.0 ft (0.")


 in the case of forward projections.")


7 Of the 87 crash testss reviewed for this research, the pedestrian was carried 3.2 ft (1.0 m) before the pedestrian becomes airborne. The longest carry distance seen was 9.6 ft (2.9 m) and the shortest carry distance seen was 0.0 ft (0.0 m) in the case where forward projection and corner crash scenarios occurred. Searle s research [7] suggests the carry distance is short. This research paper shows little difference from that researchh conducted by Searle. Whether investigators make an adjustmentt to the total throw distance or not, there is only a small reduction in calculated speed of about 1.2 km/h (0.8 mph) when considering the effects of carry distance. The highest speed difference seen was 3.8 km/h (2.3 mph) and the lowest speed difference seen was 0.0 km/h (0.0 mph) in the case of forward projections. This on-going research is consistent with the research conducted by Searle as well as the IPTM crash testing [1, 10]. Regardless which option investigators choose, reducing the total throw distance by the carry distance will result in a small speed reduction. Since thee pedestrian will usually not acquire 100 % of the vehicle s speed at impact, any differences are insignificant.. Airborne Phase The airborne phase occurs after the impact and the carry distance phases are completed. Here, the pedestrian has separated from the vehicle and iss now travelling forward at a constant, horizontal speed while experiencing the effects of gravitational acceleration. Figure 5: Airborne Phase Graphic from Visual Statement EdgeFX Software There has been much discussion about when the airborne phase actually begins and how far the pedestrian is carried before the airborne phase begins. Unless there is evidence to suggest the pedestrian was trapped on the vehicle for an extended distance, the crash test data reviewed for this paper suggestss that the pedestrian will separate from the vehicle after a very short carry distance. 7

8 Airborne Analysis Unlike a true vault situation, it is not critical to know where the pedestrian first touches down after the airborne phase is completed. Since pedestrian airborne formulas include the impact, carry distance, airborne and the pedestrian sliding phases, investigators need not worry themselves, by trying to locate the location for first touchdown on the road surface. Rather, it is more important to locate where the pedestrian was when impact occurs so the total throw distance can be determined. The crash test video [1] collected during the crash testing is reviewed in the cswing [11] computer software. This software program is designed to analyze golf swings. However, because of the software s unique ability to scale distances and measure angles directly on video footage, this software became a useful tool to gather pedestrian carry distance and pedestrian takeoff angles directly from the crash test video. Figure 7 is an example of the cswing program s main screen with a video example. Figure 6 - cswing Program Screen Capture Showing Measurements Much discussion has been made about what the pedestrian takeoff angles are or should be as the pedestrian becomes airborne. Although, investigators have been interested in takeoff angles for many years, it is becoming more apparent the pedestrian s takeoff angle is not required using the method in this research to estimate the pedestrian s projectile speed. To determine the pedestrian s projectile speed, the Searle Minimum Speed Formula is used. The total throw distance from impact to final rest along with the pedestrian s sliding friction value 8
9 are required to complete this calculation. The following formula can then be expanded to include the overall effects of the roadway slope, the change in vertical height between takeoff and touchdown, the pedestrian carry distance and the vehicle s and pedestrian s weight. min2μ 1+ μ gsv= The projectile velocity results V min obtained using this formula are in feet per second. Where: μ is the pedestrian sliding coefficient of friction, g is the gravitational acceleration and s is the total throw distance from impact to the pedestrian s final rest. Once investigators have determined the velocity required to project the pedestrian a total throw distance, compare these results to the results obtained using formula 8, or the pedestrian s speed from sliding along the road surface. Ground Impact Phase As the ground impact phase commences, the pedestrian experiences a significant impact where the pedestrian loses some horizontal velocity [9]. Once this initial contact takes place the body slides, tumbles or rolls to its final rest position. Searle [7] has suggested similar observations during his research. For this paper, the crash test data indicates the horizontal velocity lost upon initial ground impact is 6.6 mph (10.6 km/h). Ground Impact Analysis As a follow up to research already conducted by Searle that discusses the horizontal speed loss on impact with the road surface, the following formulae are used to address these issues. An excellent reference source on Airborne Analysis is Fundamentals of Traffic Crash Reconstruction, Volume 2 of the Traffic Crash Reconstruction Series, and authored by Daily, Shigemura, Daily [12]. vvsi n= θ (6) 2oThe vertical velocity on takeoff results v obtained using this formula, are in feet per second. Where: v o is the projectile s original velocity at takeoff and θ is the projectile s takeoff angle. Since we are discussing the projectile s original velocity v o, it is appropriate to use the same results obtained with the Searle Minimum Formula. (5) 9

![ding [7].](/docs-images/87/96816478/images/10-2.jpg "landv2v2g=μ + Hμ g this formu is necessary to (7) The")

 on takeoff, g is")

 upon initial impact with the ground.")
 and the lowest speed losss was 3.1 mph (5.1 km/h).")


10 been Once the projectile s vertical velocity at takeoff hass detehermined, it determine the horizontal velocity loss on ding [7]. landv2v2g=μ + Hμ g this formu is necessary to (7) The horizontal velocity loss results V obtained using ula are in feet per second. Where: μ is the pedestrian s sliding friction value, v iss the original vertical velocity (formula 7) on takeoff, g is the gravitational acceleration and H is the pedestrian s vertical height to center of mass at takeoff. Of the 87 crash testss reviewed, the test dummy lost 6.6 mph (10.6 km/h) upon initial impact with the ground. The highest speed loss was 10.8 mph (17.4 km/h) and the lowest speed losss was 3.1 mph (5.1 km/h). Even though the pedestrian s totall sliding distance is known, the resulting speed loss calculation due to sliding (formula 8) is conservative in nature and underestimates the vehicle s impact speed. These findings are consistent with those results found in Searle s on-going research. Pedestrian Sliding Phase The pedestrian sliding phase commences when the pedestrian makes contact with the road surface and includes all movement toward its final rest position. If you cannot establish the first touchdown location, then any speed loss calculations using the available roadway evidence will underestimate the pedestrian s projectile speed. Figure 7: Sliding Phase Graphic from Visual Statementt EdgeFX Software If the pedestrian s sliding distance is the only physical evidence you have analysis, then you will need to decide what pedestrian sliding friction mathematical analysis. to continue to use in your your 10
11 Pedestrian Sliding Analysis Determining the pedestrian s speed loss while sliding along the ground requires one to know the sliding distance while travelling along the road surface. Also needed is an appropriate pedestrian friction value between the sliding pedestrian and the road surface on which it slides. V2gμ d= (8) The pedestrian s velocity from sliding results V obtained using this formula are in feet per second. Where: µ is the pedestrian s sliding coefficient of friction value, g the gravitational acceleration and d is the pedestrian s total sliding distance in feet along the road surface. After determining the pedestrian s speed loss while sliding along the ground, we can compare this to the vehicle s impact speed. In all crash tests reviewed, the speed determined for the pedestrian s sliding using this method is less than the impact speed of the test vehicle as recorded by the Vericom Performance Computer [13], the Police Radar unit, or the total vehicle braking distance. The loss of horizontal speed upon initial touchdown following the airborne phase explains why this occurs. Interestingly, when comparing the pedestrian s sliding velocity to the Searle Minimum Formula results, the results of formula 8 are less than the Searle Minimum Formula results. This is also true when comparing these results to the striking vehicle s speed. Pedestrian Friction Values Pedestrian friction values originate from a variety of sources. One of the most recent discussions by Searle [7] outlines the use of a sandbag method covered with different clothes travelling upon different road surfaces. Table 1: "Sandbag" Coefficient of Friction on Different Surfaces [7] Surface Dry Wet Frost Coarse Asphalt Fine Asphalt (New) Fine Asphalt (Worn) Concrete Anti-Skid
12 (Ped Crossing) Grass Table 2: Hill's Frictions Results (Adjusted) Fine Textured Asphalt, Dry [7, 14] No of Tests Average Friction Serge Jacket & Trousers Body Warmer, Jumper, Trousers Nylon Jacket & Trousers Woollen Boiler Suit Rubberized Cotton Jacket, Wool Trousers Table 3: Bovington Friction Results (Adjusted) [7, 15] Airfield Fine Textured Asphalt Damp Conditions, One Test Nylon Rain Suit Leather M/C Suit Nylon M/C Suit Woollen Boiler Suit Rubberized Cotton Jacket, Wool Trousers
13 Table 4: Pedestrian Friction Values from Personal Testing [1] Crash Test Dummy Dressed in Cotton & Jean Materials Ped/Bike Class Albuquerque, NM Average of 10 Pulls 0.67 Ped/Bike Class Fort McCoy, WI Average of 6 Pulls 0.59 Ped/Bike Class Augusta, ME Average of 10 Pulls 0.50 Ped/Bike Class Sewell, NJ Average of 10 Pulls 0.54 Ped/Bike Class Scotch Plains, NJ Average of 10 Pulls 0.59 Ped/Bike Class Narragansett, RI Average over Several Surfaces 0.66 Table 5: Pedestrian Friction Values from CATAIR Testing [16] Crash Test Dummy Dressed in Nylon, Cotton & Jean Materials CATAIR Winter Testing, Riverview, New Brunswick (Wet Asphalt) CATAIR Winter Testing, Riverview, New Brunswick (Snow/Slush Mixture) CATAIR Winter Testing, Riverview, New Brunswick (Packed Snow) SPECIAL CONSIDERATIONS Vertical Change in Height between Takeoff and Touchdown Normally a change in the pedestrian s vertical height of center of mass between takeoff and first touchdown will occur through some three or four feet. Any differences in speed because of this short distance are very small and insignificant. However, when there is a greater difference in the vertical height difference, there will also be a greater difference in the horizontal speed loss at first touchdown as the pedestrian commences its sliding distance. Understandably, the greater the vertical height difference, the shorter the pedestrian s forward movement, or sliding distance there will be. One can also conclude that the touchdown angle between the pedestrian and the roadway will increase as the vertical height difference increases. 13
14 ()Level Surface Lower Surface Figure 8: Vertical Height Difference Graphic from Visual Statement EdgeFX Software The following formula will consider the effects of vertical change in height between takeoff and touchdown [6, 7]. 2gsHVnμ μ = 12(9) +μ miwhere the results V min are expressed in feet per second and µ is the pedestrian s friction value, g is the gravitational acceleration, s is the pedestrian s total throw distance in feet and H is the vertical change in the pedestrian s center of mass between takeoff and touchdown. 14
15 2os( in)mvspeed Analysis While Considering All Effects Investigators will face many challenges during the course of their investigations. Situations will arise when you will ask yourself Do I consider the effects of carry distance, roadway slope, or vertical height differences? at some point during your analysis. More importantly, do these considerations effect the overall analysis and if so by how much. To answer these questions, one might consider the approach that Dr. Searle s research [7], where he provides solutions to each separate issue. So, if we expand on Searle s work, we arrive at one formula that will address all these situations. = Mm+ M gμ C 1 Sin α± α μ 1 2+μ sd( ) ( μ ) H(10) This one formula will consider the effects of vehicle (M) and pedestrian (m) weight (Blue), roadway slope (α) (Red), pedestrian carry distance (D) (Magenta) and vertical change in height (H)(Green) between takeoff and touchdown on the road surface. If there is no roadway slope, simply substitute the Red section by using only g gravitational acceleration. If there is no significant vertical height difference involved, then you can remove the Green section. If there is no concern for pedestrian and vehicle weights, then remove the Blue section. The same rational would apply to the adjustment for pedestrian carry distance if an adjustment is not required. NOTE: During this calculation, it is important to note the roadway slope is reported in degrees and the gravitational acceleration is adjusted first for any roadway slope. 15
16 2( in)m200420vexample: (Considering all situations) Vehicle Weight (M): 4200 lb ( kg) Pedestrian Weight (m): 180 lb (81.81 kg) Roadway Slope (α): ± 2 degrees (0.05 %) Throw Distance (s): 125 ft (38.1 m) Carry Distance (D): 3.5 ft (1.06 m) Height Difference (H): 3 ft (0.91 m) Pedestrian Friction (µ): 0.70 = Cos2 Sin ± ( ) ( ) (11) Using the above scenario, the downhill - roadway slope results are 41.6 mph (67.0 km/h) and the uphill + roadway slope results are 43.7 mph (70.4 km/h), or a total ± difference of 2.1 mph (3.37 km/h). Taking this one step further, comparing these results to the Searle Minimum Formula with no adjustments, the results are 41.9 mph (67.4 km/h). If for example the vertical change in height between the pedestrian s center of mass at takeoff and the center of mass at touchdown is 25 ft (7.62 m), then the downhill - result would be 38.8 mph (62.5 km/h) and the uphill + result would yield 40.8 mph (65.7 km/h). However, since the pedestrian does not acquire 100% of the vehicle s speed at impact (unless of course this is a forward projection trajectory) the results obtained using the Searle Minimum Formula are conservative and therefore underestimate the vehicle s striking speed. It is worthwhile mentioning that investigators may use either Imperial or Metric values in any of the Searle Formulae. The results are reported as feet per second for Imperial values, and as meters per second units for Metric values. 16
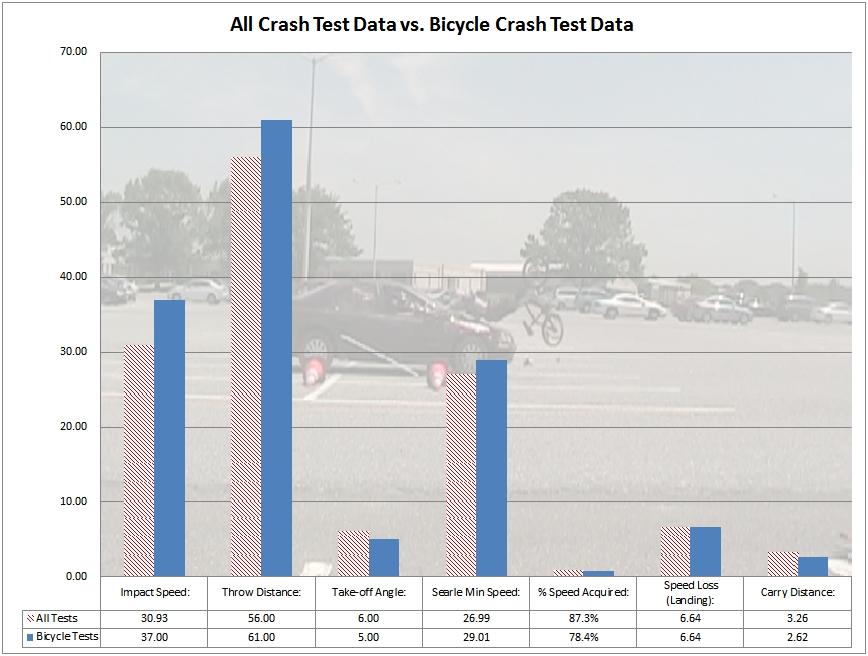
17 CONCLUSIONS On-going crash testing and research shows the pedestrian is carried a short distance before the airborne phase commences. Investigators must be aware that pedestrians may become trapped upon the vehicle, or a secondary contact may occur during the impact phase. Should this occurs, Searle [7] suggests the vehicle s impact speed could be as much as 80% of the Searle Minimum Formula results. Therefore, it is necessary to consider the effects a secondary contact will have on any overall analysis. There will be times when investigators are not able to locate the area of impact. In such cases, the only evidence is that of a pedestrian sliding along the road surface. The results obtained from pedestrian sliding will underestimate the vehicle s impact speed for two reasons: 1) because there is a horizontal loss of projectile speed upon ground impact and 2) because the pedestrian does not acquire 100% of the vehicle s impact speed, unless the trajectory is a forward projection. Current crash testing suggests there is a horizontal speed loss of 6.6 mph (10.6 km/h) when the pedestrian first makes ground contact (Appendix B). Additionally, the pedestrian only acquires 78.4% of the vehicle s impact speed for the bicycle-related crash tests conducted and acquires only 87.3% of the vehicle s impact speed for all crash tests conducted. Searle s research [5] found the pedestrian s combined projection efficiency was 77.5% of the vehicle s striking speed. We know from testing that the pedestrian does not always acquire the same percentage of vehicle speed if struck by similar vehicles and under similar impact alignments. Because the projection efficiency, or percentage, varies from test to test, it is not wise for investigators to increase their calculated results to make up for the missing speed percentages. This approach may lead an investigator to falsely overestimate the vehicle s true speed at impact. Although there is some pedestrian carry distance before the body becomes airborne, the carry distance is generally short and in the order of 3.2 feet (1 meter) [1, 9]. As a result, the decision to reduce the pedestrian s total throw distance by a carry distance only has a small effect on the final speed calculations. If investigators are able to establish a total throw distance from first impact to the pedestrian s final rest, then the methods provided by Dr. Searle s research and confirmed by this research, will allow investigators to figure out the speed necessary to project a pedestrian from impact to final rest. The values obtain using this method underestimate the vehicle s impact speed. Although there are several factors investigators need to address at some point in their investigations, it appears from this research the effects do not have a significant effect on the overall results. Knowing the pedestrian s carry distance or the pedestrian s takeoff angle has very little or no effect on the final calculated results. 17
18 REFERENCES [1] BECKER, T.L. and READE, M.W., Documentation and Analysis of Controlled Pedestrian/ Bicycle Crash Testing, Pedestrian/Bicycle Crash Investigation and Advanced Pedestrian/Bicycle Crash Investigation Courses, Institute of Police Technology and Management, Jacksonville, FL, [2] RAVANI, B., BROUGHAM, D. and MASON, R.T., Pedestrian Post-Impact Kinematics and Injury Patterns, Traffic Safely Research Corporation, Palo Alto, CA, SAE , [3] BECKER, T.L., Vehicle-Pedestrian-Bicycle Collision Investigation Manual, Institute of Police Technology and Management Publisher, ISBN , pages: 51-52, [4] READE, M.W., PEDBIKE 2000 Plus Pedestrian/Bicycle Specialty Software, Designed and Programmed in Visual Basic 6 by Mike W. Reade, [5] SEARLE, J.A. and SEARLE, A., The Trajectories of Pedestrians, Motorcycles, Motorcyclists, etc., Following a Road Accident, Motor Industry Research Association, SAE , pages: , [6] SEARLE, J.A., The Physics of Throw Distance in Accident Reconstruction, Road Accident Analysis Services, SAE , pages: 71-81, [7] SEARLE, J., The Application of Throw Distance Formulae, Road Accident Analysis, Hinckley, UK, Institute of Police Technology and Management, 2009 Special Problems in Traffic Crash Reconstruction Conference, Orlando, FL, [8] RESCUE RANDY, The test dummy manikin that was used during the crash testing, Simulaids LLC, [9] READE, M.W., How Does Pedestrian Ground Impact and Pedestrian Carry Distance Affect Investigations? A Look at On-Going Testing and Training, Forensic Reconstruction Specialists Inc., Riverview, New Brunswick, Proceedings of the 21 st Canadian Multidisciplinary Road Safety Conference, Halifax, Nova Scotia, [10] BECKER, T.L. and READE, M.W., A Fresh Approach Into The Reconstruction of Pedestrian/Bicycle Collisions, Institute of Police Technology and Management, 2007 Special Problems Conference, Jacksonville, FL., [11] cswing LLC, Professional Golf Swing Analysis Software, cswing LLC, El Paso, Texas, [12] DAILY, J., SHIGEMURA, N. and DAILY, J., Fundamentals of Traffic Crash Reconstruction Volume 2 of the Traffic Crash Reconstruction Series, Institute of Police Technology and Management Publisher, ISBN , pages: ,
19 [13] VERICOM PERFORMANCE COMPUTERS, Braking Testing and Acceleration Performance Equipment, Vericom Computers Inc., [14] HILL, G.S., Calculations of Vehicle Speed from Pedestrian Throw, Impact Vol. 4, No. 1, p18-20, ITAI, England, [15] CRAIG, A., Bovington Test Results, Impact Vol. 8, No. 8, p83-85, ITAI, England, [16] READE, M.W., CATAIR Atlantic Region Pedestrian Crash, Drop & Friction Testing, Riverview, New Brunswick, Canada,
20 Appendix A - Schematic & Terms of a Typical Pedestrian Throw Event v Projectile C/M Travel Path θ H Touchdown Final Rest D Airborne Distance d s (Total Throw Distance) Terminology: d = Sliding distance of pedestrian along ground surface, or vehicle braking distance D = Carry distance of pedestrian from impact to start of airborne phase µ = Coefficient of friction of sliding pedestrian along the ground surface f = Coefficient of friction of braking vehicle along the roadway g = Gravitational acceleration s = Total pedestrian throw distance from impact to final rest V min = Projectile velocity using Searle minimum formula v o = Projectile s original velocity on takeoff (Same result as V min ) θ = Projectile s takeoff angle in degrees v = Projectile s vertical velocity on takeoff H = Vertical change in height of center of mass between takeoff and touchdown V = Horizontal velocity loss on landing 20
21 Appendix B Summary of Crash Test Data 21
22 22
5. A bead slides on a curved wire, starting from rest at point A in the figure below. If the wire is frictionless, find each of the following.
 Name: Work and Energy Problems Date: 1. A 2150 kg car moves down a level highway under the actions of two forces: a 1010 N forward force exerted on the drive wheels by the road and a 960 N resistive force.
OBJECTIVE: The application of professional experience with tutorial and academic preparation allowing for professional growth and recognition.
 OBJECTIVE: The application of professional experience with tutorial and academic preparation allowing for professional growth and recognition. PROFESSIONAL EXPERIENCE: Accredited Traffic Accident Reconstructionist,
Crash Facts Scenario 1 Pedestrian Accident - Solution - May 2006
 Crash Facts Scenario 1 Pedestrian Accident - Solution - May 2006 Well, we got the first scenario under our belt and I received an excellent analysis from an old friend Bill Hamilton. I have not heard from
Reconstructing a rollover includes examining physical evidence on the roadway and the vehicle. Here s a detailed roadmap to examining that evidence
 Roadway and vehicle evidence in rollover collisions Reconstructing a rollover includes examining physical evidence on the roadway and the vehicle. Here s a detailed roadmap to examining that evidence BY
Analysis of Car-Pedestrian Impact Scenarios for the Evaluation of a Pedestrian Sensor System Based on the Accident Data from Sweden
 136 S.N. Huang, J.K. Yang Division of Vehicle Safety, Chalmers University of Technology, Göteborg, Sweden F. Eklund Automotive Safety Electronics, Autoliv Electronics AB, Linköping, Sweden Analysis of
Use of Throw Distances of Pedestrians and Bicyclists as Part of a Scientific Accident Reconstruction Method 1
 contents Introduction xi CHAPTER 1 Use of Throw Distances of Pedestrians and Bicyclists as Part of a Scientific Accident Reconstruction Method 1 Introduction 2 Basis of Speed Calculation 2 New Results
SIMON Simulation of Non-Automotive Vehicle Free Rolling Response
 SIMON Simulation of Non-Automotive Vehicle Free Rolling Response Ciro Ramirez, PhD, PE, CSHO, C. L. Long, Jr., P.E., and R. Joe Thornhill, PhD, PE, CSHO Thornhill, Ramirez & Associates, Inc. Copyright
The investigation of car movement trajectories after contact in the case of collisions with stationary safety barriers
 Urban Transport XIII: Urban Transport and the Environment in the 2st Century 557 The investigation of car movement trajectories after contact in the case of collisions with stationary safety barriers A.
CORRELATION OF DIFFERENT IMPACT CONDITIONS TO THE INJURY SEVERITY OF PEDESTRIANS IN REAL WORLD ACCIDENTS
 CORRELATION OF DIFFERENT IMPACT CONDITIONS TO THE INJURY SEVERITY OF PEDESTRIANS IN REAL WORLD ACCIDENTS Jikuang Yang Jianfeng Yao Chalmers University of Technology, Sweden Dietmar Otte Hannover Medical
APPENDIX A TWO-LANE RURAL ROADS ELEMENTS OF DESIGN CREST VERTICAL CURVES
 APPENDIX A TWO-LANE RURAL ROADS ELEMENTS OF DESIGN CREST VERTICAL CURVES 1. Two-lane Rural Roads 1.1 Introduction The definition of rural area can be derived from the definition of urban areas. Officially,
Current Accident Analysis and AEB Evaluation Method for Pedestrians in Japan
 Final AsPeCSS Workshop Current Accident Analysis and AEB Evaluation Method for Pedestrians in Japan July 1st, 214 National Traffic Safety and Environment Laboratory Kenichi Ando Outline Pedestrian accident
Introduction to Transportation Engineering. Discussion of Stopping and Passing Distances
 Introduction to Transportation Engineering Discussion of Stopping and Passing Distances Dr. Antonio A. Trani Professor of Civil and Environmental Engineering Virginia Polytechnic Institute and State University
A Novel Approach to Evaluate Pedestrian Safety at Unsignalized Crossings using Trajectory Data
 A Novel Approach to Evaluate Pedestrian Safety at Unsignalized Crossings using Trajectory Data Ting Fu Supervisor: Luis Miranda-Moreno, Nicolas Saunier Ting FU Outline 1. Motivation & Literature Review
Figure 1: Graphical definitions of superelevation in terms for a two lane roadway.
 Iowa Department of Transportation Office of Design Superelevation 2A-2 Design Manual Chapter 2 Alignments Originally Issued: 12-31-97 Revised: 12-10-10 Superelevation is the banking of the roadway along
Mechanical Energy I. Name: Date: Section C D F. Mr. Alex Rawson Physics
 Name: Date: Section C D F Mechanical Energy I Mr. Alex Rawson Physics 1. One of the two Olympic weightlifting events is called the Clean and Jerk, shown below. As of Athens 2004, the record for Clean and
RECONSTRUCTION OF AN UNUSUAL ROAD TRAFFIC ACCIDENT USING COMPUTER SIMULATION
 1. Attila Iuliu GÖNCZI RECONSTRUCTION OF AN UNUSUAL ROAD TRAFFIC ACCIDENT USING COMPUTER SIMULATION 1. POLITEHNICA UNIVERSITY OF TIMISOARA, ROMANIA ABSTRACT: In most of the cases of a road traffic accident
PEDESTRIAN CRASH MODEL FOR VEHICLE SPEED CALCULATION AT ROAD ACCIDENT
 International Journal of Civil Engineering and Technology (IJCIET) Volume 8, Issue 9, September 017, pp. 1093 1099, Article ID: IJCIET_08_09_1 Available online at http://http://www.iaeme.com/ijciet/issues.asp?jtype=ijciet&vtype=8&itype=9
The table below shows how the thinking distance and braking distance vary with speed. Thinking distance in m
 Q1.The stopping distance of a car is the sum of the thinking distance and the braking distance. The table below shows how the thinking distance and braking distance vary with speed. Speed in m / s Thinking
Appendix : Categorization Task. Instructions
 Appendix : Categorization Task Instructions Your task is to group the 25 problems below based upon similarity of solution into various groups on the sheet of paper provided. Problems that you consider
Copyright 2014 Edmentum - All rights reserved.
 Copyright 2014 Edmentum - All rights reserved. AP Physics Blizzard Bag 2014-2015 Classical Mechanics 1. A block of mass 4.0 kg is attached to the end of a spring. The spring stiffness constant is 25 N/m.
V & O VLIET & O NEILL, LLC C R A S H R E C O N S T R U C T I O N T R A F F I C E N G I N E E R I N G WILLIAM A. VLIET, P.E.
 V & O VLIET & O NEILL, LLC C R A S H R E C O N S T R U C T I O N T R A F F I C E N G I N E E R I N G 41 PROSPECT STREET MANCHESTER, CT 06040-5801 TELEPHONE 860.533.1210 FACSIMILE 860-533-1374 WILLIAM A.
Post impact trajectory of vehicles at rural intersections
 Post impact trajectory of vehicles at rural intersections Doecke SD., Woolley JE. and Mackenzie JR. Centre for Automotive Safety Research Abstract This report describes the path of vehicles after a collision
CURRICULUM VITAE BUSINESS INFORMATION: Website:
 CURRICULUM VITAE BUSINESS INFORMATION: Office Address: 11620 Arbor Street, Suite 202, Omaha, NE 68144 Office Phone: 402-572-9164 Email: ssokol@faarconsulting.net Website: www.faarconsulting.net EDUCATIONAL
1. Determine his speed when he reaches the photo radar car.
 Physics Unit Review 5 Use the following information to answer the next two questions. Mr. Buffi is cruising at 18.9 m/s when he sees a suspicious car (perhaps a photo radar car?) parked on the side of
Measurements of the grip level and the water film depth for real accidents of the German In-Depth Accident Study (GIDAS).
.") Measurements of the grip level and the water film depth for real accidents of the German In-Depth Accident Study (GIDAS). Henrik Liers*, Pierre Fevrier**, Christian Mignot**, Frédéric Sarazin** *Verkehrsunfallforschung
Measurements of the grip level and the water film depth for real accidents of the German In-Depth Accident Study (GIDAS). Henrik Liers*, Pierre Fevrier**, Christian Mignot**, Frédéric Sarazin** *Verkehrsunfallforschung
The table below shows how the thinking distance and braking distance vary with speed. Thinking distance in m
 Q1.The stopping distance of a car is the sum of the thinking distance and the braking distance. The table below shows how the thinking distance and braking distance vary with speed. Speed in m / s Thinking
DISTRIBUTION: Electronic Recipients List TRANSMITTAL LETTER NO. (13-01) MINNESOTA DEPARTMENT OF TRANSPORTATION. MANUAL: Road Design English Manual
 MINNESOTA DEPARTMENT OF TRANSPORTATION. MANUAL: Road Design English Manual") DISTRIBUTION: Electronic Recipients List MINNESOTA DEPARTMENT OF TRANSPORTATION DEVELOPED BY: Design Standards Unit ISSUED BY: Office of Project Management and Technical Support TRANSMITTAL LETTER NO.
DISTRIBUTION: Electronic Recipients List MINNESOTA DEPARTMENT OF TRANSPORTATION DEVELOPED BY: Design Standards Unit ISSUED BY: Office of Project Management and Technical Support TRANSMITTAL LETTER NO.
Exploring the relationship between the pressure of the ball and coefficient of restitution.
 Exploring the relationship between the pressure of the ball and coefficient of restitution. When I started thinking about possible investigations I knew I wanted to create a lab that was related to sports.
One Dimensional Kinematics Challenge Problems
 One Dimensional Kinematics Challenge Problems Problem 1: One-Dimensional Kinematics: Two stones are released from rest at a certain height, one after the other. a) Will the difference between their speeds
A tennis player hits a ball at a height of 2.4 m. The ball has an initial horizontal velocity.
 1991 Q31 A tennis player hits a ball at a height of 2.4 m. The ball has an initial horizontal velocity. The ball just passes over the net which is 0.6 m high and 6 m away from her. (Neglect air friction.)
GREG A. SULLENBERGER ACCREDITED ACCIDENT RECONSTRUCTIONIST #677. Seat belt usage analyses. Dynamic analysis of tractor/trailer accidents
 CURRICULUM VITAE GREG A. SULLENBERGER GREG A. SULLENBERGER ACCREDITED ACCIDENT RECONSTRUCTIONIST #677 CURRICULUM VITAE SPECIALIZED EXPERIENCE Airbag module (black box) download certified Commercial vehicle
LECTUR 10 CHARACTERISTICS OF THE DRIVER, THE PEDESTRIAN, THE VEHICLE AND THE ROAD. One problem that faces traffic and transportation engineers is:
 LECTUR 10 CHARACTERISTICS OF THE DRIVER, THE PEDESTRIAN, THE VEHICLE AND THE ROAD 3.1 DRIVER CHARACTERISTICS Physiological Measurable and Usually Quantifiable Psychological Much more difficult to measure
Exploring the relationship between the pressure of the ball and coefficient of restitution.
 Exploring the relationship between the pressure of the ball and coefficient of restitution. When I started thinking about possible investigations I knew I wanted to create a lab that was related to sports.
BUILDING CHINARAP. Zhang Tiejun Research Institute of Highway (RIOH) Beijing, China
 Beijing, China") BUILDING CHINARAP Zhang Tiejun Research Institute of Highway (RIOH) Beijing, China E-mail: tj.zhang@rioh.cn Greg Smith International Road Assessment Programme (irap) Beijing, China E-mail: greg.smith@irap.org
BUILDING CHINARAP Zhang Tiejun Research Institute of Highway (RIOH) Beijing, China E-mail: tj.zhang@rioh.cn Greg Smith International Road Assessment Programme (irap) Beijing, China E-mail: greg.smith@irap.org
1) What is the magnitude of the momentum of a kg baseball traveling at 45.0 m/s?
 What is the magnitude of the momentum of a kg baseball traveling at 45.0 m/s?") Momentum review 6) Two friends are standing on opposite ends of a canoe that is initially at rest with respect to a frictionless lake. The person in the front throws a very massive ball toward the back,
Momentum review 6) Two friends are standing on opposite ends of a canoe that is initially at rest with respect to a frictionless lake. The person in the front throws a very massive ball toward the back,
Prelab for the Ballistic Pendulum
 Ballistic Pendulum 1 Prelab for the Ballistic Pendulum 1. Write the general horizontal and vertical motion Kinematics equations for a horizontally launched projectile. 2. Write the relevant Conservation
Unit conversions: 9. An defensive lineman weighs 330 pounds. What is his mass in kg (given 2.2 pounds = 1 kg)? 330 lb 1 kg. 2.2 lb 10.
? 330 lb 1 kg. 2.2 lb 10.") Practice exam semester 1 physics Walk this Way Activity, Graph Sketching and Recognition, Sonic Ranger Lab: Use the graph to the right for q s 1-3 1. Which object(s) is (are) not moving? 2. Which change
Practice exam semester 1 physics Walk this Way Activity, Graph Sketching and Recognition, Sonic Ranger Lab: Use the graph to the right for q s 1-3 1. Which object(s) is (are) not moving? 2. Which change
An Analysis of Reducing Pedestrian-Walking-Speed Impacts on Intersection Traffic MOEs
 An Analysis of Reducing Pedestrian-Walking-Speed Impacts on Intersection Traffic MOEs A Thesis Proposal By XIAOHAN LI Submitted to the Office of Graduate Studies of Texas A&M University In partial fulfillment
MRI-2: Integrated Simulation and Safety
 MRI-2: Integrated Simulation and Safety Year 3 2 nd Quarterly Report Submitted by: Dr. Essam Radwan, P.E. (PI), Ahmed.Radwan@ucf.edu Dr. Hatem Abou-Senna, P.E., habousenna@ucf.edu Dr. Mohamed Abdel-Aty,
A Conceptual Approach for Using the UCF Driving Simulator as a Test Bed for High Risk Locations
 A Conceptual Approach for Using the UCF Driving Simulator as a Test Bed for High Risk Locations S. Chundi, M. Abdel-Aty, E. Radwan, H. Klee and E. Birriel Center for Advanced Transportation Simulation
Project 1 Those amazing Red Sox!
 MASSACHVSETTS INSTITVTE OF TECHNOLOGY Department of Electrical Engineering and Computer Science 6.001 Structure and Interpretation of Computer Programs Spring Semester, 2005 Project 1 Those amazing Red
Anatomy of a Homer. Purpose. Required Equipment/Supplies. Optional Equipment/Supplies. Discussion
 Chapter 5: Projectile Motion Projectile Motion 17 Anatomy of a Homer Purpose To understand the principles of projectile motion by analyzing the physics of home runs Required Equipment/Supplies graph paper,
Introduction to Transportation Engineering. Discussion of Stopping and Passing Distances
 Introduction to Transportation Engineering Discussion of Stopping and Passing Distances Dr. Antonio A. Trani Professor of Civil and Environmental Engineering Virginia Polytechnic Institute and State University
1. Which one of the following is a vector quantity? A. time B. speed C. energy D. displacement
 1. Which one of the following is a vector quantity? A. time B. speed C. energy D. displacement 2. A car is travelling at a constant speed of 26.0 m/s down a slope which is 12.0 to the horizontal. What
Design Considerations for Complete Streets. The Kiewit Center for Infrastructure and Transportation
 Design Considerations for Complete Streets Objective Provide design geometrics and features that accommodate balanced operations of bicycles, pedestrians and vehicles on a complete street Cul-de-sacs,
Analysis of Backward Falls Caused by Accelerated Floor Movements Using a Dummy
 Original Article Analysis of Backward Falls Caused by Accelerated Floor Movements Using a Dummy Hisao NAGATA 1 * and Hisato OHNO 2 1 National Institute of Occupational Safety and Health, 1 4 6 Umezono,
Ermenek Dam and HEPP: Spillway Test & 3D Numeric-Hydraulic Analysis of Jet Collision
 Ermenek Dam and HEPP: Spillway Test & 3D Numeric-Hydraulic Analysis of Jet Collision J.Linortner & R.Faber Pöyry Energy GmbH, Turkey-Austria E.Üzücek & T.Dinçergök General Directorate of State Hydraulic
ESTIMATION OF THE HEAD INJURY SEVERITY USING THE HEAD IMPACT SPEED BASED ON REAL PEDESTRIAN COLLISIONS
 ESTIMATION OF THE HEAD INJURY SEVERITY USING THE HEAD IMPACT SPEED BASED ON REAL PEDESTRIAN COLLISIONS Samuel, Sánchez Francisco Javier, Páez Arturo, Furones Francisco, Martínez University Institute of
QUESTION 1. Sketch graphs (on the axes below) to show: (1) the horizontal speed v x of the ball versus time, for the duration of its flight;
 to show: (1) the horizontal speed v x of the ball versus time, for the duration of its flight;") QUESTION 1 A ball is thrown horizontally from a cliff with a speed of 10 ms -1 shown in the diagram at right. Neglecting the effect of air resistance and taking gravitational acceleration to be g +9.8ms
QUESTION 1 A ball is thrown horizontally from a cliff with a speed of 10 ms -1 shown in the diagram at right. Neglecting the effect of air resistance and taking gravitational acceleration to be g +9.8ms
b. What is the x-distance from the foot of the cliff to the point of impact in the lake?
 PROJECTILE MOTION An object launched into space without motive power of its own is called a projectile. If we neglect air resistance, the only force acting on a projectile is its weight, which causes its
Exercise on Projectile Motion (Unit-III)
") Engineering Mechanics Exercise on Projectile Motion (Unit-III) 1 A projectile is fired with velocity 620 m/s at an angle of 40 with horizontal ground. Find the range, time of flight, maximum height attained
Engineering Mechanics Exercise on Projectile Motion (Unit-III) 1 A projectile is fired with velocity 620 m/s at an angle of 40 with horizontal ground. Find the range, time of flight, maximum height attained
Secondary Physics: The Compass Rose, Cars and Tracks
 Secondary Physics: The Compass Rose, Cars and Tracks Secondary Physics at the NASCAR Hall of Fame The Great Hall and Glory Road Focus object or destination in the Hall: Compass Rose, 18 compass lines,
CHAPTER 10: LINEAR KINEMATICS OF HUMAN MOVEMENT
 CHAPTER 10: LINEAR KINEMATICS OF HUMAN MOVEMENT 1. Vector mechanics apply to which of the following? A. displacement B. velocity C. speed D. both displacement and velocity 2. If velocity is constant, then
Biomechanics Sample Problems
 Biomechanics Sample Problems Forces 1) A 90 kg ice hockey player collides head on with an 80 kg ice hockey player. If the first person exerts a force of 450 N on the second player, how much force does
Ch06 Work and Energy.notebook November 10, 2017
 Work and Energy 1 Work and Energy Force = push or pull Work = force*distance (//) Technically: Work = force*distance*cos θ 2 Sample 1: How much work is done lifting a 5 N weight 3m vertically? 3 Work is
Numerical analysis of real-world cyclist crashes: impact speed, collision mechanism and movement trajectories.
 Numerical analysis of real-world cyclist crashes: impact speed, collision mechanism and movement trajectories T.Y. Pang 1, H. Sakeran 1, A. Short 2, A.S. McIntosh 1, G. Rechnitzer 2, K.Thai 1 1 School
2. A homemade car is capable of accelerating from rest to 100 km hr 1 in just 3.5 s. Assuming constant acceleration, find:
 Preliminary Work 1. A motorcycle accelerates uniformly from rest to a speed of 100 km hr 1 in 5 s. Find: (a) its acceleration (b) the distance travelled in that time. [ Answer: (i) a = 5.56 ms 2 (ii) x
ITARDA INFORMATION. No.128. Special feature
 ITARDA INFORMATION No.128 Special feature Special feature Accidents when four-wheel vehicles are reversing ~ Drivers must thoroughly check behind them, especially in parking lots! ~ Introduction You may
Advance Yield Markings Reduce Motor Vehicle/Pedestrian. Conflicts at Multilane Crosswalks with an Uncontrolled Approach.
 Advance Yield Markings Reduce Motor Vehicle/Pedestrian Conflicts at Multilane Crosswalks with an Uncontrolled Approach by Ron Van Houten Mount Saint Vincent University J.E. Louis Malenfant Center for Education
Appendix C. TRAFFIC CALMING PROGRAM TOOLBOX
 Appendix C. TRAFFIC CALMING PROGRAM TOOLBOX PHASE I...2 Do Not Enter Sign...3 One-Way Sign...4 Turn Prohibition...5 Pavement Markings...6 Speed Monitoring Trailer...7 Neighborhood Speed Watch...8 Police
AP Physics 1 Multiple Choice Questions - Chapter 3
 1 Resolve a speed vector of 25 m/s @ 55 above the horizontal into x and y components. a 8.25i + 7.55j b 7.55i + 8.25 j c 14.33i + 20.48j d 20.48i + 14.33j e None of the above 2 Resolve a momentum vector
Draft Report. Traffic Impact Study. Superstore, Wal-Mart, and Kent Development. Yarmouth, Nova Scotia. Prepared for
 oad & Traffic Management Road & Traffic Management R Atlantic Traffic Engineering Specialists Draft Report Traffic Impact Study Superstore, Wal-Mart, and Kent Development Yarmouth, Nova Scotia Prepared
EF 151 Final Exam - Spring, 2017 Page 3 Copy 223
 EF 151 Final Exam - Spring, 2017 Page 3 Copy 223 Name: Section: 1. Enter your EXAM ID from your seating label. If you don t know your exam ID, enter 000. 0 1 2 3 4 5 6 7 8 9 Digit #1 Digit #2 Digit #3
Physics Final Exam Review Fall 2013
 Physics Final Exam Review Fall 2013 The lines on the graph represent displacement vectors for the route along which a person moves. Use the figure to answer problems 1 2. 1. What is the total distance
RURAL HIGHWAY SHOULDERS THAT ACCOMMODATE BICYCLE AND PEDESTRIAN USE (TxDOT Project ) June 7, Presented by: Karen Dixon, Ph.D., P.E.
 June 7, Presented by: Karen Dixon, Ph.D., P.E.") RURAL HIGHWAY SHOULDERS THAT ACCOMMODATE BICYCLE AND PEDESTRIAN USE (TxDOT Project 0-6840) June 7, 2016 Presented by: Karen Dixon, Ph.D., P.E., TTI Team: Kay Fitzpatrick, Raul Avelar, & Subasish Das Project
RURAL HIGHWAY SHOULDERS THAT ACCOMMODATE BICYCLE AND PEDESTRIAN USE (TxDOT Project 0-6840) June 7, 2016 Presented by: Karen Dixon, Ph.D., P.E., TTI Team: Kay Fitzpatrick, Raul Avelar, & Subasish Das Project
Chapter Twenty-eight SIGHT DISTANCE BUREAU OF LOCAL ROADS AND STREETS MANUAL
 Chapter Twenty-eight SIGHT DISTANCE BUREAU OF LOCAL ROADS AND STREETS MANUAL Jan 2006 SIGHT DISTANCE 28(i) Chapter Twenty-eight SIGHT DISTANCE Table of Contents Section Page 28-1 STOPPING SIGHT DISTANCE
Agood tennis player knows instinctively how hard to hit a ball and at what angle to get the ball over the. Ball Trajectories
 42 Ball Trajectories Factors Influencing the Flight of the Ball Nathalie Tauziat, France By Rod Cross Introduction Agood tennis player knows instinctively how hard to hit a ball and at what angle to get
ACC.D Projectile Motion Horizontally Launched Projectiles Original Assignment
 ACC.D Projectile Motion Horizontally Launched Projectiles Original Assignment The following diagram pertains to questions #1 and #2 above. A scale is used where 1 cm = 5 meters. (Note that 1 cm may be
Walking Simulator Mechanism
 The Downtown Review Volume 2 Issue 2 Article 4 2015 Walking Simulator Mechanism Titus Lungu Cleveland State University Igor Tachynskyy Cleveland State University Omri Tayyara Cleveland State University
(i) Write down equations for x and y in terms of t. (iii) Find the range of the golf ball.
 Write down equations for x and y in terms of t. (iii) Find the range of the golf ball.") 1 A golf ball is hit at an angle of 60 to the horizontal from a point, O, on level horizontal ground. Its initial speed is 20 m s 1. The standard projectile model, in which air resistance is neglected,
1 A golf ball is hit at an angle of 60 to the horizontal from a point, O, on level horizontal ground. Its initial speed is 20 m s 1. The standard projectile model, in which air resistance is neglected,
Review Problems for Physics A Final
 Review Problems for Physics A Final 1. The fastest helicopter, the Westland Lynx, can travel 3.33 km in the forward direction in just 30.0 s.what is the average velocity of this helicopter? Express your
PHYSICS 12 NAME: Kinematics and Projectiles Review
 NAME: Kinematics and Projectiles Review (1-3) A ball is thrown into the air, following the path shown in the diagram. At 1, the ball has just left the thrower s hand. At 5, the ball is at its original
EF 151 Exam #3, Spring, 2015 Page 1 of 5
 EF 151 Exam #3, Spring, 2015 Page 1 of 5 Name: Section: Instructions: Put name and section on exam and on equation sheet. Do not open the test until you are told to do so. Write your final answer in the
TWO DIMENSIONAL KINEMATICS
 PHYSICS HOMEWORK #11 TWO DIMENSIONAL [Remember that ALL vectors must be described by BOTH magnitude and direction!] 1. You walk 250. steps North and then 400. steps East. What is your displacement? (Distance
Calculate the average acceleration during the 4.6 s time interval. Give your answer to an appropriate number of significant figures.
 Q1.The diagram below shows an electric two-wheeled vehicle and driver. (a) The vehicle accelerates horizontally from rest to 27.8 m s 1 in a time of 4.6 s. The mass of the vehicle is 360 kg and the rider
General Physics Physics 101 Test #1 Fall 2018 Friday 9/21/18 Prof. Bob Ekey
 General Physics Physics 101 Test #1 Fall 2018 Friday 9/21/18 Prof. Bob Ekey Name (print): I hereby declare upon my word of honor that I have neither given nor received unauthorized help on this work. Signature:
The Effect of Pavement Marking on Speed. Reduction in Exclusive Motorcycle Lane. in Malaysia
 Contemporary Engineering Sciences, Vol. 3, 2010, no. 3, 149-155 The Effect of Pavement Marking on Speed Reduction in Exclusive Motorcycle Lane in Malaysia Seyed Farzin Faezi PhD student in highway and
Military Road Safety Improvements
 Military Road Safety Improvements 26 th Road North to 31 st Street North SUMMARY OF DATA REVIEW AND PRELIMINARY RECOMMENDATIONS Prepared for: Department of Environmental Services Traffic Engineering and
Road Safety Facilities Implemented in Japan
 Road Safety Facilities Implemented in Japan 1 Road Safety Facilities 1.Guard Fence 2.Road Lighting 3.Other Road Safety Facilities 2 Road Safety Facilities 1.Guard Fence 2.Road Lighting 3.Other Road Safety
Physics: Principles and Applications, 6e Giancoli Chapter 3 Kinematics in Two Dimensions; Vectors. Conceptual Questions
 Physics: Principles and Applications, 6e Giancoli Chapter 3 Kinematics in Two Dimensions; Vectors Conceptual Questions 1) Which one of the following is an example of a vector quantity? A) distance B) velocity
A Study on the Widths Design of Highway Roadside Clear Zone by Considering Multi-Factors
 Available online at www.sciencedirect.com ScienceDirect Procedia - Social and Behavioral Sciences 96 ( 2013 ) 2584 2594 A Study on the Widths Design of Highway Roadside Clear Zone by Considering Multi-Factors
ATHLETICS OMNIBUS - TRIPLE JUMP From the Athletics Omnibus of Richard Stander, South Africa
 ATHLETICS OMNIBUS - TRIPLE JUMP From the Athletics Omnibus of Richard Stander, South Africa The objective of triple jumping is to try and jump as far as possible by stepping on a take off board, take 2
Exam 3 Phys Fall 2002 Version A. Name ID Section
 Closed book exam - Calculators are allowed. Only the official formula sheet downloaded from the course web page can be used. You are allowed to write notes on the back of the formula sheet. Use the scantron
R3 Safety and Rescue. Rescue 3 Europe Instructor Update SPECIALIST TRAINING SOLUTIONS. Search Content Review 2013 R3SAR
 R3 Safety and Rescue Rescue 3 Europe Instructor Update Search Content Review 2015 Locate L. A. S. T. New Content in Manual Drivers Continue to align syllabus with best practice Several significant water
Simulation Analysis of Intersection Treatments for Cycle Tracks
 Abstract Simulation Analysis of Intersection Treatments for Cycle Tracks The increased use of cycle tracks also known as protected bike lanes has led to investigations of how to accommodate them at intersections.
INDEX. Geometric Design Guide for Canadian Roads INDEX
 Acceleration lane, see Lanes, Acceleration Access, 8.1 Access Management and Functional Classification 8.2 Access Management by Design Classification 8.3 Access Configuration 8.4 Building Set-Back Guidelines
by Michael Young Human Performance Consulting
 by Michael Young Human Performance Consulting The high performance division of USATF commissioned research to determine what variables were most critical to success in the shot put The objective of the
Cutnell/Johnson Physics
 Cutnell/Johnson Physics Classroom Response System Questions Chapter 3 Kinematics in Two Dimensions Interactive Lecture Questions 3.1.1. A truck drives due south for 1.2 km in 1.5 minutes. Then, the truck
Circular Motion - Horizontal
 Circular Motion - Horizontal Outcome(s): explain and apply the concepts of centripetal acceleration and centripetal force, as applied to uniform horizontal circular motion. A bucket being swung around
K. Bhalla 1, P. Montazemi 1, J. Crandall 1, J. Yang 2, X. Liu 2, Y. Dokko 3, Y. Takahashi 3, Y. Kikuchi 3, D. Longhitano 4
 VEHICLE IMPACT VELOCITY PREDICTION FROM PEDESTRIAN THROW DISTANCE: TRADE-OFFS BETWEEN THROW FORMULAE, CRASH SIMULATORS, AND DETAILED MULTI-BODY MODELING K. Bhalla 1, P. Montazemi 1, J. Crandall 1, J. Yang
Worksheet 1.1 Kinematics in 1D
 Worksheet 1.1 Kinematics in 1D Solve all problems on your own paper showing all work! 1. A tourist averaged 82 km/h for a 6.5 h trip in her Volkswagen. How far did she go? 2. Change these speeds so that
Name: SOLUTIONS MIDTERM 2, Spring 2019
 Name: SOLUTIONS MIDTERM 2, Spring 2019 Solutions in bold. Print your name clearly above, and write and bubble in your student 800 number on the provided scantron. There are 20 equally-weighted problems
Texas Driver Education Classroom and In-car Instruction Model Curriculum
 Texas Driver Education Classroom and In-car Instruction Model Curriculum BasicManeuvering Tasks: Moderate Risk Environment Module Four SPACE MANAGEMENT CONCEPTS CHANGING LANES TURNABOUTS PARKING WORKSHEETS
1. downward 3. westward 2. upward 4. eastward
 projectile review 1 Name 11-DEC-03 1. A baseball player throws a ball horizontally. Which statement best describes the ball's motion after it is thrown? [Neglect the effect of friction.] 1. Its vertical
TEACHER ANSWER KEY December 10, Projectile Review 1
 Projectile Review 1 TEACHER ANSWER KEY December 10, 2004 4 1. A baseball player throws a ball horizontally. Which statement best describes the ball's motion after it is thrown? [Neglect the effect of friction.]
HONORS PHYSICS One Dimensional Kinematics
 HONORS PHYSICS One Dimensional Kinematics LESSON OBJECTIVES Be able to... 1. use appropriate metric units and significant figures for given measurements 2. identify aspects of motion such as position,
The diagram below represents the path of a stunt car that is driven off a cliff, neglecting friction.
 1. A baseball is thrown at an angle of 40.0 above the horizontal. The horizontal component of the baseball s initial velocity is 12.0 meters per second. What is the magnitude of the ball s initial velocity?
1. Find the potential energy of 20 Kg mass child sitting on a roof 10 m above the ground.
 LECTURE_8 Name: ID: DATE: 22/04/2015 101 PHYS ASSIGNMENT 1. Find the potential energy of 20 Kg mass child sitting on a roof 10 m above the ground. 2. A women is pulling a box of 20 Kg mass on a horizontal
Pedestrian Scenario Design and Performance Assessment in Driving Simulations
 Pedestrian Scenario Design and Performance Assessment in Driving Simulations Achal Oza, Qiong Wu, and Ronald R. Mourant Virtual Environments Laboratory, Dept. of Mechanical and Industrial Engineering 334
CHAPTER 1. Knowledge. (a) 8 m/s (b) 10 m/s (c) 12 m/s (d) 14 m/s
 8 m/s (b) 10 m/s (c) 12 m/s (d) 14 m/s") CHAPTER 1 Review K/U Knowledge/Understanding T/I Thinking/Investigation C Communication A Application Knowledge For each question, select the best answer from the four alternatives. 1. Which is true for
CHAPTER 1 Review K/U Knowledge/Understanding T/I Thinking/Investigation C Communication A Application Knowledge For each question, select the best answer from the four alternatives. 1. Which is true for