Federative Republic of Brazil irap Pilot Technical Report
|
|
|
- Polly Burns
- 5 years ago
- Views:
Transcription
1 Report No: AUS Federative Republic of Brazil irap Pilot Technical Report.. Federal Highways November 2015 GTI04 LATIN AMERICA AND CARIBBEAN.
2 . Standard Disclaimer: This volume was prepared by the International Road Assessment Programme (irap), under a Global Road Safety Facility financing, trust-fund managed by the International Bank for Reconstruction and Development/ The World Bank. The findings, interpretations, and conclusions expressed in this pa do not necessarily reflect the views of the Executive Directors of The World Bank or the governments they represent. The World Bank does not guarantee the accuracy of the data included in this work. The boundaries, colors, denominations, and other information shown on any map in this work do not imply any judgment on the part of The World Bank concerning the legal status of any territory or the endorsement or acceptance of such boundaries. Copyright Statement: The material in this publication is copyrighted. Copying and/or transmitting portions or all of this work without mission may be a violation of applicable law. The International Bank for Reconstruction and Development/ The World Bank encourages dissemination of its work and will normally grant mission to reproduce portions of the work promptly. For mission to photocopy or reprint any part of this work, please send a request with complete information to the Copyright Clearance Center, Inc., 222 Rosewood Drive, Danvers, MA 01923, USA, telephone , fax , All other queries on rights and licenses, including subsidiary rights, should be addressed to the Office of the Publisher, The World Bank, 1818 H Street NW, Washington, DC 20433, USA, fax , e- mail pubrights@worldbank.org. irap DNIT Technical Report 1
3 About irap The International Road Assessment Programme (irap) is a registered charity dedicated to saving lives through safer roads. irap works in partnership with government and non-government organisations to: inspect high-risk roads and develop Star Ratings and Safer Roads Investment Plans, provide training, technology and support that will build and sustain national, regional and local capability, and track road safety formance so that funding agencies can assess the benefits of their investments. The programme is the umbrella organisation for EuroRAP, AusRAP, usrap and KiwiRAP. Road Assessment Programmes (RAP) are now active in more than 70 countries throughout Europe, Asia Pacific, North, Central and South America and Africa. irap is financially supported by the FIA Foundation for the Automobile and Society and the Road Safety Fund. Projects receive support from the Global Road Safety Facility, automobile associations, regional development banks and donors. National governments, automobile clubs and associations, charities, the motor industry and institutions such as the European Commission also support RAPs in the developed world and encourage the transfer of research and technology to irap. In addition, many individuals donate their time and extise to support irap. For more information This report was written by: Morgan Fletcher, Senior Road Safety Engineer, irap (morgan.fletcher@irap.org) Julio Urzua, Regional Director Latin America and the Caribbean, irap (julio.urzua@irap.org) For general enquiries, contact us at: International Road Assessment Programme (irap) Worting House, Basingstoke Hampshire, UK, RG23 8PX Telephone: +44 (0) icanhelp@irap.org To find out more about the programme, visit You can also subscribe to WrapUp, the irap e-newsletter, by sending a message to icanhelp@irap.org. International Road Assessment Programme (irap) 2015 irap technology including protocols, processes and brands may not be altered or used in any way without the express written agreement of irap. irap is registered in England & Wales under company number Registered Office: 60 Trafalgar Square, London, WC2N 5DS. irap September 2015 irap DNIT Technical Report 2
4 Document Version History Version Date Description irap /09/2015 FINAL DNIT Pilot Study Technical Report English version irap /08/2015 irap /06/2015 irap DNIT Technical Report 3


5 irap DNIT Technical Report 4
6 1 Executive Summary As part of efforts to curb road deaths and serious injuries, the World Bank Global Road Safety Facility (GRSF) invited the International Road Assessment Programme (irap) to work with the National Department of Transport Infrastructure (Departamento Nacional de Infraestrutura de Transportes, DNIT) to assess the safety of Brazilian roads. During this second assessment of Brazilian roads, approximately 3,400km of roads were assessed. This technical report describes the road assessment project and includes details on data collection, the methodology used and a summary of the results. The infrastructure-related risk assessment involved detailed surveys and coding of 50 road attributes at 100 metre intervals along the network and creation of Star Ratings, which provide a simple and objective measure showing the level of risk on the road network. The star ratings show that 1% of road length is rated as 5-star, 9% is rated as 4-star, 58% is rated as 3-star, and the remaining 32% is rated as 2-star and below for vehicle occupants. For motorcyclists, no roads were rated as 5-star, only 3% of road length is rated as 4-star, 47% is rated as 3-star, and the remaining 50% is rated 2-star and below. For pedestrians less than 1% is rated as 4- star and 5-star, 2% is rated as 3-star and the remaining 13% is rated 2-star and below. For bicyclists less than 1% is rated as 5-star or 4-star, 5% is rated as 3-star and the remaining 14% is rated 2-star and below. Table 1 Star Ratings, DNIT Pilot Study Vehicle Occupant Motorcycle Pedestrian Bicycle Star Ratings Length (km) Percent Length (km) Percent Length (km) Percent Length (km) Percent 5 Stars % 0.6 0% 3.0 0% % 4 Stars % % % % 3 Stars % % % % 2 Stars % % % % 1 Star % % % % N/A 9.0 0% 9.0 0% % % Totals % % % % Note: the table shows smoothed Star Ratings. The road attribute data show that the vast majority of the survey was conducted on single carriageway roads, with infrequent physical separation between opposing flows. Roadside hazards are numerous, with over half of the survey length having hazardous objects within 5m of the running lane and limited road side protection (such as safety barriers). In locations where safety barriers were present, unprotected safety barrier terminal ends were identified as the key hazard in almost 750 instances. Provision for vulnerable road users is variable with limited, bicycle facilities present and often insufficient footpath provision and crossing facilities where pedestrian numbers are high. The project also involved the creation of a Safer Roads Investment Plans, which draws on more than 90 proven road safety treatments, ranging from low cost road markings and pedestrian refuges to higher cost intersection upgrades and full highway duplication. The Safer Roads Investment Plan in this report prioritises countermeasures that could maximise the prevention of deaths and serious injuries within the available budget. The plan largely focuses on: reducing the likelihood of vehicles running off the road and reducing the risk associated with run-off road crashes by improving shoulders, installing rumble strips and reducing the severity of roadsides, and providing facilities for pedestrians and bicyclists. irap DNIT Technical Report 5
7 Table 2 below shows that an investment of R$1.71 billion could reduce the number of deaths and serious injuries on the road by 46%, preventing over 56,000 deaths and serious injuries over 20 years. The overall benefit cost ratio of this approach would be 7.6:1. The SRIP was produced using a threshold BCR of 3 (that is, the economic benefit of each countermeasure had to be greater than or equal to 3 times the cost). Table 2 Investment Plan Summary Present value of investment SRIP Estimated deaths on surveyed network (2013) 552 Estimated deaths and serious injuries on surveyed network (2013) 6,072 Deaths and serious injuries prevented Present value of safety benefits Cost death and serious injury prevented Benefit cost ratio (BCR) 7.6 R$1,71 billion US$0.55 billion 2,815 ( year) 56,300 (20 years) R$13.01 billion US$4.16 billion R$30,425 US$9,736 Reduction in death and serious injuries 46% Roadside barriers - passenger side km Shoulder rumble strips 1,396.8 km Roadside barriers - driver side km Footpath provision passenger side km (adjacent to road) Skid Resistance (paved road) 88.2 km Traffic calming km Footpath provision passenger side (>3m km from road) Bicycle Lane (off-road) km Key treatments proposed Footpath provision driver side (adjacent to road) Clear roadside hazards - passenger side Street lighting (mid-block) Clear roadside hazards - driver side Additional lane (2 + 1 road with barrier) Central median barrier (no duplication) Footpath provision driver side (>3m from road) Improve Delineation Delineation and signing (intersection) Duplication with median barrier Refuge Island Improve curve delineation Pedestrian fencing Street lighting (intersection) Signalised crossing Exchange rate: R$1 = US$0.32 (June 2015) km km km km 37.1 km 74.6 km 69.1 km km 387 sites 12.5 km 837 sites 63.8 km 34.6 km 306 sites 167 sites irap DNIT Technical Report 6
8 The selection of an appropriate level of investment is open for decision by the DNIT. Final implementation of the plan will preferably include the following steps: local examination of proposed countermeasures (including a value engineering type workshop including all relevant stakeholders), detailed analysis of traffic survey and crash data (if available), preliminary scheme investigation studies, including site surveys and preliminary design, detailed design, star ratings of the designs, road safety audit, detailed costing and procurement, final evaluation and construction, and post-construction evaluation and road safety audit, including Star Ratings for the upgraded road and analysis of crash data (if it is available). The detailed results of the project and online software that enabled the irap analyses to be undertaken are available to stakeholders for further exploration and use. However, in order to achieve the best road safety gains on the network, efforts that go beyond the engineering improvements discussed in this report will be necessary. Significant benefits could be realised through the coordinated improvement of road user behaviour (such as speeding, seat belt and helmet wearing and driving under the influence of alcohol or drugs) and vehicles, as well as road infrastructure. The Road Safety Toolkit ( and United Nations Road Safety Collaboration Good Practice Manuals provide further information on these issues. The use of star rating targets would provide an objective measure of infrastructure safety and simplify road safety policy management, communication and accountability. The star rating can be used for network level targets, corridor and road hierarchy specific formance targets, or linked to maintenance and oational management of the road asset. Examples include targets for 4-star roads of national significance (New Zealand), 4-star roads for pedestrians and cyclists in linear settlements (Asian Development Bank) and 90% of travel on 3-star or better by 2020 (UK). For newly constructed roads the star rating target can be specified at the planning and design stage (e.g. the new road shall be 4-star standard for pedestrians and vehicle occupants at the desired oating speed of 60km/h). The improved star rating can also be confirmed prior to opening and the outcome celebrated within the project team, road agency and the public. The appropriate star rating target for an individual road network or project will reflect the existing standard of the road, the strategic purpose of the route and the volume of particular road users, available funding and political will. In principle targets should seek to maximise deaths and serious injuries saved unit of investment and therefore in general higher volume roads will have higher star rating targets. irap encourages the setting of a minimum 3-star formance management goal for new projects and targets linked to vehicle travel for existing networks. irap DNIT Technical Report 7
9 Acknowledgments The irap DNIT Pilot project would not have been possible without the support of numerous people and organisations. These include: Servicios Mexicanos de Ingenieria Civil (SEMIC) Ivone Catarina Simões Hoffmann, Manager of Road Safety and Engineering, DNIT Alexandre Castro Fernandes, General Manager of Highway Oations, DNIT Valter Tani, Manager of Transport Engineering Projects, Labtrans, Universidade Federal de Santa Catarina Labtrans sonnel, Universidade Federal de Santa Catarina The project was funded by the World Bank Global Road Safety Facility with support from Bloomberg Philanthropies. irap s activities in Brazil are supported by the FIA Foundation and the Road Safety Fund. irap DNIT Technical Report 8
10 Contents 1 Executive Summary Introduction Road safety in Brazil The DNIT Road Network Methodology Online results irap and the Safe System Approach Road Surveys and Coding Road Surveys irap Coding Road attributes Supporting Data The role of speed Speed data Traffic volumes Motorcycle volumes Pedestrian and bicycle flows Number of deaths and serious injuries The economic cost of a death and serious injury Countermeasure costs Star Ratings Smoothed Star Ratings The Star Rating Results Star Rating Maps Example Star Ratings Safer Roads Investment Plans Star Ratings after countermeasure implementation Economic Assessment Implementation and recommendations Prioritisation Commit to a Safe System approach Engage with local communities irap DNIT Technical Report 9
11 8.4 Review road safety data collection procedures Set policy targets Institutionalisation of the irap Methodology in DNIT Training and support for a national BrasilRAP programme Appendices Appendix A: Countermeasure Costs Appendix B: List of abbreviations and acronyms References irap DNIT Technical Report 10
12 2 Introduction Around the world 1.24 million people die as a result of road traffic crashes each year, that s 3,400 deaths day, or one every 25 seconds. 1 Although several high income countries are reducing the number of deaths on their roads, many low and middle-income countries are exiencing an increase in the numbers of fatal and serious injuries. With road traffic fatalities now the leading cause of death for young people aged 15 to 29 worldwide and 92% of road traffic deaths occurring in low and middle-income countries, key partners in global road safety have come together in an attempt to tackle this rapidly worsening public health crisis through accelerated investment in road safety and by fundamentally changing the way we design, build and maintain our road infrastructure networks around the world. As such, the United Nations has declared the Decade of Action for Road Safety. It is expected that during the decade, significant efforts will be made to stabilise and then reduce the death toll through systematic improvements in road infrastructure, road user behaviour and vehicle safety. 2.1 Road safety in Brazil It is recognised that investment in the transport network plays an important role in a country s economic development and poverty reduction. To this end, the Government of Brazil has invested heavily in road building programmes in recent years in order to improve mobility and reduce journey times 2. However, it is of paramount importance that every opportunity be taken to ensure that these new roads and rehabilitation projects focus on the need for safe road infrastructure for all road users, particularly the young and vulnerable. Each year road crashes in Brazil result in unprecedented levels of death and serious injury. The 2009 WHO Global Status on road safety reported that in ,155 people were killed in Brazil with an estimated 407,685 seriously injured. In the 2013 WHO Global Status report on road safety official figures showed that 37,594 people were killed in Brazil in The underreporting of fatalities due to road trauma in Brazil is also concerning. The World Health Organization estimates that the official figures understate deaths by almost 20% in Brazil, with a true number of deaths annum due to road trauma being of 43, This World Bank estimate equates to 22.5 deaths in Brazil a figure over 6 times higher than that attributable to road trauma in the UK. 2.2 The DNIT Road Network In 2014 the International Road Assessment Programme (irap) was invited by the Global Road Safety Facility (GRSF), funded with support from Bloomberg Philanthropies, to carry out an assessment on the DNIT road network. The project was designed to assist DNIT assess road infrastructure-related risk on 3,400km of highrisk roads and identify economically viable road safety countermeasures. The DNIT federal road network comprises over 55,000km of roads. 1 WHO Global status report on road safety (2013) Table 2A, WHO Global status report on road safety (2013) irap DNIT Technical Report 11

13 The project included assessments of the following roads: Table 3 DNIT federal surveyed road network Road name State Survey date Surveyed length BR-020 Distrito Federal 18/12/ km BR-101 Pernambuco 15/01/ km BR-101 Rio de Janeiro 07/01/ km BR-116 Ceará 17/01/ km BR-174 Mato Grosso 24/12/ km BR-222 Ceará 17/01/ km BR-251 Minas Gerais 19/12/ km BR-262 Espírito Santo 11/01/ km BR-356 Rio de Janeiro 05/01/ km BR-364 Mato Grosso 21/12/ km BR-364 Acre 28/12/ km BR-482 Espírito Santo 10/01/ km Total (km) km This report provides the technical details for the assessment of the DNIT controlled roads including details on data collection and the methodology used along with a summary of results. The Star Rating results and Safer Roads Investment Plans shown here will assist both the DNIT and design consultants in ensuring the safety of all road users is adequately addressed within the designs for the rehabilitation of these roads. Figure 1 Map of Brazil irap DNIT Technical Report 12

14 2.3 Methodology The production of Star Ratings and Safer Road Investment Plans involve a number of data collection, survey and analysis processes, as illustrated in Figure 2. The irap assessments make use of road attribute data for 78 variables at 100 metre intervals along a road. Thus, the data collection task is huge; in this project in Brazil for example, a total of 2,648,412 data points were recorded. These data were compiled through road surveys that collect digital images of the road using multi-view high-resolution cameras as it is driven. After the images were collected, they were viewed by coders using specialised software in the office to record the road attributes. Figure 2 The irap road survey, coding, Star Rating and Safer Roads Investment Plan process irap uses globally consistent models to produce vehicle occupant, motorcyclist, pedestrian and bicyclist Star Ratings and Safer Road Investment Plans. The methodology for each of these is described in: Star Rating Roads for Safety: The irap Methodology, and Safer Roads Investment Plans: The irap Methodology. These reports are available for download at: Other irap reference documents used in this project include: The True Cost of Road Crashes Valuing life and the cost of a serious injury, Vehicle Speeds and the irap Protocols, irap Star Rating Coding Manual v3, and Road Coding Quality Assurance Guide. 2.4 Online results This report provides details of the methodology used and summarises the results produced in the DNIT Pilot Study. Full results, including data tables and charts, interactive maps and download files, as well as data underpinning the analyses, are available in the irap online software at irap DNIT Technical Report 13


15 Figure 3 ViDA login page The Star Ratings and Safer Road Investment Plans shown in this report can be accessed through ViDA the Road Assessment Programme s online analysis software. A guide to using ViDA to access the full results, plus details on how to request a User Account is available at The guidance document shows how the maps, charts, tables, economic analysis and download files can help to improve safe road design by improving understanding of the role that road infrastructure plays in influencing the likelihood and severity of common crash types and identifying countermeasures that will reduce risk. Access to the irap online software is password protected. Usernames and passwords will be allocated to all irap project stakeholders. For further information about accessing or using the software, contact Morgan Fletcher at morgan.fletcher@irap.org. irap DNIT Technical Report 14
16 3 irap and the Safe System Approach Road deaths and injuries are the result of a complex interaction between the way people behave on the roads, the types of vehicles in use and the speed they are travelling, and the design of the roads themselves. Despite this complexity, the process of creating a road system that is genuinely safe is now well understood. Exience in implementing the well-established safe system approach, which recognises the mutual importance of safe road users, safe vehicles and safe roads, shows how death and serious injury can be prevented on a large scale. 4 The following principles broadly underline the safe system approach and inform the irap process: mistakes, errors of judgment and poor driving decisions are intrinsic to humans. The road safety system needs to be designed and oated to account for this, humans are fragile. Unprotected, we cannot survive impacts that occur at even moderate speeds, people who behave with criminal disregard for the safety of themselves and others should expect tough policing and tough penalties, safety can be built into the road system in a comprehensive and systematic fashion, not just having the apparent problem areas patched up, and the engineered elements of the system - vehicles and roads - can be designed to be compatible with the human element, haps taking lessons from motor racing that while crashes will occur, the total system is designed to minimise harm. The role of irap is to focus specifically on the safe roads element of the safety equation, in the context of safer road users, safer vehicles and safe roads. irap builds on the exience of developed countries that have a proven track record in infrastructure safety and, with the support of local engineers and researchers, applies knowledge and technical processes that are applicable for low and middle-income countries. A safe road will recognise and make provision for the limitations of humans within the transport system. The network should be designed to limit the probability of crashes occurring and minimise the severity of those crashes that do occur. Evidence shows that affordable, safe road infrastructure can cut vehicle occupant, motorcyclist, pedestrian and bicyclist deaths dramatically. Few infrastructure investments can match the economic benefits of those generated by targeted road safety measures (see Figure 4 below). Research from Australia, the United States, the United Kingdom, Norway, France, Canada, Netherlands, the Nordic Countries and New Zealand shows that targeted road safety projects generated crash cost savings of up to 60 times the cost of construction. 5 That is, for each $1 invested, there was a return of up to $60 in terms of crash costs avoided. Other research has shown that low-cost improvements at specific high-risk sites have shown first year rates of return of 300%. 6 With adequate maintenance, road infrastructure investment can last decades, so the safe roads built today will continue saving lives and preventing injuries long into the future. 4 See for example and 5 OECD (2008) Towards Zero Ambitious road safety targets and the safe systems approach -- page 96, section 4.2 The road safety management system. 6 Road Safety Foundation (2008). irap DNIT Technical Report 15
.")


17 Figure 4 Number of lives saved for each $100m invested 7 Engineering solutions exist for all of the primary crash types that kill road users, Table 4 below shows a summary of each of the common crash types with details of the engineering solutions that are proven to reduce risk, further information on these treatments can be found in the irap Road Safety Toolkit ( Table 4 Primary causes of road death and engineering solutions that save lives Crash Type / Mechanism Engineering Solutions Examples Hit Pedestrian Crash Pedestrians are killed walking along the road and in trying to cross the road. Solutions include: Footpaths, pedestrian fencing, speed management and traffic calming, safe crossing points. Head-on Crash Oncoming traffic collides at high speed (while overtaking or when momentarily crossing into the opposing lane). Solutions include: Provision of overtaking lanes, median barriers or separation, flexible posts, central hatching. Run-off Road Crash Vehicle leaves the road and strikes a fixed object (tree, pole, structure) or steep embankment. Solutions include: Protection of the hazard with barriers, remove hazard, provide safe run-off area. 7 Vulcan, P. and Corben, B. (1998) Prediction of Australian Road Fatalities for the Year 2010, Monash University Accident Research Centre (MUARC), Melbourne. irap DNIT Technical Report 16


18 Crash Type / Mechanism Engineering Solutions Examples Intersection Crash High speed frontal or side impact, rear-end crash with non-compatible vehicles. Solutions include: Grade separation, speed management, roundabouts, signalisation, turning lanes. Hit Bicyclist Crash Bicyclists are killed cycling along the road and in trying to cross the road. Solutions include: On-road and off-road, cycle paths, speed management and traffic calming, safe crossing points. An important principle for irap is the application of countermeasures on a large scale. Exience from the health sector has taught us that large-scale application of proven treatments is essential in eradicating widespread epidemics. Oation Smallpox Zero for example, was responsible for eradicating this deadly disease in just ten years. The programme of Smallpox vaccinations was described as a triumph of World Health Organization management, not of medicine. Likewise the systematic safety upgrading of the Brazilian road network over the Decade of Action can make a significant contribution to the eradication of road traffic death and injury. irap DNIT Technical Report 17

19 4 Road Surveys and Coding The road network was surveyed using a specially equipped vehicle which recorded digital images at 10m intervals to enable the coding of more than 50 road attributes relating to the likelihood and severity of a crash. 4.1 Road Surveys The surveys were undertaken by Servicios Mexicanos de Ingenieria Civil (SEMIC) between December 2014 and January 2015 using a proprietary digital imaging system. The features of the inspection system were: use of five high-resolution digital cameras (1624 x 1224 pixels). digital images collected with more than a 180 degree field of view at 10m intervals. geo-reference data collected for each digital image, including distance along road (from an established start point) plus latitude and longitude coordinates. calibrated images that enable detailed measurements of the road features. the capability to provide automated measurements of radius of curvature for horizontal curves, gradient for vertical alignment and vehicle travel speeds. Figure 5 The SEMIC survey vehicle 4.2 irap Coding Upon completion of the surveys, trained and exienced SEMIC coding teams recorded road attributes from digital images using the proprietary SEMIC VISOR Processing Toolkit software, in accordance with the irap Star Rating Coding Manual v3. The coded data were subject to quality assurance checks in accordance with the irap Road Coding Quality Assurance Guide, to ensure the highest standards of quality and consistency during the road coding process and subsequent quality reviews prior to data processing. irap DNIT Technical Report 18
20 4.3 Road attributes The following table summarises the road attributes recorded at the completion of the baseline survey (January 2015) and helps to illustrate the relationship between road infrastructure attributes and road user risk. A full data set of the coded attributes is also available as a downloadable file from Table 5 Recorded road attributes (survey length: 3395km) Road attribute Category Details / key findings % % % % % Oating Speed 55km/h 2% See next section on the importance of oating speed in relation to the irap model 60km/h 5% 65km/h 25% 70km/h 1% 75km/h 7% 80km/h 51% 85km/h 5% 95km/h 4% 115km/h 1% Number of lanes ( direction) One 75% Two 19% Three 3% Four or more <1% Two and one 2% Road User Risk* V MC P B Lane width Wide 66% Medium 34% Narrow 1% Paved shoulder width Wide 28% Medium 40% Narrow 23% None 9% Curvature straight or gently curving 83% moderate 13% Sharp 4% Very sharp <1% Quality of curve Adequate 14% Poor 3% irap DNIT Technical Report 19
21 Not applicable 83% Delineation Adequate 83% Shoulder rumble strips (raised profile edge lines) Poor 17% Present 0% Not present 100% Road surface condition Good 90% Medium 5% Poor 4% Roadside severity - driver-side object Safety barrier - metal 3% Safety barrier - concrete 6% Upwards slope - rollover gradient Upwards slope - no rollover gradient 10% 2% Deep drainage ditch <1% Downwards slope 20% Cliff 1% Tree >=10cm dia. 27% Sign, post or pole >= 10cm dia. Non-frangible structure/bridge or building Frangible structure or building Unprotected safety barrier end 13% 1 <1% 2% None 14% Roadside severity - driver-side distance 0 to <1m 8% Roadside severity - passenger-side object 1 to <5m 58% 5 to <10m 14% >= 10m 19% Safety barrier - metal 2% Safety barrier - concrete 1% Aggressive vertical face 1% Upwards slope - rollover gradient Upwards slope - no rollover gradient 12% 3% Downwards slope 19% Cliff 1% Tree >= 10cm dia. 31% Sign, post or pole >=10cm dia. Non-frangible structure/bridge or building 17% 1% irap DNIT Technical Report 20
22 Roadside severity passenger-side distance Frangible structure or building Unprotected safety barrier end 1% 3% None 10% 0 to <1m 4% 1 to <5m 60% 5 to <10m 18% >=10m 19% Median type Safety barrier - metal <1% Safety barrier - concrete 3% Physical median width >= 20.0m Physical median width >= 10.0m to < 20.0m Physical median width >= 5.0m to < 10.0m Physical median width >= 1.0m to < 5.0m 3% 6% 6% 4% Centre line 29% Wide centre line (0.3m to 1m) Intersections Merge lane 1% 49% Roundabout <1% 3-leg (unsignalised) with protected turn lane 3-leg (unsignalised) with no protected turn lane 4-leg (unsignalised) with no protected turn lane Median crossing point formal Intersection quality Adequate 3% Sidewalk - driver-side Sidewalk - passenger-side <1% 4% 1% <1% Poor 5% N/A 92% Non-physical separation 1.0m to <3.0m None 99% Other <1% Non-physical separation 1.0m to <3.0m Non-physical separation 0m to <1.0m 1% 1% 2% None 96% Informal path >= 1.0m 1% Pedestrian crossing facilities Grade separated facility 87 irap DNIT Technical Report 21
23 Signalised with refuge 41 Signalised without refuge 13 Unsignalised marked crossing with refuge Unsignalised marked crossing without a refuge No facility Pedestrian fencing Present 100% Street lighting Not present 88% Present 12% Traffic calming Present 1% Bicycle lane Present 1% *VO - vehicle occupants, MC motorcyclists, P - pedestrians, BC - bicyclists The Detailed Road Condition tables within ViDA provide the length and centage of the filtered network for each category of recorded road attribute. They can be used to compare the infrastructure attributes of different roads or road sections and can help to provide an understanding of the Star Ratings of a given road section and the proposed countermeasures that will potentially alter the road attributes and reduce risk. irap DNIT Technical Report 22
24 5 Supporting Data Although the irap Star Ratings and Safer Roads Investment Plans use a standardised global methodology, the models are calibrated with local data to ensure that the results reflect local conditions. The following section outlines the supporting data and how it was used in the irap analysis. 5.1 The role of speed The issue of speed management is of paramount importance in road safety and in-turn traffic speeds have a significant bearing on the irap Star Ratings. The risk of death or serious injury is minimised in any crash, where: vulnerable road users (e.g. motorcyclists, bicyclists and pedestrians) are physically separated from cars and heavier vehicles, or traffic speeds are 40km/h or less, opposing traffic is physically separated and roadside hazards such as trees and other fixed objects (including concrete guard posts) are well managed, and traffic speeds are restricted to 70km/h or less on roads where opposing traffic flows are not physically separated, or where roadside hazards exist. The safety of infrastructure is heavily influenced by the speed of traffic and without an understanding of the oating speeds it is difficult to assess the safety formance of infrastructure at a given location. All irap assessments are based on vehicle oating speeds to ensure that the Star Rating is based on how the road is actively functioning, which in some cases can be above the posted speed limit. For further details of the irap specifications in relation to vehicle speeds see Vehicle Speeds and the irap Protocols, which can be found on the irap website In many countries there can be a marked difference between the posted speed limit and the actual speed of vehicles using the road. This is a function of local behaviour, local enforcement practice and whether the engineering features of the road are designed in accordance with the speed limit, for example the use of traffic calming measures to help manage speeds. 5.2 Speed data Due to the lack of comprehensive speed data across the network an estimate of vehicle oating speeds was made. The method adopted to estimate the 85 th centile oating speeds, the median oating speed and the assumptions made are detailed below. Posted speed data collected during data coding were used as a basis for estimating oating speeds and 85 th centile oating speed. Assumptions were based on the analysis of speed surveys from data provided by the DNIT, and are contained in the following table. irap DNIT Technical Report 23
25 Table 6 Oating Speed Assumptions Posted Speed 85th Percentile speed Mean Speed <30km/h Oating speeds were then adjusted based on a review of the images to take into account traffic flow, land use, curvature and road surface quality, plus other attributes that could influence the oating speed. 5.3 Traffic volumes Total traffic flow (or volume) for all motorised vehicles is required for each road section and is used in the estimation of the distribution of the numbers of deaths and serious injuries that could be prevented on the network. The data are required to be in Annual Average Daily Traffic (AADT) format and should not be adjusted to passenger car equivalent (PCU) volumes. The AADT for the road sections within this assessment were provided by DNIT. However, data were not provided for all road sections within this assessment therefore where data have not been supplied estimates have been made based on observations made during the analysis phase of the project based on survey images. 5.4 Motorcycle volumes Detailed data on motorcycle traffic was not available for all roads included in the assessment. Estimates have been made based on other data sources such as observed flow during coding. Due to the interurban nature of the majority of roads assessed, motorcycle volumes were recorded as not exceeding 5% of the vehicle flow. 5.5 Pedestrian and bicycle flows Pedestrian and bicycle flows were recorded during the coding process. It is possible to rely solely on this data for processing, though it is not recommended. This is because pedestrian and bicycle flows can be transitory and a one-off visual inspection is unlikely to provide a strong basis for determining overall flows. In this project, pedestrian and bicyclist flows were estimated based on observed flows and the surrounding land use and road attributes. The approach used for estimating pedestrian along and crossing flows and bicyclist flows was as follows: An estimate was made for each 100 metre segment of road based on adjacent land use and road attributes. See irap 310: A Guide to Producing irap Star Ratings and Safer Roads Investment Plans for further information on estimating flows based on adjacent land use. irap DNIT Technical Report 24
26 If the estimate was less than the observed flow, then the observed flow was selected. It is noted that from time to time, this step could cause create an artificially high number if an unusually large number of people or bicycles happened to be observed. The pedestrian and bicyclist flows along the road were smoothed across 500 metre lengths for pedestrians and 1km for bicyclists by taking the highest value in that length (pedestrian crossing volumes were not smoothed). 5.6 Number of deaths and serious injuries As part of the irap model calibration, an estimate of the number of deaths and serious injuries that occur on the road was required. In order to allocate deaths and serious injuries to the network, the irap model requires an estimate of the distribution of deaths by road user type. DNIT provided road trauma fatality data for the majority of sections included within this analysis with fatalities on all sections shown in the link below. A fatality estimate for the roads on which no fatality data is collected was undertaken. The number of serious injuries was estimated using the standard irap assumption that for each death, 10 serious injuries occur. 8 Table 7 Crash data as supplied by DNIT irap code Reported number of fatalities Acre: BR Ceara: BR Ceara: BR Distrito Federal: BR- 020 Espirito Santo: BR- 262 Mato Grosso: BR- 174 Mato Grosso: BR- 364 Pernambuco: BR- 101 Rio de Janeiro: BR- 101 Rio de Janeiro: BR Total reported Sample iod 8 K. McMahon and S. Dahdah, The True Cost of Road Crashes: Valuing life and the cost of a serious injury, irap, irap DNIT Technical Report 25

27 irap code Estimate of fatalities on roads where no data collected Underreporting factor Estimated road deaths on surveyed network Reported number of fatalities 33 17% 552 Sample iod The distribution of deaths by road user category was estimated using data from the WHO global status report for Road Safety and adjusted to take into account the rural nature of the majority of roads in the study. Figure 6 Road deaths by user category Distribution of deaths by road user category 10% 30% 50% 10% Vehicle Ocupants Motorcyclists Pedestrians Bicyclists 5.7 The economic cost of a death and serious injury The document Safer Roads Investment Plans: The irap Methodology describes the process used to estimate the economic cost of a road death and a serious injury for irap projects. This approach is applied globally by irap and is based on research undertaken by McMahon and Dahdah (2008). The key equations used are: the economic cost of a death is estimated to be: 70 x Gross Domestic Product (GDP) capita (current prices) irap DNIT Technical Report 26
28 On this basis: the economic cost of a serious injury is estimated to be: 0.25 x economic cost of a death. the economic cost of a death is estimated to be 70 x R$ 27,777 = R$1,944,390 (US$ 622,205) 9 the economic cost of a serious injury is estimated to be: ¼ x R$1,944,390 = R$486,097 (US$155,551). Based on the 2010 total recorded road deaths on all 66,245 km of DNIT roads, the economic cost of road deaths and serious injuries on the DNIT network alone is a staggering US$18.7 billion year. To calculate net present costs and benefits, a discount rate of 12% was used. 5.8 Countermeasure costs The irap model requires the input of local construction and maintenance costs for each of the 93 countermeasures that are considered in the development of the Safer Roads Investment Plans. The estimated costs are categorised by area type (urban and rural) and up and lower costs (low, medium and high), based on the extent to which the surrounding land use and physical environment impacts upon the construction cost of major works. The countermeasure costs used in this study were based on estimates calculated by engineering staff at the DNIT and approved for preliminary use by Ivone Catarina Simões Hoffmann. The full data set for each study is provided in Appendix A. 9 Exchange rate: R$1 = US$0.32 (June.2015) irap DNIT Technical Report 27

29 6 Star Ratings irap Star Ratings are based on road infrastructure features and the degree to which they impact the likelihood and severity of road crashes. The focus is on the features which influence the most common and severe types of crash on roads for motor vehicles, motorcyclists, pedestrians and bicyclists. They provide a simple and objective measure of the relative level of risk associated with road infrastructure for an individual road user. 5- star (green) roads are the safest, while 1-star (black) roads are the least safe. Star Ratings were not assigned to roads where there was very low use by that type of road user. For example, if no bicyclists use a section of road, then a bicyclist Star Rating is not assigned to it. The Star Ratings are based on Star Rating Scores (SRS). The irap models calculate an SRS at 100 metre intervals for each of the four road user types, based on relative risk factors for each of the road attributes. The scores are developed by combining relative risk factors using a multiplicative model. More information on the risk factors used within the model can be found at Smoothed Star Ratings A Star Rating Score (SRS) is calculated for each 100 metre segment of road for vehicles occupants, motorcyclists, pedestrians and bicyclists. These scores are then allocated to Star Rating bands to determine the Star Rating for each 100 metre of road. However, for the purposes of producing a network level map showing Star Ratings, 100 metres is too much detail. Hence, Star Ratings are smoothed (or averaged) over longer lengths in order to produce more meaningful results. The effect of smoothing is illustrated in the chart below, which shows unsmoothed (raw) Star Rating Scores (SRS) in blue and smoothed SRS in white for a stretch of the Adhemar Pereira de Barros, Governador Doutor Highway. Figure S1 Raw Star Rating Scores (blue) and smoothed SRS (black) for Espirito Santo: BR-482: irap DNIT Technical Report 28
30 6.2 The Star Rating Results The combined Star Rating results for all road sections surveyed within the DNIT pilot study demonstrate that there is potential to improve the safety of road infrastructure for all users. High risk road sections feature significantly in the results with almost half of the surveyed network rated 2-stars or less (out of a possible of 5- stars) for all road user types. The star ratings show that 1% of road length is rated as 5-star, 9% is rated as 4-star, 58% is rated as 3-star, and the remaining 32% is rated as 2-star and below for vehicle occupants. For motorcyclists, no roads were rated as 5-star, only 3% of road length is rated as 4-star, 47% is rated as 3-star, and the remaining 50% is rated 2-star and below. For pedestrians less than 1% is rated as 4-star and 5-star, 2% is rated as 3-star and the remaining 13% is rated 2-star and below. For bicyclists less than 1% is rated as 5-star or 4-star, 5% is rated as 3-star and the remaining 14% is rated 2-star and below. Table 8 Star Ratings table, DNIT Pilot Study Vehicle Occupant Motorcycle Pedestrian Bicycle Star Ratings Length (km) Percent Length (km) Percent Length (km) Percent Length (km) Percent 5 Stars % 0.6 0% 3.1 0% % 4 Stars % % % % 3 Stars 1, % 1, % % % 2 Stars % 1, % % % 1 Star % % % % N/A 9.0 0% 9.0 0% 2, % 2, % Totals 3, % 3, % 3, % 3, % Note: the table shows smoothed Star Ratings. irap DNIT Technical Report 29

31 Figure 8 Star Ratings chart, DNIT Pilot Study Note: the chart shows smoothed Star Ratings. 6.3 Star Rating Maps The following images show the Star Rating maps for vehicle occupants, motorcyclists, pedestrians and bicyclists. Green represents 5-star road sections, yellow represents 4-star road sections, orange represents 3-star road sections, red represents 2-star road sections and black represents 1-star road sections. Figure 9 Star Rating Maps, DNIT Pilot Study Vehicle occupants irap DNIT Technical Report 30

32 Motorcyclists Pedestrians irap DNIT Technical Report 31

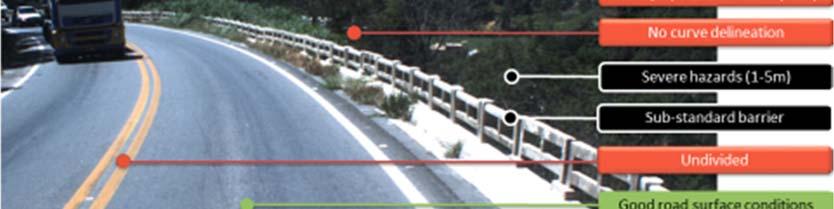
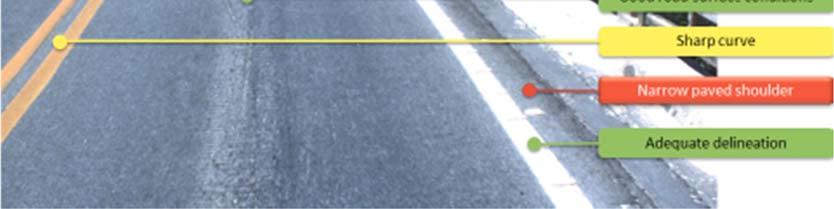
33 Bicyclists 6.4 Example Star Ratings The following images illustrate sections of roads, their Star Ratings and the road attributes that influenced the Star Rating. The figures show Star Ratings for vehicle occupants and pedestrians, as these road users account for a significant number of deaths and illustrate typical road layouts. However, similar examples can be produced for motorcyclists and bicyclists. In the figures: coloured attributes are associated with a reduced level of risk coloured attributes are associated with an intermediate level of risk coloured attributes are associated with an increased level of risk coloured attributes are associated with an extreme level of risk The figures help to illustrate the fact that the level of risk associated with a road s infrastructure, and hence its Star Rating, is a function of numerous attributes, including travel speeds. irap DNIT Technical Report 32


34 Figure 10 Examples of 5-Star Ratings irap DNIT Technical Report 33


35 Figure 11 Example of 4-Star Rating for vehicle occupants Figure 12 Examples of 3-Star Rating for vehicle occupants irap DNIT Technical Report 34


36 Figure 13 Example of 2-Star Ratings for vehicle occupants irap DNIT Technical Report 35


37 Figure 14 Example of 1-Star Ratings irap DNIT Technical Report 36


38 7 Safer Roads Investment Plans irap considers more than 90 proven road improvement options to generate affordable and economically sound Safer Road Investment Plans (SRIP) that will save lives. Road improvement options range from lowcost road markings and pedestrian refuges to higher-cost intersection upgrades and full highway duplication. Plans are developed in three key steps: 1. Drawing on the Star Ratings and traffic volume data, estimated numbers of deaths and serious injuries are distributed across the road network. 2. For each 100 metre segment of road, countermeasure options are tested for their potential to reduce deaths and injuries. For example, a section of road that has a poor pedestrian Star Rating and high pedestrian activity might be a candidate for a footpath or pedestrian crossing facility. 3. Each countermeasure option is assessed against affordability and economic effectiveness criteria. The economic benefit of a countermeasure (measured in terms of the economic benefit of the deaths and serious injuries prevented) must, at a minimum, exceed the cost of its construction and maintenance (that is, it must have a benefit cost ratio (BCR) greater than one). In many circumstances, the threshold BCR for a plan is lifted above one, which has the effect of reducing the overall cost of the plan. This helps to ensure that the plan is affordable while representing a positive return on investment and the responsible use of public money. A SRIP shows a list of affordable and economically sound road safety treatments, specifically tailored to reduce risk on the corridors assessed in this DNIT pilot study. Each countermeasure proposed in the SRIPs is supported by strong evidence that, if implemented, it will prevent deaths and serious injuries in a cost-effective way). Nevertheless, each countermeasure should be subject to additional prioritisation, concept planning and detailed design before implementation. irap DNIT Technical Report 37
39 The SRIP produced aims to maximise the prevention of deaths and serious injuries within the available budget. The plans largely focus on: reducing the likelihood of vehicles running off the road and reducing the risk associated with run-off road crashes by improving shoulders, installing rumble strips and reducing the severity of roadsides, and providing facilities for pedestrians and bicyclists. Table 9 below shows that an investment of R$1.7 billion could reduce the number of deaths and serious injuries on the road by 46%, preventing over 56,000 deaths and serious injuries over 20 years. The overall benefit cost ratio of this approach would be 7.6:1. The SRIP was produced using a threshold BCR of 3 (that is, the economic benefit of each countermeasure must be greater than or equal to 3 times the cost). Note that the details shown in the tables below are a summary of the plans for all roads surveyed in the DNIT Pilot Study, individual plans for each road corridor within the project are available within the irap online software. Table 9 Investment Plan SRIP Present value of investment R$1,71 billion US$0.55 billion Deaths and serious injuries prevented 56,300 Present value of safety benefits Cost death and serious injury prevented R$13.01 billion US$4.16 billion R$30,269 US$9,686 Benefit cost ratio (BCR) 7.6 Reduction in death and serious injuries 46% Exchange rate: R$1 = US$0.32 (June 2015) The list of countermeasures in the plan suggest that significant safety improvements can be made to the surveyed DNIT road network through the implementation of several key road safety and mass action treatments. Installing roadside barriers or clearing roadside hazards, and installing rumble strips are estimated to prevent over 20,400 fatalities and serious injuries over a 20 year iod. Countermeasures focused on reducing risk for vulnerable users also show promise. Countermeasures aimed at improving pedestrian safety alone, such as pedestrian footpaths and crossings, pedestrian fencing, lighting and traffic calming could prevent 16,121 fatalities and serious injuries over the 20 years. The countermeasures identified are shown in Table 10 below. irap DNIT Technical Report 38
40 Table 10 Safer Road Investment Countermeasure Length / Sites FSIs saved (20 years) Estimated Cost (million reals) Roadside barriers - passenger side km 6, Shoulder rumble strips 1,396.8 km 5, Roadside barriers - driver side km 5, Footpath provision passenger side (adjacent to road) km 4, Skid Resistance (paved road) 88.2 km 4, Traffic calming km 2, Footpath provision passenger side (>3m from road) km 2, Bicycle Lane (off-road) km 2, Footpath provision driver side (adjacent to road) km 1, Clear roadside hazards - passenger side km 1, Street lighting (mid-block) km 1, Clear roadside hazards - driver side km 1, Additional lane (2 + 1 road with barrier) 37.1 km 1, Central median barrier (no duplication) 74.6 km 1, Improve Delineation 69.1 km 1, Footpath provision driver side (>3m from road) km 6, Delineation and signing (intersection) 387 sites 5, Duplication with median barrier 12.5 km 5, Refuge Island 837 sites 4, Improve curve delineation 63.8 km 4, Pedestrian fencing 34.6 km 2, Street lighting (intersection) 306 sites 2, Signalised crossing 167 sites 2, Unsignalised raised crossing 262 sites 1, Shoulder sealing passenger side (>1m) 57.0 km 1, Central median barrier (1+1) 30.6 km 1, Signalise intersection (3-leg) 36 sites 1, Signalise intersection (4-leg) 36.6 km 1, Side road signalised pedestrian crossing 21 sites 1, Shoulder sealing driver side (>1m) 70 sites 1, Road surface rehabilitation 9.3 km 1, Central hatching 59.2 km 1, Side road unsignalised pedestrian crossing 197 sites Parking improvements 10.9 km Bicycle Lane (on-road) 36.0 km Lane widening (up to 0.5m) 7.2 km Sight distance (obstruction removal) 7.4 km Program BCR irap DNIT Technical Report 39
41 Countermeasure Length / Sites FSIs saved (20 years) Estimated Cost (million reals) Upgrade pedestrian facility quality 27 sites Footpath provision passenger side (with barrier) 2.1 km Shoulder sealing driver side (<1m) 6.5 km Shoulder sealing passenger side (<1m) 6.2 km Street lighting (ped crossing) 41 sites Protected turn lane (unsignalised 4 leg) 3 sites Centreline rumble strip / flexi-post 26.2 km Overtaking lane 0.3 km Restrict/combine direct access points 6.3 km Clear roadside hazards (bike lane) Footpath provision passenger side (informal path >1m) 3.3 km Sideslope improvement - driver side 2.8 km Sideslope improvement - passenger side 0.4 km Footpath provision driver side (informal path >1m) 0.4 km School zone warning - flashing beacon 9 sites , Program BCR FSI = fatal and seriously injured BCR = benefit cost ratio Maps showing the location of each countermeasure listed within Safer Roads Investment Plan can be accessed through the SRIP Table within ViDA as shown in Figure 15. irap DNIT Technical Report 40

42 Figure 15 Map showing location of a treatment (improve delineation) Full details of each recommended countermeasure, including location description, geo-reference data and economics is provided by clicking on an individual icon as shown in Figure 16. Strip plans showing the location, by distance, of up to five recommended countermeasures for each road section, are also available within ViDA, the irap online software at irap DNIT Technical Report 41

43 Figure 16 Individual countermeasure details Descriptions of these countermeasures, and many other road safety treatments, including advice on implementation issues and crash reduction effectiveness can be found at the Road Safety Toolkit Star Ratings after countermeasure implementation The Star Rating (After) table below provides details of the projected Star Ratings if all countermeasures within the SRIP were implemented. Table 11 Star Ratings After (smoothed) Road User Vehicle Occupants Motorcyclists Pedestrians Bicyclists Length (km) Percent Length (km) Percent Length (km) Percent Length (km) Percent 5 Stars % % % % 4 Stars 1, % % % % 3 Stars 1, % 2, % % % 2 Stars % % % % 1 Star % % % % Not applicable % % 2, % 2, % irap DNIT Technical Report 42
44 Analysis of the projected Star Ratings after implementation of the SRIP shows that it is economically viable to increase all bar 4% of the roads surveyed to a level of 3-stars and above for the vehicle occupants and for all bar 10% for motorcyclists. There is the potential to significantly increase the star ratings for pedestrians and cyclists across much of the network on which vulnerable roads users are likely to be present. 7.2 Economic Assessment Using actual crash data where available, an estimate of the number of deaths and serious injuries that occur on the surveyed network is made. Crash modification factors are then used to provide an estimate of the number of road deaths and serious injuries that are likely to be prevented through the infrastructure improvements that are proposed in each SRIP. More information on the crash modification factors used in the model is available in the irap Road Attribute Risk Factor factsheets in the Documents section of the irap website at: It is important to ensure that improvements such as lane widening, resurfacing, additional lanes and paved shoulders do not result in excessive vehicle speeds, particularly where vulnerable road users such as pedestrians and bicyclists are present. In such cases vehicle speeds must be effectively managed in order to minimise risk. Assuming that the proposed countermeasures do not lead to an increase in vehicle oating speeds, it is estimated that fatal and serious injuries (FSIs) are likely to reduce by 46%, preventing 3,546 deaths and serious injuries each year and almost 71,000 deaths and serious injuries over the next 20 years by implementing the countermeasure recommendations put forward in the SRIP. Table 12 Economic analysis Economic Analysis: DNIT Road length 3395km Investment R$1.70 billion US $0.55 billion Economic benefit ( year) R$1,74 billion US$0.56 billion Economic benefit (20 years) R$13.01billion US4.16 billion Benefit cost ratio (BCR) 7.6 Deaths and serious injuries Deaths ( year) Deaths and serious injuries ( year) Deaths and serious injuries (20 years) Before countermeasures 552 6, ,440 After countermeasures 296 3,256 65,120 Prevented 256 2,816 56,320 Reduction 46% Cost death and serious injury prevented Exchange rate: R$1 = US$0.32 (June.2015) R$30,269 US$9,686 It is estimated that the economic benefits of a reduction in the numbers of deaths and serious injuries from 6,072 to 3,256 year, as seen in this study, would total approximately US$557 million year in crash costs saved. irap DNIT Technical Report 43
45 8 Implementation and recommendations The irap DNIT Pilot study successfully assessed 3,395 kilometres of road and generated Star Ratings for vehicle occupants, motorcyclists, bicyclists and pedestrians. The Star Rating results show that road infrastructure poses a relatively high risk for all users across the surveyed network. High risk roads feature significantly in the results, with almost a third of the network rated 2-stars or less (out of a possible of 5-stars) for vehicle occupants, 41% rated as 2-stars or less for motorcyclists and the majority of the network rated as 2-stars or less for bicyclists and pedestrians. The road attribute data shows that the majority of the survey was conducted along a single carriageway network, with only 22% being conducted on dual carriageway roads. Roadside hazards are numerous across the network. 81% of curves where traffic flows at 80km/h or more have hazardous roadsides. Also of concern is the extent of unprotected safety barrier ends on the network, with over 700 unprotected safety barrier ends recorded across the road network. Due to the rural nature of much of the road network, provision for vulnerable road users is low with only 1% of the network having pedestrian facilities present. No motorcycle facilities were recorded. The available data from a Road Assessment such as this provides extensive planning and engineering information such as road attribute records, road user risk, countermeasure proposals and economic assessments for 100 metre sections of road network. The assessments are supported by the irap online software which makes this information highly accessible. Each countermeasure proposed in a SRIP is backed by strong evidence that, if implemented, it will prevent deaths and serious injuries in a cost-effective way, with engineering improvements that all have a BCR > 3. Review of speed limits, enforcement and ultimately reductions in 85th centile oating speeds at locations where engineering improvements are not economically viable can ensure most, if not all roads reach 3-star oating conditions. In interpreting the results of this report, it is important to recognise that irap is designed to provide a networklevel assessment of risk and cost-effective countermeasures. As such, a SRIP should be considered just the first step in building a safe road. For this reason, implementation of the proposals in this report will ideally include the following steps: local examination of proposed countermeasures (including a value engineering type workshop including all relevant stakeholders), detailed analysis of traffic survey and crash data (if available), preliminary scheme investigation studies, including site surveys and preliminary design, detailed design, star ratings of the designs, road safety audit, detailed costing and procurement, final evaluation and construction, and post-construction evaluation and road safety audit, including Star Ratings for the upgraded road and analysis of crash data (if it is available). The detailed results of the project and access to the irap online software ( have been provided to key stakeholders for further exploration and use. Detailed briefings are also able to be held with key funding bodies, elected members, government officials, design engineers and planners to ensure a common understanding of the investment priorities and potential to save lives and reduce serious injuries. In the following sections, key issues that should be taken into consideration during the implementation process are discussed. irap DNIT Technical Report 44
46 8.1 Prioritisation Previous projects have shown that when presented with a large-scale plan of proposed countermeasures, potentially requiring hundreds of millions of dollars of investment, the decisions about what to do first and how to prioritise can be challenging. In order to prioritise work on the remaining network the Predicted Casualty Reduction map can be used to show the annual number of fatal and serious injuries that are likely to be prevented kilometre if the complete Safer Roads Investment Plan was implemented. This map can help to prioritise the implementation of countermeasures by identifying specific locations or road sections where the potential to save lives is greatest. Figure 17 Predicted Casualty Reduction Map Countermeasure implementation might be undertaken according to each countermeasure s likely source of funding and the ease with which it can be built. This was the approach taken by the Directorate General of Highways and VicRoads during crash reduction investigations on major roads in Indonesia. Their approach involved assigning countermeasures to one of four categories, as illustrated in Table 13. By doing so, the responsibilities and procedures in implementing the countermeasures was clarified, with patterns emerging about what can be done in the short-term and which countermeasures require further work. irap DNIT Technical Report 45
47 Table 13 Potential countermeasure categories Category Description Lead time A B C D Countermeasures for immediate implementation by the region/district public works office as part of its maintenance programme Countermeasures that require reconstruction or other works that do not add capacity to the road and which can be defined by simple diagrams or typical cross-sections but cost estimates are required to schedule the works in the region/district public works office annual budget programme for funding road works Countermeasures that require reconstruction or other works that do not add capacity to the road, but for which topographical survey and / or detailed design is required, and for which cost estimates are required to schedule the works in the region/district public works office annual budget programme for funding road works Countermeasures that require major new works and would result in an increase in capacity of the road. These require coordination with broader planning strategy and support from development banks, donors and consulting engineers might be necessary Immediate 1 year 2-5 years 5-10 years Example countermeasure Delineation, Road surface improvement, Footpath. Shoulder sealing, Pedestrian crossing, Bicycle lane. Intersection, Horizontal realignment. Duplication, Grade separation of intersections. Having identified a priority location or section of road, it is possible to further tailor the countermeasure plan to suit specific circumstances. This is especially useful if budget constraints have changed. Figure 18 below provides an example of the way in which cost-effectiveness may be used to generate a list of priority countermeasures within a limited budget. In this example the SRIP was used to produce a list of all countermeasures that could feasibly be built on the road, sorted in order of descending BCR. The countermeasure download file, available online, was used to generate this list. The initial SRIP for the Indonesian project showed that the cumulative cost of investments with a BCR of 1 or more was slightly over $100 million, as indicated by the red line in Figure 18, which was considered to be unaffordable by the local authorities. As an alternative, an initial budget was set at $2 million. This is indicated by the green line in Figure 18. For this budget, all countermeasures with a BCR of 45.6 or more could be implemented. irap DNIT Technical Report 46


48 Figure 18 Prioritising countermeasures on a particular road according to different budgets The most cost effective countermeasure is listed first With a $2 million budget, all countermeasures with a BCR greater than 45.6 could be considered If budget was unlimited, all countermeasures with a BCR greater than 1 could be considered Countermeasures with a BCR below 1.0 should not be considered 8.2 Commit to a Safe System approach The investment plans contain infrastructure improvements that can be set in place immediately. To complement those improvements, a series of additional measures need to be implemented, and a longer-term safety strategy set in place. The Safe System approach is based on the theory that all humans make mistakes, but that a mistake made on the highway should not result in death or serious injury. It recognises that the human body is vulnerable and is unlikely to survive an uncushioned impact at speeds of 30km/h or more. When these occasional, but inevitable mistakes occur on our busy roads, it stands to reason that collisions or crashes will result. Currently some of these collisions have fatal consequences, and others are less severe. The Safe System provides a forgiving highway infrastructure, one which recognises that mistakes will be made and attempts to minimise their occurrence, and the forces involved in a resulting crash, to reduce its severity to survivable levels. The Safe System approach includes engineering measures such as the removal or protection of roadside hazards, the re-design of roads, roadsides and intersections to reduce risk to a minimum and the setting of appropriate speed limits according to the existing levels of infrastructure safety. The adoption of this approach is recommended. irap DNIT Technical Report 47
BUILDING CHINARAP. Zhang Tiejun Research Institute of Highway (RIOH) Beijing, China
 Beijing, China") BUILDING CHINARAP Zhang Tiejun Research Institute of Highway (RIOH) Beijing, China E-mail: tj.zhang@rioh.cn Greg Smith International Road Assessment Programme (irap) Beijing, China E-mail: greg.smith@irap.org
BUILDING CHINARAP Zhang Tiejun Research Institute of Highway (RIOH) Beijing, China E-mail: tj.zhang@rioh.cn Greg Smith International Road Assessment Programme (irap) Beijing, China E-mail: greg.smith@irap.org
ROAD SAFETY PERFORMANCE REVIEW Capacity Building Workshop for Uganda. irap METHODOLOGY Racheal M. N. Nganwa AfricaRAP Lead 1 & 2 March 2018
 ROAD SAFETY PERFORMANCE REVIEW Capacity Building Workshop for Uganda irap METHODOLOGY Racheal M. N. Nganwa AfricaRAP Lead 1 & 2 March 2018 About irap: Registered charity Vision: a world free of high risk
Star Rating Roads For Safety
 Star Rating Roads For Safety The EuroRAP Methodology Consultation version 16 September 2009 ` EuroRAP505.04 Star Rating Roads For Safety: The EuroRAP Methodology Page 2 About EuroRAP The European Road
THE IRAP ROAD SAFETY TOOLKIT A WEBSITE-BASED APPROACH TO ADDRESSING ROAD SAFETY PROBLEMS
 THE IRAP ROAD SAFETY TOOLKIT A WEBSITE-BASED APPROACH TO ADDRESSING ROAD SAFETY PROBLEMS Blair TURNER Principal Research Scientist, Safe Systems Division ARRB Group Ltd 500 Burwood Highway, Vermont South,
irap irap The world road safety problem irap Background irap Aims A Safe Road System Vaccines for Roads 1. irap Background 2. irap Malaysia Results
 irap irap 1. irap Background 2. irap Malaysia Results Rob McInerney, CEO irap Asia Pacific 3. irap Worldwide 4. The challenge The world road safety problem A Safe Road System Road 1.2 million killed every
irap Star Rating and Investment Plan Coding Manual
 irap Star Rating and Investment Plan Coding Manual Drive on the right edition - August 2014 Setting the standards for the road coding process RAP-SR-2.2 PRINT WARNING printed copies of this document or
ROAD SAFETY DEMONSTRATION
 Shaanxi Mountain Road Safety Demonstration Project (RRP PRC 46042) ROAD SAFETY DEMONSTRATION A. Introduction 1. The Shaanxi Mountain Road Safety Demonstration Project (the project) is located in two prefecture-level
Star Ratings for the Strategic Road Network. Richard Leonard - Highways England
 Star Ratings for the Strategic Road Network Richard Leonard - Highways England Strategic Direction for Road User Safety 2 Delivery Plan Star Rating - Commitments We will ensure that by the end of 2020
irap Star Rating and Investment Plan Implementation Support Guide March 2017
 irap Star Rating and Investment Plan Implementation Support Guide March 2017 RAP-SR-4.1 PRINT WARNING printed copies of this document or parts thereof should not be relied upon as a current reference document.
Road safety design standards and the Asian Highway Network. irap Asia Pacific Workshop Greg Smith 2016/05/26
 Road safety design standards and the Asian Highway Network irap Asia Pacific Workshop Greg Smith (greg.smith@irap.org) 2016/05/26 AH Standard Summary While developing the Asian Highway network, Parties
MDB Road Safety Initiative: A Development Priority
 MDB Road Safety Initiative: A Development Priority Every six seconds, someone is killed or maimed on the world s roads. Over 90 percent of these injuries occur in low- and middle-income countries. The
A Road Safety Decade - The Case for Action
 A Road Safety Decade - The Case for Action Presentation by Dmitry Sambuk International Coordinator, Make Roads Campaign, FIA Foundation Monday 12 May 2009, Minsk, Republic of Belarus World Report on Road
APPENDIX C. Systems Performance Report C-1
 APPENDIX C Systems Performance Report C-1 System Performance Report & Requirements According to the FAST Act, a long range transportation plan needs to include a system performance report and subsequent
usrap: An Innovation in Data-Driven Safety Analysis
 Est. Dec. 2014 usrap: An Innovation in Data-Driven Safety Analysis Presented by: Bruce Hamilton, Roadway Safety Foundation Doug Harwood, MRIGlobal Webinar Logistics Duration is 11:00 AM - 12:30 PM Mountain
URBAN KIWIRAP IDENTIFYING ROAD SAFETY RISK ON NEW ZEALAND S URBAN ROADS
 URBAN KIWIRAP IDENTIFYING ROAD SAFETY RISK ON NEW ZEALAND S URBAN ROADS C. BRODIE & F. TATE & R. MINNEMA New Zealand Transport Agency, New Zealand colin.brodie@nzta.govt.nz, fergus.tate@nzta.govt.nz, ron.minnema@nzta.govt.nz
Safer Roads by Design TM : Engineering Solutions to Implement irap Surveys. Washington, DC USA March 4-8, Executive Seminar
 Safer Roads by Design TM : Engineering Solutions to Implement irap Surveys Washington, DC USA March 4-8, 2019 Executive Seminar International Road Federation The Road Industry s Most Trusted Brand in Continuing
Interim Report on the Development of Road Safety Infrastructure Facility Design Standard for the Asian Highway Network
 Development of Road Infrastructure Safety Facility Standards Expert Group Meeting on Asian Highway United Nations Economic and Social Commission for Asia and the Pacific 3-4 October 2016 Interim Report
Road Safety Annual Report 2016 OECD/ITF Chapter 26. Morocco
 Road Safety Annual Report 2016 OECD/ITF 2016 Chapter 26 Morocco This chapter presents 2014 road safety data for Morocco along with provisional data from 2015. It looks at trends in traffic and road safety
Florida Transportation Commission. October 1, 2008
 Florida Transportation Commission October 1, 2008 CONGRATULATIONS TO THE FLORIDA DEPARTMENT OF TRANSPORTATION! FLORIDA DEPARTMENT OF TRANSPORTATION: Winner for On Time Small Project FLORIDA DEPARTMENT
Middle East and North Africa Egypt Road Assessment Program
 Public Disclosure Authorized Public Disclosure Authorized Report No: AUS17950 Middle East and North Africa Egypt Road Assessment Program irap Egypt Technical Report December 10, 2014 GTI05 MIDDLE EAST
Austroads National Risk Assessment Model (ANRAM) Chris Jurewicz, ARRB
 Chris Jurewicz, ARRB") Austroads National Risk Assessment Model (ANRAM) Chris Jurewicz, ARRB Overview Context What is ANRAM? How it is used? Severe crash risk estimation ANRAM Toolkit Next steps 2 Context Diminishing blackspots
Austroads National Risk Assessment Model (ANRAM) Chris Jurewicz, ARRB Overview Context What is ANRAM? How it is used? Severe crash risk estimation ANRAM Toolkit Next steps 2 Context Diminishing blackspots
Crete irap demonstration project
 Crete irap demonstration project Draft for consultation August 2009 This project is financially supported by the FIA Foundation for the Automobile and Society and conducted in consultation with EuroRAP
Cycle traffic and the Strategic Road Network. Sandra Brown, Team Leader, Safer Roads- Design
 Cycle traffic and the Strategic Road Network Sandra Brown, Team Leader, Safer Roads- Design Highways England A Government owned Strategic Highways Company Department for Transport Road Investment Strategy
ROAD SAFETY RISK MAPPING USING STRUCTURED DATA
 ROAD SAFETY RISK MAPPING USING STRUCTURED DATA DR. P K SIKDAR Jigesh N. Bhavsar* Advisor, IRF (India Ch.) and President, ICT Pvt. Ltd., A-8 Green Park, New Delhi, India 110016 Tel: +91-11-40863224; Email:
EXECUTIVE SUMMARY March 2013
 EXECUTIVE SUMMARY March 2013 An Application of Safe System Approach to Intersections in the Capital Region Progress Report Introduction The Capital Region Intersection Partnership (CRISP) was founded in
Discover the Safe System Approach
 Discover the Safe System Approach Aim Take you on a journey of discovery Inform, engage, enthuse and share with you the Safe System approach to saving death and injury on our roads Change to less graphic
Setting Regional and National Road Safety Targets
 10 th Meeting of the United Nations Road Safety Collaboration 3-4 June 2009, Bangkok Setting Regional and National Road Safety Targets Commemorating 60 years in Thailand 1949-2009 Lives at stake people
road safety issues 2001 road toll for Gisborne district July 2002 Road user casualties Estimated social cost of crashes*
 GISBORNE DISTRICT road safety issues July 22 The Land Transport Safety Authority (LTSA) has prepared this Road Safety Issues Report. It is based on reported crash data and trends for the 1997 21 period.
EGYPT: a national decade of action for road safety
 EGYPT: a national decade of action for road safety 2011 2020 Egypt EGYPT Population: 75 497 913 Income group: Middle Gross national income per capita: $1 580 INSTITUTIONAL FRAMEWORK Lead agency Funded
The Road Users Perspective and KiwiRAP
 The Road Users Perspective and KiwiRAP Mike Noon General Manager Motoring Affairs NZ Roadmarkers Federation Conference August 09 What is the AA and why does it care? Club with 1.25m Members Not for profit
Review of Guidelines for Cycleway Safety Fencing
 Review of Guidelines for Cycleway 1.0 PURPOSE 1.1 This document is meant to provide a review of available reference documents for determining appropriate fencing requirements for cycleway paths and shared
1 Monash University Accident Research Centre, Monash University, Victoria, RACV, 550 Princes Highway Noble Park, Victoria, 3174.
 Roadside Environment Safety: a statistical analysis of collisions with fixed roadside objects in Victoria Amanda Delaney 1, Stuart Newstead 1, Bruce Corben 1, Jim Langford 1 and Peter Daly 2 1 Monash University
Title. Authors. Safety Benefits of Highway Infrastructure Investments (May 2017)
") Title Safety Benefits of Highway Infrastructure Investments (May 2017) Authors Douglas W. Harwood 1, Jessica M. Hutton 1, Zachary N. Hans 2, Reginald R. Souleyrette 3, Michael A. Fields 3 1MRIGlobal 2Iowa
Title Safety Benefits of Highway Infrastructure Investments (May 2017) Authors Douglas W. Harwood 1, Jessica M. Hutton 1, Zachary N. Hans 2, Reginald R. Souleyrette 3, Michael A. Fields 3 1MRIGlobal 2Iowa
ROSEE RSA/RSI Introduction courses ROSEE Speed Management courses
 ROSEE RSA/RSI Introduction courses ROSEE Speed Management courses ROSEE PP8 UL FGG-PTI & WP4 leader Kostanjsek, Jure & Lipar, Peter Munchen, June 6, 2013 ROSEE WP4: Safe Roads and Mobility RSA/RSI course
Economics of Road Safety What does it imply under the 2030 Agenda for Sustainable Development?
 Presentation issued without formal editing FOR PARTICIPANTS ONLY 14 March 2017 ENGLISH ONLY UNITED NATIONS CENTRE FOR REGIONAL DEVELOPMENT In collaboration with Ministry of Public Works and Transport,
Star Rating Roads for Safety Results for Consultation with Stakeholders
 Star Rating Roads for Safety Results for Consultation with Stakeholders BULGARIA http://sensorproject.eu/ SENSoR Star Rating Report - BULGARIA The SENSoR Project About SENSOR The road infrastructure of
[ Fundación PONS ] [ Fundación PONS ] [ Expertise PONS ] Investing in road safety
![[ Fundación PONS ] [ Fundación PONS ] [ Expertise PONS ] Investing in road safety](/thumbs/73/68505603.jpg "[ Fundación PONS ] [ Fundación PONS ] [ Expertise PONS ] Investing in road safety") With more than 60 years experience, PONS is a leading company in the fields of road safety and sustainable transportation planning, providing worldwide support with auditing, consultancy and training services,
With more than 60 years experience, PONS is a leading company in the fields of road safety and sustainable transportation planning, providing worldwide support with auditing, consultancy and training services,
Road Safety Partnership
 Cambridgeshire and Peterborough Road Safety Partnership Cambridgeshire and Peterborough Road Safety Partnership Introduction Road accidents can have a devastating impact not only for the people directly
Post impact trajectory of vehicles at rural intersections
 Post impact trajectory of vehicles at rural intersections Doecke SD., Woolley JE. and Mackenzie JR. Centre for Automotive Safety Research Abstract This report describes the path of vehicles after a collision
SAFER ROADS INVESTMENT PLANS FOR 14 COUNTRIES IN SOUTH EAST EUROPE
 SAFER ROADS INVESTMENT PLANS FOR 14 COUNTRIES IN SOUTH EAST EUROPE S. D. LAWSON Road Safety Foundation, United Kingdom steve.lawson@roadsafetyfoundation.org E. BELLOS & O. DJORDJEVIC Make Roads Safe Hellas,
EuroRAP s priorities. Road Safety: no Safe System without forgiving roads
 EuroRAP s priorities Our European Context Last 10 years 500,000 killed or serious trauma Majority outside cities & towns 5 serious traumas per km on main roads Annual crash cost 2% of GDP 50% Reduction
TRAFFIC CRASHES IN WORK ZONES: AN OVERVIEW OF THE BRAZILIAN FEDERAL HIGHWAYS
 TRAFFIC CRASHES IN WORK ZONES: AN OVERVIEW OF THE BRAZILIAN FEDERAL HIGHWAYS Camila Belleza Maciel Barreto LabTrans/UFSC Florianópolis, Brazil Phone: + 55 48 32256960 E-mail: camilabmaciel@gmail.com Amir
British Road Safety: Presentation 28/10/2009 by Duncan Price, Deputy Head, Road User Safety Division
 British Road Safety: Presentation 28/10/2009 by Duncan Price, Deputy Head, Road User Safety Division New British Road Safety Strategy Vulnerable Road Users Driving During Business Delivery with Local Organisations
The Safe System Approach
 There are very few areas of public discussion and sentiment which generate as much consensus as road safety. Everyone wants safer roads for all users, and road safety is a key priority for governments,
Safe System approach A beckoning perspective for children
 Plenary Session 1 Safe System approach A beckoning perspective for children Fred Wegman Emeritus Professor, Traffic Safety at Delft University of Technology, the Netherlands Traditional approach: for example
Department of Internal Affairs Mandatory Non-Financial Performance Measures 2013 Roads and Footpaths
 Road Asset Technical Accord - RATA The Centre of Excellence for Road Asset Planning in the Waikato Region Department of Internal Affairs Mandatory Non-Financial Performance Measures 2013 Roads and Footpaths
ENGINEERING DESIGN STANDARDS TO ENSURE ROAD SAFETY: EXPERIENCES FROM INDIA
 ENGINEERING DESIGN STANDARDS TO ENSURE ROAD SAFETY: EXPERIENCES FROM INDIA Atul Kumar 1 ABSTRACT The primary goal of designing roads with adequate standards is to achieve a safer transport facility for
2003 road trauma for. Wairoa District. Road casualties Estimated social cost of crashes* Major road safety issues WAIROA DISTRICT JULY 2004
 WAIROA DISTRICT JULY 24 T he Land Transport Safety Authority (LTSA) has prepared this road safety issues report. It is based on reported crash data and trends for the 1999 23 period. The intent of the
June Presentation Title. Peter Daly RACV. Presenter s Name
 June 17 2008 Presentation Title Peter Daly RACV Presenter s Name Overview What AusRAP is and isn t What it is trying to achieve How it works Key results Future directions What is AusRAP? Sister program
Findings on the Effectiveness of Intersection Treatments included in the Victorian Statewide Accident Black Spot Program
 Findings on the Effectiveness of Intersection Treatments included in the Victorian Statewide Accident Black Spot Program Nimmi Candappa, Jim Scully, Stuart Newstead and Bruce Corben, Monash University
ENHANCED IDENTIFICATION OF HIGH-RISK INTERSECTIONS. P. DURDIN Abley Transportation Consultants, New Zealand
 ENHANCED IDENTIFICATION OF HIGH-RISK INTERSECTIONS P. DURDIN Abley Transportation Consultants, New Zealand paul.durdin@abley.com 1. ABSTRACT The New Zealand Transport Agency s High-Risk Intersections Guide
6. BREENS/GARDINERS/HAREWOOD INTERSECTION - SAFETY IMPROVEMENT PROJECT
 6. BREENS/GARDINERS/HAREWOOD INTERSECTION - SAFETY IMPROVEMENT PROJECT General Manager responsible: Officer responsible: Author: Jane Parfitt General Manager City Environment DDI 941 8656 Michael Aitken
Road Safety Vademecum
 Road Safety Vademecum Road safety trends, statistics and challenges in the EU 2010-2013 March, 2014 European Commission DG for Mobility and Transport Unit C.4 Road Safety Contents Summary of findings...
Road Safety Trends, Targets and Safety Programs in New Zealand. by Dr Shane Turner
 Road Safety Trends, Targets and Safety Programs in New Zealand by Dr Shane Turner New Zealand Kiwi s vs Aussies Outline Land transport organisations NZ & US crash/accident trends NZ safety targets & priorities
Walking and Cycling Action Plan Summary. A Catalyst for Change The Regional Transport Strategy for the west of Scotland
 Walking and Cycling Action Plan Summary A Catalyst for Change The Regional Transport Strategy for the west of Scotland 2007-2021 Strathclyde Partnership for Transport Contents Purpose...2 Issues, Constraints
Risk and Safety Assessment on Road Infrastructure. Olivera Djordjevic
 Risk and Safety Assessment on Road Infrastructure Olivera Djordjevic This presentation: How we score what we score Informed Investments Decisions: Safer Roads Investments Plans How it matters best case
Response Road Safety Strategy for New South Wales
 Response Road Safety Strategy for New South Wales 2012-2021 The Amy Gillett Foundation (AGF) welcomes the opportunity to contribute to the Road Safety Strategy for New South Wales 2012-2021 (the Strategy).
Implications of the Safe System Approach for young driver safety
 Implications of the Safe System Approach for young driver safety Professor Barry Watson Developing New Approaches to Prevent Young Driver Crashes: 11 May 2018 Overview Historical changes in the way we
Introduction. 2
 Introduction In 2010, the United Nations General Assembly adopted Resolution 64/255 proclaiming 2011 2020 to be a Decade of Action for Road Safety. 1 In order to establish a baseline for the road safety
November 2, Government takes on the challenge of improving traffic safety
 November 2, 2006 Government takes on the challenge of improving traffic safety Edmonton... The Alberta government has taken on the challenge of improving traffic safety by moving ahead with a comprehensive,
Safe Speed programme ATTACHMENT 1. Randhir Karma, Group Manager Network Management and Safety
 Safe Speed programme ATTACHMENT 1 Randhir Karma, Group Manager Network Management and Safety 1 Why Safe Speeds? AT s strategic context National guidance AT has embraced Vision Zero principles and recognises
2015 Victorian Road Trauma. Analysis of Fatalities and Serious Injuries. Updated 5 May Page 1 of 28. Commercial in Confidence
 2015 Victorian Road Trauma Analysis of Fatalities and Serious Injuries Updated 5 May 2016 Page 1 of 28 Commercial in Confidence VICROADS_n3445896_2015_Victorian_Trauma_Report_- _updated_may_2016.docx 2015
Chapter 5 DATA COLLECTION FOR TRANSPORTATION SAFETY STUDIES
 Chapter 5 DATA COLLECTION FOR TRANSPORTATION SAFETY STUDIES 5.1 PURPOSE (1) The purpose of the Traffic Safety Studies chapter is to provide guidance on the data collection requirements for conducting a
ZERO DRAFT OF THE BRASILIA DECLARATION ON ROAD SAFETY (VERSION PROPOSED BY BRAZIL DATED 26 MARCH 2015)
") ZERO DRAFT OF THE BRASILIA DECLARATION ON ROAD SAFETY (VERSION PROPOSED BY BRAZIL DATED 26 MARCH 2015) Second Global High-Level Conference on Road Safety: Time for Results Brasilia, 18-19 November 2015
ZERO DRAFT OF THE BRASILIA DECLARATION ON ROAD SAFETY (VERSION PROPOSED BY BRAZIL DATED 26 MARCH 2015) Second Global High-Level Conference on Road Safety: Time for Results Brasilia, 18-19 November 2015
Traffic Calming Regulations
 Traffic Advisory Leaflet 7/93 August 1993 Traffic Calming Regulations Introduction Traffic calming can help drivers to make their speeds appropriate to local conditions, through measures which are self-enforcing.
Introduction Methodology Study area and data collection Results and recommendation Conclusion References
 Introduction Methodology Study area and data collection Results and recommendation Conclusion References It is formal procedure for assessing accident potential and safety performance in the provision
CHECKLIST 2: PRELIMINARY DESIGN STAGE AUDIT
 CHECKLIST 2: PRELIMINARY DESIGN STAGE AUDIT 2.1 General topics 2.1.1 Changes since previous audit Do the conditions for which the scheme was originally designed still apply? (for example, no changes to
Manifesto for a safe, efficient and sustainable transport in NZ
 8 January 2018 Manifesto for a safe, efficient and sustainable transport in NZ Movement is an alliance of organisations working to achieve a safe, efficient and sustainable transport system that provides
Road safety in the Eastern Mediterranean Region
 Road safety in the Eastern Mediterranean Region Facts from the Global Status Report on Road Safety 2013 Road safety in the Eastern Mediterranean Region Introduction In 2004, the World Health Organization
TRAFF IC CALMING POLICY
 TRAFF IC CALMING POLICY Policy No: 45396 Approved by Council 28 May 2008 C11/05/08 Further amendment by Council 22 June 2011 vide c08/06/11 Contents 1 Problem Statement 1 2 Desired Outcomes 2 3 Strategic
BLACK SPOTS MANAGEMENT - SLOVENIAN EXPERIENCE
 BLACK SPOTS MANAGEMENT - SLOVENIAN EXPERIENCE PhD Marko Renčelj, Assoc. Prof. Matjaž Šraml, University of Maribor, Faculty for Civil Engineering X International Symposium "ROAD ACCIDENTS PREVENTION 2010"
Aiming for Zero Road Worker Safety. Mark Pooley Highways Agency Road Worker Safety Programme Manager Monday 11 June 2012
 Aiming for Zero Road Worker Safety Mark Pooley Highways Agency Road Worker Safety Programme Manager Monday 11 June 2012 1. Road Worker Safety Strategy. RWS Strategic Target No. 1: achieve a substantial
Pedestrian injuries in San Francisco: distribution, causes, and solutions
 Pedestrian injuries in San Francisco: distribution, causes, and solutions Presentation to the San Francisco Health Commission RAJIV BHATIA, MD, MPH DIRECTOR OF OCCUPATIONAL AND ENVIRONMENTAL HEALTH, SAN
City of Perth Cycle Plan 2029
 Bicycling Western Australia s response City of Perth Cycle Plan 2029 2012-2021 More People Cycling More Often ABOUT BICYCLING WESTERN AUSTRALIA Bicycling Western Australia is a community based, not-for-profit
Star Rating Roads for Safety Results for Consultation with Stakeholders
 Star Rating Roads for Safety Results for Consultation with Stakeholders HUNGARY http://sensorproject.eu/ The SENSoR Project About SENSOR The road infrastructure of a country not only serves the basic need
Why Zone In on Speed Reduction?
 Learn it. Do it. Live it! SPEED REDUCTION IN THE ZONE Why Zone In on Speed Reduction? Speeding is a serious issue that plays a major role in the risk of serious injury and pedestrian fatality in a crash.
Road Safety. Inspections
 Title of your presentation Road Safety Name and contact details Inspections Phil Allan Australiaame ROAD SAFETY SEMINAR Lome, Togo October 2006 Definition A Road Safety Inspection (RSI) is an on-site systematic
Road safety. REGIONAL COMMITTEE Provisional Agenda item 8.5. SEA/RC70/11 Malé, Maldives 6 10 September July Seventieth Session
 REGIONAL COMMITTEE Provisional Agenda item 8.5 Seventieth Session SEA/RC70/11 Malé, Maldives 6 10 September 2017 21 July 2017 Road safety Road traffic injuries constitute a major public health burden with
Vision Zero: No more traffic deaths on Berkeley streets
 Vision Zero: No more traffic deaths on Berkeley streets Image courtesy of Fehr & Peers Farid Javandel, Transportation Division Manager Beth Thomas, Principal Planner, Transportation Division 1 Presentation
THE COMMON FINDINGS FROM ROAD SAFETY AUDITS AND ROAD SAFETY INSPECTIONS IN THE WESTERN BALKAN REGION WION
 X International Symposium "ROAD ACCIDENTS PREVENTION 2010" Novi Sad, 21 st and 22 nd October 2010. THE COMMON FINDINGS FROM ROAD SAFETY AUDITS AND ROAD SAFETY INSPECTIONS IN THE WESTERN BALKAN REGION WION
MANAGEMENT OF SPEEDING COMPARING TWO APPLIED ENGINEERING MEASURES
 Volume4 Number3 September2013 pp.10 14 DOI: 10.2478/mper-2013-0023 MANAGEMENT OF SPEEDING COMPARING TWO APPLIED ENGINEERING MEASURES Zuhair Ebrahim, Hamid Nikraz Civil Engineering Department, Curtin University,
3-13 UFC - GENERAL PROVISIONS AND GEOMETRIC DESIGN FOR ROADS, STREETS, WALKS, AND OPEN
 maintenance, and erosion. Stability is required to maintain the integrity of the pavement structure, and a slope stability analysis should be conducted for cuts and fills greater than 15 feet. For lower
1 VicRoads Access Management Policies May 2006 Ver VicRoads Access Management Policies May 2006 Version 1.02
 1 VicRoads Access Management Policies May 2006 Ver 1.02 VicRoads Access Management Policies May 2006 Version 1.02 2 VicRoads Access Management Policies May 2006 Ver 1.02 FOREWORD FOR ACCESS MANAGEMENT
Road Safety Annual Report 2016 OECD/ITF Chapter 31. Norway
 Road Safety Annual Report 2016 OECD/ITF 2016 Chapter 31 Norway This chapter presents 2014 road safety data for Norway along with provisional data from 2015. It looks at trends in traffic and road safety
An evaluation of intersection characteristics associated with crashes at intersections in Melbourne CBD. Jim Scully, Brian Fildes 1
 An evaluation of intersection characteristics associated with crashes at intersections in Melbourne CBD Jim Scully, Brian Fildes 1 ABSTRACT The contribution of crashes occurring at intersections to road
4. Guided Bus Explained
 4. Guided Bus Explained Contents 1 INTRODUCTION... 2 Structure of this report... 2 2 KERB GUIDED BUS... 3 Overview... 3 Kerb guidance... 3 Figures Figure 2.1 Figure 2.2 Figure 2.3 Figure 2.4 Figure 2.5
We believe the following comments and suggestions can help the department meet those goals.
 The Honorable Secretary Anthony Foxx The Secretary of Transportation United States Department of Transportation 1200 New Jersey Avenue, SE Washington, DC 20590 August 30, 2013 Dear Secretary Foxx, Thank
The Yalgoo Experience. Ryan Gibson
 The Yalgoo Experience Ryan Gibson Outline Yalgoo WALGA RoadWise Program Towards Zero Road Safety in the Mid West The OLA Process The Issue Outcomes What could have been done better Where is Yalgoo? Shire
Towards Zero: Using Evidence and Aspiration to Reduce Road Trauma in Western Australia
 Towards Zero: Using Evidence and Aspiration to Reduce Road Trauma in Western Australia Iain Cameron Executive Director Office of Road Safety Western Australia, Australia iain.cameron@mainroads.wa.gov.au
Lessons Learned from the Minnesota County Road Safety Plans. Richard Storm CH2M HILL
 Lessons Learned from the Minnesota County Road Safety Plans Richard Storm CH2M HILL May 21, 2014 Overview of the MN CRSP: Why Prepare Safety Plans for Local Systems? MAP-21: Requires states to address
// RoWSaF Making roads safer for road workers rowsaf.org.uk. RoWSaF Strategy 2015
 // RoWSaF Making roads safer for road workers rowsaf.org.uk Working in partnership with clients, industry and key stakeholders to improve worker safety Often working close to live traffic, activities conducted
Assessing our National Highway Network: Highway Reviews and AusRAP A Combined Approach
 Assessing our National Highway Network: Highway Reviews and AusRAP A Combined Approach Bishop, I.A. 1 1 Traffic & Safety, The Royal Automobile Association of South Australia Abstract RAA conducts regular
City of Edmonton Office of Traffic Safety
 Overview About OTS Vision 0 Key Facts Speed Management Committee and Speed Management Plan Evidence on Speed and Speeding Complaint Process Data Collection Speed Surveys Collision Review Speed Management
March Maidstone Integrated Transport Strategy Boxley Parish Council Briefing Note. Context. Author: Parish Clerk 2 March 2016
 Context. Author: Parish Clerk 2 The Draft Integrated Transport Policy (DITS) sets out a vision and objectives, and identifies a detailed programme of interventions to support the Maidstone Borough Local
Local Government Road Safety Summit - 9 April 2018
 Local Government Road Safety Summit - 9 April 2018 Report on outcomes The Associate Minister of Transport, Hon Julie Anne Genter held the Local Government Road Safety Summit in Wellington on 9 April 2018.
ROSEE Road safety in Sout East European regions: Safe Road Infrastructure
 ROSEE Road safety in Sout East European regions: Safe Road Infrastructure Kostanjsek, Jure; Lipar, Peter; Milotti, Alberto 2014 European Workshop: Road Safety Design InternationalActivities Brussels, November
ROAD SAFETY ANNUAL REPORT 2018 ISRAEL
 ROAD SAFETY ANNUAL REPORT 2018 ISRAEL ISRAEL Israel recorded 321 road fatalities in 2017, representing a 3.9% decrease when compared to 2016. The mortality rate is 3.6 deaths per 100 000 population. Since
Toward Zero Deaths: Proactive Steps for Your Community
 Est. Dec. 2014 Toward Zero Deaths: Proactive Steps for Your Community Presented by: Brian Roberts, P.E., National Association of County Engineers Marie Walsh, Ph.D., Louisiana Local Technical Assistance
Safer Verges and the Strategic Road Network
 Safer Verges and the Strategic Road Network Gavin Williams Senior Technical Advisor Vehicle Restraints Outline The Journey from Highways Agency to Highway England Overview of the Highways England Health
1 Road and HGV danger in London. Hannah White, Freight & Fleet Programme Manager November 2017
 1 Road and HGV danger in London Hannah White, Freight & Fleet Programme Manager November 2017 2 London and its transport networks London: 8.6m residents + 30m visitors 30m journeys per day 6.3m by bus