Star Rating Roads for Safety Results for Consultation with Stakeholders
|
|
|
- Esther Young
- 5 years ago
- Views:
Transcription


1 Star Rating Roads for Safety Results for Consultation with Stakeholders BULGARIA
2 SENSoR Star Rating Report - BULGARIA The SENSoR Project About SENSOR The road infrastructure of a country not only serves the basic need for safe transport of people and goods but is also considered vital for its growth and development. Decisions for public and private investments, related to these infrastructures must take into consideration the overall level of their safety capacity in a measurable way. Road traffic injuries are a global, man-made and preventable epidemic with a health burden on the scale of HIV/AIDS and Malaria. According to the World Health Organization, about 1.24 million people die every year as a result of road traffic crashes, while the annual number of road deaths worldwide is projected to increase to about 2.4 million by Specifically in the European Union, more than persons were killed and about 1,5 million persons were injured in more than 1,1 million car accidents. On this basis, the United Nations announced in 2010 the Global Plan for the Decade of Action for Road Safety The Plan encourages countries and stakeholders to implement actions that contribute to the reduction of the forecasted road fatalities rate. The categories of activities (pillars) that the Plan proposes as focusing areas are: building road safety management capacity; improving the safety of road infrastructure and broader transport networks; further developing the safety of vehicles; enhancing the behaviour of road users; and improving post-crash care. Focusing on the Infrastructure pillar, the countries should be able to assess the safety capacity of the road network for all road users and further implement infrastructure improvements through targeted investment programs. Moreover, the European Directive 2008/96/EC on Road Safety Infrastructure Management provided the requirements for safety management of the Trans-European Road Network that include Road Safety Inspection, Safety Ranking and Audits, suggesting investments on road sections with the highest number of collisions and/or the highest collision reduction potential. Within this framework the South East Neighbourhood Safe Routes (SENSoR) project has taken safety rating to the next level moving from measurement to action by assessing the risks that road users face from infrastructure and by identifying the potential improvements that can save the most lives for the money available. To do so, the Project Partners applied the latest tools of the International Road Assessment Programme (irap), a charity supporting countries and financial institutions worldwide during the UN Decade. The results give GPSmapped sites where improvements, often as simple as barriers, school crossings or roadside hazard clearance, can make the difference. SENSoR builds on outstanding cooperation between automobile clubs, universities and road authorities. Having been co-financed by the South East Europe (SEE) Transnational Cooperation Programme and the European Union, the 2-year project brought together 14 countries Greece, Slovakia, Hungary, Slovenia, Republic of Moldova, Serbia, Former Yugoslav Republic of Macedonia, Bosnia and Herzegovina, Croatia, Albania, Montenegro, Bulgaria, Romania and Ukraine. The project was launched in September 2012 and finished in September It included the road inspection, coding, analyses and reporting of RAP road safety assessments of almost 16,000kms in the above mentioned countries. The current report presents the Star Rating results for a641 km part of the major road network in Bulgaria. The assessment was performed by S. Efstathiadis & Associates, LLP (Transportation Solutions), which is an accredited RAP supplier. For more information, contact Stelios Efstathiadis, phone: (+30) , mobile: (+30) , info@t-s.gr.

3 SENSoR Star Rating Report - BULGARIA SENSoR Star Rating Coverage Figure 1: SENSoR Star Rating Coverage Map
4 SENSoR Star Rating Report - BULGARIA [Page intentionally left blank]
5 SENSoR Star Rating Report - BULGARIA Contents 1 Introduction Road Assessment in Bulgaria Results for consultation with stakeholders The RAP Method Measuring the road infrastructure safety The Star Rating process Developing the Safer Road Investment Plans (SRIPs) The inspected road network Coverage and basic characteristics Details of the recorded road attributes Data collection and coding Road Survey Road Survey Equipment Coding Team Data coding Traffic Volume Pedestrian and Bicycle volume Operating Speed Crash Data Countermeasures costs Economic data Star Rating Results Overall Star Ratings Results Safer Roads Investments Plan (SRIP) Overall SRIP Results Conclusions Annex 1 Traffic Volumes and Operating Speeds Annex 2 Countermeasure costs Annex 3 Minimum 3-star safety rating standard... 42
![1 Introduction 1.1 Road Assessment in Bulgaria The current report presents the Star Rating results for a 641 km part of the major road network in [insert the name of the country].](/docs-images/90/101393430/images/6-0.jpg "These results are only a part of the analysis of almost 16,000Km of the TEN-T road network in 14 countries in South East Europe, which was performed within the framework of the SENSoR Project.")
6 1 Introduction 1.1 Road Assessment in Bulgaria The current report presents the Star Rating results for a 641 km part of the major road network in [insert the name of the country]. These results are only a part of the analysis of almost 16,000Km of the TEN-T road network in 14 countries in South East Europe, which was performed within the framework of the SENSoR Project. In Bulgaria, according to the World Health Organization, the number of road fatalities is about 700 per year (ETSC, ). There are no recorded data following EU standards for the serious injuries. The estimated Gross Domestic Product loss due to road traffic crashes reaches the 2%.The Road Fatalities Rate in Bulgaria is about10.5 per people(who, 2013),which is one of the highest in Europe. However, data for the period reveal that Bulgaria made animportant23% reduction in total deaths of road users (ETSC, 2014). Figure 2: Road Fatalities per people 1.2 Results for consultation with stakeholders This report is presented as results for consultation with stakeholders because the SENSoR Project Partners wish to discuss with those who influence the safety of roads and road infrastructure the detail of these surveys and the priorities and possibilities for investing to save lives and serious injuries. The results are based upon surveys carried out between November 2013 and March 2014 and upon data collected at other times and with the support of Project Partners, government and police agencies. The SENSoR project is grateful for this support. An outcome of the SENSoR project is that the individual participating countries now have a Safer Roads Investment Plan which may be used to prioritise spending on crash Page 2
7 countermeasures. This Plan is not a bill of works and it and the assumptions used in the model must be carefully assessed by local engineers and others who have contributed to the work or who have a legitimate interest in the roads. In particular, they must assess such features as the value of life and injury used in the work, the data used in estimating injury savings, traffic volumes, countermeasure costs and operating speed on the network. The data for the SENSoR surveys are held in irap s ViDA software. In circumstances where the printed output differs from that held in ViDA, the material held within the software takes precedence. The printed report provides the results of the survey and also gives an entrylevel guide to the software and the analysis possibilities that are available within it. Any changes in the modelling assumptions, coding corrections, minor model changes or differences in the presentation of results (such as rounding) will always be reflected in results held in the ViDA software. 1.3 The RAP Method The protocols used here were developed by the International Road Assessment Programme (irap). irap is a registered charity dedicated to saving lives through safer roads. irap provides tools and training to help countries make roads safe. Its activities include: inspecting high-risk roads and developing Star Ratings, Safer Roads Investment Plans and Risk Maps providing training, technology and support that will build and sustain national, regional and local capability tracking road safety performance so that funding agencies can assess the benefits of their investments. The programme is the umbrella organisation for EuroRAP, AusRAP, usrap, KiwiRAP and ChinaRAP. Road Assessment Programmes (RAP) are now active in more than 70 countries throughout Europe, Asia Pacific, North, Central and South America and Africa. irap is financially supported by the FIA Foundation for the Automobile and Society and the Road Safety Fund. Projects receive support from the Global Road Safety Facility, automobile associations, regional development banks and donors. National governments, automobile clubs and associations, charities, the motor industry and institutions such as the European Commission also support RAPs in the developed world and encourage the transfer of research and technology to irap. In addition, many individuals donate their time and expertise to support irap. irap is a member of the United Nations Road Safety Collaboration. The main objective of the RAP method is the improvement of the road users safety by proposing cost-effective investment plans. The most crucial point in the RAP is that engineers and planners in developed countries have for over twenty years adopted an underlying philosophy of designing a forgiving road system to minimize the chances of injuries when road users make mistakes that result in crashes. The method indicates that the severity of a road accident can be reduced through the intervention at the sequence of events happening during this accident. As it is known, an injury accident results from a chain of events, starting with an initial event, probably resulting from several factors, which leads to a dangerous situation. The basic idea is to intervene at any point of this chain, in order to reduce the kinetic energy of all road users who are involved in the accident to a tolerable level. Such an intervention may not only reduce the number of accidents but also the severity of injuries. The initial step for the implementation of the RAP method is the inspection and record of the infrastructure elements of a road network, which relate to the road safety. The record leads to Page 3
8 the quantification of the safety that a road section provides to its users by awarding safety scores (Star Rating Scores). The Star Rating Scores express the safety capacity of a road section in a 5-Stars scale. This quantification aims to identifying the most appropriate countermeasures, which will increase the infrastructure s road safety score. The Safer Roads Investment Plan (SRIP) includes all the countermeasures proved able to provide the greater safety capacity and maximize the benefit over spent cost of the planned investments. Thus, the SRIPs are considered as a valuable tool for the authorities, stakeholders and investors in order to decide for the most cost-effective and efficient road infrastructure investments Measuring the road infrastructure safety The assessment of the road safety requires the Road Safety Inspections of the road network sections and the assignment of a safety score to them. The inspection is conducted by visual observation and record of the road infrastructure elements which are related -directly or notto road safety and have a proven influence on the likelihood of an accident or its severity. The RAP uses two types of inspection; the drive-through and the video-based inspection. During the first one, the record of the infrastructure s elements is performed manually, with the help of specialized software, while during the second, a specially equipped vehicle is used, so as the recorded video to be used for a virtual drive-through of the network and an automated identification of the infrastructure s elements. Following the RSI, the Road Protection Score (RPS) is calculated. The RPS is a unit-less indicator, which depicts the infrastructure s safety capacity for each road user type and it is calculated for 100m road segments. Road user types are considered the car occupants, the motorcyclists, the bicyclists and the pedestrians, who may be involved in road accidents. For each road user type and for 100m road segmentation the respective RPS is calculated as follows: RPS = RPS = L * S * OS * EFI * MT n,u n,u,c n,u,c n,u,c n,u,c n,u,c n,u,c c c where n is the number of 100m road segment, u the type of road user and c the crash type that the road user type u may be involved in. The following variables are taken into consideration: L: the Likelihood that the i crash may be initiated, S: the Severity of the i crash, OS: the degree to which risk changes with the Operating Speed for the specific i crash type, EFL: the degree to which a person s risk of being involved in the i type of crash is a function of another person s use of the road (External Flow Influence), MT: the potential that an errant vehicle will cross a median (Median Traversability) The Star Rating process The aim of the Star Rating process is the award of the n 100m road segments with Stars, depicting the safety offered to each of the u road users types. The Star Rating system uses the typical international practice of recognising the best performing category as 5-star and the worst as 1-star (5 stars scale), so that a 5-star road means that the probability of a crash occurrence, which may lead to death or serious injury is very low. The Star Rate is determined by assigning each RPS calculated to the Star Rating bands. The thresholds of each band are different for each road user and were set following significant sensitivity testing to determine how RPS varies with changes in road infrastructure elements. The assignment procedure leads to the development of a risk-worm chart, which depicts the variation of the RPS score in relation to the position (distance from the beginning) on the road under consideration. The final output of the Star Rating is the Star Rating Maps, in which the n road sections are shown with different colour, depending on their Star award (5-star green and 1-star black). Page 4
9 1.3.3 Developing the Safer Road Investment Plans (SRIPs) The development of the most appropriate SRIP presupposes the assessment of the number of fatalities and serious injuries that could be prevented for each 100m road segment on an annual basis when a set of countermeasures is applied. The number of fatalities is calculated as follows: F n= u where n is the number of the 100m road segment, u the type of road user, c the crash type that the road user u may be involved in and F the number of fatalities that can be prevented on a time period of 20 years, given that a specific set of countermeasures is applied. The number is related to four main factors: (1) the safety score of the specific road segment, (2) the u road users flow, (3) the fatality growth, which indicates the underlying trend in road fatalities and (4) the calibration factor, which inserts the actual number of fatalities that occur in the specific road section. The calculation of this factor presupposes the existence of similar crash data. The assessment of the number of serious injuries that could be prevented for a 100m road segment is a function of the Fn,u,c value and the ratio of the actual number of serious injuries to the actual number of fatalities to the relevant number of fatalities. In case of lack of appropriate data, the competent authorities should estimate this actual number as previously, or the ratio of 10 serious injuries to 1 death is used, which is proposed by McMahon et al. in [19]. The next step in establishing the SRIPs is the identification of the most appropriate countermeasures. Countermeasures are the engineering improvements that the road authorities should take so as to reduce the fatalities and serious injuries rates. Each countermeasure is characterized by its trigger sets and its effectiveness for each of the 100m road segments. Each trigger set describes all the cases in which this certain countermeasure can be used. The effectiveness is calculated according to the number of fatalities and serious injuries that can be prevented in this segment and the RPS of this segment before and after the application of the countermeasure. It is important to mention that in the case that multiple countermeasures act on a certain road segment, the total effectiveness is not the simple sum of each countermeasure s effectiveness. Instead, a reduction factor should act, which calibrates the total effectiveness. The procedure of selecting the most appropriate countermeasures is the basis for the technoeconomic analysis of the investment plan and aims to the calculation of the Benefit-Cost ratio (BCR) for each countermeasure. The economic benefit is considered as the benefit of preventing a death or a serious injury. The calculations are conducted following the assumption that the cost of a human life is 70 times the GDP per capita, the cost of a serious injury is the 25% of the cost of a human life and the ratio of 10 serious injuries for 1 death, if more accurate information is not available. The countermeasure cost includes all the construction costs, the maintenance costs over a 20 year period and/or probable reconstruction costs. All the benefits/costs should reflect the actual local prices, taking into account the economic life of each countermeasure and the discount rate. The outcome of this procedure is the BCR calculation for each countermeasure applied to a specific road segment. The SRIP is conducted for a period of 20 years and shows the list of the most cost effective improvements that are able to reduce the crash risk for all road user types. In that way the SRIP enables the road authorities to set the priorities properly when developing infrastructure s maintenance and/or rehabilitation plans. c F n,u,c Page 5
10 2 The inspected road network Coverage and basic characteristics The inspected road network in Bulgaria is a part of the TEN-T network. It includes 13 sections of total length of 641km. The following Table presents the roads inspected, along with the dates that the survey took place. Road Name Type (Divided/Undivided) From To Length (Km) A3 Divided DYAKOVO DRAGICHEVO 31.3 A6 Divided DRAGICHEVO SOFIA 18.3 Date of inspection & & E79 Undivided DYAKOVO NOVO DELCHEVO Undivided POLSKO KOSOVO ZLATNA PANEGA Undivided ZLATNA PANEGA VELIKO TARNOVO Undivided VELIKO TARNOVO ROMANIAN BORDER Undivided BU-SE BORDER SERBIAN BORDER Undivided BLATATA LOMSKO SHOSE B Table 1: The inspected road network in Bulgaria The largest part of the examined road network is a single carriageway. The lane width is over 3.25 m, in the length of 97% of the total of 691km (including undivided sections and both directions of the divided sections). Concerning physical separation between opposing traffic flows, the centreline separating traffic is present in the length of km (79%). Metal median barrier separating traffic lanes by directions, is placed in the length of km (18%). Hard shoulders are mostly narrow ( 1.0m) on the both driver s and passenger s side. As for the pedestrian facilities, they do not exist at the 99% of the inspected road, i.e. there is a very small number of signalized pedestrian crossings, with or without traffic lights, refuges and grade separated facilities Details of the recorded road attributes On the basis of the analysis of the inspection s data the following Table presents details of the inspected network. Vehicle flow (AADT) Km % Area type Km % Page 6
11 Rural / open area Urban / rural town or village Bicycle observed flow Km % None bicycle observed Bicycle peak hour flow Km % None to Bicycle star rating policy target Km % Not applicable Vehicle occupant star rating policy target Km % Not applicable Carriageway label Km % Carriageway A of a divided carriageway road Carriageway B of a divided carriageway road Undivided road Centreline rumble strips Km % Not present Curvature Km % Straight or gently curving Moderate Sharp Very sharp Delineation Km % Adequate Poor Differential speed limits Km % Not present Present Facilities for bicycles Km % Off-road path None Facilities for motorised two wheelers Km % None Grade Km % >= 0% to <7.5% >= 7.5% to <10% Intersection type Points % Page 7
12 Merge lane 83 1 Roundabout leg (unsignalised) with protected turn lane leg (unsignalised) with no protected turn lane leg (signalised) with protected turn lane leg (signalised) with no protected turn lane leg (unsignalised) with protected turn lane leg (unsignalised) with no protected turn lane leg (signalised) with protected turn lane leg (signalised) with no protected turn lane 3 0 None Median crossing point - informal 7 0 Median crossing point - formal 13 0 Intersecting road volume Points % >=15,000 vehicles ,000 to 15,000 vehicles to vehicles to vehicles to 1,000 vehicles to 100 vehicles 21 0 None Intersection channelisation Points % Not present Present 42 1 Intersection quality Points % Adequate Poor Not applicable Land use - driver-side Km % Undeveloped areas Farming and agricultural Residential Commercial Industrial and manufacturing Land use - passenger-side Km % Undeveloped areas Page 8
13 Farming and agricultural Residential Commercial Educational Industrial and manufacturing Lane width Km % Wide (>= 3.25m) Medium (>= 2.75m to < 3.25m) Median type Km % Safety barrier - metal Safety barrier - concrete Physical median width >= 10.0m to < 20.0m Physical median width >= 5.0m to < 10.0m Physical median width >= 1.0m to < 5.0m Physical median width >= 0m to < 1.0m Continuous central turning lane Central hatching (>1m) Centre line One way Wide centre line (0.3m to 1m) Motorcycle % Km % 1% - 5% Motorcycle observed flow Km % None motorcycle observed Motorcycle star rating policy target Km % Not applicable Number of lanes Km % One Two Three Four or more Two and one Operating speed (85 th percentile) Km % 60km/h km/h Page 9
14 80km/h km/h km/h km/h km/h Operating speed (mean) Km % 50km/h km/h km/h km/h km/h km/h km/h km/h Paved shoulder - driver-side Km % Wide (>= 2.4m) Medium (>= 1.0m to < 2.4m) Narrow (>= 0m to < 1.0m) None Paved shoulder - passenger-side Km % Wide (>= 2.4m) Medium (>= 1.0m to < 2.4m) Narrow (>= 0m to < 1.0m) None Pedestrian crossing facilities - inspected road Points % Signalised without refuge 11 0 Unsignalised marked crossing without a refuge 49 1 No facility Pedestrian crossing facilities - intersecting road Points % Signalised without refuge 3 0 Unsignalised marked crossing with refuge 1 0 Unsignalised marked crossing without a refuge 5 0 No facility Pedestrian crossing quality Points % Adequate 45 1 Poor 15 0 Page 10
15 Not applicable Pedestrian fencing Km % Not present Present Pedestrian observed flow across the road Km % None pedestrian crossing observed to 3 pedestrians crossing observed to 5 pedestrians crossing observed Pedestrian observed flow along the road driver-side Km % None pedestrian along driver-side observed to 3 pedestrians along driver-side observed to 7 pedestrians along driver-side observed Pedestrian observed flow along the road passenger-side Km % None pedestrian along passenger-side observed to 3 pedestrians along passenger-side observed to 5 pedestrians along passenger-side observed to 7 pedestrians along passenger-side observed pedestrians along passenger-side observed Pedestrian peak hour flow across the road Km % to Pedestrian peak hour flow along the road driver-side Km % to Pedestrian peak hour flow along the road passenger-side Km % to Pedestrian star rating policy target Km % Not applicable Property access points Km % Commercial Access Residential Access Residential Access 1 or Page 11
16 None Quality of curve Km % Adequate Poor Not applicable Road condition Km % Good Medium Poor Roads that cars can read Km % Meets specification Roadside severity - driver-side distance Km % 0 to <1m to <5m to <10m >= 10m Roadside severity - driver-side object Km % Safety barrier - metal Safety barrier - concrete Aggressive vertical face Upwards slope - rollover gradient Upwards slope no rollover gradient Deep drainage ditch Downwards slope Cliff Tree >=10cm dia Sign, post or pole >= 10cm dia Non-frangible structure/bridge or building Frangible structure or building Unprotected safety barrier end Large boulders >=20cm high None Roadside severity - passenger-side distance Km % 0 to <1m to <5m to <10m Page 12
17 >=10m Roadside severity - passenger-side object Km % Safety barrier - metal Safety barrier - concrete Aggressive vertical face Upwards slope - rollover gradient Upwards slope no rollover gradient Deep drainage ditch Downwards slope Tree >= 10cm dia Sign, post or pole >=10cm dia Non-frangible structure/bridge or building Frangible structure or building Unprotected safety barrier end Large boulders >= 20cm high None Roadworks Km % No road works School zone crossing supervisor Points % Not applicable (no school at the location) School zone warning Points % Not applicable (no school at the location) Service road Km % Not present Present Shoulder rumble strips Km % Not present Present Sidewalk - driver-side Km % Physical barrier Non-physical separation >= 3.0m Non-physical separation 1.0m to <3.0m Non-physical separation 0m to <1.0m None Informal path >= 1.0m Informal path 0m to <1.0m Page 13
18 Sidewalk - passenger-side Km % Physical barrier Non-physical separation >= 3.0m Non-physical separation 1.0m to <3.0m Non-physical separation 0m to <1.0m None Informal path >= 1.0m Informal path 0m to <1.0m Sight distance Km % Adequate Poor Skid resistance / grip Km % Sealed - adequate Sealed - medium Sealed - poor Speed limit Km % <30km/h km/h km/h km/h km/h km/h km/h km/h km/h km/h Motorcycle speed limit Km % <30km/h km/h km/h km/h km/h km/h km/h km/h km/h Page 14
19 120km/h Truck speed limit Km % <30km/h km/h km/h km/h km/h km/h km/h km/h km/h km/h Speed management / traffic calming Km % Not present Present Street lighting Km % Not present Present Upgrade cost Km % Low Medium High Vehicle parking Km % Low Medium High Table 2: Details of the inspected road network in Bulgaria From the detailed information, we can find that the majority of the inspected roads (91%) are undivided. The 74% of the surveyed roads have one lane per direction. The delineation of 52% road segments is not adequate. About 95% of the inspected roads are in rural areas, while just 51% of roads were considered to have good surface, 38% have medium surface condition and 11% poor. Roughly 30% of the inspected road network has metal or concrete barriers on both sides. Moreover, street lighting is not present in the majority (93%) of the surveyed network. Trees with a diameter of more than 10cm were recorded on more than one-third of the network on both sides. Moreover, there are no enough sidewalk and pedestrian crossings to make pedestrians walk safely. Pedestrian footways were provided on about 5% of the network but Page 15
20 pedestrian activity is anticipated on 13%. 15 pedestrian crossings (25%) were described as of poor quality. Page 16
21 3 Data collection and coding 3.1 Road Survey The road survey was carried out in two phases: 11 th of November 13 th of November 2013 and 16 th of November 17 th of November 2013 on the previously defined network. The process was carried out in accordance with the irap standards. Weather conditions were satisfying for the survey, and no major technical difficulties were experienced. The survey team consisted of Stelios Efstathiadis, Manolis Androulidakis, Vassilis Malovrouvas and Aristoklis Aegides from TRANSPORTATION SOLUTIONS. All team members were on the board for the entire time of the survey. The survey was completed in a smooth and timely fashion without facing any major issues Road Survey Equipment The inspection system was developed by experts of ARRB group. The road inspection vehicle used was equipped with high-resolution cameras (three cameras in the front capturing the driver s view front). The cameras are attached to the roof of the inspection vehicle in special waterproof cases, and connected to a PC built in the trunk of the car. The cameras are controlled by a keyboard and a monitor in the hands of the vehicle passenger using a remote desktop system. For geo-referencing purposes a GPS probe was used, connected also to the built-in PC. The Hawkeye Onlooker Live software, also developed by ARRB group, was used to combine the video footage with the GPS data at the same time.the whole system is mounted into the specifically modified inspection vehicle Mercedes Vito. The vehicle was equipped with prescribed logos for presentation purposes. Digital images of minimum resolution 1280x960 pixels were collected in 10m intervals while driving at the normal speed. Geo-referenced data have been provided for each digital image, including the distance along the road (from the determined start point), longitude and latitude, date and time. Page 17

22 Figure 3: The inspection vehicle Coding Team The road coding team for the Bulgarian network consisted of four coders. Each coder was working maximum 6 hours per day. Coders working on the Bulgarian network: Anna Gabarró Rubén Espuelas Clàudia Boix Ignasi Martín The coding team was being continuously managed and controlled by Jose A. Tirone an experienced and certified engineer to ensure sufficient quality and homogeneity of the coding. All of the above mentioned professionals have vast experience with road safety audits and inspections on various types of roads, while the coordinator was ready to assist the coders in case of any unclarities during the whole process. 3.2 Data coding After the completion of the road inspection phase, the process of coding of video material took place. Coding represents the process of determining specific road attributes, for each of the 100 meters interval of the inspected roads, according to the RAP-SR-2.1 Star Rating and Page 18

23 Investment Plan Survey and Coding Specification and the RAP-SR-2.2 Star Rating coding manual. Figure 4: Road coding team & workstation The quality assurance process was the next important phase of the coding process and assessed whether the road attributes captured in the road inspection had been rated correctly. It was an important validation step prior to calculation of Star Ratings, data interrogation and further consultation with stakeholders. A requirement of the RAP method, according to the RAP-SR-2-4 Road Coding Quality Assurance Guide, is the external review of a minimum 10% of the data coded from road inspections. It is recommended that this external review is carried out at three key stages of the process after completion of 25%, 50% and 100% of the coding. This enables issues to be resolved early thus reducing the amount of recoding required. The Quality Assurance of the specific dataset was performed by Indian Road Survey & Management Pvt. Ltd. (IRSM) which is an accredited RAP supplier and was commissioned by the SENSOR project to perform the QA task. The basic assumptions used regarding the traffic volume, the pedestrian and bicycle volume, the operating speed, the crash data the countermeasure costs and the economic data on which the made during the coding phase are presented in the following paragraphs. Page 19


24 3.2.1 Traffic Volume Traffic volume data is used in the irap model as a multiplier to estimate the number of deaths and serious injuries that could be prevented on the roads. Traffic volumes are approximations according to the suppliers' experience Pedestrian and Bicycle volume The ViDA model requires also inputting four types of flows for each 100m section of the surveyed network: Pedestrian peak hour flow across the road Pedestrian peak hour flow along the driver-side Pedestrian peak hour flow along the passenger-side Bicyclist peak hour flow along the road These types of data are difficult to obtain as there are no relevant measurements. To overcome this issue, appropriate estimations were made using the RAP pre-processor tool. This tool estimates the pedestrians and bicyclists flows based on the coded attributes like Land use, Area type, Pedestrian crossing facilities, Sidewalk provision etc. The basic flows and the multiplier matrix for various land use along the road are displayed in the following Figures. Figure 5 Basic pedestrian flows Figure 6 Basic bicyclists flows Page 20
25 In addition, number of conditions was applied to better estimate the real pedestrian and bicyclist flows. In particular: In sections where pedestrians/bicyclists were observed, the minimum base flow multiplier was set to 1. Where more than 8 pedestrians/bicyclists were observed, the minimum base flow multiplier was set to 1.5. On dual carriageway roads with a median barrier (without pedestrian crossing facility) the pedestrian crossing flow was set to 0. Where pedestrian crossing facility is present, the minimum base flow was set to 1, and the pedestrian crossing flow is multiplied by 1.5. Where an intersection is present, the base pedestrian crossing flow is multiplied by It is assumed that pedestrians do not walk in medians on dual carriageway roads. Where a sidewalk facility is present, the minimum pedestrian base flow multiplier along the road is set to 1. Where vehicles park either on one or both sides of the road (including bus stops), the minimum pedestrian base flow multiplier is set to 1. In all rural areas, the values are multiplied by 0.1 for the passengers along, and bicyclists along flows. The pedestrian crossing flow is multiplied by 0.2. On rural dual carriageway roads all flows are set to 0. The assumptions surrounding pedestrian flow crossing the road have been chosen conservatively. In the absence of local data or knowledge this is often a better course of action because it discourages the model from proposing measures at inappropriate locations. Local input during stakeholder consultation will enable refinement to targeting of pedestrian provision but it is likely that priorities should in any case focus on the review and improvement of existing pedestrian crossing facilities. Because the lack of the adequate sidewalk (lots of them is taken by the vehicle parking) and pedestrian facility to across the road. The pedestrians walk together with vehicles. It is very dangerous for the pedestrian, especially for the children, elder and women Operating Speed The level of risk of death or serious injury on a road is highly dependent on the speed at which the traffic travels. The RAP method indicates that risk assessments must be performed using the operating speed on a road. Operating speed is defined as being the greater of the legislated speed limit or the measured 85th percentile speed. The operating speed is one of 52 variables used in generating the Star Rating and an indication of the relationship between speed and assumed risk can be seen in the appendices. (Mean speed is used in the fatality estimation routines.) EuroRAP and irap who supported this work have experience and data from survey work in about 80 countries worldwide. Estimated operating speeds across the networks surveyed in SENSoR were measured in a series of counts in SENSoR countries (notably in Slovenia) where it was possible to work with road authorities and other stakeholders. Some examples of these counts are provided in the annexes of many of the SENSoR technical reports. When Page 21
26 possible, these counts were supplemented with advice from local engineers and police. Informal estimates were also made from the survey vehicle on an ad hoc basis whilst it was travelling as a floating vehicle in the traffic stream using techniques long-established in traffic engineering (see, for example, the comments in the Moving Car Observer technique (Wardrop and Charlesworth (1954) [1] ). Nevertheless, speed data are not usually available for every individual road or section at frequent intervals and, in the absence of detailed information, it is necessary to make assumptions about general speeds over the network based on the available data and local knowledge. Many EuroRAP and irap speed surveys have found that it is not uncommon for 85 th percentile speeds to exceed the speed limit by 10 km/h over a range of speeds. Within the context and limitations of a drive-through survey, this is the assumption used in this work and generally it is supported by speed counts taken in these countries and their neighbours. When the posted speed limit was at small sections over a long road segment limited to a significantly lesser figure, it was assumed that the operating speeds were remained constant to the overall longer road segment. This was mainly encountered at intersections. It is though recognised that there will be variation between roads and locations, times of day, and indeed between countries, based upon such factors as level of speed limit enforcement, road layout, local features such as bends, general attitudes to speed, levels of traffic, to name just a few. Part of this stakeholder consultation is to seek information and set data collection in place that will provide richer data sources for future road assessments Crash Data The crash number, the death person number and the serious injured person number for all roads are used to support the countermeasure selection and economic analysis. The traffic crash data for the years are presented at the following Table (ETSC) Total deaths in road traffic * *Estimation According to information collected, country relevant data and appropriate assumptions, we have come to the estimation of 105 fatal accidents occurred at the inspected road network. The irap model assumes 10 serious: 1 death and therefore 21,340 fatal and serious casualties over 20 years under existing conditions Countermeasures costs In order the Safer Road Investment Plan to be developed, the costs of various countermeasures must be estimated. This will enable the determination of the benefit-cost [1] Wardrop J. G. and Charlesworth G. (1954). A method of estimating speed and flow of traffic from a moving vehicle. Proc. Inst. Civil Eng. part II, 3, Page 22
27 ratio of each proposed countermeasure. The costs must include all costs of design, engineering, materials, work, land as well as maintenance for their entire life cycle. Within SESoR, these costs were determined using a common approach followed by all project partners. This approach was based on a research implemented by the SENSOR project partner AMZS Slovenia, and are presented in Annex2. The costs are in local currency (Bulgarian Lev). The countermeasure costs data used ou tput should be considered as model patterns; however the ViDA online software allows calibrating the countermeasure costs according to exact data, given by the particular national road authorities. Details are provided in Annex 2.. In some cases a low countermeasure cost has been assumed in order to enable the model to consider all suitable candidate sites for that measure Economic data 1. Analysis period The number of years over which the economic benefits of the Safer Roads Investment Plan is calculated. The value for this project is set to 20 years. 2. Gross Domestic Product The key figure for the Safer Road Investment Plan is the GDP per capita in local currency. As the source of this figure the IMF World Economic Outlook Database of October 2013 was used. The GDP per capita in Bulgaria for 2014 is 11,308 Bulgarian Lev - BGN. 3. Discount rate and minimum attractive rate of return Discounting is a technique used, among other things, to estimate costs and benefits that occur in different time periods and is used to calculate the Net Present Values (NPV) and budgets required within irap s ViDA software. The appropriate discount rate to use can vary by country and in many investment project modelling exercises is set in consultation with the funder. Typically, the discount rate varies from 4% to 12%, the latter figure being often used in World Bank transport projects. In SENSoR, a figure of 12% has been used in many countries, whereas in others, after local consultation, 9% and 4% has been used. A sensitivity analysis conducted within the ViDA Model showed that from a practical perspective, at a 12% discount rate compared with 4%, the total Present Value of safety benefits was approximately halved, the overall estimated cost of the investment is reduced by about a third and the estimated number of fatal and serious injuries saved over 20 years is reduced by about 10%. Lists of triggered countermeasures are similar with, as expected, slightly fewer sites or lengths of road recommended for improvement when the discount rate is higher. Again, as part of the consultation process in individual countries, variations on the discount rate can be trialled. In Bulgaria, a discount rate of 12% has been used in this consultation report. The minimum attractive rate of return has been set at the decimal fraction equivalent. High discount rates and the implied zero-traffic growth assumption within the model would mean that the Benefit Cost Ratios and estimates of casualties saved are highly conservative. 4. Value of life This figure reflects the social cost of one fatality on the road. In this project the irap recommendation of GDP x 70 (see McMahon and Dahdah (2008) was used. Thus, the value of life was estimated at 791,592 BGN. 5. Value of serious injury This figure reflects the social cost of one serious injury on the road. In this project the irap recommendation of Value of life x 0.25 (see McMahon, Dahdah: The True Costs of Road Crashes, irap 2010) was used. Thus, the value of serious was estimated at 197,898 BGN. Page 23

28 4 Star Rating Results Based on the coded and supporting data, the ViDA online software produces star rating of the surveyed network. The star rating is based on individual relative risk for four user groups vehicle occupants, passengers, motorcyclists and bicyclists. Therefore, four different star ratings were produced. The software is also capable of smoothing the data in order to eliminate random star rating differences over short sections of road. 4.1 Overall Star Ratings Results The Star Ratings results for the entire road network analysed are presented in the next figures for each user group. Figure 7 - Star Rating results for the inspected network As seen on the above table, almost none (less than 0.5%) of the Bulgarian surveyed network was awarded 5 stars, and just 2% was awarded 4 stars for the vehicle occupants. Roughly one-fourth of the network (28%) gained 3 stars, while almost half of the network (47%) gained only one star. The rating for the motorcyclists is worse when 71% of the network belongs to to the one-star high-risk category. Pedestrians and bicyclists results are distorted by the fact that about half of the inspected network was not star rated for pedestrians and bicyclists. This is due to non-existent pedestrian and bicyclist flow on these sections. The examined roads are dual-carriageway, rural highways. Nevertheless, it is evident that the rated road sections for the vulnerable road users were awarded poor rating, especially the pedestrians safety rating turned out to be very low. The total length adds up to 691 km which is more than the network length stated (641 km). This is due to the fact that the dual carriageway roads (A3 and A6) were surveyed in both directions. The table shows the Star Rating before smoothing raw data. The next figures show Star Rating maps after smoothing. Page 24


29 Figure 8 Star Rating map for vehicle occupants Figure 9 Star Rating map for motorcyclists Page 25


30 Figure 10 Star Rating map for pedestrians Figure 11 Star Rating map for bicyclists Problems and the lack of pedestrian facilities is evident in the examined Bulgarian network. The following examples are indicative of the problem. EXAMPLE 1 Page 26


31 Example 1 No sidewalk provision and pedestrian facilities at a crossing (National Road 5) EXAMPLE 2 Example 2 Absence of a pedestrian footpath in a village (National Road 5) Page 27

32 5 Safer Roads Investments Plan (SRIP) The basic output of the RAP method, as described in paragraph 1 is the Safer Roads Investment Plan. The SRIP presents all the countermeasures proved able to provide the greater safety capacity and maximize the benefit over spent cost of the planned investments. The cost of each countermeasure is compared to the value of life and serious injuries that could be saved and Benefit to Cost Ratio (BCR) is calculated for each countermeasure proposed. The minimum BCR for the entire SRIP was set to 1. It has to be mentioned that the countermeasures listed are indicative and will need to be assessed and sense-checked with local engineers. The Safer Roads Investment Plan is not a bill of works. 5.1 Overall SRIP Results The SRIP for the entire surveyed network would save 15,080 fatal and serious injuries over the analysis period of 20 years. The cost of these countermeasures adds up to approx. 500 million BGN. The total BCR of the entire investment plan is 3. Figure 11 presents the top 10 countermeasures of the SRIP in terms of saved lives and serious injuries (FSI). Using a threshold BCR of 3 for every 100m (meaning that every countermeasure must return an injury saving of three times its cost to be considered) achieves a programme BCR of 6 (for less than half the budget and a reduction of 14,190 fatal and serious casualties over 20 years (Figure 11a). Figure 12: Top 10 countermeasures for the entire road network, BCR=1 (unrounded data) Page 28


33 Figure 13a: Top 10 countermeasures for the entire road network, BCR=3 (unrounded data) The Star Rating results after adopting all the proposed countermeasures (BCR=1) are presented in the next figures. Figure 14 Star Rating after implementing the SRIP It is clear that the SRIP would improve the Bulgarian road network safety significantly. For vehicle occupants, the number of 1-Star high-risk roads would decrease to only 4%, whereas the 5-Star roads would be present in 56% of cases. Overall number of 91% of 3-or-more-Star roads is a good result. There are significant improvements in the motorcyclists safety, as well as pedestrians and bicyclists. However, effect of the SRIP on these user groups is relatively lower than for the vehicle occupants. Page 29


34 Figure 15 Star Rating map for vehicle occupants after implementing the SRIP Figure 16 Star Rating map for motorcyclists after implementing the SRIP Page 30


35 Figure 17 Star Rating map for pedestrians after implementing the SRIP Figure 18 Star Rating map for bicyclists after implementing the SRIP The next figure presents the predicted casualty reductions after implementing the proposed SRIP. Reduction in FSIs over 20 years Page 31

36 Figure 19 Predicted casualty reduction map This map focuses on where to address the countermeasures primarily to save the most lives and serious injuries. It is clear that the predicted casualty reduction is evenly spread throughout the network, with some evident sections where focus should be put in the first place because the predicted countermeasures are expected to be most effective in those locations. Benefit Cost Ratios Across the 14 countries for which there are data in the SENSoR project, the range of Benefit Cost Ratios is typically 5 or 6 (6 in Bulgaria if a threshold BCR of 3 is set) for the selected overall investment programmes. For individual countermeasures, the BCRs of those with greatest life-saving potential are of course higher and in most countries include many in the range between 5 and 10, but in some often up to and around 20. BCRs for some countermeasures are predicted to be even higher, typically if costs of the measures are low (such as with delineation) if the risk reduction is focussed on a very limited part of the network (for example, at crossing facilities for pedestrians at a few sites of high activity), or if a predicted risk is precisely matched with a countermeasure (such as median barriers countering head-on crashes) BCRs for overall country programmes or countermeasures dependent upon many elements, including the acceptance threshold that is set for matching countermeasures with risk over every 100m, the value of life and the countermeasure costs selected. These results for consultation provide a limited scenario of costs and benefits and the ViDA software offers the opportunity for local engineers and policy makers to vary the parameters to match them local circumstances and budgets. Examples Some of the most effective proposed countermeasures are (photos courtesy of irap): Safety barriers Page 32

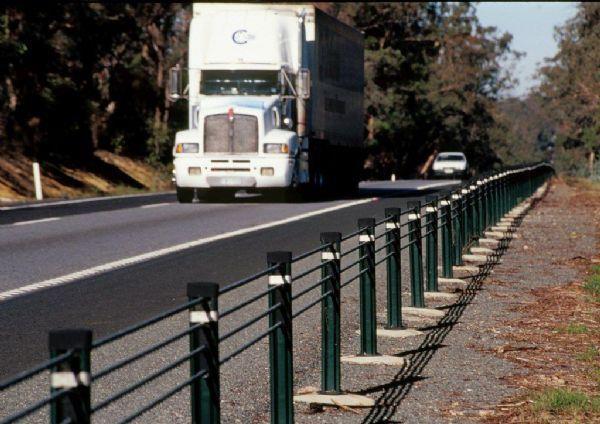
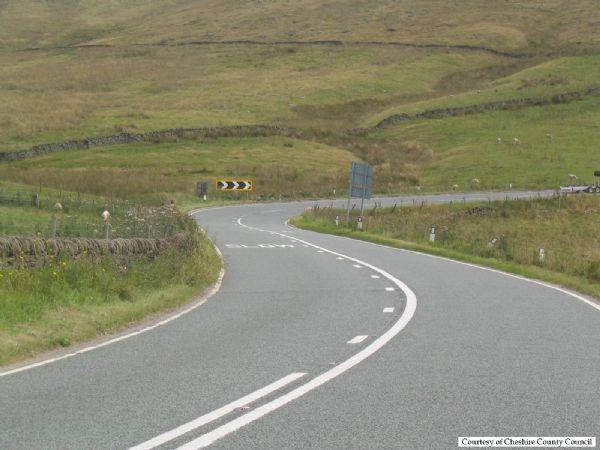
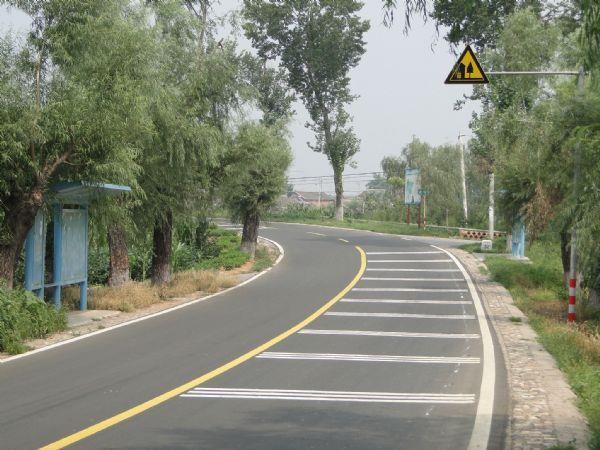
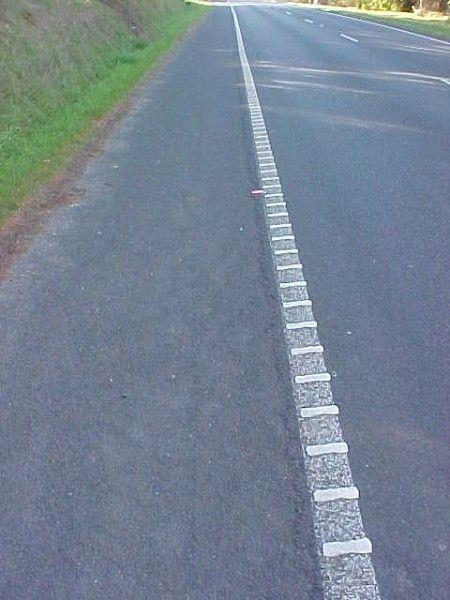
37 Improve curve delineation Rumble strips Road surface rehabilitation Page 33


38 Page 34
39 6 Conclusions Between November 2013, 641 km of the strategic road network in Bulgaria (691 km of carriageway length) were surveyed by TRANSPORTATION SOLUTIONS using a dedicated survey vehicle and specialised technology. The roads surveyed were often a mixture of single- and dual-carriageways and in need of rehabilitation. Typically they do not have the protection or crash-avoiding provision available in high-performing European countries. Crash protection systems such as barriers and modern, well-designed intersections are not provided; the quality of maintenance is often poor. The Star Rating results for infrastructure safety are presented for different classes of road user (on a 1-5 scale) vehicle occupants, motorcyclists, pedestrians and cyclists. 70% of roads rate as less than 3-star for vehicle occupants, 90% of the sections rates as less than 3- star for motorcyclists. While, about half of surveyed roads rate less than 3-star for pedestrians and cyclists. On the single carriageway parts of the network, the features that lead to death and serious injury in the event of a crash were as expected found to be widely present: o o o o lack of head-on protection junctions where brutal right-angled side-impacts may occur hazards such as unprotected electricity poles or trees close to the road lack of provision for pedestrians and cyclists Nevertheless, data for the period (ETSC) reveal that Bulgaria made a significant reduction (23%) in total deaths of road users. However Bulgaria has the highest rate of road deaths per million inhabitants in the European Union. Furthermore, Bulgaria remains one of the EU's most dangerous countries for traffic accidents due to the behaviour of drivers and bad quality of the roads. This is the reason why the SENSoR project is so important. Within this unique project a realtime road safety inspection on 641 km of the primary road network was realized. Through the specific analysing software ViDA it was possible to identify the dangerous high risk road sections. Although the total length of the survey roads is not very long the results are reliable and they depict the reasons why Bulgaria has the highest rate of road deaths in EU. Almost none (less than 0,5%) of the Bulgarian surveyed superior road network (TEN-T) was awarded 5 stars, and just 2% was awarded 4 stars for the vehicle occupants. Moreover, 47% of the network gained only 1 star. The rating for motorcyclists is even worse, since about 70% belongs to the one-star high-risk category. The ratings for pedestrians and cyclists are not good either. Tools developed by irap are now frequently applied to help develop Safer Roads Investment Plans for national governments and financial institutions. These tools, using a standard pool of more than 90 variations on proven safety measures from international practice, help evaluate how much it would cost to raise star ratings. They also show how the most lives can be saved for the money available by targeting high return safety countermeasures at locations of known high risk. These results have been assessed with the potential for fatal and serious casualty reduction predicted in the RAP online software ViDA. Assuming a threshold BCR=1, the estimated cost of upgrading and rehabilitation along the entire length of this network is assumed to be approximately 500 million BGN (Bulgarian Levs) and will provide a Benefit Cost Ratio (BCR) of 3. The casualty reduction on the priority sections would be around 65% around 15,080 Page 35
40 fatal and serious injuries saved over 20 years if the network is upgraded. In addition to the measures presented here, it is likely that benefits would result from the upgrading of the 15 (25%) pedestrian crossings described as of poor quality. Funds for road improvement will be limited and so the tools used in this analysis may be applied to select only parts of the network for improvement and/or a higher BCR threshold may be set to target measures providing higher returns for a smaller budget. The most important proposed countermeasures include duplication with median barrier (on single carriageway parts), roadside barriers on both sides, road surface rehabilitation, delineation improvements, additional lane and footpath provision. The likelihood of a road accident with fatal consequences is still unacceptably high on most Bulgarian roads. The ViDA TM software is able to calculate bank-ready safe road infrastructure investment plans with a list of most effective life-saving countermeasures on particular road sections. The countermeasures listed are indicative and will need to be assessed and sense-checked with local engineers and road authorities. The Safer Roads Investment Plan is not a bill of works, however we strongly hope, that the Bulgarian road owners and administrators will accept the project results not as a kind of competition, but as a support and the ViDA software will become a helpful tool in their daily work. Page 36
41 SENSoR Star Rating Report - BULGARIA Annex 1 Traffic Volumes and Operating Speeds Road Name Type (Divided/Undivided) From To AADT Operating Speed Mean Speed A3 Divided DYAKOVO DRAGICHEVO 35, A6 Divided DRAGICHEVO SOFIA 40, E79 Undivided DYAKOVO NOVO DELCHEVO 28, Undivided POLSKO KOSOVO ZLATNA PANEGA 19, Undivided ZLATNA PANEGA VELIKO TARNOVO 10, Undivided VELIKO TARNOVO ROMANIAN BORDER 19, Undivided BU-SE BORDER SERBIAN BORDER 18, Undivided BLATATA LOMSKO SHOSE B. 28, Page 37
42 SENSoR Star Rating Report - BULGARIA Annex 2 Countermeasure costs Countermeasure ID Countermeasure C'way Code Unit of Cost Service Life RURAL Low Upgrade Cost RURAL Med Upgrade Cost RURAL High Upgrade Cost URBAN Low Upgrade Cost URBAN Med Upgrade Cost URBAN High Upgrade Cost 1 Improve delineation Individual lane km 5 5,000 6,000 7,000 4,600 5,200 6,000 2 Bicycle lane (on-road) Individual per km 20 14,000 17,000 20,000 10,000 12,000 14,000 3 Bicycle lane (off-road) Individual per km 20 80, , ,000 60, , ,000 4 Motorcycle lane (painted logos only on-road) Individual per km 5 4,000 5,000 6,000 4,000 5,000 6,000 5 Motorcycle lane (construct on-road) Individual per km 20 80, , ,000 80, , ,000 6 Motorcycle lane (segregated) Individual per km , , , , , ,000 7 Horizontal realignment Individual lane km , , ,000 80, , ,000 8 Improve curve delineation Individual per carriageway km 5 8,000 9,600 11,200 7,360 8,320 9,600 9 Lane widening (up to 0.5m) Individual lane km 10 40,000 50,000 60,000 40,000 50,000 60, Lane widening (>0.5m) Individual lane km 10 80, , ,000 80, , , Protected turn lane (unsignalised 3 leg) Multi intersection 10 60,000 80, ,000 50,000 70,000 84, Protected turn lane (unsignalised 4 leg) Multi intersection 10 60,000 80, ,000 50,000 70,000 84, Delineation and signing (intersection) Multi intersection 5 7,000 10,000 16,000 7,000 10,000 16, Protected turn provision at existing signalised site (3-leg) Multi intersection 10 7,000 10,000 16,000 7,000 10,000 16, Protected turn provision at existing signalised site (4-leg) Multi intersection 10 7,000 10,000 16,000 7,000 10,000 16, Signalise intersection (3-leg) Multi intersection 20 50,000 60,000 80,000 50,000 60,000 80, Signalise intersection (4-leg) Multi intersection 20 50,000 60,000 80,000 50,000 60,000 80, Grade separation Multi intersection 50 8,000,000 12,000,000 18,000,000 7,000,000 10,000,000 16,000, Rail crossing upgrade Multi intersection , , , , , , Roundabout Multi intersection , ,000 1,000, , , , Central hatching Multi per km 10 6,000 8,000 10,000 6,000 8,000 10,000 Page 38
43 SENSoR Star Rating Report - BULGARIA 22 Rumble strip / flexi-post Multi per km 10 15,000 17,000 20,000 15,000 17,000 20, Central turning lane full length Multi per km 10 80, , ,000 80, , , Central median barrier (no duplication) Multi per km , , , , , , Duplication with median barrier Undivided Only per carriageway km 20 1,200,000 1,280,000 1,360,000 1,260,000 1,340,000 1,420, Duplicate - <1m median Undivided Only per carriageway km , , , , , , Duplicate m median Undivided Only per carriageway km , ,000 1,200, , ,000 1,260, Duplicate m median Undivided Only per carriageway km 20 1,160,000 1,400,000 1,700,000 1,220,000 1,460,000 1,760, Duplicate m median Undivided Only per carriageway km 20 1,300,000 1,380,000 1,460,000 1,360,000 1,440,000 1,520, Duplicate - >20m median Undivided Only per carriageway km 20 1,600,000 1,680,000 1,760,000 1,660,000 1,740,000 1,820, Service Road Individual per km , , , , , , Additional lane (2 + 1 road) Individual per km , , , , , , Implement one way network Undivided Only per carriageway km 20 80, , ,000 60,000 90, , Upgrade pedestrian facility quality Individual unit 10 8,000 13,000 18,000 6,000 10,000 14, Refuge Island Multi unit 10 10,000 15,000 17,000 10,000 15,000 17, Unsignalised crossing Multi unit 10 1,600 2,400 3,000 1,200 1,600 2, Signalised crossing Multi unit 20 40,000 50,000 60,000 30,000 36,000 40, Grade separated pedestrian facility Multi unit , , , , , , Road surface rehabilitation Individual lane km 10 12,000 16,000 20,000 10,000 14,000 16, Clear roadside hazards - passenger side Individual per linear km 20 6,000 8,000 10,000 6,000 8,000 10, Clear roadside hazards - driver side Individual per linear km 20 6,000 8,000 10,000 6,000 8,000 10, Sideslope improvement - passenger side Individual per linear km 20 16,000 40,000 70,000 16,000 40,000 70, Sideslope improvement - driver side Individual per linear km 20 16,000 40,000 70,000 16,000 40,000 70, Roadside barriers - passenger side Individual per linear km , , , , , , Roadside barriers - driver side Individual per linear km , , , , , , Shoulder sealing passenger side (<1m) Individual per linear km 20 16,000 24,000 36,000 16,000 18,000 20,000 Page 39
44 SENSoR Star Rating Report - BULGARIA 48 Shoulder sealing passenger side (>1m) Individual per linear km 20 16,000 24,000 36,000 16,000 18,000 20, Restrict/combine direct access points Individual per km , , , , , , Footpath provision passenger side (adjacent to road) Individual per km 20 80, , ,000 80,000 90, , Footpath provision passenger side (>3m from road) Individual per km , , ,000 84, , , Speed management reviews Individual per carriageway km 5 20,000 50,000 80,000 20,000 50,000 80, Traffic calming Individual per carriageway km 10 24,000 40,000 60,000 16,000 24,000 36, Vertical realignment (major) Individual lane km 20 16,150,000 20,188,000 28,262,000 23,072,000 28,840,000 40,376, Overtaking or additional lane Individual per linear km Median Crossing Upgrade Multi intersection 10 40,000 60,000 80,000 24,000 30,000 40, Clear roadside hazards (bike lane) Individual per km 20 4,000 6,000 8,000 4,000 6,000 8, Sideslope improvement (bike lane) Individual per km 20 8,000 12,000 20,000 8,000 10,000 12, Roadside barriers (bike lane) Individual per km 20 50,000 80, ,000 40,000 70,000 80, Clear roadside hazards (seg MC lane) passenger side Individual per km 20 8,000 10,000 12,000 9,000 11,000 13, Sideslope improvement (seg MC lane) passenger side Individual per km 20 16,000 20,000 24,000 18,000 22,000 26, Roadside barriers (seg MC lane) passenger side Individual per km , , , , ,000 2,250, Speed management reviews (MC Lane) Individual per carriageway km 5 6,666 16,666 20,000 6,666 16,666 20, Central median barrier (MC lane) Multi per km , ,000 1,500, ,000 1,350,000 4,500, Skid Resistance (paved road) Individual lane km 10 96, , , , , , Skid Resistance (unpaved road) Individual per carriageway km 10 40,000 50,000 72,000 58,000 72, , Pave road surface Individual lane km , , , , , , Street lighting (mid-block) Individual lane km , , , ,000 1,010,000 1,414, Street lighting (intersection) Individual intersection , , , , , , Street lighting (ped crossing) Individual unit 20 70,000 88, , , , , Shoulder rumble strips Individual per carriageway km 10 9,000 10,800 12,600 8,280 9,360 10, Parking improvements Individual per carriageway km 20 30,000 38,000 46,000 46,000 56,000 68,000 Page 40
45 SENSoR Star Rating Report - BULGARIA 79 Sight distance (obstruction removal) Individual per carriageway km 20 42,000 54,000 74,000 60,000 76, , Pedestrian fencing Individual per carriageway km , , , , , , Side road grade separated pedestrian facility Individual intersection 20 7,070,000 8,836,000 12,370,000 10,098,000 12,624,000 17,672, Side road signalised pedestrian crossing Individual intersection Side road unsignalised pedestrian crossing Individual intersection Footpath provision passenger side (with barrier) Individual per linear km Footpath provision passenger side (informal path >1m) Individual per linear km Shoulder sealing driver side (<1m) Individual per linear km Shoulder sealing driver side (>1m) Individual per linear km Footpath provision driver side (adjacent to road) Individual per linear km Footpath provision driver side (>3m from road) Individual per linear km Footpath provision driver side (with barrier) Individual per linear km Footpath provision driver side (informal path >1m) Individual per linear km 10 40,000 50,000 60,000 30,000 36,000 40,000 1,600 2,400 3,000 1,200 1,600 2,000 26,666 33,332 40,000 26,666 30,000 33, , , , , , ,000 16,000 24,000 36,000 16,000 18,000 20,000 16,000 24,000 36,000 16,000 18,000 20,000 80, , ,000 80,000 90, , , , ,000 84, , , , , , , , , , , , , , , Realignment (sight distance improvement) Individual lane km , , , , , , Central median barrier (1+1) Undivided Only per km 20 1,360,000 1,700,000 2,380,000 1,942,000 2,428,000 3,398, Clear roadside hazards (seg MC lane) driver side Individual per km 20 8,000 10,000 12,000 9,000 11,000 13, Sideslope improvement (seg MC lane) driver side Individual per km 20 16,000 20,000 24,000 18,000 22,000 26, Roadside barriers (seg MC lane) driver side Individual per km , , , , ,000 2,250, Wide centreline Undivided Only per linear km , , , , , , School zone warning - signs and markings Individual lane km 5 9,000 10,000 11,000 11,700 13,000 14, School zone warning - flashing beacon Individual unit 20 10,800 12,000 13,200 8,640 9,600 10, School zone - crossing guard/supervisor Undivided Only unit 1 18,000 20,000 22,000 23,400 26,000 28,600 * The costs are in Bulgarian lev Page 41
46 SENSoR Star Rating Report - BULGARIA Annex 3 Minimum 3-star safety rating standard A 3-star EuroRAP/iRAP rating is a minimum target to achieve. For example, the government of the Netherlands has committed to achieving a 3-star minimum for its national roads by Similar targets are being used in some low- and middle-income countries in contracts for road improvements 1. Increasing the Star Rating is associated with a decrease in fatal and serious injury crash costs or crash rate about a halving in the metric by an increase of one star. The figure below shows this and the resulting dramatic reductions in crash costs at a 3-star rating 2. Figure 18: Smoothed vehicle occupant Star Ratings and fatal and serious injury costs per vehicle kilometre travelled The latest version of the EuroRAP/iRAP model released in 2014 makes achieving the 3-star target more difficult than the earlier versions. This recalibration is common in other fields too for example, in the European New Car Assessment Programme. Recalibration is a way of improving standards through time. 1 In road improvement contracts, the percentage kilometrage with at least 3-star rating can form part of a results indicator, subject to the availability of economically viable infrastructure countermeasures. At locations where it is not economically viable to lift the Star Ratings to at least 3-stars using infrastructure countermeasures, lowering operating speeds is also be considered. 2 See and for further details. Page 42


47 SENSoR Star Rating Report - BULGARIA The operating speed of the road is a large factor in determining what the Star Rating will be. Roads are rated at the higher of the 85th percentile operating speed or the posted speed limit 3. The figures below show the relationship of speed with Star Rating for different scenarios and illustrate the speeds at which a road may achieve 3-star or 4-star rating. Intersection frequency is also a factor. Figure 19: Common scenarios of the relationship between speed and Star Rating Motorway A 90 to 150km/h Flow: 35,000 AADT Median: barrier 0-1m offset Roadside: barrier 1-5m offset Intersections: merge lane A World Free of High Risk Roads 3 An explanation of this is provided at: 3/methodology?download=135:irap-methodology-fact-sheet-7-star-rating-bandsand Page 43


48 SENSoR Star Rating Report - BULGARIA Motorway B 90 to 150km/h Flow: 35,000 AADT Median: barrier 1-5 m offset Roadside: barrier 1-5m offset Intersections: merge lane A World Free of High Risk Roads Expressway A 70 to 130km/h Flow: 35,000 AADT Median: metal barrier 0-1m offset Roadside: poles 5-10m offset Intersections: merge lane A World Free of High Risk Roads In some situations it is not difficult to see how to increase the safety and the Star Rating of road sections in order to achieve 3-star. Some of the more obvious countermeasures which benefit various road users and have been used in other EuroRAP and irap studies to increase the Star Rating include: Safety barriers Increasing the paved shoulder width on the driver-side between the lane and the barrier Page 44
SAFER ROADS INVESTMENT PLANS FOR 14 COUNTRIES IN SOUTH EAST EUROPE
 SAFER ROADS INVESTMENT PLANS FOR 14 COUNTRIES IN SOUTH EAST EUROPE S. D. LAWSON Road Safety Foundation, United Kingdom steve.lawson@roadsafetyfoundation.org E. BELLOS & O. DJORDJEVIC Make Roads Safe Hellas,
Star Rating Roads for Safety Results for Consultation with Stakeholders
 Star Rating Roads for Safety Results for Consultation with Stakeholders HUNGARY http://sensorproject.eu/ The SENSoR Project About SENSOR The road infrastructure of a country not only serves the basic need
BUILDING CHINARAP. Zhang Tiejun Research Institute of Highway (RIOH) Beijing, China
 Beijing, China") BUILDING CHINARAP Zhang Tiejun Research Institute of Highway (RIOH) Beijing, China E-mail: tj.zhang@rioh.cn Greg Smith International Road Assessment Programme (irap) Beijing, China E-mail: greg.smith@irap.org
BUILDING CHINARAP Zhang Tiejun Research Institute of Highway (RIOH) Beijing, China E-mail: tj.zhang@rioh.cn Greg Smith International Road Assessment Programme (irap) Beijing, China E-mail: greg.smith@irap.org
irap Star Rating and Investment Plan Coding Manual
 irap Star Rating and Investment Plan Coding Manual Drive on the right edition - August 2014 Setting the standards for the road coding process RAP-SR-2.2 PRINT WARNING printed copies of this document or
ROAD SAFETY PERFORMANCE REVIEW Capacity Building Workshop for Uganda. irap METHODOLOGY Racheal M. N. Nganwa AfricaRAP Lead 1 & 2 March 2018
 ROAD SAFETY PERFORMANCE REVIEW Capacity Building Workshop for Uganda irap METHODOLOGY Racheal M. N. Nganwa AfricaRAP Lead 1 & 2 March 2018 About irap: Registered charity Vision: a world free of high risk
Middle East and North Africa Egypt Road Assessment Program
 Public Disclosure Authorized Public Disclosure Authorized Report No: AUS17950 Middle East and North Africa Egypt Road Assessment Program irap Egypt Technical Report December 10, 2014 GTI05 MIDDLE EAST
irap irap The world road safety problem irap Background irap Aims A Safe Road System Vaccines for Roads 1. irap Background 2. irap Malaysia Results
 irap irap 1. irap Background 2. irap Malaysia Results Rob McInerney, CEO irap Asia Pacific 3. irap Worldwide 4. The challenge The world road safety problem A Safe Road System Road 1.2 million killed every
Star Ratings for the Strategic Road Network. Richard Leonard - Highways England
 Star Ratings for the Strategic Road Network Richard Leonard - Highways England Strategic Direction for Road User Safety 2 Delivery Plan Star Rating - Commitments We will ensure that by the end of 2020
Star Rating Roads For Safety
 Star Rating Roads For Safety The EuroRAP Methodology Consultation version 16 September 2009 ` EuroRAP505.04 Star Rating Roads For Safety: The EuroRAP Methodology Page 2 About EuroRAP The European Road
Austroads National Risk Assessment Model (ANRAM) Chris Jurewicz, ARRB
 Chris Jurewicz, ARRB") Austroads National Risk Assessment Model (ANRAM) Chris Jurewicz, ARRB Overview Context What is ANRAM? How it is used? Severe crash risk estimation ANRAM Toolkit Next steps 2 Context Diminishing blackspots
Austroads National Risk Assessment Model (ANRAM) Chris Jurewicz, ARRB Overview Context What is ANRAM? How it is used? Severe crash risk estimation ANRAM Toolkit Next steps 2 Context Diminishing blackspots
Risk and Safety Assessment on Road Infrastructure. Olivera Djordjevic
 Risk and Safety Assessment on Road Infrastructure Olivera Djordjevic This presentation: How we score what we score Informed Investments Decisions: Safer Roads Investments Plans How it matters best case
THE IRAP ROAD SAFETY TOOLKIT A WEBSITE-BASED APPROACH TO ADDRESSING ROAD SAFETY PROBLEMS
 THE IRAP ROAD SAFETY TOOLKIT A WEBSITE-BASED APPROACH TO ADDRESSING ROAD SAFETY PROBLEMS Blair TURNER Principal Research Scientist, Safe Systems Division ARRB Group Ltd 500 Burwood Highway, Vermont South,
June Presentation Title. Peter Daly RACV. Presenter s Name
 June 17 2008 Presentation Title Peter Daly RACV Presenter s Name Overview What AusRAP is and isn t What it is trying to achieve How it works Key results Future directions What is AusRAP? Sister program
Crete irap demonstration project
 Crete irap demonstration project Draft for consultation August 2009 This project is financially supported by the FIA Foundation for the Automobile and Society and conducted in consultation with EuroRAP
ROSEE Road safety in Sout East European regions: Safe Road Infrastructure
 ROSEE Road safety in Sout East European regions: Safe Road Infrastructure Kostanjsek, Jure; Lipar, Peter; Milotti, Alberto 2014 European Workshop: Road Safety Design InternationalActivities Brussels, November
URBAN KIWIRAP IDENTIFYING ROAD SAFETY RISK ON NEW ZEALAND S URBAN ROADS
 URBAN KIWIRAP IDENTIFYING ROAD SAFETY RISK ON NEW ZEALAND S URBAN ROADS C. BRODIE & F. TATE & R. MINNEMA New Zealand Transport Agency, New Zealand colin.brodie@nzta.govt.nz, fergus.tate@nzta.govt.nz, ron.minnema@nzta.govt.nz
ROAD SAFETY DEMONSTRATION
 Shaanxi Mountain Road Safety Demonstration Project (RRP PRC 46042) ROAD SAFETY DEMONSTRATION A. Introduction 1. The Shaanxi Mountain Road Safety Demonstration Project (the project) is located in two prefecture-level
irap Star Rating and Investment Plan Implementation Support Guide March 2017
 irap Star Rating and Investment Plan Implementation Support Guide March 2017 RAP-SR-4.1 PRINT WARNING printed copies of this document or parts thereof should not be relied upon as a current reference document.
ROAD SAFETY RISK MAPPING USING STRUCTURED DATA
 ROAD SAFETY RISK MAPPING USING STRUCTURED DATA DR. P K SIKDAR Jigesh N. Bhavsar* Advisor, IRF (India Ch.) and President, ICT Pvt. Ltd., A-8 Green Park, New Delhi, India 110016 Tel: +91-11-40863224; Email:
usrap: An Innovation in Data-Driven Safety Analysis
 Est. Dec. 2014 usrap: An Innovation in Data-Driven Safety Analysis Presented by: Bruce Hamilton, Roadway Safety Foundation Doug Harwood, MRIGlobal Webinar Logistics Duration is 11:00 AM - 12:30 PM Mountain
Setting Regional and National Road Safety Targets
 10 th Meeting of the United Nations Road Safety Collaboration 3-4 June 2009, Bangkok Setting Regional and National Road Safety Targets Commemorating 60 years in Thailand 1949-2009 Lives at stake people
Discover the Safe System Approach
 Discover the Safe System Approach Aim Take you on a journey of discovery Inform, engage, enthuse and share with you the Safe System approach to saving death and injury on our roads Change to less graphic
Road safety design standards and the Asian Highway Network. irap Asia Pacific Workshop Greg Smith 2016/05/26
 Road safety design standards and the Asian Highway Network irap Asia Pacific Workshop Greg Smith (greg.smith@irap.org) 2016/05/26 AH Standard Summary While developing the Asian Highway network, Parties
Federative Republic of Brazil irap Pilot Technical Report
 Report No: AUS13001. Federative Republic of Brazil irap Pilot Technical Report.. Federal Highways November 2015 GTI04 LATIN AMERICA AND CARIBBEAN. . Standard Disclaimer: This volume was prepared by the
Economic and Social Council
 UNITED NATIONS E Economic and Social Council Distr. GENERAL 20 December 2006 ENGLISH Original: ENGLISH and FRENCH ECONOMIC COMMISSION FOR EUROPE INLAND TRANSPORT COMMITTEE Working Party on Road Traffic
A Road Safety Decade - The Case for Action
 A Road Safety Decade - The Case for Action Presentation by Dmitry Sambuk International Coordinator, Make Roads Campaign, FIA Foundation Monday 12 May 2009, Minsk, Republic of Belarus World Report on Road
NRA New Divided Road Types: Type 2 and Type 3 Dual - Carriageways
 NRA New Divided Road Types: Type 2 and Type 3 Dual - Carriageways DN-GEO-03059 December 2007 DN Design Technical TRANSPORT INFRASTRUCTURE IRELAND (TII) PUBLICATIONS About TII Transport Infrastructure Ireland
Interim Report on the Development of Road Safety Infrastructure Facility Design Standard for the Asian Highway Network
 Development of Road Infrastructure Safety Facility Standards Expert Group Meeting on Asian Highway United Nations Economic and Social Commission for Asia and the Pacific 3-4 October 2016 Interim Report
IMPLEMENTATION PROCESS OF DIRECTIVE 2008/96/EC IN SLOVENIA
 IMPLEMENTATION PROCESS OF DIRECTIVE 2008/96/EC IN SLOVENIA Zvonko Zavasnik, MSc IMPLEMENTATION PROCESS non-automatic process, transpose the substance, not literally, EU Directive Correlation table Correlation
Cycle traffic and the Strategic Road Network. Sandra Brown, Team Leader, Safer Roads- Design
 Cycle traffic and the Strategic Road Network Sandra Brown, Team Leader, Safer Roads- Design Highways England A Government owned Strategic Highways Company Department for Transport Road Investment Strategy
THE COMMON FINDINGS FROM ROAD SAFETY AUDITS AND ROAD SAFETY INSPECTIONS IN THE WESTERN BALKAN REGION WION
 X International Symposium "ROAD ACCIDENTS PREVENTION 2010" Novi Sad, 21 st and 22 nd October 2010. THE COMMON FINDINGS FROM ROAD SAFETY AUDITS AND ROAD SAFETY INSPECTIONS IN THE WESTERN BALKAN REGION WION
SENSOR Risk Mapping of roads in SEE
 SENSOR Risk Mapping of roads in SEE For road authorities they reflect more broadly how risk of fatal and serious crashes is distributed across the network and can influence investment decisions. In this
Road Safety Pledge. Route to vision zero 2050 in Europe The Hague, June 14th, Malta. Luxembourg Lithuania Latvia Italy
 Malta Luxembourg Lithuania Latvia Italy Ireland The Netherlands Sweden Spain Slovenia Slovakia Romania Portugal Poland 1965 Road Safety Pledge Route to vision zero 2050 in Europe The Hague, June 14th,
Road Safety Vademecum
 Road Safety Vademecum Road safety trends, statistics and challenges in the EU 2010-2013 March, 2014 European Commission DG for Mobility and Transport Unit C.4 Road Safety Contents Summary of findings...
6. BREENS/GARDINERS/HAREWOOD INTERSECTION - SAFETY IMPROVEMENT PROJECT
 6. BREENS/GARDINERS/HAREWOOD INTERSECTION - SAFETY IMPROVEMENT PROJECT General Manager responsible: Officer responsible: Author: Jane Parfitt General Manager City Environment DDI 941 8656 Michael Aitken
Road design and Safety philosophy, 1 st Draft
 Head Office SWEDEN www.vv.se Textphone: +46 243-750 90 Roger Johansson International Secretariat roger.johansson@vv.se Direct: +46 243 75880 Mobile: +46 70 6327373 Date: 2006-08-17 Reference: Road design
APPENDIX C. Systems Performance Report C-1
 APPENDIX C Systems Performance Report C-1 System Performance Report & Requirements According to the FAST Act, a long range transportation plan needs to include a system performance report and subsequent
EuroRAP s priorities. Road Safety: no Safe System without forgiving roads
 EuroRAP s priorities Our European Context Last 10 years 500,000 killed or serious trauma Majority outside cities & towns 5 serious traumas per km on main roads Annual crash cost 2% of GDP 50% Reduction
MDB Road Safety Initiative: A Development Priority
 MDB Road Safety Initiative: A Development Priority Every six seconds, someone is killed or maimed on the world s roads. Over 90 percent of these injuries occur in low- and middle-income countries. The
Road Safety. Inspections
 Title of your presentation Road Safety Name and contact details Inspections Phil Allan Australiaame ROAD SAFETY SEMINAR Lome, Togo October 2006 Definition A Road Safety Inspection (RSI) is an on-site systematic
NRA New Divided Road Types: Type 2 and Type 3 Dual-carriageways
 NRA New Divided Road Types: Type 2 and Type 3 Dual-carriageways BENEFITS of the TYPE 2 and TYPE 3 DUAL CARRIAGEWAY ROAD TYPE There are significant safety and economic benefits associated with the Type
[ Fundación PONS ] [ Fundación PONS ] [ Expertise PONS ] Investing in road safety
![[ Fundación PONS ] [ Fundación PONS ] [ Expertise PONS ] Investing in road safety](/thumbs/73/68505603.jpg "[ Fundación PONS ] [ Fundación PONS ] [ Expertise PONS ] Investing in road safety") With more than 60 years experience, PONS is a leading company in the fields of road safety and sustainable transportation planning, providing worldwide support with auditing, consultancy and training services,
With more than 60 years experience, PONS is a leading company in the fields of road safety and sustainable transportation planning, providing worldwide support with auditing, consultancy and training services,
ENHANCED IDENTIFICATION OF HIGH-RISK INTERSECTIONS. P. DURDIN Abley Transportation Consultants, New Zealand
 ENHANCED IDENTIFICATION OF HIGH-RISK INTERSECTIONS P. DURDIN Abley Transportation Consultants, New Zealand paul.durdin@abley.com 1. ABSTRACT The New Zealand Transport Agency s High-Risk Intersections Guide
The Safe System Approach
 There are very few areas of public discussion and sentiment which generate as much consensus as road safety. Everyone wants safer roads for all users, and road safety is a key priority for governments,
Road Safety Annual Report 2016 OECD/ITF Chapter 26. Morocco
 Road Safety Annual Report 2016 OECD/ITF 2016 Chapter 26 Morocco This chapter presents 2014 road safety data for Morocco along with provisional data from 2015. It looks at trends in traffic and road safety
Safe Speed programme ATTACHMENT 1. Randhir Karma, Group Manager Network Management and Safety
 Safe Speed programme ATTACHMENT 1 Randhir Karma, Group Manager Network Management and Safety 1 Why Safe Speeds? AT s strategic context National guidance AT has embraced Vision Zero principles and recognises
Introduction Methodology Study area and data collection Results and recommendation Conclusion References
 Introduction Methodology Study area and data collection Results and recommendation Conclusion References It is formal procedure for assessing accident potential and safety performance in the provision
ENGINEERING DESIGN STANDARDS TO ENSURE ROAD SAFETY: EXPERIENCES FROM INDIA
 ENGINEERING DESIGN STANDARDS TO ENSURE ROAD SAFETY: EXPERIENCES FROM INDIA Atul Kumar 1 ABSTRACT The primary goal of designing roads with adequate standards is to achieve a safer transport facility for
road safety issues 2001 road toll for Gisborne district July 2002 Road user casualties Estimated social cost of crashes*
 GISBORNE DISTRICT road safety issues July 22 The Land Transport Safety Authority (LTSA) has prepared this Road Safety Issues Report. It is based on reported crash data and trends for the 1997 21 period.
The Road Users Perspective and KiwiRAP
 The Road Users Perspective and KiwiRAP Mike Noon General Manager Motoring Affairs NZ Roadmarkers Federation Conference August 09 What is the AA and why does it care? Club with 1.25m Members Not for profit
Safe System approach A beckoning perspective for children
 Plenary Session 1 Safe System approach A beckoning perspective for children Fred Wegman Emeritus Professor, Traffic Safety at Delft University of Technology, the Netherlands Traditional approach: for example
EGYPT: a national decade of action for road safety
 EGYPT: a national decade of action for road safety 2011 2020 Egypt EGYPT Population: 75 497 913 Income group: Middle Gross national income per capita: $1 580 INSTITUTIONAL FRAMEWORK Lead agency Funded
Title. Authors. Safety Benefits of Highway Infrastructure Investments (May 2017)
") Title Safety Benefits of Highway Infrastructure Investments (May 2017) Authors Douglas W. Harwood 1, Jessica M. Hutton 1, Zachary N. Hans 2, Reginald R. Souleyrette 3, Michael A. Fields 3 1MRIGlobal 2Iowa
Title Safety Benefits of Highway Infrastructure Investments (May 2017) Authors Douglas W. Harwood 1, Jessica M. Hutton 1, Zachary N. Hans 2, Reginald R. Souleyrette 3, Michael A. Fields 3 1MRIGlobal 2Iowa
International Conference on Transportation Infrastructure Projects Conception To Execution
 International Conference on Transportation Infrastructure Projects Conception To Execution TIPCE 2019 Formulation of Engineering Countermeasures for Accident Blackspots using irap as a Tool Case Study
British Road Safety: Presentation 28/10/2009 by Duncan Price, Deputy Head, Road User Safety Division
 British Road Safety: Presentation 28/10/2009 by Duncan Price, Deputy Head, Road User Safety Division New British Road Safety Strategy Vulnerable Road Users Driving During Business Delivery with Local Organisations
2003 road trauma for. Wairoa District. Road casualties Estimated social cost of crashes* Major road safety issues WAIROA DISTRICT JULY 2004
 WAIROA DISTRICT JULY 24 T he Land Transport Safety Authority (LTSA) has prepared this road safety issues report. It is based on reported crash data and trends for the 1999 23 period. The intent of the
ROSEE RSA/RSI Introduction courses ROSEE Speed Management courses
 ROSEE RSA/RSI Introduction courses ROSEE Speed Management courses ROSEE PP8 UL FGG-PTI & WP4 leader Kostanjsek, Jure & Lipar, Peter Munchen, June 6, 2013 ROSEE WP4: Safe Roads and Mobility RSA/RSI course
Safer Roads by Design TM : Engineering Solutions to Implement irap Surveys. Washington, DC USA March 4-8, Executive Seminar
 Safer Roads by Design TM : Engineering Solutions to Implement irap Surveys Washington, DC USA March 4-8, 2019 Executive Seminar International Road Federation The Road Industry s Most Trusted Brand in Continuing
November 2, Government takes on the challenge of improving traffic safety
 November 2, 2006 Government takes on the challenge of improving traffic safety Edmonton... The Alberta government has taken on the challenge of improving traffic safety by moving ahead with a comprehensive,
Road Safety Audit training course. Motorways - safety issues of the motorway design
 Road Safety Audit training course Motorways - safety issues of the motorway design Jesper Mertner, Road safety auditor, COWI A/S 1 ROAD SAFETY AUDITING COURSE Content 1. Safety 2. Cross sections 3. Horizontal
At each type of conflict location, the risk is affected by certain parameters:
 TN001 April 2016 The separated cycleway options tool (SCOT) was developed to partially address some of the gaps identified in Stage 1 of the Cycling Network Guidance project relating to separated cycleways.
CITY OF OTTAWA ROADWAY MODIFICATION APPROVAL UNDER DELEGATED AUTHORITY
 RMA-2015-ATM-038 CITY OF OTTAWA ROADWAY MODIFICATION APPROVAL UNDER DELEGATED AUTHORITY DATE: April 22, 2015 SUBJECT Approval of Roadway Modifications Recommended through an Area Traffic Management Study
Guide to Road Design Part 3: Geometric Design Session I 18 October 2016
 Guide to Road Design Part 3: Geometric Design Session I 18 October 2016 Today s moderator Angela Racz Online Training Coordinator Knowledge Transfer - ARRB Group P: +61 3 9881 1694 E: training@arrb.com.au
Study on fatal accidents in Toyota city aimed at zero traffic fatality
 Study on fatal accidents in Toyota city aimed at zero traffic fatality Toru Kiuchi, Yoshihisa Kanno, Makoto Shiota Toyota Motor Corporation, 1 Toyota-cho, Toyota-shi, Aichi 471-8571, Japan Abstract - Since
REDUCING ACCIDENTS MEANS SAVING LIVES.
 REDUCING ACCIDENTS MEANS SAVING LIVES. "Almost 3500 people lose their lives on the world's roads every single day. It's a shocking figure. We can raise road safety standards significantly, and save lots
Assessing our National Highway Network: Highway Reviews and AusRAP A Combined Approach
 Assessing our National Highway Network: Highway Reviews and AusRAP A Combined Approach Bishop, I.A. 1 1 Traffic & Safety, The Royal Automobile Association of South Australia Abstract RAA conducts regular
SEETO ROAD SAFETY STRATEGY SURVEY
 SEETO ROAD SAFETY STRATEGY SURVEY Final March 2014 Page 0 SEETO Road Safety Strategy Survey Final March 2014 1 BACKGROUND 2 2 ROAD SAFETY STRATEGY 4 2.1 VISION AND TARGETS 5 3 REGIONAL PARTICIPANTS ROAD
EXECUTIVE SUMMARY March 2013
 EXECUTIVE SUMMARY March 2013 An Application of Safe System Approach to Intersections in the Capital Region Progress Report Introduction The Capital Region Intersection Partnership (CRISP) was founded in
BLACK SPOTS MANAGEMENT - SLOVENIAN EXPERIENCE
 BLACK SPOTS MANAGEMENT - SLOVENIAN EXPERIENCE PhD Marko Renčelj, Assoc. Prof. Matjaž Šraml, University of Maribor, Faculty for Civil Engineering X International Symposium "ROAD ACCIDENTS PREVENTION 2010"
Road safety management and speed management
 Road safety management and speed management WP5-Responsible: ERDF PP6 - AMZS Branka Leskovšek, Robert Štaba 6.6.2013 Automobile Association of Slovenia (AMZS) Association of Automobile and Touring Clubs
Chapter 5 DATA COLLECTION FOR TRANSPORTATION SAFETY STUDIES
 Chapter 5 DATA COLLECTION FOR TRANSPORTATION SAFETY STUDIES 5.1 PURPOSE (1) The purpose of the Traffic Safety Studies chapter is to provide guidance on the data collection requirements for conducting a
Post impact trajectory of vehicles at rural intersections
 Post impact trajectory of vehicles at rural intersections Doecke SD., Woolley JE. and Mackenzie JR. Centre for Automotive Safety Research Abstract This report describes the path of vehicles after a collision
Manifesto for a safe, efficient and sustainable transport in NZ
 8 January 2018 Manifesto for a safe, efficient and sustainable transport in NZ Movement is an alliance of organisations working to achieve a safe, efficient and sustainable transport system that provides
RECONSTRUCTION OF ROADS ROAD TO SAFETY
 RECONSTRUCTION OF ROADS ROAD TO SAFETY Dušan SAVKOVIĆ, M.Sc. in Civil Engineering The Highway Institute, Belgrade Abstract The analysis of the existing condition of Serbian road network from the safety
Florida Transportation Commission. October 1, 2008
 Florida Transportation Commission October 1, 2008 CONGRATULATIONS TO THE FLORIDA DEPARTMENT OF TRANSPORTATION! FLORIDA DEPARTMENT OF TRANSPORTATION: Winner for On Time Small Project FLORIDA DEPARTMENT
CITY OF SAINT JOHN TRAFFIC CALMING POLICY
 CITY OF SAINT JOHN TRAFFIC CALMING POLICY VERSION: 1.0 April 10, 2012 Pedestrians, Cyclists and Motorists Sharing Street Spaces CONTENTS INTRODUCTION... 3 POLICY GOAL... 3 POLICY OBJECTIVES... 3 GUIDING
Ireland: Implementing research outputs on safety management from CEDR (Conference of European Road Directors) research programme - Paper 3
 research programme - Paper 3") Ireland: Implementing research outputs on safety management from CEDR (Conference of European Road Directors) research programme - Paper 3 Alastair de Beer Transport Infrastructure Ireland Parkgate Business
Ireland: Implementing research outputs on safety management from CEDR (Conference of European Road Directors) research programme - Paper 3 Alastair de Beer Transport Infrastructure Ireland Parkgate Business
Development, implementation and use of the All Level Crossing Risk Model (ALCRM) Alan Symons Network Rail Infrastructure Ltd Great Britain
 Alan Symons Network Rail Infrastructure Ltd Great Britain") Development, implementation and use of the All Level Crossing Risk Model (ALCRM) Alan Symons Network Rail Infrastructure Ltd Great Britain 1 Level Crossing Facts (Great Britain) Over 7000 in active use
Development, implementation and use of the All Level Crossing Risk Model (ALCRM) Alan Symons Network Rail Infrastructure Ltd Great Britain 1 Level Crossing Facts (Great Britain) Over 7000 in active use
Risk Assessment on Danube Area Roads: RADAR project
 Risk Assessment on Danube Area Roads: RADAR project OLIVERA DJORDJEVIC, P R O J E C T D I R E C T O R, E I R A E U R O R A P, S L O V E N I A SANJA LES P R O J E C T M A N A G E R, F P Z, C R O AT I A
The key to achievement of a sustainable, safe traffic system lies in the systematic and consistent application of safety principles.
 3 SUSTAINABLE SAFE ROAD DESIGN: THEORY In the early 1990's, in the Netherlands Sustainable Safety was developed as a vision towards a safer road traffic system. The aim of Sustainable Safety is to avoid
Analyses and statistics on the frequency and the incidence of traffic accidents within Dolj County
 UNIVERSITY OF PITESTI SCIENTIFIC BULLETIN Faculty of Mechanics and Technology AUTOMOTIVE series, year XXIV, no. 28 Analyses and statistics on the frequency and the incidence of traffic accidents within
Road safety. REGIONAL COMMITTEE Provisional Agenda item 8.5. SEA/RC70/11 Malé, Maldives 6 10 September July Seventieth Session
 REGIONAL COMMITTEE Provisional Agenda item 8.5 Seventieth Session SEA/RC70/11 Malé, Maldives 6 10 September 2017 21 July 2017 Road safety Road traffic injuries constitute a major public health burden with
saving lives SWARCO The Better Way. Every Day.
 Reducing Accidents means saving lives SWARCO The Better Way. Every Day. Shutterstock REDUCING ACCIDENTS MEANS SAVING LIVES Almost 3500 people lose their lives on the world's roads every single day. It's
Safer Verges and the Strategic Road Network
 Safer Verges and the Strategic Road Network Gavin Williams Senior Technical Advisor Vehicle Restraints Outline The Journey from Highways Agency to Highway England Overview of the Highways England Health
CITY OF WEST KELOWNA COUNCIL POLICY MANUAL
 CITY OF WEST KELOWNA COUNCIL POLICY MANUAL Page 1 of 7 DEPARTMENT: Engineering Services SUBJECT: Traffic Calming Policy (Revised June 6, 2017) Policy Statement: The provision of traffic calming measures
INDEX. Geometric Design Guide for Canadian Roads INDEX
 Acceleration lane, see Lanes, Acceleration Access, 8.1 Access Management and Functional Classification 8.2 Access Management by Design Classification 8.3 Access Configuration 8.4 Building Set-Back Guidelines
EuroRAP 2009 Results. Murska Sobota. Gornja Radgona. Lendava Ljutomer. Slovenj Gradec. Maribor. Ptuj. Ormož. Jesenice Velenje. Slovenska.
 Gornja Radgona Murska Sobota Slovenj Gradec Maribor Lendava Ljutomer Jesenice Velenje Slovenska Ptuj Ormož Tolmin Kranj Celje Trbovlje LJUBLJANA Litija Nova Gorica Idrija Krško Trebnje Novo mesto Postojna
City of Wayzata Comprehensive Plan 2030 Transportation Chapter: Appendix A
 A1. Functional Classification Table A-1 illustrates the Metropolitan Council s detailed criteria established for the functional classification of roadways within the Twin Cities Metropolitan Area. Table
PLANNING FOR SUSTAINABLE PEDESTRIAN INFRASTRUCTURE NALIN SINHA INITIATIVE FOR TRANSPORTATION & DEVELOPMENT PROG. (ITD), DELHI
, DELHI") PLANNING FOR SUSTAINABLE PEDESTRIAN INFRASTRUCTURE NALIN SINHA INITIATIVE FOR TRANSPORTATION & DEVELOPMENT PROG. (ITD), DELHI India s Road Network 5 million kms: Total road length 2.6 mn kms: Surfaced
PLANNING FOR SUSTAINABLE PEDESTRIAN INFRASTRUCTURE NALIN SINHA INITIATIVE FOR TRANSPORTATION & DEVELOPMENT PROG. (ITD), DELHI India s Road Network 5 million kms: Total road length 2.6 mn kms: Surfaced
Findings on the Effectiveness of Intersection Treatments included in the Victorian Statewide Accident Black Spot Program
 Findings on the Effectiveness of Intersection Treatments included in the Victorian Statewide Accident Black Spot Program Nimmi Candappa, Jim Scully, Stuart Newstead and Bruce Corben, Monash University
Cycling and risk. Cycle facilities and risk management
 Cycling and risk Cycle facilities and risk management Failure to recognize possibilities is the most dangerous and common mistake one can make. Mae Jemison, astronaut 6/11/2010 York Regional Council Cycling
Background. The scale of the problem. The scale of the problem. Road Safety in London, the statistics. 280 Fatalities from road crashes in 2002
 Impacts: 8th Intercontinental Conference - Geneva Thursday, 13 November 23 European Road Safety Programme Implementation by Cities AN OVERVIEW OF THE LONDON PICTURE Lukman Agboola Senior Road Safety Engineer
Lincolnshire JSNA: Road Traffic Accidents
 Road Traffic Accidents What do we know? Summary A higher proportion of road traffic collisions in Lincolnshire result in death compared to other areas. This may be due to the types of road in the County
LEA BRIDGE ROAD - A STREET FOR EVERYONE Public consultation document
 LEA BRIDGE ROAD - A STREET FOR EVERYONE Public consultation document TELL US Bakers Arms to Leyton Green Road (Section D, E, F) Leyton Green Road to Whipps Cross Roundabout (Section G) YOUR VIEWS www.enjoywalthamforest.co.uk
Road safety in the Eastern Mediterranean Region
 Road safety in the Eastern Mediterranean Region Facts from the Global Status Report on Road Safety 2013 Road safety in the Eastern Mediterranean Region Introduction In 2004, the World Health Organization
The road transport system is an open and complex system. Vision Zero The Basics
 TMALL 0146 Presentation widescreen engelsk v 1.0 2017-11-07 Vision Zero The Basics Anders Lie Specialist, Trafikverket The road transport system is an open and complex system Infrastructure Vehicles Road
Proven Safety Countermeasures. FHWA Office of Safety January 12, :00 p.m. to 2:00 p.m. Eastern Time
 Proven Safety Countermeasures FHWA Office of Safety January 12, 2012 1:00 p.m. to 2:00 p.m. Eastern Time Introduction and Background While States should still be considering the application of all of the
A Road Safety Strategy for Greece
 United Nations Economic Commission for Europe Conference on Improving Road Safety in the BSEC Region 18-19 November 2010, Ioannina, Greece A Road Safety Strategy for Greece George Kanellaidis, George Yannis,
Scientific Analysis of Road Traffic Accidents. Requirements and Training Needs. Saving Lives through Accident Research
 Saving Lives through Accident Research Scientific Analysis of Road Traffic Accidents Requirements and Training Needs SAFE Annual Convention Shimla Overview Importance of In-Depth Accident Data (the feedback
4. WIDER SOCIAL DETERMINANTS OF HEALTH
 4. WIDER SOCIAL DETERMINANTS OF HEALTH 4.6 Road Safety Road safety affects all road users; pedestrians, cyclists and vehicle drivers and passengers. This section describes the impact of road safety and