Supplemental Information Item #F3 MANAGEMENT PLAN. Fiscal Year
|
|
|
- Loren Mitchell
- 5 years ago
- Views:
Transcription

1 Supplemental Information Item #F3 MANAGEMENT PLAN Fiscal Year May 6, 2015
2 Table of Contents I. Executive Summary... 2 Omnitrans Vision... 5 Omnitrans Mission Statement... 5 II. Strategic Initiatives... 5 Implementation... 6 Strategic Initiative 1 - Fuel Cost Reduction... 7 Strategic Initiative 2 - New Bus Technology... 9 Strategic Initiative 3 - West Valley Connector Corridor Strategic Initiative 4 - San Bernardino Transit Center Strategic Initiative 5 - September Service Change Strategic Initiative 6 - Consistent Staffing Levels
3 Management Plan FY 2016 Executive Summary The primary purpose of this FY 2016 Management Plan is to provide a set of actions to align the efforts of the Omnitrans Leadership Team in its decision-making and execution of strategies for the multi-faceted needs and desires of the region. Furthermore, it is an example of the type of strategic business actions used to improve business operations. It involves evaluating products and services, examining labor performance, procurement costs, delivery processes and customer satisfaction. This plan is a result of a collaborative effort of Omnitrans CEO/General Manager and Directors who have systematically reviewed the agency s Short Range Transit Plan (SRTP) for Fiscal Years OmniConnects. It serves as the basis for evaluation of progress and performance on the SRTP in FY Omnitrans Short Range Transit Plan s goals are: Deliver safe, reliable, clean, frequent, convenient, comfortable and equitable service. Enhance Omnitrans network design to increase ridership and minimize costs by reducing redundancy. Minimize impact to existing riders while seeking opportunities to expand ridership. Support the local economy by providing connections to where people want to go. Maximize cost recovery while charging a fair fare. Support initiatives that are financially and environmentally sustainable in the short and long term. Expand, maintain and improve existing vehicles, facilities and passenger amenities. Resting on the seven goals of the SRTP OmniConnects, this Management Plan for FY 2016 focuses on six Strategic Initiatives: Fuel Cost Reduction New Bus Technology West Valley Connector Corridor San Bernardino Transit Center September Service Change Consistent Staffing Levels 2 2
4 Management Plan FY 2016 The Management Plan presented in this document also demonstrates our commitment to ongoing collaboration with our partners in particular, the San Bernardino Associated Governments (SANBAG) FY Short Range Transit Plan as illustrated in the diagram on the following page. 3 3
5 Management Plan FY 2016 Omnitrans Management Plan Linkages to SRTP Plans Management Plan FY 2016 Develop and implement a comprehensive Fuel Cost Reduction Plan. Introduce New Bus Technology that will reduce operating costs. Advance West Valley Connector Corridor design and pursue grant funding opportunities. Commence bus operations at the San Bernardino Transit Center. Implement September Service Changes as outlined in the SRTP, to streamline service, improve efficiencies and attract new customers. Maintain Consistent Staffing Levels throughout the Agency Omnitrans SRTP FY Support initiatives that are financially and environmentally sustainable in the short and long term. Minimize impact to existing riders while seeking opportunities to expand ridership. Maximize cost recovery while charging a fair fare. Support the local economy by providing connections to where people want to go. Enhance Omnitrans network design to increase ridership and minimize costs by reducing redundancy. Expand, maintain and improve existing vehicles, facilities and passenger amenities. Deliver safe, reliable, clean, frequent, convenient, comfortable and equitable service. SANBAG s SRTP FY Network Connectivity Coordinate and integrate the transit services of the various transit operators throughout the County Inter-Regional Transit Travel Facilitate interregional transit travel between regions of the County as well as between San Bernardino County and other counties. Access for All Seek cost-effective accessibility programs to improve mobility for seniors and persons with disabilities. Commuter Rail Service Support continued development and enhancement of commuter rail service in San Bernardino County. Key Projects Implement projects that will support the SRTP s goals, including: carpool/ vanpool services; downtown SB Passenger Rail Project; SB Transit Center; Redlands Passenger Rail Project. 4 4
6 Management Plan FY 2016 Omnitrans Vision Omnitrans vision for Transit in the San Bernardino Valley is a values and customer based vision where: The San Bernardino Valley s multimodal transit system supports the local economy. Omnitrans service is reliable, not just in the narrow sense of on-time performance, but in a broader manner: Omnitrans service is worthy of the customer s trust. Customers have a high-quality experience using Omnitrans. Omnitrans maximizes value to the community with every transit dollar available. Omnitrans Mission Statement Omnitrans mission is: To provide the San Bernardino Valley with comprehensive public mass transportation services which maximize customer use, comfort, safety, and satisfaction, while efficiently using financial and other resources in an environmentally sensitive manner. Strategic Initiatives The purpose of this section is to provide the reader with guidance on how the Strategic Initiatives are presented in later sections, as well as how the Management Plan will be implemented. The Management Plan for FY 2016 centers on six Strategic Initiatives: Fuel Cost Reduction New Bus Technology West Valley Connector Corridor San Bernardino Transit Center September Service Change Consistent Staffing Levels Each Strategic Initiative consists of seven sections: 1. Goal Statement what will be accomplished in FY Supports SRTP Goals identifies the Omnitrans SRTP goals that the Strategic Initiative supports. 3. Outcome(s) what will be the measureable benefit or impact of completing the Initiative. 4. Strategic Actions key actions necessary to complete the Initiative that require organizational coordination and collaboration. 5. Performance Indicators how progress and/or success toward the Outcomes will be articulated in Rationale provides a summary justification for Strategic Initiative s priority for the year 7. External Factors what External Factors or circumstances might impede accomplishment of the initiative in a timely or effective manner. 5 5
7 Management Plan FY 2016 Implementation Vital to successful implementation of the Management Plan: 1. Monthly meetings of the Leadership Team dedicated to discussion and evaluation of progress on the Management Plan and dealing with questions or challenges that may arise in execution. 2. Each Strategic Initiative in the Management Plan is assigned to a cross-cutting team that will take responsibility for the initiative (see Table 1 below). 3. Performance Indicators that enable tracking of progress on strategic actions and tasks to be measured and reported within the Leadership Team. 4. Directors will communicate the plan to staff to ensure that there is sufficient understanding of the Management Plan. Table 1: Leadership Team Responsibility on Strategic Initiatives (Team Lead indicated in bold) Strategic Initiative Operations Maintenance IPMO Marketing/ Planning Directors Finance Procurement Audit HR/ Safety Fuel Cost Reduction X X X X New Bus Technology X X X X X West Valley X X X X X X Connector Corridor SB Transit Center X X X X X September X X X Service Change Consistent Staffing Levels X X X X X Finally, as a mechanism for reporting progress to the Board, oversight by the CEO and Directors of the Management Plan will involve: Review monthly with Senior Leadership Team Implement corrective action where tasks are not achieved, or achieved on time Ensure that resources will be available when needed Make adjustments to Strategic Actions if needed to achieve Management Plan goals IT 6 6
8 Management Plan FY 2016 Strategic Initiative 1 - Fuel Cost Reduction Goal Statement Develop and implement a comprehensive fuel cost reduction plan. Supports SRTP Goals Maximize cost recovery while charging a fair fare. Support initiatives that are financially and environmentally sustainable in the short and long term. Outcomes 1. Reduced fuel budget Strategic Actions 1. Install pipeline gas fueling system at East Valley a. Feasibility Study b. Funding c. Procure Design/Build and Maintain contractor d. Construct e. Start Fueling 2. Continue phasing in of CNG Paratransit Vehicles a. Delivery of vehicles b. Enter into MOU for Fueling c. Repeated vehicle orders Performance Indicators 1. Reduced operational budget for fuel 2. Increased number of vehicles using CNG 3. Completed installation of the first of three pipeline gas facilities Rationale Fuel is a variable expense that necessitates a proactive fuel management approach. Agency operational costs will be reduced by reducing the cost of fuel through the use of alternative fuel sources. Additional operational cost-reduction opportunities will be realized by streamlining the fueling process. For Fixed Route by changing LNG fueling facilities to pipeline gas, the necessity to deliver LNG to each facility is eliminated; thus reducing costs to purchase fuel and costs associated with liability insurance risk for delivery of fuel. Table 2. Fixed Route Projected Cost Savings Fixed Route Projected Cost Savings Current Projected Cost of LNG for FY 2016 East Valley $3,477,825 Projected Cost of Pipeline CNG for FY2017 East Valley $2,477,825 Projected Cost Savings per year (Full potential/forecasted savings beginning FY2017) $1,000,
9 Management Plan FY 2016 For Paratransit by changing the Paratransit fleet from an unleaded fleet to a CNG fleet, the cost of fueling is reduced based on the differential in cost between unleaded fuel and CNG fuel Projected Annual Cost Savings of converting 13 paratransit vehicles from Unleaded to CNG (starting July 1, 2015): $22,500. External Factors CONSTRUCTION COSTS AND EQUIPMENT LEAD TIME Availability of equipment used for pipeline gas systems is limited. If Federal funds are used, Buy America requirements may also be a concern. EXTERNAL DEMAND Pipelines ability to support Omnitrans demand (i.e., size of line and potential gas outages ) could affect Omnitrans ability to fuel vehicles. RESPONDING TO COMMUNITY CONCERNS Community concerns with fueling operations. Leadership Team Members Directors of Finance (Lead), Maintenance, Procurement, Audit 8 8
10 Management Plan FY 2016 Strategic Initiative 2 - New Bus Technology Goal Statement Introduce New Bus Technology that will reduce operating costs. Supports SRTP Goals Support initiatives that are financially and environmentally sustainable in the short and long term. Maximize cost recovery while charging a fair fare. Outcomes 1. Lower operating costs (reduction in workers compensation and passenger liability) 2. Increase safety 3. Reduce fuel costs Strategic Actions 1. Secure funding Federal & State Grants (Zero Emissions, Prop 1B, 5310). 2. Develop contingency funding plan if zero emissions grant is not awarded. 3. Develop a Procurement Plan for design infrastructure & equipment, purchase & install equipment and provide training. Procurement Plan(s) are to include: 5 electric buses & charging stations audible turn signals expand Transit Signal Priority design vehicles 3-way restraints (Q-pods) rear facing wheelchair stations Performance Indicators 1. Short term: Reduced operating costs 2. Mid-term: Decreased maintenance costs; Reduced fuel costs; Reduced emissions 3. Long-term: Improved safety Rationale FISCALLY RESPONSIBLE New bus technology offers a wide range of benefits including significantly lower emissions, increased efficiency, and decreased maintenance. INCREASED SAFETY With advanced safety features and alternative fueled engines the new bus technology will provide increased safety to the public, riders, and Operators. MORE ENVIRONMENTALLY FRIENDLY Positive environmental impacts will be achieved by reducing greenhouse gases that contribute to global climate change, as well as local air pollutants, which lead to regional air pollution and smog. There is also the additional benefit of reducing personal exposure to harmful air pollutants. External Factors FUNDING Federal grants are part of the funding portfolio for the new bus technology and will require a local match. 9 9
11 Management Plan FY 2016 BOARD APPROVAL Additional parts/tooling are required for conversion to the new bus technology. Consequently, the Board may find benefit in remaining standardized with the CNG fleet. EQUIPMENT LEAD TIMES Electronic buses are made to order and are in high demand. INFRASTRUCTURE SUPPORT Widespread adoption of new bus technology is challenged with the critical tasks of mobility modeling and charging station deployment. Leadership Team Members Directors of Operations (Lead), Maintenance, Finance, Procurement, IT 10 10
12 Management Plan FY 2016 Strategic Initiative 3 - West Valley Connector Corridor Goal Statement Advance West Valley Connector Corridor design and pursue grant funding opportunities. Supports SRTP Goals Support the local economy by providing connections to where people want to go Enhance Omnitrans' network design to increase ridership and minimize costs by reducing redundancy Outcomes 1. Readiness for construction 2. Aligned funding Strategic Actions 1. Award contract for design Involve stakeholders 2. Prepare and submit grant proposals for Phases 2 and 3 Identify potential funding sources Obtain funding awards 3. Timely Board approvals for each project phase Performance Indicators 1. On time project deliverables 2. Manage budget prediction / adherence 3. Funding Dedicated Lanes Phase 2 60 foot vehicles Phase 3 Rationale The goal of the West Valley Connector Corridor project is to provide faster, more frequent, and more direct bus service to connect major destinations throughout the western part of the San Bernardino Valley, as well as providing enhanced amenities for passengers. This project is part of a system of ten planned bus rapid transit (BRT) corridors, including the sbx Green Line in San Bernardino and Loma Linda that began operation in April Omnitrans BRT system will help to alleviate traffic congestion long-term by providing highquality, faster premium bus service that will attract new riders to Omnitrans system. External factors INVESTIGATION Further study is required regarding alternative routing, particularly how best to serve Rancho Cucamonga (Haven or Milliken), and finalize corridor routing alignment and station locations; Public and stakeholder input are needed to achieve support. FUNDING is available to construct a rapid line with enhanced stations operating in mixed flow traffic. However, funding for 3.5 miles of dedicated lanes (Phase 2) and 60-foot articulated buses (Phase 3) has not been identified yet. A financing and phasing plan must be developed for project
13 Management Plan FY 2016 GOVERNANCE Timely design and route decisions are dependent on Board approvals. The Agency is committed to providing appropriate resources that will assist the Board in its decisionmaking process. Leadership Team Members Directors of Marketing/Planning (Lead), IPMO, Procurement, Finance, IT, Audit 12 12
14 Management Plan FY 2016 Strategic Initiative 4 - San Bernardino Transit Center Goal Statement Commence bus operations at the San Bernardino Transit Center. Supports SRTP Goals Expand, maintain and improve existing vehicles, facilities, and passenger amenities Deliver safe, reliable, clean, frequent, convenient, comfortable and equitable service Outcomes 1. Increase ridership 2. Increase connectivity (local, express lines, rail, neighboring transit) 3. Increase customer satisfaction Strategic Actions 1. Complete facility 2. Realign service 3. Complete service contracts/contracts not covered by SANBAG 4. Ensure facility is safe and secure for customers Performance Indicators 1. Ridership (on all connecting routes) 2. Overall customer satisfaction levels 3. Timely deliverables 4. Safety record Rationale Commencement of bus operations will help make transit more attractive to new riders and help retain existing riders. When the rail line is extended in future years, we will see additional benefits. Omnitrans is committed to ensuring that it is prepared to commence operations at the SBTC in a manner that provides safe, on-time performance, is customer-oriented and improves ridership. External Factors EFFECTIVE COLLABORATION Potential delays on out of scope projects and other unexpected issues affecting completion will require Omnitrans to be a responsive and helpful collaborative partner. Leadership Team Members Directors of Operations (Lead), Marketing/Planning, IT, HR/Safety, Maintenance 13 13
15 Management Plan FY 2016 Strategic Initiative 5 - September Service Change Goal Statement Implement September Service Changes as outlined in the SRTP, to streamline service, improve efficiencies and attract new customers. Supports SRTP Goals Enhance Omnitrans' network design to increase ridership and minimize costs by reducing redundancy Deliver safe, reliable, clean, frequent, convenient, comfortable and equitable service Expand, maintain and improve existing vehicles, facilities and passenger amenities Outcomes 1. Increase ridership 2. Increase mobility and connectivity 3. Reduce redundancies (equipment) 4. Increase productivity Strategic Actions 1. Implement Marketing Campaign a. Communicate changes to customers b. Raise awareness of general public 2. Route Realignment a. Bidding process for operators b. Scheduling c. Route tracing 3. Move Bus Stop Signs 4. Revise Schedules & Schedule Books 5. Bid Runs 6. Route Familiarization training, rest areas, end of lines, etc. Performance Indicators 1. Increase ridership 2. Reduce travel time 3. Increase fare box recovery 4. Increase customer satisfaction Rationale SERVICE CHANGES are in response to customer and stakeholder requests, coach operator suggestions, and completion of the San Bernardino Transit Center. This will deliver improved operational efficiency, streamlined service for customers and enhanced multimodal connectivity, as well as a central location for connecting to other transportation agencies (i.e. Mountain Transit, VVTA). External Factors RESPONSE TO CHANGE With any major service change, there is a period of adaptation by customers. Additional adjustments may be necessary
16 Management Plan FY 2016 OPERATOR PREPAREDNESS Ensuring that operators are ready for newly designated route stop locations for connections. Leadership Team Members Directors of Marketing/Planning (Lead), Operations, IT 15 15
17 Management Plan FY 2016 Strategic Initiative 6 - Consistent Staffing Levels Goal Statement Maintain consistency of staffing levels throughout the Agency Supports SRTP Goals Deliver safe, reliable, clean, frequent, convenient, comfortable, and equitable service Expand, maintain, and improve existing vehicles, facilities, and passenger amenities Outcomes 1. Minimize staff vacancies 2. Improved service quality and reliability 3. Increased customer satisfaction Strategic Actions 1. HR to provide staff for all union classifications and levels 7-9 non-represented administrative/clerical positions a. Advertisements b. Interviews c. Testing d. Placement 2. Procure temporary agency agreement for skilled positions a. Prepare procurement b. Select firm c. Award d. Execute agreement 3. Develop internal staff for advancement 4. Negotiate mutually beneficial language with Unions to reduce absenteeism Performance Indicators 1. Reduction in lost service 2. Reduced overtime 3. Reduced average time to hire Rationale Absenteeism, employee turnover, vacancies, and need for expansion affect the level of service and reliability of service. Having the ability to rapidly staff vacant positions, including temporary staff, provides a tool to prevent loss of revenue service. It is expected that the average time to hire could be reduced by as much as six weeks. External Factors UNSCHEDULED OCCURRENCES Workers Compensation, FMLA, Kin Care, Unscheduled Absences. POSITION REQUIREMENTS AND WORKFORCE AVAILABILITY The availability of the personnel with the skills required for a position have an impact on the ability to staff vacant positions. Leadership Team Members Directors of HR/Safety (Lead), Operations, Maintenance, Procurement, Audit 16 16
18 MANAGEMENT PLAN P. SCOTT GRAHAM CEO/GENERAL MANAGER MAY 6,
19 Management Plan Briefing Highlights 1. Management Plan defines the initiatives for Omnitrans in 2016; to that end, strategic priorities were developed for the Board s approval. 2. It is aligned with Omnitrans SRTP, the CEO s goals and SANBAG s SRTP; as well as the Federal and State requirements for performance based planning. 3. The Leadership Team participated in a structured, collaborative process to develop the Management Plan. 4. The Management Plan allows the Leadership Team to address strategic priorities and translate strategy into results. 5. It facilitates accountability and communication with consistent and significant reporting on progress. 18
20 Management Plan Performance Based Planning Fiscal Year 2016 Plan is built so results can be measured and reported compared to prior plan 2014 Management Plan Explore information technology system (ITS) solutions to manage operations 2016 Management Plan Introduce New Bus Technology that will reduce operating costs 19
21 Goal for Strategic Initiative What SRTP Goal it supports Team-Accountability/Cross Departmental Collaboration Outcomes What will be accomplished in FY 2016? What will be improved or changed? Strategic Actions What tasks or actions are needed to accomplish outcomes for 2016 Translates leadership insights into actionable solutions Prioritizes the order in which a Strategic Initiative should be developed and/or launched Performance Indicators Demonstrates progress on initiatives Shapes the conversation about accomplishments on a strategic initiative Rationale Justification External Factors Justification External Factors 20
22 Management Plan Development of Management Plan Full participation of the Leadership Team from beginning to end. Strategic Initiatives were built around the CEO s goals for FY Outcomes, Strategic Actions, Performance Indicators, Rationale, and External Factors developed by the Leadership Team in a collaborative process. Structured process that ensured alignment with Omnitrans SRTP and SANBAG s SRTP. 21
23 Management Plan Goals for Strategic Initiatives Strategic Initiative 1: Develop and implement a comprehensive fuel cost reduction plan. Strategic Initiative 2: Introduce new bus technology that will reduce operating costs. Strategic Initiative 3: Advance West Valley Connector Corridor design and pursue grant funding opportunities. Strategic Initiative 4: Commence bus operations at the public the San Bernardino Transit Center. Strategic Initiative 5: Implement September service changes as outlined in the SRTP, to streamline service, improve efficiencies and attract new customers. Strategic Initiative 6: Maintain consistent staffing levels throughout the Agency. 22
24 Omnitrans Management Plan Linkages to SRTP Plans Management Plan FY 2016 Develop and implement a comprehensive Fuel Cost Reduction Plan. Introduce New Bus Technology that will reduce operating costs. Advance West Valley Connector Corridor design and pursue grant funding opportunities. Commence bus operations at the San Bernardino Transit Center. Implement September Service Changes as outlined in the SRTP, to streamline service, improve efficiencies and attract new customers. Maintain Consistent Staffing Levels throughout the Agency Omnitrans SRTP FY Support initiatives that are financially and environmentally sustainable in the short and long term. Minimize impact to existing riders while seeking opportunities to expand ridership. Maximize cost recovery while charging a fair fare. Support the local economy by providing connections to where people want to go. Enhance Omnitrans network design to increase ridership and minimize costs by reducing redundancy. Expand, maintain and improve existing vehicles, facilities and passenger amenities. Deliver safe, reliable, clean, frequent, convenient, comfortable and equitable service. SANBAG s SRTP FY Network Connectivity Coordinate and integrate the transit services of the various transit operators throughout the County Inter-Regional Transit Travel Facilitate interregional transit travel between regions of the County as well as between San Bernardino County and other counties. Access for All Seek cost-effective accessibility programs to improve mobility for seniors and persons with disabilities. Commuter Rail Service Support continued development and enhancement of commuter rail service in San Bernardino County. Key Projects Implement projects that will support the SRTP s goals, including: carpool/ vanpool services; downtown SB Passenger Rail Project; SB Transit Center; Redlands Passenger Rail Project. 23
25 Management Plan Accountability/Communication/Implementation 1. Monthly meetings of the Leadership Team to implement corrective action and make adjustments to Strategic Actions, if needed 2. Each Strategic Initiative in the Management Plan is assigned to a cross-cutting team that will take responsibility for the initiative. 3. Performance Indicators that enable tracking of progress on strategic actions and tasks to be measured and reported within the Leadership Team. 4. Directors will communicate the plan to staff to ensure that there is sufficient understanding of the Management Plan. 5. A quarterly progress report will be made to the Board of Directors. 24
26 Management Plan Thank You! Any Questions? 25
27 Supplemental Information Item #F4 SERVICE PLAN Fiscal Year May 6, 2015
28 FY2016 Service Plan (This Page Intentionally Left Blank) i Page
29 FY2016 Service Plan TABLE OF CONTENTS Table of Contents... ii List of Exhibits... iii 1. Introduction Ridership Trends September 2015 Fare Increase Fuel Price Declines Lost Service Hours sbx Ridership Conclusion Summary of Proposed Service Changes West Valley North-South Routing Improvements San Bernardino Transit Center Routing Route Route Route Route I-10 Freeway Express Route Minor Access Service Area Map Changes Access Eligibility Application Process Proposed FY2016 Service Systemwide Service Fixed Route Directly Operated Service Fixed Route Purchased Transportation Service sbx Service Access Service ADA Paratransit Service Fare Structure Summary of Public Input Title VI Service Equity Analysis ii Page
30 FY2016 Service Plan LIST OF EXHIBITS Exhibit 1: Omnitrans Family of Service Offerings... 2 Exhibit 2: Omnitrans Systemwide Ridership by Month (FY2013, FY2014 and FY2015)... 4 Exhibit 3: Omnitrans Systemwide Ridership by Mode Fiscal Year 1993 to Exhibit 4: Omnitrans Fixed Route Ridership Compared to Avg. Fuel Prices... 6 Exhibit 5: Omnitrans Monthly Revenue Hours of Lost Service... 7 Exhibit 6: Average Weekday sbx Ridership by Week and Total sbx Ridership since Inception. 7 Exhibit 7: Split of E Street Corridor Ridership by Route 2 and sbx Projected and Actual... 8 Exhibit 8: Average Weekday Boarding Map on E Street Corridor: sbx and Route Exhibit 9: Proposed West Valley Routing (September 2015, FY2016) Exhibit 10: Summary of Proposed West Valley Routing Changes Exhibit 11: Proposed Routing for Downtown San Bernardino Exhibit 12: Proposed Route 1 Map Exhibit 13: Proposed Route 8 Map Exhibit 14: Proposed Route 15 Map Exhibit 15: Proposed Routing for Downtown San Bernardino Exhibit 16: OmniConnects Freeway Express Route Network Exhibit 17: Proposed Freeway Express Route Exhibit 18: Proposed Access Map, September 2015 (FY2016) Exhibit 19: Proposed Access Eligibility Process: Current & Proposed for July 2015 (FY2016). 23 Exhibit 20: Systemwide Service Characteristics Summary Exhibit 21: Fixed Route Directly Operated Service Characteristics Summary Exhibit 22: Fixed Route Purchased Transportation Service Characteristics Summary Exhibit 23: sbx Service Characteristics Summary Exhibit 24: Access Service Characteristics Summary Exhibit 25: Fixed Route Fares Exhibit 26: Access Fares Exhibit 27: Public Hearings and Input Sessions Exhibit 28: Public Comments by Type Exhibit 29: Minority and Low Income Share in Omnitrans Service Area, Sub Regions and San Bernardino County iii P age
31 FY2016 Service Plan 1. INTRODUCTION This report provides an overview of Omnitrans service offerings and fare policy for Fiscal Year 2016 (FY2016). Section 1 is this introduction. Section 2 examines Omnitrans ridership trends. Section 3 provides a detailed description of proposed service changes for FY2016. Section 4 details the service levels for each service in Omnitrans family of services. Section 5 presents Omnitrans fare structure. Sections 6 and 7 describe the outcome of Omnitrans public input sessions and a summary of the required Title VI service equity analysis, respectively. The FY2016 Service Plan is the Phase II implementation of Omnitrans OmniConnects FY Short Range Transit Plan (SRTP). OmniConnects was approved by the Omnitrans Board of Directors in May OmniConnects prescribed two years of service changes. Phase I was implemented in September 2014 and included a fare increase and service changes focused in the East Valley of Omnitrans service area. Phase II was planned for FY2016 and this document moves the planned Phase II of the OmniConnects SRTP into the implementation pipeline. Omnitrans has utilized lessons learned from the Phase I implementation to slightly modify Phase II. These changes are generally descriptive changes such as modifying route numbers compared to the original plan rather than substantive routing changes. The FY2016 Service Plan maintains Omnitrans existing family of service. The family of services can be seen in Exhibit 1. The family of services includes bus rapid transit (BRT) called sbx, local and express service branded as Omnitrans, community circulators known as OmniGo and Americans with Disabilities Act (ADA) paratransit service operated as Access. While the family of services is proposed to remain constant in FY2016, there are many proposed changes to the routes that make up the local and express services. Currently, Omnitrans operates 32 fixed routes. During FY2016, Omnitrans proposes to modify 18 of these routes, or 56% of the individual route maps. FY2016 proposed service changes include: 1) OmniConnects implementation of West Valley north-south route improvements; 2) Routing changes for the opening of the San Bernardino Transit Center; 3) Introduction of a weekday, peak-hour, freeway express route on Interstate 10 that connects Downtown San Bernardino, Arrowhead Regional Medical Center, Ontario Mills and the Montclair Transit Center; 4) Minor modifications to the Access service area in order to maintain compliance with ADA paratransit regulations; and, 5) Shift in the application process for Access service that would have applicants complete a medical verification prior to delivering a completed application in person to Omnitrans. Omnitrans proposes to maintain the existing fare policy into FY2016. Omnitrans recently raised fares in September 2014 (FY2015). The full impact of this fare increase is still being felt. As 1 Page 1
 utilizing dedicated BRT buses.")

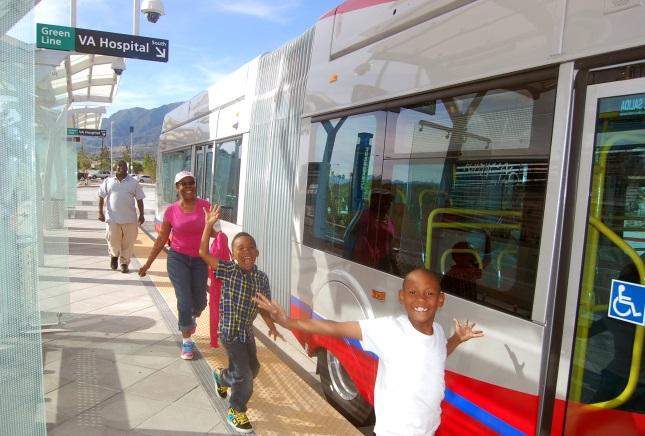
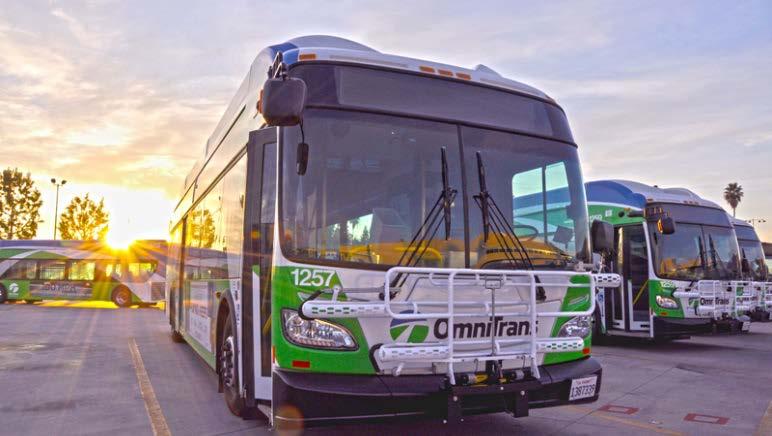
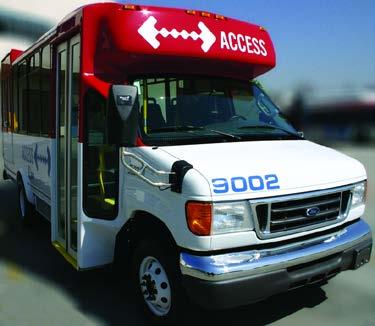
32 FY2016 Service Plan planned within OmniConnects and because Omnitrans general public farebox recovery remains Exhibit 1: Omnitrans Family of Service Offerings Service Type Brand Image Description Bus sbx BRT service mirrors light-rail service with Rapid dedicated amenities, stations and Transit significantly reduced travel times while (BRT) utilizing dedicated BRT buses. sbx utilizes standalone stations with level boarding, prepaid fares, dedicated lanes, signal prioritization, and limited stop spacing to achieve faster service. Fixed Route Local Omnitrans Traditional large bus service operating on a set route with a set schedule at defined frequencies. Routes travel in mixed flow traffic with stops placed approximately every 0.2 miles. Express Omnitrans Freeway bus service using a traditional large bus on a set route with a set schedule and frequency that is designed to connect two or more areas of highly concentrated activity. Route(s) typically travel mostly by freeway and stops are placed several miles apart. Community Circulator OmniGo Smaller bus service designed to offer lifeline mobility for areas with relatively low population and employment density. OmniGo provides service to key locations within Grand Terrace, Chino Hills and Yucaipa. The service operates in mixed flow traffic with frequent stop placement. Demand Response ADA Paratransit Access Curb-to-curb service provided to comply with the Americans with Disabilities Act (ADA) that is complementary to fixed-route service, and is provided within ¾-mile of a fixed route. Beyond-the-boundary Access service extends Access past the ¾-mile fixed route boundary to the edge of each JPA member city, for a nominal fee. above target at 23.3% through February 2015, Omnitrans does not plan to increase fares during the coming year. In bringing the FY2016 Service Plan forward for implementation, Omnitrans completed a round of 12 public hearings reaching over 360 individuals. Most of the individuals that participated found the proposals to be an improvement in Omnitrans service offering. Additionally, Omnitrans completed a Title VI Service Equity analysis as required by the FTA for a major 2 Page 2
33 FY2016 Service Plan service change. The result of this analysis shows that the proposed service changes comply with Title VI Requirements of the Civil Rights Act of Page 3

34 FY2016 Service Plan 2. RIDERSHIP TRENDS Omnitrans systemwide ridership levels were impacted by multiple factors during FY2015. The result is systemwide FY2015 year-to-date ridership through February was down 6.8% having carried 9.8 million passengers over the previous eight months, compared to 10.5 million riders during the same period the year before. Each of Omnitrans primary transit modes saw decreases with fixed route services down 6.8% and demand response services down 4.9%. Omnitrans Systemwide monthly ridership trends are shown in Exhibit 2. The monthly data shows that the ridership declines this fiscal year have been fairly consistent. 1,800,000 1,600,000 1,400,000 1,200,000 1,000, , , , ,000 - Exhibit 2: Omnitrans Systemwide Ridership by Month (FY2013, FY2014 and FY2015) FY13 FY14 FY15 Thousands 12,000 10,000 8,000 6,000 4,000 2,000 - Jul Aug Sep Oct Nov Dec Jan Feb Mar Apr May Jun YTD Total Historic annualized ridership data can be seen in Exhibit 3. This data shows that Omnitrans is experiencing the second consecutive year of ridership decline which was preceded by a few years of growth. This pattern appears similar to the early to mid-2000s which saw initial ridership declines followed by a multi-year plateau. Exhibit 3: Omnitrans Systemwide Ridership by Mode Fiscal Year 1993 to 2015 Following the path put forth in the OmniConnects FY Short-Range Transit Plan which was approved in May 2014, Omnitrans has many proposed service changes designed to help 4 Page 4
35 FY2016 Service Plan reverse this trend. These are outlined in Section 3 of this report and include: the streamlining of West Valley north-south routes to make them easier to understand for new riders while also improving travel times; the introduction of Route 290 freeway express service on Interstate 10 between San Bernardino and Montclair; and, improved transfer facilities with the opening of the San Bernardino Transit Center. While Omnitrans recognizes the two year declining ridership trends, the agency is working diligently to reverse this trend. In order to reverse the trend, it is important to understand the key drivers of this trend. Omnitrans has identified three key drivers for the ridership decline in FY2015. These are: 1) September 2015 fare increase; 2) Fuel price declines; and, 3) Lost service hours typically related to absenteeism. Additionally, Omnitrans was anticipating a large surge in ridership during FY2015 with the first full-year operation of sbx. While ridership on the E Street Corridor is 988,643 boardings, up 12.1% year-to-date through March compared with ridership on the corridor a year ago, the overall impact on the system was less than anticipated thus far. 2.1 SEPTEMBER 2015 FARE INCREASE The largest impact of ridership declines during FY2015 was the fare increase implemented in September For the first time in five years, Omnitrans raised passenger fares in order to meet budgetary constraints without reducing service. Omnitrans base fare increased from $1.50 to $1.75, and increase of 16.7%. Based on industry standard fare elasticity, this fare increase on its own would generate a 6% decline in ridership during the first year of the increase. Year-todate ridership through February was down 6.8%. The goal of the fare increase was not to decrease ridership, but to increase revenue. In that way, the fare increase has been successful. Systemwide fare revenue year-to-date through March is $11.5 million, up $500,000 or 4.2% compared to the $11.0 million for the same period a year ago. This revenue was generated in a six month period since the fare increase was put in place in September, two months into the fiscal year. 2.2 FUEL PRICE DECLINES Transit ridership, like nearly all goods, is impacted by price changes of substitute goods. In this case, if the price of fuel drops, it becomes less expensive to drive and it also becomes easier for single car families to utilize that car for multiple trips rather than having a dedicated driver and other family members ride transit. Over the first six months of FY2015, the price of a gallon of unleaded gasoline dropped by 38%. Since the fuel price high in October 2012, fuel prices dropped by 44%. Typically small changes in fuel prices have minimal impacts on bus transit ridership. However, these were not small changes. Exhibit 4 shows two views of the relationship between fuel prices and Omnitrans bus ridership. The first focuses on monthly variation in ridership and fuel prices. It is evident that as fuel prices 5 Page 5


36 FY2016 Service Plan plummeted in late calendar year 2014, Omnitrans ridership began to fall significantly as well. This data also shows a time lag of about three months before a change in the price of fuel and its impact on ridership, which is in line with industry and academic research. The second view in Exhibit 4 does not look at the monthly fluctuations, but the broader impact of fuel prices and ridership by showing the 12-month moving average of both. This data shows that the overall trend in fuel and ridership are highly correlated. Looking at fuel price highs, fuel prices peaked in October 2012, which corresponded with Omnitrans highest ridership period in the agency s 38-year history. As fuel prices slowly retreated, so did ridership. Exhibit 4: Omnitrans Fixed Route Ridership Compared to Avg. Fuel Prices Looking specifically at the impact fuel prices had on ridership during FY2015, the 38% decline in fuel prices during the first six months of the year would typically generate a 5% decline in ridership that would not have been anticipated at the beginning of the year. This is calculated using a fuel-price elasticity on transit ridership of , which implies a 10% increase in fuel prices would cause a 1.3% increase in transit ridership over time. 2.3 LOST SERVICE HOURS Omnitrans riders depend on reliable, on-time transportation in order to use transit for trips important to their daily activates. Omnitrans has a long history of delivering reliable, on-time service that meets or exceeds peer group averages. However, during FY2015, Omnitrans did experience an increase in lost revenue hours of service, which means scheduled bus service that was not delivered typically either because of mechanical difficulties or lack of operating personnel. During FY2015 year-to-date through March, Omnitrans has dropped 2,634 revenue hours of service, 122.5% higher than the same period last year. 74.5% of lost hours during the year were attributed to a lack of personnel. Nineteen months of monthly data is shown in Exhibit 5 and there is a clear spike in lost hours starting in July Omnitrans management identified this trend early, and worked to increase part-time operator positions along with other measures in order to handle the ebb and flow of 1 Source: Effects of Rising Gas Prices on Bus Ridership for Small Urban and Rural Transit Systems, Jeremy Mattson, Small Urban and Rural Transit Center, Upper Great Plains Transportation Institute, June Page 6

37 FY2016 Service Plan attendance. This helped bring down the spike by 62% from a high of 436 hours in one month to 165 hours during the most recently completed month. Exhibit 5: Omnitrans Monthly Revenue Hours of Lost Service While Exhibit 5 does show the spike in lost hours, the total lost hours for the year represent only approximately 0.5% of scheduled service. Ultimately, this implies that 0.5% of ridership was impacted by lost service. The bigger impact of this is on perceived reliability of Omnitrans system and maintaining the trust that Omnitrans riders have in the system. Omnitrans is participating in an annual survey currently, which will measure if the perception of reliability has changed. Regardless, Omnitrans is committed to continual improvement in this area, which has already been demonstrated by the reduction in lost hours since its early-year peak. 2.4 SBX RIDERSHIP Ridership on sbx totaled 461,649 during its first 46 weeks of service. This puts the route on pace to deliver over 500,000 trips during its first full year. As shown in Exhibit 6, average weekday ridership has grown since the early weeks, more than doubling from May through October. Exhibit 6: Average Weekday sbx Ridership by Week and Total sbx Ridership since Inception. 7 Page 7


38 FY2016 Service Plan Exhibit 7: Split of E Street Corridor Ridership by Route 2 and sbx Projected and Actual Exhibit 8: Average Weekday Boarding Map on E Street Corridor: sbx and Route 2 8 Page 8

39 FY2016 Service Plan Exhibit 7 and Exhibit 8 show the split of ridership on the E Street Corridor between sbx and Route 2 and a map of the boarding locations. One large factor impacting sbx ridership during FY2015 was the delay in the completion of the San Bernardino Transit Center compared to early sbx plans. This delay resulted in maintaining the current transfer area in Downtown San Bernardino, which is about a 0.4 mile walk from the closest sbx station. As a result of this walk, a higher share of riders (48%) stayed on Route 2, compared to the expected 20% remaining on Route 2. A look at the boarding map shows that many of the boarding hot spots on Route 2 are within a quarter-mile walk of a sbx station. As described in Section 3 of this report, when the San Bernardino Transit Center opens the transfer walking distance will be removed. The opening of the transit center along with the reduced walk times has provided the necessary conditions to reduce frequency on Route 2 to 60 minutes compared to 30 minutes today. This will aide with the natural transition to sbx from Route 2 and is in line with the planned frequencies for local routes for any new proposed Omnitrans sbx BRT line. 2.5 CONCLUSION While there are many dynamics impacting ridership during FY2015, Omnitrans has a path forward with the OmniConnects FY Short Range Transit Plan. Phase I of this plan was implemented in September 2014 along with the fare increase. The Phase II Implementation is described in section 3 below. 9 Page 9
40 FY2016 Service Plan In looking at a few of the changes that were implemented during the last year, two of the three routes with major changes stand out as success. Omnitrans modified to Route 8 to create a short and long route that connect Crafton Hills College and Downtown San Bernardino with service primarily on Redlands Blvd. Ridership on this route since the service change is up 12.4%, carrying 268,486 riders compared to 238,967 riders over the same period a year ago. Similarly, Route 19 which was extended to Yucaipa and provides a one-seat ride between Yucaipa and Fontana with service to Redlands, Loma Linda, Colton, and Rialto has seen an increase of 17.6% carrying 480,517 riders since the service change compared to 408,524 over the same period a year ago. Not all of the changes generated an immediate positive ridership response. Omnitrans also changed Route 5 to provide direct service on Waterman Avenue rather than service to Downtown San Bernardino. This route saw a decrease in ridership of 14.8% to 281,515 riders since this service change from 330,397 riders for the same period a year ago. This route has begun to see some reductions in the loss as riders have begun to figure out how to use it. Omnitrans did learn an important lesson from this route change, which was when the routes undergo significant alignment changes, the route should be renumbered. This lesson learned was applied to the proposed Phase II implementation with the route renumbering of north-south routes for West Valley. Overall, East Valley also saw an increase in on-time performance following the Phase I implementation. East Valley on-time performance has grown to 86.6% since the service change, up from 85.4% for the same period a year ago. While ridership has declined in FY2015, many lessons were learned and several successes were created by the implementation of Phase I changes in OmniConnects. The proposals in the next section build upon these successes to move Omnitrans back on a ridership growth trajectory. 10 Page 10
41 FY2016 Service Plan 3. SUMMARY OF PROPOSED SERVICE CHANGES Omnitrans proposed service offerings in FY2016 are based on the OmniConnects FY Short Range Transit Plan (SRTP) that was adopted by the Board of Directors in May The changes are proposed for September 2015 (FY2016) and are the second phase implementation of the OmniConnects plan. Minor changes to the plan were developed in light of lessons learned from the first phase implementation in East Valley and based on public feedback. Omnitrans proposes service changes in four key service areas: 1. West Valley North-South Routing Improvements; 2. San Bernardino Transit Center Routing; 3. Interstate 10 (I-10) Freeway Express Route; 4. Minor ADA Service Area Map Changes; and 5. Access Eligibility Application Process. In total, 18 of Omnitrans 32 routes (56%) have a proposed change. The details of these changes can be found in the following four subsections of this report. The primary goals of the proposed service changes are in line with the high level goals of OmniConnects which were to: 1) Enhance Omnitrans Network Design to increase ridership and minimize costs by reducing redundancy; and, 2) Minimize impact to existing riders while seeking opportunities to expand ridership. More specifically the goals of the proposed changes for the second phase implementation of OmniConnects were to: Streamline local routes to improve travel times; Improve directness of travel; Make the system easier to understand for new or potential riders; Reduce areas of service duplication; and, Build upon the success of Omnitrans and neighboring agency s freeway express routes. The proposed changes continue to help push Omnitrans to the 65% productivity-oriented and 35% coverage-oriented service splits that the Board reaffirmed in the OmniConnects plan. In total, the proposed service changes for FY2016 are a cost neutral restructuring of service with the exception of the proposed freeway express route. The freeway express route funding comes from two sources: 1) Ongoing annual savings that was realized during the FY2015 service changes and 2) $54,000 in Cap-and-Trade funding from the Low-Carbon Transit Operator Program (LCTOP). 3.1 WEST VALLEY NORTH-SOUTH ROUTING IMPROVEMENTS Omnitrans service proposal for West Valley is designed to take advantage of the productivity and high frequency service along the two major east-west bus corridors with Route 61 on Holt Boulevard and Route 66 on Foothill Boulevard. Currently, many of Omnitrans north-south routes have significant sections also running east-west. This creates a travel patterns that does not mimic how people travel on their own by car, bike or as pedestrians and it also duplicates the east-west trunk routes. By straightening and streamlining north-south travel, Omnitrans can build better transfers onto the east-west trunks while also improving travel times north-south. 11 Page 11

42 FY2016 Service Plan Ultimately, this should be an improvement to our riders while also focusing key east-west travel along already existing high-productivity corridors. Proposed West Valley Routing can be seen in Exhibit 9 below and a list of changes can be found in Exhibit 10. One of the primary changes to the routing compared to the OmniConnects plan is a change to the numbering patterns of the routes. Based on feedback we got from the service changes implemented in East Valley, the proposed routing number convention creates a grid of numbers where 60 series routes like 61, 66 and 67 generally travel east-west. 80 series routes generally travel north-south such as the 81, 82, 83, 84, 85, 86, and 88. The numbering change should allow customers to more easily identify that there was a change and also make it easier for new riders to understand the route. Exhibit 9: Proposed West Valley Routing (September 2015, FY2016) Two changes are indicative of the types of changes that are being proposed. The proposed Route 84 travels north and south on Mountain Avenue from as far south as Chino Avenue in Chino and as far north as 19 th St. in Upland. Currently, someone trying to travel for any reasonable distance on Mountain Avenue would be required to make a transfer and most trips require two transfers for a total of three routes. The new proposed service on Route 84 simplifies and expedites travel on Mountain Avenue with a one-seat ride. Similarly, travel north and south on Haven Avenue between Riverside Drive and Chaffey College now requires with three routes and two transfers. Proposed Route 81 simplifies travel with one route being the dedicated service on Haven, again creating a longer distance one-seat ride. Similar changes can be found that simplify and straighten routes on Milliken Avenue and Campus Avenue. 12 Page 12
43 Exhibit 10: Summary of Proposed West Valley Routing Changes Route Change Map 61 No Change 63 Replaced; Service area transferred to Routes 84 and Replaced; Service area transferred to Routes 85 and No Change. 67 Develop one-seat ride from Fontana to Chaffey College. Transfer service on Mountain Avenue to new Route 84 FY2016 Service Plan 68 Replaced; Service area transferred to Routes 85 and Route changed to focus on connection between Ontario and Chaffey College. Connection between Holt and Montclair Transit Center can be accomplished on Routes 85 or 88. Service on Mountain can be accomplished on Route Page 13

44 Route Change Map 81 Route now focuses on travel on Haven Avenue and Riverside Drive. The meandering portions of this route on Milliken and Vineyard have been transferred to Routes 85, 82 and 86. FY2016 Service Plan 82 Western leg of this route travels north-south on Milliken instead of Haven with an end of line at Victoria Gardens. 83 The southern leg of this route is extended to Eucalyptus to serve the College Park area which was built with many transit amenities including bus turnouts, benches and shelters. 14 Page 14
45 Route Change Map 84 This is a new route that travels north-south on Mountain Avenue that replaces parts of the previous Routes 63, 67, and 80. FY2016 Service Plan 85 Routes 85 & 88 trade off sections of the previous Routes 65 and 68. The goal was to match highest demand with highest frequency. The primary result of this change is that the frequency along Central will increase to 30 minutes from 60 minutes and the frequency along Ramona Ave. will decline from 60 minutes to 30 minutes. 86 This route is a new route that combines north-south travel from the previous Routes 63 and 81. The result is a route from Ontario to Upland primarily along Campus Avenue. 15 Page 15
46 Route Change Map 88 Routes 85 & 88 trade off section of the previous routes 65 and 68. The goal was to match highest demand with highest frequency. The primary result of this change is that the frequency along Central will increase to 30 minutes from 60 minutes and the frequency along Ramona Ave. will decline from 60 minutes to 30 minutes. FY2016 Service Plan 3.2 SAN BERNARDINO TRANSIT CENTER ROUTING Omnitrans is excited to open the San Bernardino Transit Center (SBTC) in September 2015 (FY2016). For the first time, Omnitrans customers will enjoy one centralized location for connection on several of Omnitrans busiest routes. In addition to 11 Omnitrans local routes and sbx, the SBTC will also provide connections to Mountain Transit s off the hill services and Victor Valley Transit Authority s BV Link. The 22-bay SBTC will have a customer service desk where passes can be purchased, restroom facilities, on-site security, green space and public art. Since the SBTC is 0.7 miles away from Omnitrans current Downtown San Bernardino transfer hub at 4 th Street and F Street, each of Omnitrans routes serving downtown needed to be modified. To develop the modifications, Omnitrans developed a series of goals to guide the rerouting process: Maximize customer convenience; Implement changes such that they are operational cost neutral; Maintain service to key locations in downtown San Bernardino; Maintain a grid routing plan to minimize duplication; Improve reliability and on-time performance; and, Encourage transit center use and avoid creating unofficial transfer zones. Using the above goals as guiding principle for the rerouting, the vast majority of routes could simply be realigned with minimal disruption of existing service. The proposed routing for downtown San Bernardino can be seen in Exhibit 11. Routes 3, 4, 5, 7, 10, 11, 14, 215 and sbx have minimal changes. Routes 1, 2, 8 and 15 have significant changes, which are described in detail in the following subsections. 16 Page 16

47 Exhibit 11: Proposed Routing for Downtown San Bernardino FY2016 Service Plan Route 1 Exhibit 12: Proposed Route 1 Map There are three specific changes proposed to Route 1. The first proposal is to improve service frequency on the northern end of the route to 15 minute service, instead of the 30 minute service that exists today. Route 1 has become Omnitrans most productive route with over 36.7 passengers per hour and a farebox recovery ratio over 32%. Currently the route is split with 15 minute frequency on the southern end and 30 minute frequency on the northern end. The fastest-growing portion of this route is the less frequent north end, which now 17 Page 17
48 accounts for over 40% of boarding despite being less than 30% of service. FY2016 Service Plan The second Route 1 proposal is to extend the route s northeastern terminus from Lynwood Drive and Sterling Avenue to Lynwood Drive and Victoria Avenue. This change brings Route 1 to just outside of San Manuel Indian Bingo and Casino. Currently, Omnitrans closest stop to San Manuel is about 1.1 miles away. The proposed alignment will reduce that to less than 0.3 miles as Omnitrans service would be just beyond the southern parking lot. Service to this location has been one of the most frequent public requests that Omnitrans has received over at least the last five years. The final Route 1 proposal is for service to remain on Second Street between Mt. Vernon and E Street instead of the current path on 3 rd Street. This moves the closest stop to the Santa Fe Depot Metrolink Station from about 350 feet west of the intersection of 3 rd Street and Metrolink Way to about 400 feet south of the same intersection at 2 nd and Metrolink Way. The purpose for this proposed change near the Santa Fe Depot is the construction associated with the Downtown San Bernardino Passenger Rail Project which will put a cul-d-sac near 3 rd and J Street reducing the opportunity for an efficient straight-line path to the Metrolink station. While the walking distance between the current closest and proposed closest stop is less than 50 feet different from the main platforms, the stop will not be as visible from the station. This will selfcorrect when the rail project is completed and Metrolink is extended to the SBTC. In total, the changes to Route 1 are operating cost neutral when combined with the proposed changes on Route Route 2 Omnitrans proposes no significant map changes to Route 2, but a significant reduction in service frequency from 30 minute weekday service to 60 minute weekday service. Route 2 is the local route that shares the sbx Greenline corridor. It was originally estimated that 80% of riders on the corridor would be on sbx and the remaining 20% would be on Route 2. During the last year, the achieved split of service has hovered at 50% on sbx and 50% on Route 2. One of the primary reasons why riders have indicated that they are remaining on Route 2 is the current 0.4 mile transfer walk between sbx and Omnitrans other downtown services. This walk will effectively be eliminated with the opening of the San Bernardino Transit Center and the adjacent Transit Center sbx station at Rialto Avenue and E Street. Overall, the E Street corridor was expected to deliver 7,049 riders per typical weekday and over the last two months has delivered 4,625 riders per weekday. As a result, and since the majority of Route 2 riders remain within Omnitrans half mile walking standard of a sbx stop, Omnitrans proposes to reduce the frequency on Route Page 18

49 FY2016 Service Plan Route 8 Exhibit 13: Proposed Route 8 Map Shortly after Omnitrans modified East Valley service in September 2014, the San Bernardino County Department of Public Health (DPH) moved to Mill Street and Lena Road. Omnitrans had just discontinued service at that intersection because of low ridership. This low ridership existed even though the San Bernardino County Department of Aging and Adult Services (DAAS) was located in the same area. With the opening of the San Bernardino Transit Center, Omnitrans has the opportunity to be both more productive and to improve service coverage at Mill and Lena to better serve DAAS and DPH. The proposed Route 8 approaches the transit center from the south-east on Mill and Sierra Way instead of looping around to the north and doubling back to serve the transit center. This change reduces travel time to the SBTC from Loma Linda, Redlands and Yucaipa by 10- minutes per one way trip. The downside to this proposed alignment on its own is that Route 8 currently serves the San Bernardino International Airport, Goodwill Industries, and Arrowhead Vista Apartments. These destinations will be transferred to the Route 15 so no key destination on the current Route 8 is left without service Route 15 The proposed service changes on Route 15 are designed to continue to provide bus service to San Bernardino International Airport, Goodwill Industries and Arrowhead Vista Apartments previously served by Route 8. Exhibit 14: Proposed Route 15 Map Route 15 was selected to provide coverage to this area because its existing service on 9 th Street remains within Omnitrans walking distance standard of higherfrequency Routes 3 & 4 on Baseline. Additionally, 9 th Street continues to see coverage from many intersecting northsouth routes that will continue to provide coverage to the area. 19 Page 19

50 FY2016 Service Plan The key destinations along 9 th Street are Indian Springs High School and Curtis Middle School, both of which will continue to receive service at the corner of 9 th and Del Rosa. One final change to Route 15 was for travel south from the San Bernardino Transit Center to occur on G Street instead of E St. This change removes some duplication of Route 15 on a section of E Street covered by both sbx and Route 2 while providing service to Loma Linda University Medical Clinic/Campus that is currently under construction on G Street. Incorporating all of the proposed changes above, the East Valley System map proposed for September 2015 (FY2016) is shown in Exhibit 15 Exhibit 15: Proposed Routing for Downtown San Bernardino 3.3 I-10 FREEWAY EXPRESS ROUTE Within the OmniConnects Short-Range Transit Plan (SRTP), identified savings from implemented service changes were designated to improve Omnitrans productivity-oriented services with a focus of implementing freeway express service. Freeway express service is an important element of Omnitrans family of services because the one freeway express route that Omnitrans currently provides has been one of the fastest and consistently growing routes over the last six years. Route 215 which provides service from Downtown San Bernardino to Downtown Riverside has grown by 28% since FY2010, compared to Omnitrans Systemwide growth rate of -0.8% over the same time. Additionally, neighboring agencies freeway express routes (Riverside Transit Agency s (RTA s) Commuter Link, Victor Valley Transit Authority s (VVTA s) BV-Link, and Foothill Transit s SilverStreak) have driven ridership growth at these agencies. In OmniConnects, Omnitrans proposed a network of Freeway Express Routes with a plan to prioritize the routing based on ridership potential, public feedback and budget availability. The network of Freeway Express Routes is shown in Exhibit Page 20

51 Exhibit 16: OmniConnects Freeway Express Route Network FY2016 Service Plan One of these routes, the yellow route connecting Downtown San Bernardino at the San Bernardino Transit Center and Montclair at the Montclair Transit Center with stops at Arrowhead Regional Medical Center and Ontario Mills stood out as the route with the highest overall potential. Omnitrans had a similar route, Route 90, in the early and mid-2000s. It was eliminated due to budget cuts, but almost ten years after its elimination, it remains one of the most frequently requested services at public hearings and in regular reoccurring requests received through Customer Service. In response to the public request to Bring Back the 90, Omnitrans proposes to deliver peak hour weekday service on Route 290 with 15-one way trips per day. Exhibit 17: Proposed Freeway Express Route 290 The route s annual operating cost is $400,000 and can be delivered within Omnitrans existing fleet of buses. The operating cost is covered through two sources: 1) savings realized from the elimination of OmniLink service in FY2015 and 2) through the use of a new source of funding, the Low-Carbon Transit Operator Program (LCTOP), which is a Cap-and-Trade funding source. The route is expected carry 100,000 riders per year within two years based on achieving similar productivity levels as Omnitrans existing freeway express service. 21 Page 21

52 FY2016 Service Plan Route 290 is designed to reduce travel time across Omnitrans service area. Currently, a similar trip on Routes 14 and 66 would take approximately 2 hours and 10 minutes. The 290 cuts this travel time in half, bringing the total time for a one-way trip down to 58 minutes. For riders traveling the entire distance of the route, this reduces travel times by over hour per way and potentially two hours per day, which should greatly improve the quality of life for these riders. Omnitrans projects strong ridership on the Route 290, because it is timed with key transfers in both East and West Valley. In East Valley the route times to most early morning routes include the first sbx trips to reach the SBTC. In Montclair, timing was built around connections to SilverStreak and Metrolink trains. Omnitrans built the trips looking at the highest ridership trips on the current east-west trunk routes to reduce travel times to the greatest number of riders. The Route 290 is designed to be the connection between multiple Omnitrans local routes more so than a single route that connects a person s origin and destination. With this design, Route 290 offers a direct transfer connection to routes that comprise approximately 48,000 of Omnitrans average weekday riders. This has 96% of Omnitrans existing riders on a route that provides a direct transfer connection to the Route MINOR ACCESS SERVICE AREA MAP CHANGES Americans with Disabilities Act (ADA) complementary paratransit services is mandated within ¾-miles around fixed routes service. Whenever fixed route service changes, the corresponding ADA paratransit coverage requirements change. Since most of the proposed fixed route changes take sections of one route and apply them to another, the majority of the changes do not impact Omnitrans ADA paratransit service, Access. Exhibit 18 shows Omnitrans proposed Access map following the proposed services changes. The only minor subtraction from the regular service area is a small square in blue bordered by Rochester Avenue, Lark Drive, Mimosa Place, and Elkridge Place in Rancho Cucamonga. During the last quarter, there were no trip originations in this area and one trip destination out of Exhibit 18: Proposed Access Map, September 2015 (FY2016) 22 Page 22
53 FY2016 Service Plan the 109,383 trips that Access delivered. As a result, the expected impact of this change is small. Should a new rider wish to use Access from this area, it remains within the Beyond the Boundary Access service, subject to a $5 surcharge. There are a few minor additions to the Access service area including small changes in Chino, Chino Hills, and Ontario along the southern edge of the access service area. There is a small increase in Rancho Cucamonga as new routing will push Access slightly farther north near Archibald. Lastly, San Manuel Indian Bingo and Casino officially enters the Access service area. Currently, its parking lots are in the Access service area, but the Casino entrance itself is not. The change in Access service area map is expected to have a minimal to no impact on overall Access service for FY ACCESS ELIGIBILITY APPLICATION PROCESS In order to expedite the application process, ensure that applicants are choosing the right mode of transportation and to improve the validity of eligibility determination, Omnitrans proposes to change the eligibility application process for Access. The process changes are summarized in Exhibit 19. Exhibit 19: Proposed Access Eligibility Process: Current & Proposed for July 2015 (FY2016) Step Current Process Proposed Process Initial Interest in Request/Download Application: Phone, Mail, Unchanged Applying for Access On-line, In-person Application Mailed in or dropped off in person on its own. Includes a release for Omnitrans to obtain a medical verification. turned in during interview. Similar application. No release need for medical records release to Omnitrans. Application to be Medical Verification Omnitrans submits requests to applicant s doctor to complete medical verification. Applicant obtains medical verification for submittal with application. In-Person Interview None. Application and medical verification are brought to interview. Both documents are scanned and returned to applicant allowing Omnitrans to maintain a paperless process. Interview includes a few brief questions about application to verify authenticity of process. Eligibility Determination Completed within 21 days. Timeline confusing to applicants because significant delay can occur waiting for medical verification, which is outside of Omnitrans control. Completed within a few days of interview because all relevant material is provided at once. The primary change proposed in the Access eligibility application process is responsibility for obtaining a medical verification form. Currently, Omnitrans obtains the form after being granted a medical records release in the application itself. Omnitrans now proposes that the applicant directly acquire and submit the medical verification as part of the application. This change allows for greater transparency of the application process and reduces the call volume to Omnitrans. Currently, waiting for the medical release can be the longest part of the application process. From an applicant s perspective, it is hard to determine if the delay is caused by Omnitrans or their doctor, which makes the application process more cumbersome for all parties than necessary. Currently, approximately 30% of applications time out because they are incomplete. 23 Page 23
54 FY2016 Service Plan Omnitrans also proposes that the application with medical verification be brought in personally by the applicant rather than mailed. This will allow Omnitrans the opportunity to scan and return the application leaving a paperless process at Omnitrans. Additionally, Omnitrans will be able to verify some basic details about the application in a brief interview. Omnitrans peers have found that even a cursory interview can significantly reduce the number of fraudulent applications. For those not found eligible, the interview also provides an opportunity to educate the applicant about other options that may exist. At this time, Omnitrans does not propose a full functional assessment. Omnitrans believes that this program can be accomplished within the current Access budget. Omnitrans staff will no longer need to allocate time to chasing down medical verifications and can reschedule that time to working with Access riders. Omnitrans does have an internship grant that will be used within this program, where the intern will help schedule interviews. This grant will provide Omnitrans with two years to validate the costs and benefits of this program before determining if staffing levels should be adjusted. 24 Page 24
55 FY2016 Service Plan 4. PROPOSED FY2016 SERVICE Service levels are characterized by family of service (Local/Express, OmniGo, sbx and Access). Each of these services is defined by the routes along with the projected hours and miles of service to be delivered during the year along with the fleet requirements. Based on the service levels supplied, forecasts are derived for ridership, productivity and fare revenue. Omnitrans proposed FY2016 service levels are in line with OmniConnects FY Short Range Transit Plan (SRTP) that was adopted by the Board of Directors in May FY2016 is the Phase II implementation year of the changes proposed within OmniConnects. The detailed service change proposals were described in Section 3 of this report. Generally, Omnitrans service levels are held flat compared to the prior year. The changes that are proposed are cost neutral shifts from one service or route to another. The primary dynamics forecasted for the year are the result of these shifts, the opening of the San Bernardino Transit Center and having a year of sbx ridership history. Additionally, forecasts are impacted by the fare change that was implemented in September 2014, with the first few months of the year still seeing the annualized impact of the increase in fares. Finally, hours and miles are generally pushed slightly higher during FY2016 because of two additional weekdays during the year compared to FY2015. The largest change in the service forecasts for FY2016 compared to OmniConnects are in the ridership and passenger revenue forecasts for sbx. During FY2015, sbx is expected to deliver 559,000 riders and $481,000 in fare revenue. Based on the growth that sbx saw during the year, such as average weekday ridership more than doubling from May to October, the opening of the San Bernardino Transit Center and the reduction in frequency on Route 2, Omnitrans anticipates that sbx ridership in FY2016 will be 743,000 and fare revenue will be $654,000. While these measures improve by over 30% each compared to FY2015, they remain below the initial expectation of 1.4 million riders per year and $1.2 million in fare revenue. 4.1 SYSTEMWIDE SERVICE Systemwide service levels are the summation of the individual family of services which were defined in Exhibit 1. Systemwide service characteristics can be found in Exhibit 20. Financial Operating Data Fleet Data Key Stats y ( Exhibit 20:, Systemwide Service, Characteristics,, Summary ) System Total (in Thousands except vehicles and ratios) Fare Revenue 14,930 Year-End Percent Actuals Projection Estimate Change FY2012 FY2013 FY2014 FY2015 FY2016 FY2016 $ $ 14,738 $ 14,773 $ 16,422 $ 17, % Revenue Miles 10,851 10,866 10,861 11,239 11, % Total Miles 12,019 12,073 12,258 12,653 12, % Revenue Hours % Total Hours % Passengers 16,152 16,146 15,689 15,127 15, % Peak Revenue Fleet % Passengers per Hour % 25 Page 25
56 FY2016 Service Plan Omnitrans projects an increase in Systemwide ridership of 1.2% to 15.3 million riders in FY2016. This growth is driven primarily by increases in sbx and Access service. Additionally, in the second half of the year, Omnitrans anticipates ridership gains as the initial reaction to the FY2015 implemented fare increase wears off. The FY2015 fare increase still helps increase fare revenue in FY2016. The first two months of FY2015 were at the previous lower fare and now FY2016 will be at the higher fare. While this change on its own would only suggest an increase in fare revenue by 1.0% to 1.5%, Omnitrans use of forever passes extended the lower priced fares for many into more than just the first two months of FY2015. This coupled with the increase in expected ridership pushes expected fare revenue up 3.5% to $17.0 million. Revenue hours and revenue miles, the basic measure of transit supplied, remain generally flat compared to FY2015 with increases of 0.5% and 0.6%, respectively. These are driven by the introduction of freeway express service and the calendar impact of leap year. Overall, Fixed route service dominates Systemwide service characteristics because 91% of ridership and 71% of revenue hours are projected on fixed route local and freeway express service. In order of ridership, the next largest family of service is sbx with 5% of ridership and 4% of revenue hours; followed by Access with 3% of ridership and 21% of revenue hours; and, lastly OmniGo contracted fixed route with 1% of ridership and 3% of revenue hours. 4.2 FIXED ROUTE DIRECTLY OPERATED SERVICE Fixed route services include Omnitrans local and freeway express services. With the proposals for September 2015, these two services will be provided by 28 routes. These fixed route services account for that vast majority of Omnitrans service with 91% of Systemwide ridership and 71% of service provided. Exhibit 21 below shows the service characteristics summary for Omnitrans fixed route service offerings. Ridership in this category is expected to slightly decline 0.1% to million riders, compared to million riders in FY2015. This decline is caused by the continued impact of the fare increase and also because there are changes to 56% of the individual route maps which will cause some initial ridership loss. Omnitrans expects to regain this ridership once the service changes are provided time to mature. Exhibit 21: Fixed Route Directly Operated Service Characteristics Summary Motor Bus Directly Operated (MBDO) Excludes sbx Actuals Year-End Percent Projection Estimate Change (in Thousands except vehicles and ratios) FY2012 FY2013 FY2014 FY2015 FY2016 FY2016 Financial Fare Revenue $ 13,249 $ 13,031 $ 12,972 $ 14,095 $ 14, % Revenue Miles 7,550 7,491 7,506 7,469 7, % Total Miles 8,137 8,074 8,087 8,046 8, % Operating Revenue Hours % Data Total Hours % Passengers 15,523 15,510 14,962 13,955 13, % Fleet Data Peak Revenue Fleet % Key Stats Passengers per Hour % 26 Page 26
57 FY2016 Service Plan Fixed route revenue are estimated to grow 2.4% to $14.4 million as the September fare increase and the use of forever passes still provides for an expected $0.02 increase in average fare. Revenue hours and miles rise by 1.2% and 1.9%, respectively, as the new freeway express route, Route 290, are included in this category coupled with the calendar impacts described above. The Route 290 will initially negatively impact boardings, because most trips on this route today are occurring with two boardings, but will now only be counted once. This will also dissipate over time as the travel time savings should attract new riders. 4.3 FIXED ROUTE PURCHASED TRANSPORTATION SERVICE Omnitrans Fixed Route Purchased Transportation services (OmniGo and weekend contracted service on Routes 20 and 29) are projected to have a fairly stable FY2016. Revenue hours and miles are projected to increase by 0.2%, caused by calendar impacts. As shown in Exhibit 22, ridership in this category is expected to remain at 141,000 riders. This is a decline compared to FY2012-FY2014 caused by the fare increase implemented in September This fare increase s carryover impact in FY2016, does allow for a 3.0% increase in projected fare revenue growing from $134,000 in FY2015 to $138,000 in FY2016. Exhibit 22: Fixed Route Purchased Transportation Service Characteristics Summary Motor Bus Purchased Transportation (MBPT) Actuals Year-End Percent Projection Estimate Change (in Thousands except vehicles and ratios) FY2012 FY2013 FY2014 FY2015 FY2016 FY2016 Financial Fare Revenue $ 110 $ 122 $ 149 $ 134 $ % Revenue Miles % Total Miles % Operating Revenue Hours % Data Total Hours % Passengers % Fleet Data Peak Revenue Fleet % 4.4 SBX SERVICE sbx service is the most dynamic of Omnitrans family of services. Ridership and passenger revenue are expected to increase by over 30%, revenue miles are expected to remain flat and revenue hours are projected to increase by 5.5% for the year, despite remaining at the status quo service level in place today. Exhibit 23 provides the summary of sbx service characteristics. Three components are the primary driver of changes to sbx: 1) Sustaining ridership levels achieved and ongoing growth associated with a new service; 2) The opening of the San Bernardino Transit Center; and, 3) The reduction in service frequency proposed for Route 2. Average daily ridership on sbx ridership has more than doubled since the early weeks of the service. This growth has been sustained from October 2014 through February and March Interestingly, sbx ridership has been highly seasonal tied specifically to school schedules at California State University, San Bernardino and San Bernardino High School. Ridership on sbx 27 Page 27
58 FY2016 Service Plan Exhibit 23: sbx Service Characteristics Summary Bus Rapid Transit (BRT) Actuals Year-End Percent Projection Estimate Change sbx (Not included in MBDO or MBPT) FY2012 FY2013 FY2014 FY2015 FY2016 FY2016 Financial Fare Revenue $ 42 $ 481 $ % Revenue Miles % Total Miles % Operating Revenue Hours % Data Total Hours % Passengers % Fleet Data Peak Revenue Fleet % Key Stats Passengers per Hour % is projected to grow 32.9% from 559,000 riders to 743,000 riders. About one-third of this projected 184,000 riders increase is caused by annualizing the ridership growth that has already occurred. One of the lessons learned from the launch sbx was the importance of strong transfer connections to the rest of Omnitrans system. Since the San Bernardino Transit Center (SBTC) project experienced delays, it was not open when sbx opened as initially planned. This left Omnitrans local routes 0.4 miles away and out of line-of-sight from the closest sbx station. As a result, ridership on Route 2, which did not have this transfer walking distance, continued to see higher ridership than expected. Initially the sbx and Route 2 split of corridor ridership was expected at 80% and 20%, respectively. What actually occurred during the first year was closer to 50% and 50%. This will be corrected when the SBTC opens in September Since the transfer walking distance is removed from sbx, Omnitrans will reduce frequency on Route 2 to 60 minute service which is now in line with the proposed service levels for underlying local routes for any new Bus Rapid Transit services. These changes combined will likely lead to a 100,000 rider increase on sbx compared to FY2015. Based on the 32.9% ridership increase along with the annualized change from the September fare increase, Omnitrans expected fare revenue on sbx to rise by 36.0% to $654,000. Omnitrans expected revenue miles to remain constant with only a 0.4% increase in miles caused by calendar impacts. Daily revenue hours are expected to remain constant compared to the service in place today. However, to increase service reliability on the route, Omnitrans added a 12 th bus to the afternoon and evening rush hour during FY2015. On an annual level, that extra bus in the late afternoon increases revenue hours by 5.5% compared to the estimated levels for FY2015. Omnitrans is hopeful that these service hours will be removed during the year as the signal synchronization project currently occurring on E Street should allow for the reliability and travel time improvements without the need for the 12 th peak bus. 28 Page 28
59 FY2016 Service Plan 4.5 ACCESS SERVICE ADA PARATRANSIT SERVICE The primary driver of access service growth is growth in the senior and disabled population. Based on historic trends, application volume and demographic shifts, Access ridership is expected to growth from 469,000 riders in FY2015 to 481,000 riders in FY2016, an increase of 2.5%. This increase offsets the reduction in ridership caused by the fare increase in FY2015, and the FY2014 ridership level on Access was 479,000 riders. Detailed Access service characteristics can be found in Exhibit 24. Financial Operating Data Fleet Data Key Stats Access (in Thousands except vehicles and ratios) Exhibit 24: Access Service Characteristics Summary Year-End Percent Actuals Projection Estimate Change FY2012 FY2013 FY2014 FY2015 FY2016 FY2016 $ $ 1,551 $ 1,578 $ 1,708 $ 1, % Fare Revenue 1,532 Revenue Miles 2,845 2,918 2,800 2,818 2, % Total Miles 3,346 3,456 3,510 3,532 3, % Revenue Hours % Total Hours % Passengers % Peak Revenue Fleet % Passengers per Hour % The Access service will be provided under a new contract for the majority of FY2016. While the contractor is unknown at this time and remains in an open procurement, the contract did include incentives and other measures designed to improve productivity measured as passengers per hour. Omnitrans expects these measures to improve productivity to levels seen in FY2014, if not to the long-term goal of 3.0 passengers per hour. As a result of the expected improvement in productivity, Omnitrans anticipates a slight reduction in revenue hours and miles of 2.4% each. These are in line with the revenue hours and miles provided in FY2014 when Access achieved 2.8 passengers per hour. 29 Page 29
60 FY2016 Service Plan 5. FARE STRUCTURE Omnitrans FY2016 fare policy proposal follows the fare plan approved by the Omnitrans Board of Directors with the adoption of the OmniConnects FY Short Range Transit Plan (SRTP). The OmniConnects plan was based on implementing fare increases every other year, with the first fare increase implemented in FY2015. Omnitrans has followed this plan, and FY2016 is the year in between subsequent planned fare increases. Omnitrans recommends fare policy based on the requirement of achieving minimum farebox recovery ratio objectives set for general public services (Local, Express, OmniGo and sbx) and specialized service (Access). Omnitrans is required by the Transportation Development Act to maintain a farebox recovery ratio of at least 20% for its general public services and 10% for ADA service. Omnitrans is meeting its farebox recovery standards, so there is no immediate need to implement a fare change. During FY2015 year-to-date through February, Omnitrans achieved a 23.3% farebox recovery rate on general public service and a 13.5% farebox recovery rate on specialized service. These are both in excess of the mandate. Exhibit 25 and Exhibit 26 below provide details of Omnitrans FY2016 fare structure. Exhibit 25: Fixed Route Fares Full-Fare Senior/Disability/Medicare Youth Veteran 31-Day $ $ $ $ Day $ $ 8.00 $ $ Day Individually $ 5.00 $ 2.25 n/a full-fare $ 2.25 Packs of Ten $ $ n/a full-fare $ Cash/Ticket* $ 1.75 $ 0.75 n/a full-fare $ 0.75 Free Rides Metrolink Transfers: Free to rider; SCRRA pays one-half base fare for each boardings with a MetroLink ticket/pass; Children: Height < 46 ; limit 2 free per fare paying riders Personal Care Attendant: Accompanying a ADA Rider; Omnitrans Employees and Family Members: With Employee/Family ID; RTA Employees and Family Members: With Employee/Family ID; and, LAMTA, Foothill Transit, OCTA & VTrans Employees: With Employee ID Promotional Fares. Go Smart Fare The Go Smart fare is a pre-negotiated fare for all riders that attend a partner University, College, Trade/Technical School, or High School, or work at a partner employer. Participants must have an active, valid Omnitrans-compatible ID card as proof of fare. *1-Way ticket available for full fare only, minimum purchase quantity is 500 tickets. Exhibit 26: Access Fares Cash Beyond ADA Boundary 1-3 zone $ 3.25 $ zone $ 4.25 $ zone $ 5.25 $ zone $ 6.25 $ Page 30
61 FY2016 Service Plan 6. SUMMARY OF PUBLIC INPUT The proposed September FY2016 service changes were developed in the OmniConnects FY Short Range Transit Plan (SRTP). OmniConnects was developed based on multiple rounds of public hearings and informal public input sessions to develop a service profile that best matched the needs of Omnitrans riders and the community as a whole while taking into account the resources available to Omnitrans. Even though the OmniConnects plan was vetted through public input, the implementation of the second phase on the OmniConnects plan was presented to the public for further comment and refinement. Omnitrans held 12 separate meetings at a variety of times and locations as shown in Exhibit 27. Exhibit 27: Public Hearings and Input Sessions City Location Day & Date Time Highland City Council Chambers Thursday March19, :00 A.M. 12:00 P.M. Yucaipa Yucaipa Transit Center Thursday March 19, :00 P.M. - 6:00 P.M. Montclair Montclair Transit Center Monday, March 23, :00 A.M. - 11:00 A.M. Rancho Cucamonga City Council Chambers Monday, March 23, :00 P.M. -4:00 P.M. Fontana Fontana Metrolink Station Tuesday, March 24, :00 A.M. -10:00 A.M. San Bernardino 4 th Street Transfer Center Tuesday, March 24, :00 A.M. - 2:00 P.M. San Bernardino Omnitrans Metro Office Tuesday, March 24, :00 P.M. - 7:00 P.M. Chino City Council Chambers Wednesday, March 25, :00 A.M. - 11:00 A.M. Fontana Fontana Metrolink Station Wednesday, March 25, :00 P.M. - 6:30 P.M. Rancho Cucamonga Chaffey College Transit Center Thursday, March 26, :30 A.M. - 1:00 P.M. Ontario City Hall Community Rooms 1 & 2 Thursday, March 26, :30 P.M. - 7:00 P.M. San Bernardino 4 th Street Transfer Center Friday, March 27, :00 A.M. - 10:00 A.M. Exhibit 28: Public Comments by Type Comment Type Number Share Positive Changes Proposed % Longer AM/PM Service Hours % Increase Coverage % Increase Route Frequency % More Weekend Service % NexTrip Reliability 6 3.3% Improve Security at Stops 5 2.8% More Amenities 5 2.8% Happy with Omnitrans Services 4 2.2% Reduce Fares 2 1.1% More ADA Service 2 1.1% Like SBTC/SBTC Recommendations 2 1.1% Need to Improve Customer Service 2 1.1% Need to Improve Service Reliability 2 1.1% Dislike Changes to: Route % Route % Route % Route % Route % General Displeasure with Change 7 3.9% Other % 31 Page 31
62 FY2016 Service Plan At these meetings, Omnitrans staff interacted with approximately 366 individuals. In total, Omnitrans received 181 comments including comments that were also submitted by phone, , regular mail or online. Exhibit 28 shows a breakout of the public comments by type. The specific public comments are available upon request. Total % The most common public comments were positive comments about the proposed changes which accounted for 17.1% of all comments. These were often made by individuals who felt that their comments from earlier public meetings were included in the plan. These comments also heavily revolved around the opening of the San Bernardino Transit Center, the proposed Freeway Express Service on I-10 and improvements to Route 1. Additionally, 49% of people staff interacted with did not feel the need to comment which generally implies that they did not see a significant problem with the proposals. The next most common types of comments were requests for additional service. The two comment types that received were near 10% of comments were for longer service hours and services to new areas: 11.6% of comments were for Omnitrans to run longer hours, typically later in the evening or all night. 9.9% of comments requested routing to new areas not currently served by Omnitrans. These requests were generally for different locations. One of the only repeated requests was to extend service into the City of Eastvale in Riverside County in order to provide a regular, reoccurring transfer connection to Riverside Transit Agency (RTA) 19.9% of comments were for other items which ranged over a wide variety of topics. The only proposed change that received repeated negative feedback was the proposal to reduce service frequency on Route 2 from 30 minute to hourly service. Route 2 is the local route paired with the sbx Greenline. Many riders indicated that they did not use sbx because of the walking distances, particularly to make transfers downtown. With the opening of the San Bernardino Transit Center, the walking distance between sbx and Omnitrans local routes will be effectively eliminated compared to a 0.4 mile transfer walk today. In initial discussions at the public hearings, many riders indicated dissatisfaction with the proposed service changes on the Route 67. This route currently travels from Fontana Transit Center to the Montclair Transit Center primarily on Baseline Road and Mountain Avenue. The proposed routing creates a one-seat ride between Fontana and Chaffey College but does not provide service on Mountain Avenue in Upland. However, Omnitrans has proposed a new route 84 which provides direct north-south service on Mountain Avenue through Upland, Ontario and Chino. Once riders understood the combined services of Routes 67 and 84, they generally commented that the service was an improvement. 32 Page 32
63 FY2016 Service Plan 7. TITLE VI SERVICE EQUITY ANALYSIS Title VI of the Civil Rights Act of 1964 requires that public transit agencies do not impose disparate treatment or disparate impact upon low income or minority populations. As part of Omnitrans Title VI obligation, an equity analysis must be performed for major service and fare changes as part of the planning process. The analysis tests if the proposed changes unfairly impact the minority or low-income populations. Detailed service and fare equity analyses on the latest proposed routing changes were completed and presented in Chapter 13 of the OmniConnects FY Short Range Transit Plan (SRTP). The FY16 Service Plan is the implementation of the second phase of OmniConnects routing plan and as such has already been evaluated by a Title VI Analysis. However, since minor changes were made to the plan due to public feedback, an updated service equity analysis was completed. The results in Exhibit 29 illustrate that Omnitrans service area has a higher share of minorities and low income or minorities (LIM) than the county as a whole. Additionally, the results show that the minority population within ½-mile of Omnitrans proposed routing for September FY2016 the minority population grows from 75% to 76%. This data combined with the detailed analysis adopted within OmniConnects show that Omnitrans maintains compliance with Title VI with the implementation of this service change. Exhibit 29: Minority and Low Income Share in Omnitrans Service Area, Sub Regions and San Bernardino County REGION % Minorities % LIM COUNTYWIDE 67% 73% HALF MILE PEDESTRIAN BUFFERS Omnitrans' Entire Service Area Current 75% 78% Omnitrans' Entire Service Area, Sept FY % 79% EAST VALLEY FY2015 (Before) 79% 82% FY2016 (After) 79% 82% WEST VALLEY FY2015 (Before) 74% 77% FY2016 (After) 74% 77% In sum, after all route changes are proposed and implemented in the East and West Valleys, the end result is a negligible difference in proportion of minorities or Low Income / Minority (LIM) before and after the changes. The FY2016 Service Plan revised Routes 67, 65 and 68 compared to the OmniConnects plan. Additionally, Routes 65 and 68 are being changed to 85 and 88, respectively. In the case of Route 67, the western-most EOL was changed from the Milliken approach to Chaffey College to the Archibald approach to Chaffey College. Although demographic analysis of this change showed that the new alignment served a population with lower minority resident proportion than the older alignment (69.4% minority versus 74.2% minority, respectively), the older Milliken 33 Page 33
64 FY2016 Service Plan approach would be covered by the new Route 85, and thus Route 67 s coverage was redundant. The new alignment eliminated redundancy of service, and permitted expanding ridership. Since the older Milliken approach to Chaffey College was already being served, the change did not impose disparate treatment or disparate impact. As for the new Routes 85 and 88, it was found that further modification of the new iterations of Routes 65 and 68 were necessary to better and more efficiently serve the ridership of that portion of West Valley. By moving part of Route 65 from an EOL approach to Chaffey College on Haven to Milliken, it covered the lost approach due to realigning route 67, and the Haven approach would be covered in its turn by the new realignment of Route 67 to Archibald. The new alignment of 85 and 88 was virtually demographically indistinguishable from the minority resident makeup of old Routes 65 and 68 (73.2% minority versus 73.1% minority, respectively, and 76.0% versus 75.9% LIM, respectively). So the change does not impose disparate treatment or disparate impact. Numerous route changes in East Valley are proposed so that routes currently serving the 4 th Street Transfer Center will be able to serve the new San Bernardino Transit Center (SBTC) which will begin operating in September Owing to the fact that many of these routes experience either close proximity or overlap near where they converge in downtown San Bernardino, a realignment of these routes termini near the SBTC results in much of the area remaining fully covered. When the two half-mile pedestrian buffer regions are compared, the realignment of all routes around SBTC leads to nearly every portion of each buffer being covered by the other. Only two areas are found where there is very minimal difference between these two buffer regions; in the one region a small gap that was formerly not served by the original routing between Lena and 5 th Streets and between Harry Sheppard and Central is now served by the new routing. In the second case, a small gap opens up in the new routing from east of Valencia to Tippecanoe and from Vine to 7 th Streets in San Bernardino. When the two buffer regions are compared, the proportion of minority residents in each buffer regions are virtually identical (79.2% minority and 82.4% LIM, for each), and both have higher proportions of minority residents than either Omnitrans entire service area or for San Bernardino County overall. So the changes do not impose disparate treatment or disparate impact. In response to long customer demand, an additional peak hour freeway express route has been proposed. It will travel along the 10 freeway from SBTC to Montclair Transit Center. It will make 15 trips a day during morning and evening peak periods. A demographic analysis of the regions it serves shows that the percentage of minority residents falls below that of Omnitrans service area as a whole (73.2% versus 75.5%, respectively), but surpasses that of the County (66.7%); when compared to West Valley s combined half-mile pedestrian buffer as a background, the proportion of minority residents is still less, but closer to compatibility (73.2% versus 74.4%). Introduction of this limited service express route does not impose disparate treatment or disparate impact. Two route frequency changes are proposed: 1. Reducing frequency of service on Route 2 from 30 minutes to 60 minutes; and, 34 Page 34
65 FY2016 Service Plan 2. Increasing frequency of service on an expanded Route 1 to 15 minute service on all portions all day. Route 2 serves exactly the same area that sbx Greenline serves, along exactly the same streets, and it is felt that redundant service should be reduced there in order to free up resources so as to increase service where there is high demand elsewhere. sbx does serve fewer and more widely spaced stops along its length, but almost all of the stops are situated so that a pedestrian to walk in either direction half a mile to reach an sbx stop. As well, sbx runs at a ten-minute frequency all weekday long, and thus serves at a far higher frequency than Route 2. Finally, the resources saved by reducing frequency on Route 2 will be applied to increase frequency on Route 1. Currently, Route 1 is divided into a short and long route; one serves at 15-minute frequency, and the other at 30-minute frequency. By extending Route 1 an extra block at its northern-most EOL to serve beyond Lynwood and Del Rosa to Lynwood and Sterling and by increasing frequency along the entire route to 15-minute frequency all day long, we increase and improve service to more riders. A demographic analysis of the half-mile pedestrian buffer associated with both routes (Route 2 and proposed new Route 1) shows that the proportion of minority residents per buffer actually increases (from 76.6% for Route 2 to 86.7% for new Route 1). Thus these changes do not result in disparate treatment or disparate impact. The service equity analysis shows that Omnitrans proposed service changes are compliant with Title VI requirements. 35 Page 35

66 SERVICE PLAN JEREMIAH BRYANT SERVICE PLANNING MANAGER MAY 6,
67 Service Plan Annual Service Plan 1. Evaluates Ridership Trends 2. Proposes Service Changes 3. Defines Fare Policy 4. Forecasts Service Levels: Systemwide & by Service Family 5. Summarizes Public Input & Title VI Analysis 37
68 Service Plan FY2016 Service Plan Summary Based on OmniCONNECTS FY SRTP Board adopted May 2014 Phase II implementation Goals: Streamline local routes to improve travel times; Improve directness of travel; Simplify the route network; Reduce areas of service duplication; and, Build upon the success of freeway express routes. Overall changes are cost neutral and fit within OmniCONNECTS planned budget. 38
69 Ridership Trends -- System Total -- Service Plan Systemwide: -6.8% YTD-Feb. Goal +2.9%. Why: Fare increase: Contributed 6% reduction Fuel Prices: Contribute approx. a 5% decline sbx Ridership: Corridor ridership up 12.4%, Omnitrans Ridership a 1% growth offset Systemwide. 1,800,000 FY13 FY14 FY15 Thousands 12,000 1,600,000 1,400,000 10,000 1,200,000 8,000 1,000, ,000 6, ,000 4, , ,000 2, Jul Aug Sep Oct Nov Dec Jan Feb Mar Apr May Jun YTD Total

70 sbx Ridership Service Plan Projected sbx Greenline 80% Local Service 20% YTD sbx Greenline 52% Local Service 48% 40
71 Fixed Route Service Plan Type Brand Image Description Bus sbx Rapid Transit (BRT) BRT service mirrors light-rail service with dedicated amenities, stations & significantly reduced travel times. Local Omnitrans Traditional large bus service operating on a set route with a set schedule. Express Omnitrans Freeway bus service using a traditional large bus on a set route with a set schedule & frequency designed to connect two or more areas of concentrated activity. Community Circulator OmniGo Smaller bus service designed to offer lifeline mobility for areas with relatively low population and employment density. Demand Response ADA Paratransit Access Curb-to-curb service provided to comply with the Americans with Disabilities Act (ADA) that is complementary to fixed-route service, and is provided within ¾-mile of a 41 fixed route.


72 Service Plan Proposed Service Changes 1. West Valley North-South Route Improvements 2. San Bernardino Transit Center Routing 3. Freeway Express Route 4. Minor Access Service Area Map Changes 5. Access Application Process 42
73 Service Plan West Valley Route changes follow OmniCONNECTS Plan 43
74 Service Plan 44

75 Service Plan SBTC Routing Plan 45
76 Service Plan Route 2: Reduce freq. to 60 minutes because of improved transfers for sbx. Route 8: Service to DAAS and DPH. Transfer service of airport to Route 15. Route 1: Use efficiencies to improve frequency & connection near San Manuel. 46
77 Service Plan Route 290 Freeway Express Route Today: 2+ hour trip one-way. Proposed: 58 minutes (50% travel savings). Funding: FY2015 OmniConnects savings Cap and Trade Low-Carbon Transit Operator Program funds. Ridership potential: 100,000 riders per year. Weekday Peak hour service. 47

78 Service Plan Minor Access Service Map Changes 48
79 Service Plan Access Application Process Step Current Process Proposed Process Initial Interest Request App: Phone, Mail, Unchanged On-line, In-person Application Mailed in or dropped off. Includes a release to obtain a medical verification. Similar application. No release needed. Application to be turned in during interview. Medical Omnitrans submits requests Applicant obtains medical Verification In-Person Interview Eligibility Determination to doctor. None. Completed within 21 days. Delays often waiting for medical verification verification. Application & medical verification are brought to interview. Brief interview questions to verify authenticity. Completed within a few days of interview because all relevant material is provided at once. 49
80 Service Plan FY2016 Fare Policy Status quo. Fixed Route Fares Full-Fare Senior/Disability/Medicare Youth Veteran 31-Day $ $ $ $ Day $ $ 8.00 $ $ Day Individually $ 5.00 $ 2.25 n/a full-fare $ 2.25 Packs of Ten $ $ n/a full-fare $ Cash/Ticket $ 1.75 $ 0.75 n/a full-fare $
81 Financial Operating Data Fleet Data Key Stats System Total (in Thousands except vehicles and ratios) Service Plan Systemwide Forecasts Actuals Year-End Estimate Projection Percent Change FY2012 FY2013 FY2014 FY2015 FY2016 FY2016 Fare Revenue $ 14,930 $ 14,738 $ 14,773 $ 16,422 $ 17, % Revenue Miles 10,851 10,866 10,861 11,239 11, % Total Miles 12,019 12,073 12,258 12,653 12, % Revenue Hours % Total Hours % Passengers 16,152 16,146 15,689 15,127 15, % Peak Revenue Fleet % Passengers per Hour % 1.2% increase in ridership sbx, Freeway Express, Leap Year Slight increase in hours and miles for freeway express & leap year. 51
82 Fixed Route Type Brand Image FY2015 Bus Rapid Transit (BRT) Local Express sbx Omnitrans Omnitrans Service Plan (Millions of riders) FY2016 (Millions of Riders) % % % Community Circulator OmniGo % Demand Response ADA Paratransit Access % 52 System Total %
83 Service Plan Public input sessions held. 366 individuals reached. 181 comments. Common comments were: Changes are Positive Add more service Don t Change Route 2 Compliant with Title VI 53


84 Service Plan Thank You! Any Questions? 54

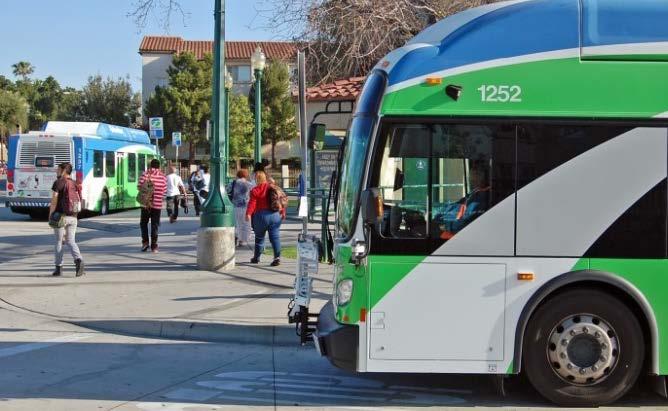

85 Supplemental Information Item #F4 MARKETING PLAN Fiscal Year May 6, 2015
86 EXECUTIVE SUMMARY MARKETING PLAN The mission of Omnitrans marketing is to generate a high level of public support and awareness of Omnitrans services and to promote increased use of those services. The annual Marketing Plan outlines a strategic approach to attracting and retaining customers while maintaining overall community support through the promotion of Omnitrans services and programs. The plan begins with analysis of the marketplace and a review of agency strengths, weaknesses, opportunities, and threats. Key goals are established and marketing strategies are developed to achieve them utilizing available resources. Comparing calendar year 2014 to 2013, Omnitrans system ridership declined by 3.9 percent year over year. Through February of the current fiscal year, Omnitrans system-wide ridership was 6.8 percent below the prior year. This negative trend is driven by a fare increase implemented in September 2014 and gasoline prices that dropped more than 40 percent in the first seven months of the fiscal year. While overall system ridership is down, the sbx/route 2 corridor posted a 12.4 percent gain compared to Route 2 alone in the prior year. Positive trends include the increased revenue from pass sales (+9%) and advertising revenue (+12%), and growing use of the NexTrip real-time arrival information system (+45%). Public awareness of Omnitrans is high, at 92 percent according to a recent survey, up from 85 percent in Customer satisfaction is 83 percent positive and public opinion is 76 percent favorable. The typical Omnitrans passenger is a young, working, English-speaking Hispanic woman with a high school education. Over 60 percent of rider households earn less than $20,000 annually. About 16 percent of riders are students and 9 percent are senior citizens. Omnitrans passengers are heavily reliant on transit; nearly half do not have a driver s license and only 18 percent have a car readily available to them. The primary reason for riding Omnitrans is to get to work, followed by school, shopping, and medical trips. Key objectives for Fiscal Year are to generate increased ridership, revenue, customer satisfaction, public awareness and public opinion. To achieve these goals several marketing strategies will be employed: promotion of Omnitrans family of services (sbx bus rapid transit, freeway express service, local bus routes, and OmniGo community shuttles) especially new and improved services to core and niche markets. The new San Bernardino Transit Center will offer an opportunity to enhance customer service at our busiest transfer hub. Ongoing programs include the GoSmart student fare program, community outreach and travel training, Hispanic/Spanish outreach, promoting pre-paid fares, improving customer communications, enhancing passenger amenities, and proactive media relations. Omnitrans has enhanced advertising revenue through the recent addition of onboard audio advertising; onboard video advertising will be explored on sbx. In an effort to maintain low administrative costs for the agency, expenses for public relations, advertising, promotion, outreach, and printing are being maintained at prior year budget levels. With the opening of the SBTC in September 2015, one full-time and one part-time customer service positions will be added. 1 1
87 MARKETING PLAN MARKET ANALYSIS Service Overview Omnitrans was established in 1976 to provide a unified and comprehensive public transit system for the San Bernardino Valley. Provisions of the Joint Powers Authority agreement called for: Establishment of a uniform fare policy within the service area Development of a coordinated marketing program Consolidation of operating and administrative functions to achieve economies of scale Omnitrans provides a family of services including both fixed route and demand response transportation. All services combined are supported by 171 buses, 110 cutaway buses and vans, 650 direct employees and 230 contracted employees. Fixed Route: As of May 2015, Omnitrans provides transit service on 32 routes, including one bus rapid transit (BRT) line, one freeway express route, 25 local bus routes and five community circulator routes. Combined, these provide nearly 50,000 passenger trips on weekdays. Routes cover the San Bernardino Valley and provide connections to other regional transit providers. Demand Response: Access is a lift-equipped, curb-to-curb, shared-ride service mandated by the Americans with Disabilities Act (ADA). It is available for pre-qualified persons with disabilities throughout the Omnitrans service area. Service is offered seven days a week by advance reservation. Access provides approximately 1,750 passengers trips on a typical weekday. Service Area Geography: Omnitrans operates in an area of approximately 450 square miles area known as the San Bernardino Valley. This includes the cities of Chino, Chino Hills, Colton, Fontana, Grand Terrace, Highland, Loma Linda, Montclair, Ontario, Rancho Cucamonga, Redlands, Rialto, San Bernardino, Upland and Yucaipa along with some unincorporated areas of San Bernardino County. Omnitrans travels beyond the service area to Pomona and Riverside, to connect to neighboring transit services. Population: The San Bernardino Valley is gaining population, but at a slower pace than a decade ago, reflecting an economy slow to recover from the recession of According to 2014 census estimates, the resident population of San Bernardino County was 2,091,618, up 2.7 percent from The Omnitrans service area population, in comparison, is approximately 1.4 million. The area is projected to see continued growth over the next 10 to 15 years, particularly in Chino and Ontario. 2 2
88 MARKETING PLAN Employment: Unemployment levels have improved since the double digit rates seen during Unemployment for San Bernardino County was 7.0 percent in December 2014, down from 8.6 percent the previous year. This compares to the national average of 5.6 percent and the state average of 6.7 percent. The San Bernardino Valley provides an estimated 503,530 jobs with an average salary of $42,000. Job growth in the San Bernardino Valley is expected to outpace Los Angeles and Orange Counties in the long term. SCAG forecasts that Ontario and San Bernardino will be among the top ten job markets in the region by Public Awareness and Opinion Overall awareness of Omnitrans among non-riders surveyed in 2015 was 92 percent, which is up significantly from 85 percent in percent could name Omnitrans, or an Omnitrans service, as their local bus service unaided. When prompted, 47 percent more said they had heard of Omnitrans, even though they could not name it outright. High awareness levels are desirable because it indicates people will seek out Omnitrans services when the need arises. The general public views Omnitrans in a positive light. The 2015 Inland Empire Annual survey showed that 76 percent of people rated the agency favorably even if they did not use our services. The graph at left 80% 70% 60% 50% 40% 30% 20% 10% 0% GENERAL PUBLIC OPINION RATING Negative Neutral Positive shows results of the same survey since Survey participants were asked if their opinion of Omnitrans had changed in the past year. While the majority said their perception of Omnitrans stayed the same at 72 percent, 25 percent said their perception improved and only 3 percent said their perception declined. When asked if they would consider becoming a bus rider, 13 percent said they would not consider riding, while 53 percent said they would ride if they had no other transportation and 29 percent said they would consider riding in the future. Current bus riders accounted for four percent of survey participants. Non-Rider Analysis Omnitrans most recent comprehensive survey of non-riders was conducted in The top barriers to using transit were preference for the comfort and privacy of a personal car and needing a car during the day. Also of significance was travel time compared to driving. While 71 percent would use the bus if travel times were the same as driving and 54 percent would tolerate up to 9 additional travel minutes, only 27 percent would ride up to 15 minutes longer. Very few wanted to extend travel time beyond 15 minutes. In the survey, non-riders viewed the primary benefits of using transit as helping reduce air pollution (81%) and traffic congestion (80%). Also, 70 percent agreed transit helps the economy. 3 3


89 MARKETING PLAN Rider Profile Age and Trip Purpose: Most Omnitrans fixed route riders are young adults using transit to get to work or school. The chart shows the distribution by age group based on a 2011 survey. The largest group is age 20 to 29 and over than half are under age 40. Those 60 plus make up only about 9 percent of riders. The majority of riders report being in the work force with 27 percent employed full-time, 20 percent part time and 5 percent selfemployed. Students made up 16 percent of passengers. Approximately one quarter of riders age took the bus to work, while about one quarter of those reported travelling to school. Medical trips are the most likely reason for travel by persons 70 and older. Transit Reliance: Overall, Omnitrans bus riders rely on transit to get around. In a 2011 survey, only 18 percent said they had an option of driving alone if the bus was not available and 45 percent indicated they did not own a working car. Less than half reported having a driver s license, though 61 percent had a licensed driver in the household. Access users are more transit dependent than fixed route riders. In 2011, just 7 percent had a driver s license compared to almost half (45%) of fixed route riders. Income: Omnitrans bus riders surveyed in 2011 were low income, as shown in the chart below. Over 60 percent of riders stated they lived in a household earning less than $20,000 annually. The RIDER INCOME $50K+, annual mean income was $31,250. In contrast, over $35K - 9% half of non-riders surveyed the same year reported <$50K, income levels of at least $50,000 annually. While it 11% must be noted that economic conditions have improved since the 2011 survey, historically the income gap between riders and non-riders has been similar. Turnover Rate: Historical data demonstrates that Omnitrans must work to attract about one fourth of its customer base each year from new customers to replace those leaving the system in order to keep ridership levels constant. Assuming the average trips per person each year remains relatively constant, the annual turnover rate has averaged about 23 percent in the past 20 years. For example, a 2011 survey showed that 28 percent of customers had been riding a year or less. In that year, ridership increased 6.7 percent. This translates to a 21.3 percent turnover rate. In 2007, 17 percent of riders rode a year or less while ridership decreased 3.1 percent, reflecting a 20 percent turnover. In 2003, we had a 24 percent turnover rate and in 2000 it was 22.5 percent. In 1994 and 1997, 37 percent of riders were new to the system fueling strong ridership growth of 12 percent 14 percent respectively. However the turnover rate remained consistent at 25 and 23 percent. This supports the need for marketing the 4 RIDER AGE DISTRIBUTION 60+ 9% % % $20K - <$35K, 19% % <20 17% % <$20K, 61% 4


90 MARKETING PLAN system because to generate growth, we need to attract higher levels of new riders. This information is graphically displayed in the chart below. 70% 60% 50% 40% 30% 20% 10% 0% LENGTH OF TIME RIDING OMNITRANS < 1 year 1-2 yr. >2 yr Customer Satisfaction: Omnitrans earns high marks from the people that matter most, those who use the service. In a 2014 rider survey, 83 percent of fixed route customers gave Omnitrans Positive 83% CUSTOMER SATISFACTION Neutral 10% Negative 7% a positive rating as the chart at left illustrates. This rating was the highest among 17 similar-sized agencies that make up the American Bus Benchmarking Group (ABBG). Omnitrans also had the highest Net Promoter Score, which compares how many customers would recommend Omnitrans to a friend or family member versus those who would not. The survey indicated that customers are most concerned about availability of service (service span and routing), time (on-time and travel time) and security, particularly at bus stops. Among Access customers surveyed in 2010, 90 percent gave the service an overall satisfaction rating of Excellent or Good. 5 5
91 MARKETING PLAN Ridership Trends In calendar year 2014, ridership on all Omnitrans services totaled 15,294,394 trips, which is a 3.9 percent decrease from the prior year, continuing a downward trend that began in The primary factors contributing to the 2014 decline include a fare increase implemented in September and falling gasoline prices, which were down as much as 40 percent from the prior year. The chart at right displays the trend from Fixed Route: Fixed route bus service generated 14.8 million boardings in 2014, down 4.0 percent 12 from than the prior year. Looking at ridership by fare category we learn that just over half of riders 10 (51%) paid full fare and one quarter paid the senior/disability rate. Students in the GoSmart program and youth fares accounted for 16 percent of ridership. The remaining eight percent of trips were attributed to free rides, transfers and miscellaneous categories. Demand Response: Ridership on Access and OmniLink combined in calendar year 2014 was 488,863 (-1.0% vs. 2013) with Access accounting DEMAND RESPONSE RIDERSHIP for 98 percent of the total demand response trips. Access ridership was essentially flat in (+0.4%) while OmniLink use continued to drop. The five year demand response ridership trend is 400 shown at right. Thousands Millions SYSTEM TOTAL RIDERSHIP In September 2014, Omnitrans discontinued OmniLink, dial-a-ride service offered in Chino Hills and Yucaipa following years of steady ridership declines since OmniGo shuttle routes were implemented in 2010 to more efficiently serve these communities Access OmniLink 6 6
92 MARKETING PLAN Revenue Trends Pass Sales: In calendar year 2014 prepaid bus pass unit sales increased 20.8 percent versus 2013, bouncing back from a down year in The chart below shows the pass sales trend for the past Thousands PASS SALES BY FARE CATEGORY DAY 7-DAY 1-DAY five years. A portion of the recent gain is attributed to the addition of ticket vending machines on the sbx line. Online store transactions also continued to grow, up 15.8% compared to Revenue from pass sales, including the GoSmart program, was up 10.7 percent, with the total exceeding $5.7 million. A fare increase implemented in September 2014 impacted revenue gains. Revenue from the GoSmart increased by 23.3% due to California State University being in the program for all of 2014, compared to a partial year in The GoSmart program is a negotiation rate program with costs supported by student fees and/or administrative contributions at partner schools. Students use their photo ID for fare payment. Prepaid and other non-cash fares averaged 70.7 percent of trips in the first three quarters of 2014, but increased to 72.3 percent after the September 2014 fare increase. This is a positive change as Omnitrans prefers to minimize cash fares because they increase the boarding time per rider as well as fees related to cash handling. Advertising: Marketing is responsible for managing advertising on agency assets either through a contractor or directly. This includes advertising on the exterior and interior of Omnitrans buses and at bus shelters and stations owned by Omnitrans. On board audio advertising on buses was recently implemented on local fixe route vehicles. For sbx vehicles, on board video displays are being tested which might provide advertising revenue potential. Future opportunities might include station or line naming rights or mobile app advertising. System advertising represents an important revenue stream for Omnitrans. Aside from the revenue, Omnitrans is able to use these various advertising methods for self-promotion at low or no cost. Thousands $1,000 $800 $600 $400 $200 $0 ADVERTISING REVENUE The five year trend for advertising revenue is shown at left. The steep decline between 2011 and 2012 came after the end of a five-year contract that was unfavorable to the bus advertising vendor when revenues declined due the recession of In 2012, Omnitrans implemented a one-year contract extension with the prior vendor. In 2013 a new five year contract was implemented with a new vendor. Revenue for 2014 was up 12 percent compared to the prior year. 7 7
93 MARKETING PLAN SWOT ANALYSIS In preparing the marketing plan, we consider our strengths, weaknesses, opportunities and threats (SWOT) as shown below. Strengths and weaknesses are largely characteristics of the organization while opportunities and threats are due primarily to external influences. INTERNAL EXTERNAL POSITIVE STRENGTHS Service Quality Customer satisfaction Safety record On-time performance System Features Family of services (BRT, freeway, local, shuttle, Access) Transit centers, bus stop amenities Wheelchair accessible Bike racks Clean fuel fleet Economical Service Passes for volume discounts Discounts for Veteran, Youth, Senior, Disabled, Medicare categories. Customer Communication Multilingual (LEP) Schedules, Newsletters Community outreach Travel training Website, mobile app, social media NexTrip real time arrival info Call center New service and infrastructure San Bernardino Transit Center West Valley realignment New freeway express service OPPORTUNITIES Service Area Development Multimodal, TOD interest at Cities Growing population, urbanization, congestion Active transportation projects Improving local economy, employment Community Partnerships Students, GoSmart Veterans Senior and disabled Employers Spanish/Hispanic Millennial generation pro transit Public Awareness/Public Opinion New revenue/funding opportunities New fare payment options Potential grants: Article 3, Cap and Trade Advertising programs NEGATIVE WEAKNESSES Constrained budget/service Limited funding Flat service levels Productivity vs. coverage demands Low service frequency Travel time Declining ridership Fare increase impacts Service changes, short term impact Dropped service, staffing levels Public agency environment Lack of flexibility Funding mechanisms Procurement cycles Slow reaction time THREATS Car culture High auto ownership Free parking Low market share Few choice riders Lower gasoline prices Lack of transit-friendly infrastructure Gaps in pedestrian/ bicycle infrastructure Suburban sprawl Graffiti and vandalism Perception of safety/security Construction impacts New private services Uber, Lyft, private shuttles, etc. 8 8
94 MARKETING PLAN TARGET MARKETS Identification of target markets is key to the success of any marketing plan. Only when target markets are clearly defined, can effective messages and media tactics be developed. FIXED ROUTE Core Market: Since our most likely new customers are those who most closely resemble current users of the service, these characteristics also identify our core target market. According to a 2011 rider survey, the typical Omnitrans fixed route rider is: Young: 16 to 29 years of age (43%), median age 33. Gender Neutral: Female (52%), Male (48%) Ethnically Diverse: Hispanic (46%); African American (25%); White (21%) Low Household Income: Under $20K (61%); $20K to $35K (19%) Employed: (54%) Niche Markets: In addition to the core market, several niche markets provide an opportunity for ridership growth: Students: 16 percent of riders surveyed in 2011 identified themselves as students, and school was the destination for 13 percent of all trips. Students tend to be economically less likely to afford a car, and may not be old enough to drive. Omnitrans focuses on students attending high schools, colleges and trade schools. Spanish Speaking: In the Omnitrans service area, an estimated one-third of residents are Spanish speakers and 16 percent speak English less than very well according to the 2011 American Community Survey. To effectively reach this market, specialized materials and messages must be created to attract Spanish speakers to the system. Seniors: In the 2011 rider survey, 9 percent of passengers were 60 years of age and older, compared to 18 percent of County residents. This is one of the fastest growing segments of our population. Thus, we have the opportunity to attract more senior riders to the Omnitrans bus system. Veterans: With the introduction of a Veteran discount fare in January 2015, we have increased our opportunities to partner with local Veterans organizations to promote Omnitrans services. Commuters: Commuters represent the potential for daily transit trips. Omnitrans works to attract more commuters by reaching out to large employers and employment centers. Most commuters in our service area are choice transit riders, persons with another means of transportation readily available. In a 2015 survey, 29 percent of non-riders indicated they might consider taking the bus in the future. ACCESS Access provides transportation service mandated by the Americans with Disabilities Act (ADA) for people unable to independently use the fixed route bus service for all or some trips. Target Market: Persons with physical or mental disabilities. Customers are reached primarily through local social service organizations. Omnitrans maintains extensive databases of persons 9 9

95 MARKETING PLAN with disabilities who have used our services in the past. This enables the Marketing team to effectively reach these target markets in order to alert them of service and policy changes. RESOURCES At Omnitrans, marketing, public relations and customer service functions fall within the Marketing & Planning Department. The marketing and planning functions work together to identify customer and community transportation needs in order to develop and enhance service offerings then effectively communicate them to the public. The organization chart below shows all positions in the department. The customer service section has 11 positions including seven that provide customer assistance in the agency call center seven days a week. This section also manages fare media sales, reduced fare ID cards, lost and found and reception. The marketing section has three positions which are responsible for all community outreach efforts and customer communications, both printed and electronic. Omnitrans utilizes an advertising agency to provide advertising and design services including creative development, graphic design, media buying and webmaster responsibilities. The department director oversees the advertising agency and serves as the agency s public information officer
96 MARKETING PLAN MARKETING GOALS The primary role of Marketing is to effectively communicate Omnitrans messages to target audiences in a manner that contributes to the overall Omnitrans mission. Resources are focused on generating a high level of public awareness in order to attract and retain customers, achieve high customer satisfaction and maintain positive public opinion. Marketing also promotes prepaid fare media sales and oversees advertising contracts which are important sources of revenue for the agency. Below are four primary goals and key performance indicators for Fiscal Year with comparisons to Fiscal Year targets and year-to-date results through February. 1. INCREASE RIDERSHIP System Ridership FY 2016 TARGET +1.2% FY 2015 Target +2.9% FY 2015 Actual YTD -6.8% 2. INCREASE REVENUE Bus Pass Sales Revenue FY 2016 TARGET +5.0% FY 2015 Target +5.0% FY 2015 Actual YTD +8.6% Advertising Revenue FY 2016 TARGET +15% FY 2015 Target N/A FY 2015 Actual YTD +12% 3. MAINTAIN HIGH CUSTOMER SATISFACTION Customer Satisfaction (favorable) FY 2016 TARGET 85% FY 2015 Target 90% FY 2015 Actual* 83% Call Center Efficiency (abandoned calls) FY 2016 TARGET <15% FY 2015 Target <15% FY 2015 Actual YTD 18% 4. MAINTAIN HIGH PUBLIC AWARENESS AND POSITIVE OPINION Public Awareness FY 2016 TARGET 90% FY 2015 Target 90% FY 2015 Actual** 92% Public Opinion (favorable) FY 2016 TARGET 75% FY 2015 Target 75% FY 2015 Actual** 76% Outreach Activities FY 2016 TARGET +5% FY 2015 Target +5% FY 2015 YTD 17% Media Coverage (favorable) FY 2016 TARGET 66% FY 2015 Target N/A FY 2015 YTD 66% *Customer satisfaction rating from American Bus Benchmarking Group annual survey, conducted in **Public awareness and public opinion data from Inland Empire Annual Survey
97 MARKETING PLAN MARKETING STRATEGIES Marketing strategies and the tactics planned to implement them are the heart of the marketing plan. Below are the key strategies Omnitrans will employ in the Fiscal Year. Each strategy is grouped with the strategic goal it is designed to achieve. GOAL 1: INCREASE RIDERSHIP Strategy: Promote express services Develop launch campaign for new Route 290 freeway express; include Route 215 Ongoing advertising of sbx green line service to build awareness and use Create community partnerships to reach potential new users Strategy: Promote local fixed route service to core market Target areas impacted by September 2015 West Valley realignment Promote San Bernardino Transit Center opening and related enhanced connectivity Promote Route 1 extension near to San Manuel Indian Bingo & Casino Utilize recurring advertising schedule to maintain/improve overall awareness Deliver advertising messages via local radio, cable television, direct mail, online, print and outdoor media to reach core market. Strategy: Promote OmniGo services in communities served Advertise to maintain awareness and attract new riders Partner with senior facilities and schools to increase awareness and use Participate in community events to increase awareness of service Strategy: Market to high school and college students Promote GoSmart program at partner schools and seek to enroll additional schools Market to high school students through free trial and travel training programs Promote youth bus pass options Strategy: Market to Hispanic and Spanish-speaking market segment Develop Hispanic-focused and Spanish-language advertising campaigns Provide Spanish translation in printed schedules, brochures and website Increase participation in Hispanic-focused community events Strategy: Market to senior citizens Conduct outreach through senior centers and organizations Develop promotions specifically for senior market; promote reduced fare Provide travel training for seniors Strategy: Market to military Veterans Conduct outreach through Veteran facilities and organizations Develop promotions specifically for Veteran market Promote Veteran fare 12 12
98 MARKETING PLAN Strategy: Market to commuters through corporate outreach programs Utilize e-marketing and events to reach large employers Develop specialized promotions directed at commuter market including travel training Create incentives for employers to promote transit use Strategy: Utilize marketing research to guide decisions Participate in annual ABBG customer service survey Participate in Inland Empire Annual Survey Conduct sbx before and after study survey Conduct online customer surveys on selected topics Strategy: Analyze ridership and pass sales data Evaluate ridership trends overall and by customer segment Track sales and usage of bus passes to determine trends and opportunities GOAL 2: INCREASE REVENUE Strategy: Promote prepaid fares Offer bus pass sales at SB Transit Center customer service desk Promote use of ticket vending machines on sbx line and SB Transit Center Promote online and retail outlet bus pass sales Target potential retail partners to become pass outlets to increase sales Promote fare media values in marketing materials Explore new fare collection technology such as mobile ticketing Strategy: Increase advertising revenue Ensure that existing advertising revenue contracts deliver maximum revenue potential through effective contract management Promote interior bus card advertising program to increase revenue Research new opportunities to generate advertising revenue on agency assets including fleets and facilities. Strategy: Leverage San Bernardino Transit Center Explore joint development opportunities on Omnitrans-owned property at San Bernardino Transit Center at E Street and Rialto Avenue in San Bernardino Explore other possible revenue opportunities for San Bernardino Transit Center GOAL 3: MAINTAIN HIGH CUSTOMER SATISFACTION Strategy: Improve customer communications Expand and enhance social media (Facebook, Twitter, YouTube, Flickr, Instagram, Blog, etc.) and e-marketing communications to reach customers and stakeholders Implement enhancements to agency website, and mobile app Maintain call center efficiency to maximize calls answered Expand communications for limited English proficiency (LEP) populations 13 13
99 MARKETING PLAN Utilize bus book, brochures, newsletters, posters and bus cards to inform customers Promote NexTrip bus arrival information system to increase use Strategy: Enhance passenger amenities at stops and stations Open San Bernardino Transit Center in September 2015, with enhanced passenger amenities and customer service desk Maintain cleanliness and safety of local bus stops, sbx stations, SB Transit Center Provide updated passenger information at stops, shelters and transit centers Develop and install enhanced bus shelters at key locations Add NexTrip electronic message signs at transit centers Strategy: Promote a customer service culture at Omnitrans Continue employee recognition programs for positive customer service behavior Promote employee bus ride program to increase understanding of customer experience Provide internal customer service training through videos, articles, and presentations Implement customer appreciation activities GOAL 4: MAINTAIN HIGH PUBLIC AWARENESS, POSITIVE OPINION Strategy: Expand community outreach efforts Expand participation in and sponsorship of community events Utilize travel training bus and video in outreach to target groups Utilize agency mascot and vintage bus at community events Strategy: Effective public relations practices Deliver key messages to target groups including stakeholders and general public Produce positive news releases and related coverage each month Respond to media inquiries in a timely manner Provide media communication training for key staff Strategy: Positive communications with community stakeholders Continue e-newsletters to inform community leaders and decision makers Develop partnerships with key organizations such as VetLink, American Lung Association, Veterans Affairs, cities, chambers, school districts, etc. Maintain awareness of key agency projects such as West Valley Connector Corridor Presentations at city councils of member cities, local service and business organizations as requested Promote transit benefits through participation in national or regional events such as Dump the Pump Day, Earth Day, Bike to Work Week, Rideshare Week, etc

100 MARKETING PLAN WENDY WILLIAMS DIRECTOR OF MARKETING & PLANNING MAY 6,
101 Marketing Plan Market Analysis Public Awareness Up: >9 out of 10 Public Opinion Up: 76% positive 25% say we improved Riders: going to work/school, transit reliant, low income, highly satisfied, 25% turnover Ridership: -6.8% YTD Pass Sales: +8.7% YTD Adv. Revenue: +12% YTD 16

102 Marketing Plan SWOT Analysis STRENGTHS Customer Satisfaction 83% (Highest in ABBG) Service Quality System Features Economical Service Customer Communication New Service, Infrastructure 17
103 Marketing Plan SWOT Analysis WEAKNESSES Constrained budget/service Travel time, low frequency Declining ridership Public agency process Lack of flexibility, slow reaction time 18
104 Marketing Plan SWOT Analysis OPPORTUNITIES Service Area Development Community Partnerships Millennial Generation Public Awareness/Opinion New Revenue/Funding Opportunities 19
105 Marketing Plan SWOT Analysis THREATS Car Culture Lower gasoline prices Lack of transit-friendly infrastructure Graffiti/Vandalism Perception of Safety/Security Construction Impacts New Private Services 20
 Ethnically")
 Spanish Lang.")

106 Marketing Plan Typical Rider Young: (43%) Ethnically Diverse Low Income Employed (55%) Niche Students (16%) Spanish Lang. (15%) Seniors, 62+ (9%) Commuters/Choice Veterans Access: Persons with Disabilities 21
107 Marketing Plan Increase Ridership +1.2% system wide Increase Revenue +5.0% Pass Sales; +15% Advertising Maintain High Customer Satisfaction 85% customer satisfaction rating <15% lost calls in call center Maintain High Awareness/Public Opinion >90% public awareness; >75% positive opinion +5% in outreach; +66% positive media 22
 Market to core and niche markets")

108 Marketing Plan Increase Ridership Promote express services (freeway, sbx) Market to core and niche markets Students, seniors, commuters, Vets, Spanish Radio, TV, Print, Digital, Outdoor, Direct Mail Promote OmniGo Research Analyze data 23

109 Marketing Plan Increase Revenue Promote prepaid fares SBTC in-person sales, TVMs Online, retail outlets Explore new fare payment technology Increase Advertising Revenue Contracts for buses, shelters Interior bus cards New opportunities Leverage SB Transit Center TOD on site Other revenue 24

110 Marketing Plan Maintain High Customer Satisfaction Improve customer communications Social media/online, print, on board Expand multi-lingual materials (LEP Plan) Enhance passenger amenities Open SB Transit Center Maintain cleanliness, info NexTrip expansion Customer service culture Recognition, training, passenger experience Customer appreciation 25

111 Marketing Plan Maintain High Awareness/Public Opinion Community outreach Events, sponsorships New Travel Training Video Buster and Old Blue Public relations Proactive positive news Media relations, training Communications with stakeholders E-newsletters, presentations, Partnerships, industry/regional events 26
112 Marketing Plan Thank You! Any Questions? 27
113 Supplemental Information Item #F5 BUDGET PLAN Fiscal Year May 6, 2015
114 1
115 2
116 3
117 4
118 5
119 6
120 7
121 8
122 9
123 10
124 11
125 12
126 13
127 14
128 15

129 BUDGET MAURICE MANSION TREASURY MANAGER MAY 6,
ALTERNATIVES ANALYSIS EXECUTIVE SUMMARY
 West Valley Connector Corridor ALTERNATIVES ANALYSIS EXECUTIVE SUMMARY FINAL September 2014 Ontario International Airport Ontario Mills Rancho Cucamonga Metrolink Station Kaiser Permanente PARSONS EXECUTIVE
Arlington County 10-Year Transit Development Plan & Premium Transit Network Briefing. May 2016
 Arlington County 10-Year Transit Development Plan & Premium Transit Network Briefing May 2016 Overview 10-Year Transit Development Plan Premium Transit Network Columbia Pike service concept Premium amenities
TRANSIT & NON-MOTORIZED PLAN DRAFT FINAL REPORT Butte County Association of Governments
 1 INTRODUCTION Maintaining a high quality of life is the essence of this plan for transit and non-motorized transportation in Butte County. Curbing greenhouse gas emissions (GHG) by reducing congestion,
Proposed. City of Grand Junction Complete Streets Policy. Exhibit 10
 Proposed City of Grand Junction Complete Streets Policy Exhibit 10 1 City of Grand Junction Complete Streets Policy Vision: The Complete Streets Vision is to develop a safe, efficient, and reliable travel
Transportation Master Plan Advisory Task Force
 Transportation Master Plan Advisory Task Force Network Alternatives & Phasing Strategy February 2016 BACKGROUND Table of Contents BACKGROUND Purpose & Introduction 2 Linking the TMP to Key Council Approved
Purpose and Need. Chapter Introduction. 2.2 Project Purpose and Need Project Purpose Project Need
 Chapter 2 Purpose and Need 2.1 Introduction The El Camino Real Bus Rapid Transit (BRT) Project (Project) would make transit and other transportation improvements along a 17.6-mile segment of the El Camino
Service Business Plan
 Service Business Plan Service Name Transportation Planning Service Type Public Service Owner Name Kaylan Edgcumbe Budget Year 2019 Service Owner Title Service Description Manager of Transportation Planning
Where We Live and Work Today
 San Diego Forward: The 2019-2050 Regional Plan Network Concepts Transportation Committee Item 4 October 19, 2018 Where We Live and Work Today 2018 2 2019 Regional Plan Transportation Committee Item 4 October
North Coast Corridor:
 North Coast Corridor: Connecting People, Transportation & Environment Legislative Hearing: 11.8.10 1 North Coast Corridor Region s Lifeline A Regional Strategy Mobility, Economy & Environment North Coast
Memorandum. Fund Allocation Fund Programming Policy/Legislation Plan/Study Capital Project Oversight/Delivery Budget/Finance Contract/Agreement Other:
 Memorandum Date: November 20, 2017 To: Transportation Authority Board From: Eric Cordoba Deputy Director Capital Projects Subject: 12/5/17 Board Meeting: San Francisco Freeway Corridor Management Study
CITY OF ELK GROVE CITY COUNCIL STAFF REPORT
 CITY OF ELK GROVE CITY COUNCIL STAFF REPORT AGENDA ITEM NO. 10.1 AGENDA TITLE: Provide Guidance on Proposed e-tran Service Modifications MEETING DATE: PREPARED BY: DEPARTMENT HEAD: Jean Foletta, Transit
Exhibit 1 PLANNING COMMISSION AGENDA ITEM
 Exhibit 1 PLANNING COMMISSION AGENDA ITEM Project Name: Grand Junction Circulation Plan Grand Junction Complete Streets Policy Applicant: City of Grand Junction Representative: David Thornton Address:
Regional Transportation Needs Within Southeastern Wisconsin
 Regional Transportation Needs Within Southeastern Wisconsin #118274 May 24, 2006 1 Introduction The Southeastern Wisconsin Regional Planning Commission (SEWRPC) is the official areawide planning agency
Bus Rapid Transit ALTERNATIVES ANALYSIS. Open House
 Bus Rapid Transit ALTERNATIVES ANALYSIS Open House June 23, 2015 Open House Meeting Agenda Agenda Introductions What is BRT? Project Goals Study Tasks Next steps Discussion PVTA Bus Rapid Transit Study
Bicycle Master Plan Goals, Strategies, and Policies
 Bicycle Master Plan Goals, Strategies, and Policies Mobilizing 5 This chapter outlines the overarching goals, action statements, and action items Long Beach will take in order to achieve its vision of
CASE STUDY City of Monrovia: Leveraging emerging ridesharing services to expand mobility options
 Advancing Mobility Management CASE STUDY City of Monrovia: Leveraging emerging ridesharing services to expand mobility options Agency: Location: Service Area: Modes: Community Context: Key Contacts: City
Service Proposal for the City of Ashland, Oregon
 Rogue Valley Transportation District 3200 Crater Lake Avenue Medford, Oregon 97504-9075 Phone (541) 608-2429 Fax (541) 773-2877 Visit our website at: www.rvtd.org 2009-2011 Service Proposal for the City
Arterial Transitway Corridors Study. Ave
 Arterial Transitway Corridors Study Ave January 2012 Arterial Transitway Corridors Study Overview Corridor Features and Demographics 11 study corridors, 95 route miles 86,000 daily rides and half of existing
TRAVEL PLAN: CENTRAL EUROPEAN UNIVERSITY CAMPUS REDEVELOPMENT PROJECT TRAVEL PLAN. Central European University Campus Redevelopment Project.
 TRAVEL PLAN Central European University Campus Redevelopment Project Page 1 Table of Contents Introduction... 3 Background... 7 Building Users... 7 Transportation in Community Consultation... 7 Summary
Philadelphia Bus Network Choices Report
 Philadelphia Bus Network Choices Report JUNE 2018 SEPTA Table of Contents Executive Summary...7 What if transit gave us more freedom?... 8 What is this report?... 8 The main conclusions... 9 What is happening
Public Consultation Centre For. Transportation Master Plan Update. Information Package
 Public Consultation Centre For Transportation Master Plan Update Information Package Date Location Hours Tuesday, September 12, 2017 Wednesday, September 13, 2017 Tuesday, September 19, 2017 Cambridge
ACTIVE TRANSPORTATION/NONMOTORIZED TRANSPORTATION
 ACTIVE TRANSPORTATION/NONMOTORIZED TRANSPORTATION BACKGROUND Active transportation, also known as nonmotorized transportation, is increasingly recognized as an important consideration when planning and
Pocatello Regional Transit Master Transit Plan Draft Recommendations
 Pocatello Regional Transit Master Transit Plan Draft Recommendations Presentation Outline 1. 2. 3. 4. What is the Master Transit Plan? An overview of the study Where Are We Today? Key take-aways from existing
Afeasibility study to evaluate bus rapid transit service in the East-West Corridor connecting major employment and activity centers between downtown
 East-West Bus Rapid Transit Feasibility Study Update and Recommended Locally Preferred Alternative (LPA) Summary City of Wauwatosa, Transportation Affairs Committee June 2016 Afeasibility study to evaluate
In station areas, new pedestrian links can increase network connectivity and provide direct access to stations.
 The Last Mile Planning for Pedestrians Planning around stations will put pedestrians first. Making walking to stations safe and easy is important; walking will be a part of every rapid transit Accessible
Transportation Authority of Marin Renew Existing ½-cent Transportation Sales Tax
 Transportation Authority of Marin Renew Existing ½-cent Transportation Sales Tax Request for Approval of the Final Sales Tax Renewal Expenditure Plan Town of Tiburon June 20, 2018 Request Council to Approve
Calgary Transit Route 302 Southeast BRT Year One Review June
 Calgary Transit Route 302 Southeast BRT Year One Review 2011 June Calgary Transit Route 302 Southeast BRT: Year One Review 2011 April Table of Contents 1.0 Executive Summary... 1 2.0 Introduction... 3
ORANGE COUNTY TRANSPORTATION AUTHORITY. Metrolink Ridership and Revenue Quarterly Report. Staff Report
 ORANGE COUNTY TRANSPORTATION AUTHORITY Metrolink Ridership and Revenue Quarterly Report Staff Report March 8, 2012 To: From: Subject: Transit Committee Will Kempton, Chief Executive Officer Metrolink Ridership
2. Context. Existing framework. The context. The challenge. Transport Strategy
 Transport Strategy Providing quality connections Contents 1. Introduction 2. Context 3. Long-term direction 4. Three-year priorities 5. Strategy tree Wellington City Council July 2006 1. Introduction Wellington
City of Davenport CitiBus Public Transportation Study. April 2015
 City of Davenport CitiBus Public Transportation Study April 2015 Overview Project Background Key Findings CitiBus Service Allocation Policy Discussion 2 Project Background 3 About CitiBus Operates 17 routes
Understanding Rail and Bus Ridership
 Finance Committee Information Item III-A October 12, 2017 Understanding Rail and Bus Ridership Washington Metropolitan Area Transit Authority Board Action/Information Summary Action Information MEAD Number:
4 Ridership Growth Study
 Clause 4 in Report No. 15 of Committee of the Whole was adopted, without amendment, by the Council of The Regional Municipality of York at its meeting held on November 16, 2017. 4 Ridership Growth Study
PEDESTRIAN ACTION PLAN
 ATTACHMENT 2 CITY OF SANTA MONICA PEDESTRIAN ACTION PLAN CITY OF SANTA MONICA PEDESTRIAN ACTION PLAN This page intentionally left blank EXECUTIVE SUMMARY CHAPTER 1 EXECUTIVE SUMMARY Setting the Stage
WHITE PAPER: TRANSIT SERVICE FOR SOUTH SHAGANAPPI
 9/27/2012 TRANSIT PLANNING WHITE PAPER: TRANSIT SERVICE FOR SOUTH SHAGANAPPI 2012 Calgary Transit 1 Table of Contents Purpose... 3 Area of Change... 3 Background... 3 Access to destinations... 5 Connecting
Capital Metro Monthly Ridership Report September 2017 (Fiscal Year-end 2017)
") Capital Metro Monthly Ridership Report September 2017 (Fiscal Year-end 2017) Page 1 of 6 Ridership Summary This is a summary of Capital Metro system-wide ridership statistics for fiscal year-end and the
Capital Metro Monthly Ridership Report September 2017 (Fiscal Year-end 2017) Page 1 of 6 Ridership Summary This is a summary of Capital Metro system-wide ridership statistics for fiscal year-end and the
Climate Change Action Plan: Transportation Sector Discussion Paper: Cycling
 Climate Change Action Plan: Transportation Sector Discussion Paper: Cycling ontario.ca/climatechange Contents 1. Minister of Transportation s message... 3 2. Introduction... 5 3. Sector Overview and Support
Typical Rush Hour Commute. PennyforTransportation.com
 Typical Rush Hour Commute In the News Overview of the Plan Collaborative plan with projects in every community Prioritizing connectivity and congestion relief Dedicated transportation-specific funding;
Appendix A-K Public Information Centre 2 Materials
 Appendix A-K Public Information Centre 2 Materials Our Rapid Transit Initiative Make an impact on the future of transit Join the discussion on Rapid Transit in London You re invited to a Public Information
City of Novi Non-Motorized Master Plan 2011 Executive Summary
 City of Novi Non-Motorized Master Plan 2011 Executive Summary Prepared by: February 28, 2011 Why Plan? Encouraging healthy, active lifestyles through pathway and sidewalk connectivity has been a focus
ROUTES 55 / 42 / 676 BUS RAPID TRANSIT LOCALLY PREFERRED ALTERNATIVE
 ROUTES 55 / 42 / 676 BUS RAPID TRANSIT LOCALLY PREFERRED ALTERNATIVE April, 2012 1 INTRODUCTION The need for transit service improvements in the Routes 42/55/676 corridor was identified during the Southern
1999 On-Board Sacramento Regional Transit District Survey
 SACOG-00-009 1999 On-Board Sacramento Regional Transit District Survey June 2000 Sacramento Area Council of Governments 1999 On-Board Sacramento Regional Transit District Survey June 2000 Table of Contents
Priced Managed Lanes in America. October 2013
 Priced Managed Lanes in America October 2013 1 Priced Managed Lanes What are they? Where are they? Why do them? When to do them? Common issues Lessons learned What are Priced Managed Lanes? The subset
Capital and Strategic Planning Committee. Item III - B. April 12, WMATA s Transit-Oriented Development Objectives
 Capital and Strategic Planning Committee Item III - B April 12, 2018 WMATA s Transit-Oriented Development Objectives Page 24 of 76 Washington Metropolitan Area Transit Authority Board Action/Information
Moving Cambridge. City of Cambridge Transportation Master Plan Public Consultation Centre. March 7, :00 8:00 PM.
 City of Cambridge Transportation Master Plan Public Consultation Centre March 7, 2018 5:00 8:00 PM Region of Waterloo City of Cambridge Transportation Master Plan Public Consultation Centre March 7, 2018
Providence Downtown Transit Connector STAKEHOLDER MEETING #2. Stakeholder Meeting #1 October 24, 2016
 Providence Downtown Transit Connector STAKEHOLDER MEETING #2 Stakeholder Meeting #1 October 24, 2016 February 2017 1 AGENDA 1 DTC Goals and Expectations 2 Street Design Concepts 3 Potential Benefits and
Standing Committee on Policy and Strategic Priorities
 POLICY REPORT Report Date: January 15, 2019 Contact: Steve Brown Contact No.: 604.873.9733 RTS No.: 12955 VanRIMS No.: 08-2000-20 Meeting Date: January 30, 2019 TO: FROM: SUBJECT: Standing Committee on
95 Express Annual Operations Report: Fiscal Year
 95 Express Annual Operations Report: Fiscal Year 2014-2015 General The 95 Express Program completed its sixth full Fiscal Year of operations in June 2015. For the FDOT, its Fiscal Year (FY) is from July
ITEM 2.3 South of Fraser Rapid Transit Surrey-Langley technology decision. That the Mayors Council on Regional Transportation receive this report.
 TO: FROM: Mayors Council on Regional Transportation Geoff Cross, Vice President of Planning and Policy DATE: September 27, 2017 SUBJECT: ITEM 2.3 South of Fraser Rapid Transit Surrey-Langley technology
Paratransit Service. ADA Paratransit Service
 Paratransit Service June 8, 2011 ADA Paratransit Service Operating Statistics Redi-Wheels & RediCoast Customer Service Paratransit Eligibility ADA Program Costs Efficiency Measures Summary 2 1 Redi-Wheels
York Region Population and Employment Growth
 March 1, 2016 1 York Region Population and Employment Growth York Region needs to comply with The Provincial Growth Plan and new forecasts introduced to 2036 and 2041 2 Regional Official Plan Review York
Transit Ridership - Why the Decline and How to Increase. Hosted by the. Virginia Transit Association
 Transit Ridership - Why the Decline and How to Increase Hosted by the Virginia Transit Association Virginia Transit Association 1108 East Main Street, Suite 1108 Richmond, VA 23219 804.643.1166 www.vatransit.com
APPROVE A RESOLUTION ADOPTING A COMPLETE STREETS POLICY
 STAFF REPORT MEETING DATE: September 13, 2016 TO: FROM: City Council Bob Brown, Community Development Director Russ Thompson, Public Works Director Patrick Filipelli, Management Analyst 922 Machin Avenue
Access BART: TOD and Improved Connections. October 29, 2008
 Access BART: TOD and Improved Connections October 29, 2008 1 Access BART Study Goals Evaluate at the system-level land use and access scenarios to optimize ridership Identify station clusters that provide
DIRECTION REGARDING WEHO PEDALS BIKE SHARE PROGRAM AND DOCKLESS BIKE SHARE PILOT MAYOR PRO TEMPORE JOHN D' AMICO COUNCILMEMBER LAUREN MEISTER
 CITY COUNCIL DECEMBER 3, 2018 NEW BUSINESS SUBJECT: INITIATED BY: DIRECTION REGARDING WEHO PEDALS BIKE SHARE PROGRAM AND DOCKLESS BIKE SHARE PILOT MAYOR PRO TEMPORE JOHN D' AMICO COUNCILMEMBER LAUREN MEISTER
Progress Report Capital Programs Support
 Progress Report Capital Programs Support June 2017 Prepared by Project Control l Design, Engineering & Construction Management June 2017 Page 135 of 142 This page intentionally left blank. June 2017 Page
Governor s Transportation Vision Panel
 Office of Governor Kate Brown Governor s Transportation Vision Panel JLA Public Involvement Project Overview The is a yearlong effort to develop a series of recommendations for the Governor that address
CITY OF COCOA BEACH 2025 COMPREHENSIVE PLAN. Section VIII Mobility Element Goals, Objectives, and Policies
 CITY OF COCOA BEACH 2025 COMPREHENSIVE PLAN Section VIII Mobility Element Goals, Objectives, and Policies Adopted August 6, 2015 by Ordinance No. 1591 VIII MOBILITY ELEMENT Table of Contents Page Number
Caltrain Bicycle Parking Management Plan DRAFT PROJECT SCOPE SUBMITTED TO CALTRANS FALL 2014
 Caltrain Bicycle Parking Management Plan DRAFT PROJECT SCOPE SUBMITTED TO CALTRANS FALL 2014 NOTE: The following draft scope of work was developed by Caltrain in the fall of 2014 as part of a Caltrans
University of Leeds Travel Plan
 University of Leeds Travel Plan 2015-2018 Contents 1: Introduction 1.1 What is a Travel Plan? 1.2 Why do we need one? 1.3 Sustainability Strategy 2: Overview 2.1 The bigger picture 2.2 The City scale 2.3
MEETING Agenda. Introductions. Project Overview. Key Study Components. Alternative Station Concepts. Preferred Station Concept. Next Steps.
 City GARLAND Council ROADVISION Briefing STUDY VISION STUDY Dallas, TX April 8, 2010 1 1 MEETING Agenda Introductions Project Overview Key Study Components Alternative Station Concepts Preferred Station
Rochester Area Bike Sharing Program Study
 roc bike share Rochester Area Bike Sharing Program Study Executive Summary ~ January 2015 JANUARY 2015 8484 Georgia Avenue, Suite 800 Silver Spring, MD 20910 3495 Winton Pl., Bldg E, Suite 110 Rochester,
University of Victoria Campus Cycling Plan Terms of Reference. 1.0 Project Description
 University of Victoria Campus Cycling Plan Terms of Reference 1.0 Project Description The Campus Cycling Plan, a first for the University, will provide a comprehensive and coordinated approach to support
Contents. Champaign-Urbana Mass Transit District Stop Placement Guidelines
 Contents Champaign-Urbana Mass Transit District Introduction... 1 Stop Spacing... 2 Rural... 2 Low Density Suburban... 2 General Urban... 2 Urban Core... 2 Operational Safety... 3 Stop Placement... 4 Nearside
Tulsa Metropolitan Area LONG RANGE TRANSPORTATION PLAN
 Tulsa Metropolitan Area LONG RANGE TRANSPORTATION PLAN Indian Nations Council of Governments August 2005 CONTACTING INCOG In developing the Destination 2030 Long Range Transportation Plan, INCOG s Transportation
Capital Beltway HOT Lanes - Frequently Asked Questions
 Capital Beltway HOT Lanes - Frequently Asked Questions December 20, 2007 1. What is the cost of the project? The fixed-price design-build cost is approximately $1.4 billion. 2. Why have the project costs
2.2 TRANSIT VISION 2040 FROM VISION TO ACTION. Emphasize transit priority solutions STRATEGIC DIRECTION
 TRANSIT VISION 2040 FROM VISION TO ACTION TRANSIT VISION 2040 defines a future in which public transit maximizes its contribution to quality of life with benefits that support a vibrant and equitable society,
MORE CONNECTIONS. Redesigning routes for the future of transit in Milwaukee County.
 What is MCTS NEXT? FASTER SERVICE MORE CONNECTIONS INCREASED ACCESSIBILITY Redesigning routes for the future of transit in Milwaukee County. MCTS NEXT is a new way of looking at transit. We re examining
Speaker: Brian Dranzik, Fiscal & Policy Administrator Milwaukee County
 Milwaukee County Speaker: Brian Dranzik, Fiscal & Policy Administrator Milwaukee County Department of Transportation and Public Works Project coordinated by Milwaukee County Transit System and Southeastern
TOWARDS A BIKE-FRIENDLY CANADA A National Cycling Strategy Overview
 TOWARDS A BIKE-FRIENDLY CANADA A National Cycling Strategy Overview NationalCyclingStrategFrameworkv3.indd 1 Potential for this modal shift can be found in municipalities of all sizes, in every population
Traffic Safety Plan Traffic Safety Plan 2015
 Traffic Safety Plan 2015 Purpose Airdrie s last Traffic Safety Plan was created in 2011. The 2015 Traffic Safety Plan is a revised model of the traffic operations for the City of Airdrie. The purpose of
BUILDING THE CASE FOR TRAVEL OPTIONS IN WASHING TON COUNTY. Image: Steve Morgan. Image: Steve Morgan
 BUILDING THE CASE FOR TRAVEL OPTIONS IN WASHING TON COUNTY Image: Steve Morgan Image: Steve Morgan Image: TriMet Image: TriMet WHAT ARE TRAVEL OPTIONS PROGRAMS? Travel options programs encourage residents,
CARTA East Cooper Transit Service Transportation Committee Town of Mount Pleasant. February 5, 2013
 CARTA East Cooper Transit Service Transportation Committee Town of Mount Pleasant February 5, 2013 Service Overview Study Overview East Cooper Service Analysis Provide additional analysis as a follow up
Board Strategy Day. January 25, 2018
 Board Strategy Day January 25, 2018 Corporate Plan 2018-2022 & beyond Presentation to the board 2018 2022 & beyond 2 Building on the last five-year plan 2013 2017 21% reduction in subway delay minutes
Chapter 5 Future Transportation
 Chapter 5 Future Transportation The Future Land Use Plan identifies the desired land use designations. The land uses desired for Crozet depend, in large part, on the success of the transportation system,
EXECUTIVE SUMMARY... vii 1 STUDY OVERVIEW Study Scope Study Area Study Objectives
 Contents EXECUTIVE SUMMARY... vii 1 STUDY OVERVIEW... 1-1 1.1 Study Scope... 1-1 1.2 Study Area... 1-1 1.3 Study Objectives... 1-3 2 EXISTING CONDITIONS... 2-1 2.1 Existing Freeway Conditions... 2-4 2.1.1
WALKNBIKE DRAFT PLAN NASHVILLE, TENNESSEE EXECUTIVE SUMMARY NASHVILLE, TENNESSEE
 NASHVILLE, TENNESSEE EXECUTIVE SUMMARY Executive Summary A world-class multi-modal transportation system is essential to a vibrant city and better quality of life. -Mayor Barry The WalknBike plan aims
Update June 2018 OUR 2017 PUBLIC ENGAGEMENT
 Update June 2018 Hi, Let s Get Wellington Moving (LGWM) is developing a Recommended Programme of Investment (RPI) that meets our programme objectives and supports the city s and region s growth. As part
Circulation in Elk Grove includes: Motor vehicles, including cars and trucks
 Circulation, as it is used in this General Plan, refers to the many ways people and goods move from place to place in Elk Grove and the region. Circulation in Elk Grove includes: Motor vehicles, including
Wilshire Boulevard Bus Rapid Transit Project
 Los Angeles County Metropolitan Transportation Authority Wilshire Boulevard Bus Rapid Transit Project COMMUNITY MEETINGS November 2008 Agenda Introduction Proposed Project Overview Participating Agencies
May 12, 2016 Metro Potential Ballot Measure Issue Brief: Local Return
 Summary: Local return is an important revenue source for cities to maintain their local transportation infrastructure. Most cities use their local return to operate small bus systems and repave streets,
Preliminary Transportation Analysis
 Preliminary Transportation Analysis Goals of a Robust, Multimodal Transportation Network Safe Accessible/Connected Efficient Comfortable Context-Sensitive Motor Vehicle: Continue to analyze the data to
Title VI Fare Change Equity Analysis
 Title VI Fare Change Equity Analysis Evaluation Report Submitted to Dallas Area Rapid Transit Submitted by TranSystems June 2012 Title VI Fare Change Equity Analysis Introduction DART has proposed a schedule
Cutting Canada s Slowest Rush Hour with Public Transportation
 Cutting Canada s Slowest Rush Hour with Public Transportation Denny Yip September 30 th, 2011 1. Introduction Transportation is a key issue in Canada. In the province of Ontario, the Greater Toronto Area
South King County High-Capacity Transit Corridor Study
 HIGH-CAPACITY TRANSIT CORRIDOR STUDY South King County Corridor South King County High-Capacity Transit Corridor Study Corridor Report August 2014 South King County High Capacity Transit Corridor Report
Bus Rapid Transit Plans
 Twin Cities Region Bus Rapid Transit Plans ULI Minnesota Workshop Connecting Bus Rapid Transit to the Community December 15, 2009 John Levin Director of Service Development Metro Transit Metropolitan Area
Southwest Bus Rapid Transit (SW BRT) Functional Planning Study - Executive Summary January 19 LPT ATTACHMENT 2.
 Functional Planning Study - Executive Summary January 19 LPT ATTACHMENT 2.") Southwest Bus Rapid Transit (SW BRT) Functional Planning Study - Executive Summary 2011 January 19 1 of 19 Introduction This executive summary presents the results of the Southwest Bus Rapid Transit (SW
Southwest Bus Rapid Transit (SW BRT) Functional Planning Study - Executive Summary 2011 January 19 1 of 19 Introduction This executive summary presents the results of the Southwest Bus Rapid Transit (SW
395 Express Lanes Extension
 395 Express Lanes Extension January 2016 Building a network of Express Lanes Project overview Add capacity on I-395 with addition of a third HOV lane and active traffic management Generate guaranteed transit
Welcome! Public Open House on UBC s Transportation Plan
 1 Welcome! Public Open House on UBC s Transportation Plan Public open house hours: to When it comes to on-campus transportation, what do you think is working well and what are some opportunities for improvement?
PUBLIC TRANSPORTATION PLAN FOR THE CITY OF GEORGETOWN
 PUBLIC TRANSPORTATION PLAN FOR THE CITY OF GEORGETOWN PRESENTATION TO CITY COUNCIL JANUARY 22, 2008 PUBLIC TRANSIT FOR THE CITY OF GEORGETOWN LOCAL SERVICE For Georgetown residents to Georgetown destinations.
GOLD COAST TRANSIT DISTRICT SHORT RANGE TRANSIT PLAN FY 2015 FY 2019 APPENDICES
 APPENDICES I. GCTD Ridership Data a. Fixed-Route 10 Year Ridership History b. Ridership Summary - FY 2013-14 & FY 2014-15 c. Performance Indicators By Route FY 2013-14 & FY 2014-15 d. Annual Ridership/Passengers
Community Task Force July 25, 2017
 Community Task Force July 25, 2017 Welcome and Introductions Project Partners Regional Transportation District (RTD) Colorado Department of Transportation (CDOT) Denver Regional Council of Governments
Central Oregon Intergovernmental Council
 Central Oregon Intergovernmental Council Regional Transit Master Plan (RTMP) Technical Advisory Committee Kick-Off Meeting May 16, 2012 Meeting Agenda Project Orientation Presentation of Survey Results
Spring Lake Park Mounds View North Oaks. Arden Hills. Shoreview. Roseville. Little Canada. Falcon Heights SNELLING. Lilydale. West Saint Paul 35E
 Coon Rapids Blaine Spring Lake Park Mounds View rth Oaks In 2011, Metro Transit embarked on the Arterial 494 Minnetonka Maple Grove Plymouth Hopkins Brooklyn Park New Hope Golden Valley Louis Park Edina
Congestion Management in Singapore. Assoc Prof Anthony TH CHIN Department of Economics National University of Singapore
 Congestion Management in Singapore Assoc Prof Anthony TH CHIN Department of Economics National University of Singapore anthonychin@nus.edu.sg Introduction 2 Introduction and What is Traffic Congestion?
AMATS Complete Streets Policy
 AMATS Complete Streets Policy Table of Contents: Section 1. Definition of Complete Streets Section 2. Principles of Complete Streets Section 3. Complete Streets Policy Section 4. Consistency Section 5.
Auckland Transport Monthly Indicators Report 2018/19
 Attachment 1 Auckland Transport Monthly Indicators Report 218/19 August 218 Table of Contents Page 2. 1. Summary of indicators 1.1 SOI performance measures 1.2 AT Metro patronage breakdown 2. Monthly indicators
Third Street Bridge & Corridor Project
 Third Street Bridge & Corridor Project Preparation for the FY2018 budget to commence October 1, 2017, includes funding to address a project that has been considered since 1994. The Third Street bridge
Highway 217 Corridor Study. Phase I Overview Report
 Highway 217 Corridor Study Phase I Overview Report November 3, 24 BACKGROUND AND OVERVIEW Study purpose The Highway 217 Corridor Study is developing multi-modal transportation solutions for traffic problems
Craig Rempp, Transit Superintendent Mary Karlsson, Kimley-Horn. Mankato City Council Meeting 6/25/2018
 Craig Rempp, Transit Superintendent Mary Karlsson, Kimley-Horn Mankato City Council Meeting 6/25/2018 What is a Transit Development Plan (TDP)? Engagement Issues Goals, objectives, design guidelines and
Corridor Vision Workshop Summary James Madison Elementary February 22,2018
 Corridor Vision Workshop Summary James Madison Elementary February 22,2018 WHY DEVELOP THIS STUDY? Ogden City is planning for better connectivity and access to jobs and housing. Working with area partners,