Twin CATS Long Range Plan Public Transit Section Working Draft
|
|
|
- Griselda Alexander
- 5 years ago
- Views:
Transcription
1 Twin CATS Long Range Plan Public Transit Section Working Draft March 14,
2 PLEASE NOTE In an effort to gather additional comments and suggestions during the 2040 Long Range Transportation Planning process the Southwest Michigan Planning Commission is making the working draft sections of the plan available to the public. Additional data collection and analysis is still being conducted and this information will be included in the next draft which is to be released mid April Questions or comments can be directed to: Southwest Michigan Planning Commission %TwinCATS MPO 185 E. Main Street Suite 701 Benton Harbor, Michigan Gautam Mani (269) x24 2
3 PUBLIC TRANSIT Over the last four years a comprehensive effort has been made to understand the current role of public transit and mobility in Berrien County. This effort included several transit focused studies that called for the establishment of a structure to build and sustain coordination efforts and for improved integration between countywide rural and small urban service. This was documented in the following completed studies from ; Berrien County Coordinated Human Service Transportation Plan, Berrien County Transit Study, Niles Dial a Ride Transit Study and the Pokagon Band of Potawatomi Transit Study. In 2011 the KFH group was selected to conduct a three year countywide transit consolidation feasibility study with the purpose of identifying opportunities to coordinate or consolidate transit services in Berrien County. The study will provide detailed analysis of the following opportunities: o To allow for additional rider benefits, such as better and increased services with in the County and services that cross county and state boarders. o To provide a more effective mechanism to address regional transportation issues o To provide greater opportunities for the creation of local dedicated funding sources for transit; and o To achieve economies of scale with regard to capital, operating, administrative, and human resources. Since 2010 a Mobility Manager has been in place. Working with the SWMPC and other agencies the Mobility Manager is responsible for short-range planning, management activities and projects for improving coordination among public transportation and other transportation service providers with the intent of expanding the availability of services to people with disabilities, older adults and low-income individuals. How well are transit needs being fulfilled in the St. Joseph Benton Harbor urbanized area? Transit is of critical importance as part of a life-sustaining network for many residents, especially for older adults, people with disabilities and low income households. Twin 3
4 Cities Area Transportation Authority (TCATA) is the public transit agency that serves the communities of Benton Harbor, Benton Township and the City of St. Joseph. There are four independently operated public transit systems spread throughout the county of Berrien. Twin Cities Area Transportation Authority is the designated transit provider in the St. Joseph Benton Harbor UZA and Berrien Bus is the designated rural provider for areas in the county not served by Niles Dial a Ride and Buchanan Dial a Ride. See Map 1.1 Some level of public transit service is provided in 28 of Berrien County s 30 municipalities, townships and villages. However, many of these areas are limited in the amount and frequency of service they receive, especially in more rural areas of the county. The four independently operated transit agencies have combined annual budgets totaling over $3.5 million. Three out of the four transit agencies receive local support in the form of a millage. Many of the life-sustaining needs of elderly, disabled, and low-income residents in Berrien County are being met, but there are large gaps in services that need to be addressed in the future. Economic Growth Public transportation service in the St. Joseph Benton Harbor enhances economic growth in many ways. For example, it can increase the local customer base for a range of services, including shopping malls, medical facilities, and other transportation services (such as Amtrak). Residents interested in attending community colleges or other local educational facilities may gain access to such training opportunities with Today, public transit in Berrien County is generally not geared toward commuting to work. transit service. Availability of public transportation may also increase the ability of human service agencies to serve individuals on public assistance and transport low-income residents to 4
5 jobs, training opportunities, and other support services. Transit can play an important role by providing local recreation-based businesses with an expanded supply of low-skilled workers from surrounding counties. In addition to assisting businesses in meeting their labor demands, transit also helps workers find jobs. While such jobs may be low-wage in nature, they serve as an important source of income to those who otherwise would likely face persistent unemployment. 5

6 Map 1.1 Public Transit Service Areas 6
7 Twin Cities Area Transportation Twin Cities Area Transportation Authority (TCATA) became an authority and began operations in TCATA s original authority and service area consisted of the communities of the City of Benton Harbor, Benton Township, City of St. Joseph, St. Joseph Township and Lincoln Township; all of these communities were members of the authority. Subsequent reductions of member communities in the authority reduced its membership to one community, the City of Benton Harbor. Today, TCATA serves approximately 24,000 residents within a fourteen square mile service area, about fifty two percent of the St. Joseph-Benton Harbor urbanized area. The remaining forty seven percent of the St. Joseph-Benton Harbor urbanized area receives no service from TCATA.1 Communities outside of the St. Joseph-Benton Harbor urbanized area in Berrien County are served by Berrien Bus, Niles Dial a Ride and Buchanan Dial a Ride. Governance The Twin Cities Area Transportation Authority is organized under the Michigan Mass Transportation System Authorities Act 55 of The Authority is governed by a Board of Trustees comprised of members appointed by the City of Benton Harbor including one member of the public residing in the city of Benton Harbor, the city manager (Emergency Financial Manager) two members at large (Area Agency on Aging, Disability Network of Southwest Michigan) and the Executive Director of TCATA. For the exclusive purposes of financing the contractual obligation created by a contract between the City of Benton Harbor and TCATA the City of Benton Harbor passed a levy of.243 mills ($23.43 per $1000) on all real and tangible personal property in the City of Benton Harbor for a period of twenty years in Prior to the current levy, the rate was mills. The revenue generated by this levy is approximately $128,000 per year. See Appendix 1.1 7
8 Funding TCATA s operating costs are covered by a combination of federal, state and local funding as well as passenger fares. The City of Benton Harbor, TCATA s only source of local funds is funded through a twenty year transit millage the city has in place. Figure1.1 shows a breakdown of the sources of TCATA s operating revenue from Figure 1.1 Sources of TCATA Operating Revenue Sources of TCATA Operating Revenue Federal State Local Fare Other $3,500,000 $3,000,000 $2,500,000 $2,000,000 $1,500,000 $1,000,000 $500,000 $ Data Source: National Transit Database Transportation Dependent Populations Transit dependent populations are individuals considered by the transportation profession to be dependent upon public transit based on income, age, or disability. These population characteristics prevent most such individuals from driving and/or owning a reliable automobile, leaving ridesharing, public transit, and other community transportation options as the only other motorized forms of transportation available. 8
9 TCATA s primary service area is comprised of three communities; the City of Benton Harbor, Benton Charter Township and the City of St. Joseph. The three communities have a population of 33,152 people that reside in one of the 13,394 households. A large percentage of the population within the service area can be considered transit dependent and they reside in the City of Benton Harbor and Benton Township. Within the City of Benton Harbor forty two percent households have a median income of under $15,000, and twenty nine percent of Benton Charter Township s household income is under $15,000. The income per capita in the City of Benton Harbor is only $9,745, which includes all adults and children and is the lowest per capita in Michigan. The City of Benton Harbor population s median age is twenty eight, considerably younger than the state of Michigan s median age of thirty nine and the City of St. Joseph median age of forty two. See Table 1.1 Table 1.1 Population People Benton Charter Township City of Benton City of St. Joseph Harbor Population 14,749 10,038 8,365 9,883,640 Pop. Density 456 2,268 2, Pop. Change -8.99% % -4.57% -0.50% Median Age Households 5,913 3,548 3,933 3,872,508 Unemployment % 8.20% 8.20% Rate* Income per Cap. $15,426 $9,745 $27,892 $23,797 Household Income $28,415 $18,970 $39,623 $46,932 US Census 2010, Bureau of Labor Statistics* Financial, legal and age limitations preclude many households in the City of Benton Harbor from owning or operating an automobile. It is not surprising that almost eighteen percent of the households in the City of Benton Harbor and commute using public transit or ridesharing, much higher than the state average of twelve percent. Households in the city of St. Joseph indicated that they never utilize public transit as a commute option, but TCATA driver logs indicate many seniors use public transit to access groceries and some medical services. Using public transit to commute by households in Benton Charter Township was less than one percent. This low 9
10 number is deceiving because according to 2011 TCATA passenger trip data over 24,142 passenger trips were provided in 2011 from origins to destinations within Benton Charter Township. A large majority of the service area s commute time is fifteen minutes or less. For people dependent on transit this short commute time is due to the fact that many entry level service jobs that are accessible by public transit are located in Benton Charter Township. See Table 1.3 Table 1.3 Travel Behaviors Transportation Cityof Benton Harbor BentonCharter Township City of St. Joseph Michigan Commute Time COMMUTE MODE Auto (alone) 71.95% 78.13% 87.76% 82.51% Carpool 14.20% 14.46% 4.72% 9.28% Mass Transit 3.53% 0.61% 0.00% 1.35% Work at Home 3.31% 3.97% 3.78% 3.45% COMMUTE TIME TO WORK Commute Less Than 15 min % 41.88% 59.51% 29.93% Commute 15 to 29 min % 45.16% 29.41% 38.19% Commute 30 to 44 min. 9.11% 8.30% 6.55% 18.92% Commute 45 to 59 min. 1.29% 1.82% 2.09% 7.03% Commute greater than % min. 2.83% 2.45% 5.93% US Census A large percentage of the City of Benton Harbor and Benton Township population is employed in the service sector and warehousing and transportation occupations. Statewide thirty two percent of workforce is employed in those sectors and that number is almost doubled in Benton Harbor and Benton Township. The majority of these occupations require shifts that begin or end after TCATA s hours of operation and many times public transit is not a commute option. See Table
11 Table 1.4 Populations by Occupation City of Benton Harbor Benton City of Michigan Charter St. Township Joseph POPULATION BY OCCUPATION Management, Business, and Financial 3.94% Operations 7.69% 12.67% 12.63% Professional and Related Occupations 6.22% 11.01% 26.89% 20.10% Service 26.99% 17.68% 13.52% 14.18% Sales and Office 22.74% 24.43% 25.57% 25.55% Farming, Fishing, and Forestry 0.57% 1.39% 0.25% 0.46% Construction, Extraction, and Maintenance 5.96% 6.47% 6.49% 9.21% Production, Transportation & Material 33.61% 31.35% % Moving US Census In order to bring workers and industries together, the state continues to focus programs and initiatives centered on workforce development. Lake Michigan College plays an integral role in those initiatives. There are several programs in place at LMC to ensure more students and adults can access a college education and the increased earnings potential it provides. LMC 2012 enrollment indicated that over 20 percent of their students reside in Benton Harbor and Benton Township while over 60 percent of the enrollment resides within the TwinCATS study area. TCATA currently provides demand response service from origins located in the City of Benton Harbor, Benton Township and the City of St. Joseph to LMC. It is ranked in the top five demand response destinations within TCATA s service area. See Appendix 11
12 Community Mobility Options for Older Adults Reductions in mortality have resulted in increases in life expectancy that have contributed to the growth of the elderly population, especially in the oldest age brackets. This is in contrast to the early days of our nation when high fertility and high mortality kept the nation young. A century ago in 1910 life expectancy at birth was a mere 46 years for boys and 48 years for girls.3 Today, life expectancy at birth is 75 for boys and 80 for girls.4 Many citizens in the region can expect to live well beyond retirement. In fact, more and more people in the region are in their 70s, 80s and 90s. Differences among older adults must be taken into account. The older adult population is the most diverse of all age groups. In particular, people between the ages of sixty and seventy can quite a different set of needs when compared with people age eighty and above. A Michigan Department of Transportation demographic analysis and survey found that older adults age eighty and older reported lower levels of health and functioning, drove less and closer to home and were more likely to think there was a chance their driving ability could become a problem within the next five years. In addition, their participation in outside activities was limited and they also reported a higher level of perceived isolation. Insert Senior population data here - By community For older adults who are unable or choose not to drive, support for community transportation options will become increasingly important. A number of services are available to meet some of the needs of older adults who no longer drive and still require or desire mobility. They include TCATA, Amtrak, Berrien Bus and Greyhound. There is limited supplemental transportation available within the study area that specifically provides service to older adults. Adults sixty years and older can receive services from seven independently operated senior service centers and meal sites located Neither traditional public transit services nor special demand services will come anywhere near meeting mobility needs of the country s aging population. American Society in Aging throughout Berrien County. Each of the seven centers is supported financially by a countywide 12
13 senior millage that provides approximately two million dollars annually in funding. This funding helps support activities, transportation and facilities. Each of senior centers provides transportation services to older adults in its service area. However, the frequency and service area varies from one senior center to the next. For example, an older adult who resides in the Niles Senior Service area has access to countywide and cross-county transportation services, while someone who lives in the Benton Harbor or St. Joseph senior services area only has access to destinations in Benton Harbor and St. Joseph. See Table 1.5. There is little or no coordination that takes place between the seven centers in the provision of transportation services, leaving some residents with very limited transportation options. 13
14 Table 1.5 Berrien County Senior Service Providers Senior Center / Origins Destinations Center Hours Transportation Hours Number of Vehicles Popular Destinations Benton Harbor Senior Center Benton Harbor, Benton Twp. St. Joseph, Royalton Twp. Lincoln Twp. St. Joseph Twp. City of Benton Harbor Benton Twp. Monday-Friday 8:00-4:30pm Monday-Friday 9:00-4:00pm Three 12 passenger vans (One lift equipped) Lakeland Hospital Napier Royalton City of Buchanan Senior Center City of Buchanan, Buchanan Township City of Buchanan City of Benton Harbor Bertrand Twp. Battle Creek Niles Twp. Monday-Friday 9:00am-4:00pm Monday-Friday 9:00am-4:00pm One 5-6 passenger van Lakeland Hospital Niles Central County Senior Center Berrien Twp. Sodus Twp., Oronoko Twp. Pipestone Twp. Berrien Twp. Baroda Twp, Village of Baroda Village Berrien Springs Berrien County, Kalamazoo, Battle Creek Monday-Friday 8:30am-4:30pm Monday-Friday 8:30am-4:30pm Five vehicles ranging in size from 7 passenger to 24 passenger (One lift equipped) Lakeland Hospital - Napier Royalton Meijer Benton Harbor Niles Senior Center City of Niles, City of Buchanan, Niles Twp. City of Niles City of Buchanan Battle Creek (hospital) South Bend Medical destinations. Monday-Friday 8:00am-4:00pm Monday-Friday 8:00am-4:00pm One 4-5 passenger mini vans Lakeland Hospital Niles South Bend Medical North Central Senior Services City of Coloma, Coloma Twp, Hagar Twp, Watervliet Twp, City of Watervliet Berrien County Monday-Friday 8:00am-4:00pm Monday-Friday 9:00am-3:00pm Two 6 passenger vans One 4 passenger sedan Royalton Watervliet Meijer - Benton Harbor St. Joseph Lincoln Senior Services City of St. Joseph, St. Joseph Charter Twp. Lincoln Twp. Royalton Twp. Village of Stevensville City of St. Joseph, St. Joseph Twp. Lincoln Twp. Royalton Twp. Village of Stevensville Benton Twp. City of Benton Harbor Monday-Friday 8:00am-4:00pm Monday-Friday 9:00 am- Noon One 12 passenger bus One 7 passenger van One 5 passenger suv Lakeland Hospital Napier Royalton River Valley Senior Services City of New Buffalo Three Oaks Twp. Galien Twp. Lake Twp. City of Bridgeman New Buffalo Three Oaks Galien Twp. Lake Twp. Bridgeman,St. Joseph Watervliet, Battle Creek, Benton Harbor Royalton Twp. Monday-Friday 9:00am-4:00pm Monday-Friday 9:00am-4:00pm One 12 passenger van Lakeland Hospital, Meijer - Stevensville 14
15 System Operating Data The TCATA operating data summarized below in Table 1.6 provides five year overview of the combined operating data for demand response and fixed route service. The average increase in TCATA public transit ridership was 16 percent between , while passenger miles service averaged an increase of about 6 percent. Over the same five year period TCATA experienced a 4 percent decrease in passengers per revenue hour with a 5 percent increase in the number of service revenue hours. Table 1.6 System Operating Data for All Services Unlinked Trips Unlinked Trips Annual Revenue Miles Vehicle Hours Fiscal Year , , ,722 34, , , ,892 35, , , ,656 39, , , ,795 49, , , ,635 46,511 Source: FTA National Transit Data Base Changes in operating data can be impacted by changes in hours, operations, new or discontinued services. Table 1.7 below provides an overview of the changes in service that have taken place during the FY time period. 15
16 Table 1.7 TCATA Service Changes Mode of Service Demand Response Blue Route Red Route Green Route Service Prior FY Service Changes FY Hours Hours Hours Monday - Friday 6:00 am - 6:00 pm Saturday 8:00 am - 4:00 pm Monday - Friday 8:00 am - 5:00 pm Saturday 8:00 am - 4:00 pm Monday - Friday 6:00 am - 6:00 pm Saturday 8:00 am - 4:00 pm Monday - Friday 6:00 am - 10:00 pm Saturday 8:00 am - 10:00 pm Monday - Friday 6:00 am - 6:00 pm Saturday 8:00 am - 3:00 pm Monday - Friday 8:00 am - 5:00 pm Saturday 8:00 am - 10:00 pm Service Changes FY Monday - Friday 6:00 am - 6:00 pm Saturday 8:00 am - 3:00 pm Monday - Friday 6:00 am -10:00 pm Saturday 8:00 am - 10:00 pm Monday - Friday 6:00 am -10:00 pm Saturday 8:00 am - 10:00 pm Eliminated During FY 2007 and 2008 the Blue route was the only fixed route service provided by TCATA. During that time period the Blue route utilized two vehicles to provide service every thirty minutes and operated nine hours per day Monday through Friday and seven hours per day on Saturdays. In FY 2009 a Job Access Reverse Commute grant was awarded to increase the Blue route s hours of service by seven hours during the week and seven hours on Saturday. A grant from the same source in FY2009 also provided funding in the amount of $280,000 to support a new fixed route that utilized one vehicle and mirrored the extended hours of the blue route. A third route (Green) was created during FY 2009 and operated nine hours per day on week days. The route was discontinued in the middle of FY
17 Figure 1.2 Fixed Route Ridership Fixed Route Service: Trends in Ridership 40,000 35,000 30,000 25,000 20,000 15,000 10,000 5,000-33,370 24,008 23,203 18,340 18, Data Source: National Transit Database Add additional analysis here Table 1.3 Demand Response Service Ridership Demand Response Service: Trends In Ridership 200, , , , ,000 75,000 50,000 25, , , , , , Data Source: National Transit Database
18 The Federal Transit Administration and the Michigan Department of Passenger Transportation evaluate public transit services for both efficiency (doing things right) and effectiveness (doing the right things). Efficiency is usually analyzed by operating cost per hour, per mile or cost per passenger trip. Effectiveness emphasized by passenger productivity is usually analyzed by passenger trips per mile or hour. TCATA measures vehicle hours based on the hours that a vehicle is scheduled or actually travels from the time it pulls out from its garage to go into revenue service to the time it pulls in from revenue service. Figure 1.4 Productivity Trends: Demand Reponse Service Productivity (Pass/RevHours) Data Source: National Transit Database According to the ridership operating data provided above, the demand response service has decreased over the last three years. On a national level, the average demand response passenger per hour productivity goal is at least two passengers per hour. The above higher than average ridership per hour for TCATA demand response service is likely due to the population density of the core ridership from the City of Benton Harbor and parts of Benton Township. In many parts of TCATA s service area there is a duplication of service where both demand response service and fixed routes service the same area. Customers refer to the scheduled fixed route service as the special service and the demand response service as the regular service. This is counter to operations of most transit systems that typically encourage customers to ride fixed route 18
19 services and only provide demand response type service for customers unable to access scheduled fixed route services. Typically in small urban areas more extensive scheduled services are operated than are currently in place within TCATA s service area.3 Figure 1.5 Productivity Trends: Fixed Route Service Productivity (Pass/RevHour) Data Source: National Transit Database TCATA s fixed route productivity based on trips per hour is below the industry norms. This may be in part a result of areas in Benton Harbor and Benton Township where there is both fixedroute and Dial-A-Ride service. During FY 2007 and 2008 the blue route was the only fixed route service provided by TCATA. During that time period the Blue route utilized two vehicles to provide service every thirty minutes and operated nine hours per day Monday through Friday and seven hours per day on Saturdays. Data indicates that in FY 2009 and FY 2010 when three fixed routes were in place, trips per revenue hour increased by two people per hour from FY Red Route Route Description The Red Route operates Monday through Friday from 6:00 am 10:00 pm and on Saturday from 8:00 am 10:00 pm. This hourly one way loop route originates in the City of Benton 19
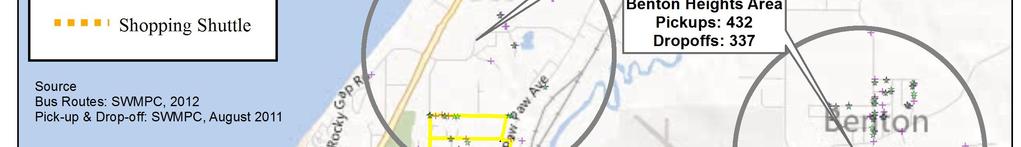
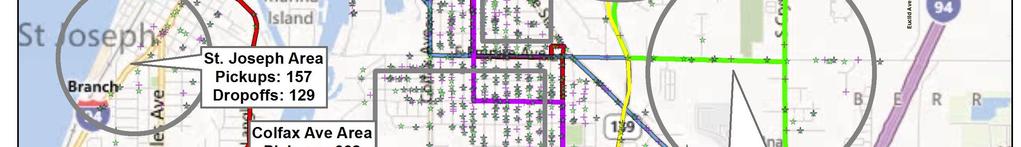
20 Harbor at Union, an area with higher than average poverty rates, unemployment and no access to a vehicle. Along the route there are several clusters of entry level employment opportunities and life sustaining services including Lakeland Hospital, Berrien County Court House, Michigan WORKS and two large grocery stores. The Red Route also offers an option to flex to locations along the route if the route is on schedule. Based on 2012 annual data, the red route served four passengers per hour and the annual ridership was 19,196 A contributing factor to the low ridership per hour is the routes length, the one way loop configuration and the lack of sidewalk infrastructure along several segments of the route. This route is funded through FTA JARC 5316 funds since Route Characteristics The Red Route has been in service since December 2009 and since that time the route has experienced consistent growth in ridership. Ridership is most productive along the Lakeshore Drive/BL 94 segment and at the TCATA headquarters where customers can transfer from the Blue Route. See Figure 1.6 The segment of the route that has lowest productivity is the portion between Meijer stop and the Briarwood stop in Benton Township. Ten minutes of the route is used in this segment traveling on I-94 where it exits at M139 near the MDOT Interstate bus terminal and the MDOT carpool parking lot. Typically, in a loop route configuration the number of ons and offs at each stop are equal, as people ride around the loop to reach their destinations. The Red Route does not have this pattern, which could indicate people are utilizing this route for only one leg of their trip. 20
21 Route Pickups and Drop offs By Segment (INSERT MAP HERE BEFORE CHARTS BELOW) Figure 1.6 Red Route Segment Data Red Route Pickups By Segment Red Route Drop Off By Segment Base Downtown Benton Harbor Downtown St. Joseph Base Downtown Benton Harbor Downtown St. Joseph 300 Langley Segment 500 Langley Segment 250 Lakeland Hospital 400 Lakeland Hospital 200 Niles - Hilltop Segment Niles - Hilltop Segment Pickups Lakeshore Drive (BL94) Segment I-94-Nikerson Segment Union Segment Empire Segment Broadway Segment 0 Drop Offs Lakeshore Drive (BL94) Segment I-94-Nikerson Segment Union Segment Empire Segment Broadway Segment Blue Route Route Description The Blue Route operates Monday through Friday from 6:00 am 10:00 pm and on Saturday from 8:00 am 10:00 pm. This hour loop route originates in the City of Benton Harbor at TCATA headquarters and provides services to several housing developments, social service agencies and retail locations. The route is serviced by two vehicles that leave on the hour and half hour. The majority of stops along the route receive service every thirty minutes with the exception of Intercare, DHS and River Terrace which receive service every fifteen minutes with inbound and outbound stops. The Blue Route also offers an option to flex to locations along the route if the route is on schedule. The early morning (6:00 am 8:00 am) and the late night 21
22 (6:00 pm -10:00 pm) portion of this route s hours have been funded through FTA JARC 5316 funds since 2009, but in 2015, funding from this program will no longer be available. Based on 2012 annual data, the Blue route served almost four passengers per hour and the annual ridership was 32,294. Contributing factors to the low ridership per hour are the route s use of two vehicles to provide the service every thirty minutes, and the lack of sidewalk infrastructure along several segments of the route in Benton Township on M139, Mall Drive and Pipestone. Route Characteristics Insert analysis and narrative here Potential for Additional Fixed Routes and Improved Pedestrian Connectivity Many transit trips require pedestrian or bicycle connections. In addition to having well-planned routes, a good transit system provides its riders with safe, accessible stops. To encourage active use of the current TCATA routes and any planned future routes, a network of sidewalks bike lanes or shared use paths could connect transit stops to neighborhoods and popular destinations and improve the efficiency of the fixed routes. It would be increase the efficiency if the bus stops were located adjacent to the corridor. Unfortunately the current stops within the townships of Benton and St. Joseph require the bus to pull of the route onto private property to pick up passengers. Currently there is a lack of pedestrian and bicycle connections along several corridors forcing public transit to place fixed route stops on private property that off the corridor. This lack of infrastructure increases several things including the route length and time of the route. Table. below illustrates corridors within the TwinCATS study area that exhibit strong indicators of need and opportunity for fixed route transit service. These indicators include population density, employment density, activity centers, demographic characteristics associated with transit dependency and large volume of existing riders. 22
23 Table. Corridors Exhibiting Need and Opportunity for Fixed Route Service Corridor From To Jurisdiction Responsible Agency Mall Drive M-139 Pipestone Ave Benton Township Berrien Road Commission Hilltop Road Niles Ave. Lakeshore Drive (BL94) Napier Ave. City of St. Joseph, St. Joseph Twp. Miami Road Pipestone Ave City of St. Joseph, St. Joseph Twp. Benton Twp. Berrien Road Commission, City of St. Joseph Berrien Road Commission M 139 Britain Ave. Nickerson Ave. Benton Twp Berrien Road Commission, MDOT Fair Ave. Martin Luther King Britain Ave. Territorial Road Benton Twp. City of Benton Harbor Britain Ave. Territorial Road Benton Twp. City of Benton Harbor Berrien Road Commission, Benton Harbor Berrien Road Commission Strategies Use current demand-response services more efficiently to expand capacity of current services offered to individuals who need human service and specialized transportation by integrating countywide rural service, small urban dial-a-ride services, and fixed-route services. There is an existing demand for transportation that is not currently being met because of capacity restraints. This demand is anticipated to grow tremendously over time, yet services will remain constrained because of a lack of funding and/or the lack of political will to provide additional funding. As such, it is up to human service agencies and transportation service providers to make strategic decisions that can help stretch available dollars, making their services operate more efficiently while at the same time maintaining acceptable levels of service. 23
24 Integrating both demand-response service (for seniors and disabled persons) and fixed-route services (for able-bodied riders) can be a cost-effective way to reduce the number of general public demandresponse trips. With the reduction in general public demand response trips there is additional capacity to provide rides to those individuals who require specialized transportation. With this in mind, proposed conceptual routes have been created (See Map 1.3), including a combination of fixed routes in higher density areas and flex-route service in lower density areas with scheduled transfer points throughout the service area. The service recommendations have been developed utilizing TCATA demand response service driver log data to identify popular destinations and origins. Beyond the high density activity corridors, there are other key travel patterns that indicate opportunities for public transit. Consultation with the management of Berrien Bus indicated that many of their Contract Routes could support a bus feeder system connecting rural passengers to fixed route services. See Map 1.2 The goal of all of these new service concepts is to provide an optimized route structure to increase the ability of public transit to accommodate trips between cities in rural and urban areas in Berrien County. Make fixed routes more accessible, thereby decreasing rider dependence on demandresponse service, by creating a pedestrian- and bicycle-friendly infrastructure that will encourage people to walk and bicycle to transit stops. To promote and maintain active lifestyles, people need a variety of transportation options beyond personal automobiles, including walking, bicycling, and public transit. As state and local agencies design transportation systems, it is critical to provide routine accommodation for all users of the roadway, including pedestrians, bicyclists, individuals with disabilities, seniors, users of public transportation, and motorists. This is particularly important for seniors, since elderly populations are increasing. Implement complete streets policies to provide for the safe and convenient travel of all users of the roadway, including pedestrians, bicyclists, public transit users, motorists, children, seniors, and people with disabilities. Complete streets is a design strategy to ensure that all roads provide routine accommodation for all users, including bicyclists, transit users, and 24
25 pedestrians of all ages and abilities. This is done by including or enhancing pedestrian and bicycle infrastructure during routine road maintenance and repair, new construction, and redesign. Comprehensive complete streets solutions include: 1) traffic calming measures, such as widening sidewalks, raising medians, and narrowing roadways; 2) placing bus stops in a safe and convenient environment; and 3) making various improvements (e.g., refuge medians) for disabled travelers all of which play a role in reducing the number of crashes and reducing pedestrian risk of injury. Map 1.2 Rural Connector Service Concept (Berrien Bus/Rural & TCATA) 25
26 Map 1. Current and Proposed Fixed Routes to Reduce Need for Demand Response Service 26


27 27
28 Add conclusion here 28
29 APPENDIX 29
30 30
31 31
32 letter concerning the cooperative distribution of Federal Transit Administration (FTA) formula funds to Berrien Bus and Twin Cities Area Transportation Authority operating in the Benton Harbor Urbanized Area. *The service area population is larger than TCATA s reported service population. This is due to a non-urbanized portion of Benton Township that is not served by TCATA. For the purpose of this plan the population from the US Census will be used for this section Berrien County Transit Consolidation Feasibility Study Technical Memorandum No. 1: Evaluation of Current Operations 32
33 LETTER OF AGREEMENT BETWEEN BERRIEN COUNTY AND TWIN CITIES AREA TRANSPORTATION AUTHORITY. June 16, 2011 Bill Purvis, Director: The purpose of this letter is to set forth in writing the understanding between the County of Berrien, as operators of Berrien County s transit system (BerrienBus), and the Twin Cities Area Transportation Authority (TCATA), as operators of TCATA Dial-A-Ride, concerning the cooperative distribution of Federal Transit Administration (FTA) formula funds to the two transit agencies operating in the Benton Harbor Urbanized Area. This letter of understanding shall be renewed on an annual basis unless the County of Berrien and TCATA mutually agree to a longer term. This understanding, based on discussions between the two systems, is to use a local urban-area apportionment methodology parallel to that used in the annual apportionment of funds from the FTA to the State of Michigan for the urban transit agency formula program. The FTA provides formula funding to urban transit agencies based upon decennial census population and population density numbers. These decennial numbers are combined with an annual factor to determine funding to the State of Michigan for each urbanized area. By this understanding, the County of Berrien and TCATA will similarly utilize the population of their respective transit system service areas to determine the share of funding available to each entity. Funding which is available, but which is based on population not served by one of the two transit agencies will be split equally between the two until such time as service area boundaries change so that the populations within any service area change by 5% or more, at which time the corrected population figures will be used and the percentage adjusted accordingly. On an annual basis either system may decline their share of funding for the unserviced area and allow the other system to use 100% of the available funding for that area. Using this methodology and 2010 Census figures, the distribution formula for FY 2011 is set out as follows: Total Benton Harbor Urbanized Area Population 60,386 persons TCATA Urban Service Area Population 31,819 persons = 52.69% of available funds Berrien County s transit system Service Area Population -- 0 persons = 0% of available funds Unserviced Urban Population 28,567 persons = 47.30% of available funds For FY 2011 Berrien County declines their share of funding for the unserviced portion of the urbanized area. This permits TCATA to obtain 100% of the available funding for the Benton Harbor Urbanized Area for FY Sincerely, Dave Pagel, Chairman Date Twin Cities Area Date Board of Commissioners Transportation Authority Berrien County M. Louise Stine, County Clerk Date 33
34 34
PASER Road Survey. For Berrien County, Michigan
 The State of Michigan Transportation 2003-2014 PASER Road Survey For Berrien County, Michigan Prepared by the Southwest Michigan Planning Commission 376 W Main St Benton Harbor, MI 49022 (269) 925-1137
PASER Road Survey. For Berrien County, Michigan
 The State of Michigan Transportation 2003-2010 PASER Road Survey For Berrien County, Michigan Prepared by the Southwest Michigan Planning Commission 185 E. Main St. Suite 701 Benton Harbor, MI 49022 (269)
Typical Rush Hour Commute. PennyforTransportation.com
 Typical Rush Hour Commute In the News Overview of the Plan Collaborative plan with projects in every community Prioritizing connectivity and congestion relief Dedicated transportation-specific funding;
Exhibit 1 PLANNING COMMISSION AGENDA ITEM
 Exhibit 1 PLANNING COMMISSION AGENDA ITEM Project Name: Grand Junction Circulation Plan Grand Junction Complete Streets Policy Applicant: City of Grand Junction Representative: David Thornton Address:
2012 Transit Study Randolph County
 2012 Transit Study Randolph County Appendix B Technical Memorandum 2011 Transportation Survey Prepared for: Randolph County Housing Authority Country Roads Transit Submitted by: July 1, 2012 Table of Contents
TRANSIT & NON-MOTORIZED PLAN DRAFT FINAL REPORT Butte County Association of Governments
 1 INTRODUCTION Maintaining a high quality of life is the essence of this plan for transit and non-motorized transportation in Butte County. Curbing greenhouse gas emissions (GHG) by reducing congestion,
Proposed. City of Grand Junction Complete Streets Policy. Exhibit 10
 Proposed City of Grand Junction Complete Streets Policy Exhibit 10 1 City of Grand Junction Complete Streets Policy Vision: The Complete Streets Vision is to develop a safe, efficient, and reliable travel
THE I-79 CORRIDOR. I-79 provides motorists with connections to the following major highways: I-80, PA 358, PA 965 and PA 208.
 The I-79 Corridor Pittsburgh to Erie Regional Thruway I-79 was constructed through Mercer County in the early 1960s. The portion north of PA 965 opened in 1961 and the segment south of PA 965 the following
APPENDIX C. Systems Performance Report C-1
 APPENDIX C Systems Performance Report C-1 System Performance Report & Requirements According to the FAST Act, a long range transportation plan needs to include a system performance report and subsequent
Chapter 5 Future Transportation
 Chapter 5 Future Transportation The Future Land Use Plan identifies the desired land use designations. The land uses desired for Crozet depend, in large part, on the success of the transportation system,
Transportation Master Plan Advisory Task Force
 Transportation Master Plan Advisory Task Force Network Alternatives & Phasing Strategy February 2016 BACKGROUND Table of Contents BACKGROUND Purpose & Introduction 2 Linking the TMP to Key Council Approved
Regional Transportation Needs Within Southeastern Wisconsin
 Regional Transportation Needs Within Southeastern Wisconsin #118274 May 24, 2006 1 Introduction The Southeastern Wisconsin Regional Planning Commission (SEWRPC) is the official areawide planning agency
Rochester Area Bike Sharing Program Study
 roc bike share Rochester Area Bike Sharing Program Study Executive Summary ~ January 2015 JANUARY 2015 8484 Georgia Avenue, Suite 800 Silver Spring, MD 20910 3495 Winton Pl., Bldg E, Suite 110 Rochester,
City of Davenport CitiBus Public Transportation Study. April 2015
 City of Davenport CitiBus Public Transportation Study April 2015 Overview Project Background Key Findings CitiBus Service Allocation Policy Discussion 2 Project Background 3 About CitiBus Operates 17 routes
A Matter of Fairness: ROCOG s Environmental Justice Protocol. What is Mobility Limitation?
 No Person Left Behind What is Mobility Limitation? What is the Access Limitation? Environmental Justice population should be provided adequate mobility & access to meet their needs; Identify acceptable
Tulsa Metropolitan Area LONG RANGE TRANSPORTATION PLAN
 Tulsa Metropolitan Area LONG RANGE TRANSPORTATION PLAN Indian Nations Council of Governments August 2005 CONTACTING INCOG In developing the Destination 2030 Long Range Transportation Plan, INCOG s Transportation
CITY OF COCOA BEACH 2025 COMPREHENSIVE PLAN. Section VIII Mobility Element Goals, Objectives, and Policies
 CITY OF COCOA BEACH 2025 COMPREHENSIVE PLAN Section VIII Mobility Element Goals, Objectives, and Policies Adopted August 6, 2015 by Ordinance No. 1591 VIII MOBILITY ELEMENT Table of Contents Page Number
Develop a Multi-Modal Transportation Strategy (Theme 6)
") DEVELOP A MULTI-MODAL TRANSPORTATION STRATEGY (THEME 6) WHY IS THIS THEME ADDRESSED? Develop a Multi-Modal Transportation Strategy (Theme 6) Statement of Ideal Reduce resident and visitor reliance on single
DEVELOP A MULTI-MODAL TRANSPORTATION STRATEGY (THEME 6) WHY IS THIS THEME ADDRESSED? Develop a Multi-Modal Transportation Strategy (Theme 6) Statement of Ideal Reduce resident and visitor reliance on single
Guidelines for Providing Access to Public Transportation Stations APPENDIX C TRANSIT STATION ACCESS PLANNING TOOL INSTRUCTIONS
 APPENDIX C TRANSIT STATION ACCESS PLANNING TOOL INSTRUCTIONS Transit Station Access Planning Tool Instructions Page C-1 Revised Final Report September 2011 TRANSIT STATION ACCESS PLANNING TOOL INSTRUCTIONS
Corpus Christi Metropolitan Transportation Plan Fiscal Year Introduction:
 Introduction: The Safe, Accountable, Flexible, Efficient Transportation Equity Act: A Legacy for Users (SAFETEA-LU) has continued the efforts started through the Intermodal Surface Transportation Efficiency
Transportation Trends, Conditions and Issues. Regional Transportation Plan 2030
 Transportation Trends, Conditions and Issues Regional Transportation Plan 2030 23 Regional Transportation Plan 2030 24 Travel Characteristics Why Do People Travel? Over one-half of trips taken in Dane
PLEASE NOTE. Questions or comments can be directed to: Southwest Michigan Planning Commission. 185 E. Main Street Suite 701
 PLEASE NOTE In an effort to gather additional comments and suggestions during the 2040 Long Range Transportation Planning process the Southwest Michigan Planning Commission is making the working draft
CITY OF BLOOMINGTON COMPLETE STREETS POLICY
 CITY OF BLOOMINGTON COMPLETE STREETS POLICY POLICY OBJECTIVE: The City of Bloomington will enhance safety, mobility, accessibility and convenience for transportation network users of all ages and abilities,
January Project No
 January 13 2015 Project No. 5070.05 Neil Connelly, Director University of Victoria, Campus Planning and Sustainability PO Box 1700 STN CSC Victoria, BC V8P 5C2 Dear Neil: Re: UVic 2014 Traffic Final Report
ACTIVE TRANSPORTATION/NONMOTORIZED TRANSPORTATION
 ACTIVE TRANSPORTATION/NONMOTORIZED TRANSPORTATION BACKGROUND Active transportation, also known as nonmotorized transportation, is increasingly recognized as an important consideration when planning and
Circulation in Elk Grove includes: Motor vehicles, including cars and trucks
 Circulation, as it is used in this General Plan, refers to the many ways people and goods move from place to place in Elk Grove and the region. Circulation in Elk Grove includes: Motor vehicles, including
Capital Bikeshare 2011 Member Survey Executive Summary
 Capital Bikeshare 2011 Member Survey Executive Summary Prepared by: LDA Consulting Washington, DC 20015 (202) 548-0205 June 14, 2012 EXECUTIVE SUMMARY Overview This report presents the results of the 2012
NM-POLICY 1: Improve service levels, participation, and options for non-motorized transportation modes throughout the County.
 Transportation PRINCE WILLIAM COUNTY 2008 COMPREHENSIVE PLAN NON-MOTORIZED PLAN CONTENTS Goals, Policies, and Action Strategies Table 4 (Bike Facility Classifications and Descriptions) Table 5 (Bike Facility
1999 On-Board Sacramento Regional Transit District Survey
 SACOG-00-009 1999 On-Board Sacramento Regional Transit District Survey June 2000 Sacramento Area Council of Governments 1999 On-Board Sacramento Regional Transit District Survey June 2000 Table of Contents
o n - m o t o r i z e d transportation is an overlooked element that can greatly enhance the overall quality of life for the community s residents.
 N o n - m o t o r i z e d transportation is an overlooked element that can greatly enhance the overall quality of life for the community s residents. 84 Transportation CHAPTER 11 INTRODUCTION Transportation
Solana Beach Comprehensive Active Transportation Strategy (CATS)
") Solana Beach Comprehensive Active Transportation Strategy (CATS) 3.0 Goals & Policies The Solana Beach CATS goals and objectives outlined below were largely drawn from the Solana Beach Circulation Element
Solana Beach Comprehensive Active Transportation Strategy (CATS) 3.0 Goals & Policies The Solana Beach CATS goals and objectives outlined below were largely drawn from the Solana Beach Circulation Element
2015 Florida Main Street Annual Conference. Complete Streets Equal Stronger Main Streets
 WHAT ARE COMPLETE STREETS? CASE STUDIES COMPLETING YOUR MAIN STREET 2015 Florida Main Street Annual Conference St. Petersburg, Florida August 19, 2015 WHAT ARE COMPLETE STREETS? CASE STUDIES COMPLETING
ADOT Statewide Bicycle and Pedestrian Program Summary of Phase IV Activities APPENDIX B PEDESTRIAN DEMAND INDEX
 ADOT Statewide Bicycle and Pedestrian Program Summary of Activities APPENDIX B PEDESTRIAN DEMAND INDEX May 24, 2009 Pedestrian Demand Index for State Highway Facilities Revised: May 29, 2007 Introduction
Goal 3: Foster an environment of partnerships and collaboration to connect our communities and regions to one another.
 Non-Motorized Transportation Plan (NMTP) Draft Vision, Goal and,, Tri-County Regional Planning Commission (TCRPC) Purpose The purpose of the Tri-County Regional Planning Commission (TCRPC) Non-Motorized
2010 Pedestrian and Bicyclist Special Districts Study Update
 2010 Pedestrian and Bicyclist Special Districts Study Update Pedestrian and Bicyclist Special Districts Program Overview H-GAC s Special Districts Program aims to provide strategic investments in pedestrian
92% COMMUTING IN THE METRO. Congested Roadways Mode Share. Roadway Congestion & Mode Share
 COMMUTING IN THE METRO Roadway Congestion & Mode Share The majority of major roadways in Greater Des Moines are without congestion and have underutilized capacity. This surplus capacity could be used for
Travel and Rider Characteristics for Metrobus
 Travel and Rider Characteristics for Metrobus 040829040.15 Travel and Rider Characteristics for Metrobus: 2012-2015 Overview The Miami Dade County Metropolitan Planning Organization (MPO) conducted a series
Madison Urban Area and Dane County. Bicycle Transportation Plan Summary. September Introduction. Bicycle Plan Scope and Planning Process
 Bicycle Transportation Plan Summary Madison Urban Area and Dane County Introduction September 2000 Bicycling is an important mode of transportation in the Madison urban area and countywide that is available
WILMAPCO Public Opinion Survey Summary of Results
 Wilmington Area Planning Council WILMAPCO Public Opinion Survey Summary of Results Prepared by: 2955 Valmont Road, Suite 300 Boulder, Colorado 80301 t: 303-444-7863 f: 303-444-1145 www.n-r-c.com Table
Pocatello Regional Transit Master Transit Plan Draft Recommendations
 Pocatello Regional Transit Master Transit Plan Draft Recommendations Presentation Outline 1. 2. 3. 4. What is the Master Transit Plan? An overview of the study Where Are We Today? Key take-aways from existing
Central Jersey Transportation Forum. March 2007
 Central Jersey Transportation Forum March 2007 Feasibility Analysis of BRT on Dinky Right of Way from Princeton Station to Alexander Rd. in West Windsor (west of Rt. 1) Study spurred by Princeton University's
Chapter 7. Transportation. Transportation Road Network Plan Transit Cyclists Pedestrians Multi-Use and Equestrian Trails
 Chapter 7 Transportation Transportation Road Network Plan Transit Cyclists Pedestrians Multi-Use and Equestrian Trails 7.1 TRANSPORTATION BACKGROUND The District of Maple Ridge faces a number of unique
MASTER BICYCLE AND PEDESTRIAN PLAN
 VILLAGE OF NORTHBROOK MASTER BICYCLE AND PEDESTRIAN PLAN DRAFT PLAN OPEN HOUSE May 2, 2018 AGENDA 1. Community Engagement 2. Vision and Goals 3. General Structure of Plan 4. Recommendations Overview 5.
The Route 29 Corridor Study was initiated at the request of Virginia s Commonwealth
 CHAPTER 2: Study Background and approach The Route 29 Corridor Study was initiated at the request of Virginia s Commonwealth Transportation Board in response to requests from members of the General Assembly
Non-Motorized Transportation 7-1
 Non-Motorized Transportation 7-1 Transportation facilities no longer mean just accommodating a vehicle powered by a combustion engine. Pedestrian and non-motorized facilities are important modes of travel
Purpose and Need. Chapter Introduction. 2.2 Project Purpose and Need Project Purpose Project Need
 Chapter 2 Purpose and Need 2.1 Introduction The El Camino Real Bus Rapid Transit (BRT) Project (Project) would make transit and other transportation improvements along a 17.6-mile segment of the El Camino
SUMMARY OF TRANSPORTATION INVESTMENTS
 Santa Cruz County 2016 Measure D: Transportation Improvement Expenditure Plan - Approved by over 2/3 of Santa Cruz County voters on November 8, 2016 - Overview Measure D, the 2016 Transportation Improvement
RESOLUTION NO ?? A RESOLUTION OF THE CITY OF NEPTUNE BEACH ADOPTING A COMPLETE STREETS POLICY
 RESOLUTION NO. 2018-?? A RESOLUTION OF THE CITY OF NEPTUNE BEACH ADOPTING A COMPLETE STREETS POLICY WHEREAS, safe, convenient, and accessible transportation for all users is a priority of the City of Neptune
Chapter 2. Bellingham Bicycle Master Plan Chapter 2: Policies and Actions
 Chapter 2 Bellingham Bicycle Master Plan Chapter 2: Policies and Actions Chapter 2: Policies and Actions The Bicycle Master Plan provides a road map for making bicycling in Bellingham a viable transportation
APPENDIX 2 LAKESHORE ROAD TRANSPORTATION REVIEW STUDY EXECUTIVE SUMMARY
 APPENDIX 2 LAKESHORE ROAD TRANSPORTATION REVIEW STUDY EXECUTIVE SUMMARY Appendix 2 City of Mississauga Lakeshore Road FINAL REPORT Transportation Review Study December 2010 EXECUTIVE SUMMARY Study Purpose
Briefing Paper #1. An Overview of Regional Demand and Mode Share
 2011 Metro Vancouver Regional Trip Diary Survey Briefing Paper #1 An Overview of Regional Demand and Mode Share Introduction The 2011 Metro Vancouver Regional Trip Diary Survey is the latest survey conducted
SANTA CLARA COUNTYWIDE BICYCLE PLAN August 2008
 SANTA CLARA COUNTYWIDE BICYCLE PLAN August 2008 To assist VTA and Member Agencies in the planning, development and programming of bicycle improvements in Santa Clara County. Vision Statement To establish,
Bikeway action plan. Bicycle Friendly Community Workshop March 5, 2007 Rochester, MN
 Bikeway action plan Summary The was held on March 5, 2007 at the Rochester Mayo Civic Center. The workshop was hosted by Rochester-Olmsted County Planning Department in collaboration with the League of
Introduction.
 2307-1.0. Introduction. Delaware s Safe Routes to School (SRTS) Program was established September 10, 2002 when Governor Ruth Ann Minner signed Senate Bill 353 of the 141st General Assembly of Delaware
Roads and Vehicular Traffic Design Principles. Roads and Vehicular Traffic Recommendations
 CIRCULATION AND PARKING roads and vehicular traffic The Campus Master Plan updates the campus transportation network through a multi-modal approach that encourages walking and biking while improving vehicular
Executive Summary. TUCSON TRANSIT ON BOARD ORIGIN AND DESTINATION SURVEY Conducted October City of Tucson Department of Transportation
 Executive Summary TUCSON TRANSIT ON BOARD ORIGIN AND DESTINATION SURVEY Conducted October 2004 Prepared for: City of Tucson Department of Transportation May 2005 TUCSON TRANSIT ON BOARD ORIGIN AND DESTINATION
Exceeding expectations: The growth of walking in Vancouver and creating a more walkable city in the future through EcoDensity
 Exceeding expectations: The growth of walking in Vancouver and creating a more walkable city in the future through EcoDensity Melina Scholefield, P. Eng. Manager, Sustainability Group, City of Vancouver
Key Findings & Corridor Highlights
 The PA 358 Corridor Greenville to I-79 The PA 358 Corridor connects the Borough of Greenville in northwest Mercer County with I-79 to the east. For much of the way it follows the Shenango and Little Shenango
Appendix T 1: Additional Supporting Data
 Appendix T 1: Additional Supporting Data Project Delivery Delays with the implementation of the 2000 TIP became apparent early in the decade. In response to direction among policy officials, ARC began
Sixth Line Development - Transit Facilities Plan
 Memorandum Date: November 13, 2012 To: From: c.c. Subject: Rob Freeman (Freeman Planning) Kevin Phillips Sixth Line Development - Transit Facilities Plan 33016631 This memo was prepared to review the transit
Modal Shift in the Boulder Valley 1990 to 2009
 Modal Shift in the Boulder Valley 1990 to 2009 May 2010 Prepared for the City of Boulder by National Research Center, Inc. 3005 30th Street Boulder, CO 80301 (303) 444-7863 www.n-r-c.com Table of Contents
Measuring Transportation: Traffic, Mobility and Accessibility
 Measuring Transportation: Traffic, Mobility and Accessibility THIS FEATURE COMPARES THREE APPROACHES TO MEASURING TRANSPORTATION SYSTEM PERFORMANCE. TRAFFIC-BASED MEASUREMENTS EVALUATE MOTOR VEHICLE MOVEMENT;
THE 2010 MSP REGION TRAVEL BEHAVIOR INVENTORY (TBI) REPORT HOME INTERVIEW SURVEY. A Summary of Resident Travel in the Twin Cities Region
 REPORT HOME INTERVIEW SURVEY. A Summary of Resident Travel in the Twin Cities Region") THE 2010 MSP REGION TRAVEL BEHAVIOR INVENTORY (TBI) REPORT HOME INTERVIEW SURVEY A Summary of Resident Travel in the Twin Cities Region October 2013 WHAT IS THE TBI? The Travel Behavior Inventory (TBI)
THE 2010 MSP REGION TRAVEL BEHAVIOR INVENTORY (TBI) REPORT HOME INTERVIEW SURVEY A Summary of Resident Travel in the Twin Cities Region October 2013 WHAT IS THE TBI? The Travel Behavior Inventory (TBI)
Moving Cambridge. City of Cambridge Transportation Master Plan Public Consultation Centre. March 7, :00 8:00 PM.
 City of Cambridge Transportation Master Plan Public Consultation Centre March 7, 2018 5:00 8:00 PM Region of Waterloo City of Cambridge Transportation Master Plan Public Consultation Centre March 7, 2018
ACTIVE TRANSPORTATION
 ACTIVE TRANSPORTATION Mobility 2040 Supported Goals Improve the availability of transportation options for people and goods. Support travel efficiency measures and system enhancements targeted at congestion
On the Move: Transportation Plan Wood County Survey Assessment
 On the Move: 2015 2045 Transportation Plan Wood County Survey Assessment Bowling Green State University Master of Public Administration Program conducted by Alina Raulinaitis, Guang Yang, Sarah Tekle,
Executive Summary Route 30 Corridor Master Plan
 Route Corridor Master Plan Project Overview The Route Corridor Master Plan is a coordinated multimodal transportation and land use plan for the entire stretch of Route through East Whiteland Township,
4. ENVIRONMENTAL IMPACT ANALYSIS 9. TRANSPORTATION AND TRAFFIC
 4. ENVIRONMENTAL IMPACT ANALYSIS 9. TRANSPORTATION AND TRAFFIC 4.9.1 INTRODUCTION The following section addresses the Proposed Project s impact on transportation and traffic based on the Traffic Study
City of Novi Non-Motorized Master Plan 2011 Executive Summary
 City of Novi Non-Motorized Master Plan 2011 Executive Summary Prepared by: February 28, 2011 Why Plan? Encouraging healthy, active lifestyles through pathway and sidewalk connectivity has been a focus
Performance Criteria for 2035 Long Range Transportation Plan
 Minimizing Impacts on Natural, Historic, Cultural or Archeological Resources 2035 LRTP Weighting Factor: 7% Objective 1.1: Use appropriate planning and design criteria to protect and enhance the built
SNCC Demographic Trends
 Employment Population SNCC Demographic Trends In 1970 the SNCC population was 10,040, accounting for roughly 3% of the County population In 2015, SNCC grew to 60,567 people, roughly 11% of the County population
Flyaway Bus: GIS Analysis on Current and Potential Ridership, Revenue, and Prospective Stations
 ProfessorBarry Waite & Bonnie Shrewsbury Flyaway Bus: GIS Analysis on Current and Potential Ridership, Revenue, and Prospective Stations 1. Abstract The Flyaway Bus is a long distance non-stop shuttle
San Mateo County Comprehensive Bicycle and Pedestrian Plan Open House
 San Mateo County Comprehensive Bicycle and Pedestrian Plan Open House October 28, 2010 Presented to San Mateo County residents and interested parties by Lauren Ledbetter, Alta Planning + Design Matt Haynes,
Cities Connect. Cities Connect! How Urbanity Supports Social Inclusion
 Cities Connect! How Urbanity Supports Social Inclusion Todd Litman Victoria Transport Policy Institute Metropolis Toronto, Canada - 14 June 2006 Cities Connect People with people. People with jobs. People
Peterborough Council on Aging
 Peterborough Council on Aging Discussion paper series #4, 2015 Transportation Transportation, including accessible and affordable public transport is a key factor influencing active aging. in particular,
Route 7 Corridor Study
 Route 7 Corridor Study Executive Summary Study Area The following report analyzes a segment of the Virginia State Route 7 corridor. The corridor study area, spanning over 5 miles in length, is a multi
CITY OF HAMILTON. PUBLIC WORKS DEPARTMENT Transportation Division
 CITY OF HAMILTON PUBLIC WORKS DEPARTMENT Transportation Division TO: Mayor and Members General Issues Committee WARD(S) AFFECTED: CITY WIDE COMMITTEE DATE: February 25, 2013 SUBJECT/REPORT NO: Public Bike
Section 9. Implementation
 Section 9. Implementation The transportation system is just one of many aspects that must be carefully planned to maintain and enhance the quality of living in Cecil County. The Cecil County Bicycle Plan
SMART 1 Public Meeting #1. February 24, 2016
 SMART 1 Public Meeting #1 February 24, 2016 Agenda Who is the SMTC? SMART 1 project overview Syracuse Metropolitan Transportation Council An Introduction: Who we are & what we do What is an MPO? A Metropolitan
2.0 Existing Conditions
 20 2.0 Existing Conditions 2.1 Land Use, Future Growth Patterns, Physical Barriers Geographic Overview Sutter County s land use pattern is characterized by extensive agricultural areas, significant natural
Westside Transportation Access Needs Assessment - Short and Long Term Improvements
 ABSTRACT The Los Angeles County Metropolitan Transportation Authority (MTA) adopted the 2001 Long Range Transportation Plan (LRTP), which sets out the County s transportation investments for the next 20-25
Sustainable Transportation Initiatives and Plans in Caledon
 Sustainable Transportation Initiatives and Plans in Caledon Arash Olia, P.Eng., PhD. Coordinator, Transportation Development Finance & Infrastructure Services Town of Caledon Eric Chan, P.Eng., PMP Manager,
Base Information. 1. Project Title SH7/East Arapahoe Multi-Use Path and Transit Stop Improvements. 2. Project Start/End points or Geographic Area
 Part 1 Base Information 1. Project Title SH7/East Arapahoe Multi-Use Path and Transit Stop Improvements 2. Project Start/End points or Geographic Area 38 th /Marine streets to Cherryvale Road (See attached
Memorandum. Purpose: To update the MPO CTAC on the status of the LRTP scenario evaluation process.
 Charlottesville-Albemarle Metropolitan Planning Organization POB 1505, 401 E. Water St, Charlottesville, VA 22902 www.tjpdc.org (434) 979-7310 phone info@tjpdc.org email Memorandum To: MPO CTAC From: Wood
Berkeley Strategic Transportation Plan A-76
 Berkeley Strategic Transportation Plan A-76 Appendices 1. A Team Effort 2. Where We ve Been A-11 Berkeley Strategic Transportation Plan Alameda County Transportation Plan Alameda County will be served
PEDESTRIAN ACTION PLAN
 ATTACHMENT 2 CITY OF SANTA MONICA PEDESTRIAN ACTION PLAN CITY OF SANTA MONICA PEDESTRIAN ACTION PLAN This page intentionally left blank EXECUTIVE SUMMARY CHAPTER 1 EXECUTIVE SUMMARY Setting the Stage
TOWN OF PORTLAND, CONNECTICUT COMPLETE STREETS POLICY
 TOWN OF PORTLAND, CONNECTICUT COMPLETE STREETS POLICY I. VISION, GOALS & PRINCIPLES VISION To improve the streets of Portland making them safer and more accessible for all users including pedestrians,
Appendix A-K Public Information Centre 2 Materials
 Appendix A-K Public Information Centre 2 Materials Our Rapid Transit Initiative Make an impact on the future of transit Join the discussion on Rapid Transit in London You re invited to a Public Information
Highway 217 Corridor Study. Phase I Overview Report
 Highway 217 Corridor Study Phase I Overview Report November 3, 24 BACKGROUND AND OVERVIEW Study purpose The Highway 217 Corridor Study is developing multi-modal transportation solutions for traffic problems
City of Birmingham Draft Multi-modal Transportation Plan
 City of Birmingham Draft Multi-modal Transportation Plan City Commission Public Hearing Monday, November 25, 2013 7:30 pm Norman Cox, PLA, ASLA The Greenway Collaborative, Inc. Ann Arbor, Michigan The
Plant City Walk-Bike Plan
 Plant City Walk-Bike Plan Plant City Commute Mode Share 2.2% 1.4% 2.9% Drove alone 10.2% Carpooled Public transportation (0.1%) Walked Used a Bike (0.4%) 82.9% Taxicab, motorcycle, or other means Worked
INNER LOOP EAST. AIA Rochester Annual Meeting November 13, 2013 TRANSFORMATION PROJECT. Bret Garwood, NBD Erik Frisch, DES
 INNER LOOP EAST TRANSFORMATION PROJECT AIA Rochester Annual Meeting November 13, 2013 Bret Garwood, NBD Erik Frisch, DES Why? We are building a city that encourages walking, biking and enjoying the outdoor
DRAFT MOVING FORWARD RHODE ISLAND BICYCLE MOBILITY PLAN 2018 PREPARED FOR PREPARED BY IN ASSOCIATION WITH
 RHODE ISLAND MOVING FORWARD BICYCLE MOBILITY PLAN 2018 PREPARED FOR PREPARED BY IN ASSOCIATION WITH T AF CHAPTER 1 D R INTRODUCTION CHAPTER 3 ARTICULATES VISION Bicycling is safe, fun and practical in
ADA Transition Plan. City of Gainesville FY19-FY28. Date: November 5, Prepared by: City Of Gainesville Department of Mobility
 ADA Transition Plan FY19-FY28 Date: November 5, 2018 Prepared by: City Of Gainesville Department of Mobility 1.0 INTRODUCTION 1.1 BACKGROUND The federal statute known as the Americans with Disabilities
Chapter 5. Complete Streets and Walkable Communities.
 Chapter 5. Complete Streets and Walkable Communities. 5.1 Description of Complete Streets. Cities throughout the world, and specifically the United States, are coming to embrace a new transportation and
Town of Superior. Superior Trails Plan
 Part 1 Base Information 1. Project Title US 36 Bikeway Extension 2. Project Start/End points or Geographic Area Provide a map with submittal, as appropriate 3. Project Sponsor (entity that will construct/
City of Bartow Comprehensive Plan. Transportation Element
 City of Bartow 2030 Comprehensive Plan Amended through January 7, 2013 TRANSPORTATION ELEMENT GOAL: IT SHALL BE A GOAL OF THE CITY OF BARTOW TO PROVIDE A SAFE AND EFFICIENT MULTI-MODAL TRANSPORTATION SYSTEM
Service Proposal for the City of Ashland, Oregon
 Rogue Valley Transportation District 3200 Crater Lake Avenue Medford, Oregon 97504-9075 Phone (541) 608-2429 Fax (541) 773-2877 Visit our website at: www.rvtd.org 2009-2011 Service Proposal for the City
Transportation 2040 Update: Eudora Public Input As of June 1, 2017
 Transportation 2040 Update: Eudora Public Input As of June 1, 2017 Overview... 1 Survey Responses... 2 Overview The Lawrence Douglas County Metropolitan Planning Organization (MPO) is updating our long
To secure Council approval for a pilot expansion of Transit service to the villages of St. Davids and Queenston.
 Operations Telephone (905) 468-4261 Facsimile (905) 468-4555 1565 Creek Road P.O. Box 190 Virgil, Ontario L0S 1T0 Report: OPS-15-026 Committee Date: May 04, 2015 Due in Council: May 11, 2015 Report To: