The Milwaukee Path to Platinum Community Bicycling Survey Summary Report
|
|
|
- Meryl Stephany Conley
- 6 years ago
- Views:
Transcription
1 The Milwaukee Path to Platinum Community Bicycling Survey Summary Report FINAL March 2017 Authors Robert Schneider, PhD, Associate Professor, UW-Milwaukee Department of Urban Planning Ryan Peterson, Master of Urban Planning Student, UW-Milwaukee Department of Urban Planning Emma Siegworth, Master of Urban Planning Student, UW-Milwaukee Department of Urban Planning Nicholas La Joie, Media Specialist, Marquette University 2016 Path to Platinum Core Team Angela Allen, University of Wisconsin-Extension James Davies, Bublr Bikes Tony Giron, Wisconsin Bicycle Federation Keith Holt, Bike Easy Nicholas La Joie, Marquette University Kate Nelson, UW-Milwaukee Office of Sustainability Robert Schneider, UW-Milwaukee Department of Urban Planning John Siegert, Rails-to-Trails Conservancy David Waters, Sixteenth Street Community Health Centers Tonieh Welland, Black Girls Do Bike Jessica Wineberg, Wisconsin Bicycle Federation 2016 Path to Platinum Public Agency Liaisons Kristin Bennett, City of Milwaukee Department of Public Works James Hannig, Wisconsin Department of Transportation Montavius Jones, City of Milwaukee Department of City Development Jeff Polenske, City of Milwaukee Department of Public Works Monica Wauck, City of Milwaukee Department of City Development Mission of Milwaukee s Path to Platinum Initiative: "Engage the whole Milwaukee community to advocate for better bicycling and safer streets for all."
2 Contents Key Findings...1 Survey Responses High-Priority Improvements Location-Specific Improvements Survey Background...3 Section 1. Path to Platinum Results Overview...6 City of Milwaukee Respondents Zip Code-Specific Analysis Gender-Specific Analysis Age-Specific Analysis Workplace Amenities Analysis Commuter & Recreational Riders Infrequent Rider Analysis Section Priority Write-In Comment Analysis Intersection Write-In Comment Analysis Appendices A. Survey Instrument B. Survey Distribution Message C. Reported Pedestrian and Bicyclist Crashes by Aldermanic District D. Milwaukee County Bicycle Crash Density E. Milwaukee County Pedestrian Crash Density F. Priority 1 Open-Ended Comments G. Priority 2 Open-Ended Comments H. Open-Ended Comments: Recommended Bicycle Improvements by Location
3 Key Findings More than 900 people responded to the Milwaukee Path to Platinum Community Bicycling Survey during Fall 2016, including 850 City of Milwaukee residents. The survey results show that many people care deeply about improving bicycling and creating safer streets in the Milwaukee Community. Key findings from the survey are summarized below. The summary report provides the detailed analysis behind each finding. Note that the survey was not intended to gather responses from a representative sample of Milwaukee residents. Instead, it was shared to reach as many Milwaukee community members as possible and gather as much information as possible about opinions related to bicycling and safer streets. Survey Responses People from neighborhoods across Milwaukee responded to the survey. Only one zip code in the City of Milwaukee did not have any survey respondents. Respondents have a high level of interest in bicycling improvements. Approximately half took additional time to write open-ended comments and enhance their responses with more specific details. High-Priority Improvements Separated bicycle lanes. The most desired improvement recommended by City of Milwaukee respondents was more separation from vehicle traffic (the picture accompanying the question showed a separated bicycle lane) (88%). Further, the most common and third-most common barriers to bicycling were bad drivers (64%) and automobile traffic (56%). Separated bicycle lanes were also the most common improvement recommended through open-ended comments. This is especially notable because Milwaukee currently has only one example of a separated bike lane (raised curb bike lane on Bay Street). Separated bicycle lanes have some type of physical separation (e.g., bollards, planters, raised curb, parked cars) between moving automobiles and bicyclists along street segments. Connected, on-street bicycle facilities. More bike lanes was the second-most desired improvement of City of Milwaukee respondents (86%) and improved connections between bike lanes, bikeways, and sidewalks was the fourth-most desired improvement (78%). On-street bicycle infrastructure and accessibility and connectivity were the second- and third- most common improvements recommended through open-ended comments. The second-most common barrier to bicycling was unsafe intersections (57%), which are crucial to providing a connected bicycle network. Bicycle facility maintenance. Maintenance of existing bike lanes, routes, and greenways was the third-most desired improvement of City of Milwaukee respondents (85%). Maintenance issues include potholes and pavement problems as well as snow and ice removal. Neighborhood greenways. More neighborhood greenways was the fifth-most desired improvement of City of Milwaukee respondents (73%). This is especially notable because Milwaukee does not yet have an example of a neighborhood greenway. Neighborhood greenways are well-signed, traffic-calmed residential streets that prioritize slow-speed travel. Importantly, pedestrian and bicyclist crossing enhancements are provided where neighborhood greenways intersect major roadways. Safer driver behavior. The top barrier to bicycling cited by City of Milwaukee respondents was bad drivers (64%). Three categories of open-ended responses also raised the issue of behavior: driver behavior, education on driver and bicyclist laws, and law enforcement. These were the 1
4 fourth-, fifth-, and sixth-most common categories of open-ended responses, underscoring the importance of this issue. Some comments suggested the need to improve bicyclist behavior and increase bicyclist compliance with traffic laws. However, the majority of comments highlighted unsafe driving behaviors related to drivers passing in bicycle lanes, speeding, and general lack of awareness and respect for bicyclists on public roadways. Location-Specific Improvements Downtown Milwaukee. The most common area mentioned by respondents in each of the six top respondent home zip codes was Downtown Milwaukee. This may not be surprising since many of the top respondent zip codes were near Downtown and many people travel there for work and other activities. However, it highlights the lack of bicycle connections in this area and emphasizes the importance of having a safe, well-connected bicycle network in the core of the city. Major roadways throughout Milwaukee. Respondents listed hundreds of specific intersections, corridors, and areas throughout the entire city that they would like to see improved for bicycling. The locations cited most often tended to be thoroughfares serving commercial districts. For example, the most roadway corridors mentioned in the top respondent home zip codes were: o (Downtown/Lower East Side): Water Street; Brady Street o (Bayview): Water Street/1 st Street; Oklahoma Avenue o (Washington Heights/Washington Park): Lisbon Avenue; 35 th Street o (Upper East Side): Locust Street; Water Street/1 st Street o (Riverwest/Harambee): Locust Street; Water Street/1 st Street o (Far West Side/Wauwatosa): Bluemound Road; Wisconsin Avenue Physical changes to major roadways, such as adding separated bike lanes and other high-quality on-street bicycle facilities, may improve these corridors for bicycling. Neighborhood greenways can also improve bicycle access on routes parallel to these roadways. Corridors with many reported bicycle crashes. There is a notable overlap between roadway corridors and intersections cited by survey respondents and roadway corridors and intersections with high concentrations of reported bicycle and pedestrian crashes. This underscores the need for better bicycling and safer streets for everyone. 2
5 Survey Background The Path to Platinum Community Bicycling Survey was designed to gather information about bicycling frequency, barriers to bicycling, strategies to improve bicycling from Milwaukee residents during Fall The online survey instrument was designed by Nicholas La Joie and was available in both English and Spanish (Appendix A). Esperanza Magana, Tatiana Maida, and Tony Giron produced the Spanish translation. A link to the survey was distributed by members of the Path to Platinum Core Team to Path to Platinum contacts, community organizations, bicycle advocates, neighborhood residents, and others via , Facebook, Twitter, and other social media outlets between October 7 th, 2016 and December 16 th, 2016 (Appendix B). The survey was not intended to gather responses from a representative sample of Milwaukee residents. Instead, it was shared to reach as many Milwaukee community members as possible and gather as much information as possible about opinions related to bicycling and safer streets. After duplicate responses were removed, a total of 933 clean responses were analyzed. The maps on the following pages show the total number of responses by zip code (Figure 1) and responses per 10,000 residents by zip code (Figure 2). This report presents the results of the survey in two main sections: Section 1, written by Ryan Peterson, provides an overview of respondent bicycling frequency, barriers to bicycling, and preferred strategies to improve bicycling. It summarizes results for zip codes with the most respondents and also compares respondents from different groups (e.g., City of Milwaukee versus other respondents, male versus female, frequent versus infrequent riders). Section 2, written by Emma Siegworth, is a detailed summary of open-ended comments about ideas to improve bicycling in Milwaukee. Each response was categorized into one of 19 different themes, and these themes are ranked by how often they were mentioned. Many comments also mentioned specific intersections, corridors, areas, and connections for improvements. These location-based comments were compiled and ranked according to the home zip code of the respondents. Finally, the appendix to this report provides important contextual information about bicyclist and pedestrian safety in the Milwaukee community. It summarizes the total number of bicyclist and pedestrian crashes reported to police between 2011 and 2015 by City of Milwaukee Aldermanic District (Appendix C). Crash density maps are also provided to show bicycle crash hot spots (Appendix D) and pedestrian crash hot spots (Appendix E). These data were analyzed by Robert Schneider. Note that the terms separated bike lanes, protected bike lanes, and cycle tracks are all used in this report to refer to a facility that provides some type of physical separation (e.g., bollards, planters, raised curb, parked cars) between moving automobiles and bicyclists along street segments. Separated bike lanes is the terminology being used by the Federal Highway Administration, so the Path to Platinum initiative is currently following this precedent. 3


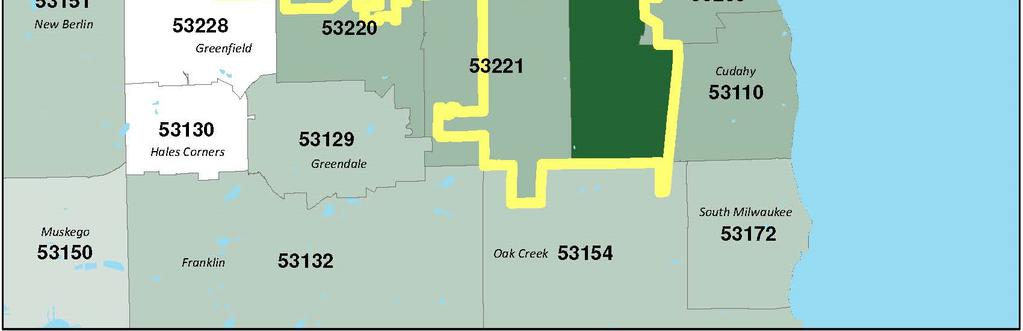
6 Figure 1. Total Survey Responses by Zip Code 4


7 Figure 2. Survey Responses per 10,000 Residents by Zip Code 5
8 Section 1. Path to Platinum Results Overview Written by Ryan Peterson University of Wisconsin-Milwaukee, Department of Urban Planning City of Milwaukee Respondents Summary The first analysis that was conducted was on the comparison between respondents located within and outside of the City of Milwaukee. Respondents were sorted by their home zip codes to determine whether or not they live within Milwaukee city limits. The answers from City and non-city respondents alike were analyzed to determine both the similarities and disparities between the two groups (Table 1). In total, 850 respondents were located within the City of Milwaukee. Of the 38 zip codes within Milwaukee, 25 zip codes within the City were represented within this survey. Based on the current population of Milwaukee, 599,164 residents, the per capita response rate for City residents was 0.141%. There were 83 respondents that were located outside of the City. The most common home zip code from outside of the City was (28 respondents), which just outside of city limits and is comprised of Whitefish Bay, Fox Point, Bayside, and River Hills. There were two out-of-state respondents. The two out-of-state respondents were from central Kansas and northern Illinois, respectively. Due to the lack of geographical restrictions within this survey, it was impossible to estimate a per-capita response rate for non-city residents. 6
9 Table 1. City vs. Non-City Residents City Residents Non-City Residents Number of Respondents Responses Per Capita 0.141% N/A Transportation Capabilities Own or Have Access to a Bicycle 97% 99% Own or Have Access to an Automobile 92% 99% Have Access to Public Transportation 97% 87% Barriers to Riding No Bicycle Parking 11% 7% No Bike Lane 44% 40% Bike Lanes in Poor Condition 40% 29% Unsafe Intersections 57% 46% Bad Drivers 64% 57% Automobile Traffic 56% 55% Personal Safety Concerns 46% 31% Visually Unappealing Surroundings 8% 10% Do not have the Time to Bike 24% 35% Destinations are too Far Away 30% 29% Bad Weather 44% 40% Lack of Worksite Amenities 22% 22% Traveling with Small Children 11% 16% Too Many Stops to Make 10% 11% Too Much to Carry 22% 24% Uncertainty of Bike Routes 6% 12% Lack of a Bicycle 4% 1% Most Desired Improvements More Bike Lanes 86% 91% Wider/Better Sidewalks 34% 33% More Separation from Vehicle Traffic 88% 71% More Bike Route Signage and Wayfinding 57% 60% Curb bump-outs and Other Traffic Calming Measures 52% 44% Better Intersections 68% 75% More Neighborhood Greenways 73% 69% Maintenance of Existing Bikes Lanes, Routes/Greenways 85% 75% 7
10 Improved Connections Between Bike Lanes, Bikeways, and 78% 75% Sidewalks More Bike Share Stations 28% 33% Education for Motorists, Pedestrians, and Bicyclists 60% 67% Enforcement of Laws for Motorists, Pedestrians, and Bicyclists 66% 71% Worksite Amenities 45% 56% Secure/Protected Bicycle Parking 53% 65% Bicycle Route Map 56% 71% 8
11 Analysis The transportation capabilities of City and non-city residents were similar but there was a large disparity in the respondents answer to the access to public transportation. The totals for the questions of Do you own or have access to a bicycle? and Do you own or have access to an automobile? garnered es responses in the range of 93-99% for both City and non-city residents. However, while 97% of City residents said that they have access to public transportation, only 87% of non-city respondents said that they had access to such transportation options (Figure 3). 100% 80% Transportation Capabilities 60% 40% 20% City Responses Non-City Responses 0% Access to a Bicycle Access to an Automobile Access to Public Transportation Figure 3. Depicts the transportation capabilities of City and non-city respondents The most common barriers to riding were almost identical between City and non-city respondents. The six most commonly voted barriers amongst City respondents, from greatest to smallest, were bad driver behaviors, unsafe intersections, automobile traffic, personal safety concerns, bad weather, and no bike lanes (Table 1). These six categories were identified as barriers amongst at least 40% of the respondents. The six barriers that were voted as the most worrisome barriers to riding amongst non-city residents, from the most common to least common, were bad driver behavior, automobile traffic, unsafe intersections, no bike lanes, bad weather, and personal safety concerns. These responses all garnered at least a 38% agreement response rate amongst respondents. It is clear that regardless of the location of the respondents that several answers were repeated amongst both City and non-city respondents. By alleviating these concerns, it would increase the ridership in both urban, suburban, and rural settings. The chart below shows barriers that had the greatest difference between city and non-city respondents (Figure 4). 9
12 Barriers to Riding 100% 80% 60% 40% City Responses Non-City Responses 20% 0% Figure 4. Depicts the largest disparities in answers regarding barriers to riding between City and non-city respondents There was slightly more deviation in the answers between City and non-city respondents when asked about the desired bike infrastructure improvements. The six most common desired improvements amongst City respondents were, from largest to smallest, were more separation from vehicle traffic, more bike lanes, maintenance of existing bike lanes, bike routes/greenways, improved connections, and more neighborhood greenways (Figure 5). All six desired improvements received Agree or Strongly Agree answers from 68% or more of the respondents. However, the most common answers amongst non-city responses were more bike lanes, maintenance of existing bike lanes, bike routes/greenways, improved connections, better intersections, and more separation from vehicle traffic. All of the desired improvements amongst non-city respondents received a response rate of 67% or higher. Non-City respondents agreed that more bike lanes were a necessary improvement at a rate of 93%, the highest amongst all desired improvements from both City and non-city respondents. 10
13 Desired Improvements 100% 80% 60% 40% City Responses Non-City Responses 20% 0% More bike lanes Curb bump-outs and other traffic calming measures More bike route signage and wayfinding More separation from vehicle traffic (protected separated bike lanes / cycletracks) Secure / protected bicycle parking Better intersections (bike and pedestrian signals/ crosswalks) Figure 5. Depicts the largest disparities in answers regarding desired improvements between City and non-city respondents However, there were several differences in the answers for both the barriers to riding and the desired improvements between the two groups. The large differences outline both the priorities and the opinions of City and non-city respondents that could potentially unlock the key to higher ridership numbers in the Milwaukee area and beyond. Specifically, the largest difference in the barriers to riding appeared when respondents were asked about personal safety concerns, not having the time to bicycle, and bad driver behaviors. City residents were much more concerned about personal safety concerns and bad driver behavior, while non-city residents were more concerned with not having the time to bicycle. There were several large differences within the desired improvements, as well. City residents were more concerned about having separation from vehicle traffic, but non-city residents were far more concerned about not having a bicycle route map and having secure/protected bicycle parking. The full table of the results are available in Appendix A. Zip Code-Specific Analysis Summary The next analysis that was conducted was based on the zip codes of the respondents. Respondents were sorted by their home zip code to determine the barriers, desired improvements, and additional information from each zip code. The purpose of this analysis is to ascertain if there any barriers or improvements that are restricting residents from choosing biking as a form of transportation. Work zip codes were not included in this analysis (Table 2). Respondents entered 61 unique zip codes as their home zip code. The most common zip codes that appeared throughout the survey were (161 respondents), (125 respondents), (122 respondents), (102 respondents), and (90 respondents). Respondents from these zip codes 11
14 represent over 64% of the total responses. These five zip codes, and their corresponding respondents, comprised the data used for this section s analysis. In addition to the most commonly answered zip codes, an additional category was added to this analysis to act as a control group to compare against. This group was labeled Other and includes respondents that did not list a home zip code as one of the most common. This demographic included 333 respondents. 12
15 Table 2. Zip Code Analysis Other Number of Respondents Population 35,406 35,149 30,416 31,133 23,386 Responses Per Capita 0.458% 0.347% 0.39% 0.328% 0.376% N/A Neighborhoods Within Zip Code Murray Hill East Town Shorewood Bay View Mitchell Airport Riverwest Historic King Drive Brewers Hill Harambee Sherman Park Washington Park Walnut Hill Brady Street Third Ward ankee Hill North Avenue Prospect Towers Median Household Income $50,619 $53,646 $29,653 $31,474 $47,231 N/A Median Resident Age N/A N/A Transportation Capabilities Own or Have Access to a Bicycle Own or Have Access to an Automobile Have Access to Public Transportation 96% 98% 99% 96% 93% 97% 91% 92% 92% 99% 81% 96% 96% 99% 98% 95% 97% 94% Barriers to Riding No Bicycle Parking 9% 12% 7% 8% 16% 13% No Bike Lane 43% 48% 42% 40% 53% 40% Bike Lanes in Poor Condition 43% 50% 41% 29% 41% 35% Unsafe Intersections 57% 57% 62% 54% 62% 51% Bad Drivers 58% 71% 66% 70% 63% 60% Automobile Traffic 50% 59% 57% 60% 52% 55% Personal Safety Concerns 46% 44% 46% 51% 42% 44% Visually Unappealing Surroundings 7% 6% 7% 8% 4% 11% Do not have the Time to Bike 32% 26% 24% 25% 19% 29% Destinations are too Far Away 62% 28% 30% 26% 26% 31% Bad Weather 77% 42% 40% 37% 44% 44% Lack of Worksite Amenities 17% 30% 19% 19% 20% 25% 13
16 Traveling with Small Children 7% 7% 9% 19% 3% 16% Too Many Stops to Make 8% 6% 7% 11% 6% 15% Too Much to Carry 30% 18% 19% 24% 14% 24% Uncertainty of Bike Routes 6% 5% 4% 6% 12% 8% Lack of a Bicycle 2% 3% 2% 4% 7% 3% Most Desired Improvements More Bike Lanes 87% 90% 90% 88% 91% 83% Wider/Better Sidewalks 29% 30% 30% 35% 42% 36% More Separation from Vehicle Traffic 89% 92% 91% 89% 87% 84% More Bike Route Signage and 53% 55% 57% 61% 63% 59% Wayfinding Curb bump-outs and Other Traffic Calming 52% 50% 61% 57% 57% 47% Measures Better Intersections 66% 66% 75% 68% 73% 64% More Neighborhood Greenways 72% 71% 80% 80% 74% 66% Maintenance of Existing Bikes Lanes, 86% 85% 88% 82% 86% 82% Routes/Greenways Improved Connections Between Bike Lanes, Bikeways, 75% 82% 79% 85% 72% 76% and Sidewalks More Bike Share Stations 29% 24% 28% 28% 38% 26% Education for Motorists, Pedestrians, and 53% 60% 61% 68% 61% 63% Bicyclists Enforcement of Laws for Motorists, Pedestrians, and 62% 62% 64% 76% 67% 67% Bicyclists Worksite Amenities 45% 53% 35% 48% 41% 48% Secure/Protected Bicycle Parking 55% 58% 42% 60% 49% 57% Bicycle Route Map 57% 54% 47% 64% 60% 57% 14
17 Analysis The 266 respondents within the zip code represents the most common zip code within the survey. With an estimated population of 35,125, the per capita response rate was 0.458%. This zip code is comprised of the Murray Hill, East Town, and Shorewood neighborhoods. The transportation capabilities were as follows, 96% of respondents own or had access to a bicycle, 91% own or have access to an automobile, and 96% have access to public transportation. The slightly lower access to an automobile is potentially explained by the large percentage of college students within the zip code, where UW-Milwaukee is located within. The highest-voted barriers to riding were destinations being too far away, bad weather, and bad drivers. Respondents within this zip code answered that bad weather is a barrier at a rate of 77%, which was the highest amongst all other zip codes. While it is hard to implement infrastructure improvements to combat the weather in this region, it can offer an explanation as to why some residents are choosing other forms of transportation besides biking. Overall, the results collected from this zip code are quite dissimilar from other zip codes, which could potentially signal the necessity for different infrastructure improvements within this area. The most desired improvements from respondents were more separation from traffic, more bike lanes, improved connections between bike lanes, bikeways, and sidewalks, and more neighborhood greenways. There were 125 respondents from the zip code. Based on the population of 36,058 within the zip code, there was per capita response rate of 0.347%. This zip code is comprised of the Bay View neighborhood and the area surrounding the General Mitchell Airport. Respondents from this zip code answered that 98% own or have access to a bicycle, 92% own or have access to an automobile, and 99% have access to public transportation. The top-voted barriers amongst respondents within this zip code were bad driver behavior, unsafe intersections, and bike lanes in poor conditions. The bad driver behavior and poor bike lane conditions barriers received the highest votes amongst all zip codes, which might indicate the immediate attention that both of these barriers require to increase ridership in this area. Several desired improvements also received high response rates. More bike lanes, more separation from traffic, and improved connections between bike lanes, bikeways, and sidewalks all received answers of agreement from over 85% of the respondents. In addition, maintenance of existing bike lanes, routes/greenways, enforcement of laws for motorists, pedestrians, and bicyclists, education for motorists, pedestrians, and bicyclists, and secure/protected bicycle parking all were voted as barriers from over 58% of the respondents. There were 122 respondents from the zip code. According to the population estimate of 31,224 within the zip code, the per capita response rate was found to be 0.39%, the second-highest among all zip codes. The zip code is comprised of the Riverwest, Harambee, Historic King Drive, and Brewers Hill neighborhoods. The transportation capabilities of the respondents from this zip code were as follows: 99% own or have access to a bicycle, 92% own or have access to an automobile, and 98% have access to public transportation. Respondents from the zip code had the highest rate of owing/access to a bicycle, which displays the existing culture of biking within these neighborhoods. The top-voted barriers from residents were unsafe intersections, bad driver behavior, and automobile traffic. Personal safety concerns and no bike lanes also received high rates of agreement amongst respondents from these neighborhoods. In addition, more bike lanes, more separation from vehicle traffic, maintenance of existing bike lanes, routes/greenways, and more neighborhood greenways were the desired improvements that were voted as the most sought-after improvements from respondents living within this zip code. There were 102 responses from residents within the zip code. The per capita response rate for this zip code was 0.328%, based on its population of 32,196 residents. Sherman Park, Washington Park, 15
18 and Walnut Hill are the neighborhoods that are located within the zip code. Respondents within this zip code answered that 96% of them own or have access to a bicycle, 99% own or have access to an automobile, and 95% have access to public transportation. The highest-answered barriers to riding amongst residents from the zip code were bad driver behavior, automobile traffic, unsafe intersections, and personal safety concerns. Compared to the responses from other zip codes, the personal safety concern and automobile traffic barriers had the highest agreement from residents within the zip code. The desired improvements from respondents within this zip code provided interesting results. The most commonly voted improvements amongst respondents within the zip code were more bike lanes, more separation from vehicle traffic, maintenance of existing bike lanes, routes/greenways, and improved connections between bike lanes, bikeways, and sidewalks. These answers were consistent with the overall results of the survey. However, several other answers received high percentages of votes from respondents. Specifically, the barriers of enforcement of laws for motorists, pedestrians, and bicyclists, creation of bicycle route map(s), education for motorists, pedestrians, and bicyclists, and secure/protected bicycle parking all received the highest percentages compared to the other zip code results. There were 90 respondents from the zip code. These 90 respondents represent 0.376% of the total population, which is 23,933 residents. The neighborhoods within this zip code are Brady Street, Third Ward, ankee Hill, North Avenue, and Prospect Towers. While this zip code has a high median household income, the access to both automobiles and bicycles are the lowest. The lack of automobiles could be explained by the high density within these neighborhoods, making it impractical to own an automobile unless absolutely necessary. However, the low rate of bicycle ownership and/or access is surprising considering the high residential density and average income figures. respondents within this zip code believe that the top barriers to riding are unsafe intersections, bad driver behavior, no bike lanes, and automobile traffic. Respondents within this zip code answered no bike lanes being a barrier more than any other zip code. The desired improvements sought by residents within this area mirrored many of the other locations. The improvement with the highest amount of agreement from respondents were more bike lanes, more separation from vehicle traffic, maintenance of existing bike lanes, routes/greenways, better intersections, and improved connections between bike lanes, bikeways, and sidewalks. In fact, 91% of respondents from this zip code felt that more bike lanes should be added, which was the highest amongst all zip codes. The respondents also answered that more bike route signage and wayfinding measures should be added at a rate of 63%, which was also the highest amongst all other zip codes. Gender-Specific Analysis Summary This section of analysis was conducted on the female and male survey respondents. There were 507 male respondents and 409 female respondents. There were 17 respondents that were excluded due to respondents not entering their gender or answers not identifying a gender. The purpose of this analysis is to determine if there are gender-specific barriers or improvements that prevent males or females from choosing to bike (Table 3). 16
19 Table 3. Gender-Specific Analysis Males Females Number of Respondents Transportation Capabilities Own or Have Access to a Bicycle 98% 95% Own or Have Access to an Automobile 94% 91% Have Access to Public Transportation 95% 95% Frequent/Infrequent Riders Frequent 97% 93% Infrequent 3% 7% Frequency of Riding Go to Work Frequently 48% 32% Infrequently 51% 67% Go to School Frequently 10% 10% Infrequently 90% 89% Go to and From Frequently 5% 5% a Transit Stop Infrequently 95% 95% Run Errands Frequently 48% 35% Infrequently 51% 63% Go Shopping or Frequently 39% 33% to Eat Infrequently 60% 66% Exercise or Go Frequently 67% 46% to the Park Infrequently 33% 53% Other Reasons Frequently 52% 36% Infrequently 48% 63% Barriers to Riding No Bicycle Parking 12% 10% No Bike Lane 41% 46% Bike Lanes in Poor Condition 39% 40% Unsafe Intersections 51% 62% Bad Drivers 59% 69% Automobile Traffic 47% 66% Personal Safety Concerns 36% 56% Visually Unappealing Surroundings 7% 9% Do not have the Time to Bike 22% 28% Destinations are too Far Away 26% 36% Bad Weather 40% 48% 17
20 Lack of Worksite Amenities 24% 21% Traveling with Small Children 12% 11% Too Many Stops to Make 7% 13% Too Much to Carry 17% 29% Uncertainty of Bike Routes 5% 9% Lack of a Bicycle 2% 5% Most Desired Improvements More Bike Lanes 86% 89% Wider/Better Sidewalks 30% 37% More Separation from Vehicle Traffic 87% 88% More Bike Route Signage and Wayfinding 52% 64% Curb bump-outs and Other Traffic Calming Measures 53% 51% Better Intersections 68% 68% More Neighborhood Greenways 75% 69% Maintenance of Existing Bikes Lanes, Routes/Greenways 84% 85% Improved Connections Between Bike Lanes, Bikeways, and 76% 80% Sidewalks More Bike Share Stations 29% 27% Education for Motorists, Pedestrians, and Bicyclists 56% 67% Enforcement of Laws for Motorists, Pedestrians, and Bicyclists 64% 70% Worksite Amenities 48% 43% Secure/Protected Bicycle Parking 51% 58% Bicycle Route Map 52% 62% 18
21 Analysis The transportation capabilities of males and females were similar, with some slight differences in their results. The largest differences came in the access to bicycles and automobiles. Males were found to own or have access to a bicycle at a rate of 98% and 94% own or have access to an automobile. Conversely, females reported lower rates of access. Females within this survey reported to own or have access to bicycles at a rate of 95% and only 91% own or have access to an automobile. Both demographics have access to public transportation at a rate of 95%. This difference in transportation capabilities could result from the long-standing roles of males and females in the household or the slightly lower rate of employment amongst females. However, there are several bicycle infrastructure discrepancies that are more likely to deter females from choosing to bike. These discrepancies will be discussed later in this analysis. As alluded to earlier, fewer females have access to bicycles than males. As one might hypothesize, this leads to lower female ridership numbers. When determining how many respondents within each gender were classified as infrequent or frequent riders, the number of males classified as frequent riders was much higher. In total, 97% of males were identified as frequent riders, while only 93% of females were classified into the same category. The locations and tasks that each gender is riding to/engaging in was also identified. The frequency of these destinations was classified into two categories: frequently or infrequently. A frequent destination is one that a rider rides to either daily or once a week. An infrequent destination is one that a rider chooses to ride to once a month or fewer. The most common location/task that males chose to ride to was exercise or going to the park. Males responded that they frequently ride to exercise or to go to the park 67% of the time. Males also run errands and commute to work frequently at a rate of 48%. Females also responded that their most common destination was exercising or going to the park. However, their frequency rate for this destination was only 46%. Their commuting rate to work was only 32% (Figure 6). 100% 80% Frequency of Riding 60% 40% 20% Males Females 0% Go to work? Go to school? Get to and from a transit stop? Run errands? Go shopping or to eat? Exercise or go to the park? Other reasons? Figure 6. Depicts percentage that males and females frequently ride to each location/task The barriers to riding were comparable between the two genders, but the response rates between the two was slightly different. Both males and females responded that the top barriers to riding were unsafe intersections and bad driver behavior. However, females answered at a much higher rate to both of 19
22 these barriers. In addition, females felt that automobile traffic was one of the most concerning barrier, at a rate of 66% compared to 47% of males who thought it was a barrier to riding. Additionally, 56% of females felt that personal concerns were a barrier to riding, compared to only 36% of males who thought these concerns were a barrier to riding (Figure 7). It is evident that many of the concerns from females stem from the lack of safety that is afforded to riders. These concerns could potentially be alleviated by separated bike lanes, reduced automobile speeds on streets with bike lanes, or the addition of bollards to protect bike lanes. By adding these measures, the gender disparity of bikers could start to be lessened. 100% Barriers to Riding 80% 60% 40% 20% Males Females 0% Unsafe intersections Bike lanes in poor condition No bicycle parking Personal safety concerns No bike lanes Visually unappealing surroundings Figure 7. Depicts the largest disparities in answers of barriers of riding between genders Age-Specific Analysis Summary The age-specific analysis was done by sorting respondents into the seven age categories within the survey. There were 50 respondents within the age group, 280 respondents within the age group, 201 respondents within the age group, 175 respondents within the age group, 148 respondents within the age group, and 72 respondents within the 65-and-over age group. There was one respondent within the 15-and-under age group that was excluded from the analysis due to the low response rate amongst that age group (Table 4). 20
23 Table 4. Age-Specific Analysis Number of Respondents Transportation Capabilities Own or Have Access to a Bicycle 94% 97% 97% 98% 97% 94% Own or Have Access to an Automobile 72% 90% 94% 98% 97% 94% Have Access to Public Transportation 90% 96% 95% 98% 96% 97% Barriers to Riding No Bicycle Parking 18% 14% 6% 11% 9% 11% No Bike Lane 48% 51% 48% 39% 31% 33% Bike Lanes in Poor Condition 38% 50% 41% 34% 28% 29% Unsafe Intersections 62% 65% 58% 51% 43% 47% Bad Drivers 66% 69% 70% 60% 52% 53% Automobile Traffic 64% 55% 60% 55% 49% 58% Personal Safety Concerns 42% 46% 47% 46% 38% 50% Visually Unappealing Surroundings 6% 9% 9% 9% 5% 10% Do not have the Time to Bike 22% 26% 30% 26% 21% 18% Destinations are too Far Away 40% 35% 33% 29% 22% 18% Bad Weather 40% 47% 45% 41% 41% 43% Lack of Worksite Amenities 226% 30% 20% 22% 16% 10% Traveling with Small Children 2% 9% 26% 10% 5% 3% Too Many Stops to Make 6% 9% 8% 14% 11% 8% Too Much to Carry 22% 25% 20% 23% 24% 18% Uncertainty of Bike Routes 8% 11% 6% 5% 3% 3% Lack of a Bicycle 6% 4% 3% 4% 2% 3% Most Desired Improvements More Bike Lanes 96% 89% 91% 82% 84% 79% Wider/Better Sidewalks 46% 34% 33 31% 34% 32% More Separation from Vehicle Traffic 88% 89% 90% 85% 89% 79% More Bike Route Signage and Wayfinding 62% 59% 53% 53% 57% 71% Curb bump-outs and Other Traffic Calming Measures 64% 55% 57% 48% 43% 46% Better Intersections 82% 73% 73% 59% 63% 65% More Neighborhood Greenways 86% 79% 76% 61% 69% 64% Maintenance of Existing Bikes Lanes, Routes/Greenways 86% 88% 83% 78% 86% 83% 21
24 Improved Connections Between Bike Lanes, Bikeways, and 78% 80% 79% 76% 77% 72% Sidewalks More Bike Share Stations 34% 29% 35% 25% 26% 17% Education for Motorists, Pedestrians, and Bicyclists 60% 57% 63% 59% 64% 69% Enforcement of Laws for Motorists, Pedestrians, and 48% 64% 69% 66% 70% 75% Bicyclists Worksite Amenities 44% 47% 47% 49% 46% 35% Secure/Protected Bicycle Parking 60% 51% 53% 59% 57% 50% Bicycle Route Map 64% 60% 51% 53% 59% 56% 22
25 Analysis The results of the transportation capabilities of each age group was relatively predictable. The transportation capabilities of younger age groups were far more restrictive than those of more advanced ages. The eldest age groups also exhibited less access to both automobiles and bicycles than middle-aged respondents. The progression of the transportation capabilities between the various age groups loosely followed the direction of a normal curve, which sees a peak in the center and decreases slightly in each direction outward. Overall, the age group of year-olds had the highest access to bicycles, automobiles, and public transportation, which would mean that they are the most mobile age group. It is also worth noting that despite the age group of year-olds only reporting that 72% having access to automobiles, 94% of respondents answered that they own or have access to a bicycle. This is an age group that should be targeted to increase ridership totals across the city due to biking being one of their only modes of available transportation. The variance between the answers of the barriers to riding in the various age groups displays the differing opinions in the rationale for non-ridership. In general, the answers that drew the highest number of votes amongst the barriers to riding were no bike lanes, bike lanes in poor conditions, unsafe intersections, automobile traffic and bad driver behavior. This analysis was found by taking the averages of all the answers and finding the highest values. Nevertheless, there were still some dissent on many of the answers. Many of the differences were predictable based on the responsibilities or tasks associated with each age group. For example, 26% of respondents answered that traveling with small children was a barrier to riding but only 2% of respondents from the age group felt that this was a barrier. There were also major differences that could potentially explain why some age groups exhibit lower rates of riding. Another observation made is that younger age demographics were actually more concerned about both safety barriers and the lack of bicycle infrastructure elements compared to older groups. ounger groups answered that they were more concerned about safety barriers like unsafe intersections and automobile traffic at a higher rate than older age groups. The same was true when comparing the answers of questions regarding bike infrastructure, such as no bicycle parking and no bike lanes. This pattern of greater concern about these important barriers could be due to a large number of issues, but most likely stems from the fact that there are more bikers in the younger age groups, giving them more of a vested interest in improving both the safety of biking but also the bike infrastructure elements. After analyzing the desired improvements from each age group, there were also several conclusions that could be drawn. Some of the desired improvements that received high rates of agreement from the majority of the age groups were more bike lanes, separation from vehicle traffic, maintenance of existing bike lanes, bike routes/greenways, and more neighborhood greenways. The majority of these desired improvements were consistent with the overall results seen from the survey. Workplace Amenities Analysis Summary & Analysis This purpose of this analysis is to determine which worksite settings have the most need for bicyclefriendly amenities. This analysis was conducted by taking the respondents that answered Strongly Agree or Agree to the question regarding the lack of worksite amenities within the barriers to riding. There were 209 respondents that fit this criterion. Next, the workplace zip codes of these respondents 23
26 were sorted to identify which zip codes were the most common. These zip codes were identified as the locations that require the most worksite amenity improvements. The four most common zip codes that require worksite bicycle amenities are (37 respondents), (13 respondents), (11 respondents), and (10 respondents). These zip codes are located within the City of Milwaukee. While these zip codes represent several of the largest job centers within the City of Milwaukee, there are obvious improvements that must be made within these zip codes to increase bike ridership within the City. The recent inclusion of bicycle-friendly workplaces has become increasingly more commonplace within the corporate culture. The benefits of employees choosing to commute via bicycle to their workplace reach far beyond the added morning and afternoon workout. Employees that choose to commute on their bicycle rather than their automobile will drastically decrease their commuting expenses, avoid waiting in morning and evening traffic, and increase their work productivity. In addition to the benefits seen directly by employees, commuting by bike is also drastically safer for the environment. In a recent study published by the European Cyclists Federation, they estimate that choosing to commute by automobile releases up to ten times more greenhouse gases than commuting by bicycle. With so many benefits of biking to work, it should come as no surprise that many workplaces are implementing bicycle-friendly amenities for their employees. Examples of workplace bicycle amenities are shower facilities, bicycle parking facilities, financial incentives for bikers, parking cash-out for unused parking spaces, relaxed dress codes on designated biking days, and flexed start times for biking commuters. Many of these policies could easily be implemented in companies across Milwaukee. Infrequent Rider Analysis Summary This analysis was done to identify the differences between infrequent and frequent riders. An infrequent rider is defined as a respondent that answered that they never ride a bicycle to any of the seven locations/tasks listed within the survey. The remaining riders were classified as a frequent rider. There were 43 respondents that fit the criterion of an infrequent rider. There were 890 respondents that identified as a frequent rider. This analysis is important because it could show what barriers are preventing non-riders from choosing to bike. It could also yield answers on what improvements must be made to make biking more accessible and/or safer for non-riders (Table 5). 24
27 Table 5. Frequent & Infrequent Riders Frequent Riders Infrequent Riders Number of Respondents Transportation Capabilities Own or Have Access to a Bicycle 99% 60% Own or Have Access to an Automobile 93% 93% Have Access to Public Transportation 96% 93% Barriers to Riding No Bicycle Parking 11% 12% No Bike Lane 44% 30% Bike Lanes in Poor Condition 40% 28% Unsafe Intersections 55% 63% Bad Drivers 63% 72% Automobile Traffic 55% 65% Personal Safety Concerns 44% 65% Visually Unappealing Surroundings 8% 14% Do not have the Time to Bike 25% 21% Destinations are too Far Away 31% 19% Bad Weather 44% 23% Lack of Worksite Amenities 23% 14% Traveling with Small Children 12% 7% Too Many Stops to Make 10% 7% Too Much to Carry 23% 16% Uncertainty of Bike Routes 7% 9% Lack of a Bicycle 2% 35% Most Desired Improvements More Bike Lanes 88% 58% Wider/Better Sidewalks 33% 42% More Separation from Vehicle Traffic 88% 74% More Bike Route Signage and Wayfinding 58% 44% Curb bump-outs and Other Traffic Calming Measures 52% 44% Better Intersections 69% 53% More Neighborhood Greenways 73% 53% Maintenance of Existing Bikes Lanes, Routes/Greenways 85% 60% 25
28 Improved Connections Between Bike Lanes, Bikeways, and 78% 63% Sidewalks More Bike Share Stations 28% 40% Education for Motorists, Pedestrians, and Bicyclists 60% 67% Enforcement of Laws for Motorists, Pedestrians, and Bicyclists 66% 79% Worksite Amenities 46% 44% Secure/Protected Bicycle Parking 54% 56% Bicycle Route Map 57% 47% 26
29 Analysis The results of the transportation capabilities of the frequent and infrequent riders provided several interesting observations. It was found that only 60% of infrequent riders own or have access to a bicycle, in comparison to 99% of frequent riders that had access to bicycles. This large disparity is to be expected, as those who do not have access to a bicycle are inherently less likely and/or unable to choose to bike. Both frequent and infrequent riders answered that they have access to an automobile at a rate of 93%. Access to public transportation was similar between the two ridership categories. Frequent riders reported having access to public transportation at a rate of 96% and infrequent riders reported a rate of 93% (Figure 8). 100% Barriers to Riding 80% 60% 40% 20% 0% Bike lanes in poor condition I do not have the time No bike lanes Unsure of route Personal safety concerns Bad weather Too much to carry Frequent Infrequent Figure 8. Depicts largest disparities in barriers to riding answers between the frequent and infrequent riders The barriers to riding of frequent and infrequent riders provided some interesting analysis after the compiling of the data. Infrequent riders responded that the top barriers to riding were personal safety concerns, automobile traffic, bad driver behavior, and unsafe intersections. Conversely, the top barriers to riding for frequent riders were bad driver behavior, unsafe intersections, automobile traffic, bad weather, and personal safety concerns. While the answers from both groups were similar, there were some noticeable differences in the respondent s thoughts on the barriers to riding. The main differences between the two groups were displayed in the automobile traffic, access to a bicycle and personal safety concern barriers. In total, frequent riders agreed that automobile traffic is a barrier at a rate of 51%, while infrequent riders agreed that this was a barrier at a rate of 67%. The personal safety concern barrier received similar results. The results showed that 39% of frequent riders think personal safety concerns were a barrier, while 61% of infrequent riders think that is it a barrier to riding. These two barriers could help the issue of non-ridership within the City. Solving personal safety concerns and alleviating the threat of automobile traffic to bikers could help convince many non-riders to view biking as a safer, conventional transportation option. Finally, 35% of infrequent riders answered that not having access to a bicycle was barrier but only 2% of frequent riders thought it was a barrier. Finally, the desired improvements from both the frequent and infrequent also provided many insightful conclusions about the gap between infrequent and frequent cyclists (Figure 9). The desired improvements that received the highest levels of agreement from frequent riders were more bike lanes, more separation from vehicle traffic, maintenance of existing bike lanes, bike routes/greenways, more neighborhood greenways, and improved connections between bike lanes, bikeways, and sidewalks. 27
30 Infrequent riders also felt that the aforementioned improvements were the most important for increasing ridership. However, despite having the same highest-voted desired improvements, there were still several noteworthy differences in the answering tendencies of the two groups. There were sizeable differences between the two group s answers regarding more bike lanes, maintenance of existing bike lanes, and more neighborhood greenways. In all three cases, frequent riders voted at a higher rate for implementing these improvements in comparison to the lower rate of answers by the infrequent riders. 100% 80% 60% 40% 20% Barriers to Riding 0% More bike lanes Maintenance of existing bike lanes, bike, routes/greenways More neighborhood greenways Improved connections between bike lanes, bikeways and sidewalks Better intersections (bike and pedestrian signals/ crosswalks) More bike route signage and wayfinding More separation from vehicle traffic (protected separated bike lanes / cycletracks) Frequent Infrequent Figure 9. Depicts largest disparities in desired improvements to riding answers between the frequent and infrequent riders Commuter & Recreational Riders Summary For this analysis, respondents were sorted by the locations where they ride their bike to analyze riders that exclusively use their bike for one activity or another. Within this section of analysis bikers were sorted into two groups, Commuting and Recreational. The three answers that comprised the Commuting category were: Go to work, Go to school, or Get to and from a transit stop. The three answers that comprised the Recreational category were: Run errands, Go shopping or to eat, or Exercise or to go to the park. The answer of Other reasons was excluded from this analysis. There were 266 respondents that fit the Recreational criterion, but only four respondents fit the Commuting criterion. Due to the low number of respondents that fit the Commuting criterion, there was no further analysis conducted on this demographic. The desired improvements and barriers to riding of the Recreational rider s demographic was analyzed, however. In addition, a control group was added to this analysis to offer a demographic for comparison against the answers gathered from Recreational riders. This group will be referred to as Other and it comprised of respondents that did not fit the criteria of a Recreational or Commuter rider. There were 677 respondents within this group (Table 6). 28
31 Table 6. Commuters & Recreational Riders Number of Respondents Transportation Capabilities Own or Have Access to a Bicycle Own or Have Access to an Automobile Have Access to Public Transportation Commuters Recreational Riders Other N/A 98% 97% N/A 98% 91% N/A 94% 97% Barriers to Riding No Bicycle Parking N/A 13% 10% No Bike Lane N/A 50% 41% Bike Lanes in Poor Condition N/A 42% 38% Unsafe Intersections N/A 63% 53% Bad Drivers N/A 68% 62% Automobile Traffic N/A 66% 52% Personal Safety Concerns N/A 58% 41% Visually Unappealing Surroundings N/A 10% 8% Do not have the Time to Bike N/A 28% 23% Destinations are too Far Away N/A 35% 29% Bad Weather N/A 42% 44% Lack of Worksite Amenities N/A 25% 21% Traveling with Small Children N/A 12% 12% Too Many Stops to Make N/A 12% 9% Too Much to Carry N/A 25% 22% Uncertainty of Bike Routes N/A 9% 6% Lack of a Bicycle N/A 3% 3% Desired Improvements More Bike Lanes N/A 86% 87% 29
32 Wider/Better Sidewalks N/A 44% 30% More Separation from Vehicle Traffic N/A 90% 86% More Bike Route Signage and Wayfinding N/A 60% 57% Curb bump-outs and Other Traffic Calming N/A 52% 52% Measures Better Intersections N/A 65% 70% More Neighborhood Greenways N/A 67% 74% Maintenance of Existing Bikes Lanes, N/A 84% 85% Routes/Greenways Improved Connections Between Bike Lanes, Bikeways, and N/A 77% 78% Sidewalks More Bike Share Stations N/A 27% 29% Education for Motorists, Pedestrians, N/A 56% 62% and Bicyclists Enforcement of Laws for Motorists, Pedestrians, and N/A 69% 65% Bicyclists Worksite Amenities N/A 39% 48% Secure/Protected Bicycle Parking N/A 55% 54% Bicycle Route Map N/A 64% 53% 30
33 Analysis The transportation capabilities of Recreational riders were similar to the overall results of the survey. The analysis of the Recreational riders showed that 98% of the respondents have access to both a bicycle and an automobile. The results of the analysis showed that 94% have access to public transportation. Those respondents within the Other group responded that 97% had access to a bicycle, 91% have access to an automobile, and 97% have access to public transportation. These results from Recreational riders are consistent with the transportation capabilities from the overall survey responses. Much like many other demographics, Recreational rider respondents thought that the most restrictive barriers to riding were unsafe intersections, bad driver behavior, no bike lanes, personal safety concerns, and automobile traffic. The respondents that fell within the Other category answered that the most restrictive barriers were bad driver behavior, unsafe intersections, automobile traffic, and bad weather. The most desired improvements within this demographic were more bike lanes, more separation from vehicle traffic, maintenance of existing bike lanes, enforcement of laws for motorists, pedestrians, & bicyclists, and improved connections between bike lanes, bikeways, and sidewalks. Conversely, the desired improvements that received the highest amount of responses from those within the Other category were more bike lanes, more separation from vehicle traffic, maintenance of existing bike lanes, and improved connections between bike lanes, bikeways, and sidewalks. By implementing these recommended improvements and eliminating these barriers, not only will the ridership of Recreational bikers increase, but many of these riders will potentially become both Recreational and Commuter riders. Conversely, the small number of riders that use their bikes exclusively for commuting would also be more encouraged to engage in recreational riding as well. 31
34 Section 2. Detailed Analysis of Open-Ended Comments Written by Emma Siegworth University of Wisconsin-Milwaukee, Department of Urban Planning Priority Write-In Comment Analysis This section analyzes the two write-in comment questions about respondents priorities for their communities: Please describe your priorities for safety, accessibility, wellness and livability (Priority 1) and What other priorities should be considered for improving and connecting the community? (Priority 2). These are questions 55 and 58 near the end of the survey in the section called our ideas to improve bicycling in Milwaukee. Below are the categories that each comment was put in. Many comments contained multiple ideas; therefore, they were put into multiple categories. The responses to each question were looked at separately as the responses seemed to have no correlation to each other and respondents answered questions 56 and 57 about intersections before answering Priority 2. The Appendix includes all detailed comments provided under Priority 1 (Appendix F) and Priority 2 (Appendix G). For the most part, comments described negative aspects of bicycling in Milwaukee or changes that respondents would like to see made. For example, if respondents mentioned that they simply liked a bike trail without mentioning that there should be more or better connections, this comment was put in the other category. Likewise, comments that did not say anything related to bicycling or seemed to describe the respondents confusion about the question were also put in an other category. Comment Categories 1. Accessibility + Connectivity describes comments that mentioned the need to connect existing bike lanes or trails together, connect to certain parts of the city with bicycle infrastructure, or create a continuous bicycling infrastructure network. 2. General Personal Safety/Crime Concerns describes comments that mentioned the need to improve safety for bicyclists (without saying it was due to driver behavior or a different reason) or improve safety due to crime. 3. General Bicycle Infrastructure Investment describes comments that mentioned the need for complete streets, investment to be focused on bicyclists instead of motor vehicles, or general bicycle infrastructure improvements such as bike routes, sharrows, or painting bike lanes a solid color. 4. Driver Behavior describes comments that specifically mention motor vehicle drivers causing safety concerns for bicyclists for any reason (ex: speeding, driving too close, being distracted, driving in bike lanes, or opening doors into bicyclists while parked on the street). 5. Education on Driver + Bicyclist Laws describes comments that mention the need for motor vehicle drivers, bicyclists, or the public to be educated on the rules of the road for how they can travel safety together. 6. Law Enforcement describes comments that mention the need for traffic laws (such as those against speeding, driving in bike lanes, running red lights, reckless driving) to be better enforced, or for those who break the law to receive more aggressive consequences. 32
35 7. In-Street Bicycle Infrastructure describes comments that mention the need for more bicycle infrastructure by specifically citing bike lanes (marked/painted, not protected) or bicycle boulevards. 8. Off-Street Bicycle Trails describes comments that mention the need for more bike trails or paths, or expand existing bike trails. 9. Traffic Slowing describes comments that mention the need for lower speed limits, traffic slowing, or traffic calming infrastructure such as curb bump-outs, speed humps, or roundabouts. 10. Road Conditions + Maintenance describes comments that mention the need to repair or repave roads due to potholes, poor pavement condition, etc. 11. Bike Trail/Lane Conditions + Maintenance describes comments that that mention the need to repair or maintain bike trails or lanes better due to their poor condition or poor maintenance (broken glass in lanes, snow not removed). 12. Protected Bike Lanes describes comments that specifically mention the need for more protected or separated bike lanes or cycle tracks. 13. Intersection Safety Concerns describes comments that express concern for safety in intersections or the need for more bicycle-friendly intersections. 14. Increased Signage + Maps describes comments that mention the need for better bicycle signage (such as share the road signs), trail/route wayfinding signage, or trail/route maps. 15. More Bublr Bike Stations describes comments that mention the need for more Bublr or bike share stations. 16. More Bicycle Amenities describes comments that mention the need for more bicycle parking, storage, or bike racks on buses. 17. Better Lighting describes comments that mention the need for more or better lighting on streets or bike trails. 18. Bicyclist Behavior describes comments that specifically mention bicyclists behavior (such as riding on sidewalks, not signaling, running red lights, and not using bike lights at night) causing safety concerns. 19. Bicycle Events + Promotion describes comments that mention the need for more bicycle events such as community rides, ciclovias, and classes, or general promotion of the benefits of bicycling. 20. Other includes comments that do not fit into other categories, locations or facilities that respondents simply mentioned that they liked, and comments about the question or survey itself. Example Individual Comments A sample of individual comments that stood out for their positivity and clarity are provided below. My opinion is that Milwaukee is very bike-able. However, for the uninitiated (kids, my wife, etc) - biking outside my neighborhood is daunting. Separated bike lanes for major bike-thoroughfares would be a great 1st step. ID #10, Priority 1 It seems that the drivers in MKE have gotten much worse in the past few years. Driver behavior in many neighborhoods may be a barrier to less experienced cyclists as well as seasoned cyclists. ID #22, Priority 1 33
36 Walker's Point is pretty good, but I just moved here from the Near West Side (Marquette), and there's no friendly way to bike over there to downtown. Bike lanes are a great start. I moved here from Madison a few years ago, and I'm always surprised at how hard it is to find a bike rack. ID #90, Priority 1 Greenways and separated bike lanes would have greatest long term impact to attract riders who rightfully fear sharing streets with motor vehicles. ID #162, Priority 1 Biking through the greater downtown area is often hazardous because of a lack of bike lanes. I would love to see more bike lanes throughout and introduction of protected bike lanes on a few key streets to allow people to safely traverse downtown. ID #221, Priority 1 Milwaukee needs a comprehensive protected bike path network. Protected lanes invite a far greater diversity of users. ID #223, Priority 1 Milwaukee needs to take the lead and invest heavily in building protected bike lanes and cycle tracks to keep cyclists safe from the pandemic of negligent driver behavior here. Automobiles have the streets, pedestrians have the sidewalks, but bicycles don't have their own space and that needs to change drastically. ID #160, Priority 2 Major designated bike routes that connect the burbs or outlying neighborhoods to downtown. A biking superhighway/greenway similar to that in Minneapolis would be nice. ID #246, Priority 2 There need to be some major improvements in the east/west thoroughfares thorough the city. The Hank Aaron Trail is the only bike path I know of that runs east/west for a substantial distance, but it is even poorly connected in some parts. We need an east/west thoroughfare (whether bike path or substantial bike lanes) for downtown (e.g. Wisconsin Ave.) and for the near north side (e.g. North Ave.). Additionally, expanding north/south paths or bike lanes would be helpful because the primary ones are on the far eastern or western parts of the city. Something like developing the 30th St. corridor could meet a major need there. ID #448, Priority 2 We should find more opportunities to develop separated path bike routes (separated lanes, offroad paths, etc,). We built the raised bike lane on Bay Street years ago and never duplicated it despite the fact that it seems to work well. ID #601, Priority 2 Bike lanes, bike parking, and incentives/education to bigger downtown companies that could promote bike commuting with its employees! I feel that more people would bike commute if they could feel more secure in a marked bike lane and if there was a legit place to park their bike at their destination (not to a meter or light pole). ID #670, Priority 2 I think a big reason why more people do not commute to work by bicycle is the lack of facilities required to change, shower, etc. Thankfully my company has those; but I've learned that a majority do not. In short, if facilities can be built that would allow for such, more folks would make bike commuting a factor in their lives. ID #811, Priority 2 34
37 Streets should be designed to accommodate ALL forms of transportation, pedestrian, bike, public transit. Many of our streets were designed for cars only. When the streets tell people that they're meant for cars, people will take their car. When the streets signal that they are designed for all forms, people are more likely to choose what type of transportation best fits their needs on that particular day. ID #895, Priority 2 Conclusions Priorities 1 and 2 were each analyzed separately (as shown in Appendix F and Appendix G), but below is a chart describing the percentage of comments from a respondent that lives in a Milwaukee zip code which mentioned each priority or concern for either question (Figure 10). This is a percentage out of the total number of usable comments from respondents that live in a Milwaukee zip code. As shown, the top priorities and concerns mentioned in at least 14% of Milwaukee zip code respondent comments are protected bike lanes, accessibility + connectivity, instreet bicycle infrastructure, and driver behavior. When looking at these top priorities and concerns by the zip codes most represented in the survey, the top categories did not vary much. This breakdown by zip code is shown below (Table 7). Priorities and Concerns for Bicycling in Milwaukee Protected Bike Lanes Accessibility + Connectivity In-Street Bicycle Infrastructure Driver Behavior Education on Driver + Bicyclist Laws Law Enforcement General Personal Safety/Crime Concerns Road Conditions + Maintenance Off-Street Bicycle Trails General Bicycle Infrastructure Investment More Bicycle Amenities Bike Trail/Lane Conditions + Maintenance Traffic Slowing Increased Signage + Maps Bicycle Events + Promotion Bicyclist Behavior 0% 2% 4% 6% 8% 10% 12% 14% 16% 18% 20% Percent of Milwaukee Zip Code Respondent Comments Figure 10. Priorities and Concerns Cited in Open-Ended Comments 35
38 Table 7. Top Bicycle Priorities and Concerns by most common respondent Zip Codes Priority 1 (Question 55) All Comments Milwaukee Zip Codes N/A Other Usable Accessibility/Connectivity % % % % % % % 2 7.4% % General Personal Safety/Crime Concerns % % 7 7.7% 3 4.2% 4 7.5% % 4 9.3% % 1 7.7% General Bicycle Infrastructure Investment % % 4 4.4% 3 4.2% 2 3.8% 3 6.0% 1 2.3% 1 3.7% 0 0.0% Driver Behavior % % % % % % % % % Education on Driver + Bicyclist Laws % % 6 6.6% 6 8.5% 2 3.8% % 2 4.7% % 1 7.7% Law Enforcement % % 8 8.8% 7 9.9% % % % 1 3.7% % In-Street Bicycle Infrastructure % % % % % % % % % Off-Street Bicycle Trails % % 3 3.3% 3 4.2% 1 1.9% 1 2.0% 2 4.7% 1 3.7% 1 7.7% Traffic Slowing % % 5 5.5% 5 7.0% % 2 4.0% 3 7.0% 0 0.0% 1 7.7% Road Conditions % % 8 8.8% % % 2 4.0% 2 4.7% 1 3.7% % Bike Trail/Lane Conditions % % 8 8.8% 6 8.5% 4 7.5% 1 2.0% 1 2.3% 1 3.7% % Protected Bike Lanes % % % % % % % % 1 7.7% Intersection Safety Concerns % % 3 3.3% 4 5.6% 4 7.5% 4 8.0% 3 7.0% 0 0.0% 1 7.7% Increased Signage + Maps % % 5 5.5% 3 4.2% 0 0.0% 4 8.0% 3 7.0% 0 0.0% 1 7.7% More Bublr Bike Stations 5 1.1% 5 1.2% 1 1.1% 1 1.4% 0 0.0% 0 0.0% 2 4.7% 1 3.7% 0 0.0% More Bicycle Amenities % % 2 2.2% 1 1.4% 2 3.8% 0 0.0% 3 7.0% 2 7.4% 0 0.0% Better Lighting % % 0 0.0% 2 2.8% 2 3.8% 1 2.0% 3 7.0% 0 0.0% 1 7.7% Bicyclist Behavior % % 8 8.8% 2 2.8% 2 3.8% 4 8.0% 2 4.7% 0 0.0% 1 7.7% Bicycle Events + Promotion 5 1.1% 4 0.9% 1 1.1% 1 1.4% 0 0.0% 1 2.0% 1 2.3% 0 0.0% 0 0.0% Priority 2 (Question 58) All Comments Milwaukee Zip Codes N/A Other Usable Accessibility + Connectivity % % % % % % % % 0 0.0% General Personal Safety/Crime Concerns % % 3 4.2% 1 1.4% 5 8.8% 4 9.1% 1 2.2% 2 7.1% 0 0.0% General Bicycle Infrastructure Investment % % 5 6.9% 5 7.2% % 3 6.8% 4 8.9% 1 3.6% 0 0.0% Driver Behavior % % 6 8.3% 3 4.3% % % 0 0.0% 1 3.6% 0 0.0% Education on Driver + Bicyclist Laws % % % % 5 8.8% % % % % Law Enforcement % % 1 1.4% 5 7.2% % 3 6.8% 2 4.4% 2 7.1% % In-Street Bicycle Infrastructure % % % % % 4 9.1% % % 0 0.0% Off-Street Bicycle Trails % % 6 8.3% % 1 1.8% % 3 6.7% % % Traffic Slowing % % 2 2.8% 4 5.8% 3 5.3% 3 6.8% 1 2.2% 1 3.6% 0 0.0% Road Conditions + Maintenance % % 6 8.3% 3 4.3% 2 3.5% 1 2.3% 4 8.9% 0 0.0% % Bike Trail/Lane Conditions + Maintenance % % 4 5.6% 3 4.3% 2 3.5% 0 0.0% 2 4.4% 1 3.6% 0 0.0% Protected Bike Lanes % % % % 5 8.8% % % % 0 0.0% Intersection Safety Concerns % % 3 4.2% 3 4.3% 1 1.8% 0 0.0% 3 6.7% 0 0.0% 0 0.0% Increased Signage + Maps % % 4 5.6% 3 4.3% 1 1.8% 3 6.8% 3 6.7% 1 3.6% 0 0.0% More Bublr Bike Stations % % 1 1.4% 5 7.2% 1 1.8% 0 0.0% 3 6.7% 2 7.1% 0 0.0% More Bicycle Amenities % % 5 6.9% 4 5.8% 5 8.8% % 4 8.9% 1 3.6% % Better Lighting 7 1.6% 7 1.8% 2 2.8% 1 1.4% 1 1.8% 1 2.3% 0 0.0% 0 0.0% 0 0.0% Bicyclist Behavior % % 5 6.9% 3 4.3% 5 8.8% 1 2.3% 1 2.2% 1 3.6% 0 0.0% Bicycle Events + Promotion % % 5 6.9% % 5 8.8% % 4 8.9% 2 7.1% 0 0.0% Priority 1 (Q 55) + Priority 2 (Q 58) All Comments Milwaukee Zip Codes Usable Accessibility + Connectivity % % % % % % % % % General Personal Safety/Crime Concerns % % % 4 2.9% 9 8.2% % 5 5.7% % 1 5.3% General Bicycle Infrastructure Investment % % 9 5.5% 8 5.7% % 6 6.4% 5 5.7% 2 3.6% 0 0.0% Driver Behavior % % % % % % 7 8.0% 5 9.1% % Education on Driver + Bicyclist Laws % % % % 7 6.4% % % % % Law Enforcement % % 9 5.5% % % % 8 9.1% 3 5.5% % In-Street Bicycle Infrastructure % % % % % % % % % Off-Street Bicycle Trails % % 9 5.5% % 2 1.8% 8 8.5% 5 5.7% 4 7.3% % Traffic Slowing % % 7 4.3% 9 6.4% % 5 5.3% 4 4.5% 1 1.8% 1 5.3% Road Conditions + Maintenance % % % % 9 8.2% 3 3.2% 6 6.8% 1 1.8% % Bike Trail/Lane Conditions + Maintenance % % % 9 6.4% 6 5.5% 1 1.1% 3 3.4% 2 3.6% % Protected Bike Lanes % % % % % % % % 1 5.3% Intersection Safety Concerns % % 6 3.7% 7 5.0% 5 4.5% 4 4.3% 6 6.8% 0 0.0% 1 5.3% Increased Signage + Maps % % 9 5.5% 6 4.3% 1 0.9% 7 7.4% 6 6.8% 1 1.8% 1 5.3% More Bublr Bike Stations % % 2 1.2% 6 4.3% 1 0.9% 0 0.0% 5 5.7% 3 5.5% 0 0.0% More Bicycle Amenities % % 7 4.3% 5 3.6% 7 6.4% 5 5.3% 7 8.0% 3 5.5% 1 5.3% Better Lighting % % 2 1.2% 3 2.1% 3 2.7% 2 2.1% 3 3.4% 0 0.0% 1 5.3% Bicyclist Behavior % % % 5 3.6% 7 6.4% 5 5.3% 3 3.4% 1 1.8% 1 5.3% Bicycle Events + Promotion % % 6 3.7% 9 6.4% 5 4.5% 9 9.6% 5 5.7% 2 3.6% 0 0.0% 36
39 Intersection Write-In Comment Analysis This section analyzes the two write-in questions about respondents thoughts on the intersections, corridors, and areas in Milwaukee that need improvement: What intersection(s) and/or corridor(s) do you feel have the highest safety concerns in Milwaukee? (Intersection 1) and What intersection(s) and/or corridor(s) would you most like to see improved in Milwaukee? (Intersection 2). These are questions 56 and 57 towards the end of the survey in the section called our ideas to improve bicycling in Milwaukee. The responses to each question was looked at next to each other as a pair because they seemed to correlate to each other. Pairs of responses could contain multiple ideas; therefore, they were put into multiple categories. Below are the categories that these comments were put in. Comment Categories 1. Intersection comments mentioned having safety concerns about or the desire to improve bicycle infrastructure of at least one intersection, usually denoted by street names separated by and or /. 2. Corridor comments mentioned having safety concerns about or the desire to improve bicycle infrastructure of at least one corridor or street. 3. Area comments mentioned having safety concerns about or the desire to improve bicycle infrastructure in at least one area or neighborhood in the Milwaukee area or between multiple areas or neighborhoods. The names of the areas and neighborhoods mentioned were noted next to each comment. 4. North-South Connection comments mentioned having the desire to improve connections between the North and South of the Milwaukee area. 5. East-West Connection comments mentioned having the desire to improve connections between the East and West of the Milwaukee area. 6. Trail Connection comments mentioned having safety concerns about or the desire to improve connections among bicycle trails or other streets. The trail name and connection desired are noted next to each comment. Data Analysis Only comments from respondents living in Milwaukee zip codes were analyzed for this section. Each Milwaukee zip code with more than 20 usable response pairs was analyzed separately in order to determine the most important intersections, corridors, areas, connections, and trails for each zip code (Table 8). All location-specific comments are provided in the Appendix (Appendix H). First, I filtered the responses by zip code and categorized each response pair into one or more of the above categories. Then, I noted how many response pairs fit into each category. This number is listed next to General Intersections, General Corridors, or General Areas. Then, by filtering by each of the categories, I attempted to find the most mentioned intersections and corridors, listed under Intersections and Corridors. These numbers are the number of times the corridor or intersection was mentioned by a response pair. To find even more highly mentioned streets, I created another category called General Mentions. This is how many times each street was mentioned by a response pair, regardless if it was described as a corridor or as a part of an intersection. These tables also list the number of times each response pair mentioned a directional connection, a specific area or neighborhood, or a trail. 37
40 Table 8. Top Bicycle Improvement Locations Suggested by most common respondent Zip Codes Responses General Mentions Intersections Corridors Areas Directional Connections Trail Connections Total Responses 90 Water 17 General Intersections 25 General Corridor 34 General Area 24 North-South 5 Trail Connections 5 N/A 26 Brady 16 Brady/Farwell/Cambridge 4 Water Street 10 Downtown 15 East-West 6 Oak Leaf 5 Usable 64 North 12 Water/Brady 4 Wisconsin 7 East Side 4 Hank Aaron 1 Van Buren 6 North 4 Third Ward 3 Humbolt 5 East Town 2 National 3 North Side 2 West Side 2 Bay View 2 Northwest Side Responses General Mentions Intersections Corridors Areas Directional Connections Trail Connections Total Responses 125 Water Street/1st 29 General Intersections 42 General Corridor 51 General Area 40 North-South 14 Trail Connections 8 N/A 32 Oklahoma 12 Howell/Lincoln/KK 13 Water Street/1st 18 Downtown 28 East-West 7 Oak Leaf 3 Usable 93 Chase 11 KK/1st/Maple 6 Kinnickinnic 14 Bay View 14 Hank Aaron 1 2nd 7 Chase/Oklahoma 3 Oklahoma 6 South Side 7 KK River Trail 3 North 6 Chase 6 Third Ward 6 Center 5 North Side 4 Wisconsin 4 Walker's Point 3 East Side 1 Northwest Side 1 West Side 1 Harbor District 1 Central City 1 Tippecanoe Responses General Mentions Intersections Corridors Areas Directional Connections Trail Connections Total Responses 102 Lisbon 13 General Intersections 20 General Corridor 49 General Area 18 North-South 7 Trail Connections 7 N/A 35 35th 12 North/Lisbon 2 Hawley 9 Downtown 10 East-West 7 Oak Leaf 1 Usable 67 27th 11 27th/Highland 2 Wisconsin 8 West Side 6 Hank Aaron 5 Highland 10 35th/Highland 2 Vliet 8 North Side 4 All trails Vilet 10 Lisbon/Walnut 7 Menomonee Valley 2 Hawley 10 North 7 Third Ward 1 Wisconsin 9 Highland 5 East Side 1 Lake Drive 5 Northwest Side 1 Hwy South Side 1 27th 4 Wauwatosa 1 35th 4 Washington Park 1 Center 3 Washington Heights Responses General Mentions Intersections Corridors Areas Directional Connections Trail Connections Total Responses 161 Locust 25 General Intersections 35 General Corridor 73 General Area 42 North-South 3 Trail Connections 10 N/A 50 Water Street/1st 22 Brady/Farwell/Cambridge 10 Water Street/1st 17 Downtown 25 East-West 13 Oak Leaf 8 Usable 111 Oakland 21 Oakland/Locust 9 North 14 East Side 10 Hank Aaron 1 Brady 13 Oakland/Capitol 2 Locust 13 Bay View 5 Beerline 1 Farwell 13 Oakland/North 2 Lake Drive 11 Third Ward 4 All trails 1 Wisconsin 11 Water/Brady 3 Wisconsin 10 West Side 3 Prospect 11 Capitol Drive 7 Wauwatosa 2 Capitol 10 Prospect 5 Riverwest 2 Humboldt 9 Michigan 5 Fifth Ward 2 Michigan 8 Center 3 Lakefront 2 Center 6 Farwell 3 UWM 2 Cambridge 4 Northwest Side 1 West Town 1 Walker's Point 1 Western Suburbs Responses General Mentions Intersections Corridors Areas Directional Connections Trail Connections Total Responses 122 Locust 38 General Intersections 41 General Corridor 74 General Area 22 North-South 3 Trail Connections 7 N/A 26 Water/1st 35 Locust/Humboldt 8 Locust 28 Downtown 14 East-West 7 Oak Leaf 5 Usable 96 Humboldt 24 North/Humboldt 7 Water/1st 26 Third Ward 4 Hank Aaron 2 Brady 18 North 22 Bay View 4 Beer Line 1 Holton 17 Brady 10 East Side 3 All trails 1 Capitol 15 Commerce 6 North Side 2 Commerce 8 Holton 6 Walker's Point 2 Fond du Lac 8 Fond du Lac 5 West Side 1 Oakland 7 Capitol 4 South Side 1 Wisconsin 7 Riverwest 1 Fond du Lac and North 1 Inner City 1 Washington Heights 1 Harambee 1 Clarke Square 1 Wauwatosa Responses General Mentions Intersections Corridors Areas Directional Connections Trail Connections Total Responses 51 Bluemound 7 General Intersections 8 General Corridor 19 General Area 16 North-South 2 Trail Connections 4 N/A 15 Wisconsin 7 76/North 2 Bluemound 6 Downtown 9 East-West 8 Oak Leaf 2 Usable 36 Hwy North 5 Wauwautosa 5 Hank Aaron 3 Burleigh 3 Wisconsin 5 West Side 3 Silver Spring 3 76th 4 North Side 2 Vliet 2 Northwest Side 2 Third Ward 1 East Side 1 Mequon 1 38
41 Appendix A. Survey Instrument This appendix includes the English and Spanish versions of the online survey instrument.
42 Path to Platinum - Community Survey on Bicycling Please provide the following information: * Required 1. Last Name 2. First Name * 3. (optional) 4. Organization 5. Home Zip Code * 6. If employed, what is your work Zip Code? 7. If employed or a student, how far do you live from your primary job or school? Less than a mile One to five miles Five to ten miles More than ten miles Other:
43 8. What is your age range? 15 or under or over 9. What is your gender? Male Female Other: 10. With which Milwaukee neighborhood(s) do you associate most(you may choose more than one, such as one for home, work, school, etc.)? Check all that apply. Arlington Heights Bay View Beerline B Brewers' Hill 2761 N. Downer Ave. Bronzeville Clarke Square Cold Spring Park Concordia East Side East Town East Village Enders Park Franklin Heights Grantosa Heights Granville Grover Heights Halyard Park Harambee
44 Havenwoods Hillside/Lapham Park Historic Third Ward Historic Water Tower Holler Park Jackson Park Jones Island Kops Park Layton Park Lincoln Village Marquette University (University Hill) Martin Drive Menomonee River Valley Merrill Park Metcalfe Park Midtown Mitchell Street Mount Mary Murray Hill Park West Piggsville Riverwest Sherman Park Story Hill Thurston Woods Tippecanoe Town of Lake Uptown Crossing Walker's Point Walnut Hill Washington Heights Washington Park Westown Williamsburg Heights Other: Transportation Options
45 11. Do you own or have access to a bicycle? * es No 12. Do you own or have access to an automobile (includes motorcycle)? * es No 13. Do you have access to public transportation (MCTS, Amtrak)? * es No our bicycling habits On average, how frequently do you BICCLE outside for the following reasons? 14. Go to work? * Daily At least once a week At least once a month At least once a year Never 15. Go to school? * Daily At least once a week At least once a month At least once a year Never
46 16. Get to and from a transit stop? * Daily At least once a week At least once a month At least once a year Never 17. Run errands? * Daily At least once a week At least once a month At least once a year Never 18. Go shopping or to eat? * Daily At least once a week At least once a month At least once a year Never 19. Exercise or go to the park? * Daily At least once a week At least once a month At least once a year Never
47 20. Other reasons? * Daily At least once a week At least once a month At least once a year Never our bicycle routes 21. Which of the following do you use the most when you ride a bicycle to work or school? Check all that apply. City streets and/or roadways Streets and/or roads marked as Bike Routes Bike Lanes (striped lane dedicated to bicycles on roadways) Off-street trails (eg. Oak Leaf Trail, Hank Aaron Trail, other bicycle/pedestrian shared pathways) Protected bike lanes (cycle tracks) Sidewalks Do Not Ride Other: Barriers to bicycling in Milwaukee How would you rate the following as reasons that you do not BICCLE more frequently 22. No bicycle parking Major reason Not a reason 23. No bike lanes Major reason Not a reason
48 24. Bike lanes in poor condition Major reason Not a reason 25. Unsafe intersections Major reason Not a reason 26. Bad driver behaviors Major reason Not a reason 27. Automobile traffic Major reason Not a reason 28. Personal safety concerns Major reason Not a reason 29. Visually unappealing surroundings Major reason Not a reason
49 30. I do not have the time Major reason Not a reason 31. Destinations are too far away Major reason Not a reason 32. Bad weather Major reason Not a reason 33. Lack of worksite amenities (eg. showers) Major reason Not a reason 34. Travel with small children Major reason Not a reason 35. Too many stops to make Major reason Not a reason
50 36. Too much to carry Major reason Not a reason 37. Unsure of route Major reason Not a reason 38. I do not have a bike Major reason Not a reason Bicycle Improvements How important do you think the following improvements would be in supporting bicycling in Milwaukee? 39. More bike lanes Very important Not important
51 40. Wider/better sidewalks Very important Not important 41. More separation from vehicle traffic (protected separated bike lanes / cycletracks) Very important Not important

52 42. More bike route signage and wayfinding Very important Not important 43. Curb bump-outs and other traffic calming measures Very important Not important
53 44. Better intersections (bike and pedestrian signals/ crosswalks) Very important Not important 45. More neighborhood greenways Very important Not important
54 46. Maintenance of existing bike lanes, bike, routes/greenways Very important Not important 47. Improved connections between bike lanes, bikeways and sidewalks Very important Not important
55 48. More bike share stations (Bublr) Very important Not important 49. Education for motorists, pedestrians, & bicyclists Very important Not important
56 50. Enforcement of laws for motorists, pedestrians, & bicyclists Very important Not important 51. Worksite amenities (lockers, showers, dressing rooms) Very important Not important
57 52. Secure / protected bicycle parking Very important Not important 53. Bicycle route map Very important Not important
58 54. If it were safe and convenient, how likely would you be willing to walk or bike for the following reasons? Check all that apply. Go to work Go to school Get to and from a transit stop Run errands Go shopping or to eat Exercise or go to the park Other: our ideas to improve bicycling in Milwaukee In the following section, we would like to hear from you what priorities you see needed in your specific neighborhood(s), that you feel could improve the safety, accessibility, wellness and livability of your community as it relates to bicycling. 55. Please describe your priorities for safety, accessibility, wellness and liveability of your community below 56. What intersection(s) and/or corridor(s) do you feel have the highest safety concerns in Milwaukee? 57. What intersection(s) and/or corridor(s) would you most like to see improved in Milwaukee? 58. What other priorities should be considered for improving and connecting the community? Our identity
59 Our final question deals with identity and branding. As an important stakeholder in this effort, you have already shown interest in making Milwaukee better through bicycling. We are asking our stakeholders to weigh in on how we should name our movement as we go forward. Please help by voting for your choice below: 59. What name do you prefer for our identity? Path to Platinum A Better Milwaukee Through Bicycling Better Biking Milwaukee Milwaukee Moves Other: Powered by
60 Via al Platino - Encuesta comunitaria sobre el ciclismo Por favor proporciónenos la siguiente información: * Required 1. Apellido 2. Nombre * 3. Correo electrónico: (opcional) 4. Organización 5. Código Postal donde vives * 6. Si estás empleado, Cuál es el código postal donde trabajas? 7. Si eres un empleado o un estudiante, que tan lejos vives de tu trabajo o escuela? A menos de una milla De una a cinco millas De cinco a diez millas Más de diez millas Other:
61 8. Cuál es tu rango de edad? 15 o menos años o más 9. Cuál es tu genero? Hombre Mujer Other: 10. Cuáles son los vecindarios de Milwaukee con los que te relacionas más (puedes elegir más de uno, como por ejemplo puedes mencionar el vecindario donde vives, donde trabajas, donde estudias etc.)? Check all that apply. Arlington Heights Bay View Beerline B Brewers' Hill Brady Street Bronzeville Clarke Square Cold Spring Park Concordia East Side East Town East Village Enders Park Franklin Heights Grantosa Heights Granville Grover Heights Halyard Park Harambee
62 Havenwoods Hillside/Lapham Park Historic Third Ward Historic Water Tower Holler Park Jackson Park Jones Island Kops Park Layton Park Lincoln Village Marquette University (University Hill) Martin Drive Menomonee River Valley Merrill Park Metcalfe Park Midtown Mitchell Street Mount Mary Murray Hill Park West Piggsville Riverwest Sherman Park Story Hill Thurston Woods Tippecanoe Town of Lake Uptown Crossing Walker's Point Walnut Hill Washington Heights Washington Park Westown Williamsburg Heights Other: Opciones de Transporte
63 11. Eres dueño de una bicicleta o tienes acceso a alguna? * Sí No 12. Eres dueño o tienes acceso a un automóvil (incluye motocicleta)? * Sí No 13. Tienes acceso a transportación publica (MCTS, Amtrak)? * * Sí No Tus hábitos de ciclismo En promedio, Con qué frecuencia manejas bicicleta por las siguientes razones? 14. Para ir al trabajo? * Diariamente Al menos una vez por semana Al menos una vez al mes Al menos una vez al año Nunca 15. Para ir a la escuela o universidad? * Diariamente Al menos una vez por semana Al menos una vez al mes Al menos una vez al año Nunca
64 16. Para ir y regresar de una parada del bus? * Diariamente Al menos una vez por semana Al menos una vez al mes Al menos una vez al año Nunca 17. Para hacer mandados? * Diariamente Al menos una vez por semana Al menos una vez al mes Al menos una vez al año Nunca 18. Para ir a comer o de compras? * Diariamente Al menos una vez por semana Al menos una vez al mes Al menos una vez al año Nunca 19. Para hacer ejercicio o ir al parque? * Diariamente Al menos una vez por semana Al menos una vez al mes Al menos una vez al año Nunca
65 20. Por otras razones? * Diariamente Al menos una vez por semana Al menos una vez al mes Al menos una vez al año Nunca Sus rutas en bicicleta: 21. Cuál de las siguientes opciones usas más cuando vas al trabajo o a la escuela/universidad en bicicleta? Check all that apply. Calles y / o avenidas Calles y / o avenidas con rutas marcadas para bicicletas Carriles para bicicletas (carril con rayas dedicadas a las bicicletas en la calle) Senderos fuera de las calles (por ejemplo Oak Leaf Trail, Hank Aaron Trail, otros caminos compartidos para bicicletas / peatones) Carriles para bicicletas protegidas (pistas para bicicletas) Aceras No utilizo una bici Other: Las barreras para manejar bicicleta en Milwaukee Enumera las siguientes razones por las cuales no manejas bicicleta con más frecuencia? 22. No encuentro estacionamientos para bicicletas Razón principal No es una razón 23. No hay carriles para bicicletas Razón principal No es una razón
66 24. Los carriles para bicicletas están en mal estado Razón principal No es una razón 25. Hay intersecciones peligrosas Razón principal No es una razón 26. Mal comportamiento de los conductores Razón principal No es una razón 27. El tráfico de automóviles Razón principal No es una razón 28. Me preocupa mi seguridad personal Razón principal No es una razón 29. Un ambiente visual poco atractivo Razón principal No es una razón
67 30. No tengo tiempo Razón principal No es una razón 31. Los lugares están demasiado lejos Razón principal No es una razón 32. El mal clima Razón principal No es una razón 33. La falta de instalaciones/servicios en el lugar de trabajo (por ejemplo duchas) Razón principal No es una razón 34. Llevo niños pequeños conmigo Razón principal No es una razón 35. Demasiadas paradas que hacer Razón principal No es una razón

68 36. Demasiadas cosas para cargar Razón principal No es una razón 37. No estoy familiarizado con las rutas Razón principal No es una razón 38. No tengo una bicicleta Razón principal No es una razón Mejoras para andar en bicicleta Qué tan importante crees que son las siguientes mejoras para apoyar el ciclismo en Milwaukee? 39. Más carriles para bicicletas Muy importante No importante

69 40. Aceras más anchas y en buenas condiciones Muy importante No importante
 1 2 3 4 5 Muy importante No importante")
70 41. Que haya mas separación del tráfico vehicular (carriles de bicicleta que estén protegidos y separados) Muy importante No importante

71 42. Mayor señalización para bicicletas Muy importante No importante

72 43. Extensiones de bordillos y otras medidas para detener o reducir el tráfico Muy importante No importante 44. Mejores intersecciones (señales para bicicletas y peatones) Muy importante No importante
 1 2 3 4 5 Muy importante No")

73 45. Más calles residenciales, tranquilas y seguras (zonas verdes) Muy importante No importante 46. Matenimiento de carriles y áreas verdes para bicicletas Muy importante No importante


74 47. Mejoras en las conexiones entre carriles, rutas para bicicletas y aceras Muy importante No importante 48. Más estaciones y lugares para rentar bicicletas (Bublr) Muy importante No importante


75 49. Educación para motociclistas, ciclistas, y peatones Muy importante No importante 50. Aplicación de las leyes para los automovilistas, ciclistas, y peatones Muy importante No importante
 1 2 3")

76 51. Servicios en el lugar de trabajo (taquillas/casilleros, duchas, vestidores) Muy importante No importante 52. Estacionamiento seguro para bicicletas Muy importante No importante

77 53. Mapa con rutas para bicicletas Muy importante No importante 54. Si existiera un ambiente seguro y conveniente, qué tanto estarías dispuesto a caminar o manejar bicicleta por las siguientes razones? Check all that apply. Ir al trabajo Ir al colegio Ir y venir de una parada de tránsito Hacer mandados Ir de compras o comer Hacer ejercicio o ir al parque Other: Necesitamos tus ideas para mejorar el uso de bicicletas en Milwaukee En la siguiente sección, nos gustaría escuchar de ti y lo que tu consideres como prioridades necesarias en tu vecindario(s) que podrían mejorar la seguridad, accesibilidad, bienestar y la calidad de vida de tu comunidad respecto al uso de bicicletas.
78 55. Por favor describe tus prioridades de seguridad, accesibilidad, bienestar y calidad de vida de tu comunidad abajo Qué intersecciones sientes que tienen los mayores problemas de seguridad en Milwaukee? 57. Cuál es la intersección(es) principal que te gustaría ver mejorada en Milwaukee? 58. Qué otras prioridades deben ser consideradas para lograr el mejoramiento y la conexión comunitaria? Nuestra identidad Nuestra última pregunta se refiere a la identidad y al nombre del grupo o movimiento. Como miembro de la comunidad, tu participación y voto es muy importante en este esfuerzo, y ya lo has demostrado teniendo interés en mejorar el ciclismo en Milwaukee. Estamos preguntando a todas las personas que están llenando esta encuesta para que nos den su opinión sobre cómo debemos llamar a este movimiento a medida que avanzamos. Por favor ayúdenos votando por un nombre en la siguiente sección. 59. Qué nombre prefiere para nuestra identidad? Via al Platino Un mejor Milwaukee a través del ciclismo Mejorando el Ciclismo en Milwaukee Milwaukee se mueve Other:
79 Powered by
80 Appendix B. Survey Distribution Message A variety of messages were used to share the Path to Platinum survey link with potential participants. This appendix provides examples of a long and short message used to share the survey. Long Version The mission of the Milwaukee Path to Platinum initiative is: "Engage the whole Milwaukee community to advocate for better bicycling and safer streets for all." Our mission emphasizes involving all neighborhoods across the community, including people and groups who have not traditionally been involved in bicycle advocacy. We believe that this will help create a better Milwaukee by supporting health, safety, independence, and prosperity. To help gather input from people throughout Milwaukee, we invite you to take our Path to Platinum Community Bicycling Survey at: (A Spanish version of the survey is at: Please take the survey and share it widely. We want to hear from as many people as possible across Milwaukee! On Bike To Work Day in June, Mayor Barrett announced the Path to Platinum, which would make Milwaukee one of the leading communities for bicycling in the entire country. Prior to that announcement, we had already established a dedicated core team of volunteers (including representatives from UW-Milwaukee, UW-Extension, Marquette University, Bublr Bikes, Black Girls Do Bike, Rails-to-Trails Conservancy, Sixteenth Street Community Health Clinics, and the Wisconsin Bicycle Federation). We have conducted outreach at events on the north and south sides of the city and are planning additional workshops in the coming months. Based on community feedback, we are likely to advocate for improvements such as more bicycle trails, new buffer-separated bicycle lanes on certain Downtown streets, neighborhood greenways (traffic-calmed, bike-friendly local streets) in residential areas, and major roadway crossing improvements. More details about Path to Platinum are at Short Version >>>>>>>>>>>>>>>>>> Milwaukee Path to Platinum Bicycling Newsletter and Survey: Please Share Widely Please provide your input to improve bicycling and create safer streets throughout Milwaukee! The Path to Platinum Fall Newsletter is here: -Fall-Newsletter/master/P2P%20Fall%20Newsletter.html And the Path to Platinum Community Bicycling Survey is here: (Spanish version:
81 Please take the survey and share it widely. We want to hear from as many people as possible across Milwaukee! Thanks, The Path to Platinum Team Facebook: >>>>>>>>>>>>>>>>>>
82 Appendix C. Reported Pedestrian and Bicyclist Crashes by Aldermanic District The table below summarizes the total number of pedestrian and bicyclist crashes reported in each City of Milwaukee Aldermanic District between 2011 and 2015 (Table C.1). The data come from the Wisconsin Department of Transportation s WisTransPortal Database. While these crash data are from the most complete source available, typical rates of underreporting suggest that at least twice as many collisions between automobiles and pedestrians and bicyclists have occurred in Milwaukee streets and parking lots. It is important to recognize that, all else equal, Aldermanic Districts with more pedestrian and bicyclist activity are likely to have more pedestrian and bicyclist crashes. Therefore, districts with more pedestrian and bicyclist crashes do not necessarily have greater risk for walking or bicycling (measured as crashes per pedestrian or bicyclist trips, distance traveled, or time traveled). Nonetheless, to create safer streets for everyone, we should seek to eliminate pedestrian and bicyclist crashes in all parts of Milwaukee. Table C.1. Reported Pedestrian and Bicyclist Crashes by Aldermanic District, Bicyclist Pedestrian % of % of Fatalities Crashes % of % of Fatalities District Crashes Crashes Fatalities Crashes Fatalities % 0 0.0% % 3 4.6% % % % 5 7.7% % 0 0.0% % 2 3.1% % 0 0.0% % 4 6.2% % 0 0.0% % 1 1.5% % % % 6 9.2% % 0 0.0% % 5 7.7% % % % 5 7.7% % 0 0.0% % 1 1.5% % 0 0.0% % 4 6.2% % 0 0.0% % 1 1.5% % 0 0.0% % % % 0 0.0% % 2 3.1% % % % 5 7.7% % 0 0.0% % 4 6.2% Not geocoded % 0 0.0% % % Total % % % % Note: The totals by ward and for the City of Milwaukee as a whole include some crashes in border areas with other municipalities. Therefore, some crashes that occurred in Milwaukee may have been reported in a neighboring municipality and some crashes that occurred in a neighboring municipality may have been reported in Milwaukee. A cursory review of these crashes suggests that it could impact these totals by approximately 1%.


83 Appendix D. Milwaukee County Bicyclist Crash Density


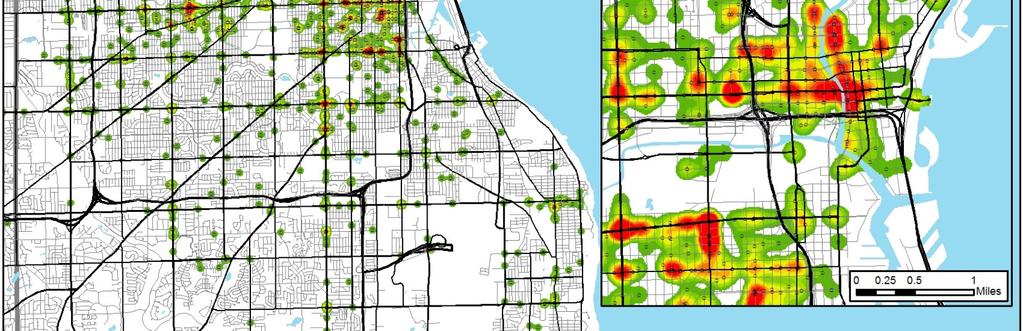
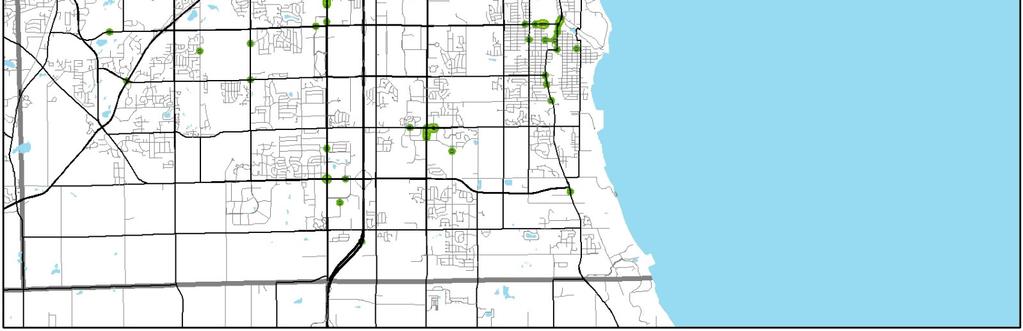
84 Appendix E. Milwaukee County Pedestrian Crash Density
PEDESTRIAN ACTION PLAN
 ATTACHMENT 2 CITY OF SANTA MONICA PEDESTRIAN ACTION PLAN CITY OF SANTA MONICA PEDESTRIAN ACTION PLAN This page intentionally left blank EXECUTIVE SUMMARY CHAPTER 1 EXECUTIVE SUMMARY Setting the Stage
EXECUTIVE SUMMARY. Vision
 Vision Walking and bicycling in Salt Lake City will be safe, convenient, comfortable, and viable transportation options that connect people to places, foster recreational and economic development opportunities,
City of Novi Non-Motorized Master Plan 2011 Executive Summary
 City of Novi Non-Motorized Master Plan 2011 Executive Summary Prepared by: February 28, 2011 Why Plan? Encouraging healthy, active lifestyles through pathway and sidewalk connectivity has been a focus
CHAPTER 3: Vision Statement and Goals
 Davidson Walks & Rolls: Active Transportation Master Plan CHAPTER 3 Contents: Overview Vision Statement Measurable Goals Public Outreach CHAPTER 3: Vision Statement and Goals Overview The vision statement
1999 On-Board Sacramento Regional Transit District Survey
 SACOG-00-009 1999 On-Board Sacramento Regional Transit District Survey June 2000 Sacramento Area Council of Governments 1999 On-Board Sacramento Regional Transit District Survey June 2000 Table of Contents
Key objectives of the survey were to gain a better understanding of:
 3 COMMUNITY INPUT Community input is an essential part of corridor studies. For the SR 87 corridor study, VTA staff conducted an extensive online survey of people living and commuting along the corridor.
2017 North Texas Regional Bicycle Opinion Survey
 2017 North Texas Regional Bicycle Opinion Survey Sustainable Development Program Kevin Kokes, AICP Public Meetings April, 2018 North Central Texas Council of Governments MPO for the Dallas-Fort Worth Region
Bikeway action plan. Bicycle Friendly Community Workshop March 5, 2007 Rochester, MN
 Bikeway action plan Summary The was held on March 5, 2007 at the Rochester Mayo Civic Center. The workshop was hosted by Rochester-Olmsted County Planning Department in collaboration with the League of
Chapter 2. Bellingham Bicycle Master Plan Chapter 2: Policies and Actions
 Chapter 2 Bellingham Bicycle Master Plan Chapter 2: Policies and Actions Chapter 2: Policies and Actions The Bicycle Master Plan provides a road map for making bicycling in Bellingham a viable transportation
2010 Pedestrian and Bicyclist Special Districts Study Update
 2010 Pedestrian and Bicyclist Special Districts Study Update Pedestrian and Bicyclist Special Districts Program Overview H-GAC s Special Districts Program aims to provide strategic investments in pedestrian
4 Goals, Objectives & Actions
 Chapter4 4 This chapter presents goals, objectives, and recommended actions to support the vision of making Overland Park a safer and easier place to ride a bicycle. 35 4.1 Recommendations Structure The
NM-POLICY 1: Improve service levels, participation, and options for non-motorized transportation modes throughout the County.
 Transportation PRINCE WILLIAM COUNTY 2008 COMPREHENSIVE PLAN NON-MOTORIZED PLAN CONTENTS Goals, Policies, and Action Strategies Table 4 (Bike Facility Classifications and Descriptions) Table 5 (Bike Facility
Exhibit 1 PLANNING COMMISSION AGENDA ITEM
 Exhibit 1 PLANNING COMMISSION AGENDA ITEM Project Name: Grand Junction Circulation Plan Grand Junction Complete Streets Policy Applicant: City of Grand Junction Representative: David Thornton Address:
Bicycle Facilities Planning
 Bicycle Facilities Planning Overview Types of Cyclists Purpose for Riding Types of Facilities Bike Lanes Bicycle Boulevards Cycle Tracks Intersections Signals Signing and Marking Discussion Types of Bicyclists
o n - m o t o r i z e d transportation is an overlooked element that can greatly enhance the overall quality of life for the community s residents.
 N o n - m o t o r i z e d transportation is an overlooked element that can greatly enhance the overall quality of life for the community s residents. 84 Transportation CHAPTER 11 INTRODUCTION Transportation
Appendix E: Bike Crash Analysis ( )
") Appendix E: Bike Crash Analysis (2009-2012) Davis Bicycle Crashes Analysis 2009-2012 December 2013 Ride Walk Davis Active Transportation Program City of Davis December 2013 Prepared by: Jimmy Fong Active
Appendix E: Bike Crash Analysis (2009-2012) Davis Bicycle Crashes Analysis 2009-2012 December 2013 Ride Walk Davis Active Transportation Program City of Davis December 2013 Prepared by: Jimmy Fong Active
CONNECTING PEOPLE TO PLACES
 CONNECTING PEOPLE TO PLACES 82 EAST BENCH MASTER PLAN 07 Introduction The East Bench transportation system is a collection of slow moving, treelined residential streets and major arteries that are the
Baseline Survey of New Zealanders' Attitudes and Behaviours towards Cycling in Urban Settings
 Baseline Survey of New Zealanders' Attitudes and Behaviours towards Cycling in Urban Settings Highlights 67% of urban New Zealanders, 18 years of age or more own or have access to a bicycle that is in
Chapter 14 PARLIER RELATIONSHIP TO CITY PLANS AND POLICIES. Recommendations to Improve Pedestrian Safety in the City of Parlier (2014)
") Chapter 14 PARLIER This chapter describes the current status and future plans for biking and walking in the City of Parlier. RELATIONSHIP TO CITY PLANS AND POLICIES The Parlier General Plan is the primary
Chapter 14 PARLIER This chapter describes the current status and future plans for biking and walking in the City of Parlier. RELATIONSHIP TO CITY PLANS AND POLICIES The Parlier General Plan is the primary
MASTER BICYCLE AND PEDESTRIAN PLAN
 VILLAGE OF NORTHBROOK MASTER BICYCLE AND PEDESTRIAN PLAN DRAFT PLAN OPEN HOUSE May 2, 2018 AGENDA 1. Community Engagement 2. Vision and Goals 3. General Structure of Plan 4. Recommendations Overview 5.
Winnipeg Walk Bike Projects Downtown Tire Talk - Summary
 Winnipeg Walk Bike Projects Downtown Tire Talk - Summary Downtown Projected Bike Lane System Connecting The Forks to the Exchange District (Fort Street, Garry Street & The Forks to Assiniboine Connection)
DRAFT MOVING FORWARD RHODE ISLAND BICYCLE MOBILITY PLAN 2018 PREPARED FOR PREPARED BY IN ASSOCIATION WITH
 RHODE ISLAND MOVING FORWARD BICYCLE MOBILITY PLAN 2018 PREPARED FOR PREPARED BY IN ASSOCIATION WITH T AF CHAPTER 1 D R INTRODUCTION CHAPTER 3 ARTICULATES VISION Bicycling is safe, fun and practical in
Tuesday, September 25 th Mount Holly Municipal Complex 400 East Central Avenue 5:30pm to 7:30pm. Activity Stations o Where do you Live?
 Meeting Information Overview The public workshop for the Mount Holly Comprehensive Bicycle Plan occurred on September 25, 2018. The drop-in workshop allowed attendees to participate in a series of interactive
Online Open House Survey Report. December 2016
 December 216 I. OVERVIEW & OUTREACH SUMMARY Introduction Washington County evaluated long-term transportation investments and strategies as part of the Transportation Futures Study. The purpose of the
TABLE OF CONTENTS. Executive Summary
 Executive Summary Background... ES-1 Pedestrian Network... ES-2 Bikeway Network... ES-2 Collision History... ES-2 Public Input... ES-4 Conclusions and Recommendations... ES-4 1. Introduction and Setting
U.S. Bicycling Participation Study
 U.S. Bicycling Participation Study Report of findings from the 2016 survey Conducted by Corona Insights Commissioned by PeopleForBikes Released July 2017 Table of Contents Background and Objectives 3 Research
WALKNBIKE DRAFT PLAN NASHVILLE, TENNESSEE EXECUTIVE SUMMARY NASHVILLE, TENNESSEE
 NASHVILLE, TENNESSEE EXECUTIVE SUMMARY Executive Summary A world-class multi-modal transportation system is essential to a vibrant city and better quality of life. -Mayor Barry The WalknBike plan aims
G AT E WAY PLAN. Community BRIEFING KIT GATEWAY BIKE
 G AT E WAY PLAN GATEWAY BIKE Community BRIEFING KIT PLAN August 2016 TABLE OF CONTENTS INTRODUCTION... 1 THE BENEFITS OF A BIKEABLE COMMUNITY... 2 ECONOMY...2 SAFETY...3 HEALTH...3 HOUSEHOLD SPENDING...3
City Snapshot September 27, 2018
 1 City Snapshot September 27, 2018 Respondent Introduction Thank you for providing data for the PlacesForBikes City Rating program! The information you provide will be used to understand the progress your
Chapter 13 ORANGE COVE
 Chapter 13 ORANGE COVE This chapter describes the current status and future plans for biking and walking in the City of Orange Cove. RELATIONSHIP TO CITY PLANS AND POLICIES The Orange Cove General Plan
ACTIVE TRANSPORTATION
 ACTIVE TRANSPORTATION Mobility 2040 Supported Goals Improve the availability of transportation options for people and goods. Support travel efficiency measures and system enhancements targeted at congestion
METROPOLITAN TRANSPORTATION PLAN OUTREACH: INTERACTIVE MAP SUMMARY REPORT- 10/03/14
 METROPOLITAN TRANSPORTATION PLAN OUTREACH: INTERACTIVE MAP SUMMARY REPORT- 10/03/14 INTRODUCTION This document summarizes the results of the online interactive mapping exercise implemented by MIG for the
NASHUA REGIONAL PLANNING COMMISSION REGIONAL BICYCLE AND PEDESTRIAN PLAN
 NASHUA REGIONAL PLANNING COMMISSION REGIONAL BICYCLE AND PEDESTRIAN PLAN June, 2005 Prepared by the Nashua Regional Planning Commission 2005 NRPC Regional Bicycle and Pedestrian Plan- JUNE 2005 ACKNOWLEDGEMENTS
Pocatello Regional Transit Master Transit Plan Draft Recommendations
 Pocatello Regional Transit Master Transit Plan Draft Recommendations Presentation Outline 1. 2. 3. 4. What is the Master Transit Plan? An overview of the study Where Are We Today? Key take-aways from existing
Hennepin County Bicycle and Pedestrian Planning
 Hennepin County Bicycle and Pedestrian Planning 1 Value of bicycle and sidewalk systems Safety Livability Mobility Health Personal Finances Economic Sustainability Clean Air Recreation Parking and congestion
Urbana Pedestrian Master Plan
 Urbana Pedestrian Master Plan Recommendations Gabe Lewis, Transportation Planner Champaign County Regional Planning Commission November 15, 2018 Public Meeting #2 Public Input Round #1 Thank You! 10 public
Proposed. City of Grand Junction Complete Streets Policy. Exhibit 10
 Proposed City of Grand Junction Complete Streets Policy Exhibit 10 1 City of Grand Junction Complete Streets Policy Vision: The Complete Streets Vision is to develop a safe, efficient, and reliable travel
Pedestrian Project List and Prioritization
 To: Kyle Wagenschutz, City of Memphis CC: From: Anne Conlon and John Cock, Alta Planning + Design Date: December, 2014 Re: Project List Development (Task 3.1-3.2) and Project List Prioritization (Task
AGENDA ITEM NO. 5b HCAOG TAC meeting of May 8, 2014
 Humboldt County Association of Governments Eureka, CA, 95501 AGENDA ITEM NO. 5b HCAOG TAC meeting of May 8, 2014 DATE: May 1, 2014 TO: HCAOG Technical Advisory Committee (TAC) FROM:, SUBJECT: Letters of
Nanaimo Transportation Master Plan. Phase 1 Consultation Summary
 Nanaimo Transportation Master Plan Phase 1 Consultation Summary Transportation Advisory Committee Meeting Wednesday December 12, 2012 Agenda Study Update Phase 1 Consultation Process Phase 1 Consultation
MTP BICYCLE ELEMENT UPDATE. November 2017
 MTP BICYCLE ELEMENT UPDATE November 2017 TIME FOR AN UPDATE Bicycle Element adopted in July 2008 Almost 10 years old Many planned facilities have been implemented 10 years more experience in planning,
ADOT Statewide Bicycle and Pedestrian Program Summary of Phase IV Activities APPENDIX B PEDESTRIAN DEMAND INDEX
 ADOT Statewide Bicycle and Pedestrian Program Summary of Activities APPENDIX B PEDESTRIAN DEMAND INDEX May 24, 2009 Pedestrian Demand Index for State Highway Facilities Revised: May 29, 2007 Introduction
CITY OF COCOA BEACH 2025 COMPREHENSIVE PLAN. Section VIII Mobility Element Goals, Objectives, and Policies
 CITY OF COCOA BEACH 2025 COMPREHENSIVE PLAN Section VIII Mobility Element Goals, Objectives, and Policies Adopted August 6, 2015 by Ordinance No. 1591 VIII MOBILITY ELEMENT Table of Contents Page Number
AAMPO Regional Transportation Attitude Survey
 AAMPO Regional Transportation Attitude Survey Traditionally Underserved Populations helping organizations make better decisions since 1982 2018 Submitted to the AAMPO By: ETC Institute 725 W. Frontier
Traffic Safety Barriers to Walking and Bicycling Analysis of CA Add-On Responses to the 2009 NHTS
 Traffic Safety Barriers to Walking and Bicycling Analysis of CA Add-On Responses to the 2009 NHTS NHTS Users Conference June 2011 Robert Schneider, Swati Pande, & John Bigham, University of California
Chapter 7. Transportation. Transportation Road Network Plan Transit Cyclists Pedestrians Multi-Use and Equestrian Trails
 Chapter 7 Transportation Transportation Road Network Plan Transit Cyclists Pedestrians Multi-Use and Equestrian Trails 7.1 TRANSPORTATION BACKGROUND The District of Maple Ridge faces a number of unique
APPENDIX D. BICYCLE AND PEDESTRIAN AWARENESS SURVEY (Completed by Zogby International)
") APPENDIX D BICYCLE AND PEDESTRIAN AWARENESS SURVEY (Completed by Zogby International) Residents Views On Bicycling, Walking, and Jogging In Onondaga County Submitted to: Danielle Zebley Syracuse Metropolitan
APPENDIX D BICYCLE AND PEDESTRIAN AWARENESS SURVEY (Completed by Zogby International) Residents Views On Bicycling, Walking, and Jogging In Onondaga County Submitted to: Danielle Zebley Syracuse Metropolitan
Agenda. Overview PRINCE GEORGE S PLAZA METRO AREA PEDESTRIAN PLAN
 PRINCE GEORGE S PLAZA METRO AREA PEDESTRIAN PLAN May 28, 2008 Agenda Welcome and introductions Project overview and issue identification Planning context and strengths Design challenges and initial recommendations
LANCASTER CITY BICYCLE NETWORK
 LANCASTER CITY BICYCLE NETWORK Downtown Merchants Meeting Wednesday, July 19, 2017 http://www.lancasteratp. DOWNTOWN WALKABILITY ANALYSIS What changes can be made, in the least amount of time, and for
Madison Urban Area and Dane County. Bicycle Transportation Plan Summary. September Introduction. Bicycle Plan Scope and Planning Process
 Bicycle Transportation Plan Summary Madison Urban Area and Dane County Introduction September 2000 Bicycling is an important mode of transportation in the Madison urban area and countywide that is available
CHAPTER 1 INTRODUCTION
 CHAPTER 1 INTRODUCTION Chapter Table of Contents THE 2017 HOUSTON BIKE PLAN 1-1 HOUSTON BIKEWAYS PROGRAM 1-2 HISTORY OF BICYCLE PLANNING IN HOUSTON 1-3 BICYCLE LEVEL OF COMFORT 1-3 EXISTING PLANS, PROGRAMS
Engagement Summary: Round 1
 Engagement Summary: Round 1 June 21, 2018 REPORT FOR: City of Courtenay 830 Cliff Avenue Courtenay, BC V9N 2J7 PREPARED BY: Urban Systems Ltd. 550 1090 Home Street Vancouver, BC V6B 2W9 ALONG WITH: Kathleen
Chapter VISION, MISSION, AND GOALS AND OBJECTIVES. Vision. Mission. Goals and Objectives CONNECTING COMMUNITIES ACROSS THE ST.
 VISION, MISSION, AND GOALS AND OBJECTIVES Chapter 3 The Plan s vision, mission, and goals and objectives were developed through a series of interactive exercises with the Citizens Advisory Committee (CAC)
Transportation 2040 Update: Eudora Public Input As of June 1, 2017
 Transportation 2040 Update: Eudora Public Input As of June 1, 2017 Overview... 1 Survey Responses... 2 Overview The Lawrence Douglas County Metropolitan Planning Organization (MPO) is updating our long
Community & Transportation Preferences Survey
 Community & Transportation Preferences Survey Webinar: August 5, 2015 Hugh Morris, AICP, LEED Realtor.org Jennifer Dill, Ph.D. trec.pdx.edu 1 Introduction National Association of Realtors Over 1,000,000
Recommendations from Boston City Council Transportation Policy Briefing Series
 Recommendations from Boston City Council Transportation Policy Briefing Series Report to Boston City Councilors May 2017 Prepared by: Boston City Council Committee on Parks, Recreation & Transportation
Bicycle Master Plan Goals, Strategies, and Policies
 Bicycle Master Plan Goals, Strategies, and Policies Mobilizing 5 This chapter outlines the overarching goals, action statements, and action items Long Beach will take in order to achieve its vision of
APPENDIX A. Outreach Summary
 APPENDIX A Outreach Summary COUNTYWIDE TRANSPORTATION PLAN Summary of Public Outreach and Engagement To gather an understanding of the transportation issues and priorities throughout the county, and inform
TYPES OF CYCLING. Figure 1: Types of Cycling by Gender (Actual) Figure 2: Types of Cycling by Gender (%) 65% Chi-squared significance test results 65%
 Figure 2: Types of Cycling by Gender (%) 65% Chi-squared significance test results 65%") TYPES OF CYCLING 1,980 responses were received to this question (multiple answers were allowed), 727 female (41%) and 1,242 (71%) from male respondents. The most common responses for both genders were
TYPES OF CYCLING 1,980 responses were received to this question (multiple answers were allowed), 727 female (41%) and 1,242 (71%) from male respondents. The most common responses for both genders were
Walking and Biking Safety for Tribes: Improving health, safety, and transportation options
 Walking and Biking Safety for Tribes: Improving health, safety, and transportation options MAKING THE CASE: Benefits of Bike/Walk- Friendly Communities People Want Safer Streets What do you think the benefits
Rail Station Fact Sheet DFW Airport North Station* (*station under construction with anticipated start of service in late 2018)
") Rail Station Fact Sheet DFW Airport North Station* (*station under construction with anticipated start of service in late 018) Station Overview DFW Airport North Station will be located on DFW nternational
Rail Station Fact Sheet DFW Airport North Station* (*station under construction with anticipated start of service in late 018) Station Overview DFW Airport North Station will be located on DFW nternational
CITY OF HAMILTON PLANNING AND ECONOMIC DEVELOPMENT DEPARTMENT Transportation Planning and Parking Division
 CITY OF HAMILTON PLANNING AND ECONOMIC DEVELOPMENT DEPARTMENT Transportation Planning and Parking Division TO: Chair and Members Public Works Committee COMMITTEE DATE: June 18, 2018 SUBJECT/REPORT NO:
Bicycle Boulevards and Neighborhood Greenways
 Bicycle Boulevards and Neighborhood Greenways Traffic Safety is Improving for Everyone 90 80 70 60 50 40 30 20 10 0 PORTLAND: TOTAL TRAFFIC FATALITIES 1986-2008 1986 1987 1988 1989 1990 1991 1992 1993
TR NEWS. Public Health and Transportation. Innovation, Intervention, and Improvements NUMBER 299 SEPTEMBER OCTOBER 2015
 TR NEWS NUMBER 299 SEPTEMBER OCTOBER 2015 Public Health and Transportation Innovation, Intervention, and Improvements Public Health and Transportation Measuring the Health Benefits of Walking and Bicycling
Corpus Christi Metropolitan Transportation Plan Fiscal Year Introduction:
 Introduction: The Safe, Accountable, Flexible, Efficient Transportation Equity Act: A Legacy for Users (SAFETEA-LU) has continued the efforts started through the Intermodal Surface Transportation Efficiency
Rail Station Fact Sheet CentrePort/DFW Airport Station
 Rail Station Fact Sheet CentrePort/DFW Airport Station Station Overview CentrePort/DFW Airport Station is located by Statler Boulevard at Breezewood Drive in Fort Worth. Free shuttles connect the station
Broad Street Bicycle Boulevard Design Guidelines
 Broad Street Bicycle Boulevard Design Guidelines Building from the strategies introduced in the 2013 Bicycle Transportation Plan and community input received thus far, City Transportation Staff have identified
Bike Share Social Equity and Inclusion Target Neighborhoods
 Bike Share Social Equity and Inclusion Target Neighborhoods Target Neighborhoods West End/Visitation Park/Academy/Hamilton Heights Wellsgoodfellow/Kingsway West The Ville/Greater Ville Kingsway East/Fountain
Lessons from the Green Lanes:
 Executive Summary Lessons from the Green Lanes: Evaluating Protected Bike Lanes in the U.S. By Portland State University Chris Monsere Jennifer Dill Nathan McNeil Kelly Clifton Nick Foster Tara Goddard
Cecil County, Maryland. Bicycle Master Plan
 Cecil County, Maryland Bicycle Master Plan Overview Background Schedule and Tasks Network Assessment Network Identification Next Steps Schedule and Tasks May 2011 Plan Scoping and Mobilization Data Collection
COLUMBUS AVENUE NEIGHBORHOOD TRANSPORTATION STUDY
 COLUMBUS AVENUE NEIGHBORHOOD TRANSPORTATION STUDY Pedestrian Survey Findings Survey Main Findings: Transit and walking are the main two modes used by both visitors and residents of the area, regardless
SANTA CLARA COUNTYWIDE BICYCLE PLAN August 2008
 SANTA CLARA COUNTYWIDE BICYCLE PLAN August 2008 To assist VTA and Member Agencies in the planning, development and programming of bicycle improvements in Santa Clara County. Vision Statement To establish,
WILMAPCO Public Opinion Survey Summary of Results
 Wilmington Area Planning Council WILMAPCO Public Opinion Survey Summary of Results Prepared by: 2955 Valmont Road, Suite 300 Boulder, Colorado 80301 t: 303-444-7863 f: 303-444-1145 www.n-r-c.com Table
BIKE PLAN CONTENTS GATEWAY
 CONTENTS Acknowledgments...vii Great Rivers Greenway District Board of Directors... vii Great Rivers Greenway District Staff... vii Project Consultants... vii Committees... viii Citizens Advisory Committee
BICYCLE SAFETY OBSERVATION STUDY 2014
 County of Santa Cruz Health Services Agency BICYCLE SAFETY OBSERVATION STUDY BACKGROUND AND PURPOSE The County of Santa Cruz Health Services Agency (HSA) in conjunction with the Community Safety Coalition
APPENDIX D LEVEL OF TRAFFIC STRESS METHODOLOGY
 APPENDIX D LEVEL OF TRAFFIC STRESS METHODOLOGY 01 WHAT IS LEVEL OF TRAFFIC STRESS? When people bicycle on roadways, they encounter varying levels of stress from traffic. A quiet residential street with
Chapter 5. Complete Streets and Walkable Communities.
 Chapter 5. Complete Streets and Walkable Communities. 5.1 Description of Complete Streets. Cities throughout the world, and specifically the United States, are coming to embrace a new transportation and
Eliminate on-street parking where it will allow for a dedicated bus only lane %
 Traffic Dashboard Priorities Survey Responses Introduction 1) Are you familiar with bus rapid transit (BRT)? a. No, BRT is new to me. 597 23.5% b. I ve heard of BRT, but I don t know much about it. 1,136
Tulsa Metropolitan Area LONG RANGE TRANSPORTATION PLAN
 Tulsa Metropolitan Area LONG RANGE TRANSPORTATION PLAN Indian Nations Council of Governments August 2005 CONTACTING INCOG In developing the Destination 2030 Long Range Transportation Plan, INCOG s Transportation
WELCOME. Purpose of the Open House. Update you on the project. Present a draft recommended plan. Receive your input
 WELCOME Purpose of the Open House The Town of Smiths Falls has initiated the Beckwith Street Redevelopment Plan that includes the preparation of a streetscape functional design for the renewal of Beckwith
Kelowna On the Move. Pedestrian and Bicycle Master Plan
 Kelowna On the Move Pedestrian and Bicycle Master Plan Executive Summary April 2016 Purpose of the Plan The Pedestrian and Bicycle Master Plan identifies infrastructure, planning, and policy requirements
Public Opinion about Transportation Issues in Northern Virginia A Report Prepared for the:
 Public Opinion about Transportation Issues in Northern Virginia A Report Prepared for the: Northern Virginia Transportation Authority By QSA Research & Strategy October 13, 2005 TABLE OF CONTENTS Page
Complete Street Analysis of a Road Diet: Orange Grove Boulevard, Pasadena, CA
 Complete Street Analysis of a Road Diet: Orange Grove Boulevard, Pasadena, CA Aaron Elias, Bill Cisco Abstract As part of evaluating the feasibility of a road diet on Orange Grove Boulevard in Pasadena,
Incorporating Health in Regional Transportation Planning
 Mayor Karl Dean, Chairman Incorporating Health in Regional Transportation Planning Leslie A. Meehan, AICP Center TRT Intervention Webinar January 29, 2013 Objectives for Today Background About the Nashville
SAFE ROUTES TO SCHOOL (SR2S)
") SAFE ROUTES TO SCHOOL (SR2S) In partnership with Burbank Unified School District (BUSD) & City of Burbank George Washington Elementary School Thomas Jefferson Elementary School John Muir Middle School
SAFE ROUTES TO SCHOOL (SR2S) In partnership with Burbank Unified School District (BUSD) & City of Burbank George Washington Elementary School Thomas Jefferson Elementary School John Muir Middle School
Chapter 5 Future Transportation
 Chapter 5 Future Transportation The Future Land Use Plan identifies the desired land use designations. The land uses desired for Crozet depend, in large part, on the success of the transportation system,
FEDERAL HIGHWAY ADMINISTRATION APPLICATION
 FEDERAL HIGHWAY ADMINISTRATION APPLICATION REQUEST FOR PERMISSION TO EXPERIMENT WITH A BICYCLE BOX INTERSECTION TREATMENT Submitted by: City of Columbus Department of Public Service Date: June 26, 2009
PRINCE GEORGE S PLAZA METRO AREA PEDESTRIAN PLAN
 PRINCE GEORGE S PLAZA METRO AREA PEDESTRIAN PLAN May 28, 2008 Agenda Welcome and introductions Project overview and issue identification Planning context and strengths Design challenges and initial recommendations
5. Pedestrian System. Accomplishments Over the Past Five Years
 5. Pedestrian System Accomplishments Over the Past Five Years The Alamo Area Metropolitan Planning Organization (MPO) and its partner agencies recognize the importance of improving pedestrian mobility.
Pedestrian Survey Report
 Pedestrian Survey Report The City of Albany conducted a Pedestrian Survey in 2007 with the purpose of identifying resident s concerns about barriers to walking and accessibility in the City. The survey
Washington State University Bicycle and Pedestrian Plan Working Paper #7: Implementation Strategies
 nnn Washington State University Bicycle and Pedestrian Plan nnn TO: Bridgette Brady, CAPP, Director Parking and Transportation Services FROM: Alta Planning Design DATE: November 2013 Introduction As described
TOWN OF WILLIAMSTON, SC BICYCLE AND PEDESTRIAN MASTER PLAN TOWN OF WILLIAMSTON, SC BICYCLE AND PEDESTRIAN MASTER PLAN
 TOWN OF WILLIAMSTON, SC BICYCLE AND PEDESTRIAN MASTER PLAN Americans Want Choices 55% of Americans would rather drive less & walk more. Transit use is growing faster than population or highway travel.
Bringing together community and health. Physical Activity and Nutrition Unit Office of Statewide Health Improvement Initiatives
 Bringing together community and health. Physical Activity and Nutrition Unit Office of Statewide Health Improvement Initiatives Physical Activity and Nutrition Unit Office of Statewide Health Improvement
2017 Northwest Arkansas Trail Usage Monitoring Report
 2017 Northwest Arkansas Trail Usage Monitoring Report Summary Findings: The study showed that average daily weekday bicycle volumes per study site increased by about 32% between 2015 and 2017, from 142
Land Use and Transportation Town Hall September 17, 2018
 Land Use and Transportation Town Hall September 17, 2018 Welcome! Tonight s Agenda: 7:00-7:30 OVERVIEW PRESENTATIONS 7:30-8:15 BREAKOUT SESSIONS 8:15 - End TOWN HALL CITIZEN S TIME Purpose of Tonight s
Developing a Safer Cycling Strategy for the ACT ACRS Conference August 2012
 Developing a Safer Cycling Strategy for the ACT ACRS Conference 2012 Peter Strang Canberra Manager Sarah Court Transport Consultant 10 August 2012 Presentation Outline Background Data Analysis (Stage 1)
Summary Report: Built Environment, Health and Obesity
 Research and education Built Environment Edmonton Project Summary Report: Built Environment, Health and Obesity Introduction In 2007 the Canadian Institutes of Health Research and the Heart and Stroke
5/12/2009 Final Draft
 5/12/2009 Final Draft Prepared by: Alta Planning + Design Parametrix, Inc Table of Contents TABLE OF CONTENTS...i TABLE OF MAPS... ii LIST OF FIGURES... iii LIST OF TABLES... iii EXECUTIVE SUMMARY... ES-1
Walk Friendly Communities Education and Encouragement Programs
 Walk Friendly Communities Programs Dan Gelinne Walk Friendly Communities Workshop Grandview, MO June 2015 Module Overview Topics Background and purpose What is the role of education and encouragement programs?
TRAFFIC CALMING TOOLBOX. For the residents of the City of Decatur, Georgia
 TRAFFIC CALMING TOOLBOX For the residents of the City of Decatur, Georgia 2 City of Decatur Traffic Calming Toolbox Public Works Department 2635 Talley Street Decatur, GA 30030 404.377.5571 3 Welcome to