Hatchery and Supplementation Program FINAL 2015 Report. Lewis River Hydroelectric Projects FERC Project Nos. 935, 2071, 2111, 2213
|
|
|
- Vernon Griffin Sparks
- 5 years ago
- Views:
Transcription


1 Hatchery and Supplementation Program FINAL 2015 Report Lewis River Hydroelectric Projects FERC Project Nos. 935, 2071, 2111, 2213 Erik Lesko April 2016
2 TABLE OF CONTENTS 1.0 INTRODUCTION LATE WINTER STEELHEAD Broodstock Collection Merwin Trap Tangle Netting Winter Steelhead Broodstock Collection Timing Genetic Analysis of Potential Broodstock Spawning and Egg Take Spawn Timing Rearing, Tagging and Release Rearing Tagging Release MONITORING AND EVALUATION Winter Steelhead Redd Surveys (Lower River) Spawning Abundance Distribution Proportion of hatchery origin spawners on the spawning grounds Recaptures of circular pond reared late winter steelhead Upstream Transport of Steelhead, Coho and Spring Chinook Screw trap Operations Mainstem Carcass and Redd Surveys Coho Salmon Tributary Surveys 2012, 2013 and 2014: Spring Chinook and Coho Salmon Survey results summary RECOMMENDATIONS FOR ONGOING MANAGEMENT REFERENCES i
3 APPENDICES Appendix A Winter steelhead collection Log 2015 Appendix B Genetic assignment results from Lewis River captures at Merwin Trap (MT), Cedar Creek (CC) and Tangle Netting (TN) 2015 Appendix C NOR winter steelhead spawning crosses 2015 Appendix D NOR winter steelhead spawning log 2015 Appendix E Steelhead redd locations, Lewis River, WA 2015 Appendix F Appendix G Revised estimates of 2013 and 2014 coho escapement from tagged carcass surveys in the lower Lewis River. (Memo from Leigh Ann Starcevich, West, Inc., to Jason Shappart, Meridian Environmental, Inc.) Estimates of 2015 spring Chinook and coho escapement from tagged carcass surveys in the lower Lewis River. (Memo from Leigh Ann Starcevich, West, Inc. to Jason Shappart, Meridian Environmental, Inc. Appendix H Lewis River Fall Chinook Escapement Report Appendix I WDFW Lewis River Hatchery Complex Operations Program Report Appendix J Response Matrix from review comments received by March 31, TABLES Table 1. Summary of total captures of winter steelhead by method between 2009 and 2015 (excludes recaptures). 2 Table 2. Disposition of Winter Steelhead Captured at the Merwin Trap between January 1 and July 4, Table 3. Disposition of steelhead captured through tangle netting in Table 4. Number of spawning crosses and parents including the duration of each spawning periods for brood years between 2009 and Table 5. Summary of rearing statistics for the 2015 brood year 11 Table 6. Late Winter Steelhead Abundance Downstream of Merwin Dam 2008 through 2015 based on redd counts. 13 Table 7. Redd distribution summary for reaches 1 through 5 including redds per mile 15 Table 8. Ratio of marked steelhead recaptured at the Merwin Trap including estimates of escapement, phos and PNI 17 ii
4 Table 9. Weekly ratio of HOR and NOR steelhead captured in the tangle net for year Table 10. Summary of Winter Steelhead transported and released upstream of Swift Dam. 19 Table 11. Collection summary for the rotary screw trap deployed downstream of Merwin Dam April 1 June 12, Table 12. Weekly and total estimates of abundance for all coho smolts migrating past the lower Lewis River screwtraps April 1 June 12, Table 13. Weekly and total estimates of abundance for NOR coho smolts migrating past the lower Lewis River screwtraps April 1 June 12, Table 14. Weekly and total estimates of abundance for all steelhead smolts migrating past the lower Lewis River screwtraps April 1 June 9, Table 15. Summary of spring Chinook and coho salmon spawning surveys downstream of Merwin Dam (September 2015 through January 2016) 25 FIGURES Figure 1. Figure 2. Figure 3. Figure 4. Figure 5. Total number of male and female steelhead trapped at the Merwin Collection Facility by month between January 1, 2015 and July 4, Monthly proportion of NOR and BWT steelhead trapped at the Merwin Collection Facility between January 1, 2015 and July 4, Composition of winter steelhead captured through tangle netting between February 10, 2015 and April 28, 2015 (n= 114). 5 Actual collection timing of steelhead used as broodstock compared to predetermined collection curve during the 2015 season. 7 Proportion of primary genetic assignment for tangle netting, the Merwin Trap and Cedar Creek Weir (n=174). 8 Figure 6. Spawn timing of broodstock held at the Merwin Hatchery. All crosses (n=25) are 1x1 10 Figure 7. Observed mortality rate of fish ponded for brood years 2009 through Figure 8. Wild winter steelhead spawner abundance downstream of Merwin Dam 2008 through 2015 based on redd counts. 14 Figure 9. Cumulative proportion of steelhead captured at the Merwin Trap for years 2014 and Figure 10. Total discharge from Merwin Dam between April 1 and June 10, iii
5 Lewis River Hydroelectric Project (FERC Nos. 935, 2071, 2111 & 2213) Hatchery & Supplementation Program Annual Report INTRODUCTION The purpose of this report is to document results from field studies associated with implementation of the Hatchery and Supplementation (H&S) Program during Monitoring and evaluation (M&E) activities of the H&S program are planned in consultation with the H&S subgroup and incorporated into the Annual Operating Plan (AOP) each year. The following key activities were completed as part of the 2015 AOP: Transport of winter steelhead and early and late coho salmon upstream of Swift Dam Screw trapping of emigrating juveniles downstream of Merwin Dam Carcass and redd surveys downstream of Merwin Dam Broodstock collection and production for wild winter steelhead supplementation Hatchery production of trout and salmon as stipulated in Section 8 of the Lewis River Settlement Agreement. Fall Chinook carcass surveys downstream of Merwin Dam This report is required by Section of the Lewis River Settlement Agreement that states: On an annual basis, the Licensees shall provide to the ACC for review and comment a report compiling all information gathered pursuant to implementation of the Hatchery and Supplementation Plan. The report also will include recommendations for ongoing management of the Hatchery and Supplementation Program. The ACC shall have 60 days to comment on the annual report. Within 60 days of the close of the comment period, the Licensees shall finalize the report after consideration of all comments. The Licensees shall also provide the comprehensive periodic review undertaken pursuant to Section below to the ACC. The Licensees shall provide final annual reports and the comprehensive periodic review to the Services during the development of any required ESA permit or authorization for hatchery operations, including NOAA Fisheries HGMP process. The report may be included as part of the detailed annual reports of the ACC activities required by Section
6 Lewis River Hydroelectric Project (FERC Nos. 935, 2071, 2111 & 2213) Hatchery & Supplementation Program Annual Report LATE WINTER STEELHEAD Late winter steelhead in the Lewis River are composed primarily of native stock. This stock is preferred in reestablishing a population upstream of Swift Dam. The program is composed of three main elements: Broodstock collection at traps and through in river netting. Spawning and rearing at Merwin Hatchery. Transport of returning adults upstream of Swift Dam. The primary goal of this program is to support a self sustaining population upstream of Swift Dam that in time requires no hatchery support. Table 1 provides a summary of steelhead collected for the years 2009 through Table 1. Summary of total captures of winter steelhead by method between 2009 and 2015 (excludes recaptures). YEAR Merwin Trap ,075 1,323 Lewis River Trap Tangle Netting Angling 8 2 Discontinued in 2011 TOTAL ,238 1,437 * Note: Two steelhead in the Merwin Trap were repeat spawners from One of which (Male) had been spawned at Merwin Hatchery and released 2.1 Broodstock Collection Broodstock collection relied principally on two methods: (1) trapping at Merwin Dam and (2) tangle netting. All captured NOR winter steelhead from the Merwin Trap an in river netting were transported to Merwin Hatchery for genetic assignment analysis. Once results were known, these fish were either held for broodstock or released back to river depending on predetermined collection curves. All program fish (BWT) captured in the Merwin Trap were immediately transported upstream of Swift Dam as part of the supplementation program. Data for all steelhead transported to the Merwin hatchery are provided in Appendix A Merwin Trap The first NOR steelhead arrived at the Merwin trap on January 6, 2015; the first BWT steelhead was captured on January 1, During the period January 1 July 4, sixty eight (5%) NOR steelhead and 1,255 (95%) BWT winter steelhead were captured at the Merwin trap (Table 2). In addition, to the typical BWT and NOR steelhead, the trap also trapped eight BWT steelhead with a clipped adipose fin. Genetic analyses of these fish indicated origin to Lewis River and likely represent supplementation program fish that were inadvertently clipped. 2
7 Lewis River Hydroelectric Project (FERC Nos. 935, 2071, 2111 & 2213) Hatchery & Supplementation Program Annual Report 2015 Figure 1 illustrates the sex ratio of all steelhead returning to the Merwin trap by month. For every month males outnumbered females. Ratio of males to females was 1.46 to 1. Table 2. Disposition of Winter Steelhead Captured at the Merwin Trap between January 1 and July 4, Males Females NOR Transferred to Merwin (NOR) BWT BWT + AD Clip* Upriver Transport (BWT) Kelts (to river) 3 0 Mortalities 5 1 Returned to River 2 6 TOTAL *BWT returns that were inadvertently AD clipped prior to release. 350 Number of steelhead trapped Males Females 50 0 Jan Feb Mar Apr May Jun Jul Month Figure 1. Total number of male and female steelhead trapped at the Merwin Collection Facility by month between January 1, 2015 and July 4,
8 Lewis River Hydroelectric Project (FERC Nos. 935, 2071, 2111 & 2213) Hatchery & Supplementation Program Annual Report 2015 Figure 2 illustrates the proportion of both NOR and BWT steelhead captured by month. BWT steelhead captures peaked in April while NOR steelhead peak captures were in May. More specifically, 88% of the BWT steelhead were captured by May 1 whereas only 55% of the total NOR's had been captured. The ratio of BWT to NOR steelhead was 18.3 to NOR Steelhead BWT Steelhead 0.4 Proportion Jan Feb Mar Apr May Jun Jul Month Figure 2. Monthly proportion of NOR and BWT steelhead trapped at the Merwin Collection Facility between January 1, 2015 and July 4, Tangle Netting Tangle netting efforts began on February 10, 2015 and continued through April 28, A PacifiCorp crew of two biologists netted at least once per week depending on river conditions. Six to eight pound test monofilament, 4 inch (stretch) mesh tangle nets are drifted in known and established steelhead holding areas. Once steelhead become entangled in the drifting net it is pulled into the boat, freed and then placed in an insulated cooler with fresh river water. All steelhead are processed on the boat and either released or transported to an oxygenated holding tank at the Lewis River hatchery access area. Table 3 summarizes the disposition of steelhead captured during tangle netting efforts. 4
9 Lewis River Hydroelectric Project (FERC Nos. 935, 2071, 2111 & 2213) Hatchery & Supplementation Program Annual Report 2015 Table 3. Disposition of steelhead captured through tangle netting in Males Females RETAINED NOR shipped to Merwin 10 6 BWT transported upstream 23 4 AD Clipped (Euthanized) 0 4 RELEASED (On Site) NOR 28 5 BWT 12 6 AD Clipped Kelts 1 3 BWT (radio tagged) 11 1 Mortalities 0 0 TOTAL In total, 114 steelhead were captured through the tangle netting program. Of these, 49 (43%) were of natural origin (Figure 3). Remaining steelhead 65 (57%) were either program returns (BWT) or from traditional hatchery programs. Sex ratio of males to females was 2.9 to NOR (n=49) HOR (n=65) Feb 10 Feb 17 Feb 24 Mar 3 Mar 10 Mar 17 Mar 24 Mar 30 Apr 7 Apr 14 Apr 21 Apr 28 Number of Steelhead Capture Date (weekly) Figure 3. Composition of winter steelhead captured through tangle netting between February 10, 2015 and April 28, 2015 (n= 114). 5
10 Lewis River Hydroelectric Project (FERC Nos. 935, 2071, 2111 & 2213) Hatchery & Supplementation Program Annual Report Winter Steelhead Broodstock Collection Timing The ability to conform to predetermined collection curves presents several difficulties in the field. Several variables continue to make broodstock collection challenging. Specific variables include the following: Additional fish (than stipulated in the collection curve) need to be captured each period to compensate for steelhead that do not assign as acceptable broodstock. Spawning maturity varies substantially in females, which adds uncertainty when deciding to retain or release male broodstock. Capture efficiency is affected by river flow and turbidity which may change daily. Sex ratios are variable and having adequate numbers of females is often challenging. Steelhead condition varies throughout the collection period with a larger percentage of fish being returned to river later in the collection window due to ripeness, and, Fecundity varies substantially from fish to fish and from year to year. Because of these variables, the collection curve is meant to be a guide for collection crews to help plan fish collection activities on a weekly basis. This planning helps to ensure that fish are collected across their spawning period to preserve genetic diversity among the available broodstock. According to the collection curve proposed in the annual plan for 2015, up to 50 steelhead are held for broodstock and spawned over the course of the run. Between February 9 and May 18, 2015, 62 steelhead were transferred to Merwin Hatchery as potential broodstock. Of these, 50 were spawned (25 pair) and 12 were released back to river due to unacceptable genetic assignment, poor condition or because egg take goals had already been met. Figure 4 provides the capture timing of broodstock that were used for spawning relative to the proposed collection curve. 6
11 Lewis River Hydroelectric Project (FERC Nos. 935, 2071, 2111 & 2213) Hatchery & Supplementation Program Annual Report Actual Broodstock Captures Collection Curve Number of Steelhead Jan - Feb Mar 1-15 Mar Apr 1-15 Apr May 1-15 May Period Figure 4. Actual collection timing of steelhead used as broodstock compared to predetermined collection curve during the 2015 season. 2.3 Genetic Analysis of Potential Broodstock The H&S Subgroup agreed to use a genetic assignment target level of 50 percent or greater to the NF Lewis River or Cedar Creek stock(s) to be considered acceptable broodstock. Additionally, steelhead captured after April 1 with 50 percent or greater assignment to the Cascade Strata are also considered acceptable broodstock. The only exception to this rule is for fish showing hatchery assignment at levels greater than 5 percent. These fish would not be incorporated into the broodstock despite any assignment of 50 percent or greater to the NF Lewis River wild winter steelhead stock or Cascade Strata. A total of 174 samples were taken from steelhead captured in the Merwin Trap, through tangle netting and the Cedar Creek Weir. All sampled steelhead were assigned a probability percentage as to likelihood of assignment to known baselines established for Lower Columbia River tributaries. Probabilities are classified as primary, secondary and tertiary to account for 7
12 Lewis River Hydroelectric Project (FERC Nos. 935, 2071, 2111 & 2213) Hatchery & Supplementation Program Annual Report 2015 introgression from other basins and provide a more complete picture of diversity present within the samples. Figure 5 provides an illustration of results of sampled (n=174) non BWT steelhead. Appendix B provides the tabular genetic assignments results for each individual unclipped steelhead captured at the Merwin trap, tangle netting and at the Cedar Creek weir Tangle Netting (n=53) Merwin Trap (n=45) Cedar Creek Weir (n=76) Proportion LR Winter LR Cedar Coweeman Mill Cr Kalama Winter Germany Creek EF Lewis LR Winter (hatchery) LR Summer (hatchery) Klickitat Summer Mill Creek Sandy River S Santiam (upper) NF Toutle SF Toutle Stock Figure 5. Proportion of primary genetic assignment for tangle netting, the Merwin Trap and Cedar Creek Weir (n=174). 2.4 Spawning and Egg Take A total of 25 females and 25 males were spawned through 25 crosses between March 26 and May 22, 2015 (Appendix C). The target goal of 25 females and 25 males was achieved for the second consecutive year since 2009 (Table 4). Fecundity averaged 3,891 eggs per female resulting in an estimated egg take of 107,775 (actual 97,265). However, one cross resulting in about 4400 eggs was separated after primary 8
13 Lewis River Hydroelectric Project (FERC Nos. 935, 2071, 2111 & 2213) Hatchery & Supplementation Program Annual Report 2015 assignment probabilities of the parents did not meet the genetic criteria established in the 2015 AOP. Eggs from this cross were hatched and released as unfed fry into the North Fork Lewis River. Appendix D provides the spawning log for 2015 indicating fecundity, eyed egg take and estimated egg loss. Table 4. Number of spawning crosses and parents including the duration of each spawning periods for brood years between 2009 and Brood Year Crosses Females Males Spawn Period Days Mar 2 May Mar 17 May Mar 30 May Apr 10 May Apr 10 May Apr 7 May Mar 26 May Spawn Timing Capture timing does not correlate well to spawn timing. One of the goals of this program is to spawn broodstock being held at Merwin Hatchery over the course of their natural spawn based on redd surveys in the lower river. Peak spawn timing for broodstock held at Merwin Hatchery occurred during the week of April 19 (Figure 6). No spawning occurred during the week of April 26 due to the lack of females. 9
14 Lewis River Hydroelectric Project (FERC Nos. 935, 2071, 2111 & 2213) Hatchery & Supplementation Program Annual Report Number of spawning crosses (1x1) Mar Mar 29 - Apr 4 Apr 5-11 Apr Apr Apr 26 - May 2 May 3-9 May May Week Figure 6. Spawn timing of broodstock held at the Merwin Hatchery. All crosses (n=25) are 1x1 2.6 Rearing, Tagging and Release Of the 84,337 fry ponded, 29.3 percent (24,745) succumbed to natural mortality, bacterial coldwater disease (BCW), ichthyopthirius (Ich), and Furunculosis. Because the egg take goal was achieved, the 2016 release is expected to release 60,
15 Lewis River Hydroelectric Project (FERC Nos. 935, 2071, 2111 & 2213) Hatchery & Supplementation Program Annual Report Rearing Table 5. Summary of rearing statistics for the 2015 brood year GENERAL STATISTIC Actual Egg Take 97,265 Eyed Eggs 91,022 Total Fry Ponded 84,337 Total Fry out planted (unfed) 4,400 MORTALITY Egg Loss % 6.42% Total Rearing Loss 24,745 Due to natural causes 1,793 Due to disease (ich and Furunculosis) 2,475 Due to disease (BCW) 20,477 Shortage / Adjustment 1,748 RELEASE Projected Smolt Release (survival) 60,000 Release Date (Start Volitional) May 1, 2016 Release size 8 fpp 11
16 Lewis River Hydroelectric Project (FERC Nos. 935, 2071, 2111 & 2213) Hatchery & Supplementation Program Annual Report Number of Smolts May Jun Jul Aug Sep Oct Nov Dec Jan Feb Mar Apr Month Figure 7. Observed mortality rate of fish ponded for brood years 2009 through Tagging All subyearling steelhead were tagged with blank wire snout tag in December Release All fish will be volitionally released on May 1, 2016 at the Merwin boat launch. Volitional release will continue until June 1, Any fish remaining in the ponds on June 1, 2016 will be forced out and released downstream of the County Bridge in Woodland, WA. Projected average release size in 8 per pound. A total release number of 60,000 smolts is projected. 12
17 Lewis River Hydroelectric Project (FERC Nos. 935, 2071, 2111 & 2213) Hatchery & Supplementation Program Annual Report MONITORING AND EVALUATION 3.1 Winter Steelhead Redd Surveys (Lower River) Redd surveys are used to estimate spawning abundance and distribution of winter steelhead in the mainstem North Fork Lewis River. Surveys are conducted weekly throughout the spawning period, which typically starts March 1 and extends into mid June Spawning Abundance Spawning abundance estimates rely on new redd census data, assumed sex ratio and females per redd to calculate total spawner abundance (Freymond and Foley 1986). Females per redd follow WDFW generalized guidelines of 0.81 females per redd and sex ratio is assumed equal (Table 6). Beginning in 2013, we also calculate the spawner abundance using the observed sex ratio of late winter steelhead entering the Merwin Trap. This may be a more accurate estimate of female to male ratio in the river because of the large numbers captured in the trap and is unbiased in terms of capture efficiency for males or females. Using trap data collected for 2015, a total of 1,323 steelhead were trapped. These include mainly BWT steelhead, but also include steelhead held for broodstock and steelhead released because of stubby dorsal fins and no wire tag in their snout. Of this total, 785 were male and 538 were female. Therefore, for every female we assume that there are 1.46 males (instead of 1) that make up the population. As a result, the corrected population estimate is higher than assuming the 1:1 ratio (Table 6). The number of redds per female should also be verified at some point to improve the accuracy of this estimate. By combining trap counts and in river abundance estimates through redd surveys a total estimate of escapement can be calculated. Total escapement of late winter steelhead (to include both NOR and BWT) to the North Fork Lewis River is 2,088 (Table 8). Table 6. Late Winter Steelhead Abundance Downstream of Merwin Dam 2008 through 2015 based on redd counts. Year Number of Redds observed Spawner Estimate Observed sex ratio (females : males) Spawner Estimate (Corrected) : : :
18 Lewis River Hydroelectric Project (FERC Nos. 935, 2071, 2111 & 2213) Hatchery & Supplementation Program Annual Report 2015 Number of Spawners or Redds Spawner Estimate Redds Spawner Estimate (Corrected) Year Figure 8. Wild winter steelhead spawner abundance downstream of Merwin Dam 2008 through 2015 based on redd counts Distribution A summary of redd distribution is provided in Table 7. Reach number 2 had the most redds and the highest density given the amount of available habitat. Most of this density is concentrated just upstream of a small riffle about ¾ of mile downstream of Merwin Dam nicknamed Haggedorn's. It is not fully understood why this area is used so extensively used by steelhead for spawning but it remains consistent from year to year. One key difference in this area is the gravel size (relatively small) and consistent flow rates along the tailout of the main pool. Redd locations are illustrated in Appendix E. Reach breaks coincide with WDFW reach breaks used for fall Chinook surveys. 14
19 Lewis River Hydroelectric Project (FERC Nos. 935, 2071, 2111 & 2213) Hatchery & Supplementation Program Annual Report 2015 Table 7. Redd distribution summary for reaches 1 through 5 including redds per mile Reach Reach Length (miles) Redds Redd per Mile TOTAL Average redds per mile = Proportion of hatchery origin spawners on the spawning grounds Program returns are treated as hatchery origin (HOR) steelhead despite their genotype assignment to NOR stocks. This is due to the hatchery influence during mating and captive rearing conditions during their first year of life. As these program fish return as adults, there is opportunity for these (HOR) fish to spawn with NOR stocks. It has been shown that reproductive success (fitness) declines rapidly (up to 37 percent per captive reared generation) within a natural population (Araki et. al. 2007). The evolutionary mechanisms for declines in fitness are not fully understood, but hatchery protected rearing environments and controlled mating selection are suspected contributors to this decline (Araki et. al 2007). Inbreeding between program fish is also a concern because of loss in genetic diversity or effective population size further limits fitness and adaptability of the natural spawning population. In 2015, the ratio of HOR to NOR captured through tangle netting is used to estimate phos and related PNI. Tangle netting provides a direct measure of the proportion of hatchery to natural origin fish on the spawning grounds when done during spawning and in areas where spawning is occurring. However, there is a portion of HOR steelhead caught in the tangle nets that are destined for the Merwin Trap based on trap returns in 2014 and Figure 9 provides the proportion of fish collected through the run time of late winter steelhead. April 8 represents the day in which half of the available steelhead are trapped suggesting that a portion of the BWT steelhead captured in the tangle nets are ultimately destined for the Merwin Trap and do not spawn in the lower river (i.e., they are not kelts upon entry into the trap). 15
20 Lewis River Hydroelectric Project (FERC Nos. 935, 2071, 2111 & 2213) Hatchery & Supplementation Program Annual Report Cumulative Proportion Lower Quartile = March 23 Median = April 6 Upper Quartile = April Jan Feb Mar Apr May Jun Jul Day Figure 9. Cumulative proportion of steelhead captured at the Merwin Trap for years 2014 and To estimate phos through tangle netting, the number of HOR (primarily BWT) and NOR are recorded during the peak spawn time of NOR winter steelhead in the Lewis River (Figure 3). The total HOR and NOR captures during the peak spawn time (March through the end of netting) provides an estimate of the ratio present on the spawning grounds (Table 8). To account for HOR steelhead that have not yet entered the Merwin Trap, the number of HOR steelhead netted is adjusted based on the proportion of marked and released HOR steelhead that ultimately entered the Merwin Trap (Table 8). The use of tangle netting is limited by its duration in that netting normally does not extend past the first or second week of May. Netting past this date raises the potential for disrupting and perhaps reducing natural spawning success, because nearly all steelhead captured past this date are either kelts or active spawners. Despite this limitation, tangle netting remains a means to directly sample and determine origin of steelhead while on the spawning grounds. 16
21 Lewis River Hydroelectric Project (FERC Nos. 935, 2071, 2111 & 2213) Hatchery & Supplementation Program Annual Report 2015 Table 8. Ratio of marked steelhead recaptured at the Merwin Trap including estimates of escapement, phos and PNI Abundance BWT NOR Total Merwin Trap 1, ,323 Marks Redd Survey 765 Total Escapement 2,088 Tangle Netting 23 Recaptured at Trap 7 Recruitment to trap (avg) 0.30 phos Peak Spawn time Average 45% Season Average 51% PNI Season Average 67% Table 9. Weekly ratio of HOR and NOR steelhead captured in the tangle net for year 2015 Week NOR HOR (observed) HOR (corrected*) phos PNI** Feb % 61% Feb % 56% Feb % 63% Mar % 63% Mar % 71% Mar % 66% Mar % 73% Mar % 67% Apr % 67% Apr % 68% Apr % 79% * Corrected values reflect a reduction of 0.30% based on Merwin Trap recaptures **pnob = 1 because all broodstock are tested for assignment to natural origin stocks Based on tangle net captures during the spawning period, we estimate the proportion of hatchery origin spawners is 45 percent (51 percent for the season). The main contributor to this estimate is the number of BWT steelhead on the spawning grounds during the natural spawning period. Based on our estimate, over half of the late winter steelhead spawning in the 17
22 Lewis River Hydroelectric Project (FERC Nos. 935, 2071, 2111 & 2213) Hatchery & Supplementation Program Annual Report 2015 North Fork Lewis River mainstem are of hatchery origin. The ability to remove a meaningful number of BWT and AD clipped winter steelhead spawning in the lower river would be challenging without directly and irreversibly reducing NOR spawning success. Estimates of PNI are always going to exceed HSRG standards as long as the program continues to use only verified NOR broodstock. Estimates of PNI are provided in Table 9. HSRG recommendations for phos and PNI for late winter steelhead on the Lewis River are as follows: phos: < 30 percent PNI: > 50 percent 3.3 Recaptures of circular pond reared late winter steelhead In 2013, a total of 1,205 late winter steelhead smolts were PIT tagged from circular rearing vessels. The purpose of this marking is to evaluate (1) return rates of circular reared smolts relative to rearing pond releases and (2) compare residualism rates of through tangle netting and screw trapping between circular reared and traditional pond rearing smolts. In 2015, thirteen adults (1.1 %) were recaptured that had codes from the 2013 brood year (one from 2014 brood year). The ability to detect PIT tagged fish at the Merwin Trap was limited in 2015 because the automated detector was not installed until May. This likely resulted in positive PIT tagged steelhead being transported upstream as regular BWT steelhead (all circular tank fish were also tagged with blank wire tags). In 2016, the Merwin Trap will be fully functional with an automated PIT tag reader and an accurate count of circular tank returns will be possible. All fish caught during tangle netting are also wanded for PIT tags upon capture. 3.4 Upstream Transport of Steelhead, Coho and Spring Chinook In 2015, a total of 1,265 blank wire tagged steelhead (758 males, 507 females) were transported upstream of Swift Dam (Table 9). Steelhead were transported from both the Merwin Trap and through tangle netting. Eighty three (83) transported steelhead also received a gastric radio tag for distribution studies in the upper basin as part of the Aquatic Monitoring and Evaluation Plan. This year represents the fourth year of steelhead transportation activities and numbers continue to increase each year. The goal of the H&S program is 500 winter steelhead transported each year. We have exceeded this target the last three years (Table 10). In 2015, late coho were used for the first time for adult supplementation upstream of Swift Dam. This decision was made by the H&S subgroup and approved by the ACC. The main reason for this change was that both early and late coho are treated as the same population for recovery planning purposes. Also, by using late coho there is more flexibility in the transportation schedule to spread the transportation over a longer period of time. It is anticipated that over the years, survival between early and late coho will differ based on 18
23 Lewis River Hydroelectric Project (FERC Nos. 935, 2071, 2111 & 2213) Hatchery & Supplementation Program Annual Report 2015 natural processes (e.g., river flow, temperature, turbidity, etc) at the time each group spawns. This difference is considered beneficial as the natural environment will have a larger influence on survival. Adult spring Chinook supplementation has not been possible for several years due to poor hatchery returns to the Lewis River hatchery. The WDFW is modifying the release timing of spring Chinook from the hatchery in hopes of improving survival of spring Chinook smolts and returns back to the Lewis in coming years. Table 10. Summary of Winter Steelhead transported and released upstream of Swift Dam. YEAR Late Winter Steelhead TOTAL Radio Tagged (of total) Coho (early and late) TOTAL Radio Tagged (of total) Spring Chinook , , , , , , , , , , * 1, , *starting in 2015, late coho (type n) were also transported Screw trap Operations In 2015, the screw trapping effort was conducted near the golf course using two 8 foot diameter screwtraps from April 1 through June 12, Both traps were fastened together and fished in tandem for the duration of the sampling season. In total, 44,132 salmonids (15,223 smolts) were captured (Table 11). This is a significantly higher capture rate than the 3,013 smolts collected in 2014 despite significantly lower than normal river flow throughout the sampling period (Figure 10). In 2014, only a single 8 foot screwtrap was used. The use of a tandem trap appears to improve trapping efficiency. In 2014, only coho were used to estimate trapping efficiency due to low capture rates of other species. The calculated trap efficiency in 2014 for coho was 0.98 percent compared to 1.5 percent in 2015 (Table 12). Steelhead and NOR coho had much higher efficiencies at 2.1 and 10.5 percent, respectively (Tables 13 and 14). 19
24 Lewis River Hydroelectric Project (FERC Nos. 935, 2071, 2111 & 2213) Hatchery & Supplementation Program Annual Report 2015 The use of a tandem trap will again be used in If flow rates in 2016 are representative of the historical average, efficiencies should improve over those observed in Flow Smolt Captures 4000 River Flow (CFS) 4000 Release of coho from Lewis River Hatchery Number of Smolts Apr May Jun Month (day) Figure 10. Total discharge from Merwin Dam between April 1 and June 10,
25 Lewis River Hydroelectric Project (FERC Nos. 935, 2071, 2111 & 2213) Hatchery & Supplementation Program Annual Report 2015 Table 11. Collection summary for the rotary screw trap deployed downstream of Merwin Dam April 1 June 12, Species Smolt Type Number Collected Mean Length (FL, mm) Marked and released upstream Recaps NOR 1, Coho AD 11, AD + CWT CWT only TOTAL 13,654 2, NOR Steelhead BWT 1, AD TOTAL 1,196 1, NOR (fry) 28, Chinook AD 321 AD + CWT 6 % Hatchery TOTAL 29, Cutthroat NOR % 91% 88% 1% TOTAL SMOLTS = 15,223 TOTAL FRY (fall Chinook) = 28,909 TOTAL SALMONIDS = 44,132 21
26 Lewis River Hydroelectric Project (FERC Nos. 935, 2071, 2111 & 2213) Hatchery & Supplementation Program Annual Report 2015 Table 12. Weekly and total estimates of abundance for all coho smolts migrating past the lower Lewis River screwtraps April 1 June 12, Period Total Smolts Captures (excluding recaptures) Marked and Released Upstream Recapture Trap Efficiency* Number of Migrants** Week 1 April 1 7 7, ,997 Week 2 April , ,533 Week 3 April ,133 Week 4 April ,133 Week 5 April 29 May ,174 Week 6 May ,296 Week 7 May ,260 Week 8 May ,600 Week 9 May 27 June ,120 Week 10 June ,436 TOTAL 13,654 2, ,320,683 * for zero recaptures, seasonal efficiency (0.015) was used to calculate the number of weekly migrants. ** if using seasonal efficiency (rather than weekly) the estimate of migrants is 896,083 22
27 Lewis River Hydroelectric Project (FERC Nos. 935, 2071, 2111 & 2213) Hatchery & Supplementation Program Annual Report 2015 Table 13. Weekly and total estimates of abundance for NOR coho smolts migrating past the lower Lewis River screwtraps April 1 June 12, Period Total Smolts Captures (excluding recaptures) Marked and Released Upstream Recapture Trap Efficiency* Number of Migrants** Week 1 April ,055 Week 2 April ,912 Week 3 April Week 4 April Week 5 April 29 May Week 6 May Week 7 May Week 8 May ,170 Week 9 May 27 June ,345 Week 10 June TOTAL ,589 * for zero recaptures, seasonal efficiency (0.102) was used to calculate the number of weekly migrants. ** if using seasonal efficiency (rather than weekly) the estimate of migrants is 11,396 23
28 Lewis River Hydroelectric Project (FERC Nos. 935, 2071, 2111 & 2213) Hatchery & Supplementation Program Annual Report 2015 Table 14. Weekly and total estimates of abundance for all steelhead smolts migrating past the lower Lewis River screwtraps April 1 June 9, Period Total Smolt Captures (excludes recaptures) Marked and Released Upstream Recapture Trap Efficiency * Number of Migrants** Week 1 April Week 2 April Week 3 April Week 4 April ,714 Week 5 April 29 May ,950 Week 6 May ,476 Week 7 May ,352 Week 8 May ,556 Week 9 May 27 June Week 10 June TOTAL 1,196 1, ,056 * for zero recaptures, seasonal efficiency (0.021) was used to calculate the number of weekly migrants. ** if using seasonal efficiency (rather than weekly) the estimate of migrants is 59, Mainstem Carcass and Redd Surveys *NOTE: Mainstem and tributary carcass survey data for spring Chinook and coho are surveyed beginning in the fall season of each year and extend until the end of January. This schedule does not typically provide adequate time to input, review and analyze collected data and present the results in formal reporting by April 1 of each year. Therefore, reporting for mainstem and tributary surveys of coho and spring Chinook may be delayed one year from the survey period. However, placeholder titles in each report iteration are never removed until the data are available, analyzed or deemed inadequate. This is especially true of tributary coho estimates whereby estimates of adult coho abundance are grouped into the larger lower Columbia River DPS. These results will be presented when WDFW completes their final analysis for years For lower Lewis River mainstem surveys of coho and spring Chinook results are presented in this report for survey year Field work was completed by Meridian Environmental and analysis of the data was performed by West, Inc. For 2013 and 2014 revised abundance estimates for coho are provided in Appendix F. These revised estimates account for loss on capture when carcasses are re sighted then removed from the marked population abundance estimates for both spring Chinook and coho salmon are provided in Appendix G of this report. 24
29 Lewis River Hydroelectric Project (FERC Nos. 935, 2071, 2111 & 2213) Hatchery & Supplementation Program Annual Report 2015 Fall Chinook abundance estimates are reported by WDFW and included as Appendix H Coho Salmon Tributary Surveys 2012, 2013 and 2014: WDFW to provide results Spring Chinook and Coho Salmon Survey results summary Table 15. Summary of spring Chinook and coho salmon spawning surveys downstream of Merwin Dam (September 2015 through January 2016) 4.0 RECOMMENDATIONS FOR ONGOING MANAGEMENT Improvements in the way we handle and rear steelhead from wild winter broodstock continues to improve. Observed mortality of adults, juveniles and eggs has declined from previous years. Also, rearing conditions have improved as recommendations from the H&S subgroup have been implemented. Returns of late winter steelhead reared in circular tanks will continue to return through If results suggest survival benefits (SAR), the use of circular tank rearing may be expanded to include a larger portion of the steelhead smolt releases and longer duration of rearing in circular tanks. 25
30 Lewis River Hydroelectric Project (FERC Nos. 935, 2071, 2111 & 2213) Hatchery & Supplementation Program Annual Report 2015 Developing estimates of abundance for juveniles that meet precision goals continues to be a challenge. Annual planning meetings need to focus on developing standardized sampling methods that strive to meet NOAA precision guidelines for monitoring fish populations. Our trapping efforts for estimating juvenile abundance currently does not achieve collection efficiencies needed to meet precision goals of abundance (migrants). In 2016, the tandem trap will again be deployed. More normal flows may improve trap efficiencies beyond those observed in 2015 due to historically low flows on the North Fork Lewis River. In addition to monitoring methods, the H&S Subgroup should focus on the effects of the late winter broodstock program on NOR winter steelhead stocks in the lower river. The effects of mining and of program returns competing and spawning with NOR steelhead in the lower river needs more comprehensive evaluation. While the program is temporary, there may be long term genetic impacts to the locally adapted population that may not yet be realized. These potential impacts should be monitored with methods that are now available to quantify metrics such as effective population size and inbreeding coefficients. These metrics are consistent with regional best management practices and should be developed further for the North Fork Lewis River late winter steelhead program. Additionally, ongoing genetic testing of returning program fish should be used to determine whether spawning crosses and resulting families are well represented in the adult program returns. If family representation is not well represented, spawning protocols need to be modified based on recommendations from regional geneticist to ensure (as best we can) that each family is equally represented in the program returns. As the program matures into its 8th year, the potential for non marked steelhead captured in the Merwin Trap originating from natural spawning of BWT steelhead in the lower river or upstream of Swift Dam increases. These fish are indistinguishable from native stocks despite their ancestry to hatchery programs. The fact that there are no means to differentiate these fish may result in broodstock selection of F2 program fish. This risk has to be accepted for the program to continue. Microsattelite analysis will continue with all broodstock to ensure that Chambers Creek stock or other hatchery strays are not used in the program. 5.0 REFERENCES Araki, H., Cooper, B., and S. Blouin Genetic Effects of Captive Breeding Cause a Rapid, Cumulative Fitness Decline in the Wild. Science, vol. 318, October 5, Freymond, B., and S. Foley Wild steelhead spawning escapement estimates from Boldt Case rivers Washington Department of Game. Fish Management Division. Rep. No Olympia,WA. Hilborn, R., B. G. Bue, and S. Sharr Estimating spawning escapement for periodic counts: a comparison of methods. Canadian Journal of Fisheries and Aquatic Sciences 56:
31 Lewis River Hydroelectric Project (FERC Nos. 935, 2071, 2111 & 2213) Hatchery & Supplementation Program Annual Report 2015 Hill, R. A Optimizing aerial count frequency for area under the curve method of estimating escapement. North American Journal of Fisheries Management 17: Hood, G. M Pop Tools version URL Kinsel, C., P. Hanratty, M. Zimmerman, B. Glaser, S. Gray, T. Hillson, D. Rawding, and S. VanderPloeg Intensively Monitored Watersheds: 2008 Fish Population Studies in the Hood Canal and Lower Columbia Stream Complexes. FPA 09 12, Washington Department of Fish and Wildlife, Olympia, Washington. 27
32 Lewis River Hydroelectric Project (FERC Nos. 935, 2071, 2111 & 2213) Hatchery & Supplementation Program Annual Report 2015 APPENDIX A Wild Winter Steelhead Collection Log 2015
33 Appendix A: Broodstock Transferred to Merwin Hatchery Trap Date Capture Method Gender Fork Length (cm) Pit Tag # DNA Sample # DNA Results Scale Card # Position Returned To River Comments 2/9/2015 Merwin Trap M 60 A203 MT15 1 LRMerwin Y Spawned 3/26 w/ Female MT15 8 2/16/2015 Merwin Trap M 56 A1EF MT15 2 LRMerwin Y Spawned 4/14 w/ Female MT /17/2015 Tangle Net M 71 BC96066 TN15 6 LRMerwin.7286 Y Spawned 4/22 w/ female MT /19/2015 Merwin Trap F 73 A238 MT15 3 Germany cr Y 2/21/2015 Merwin Trap M 69 A206 MT15 4 LRMerwin N Spawned 4/10 w/ Female MT /22/2015 Merwin Trap M 89 A200 MT15 5 LRMerwin N Spawned 4/15 w/ female MT /3/2015 Merwin Trap F 63 A205 MT15 6 NFToutleR N Spawned 4/6 w/ Male TN /10/2015 Tangle Net F 81 BC96066 TN15 14 LRMerwin.8736 Y Spawned 4/1 w/ Male TN /10/2015 Tangle Net M 76 BC96054 TN15 15 LRMerwin.8352 Y Spawned 4/1 w/ Female TN /14/2015 Merwin Trap M 75 A22F MT15 7 LRMerwin N Spawned 4/6 w/ Female MT /17/2015 Tangle Net M 91 BC96074 TN15 16 LRMerwin N Spawned 4/6 w/ Female MT /17/2015 Tangle Net M 77 BC9607E TN15 17 LRMerwin N Spawned 4/6 w/ Female TN /17/2015 Tangle Net F 60 BC96065 TN15 19 Coweeman Y Spawned 4/20 w/ male TN /17/2015 Tangle Net M 72 BC96080 TN15 21 LRMerwin Y Spawned 4/1 w/ Female MT /17/2015 Tangle Net M 77 BC960A0 TN15 23 Germany cr Y 3/24/2015 Tangle Net F 85 BC9607A TN15 26 LRMerwin.9052 Y Tangle Net brought in Spawned Out 3/24/2015 Tangle Net M 91 BC960A7 TN15 28 LRCedar.8113 Y Spawned 4/20 w/ female TN /24/2015 Tangle Net M 72 BC960A4 TN15 29 LRMerwin.9868 Y Spawned 4/20 w/ female MT15 9 3/24/2015 Tangle Net F 84 BC960AC TN15 31 LRMerwin.2528 Y Scale Card /26/2015 Merwin Trap F 60 A241 MT15 8 LRMerwin Y Spawned 3/26 w/ Male MT15 1 LRMerwin /28/2015 Merwin Trap F 58 A21C MT Y Spawned 4/20 w/ male TN15 29 KalamW /28/2015 Merwin Trap M 87 A211 MT15 10 LRMerwin Y Spawned 4/20 w/ female MT /30/2015 Tangle Net F 86 BC96051 TN15 33 LRMerwin Y Spawned 4/6 w/ Male TN Coweeman /30/2015 Tangle Net M 92 BC9605F TN Y Spawned 4/20 w/ female MT15 11 LRMerwin KalamW /30/2015 Tangle Net M 76 BC9609D TN N Spawned 4/14 w/ female MT15 23 LRMerwin /31/2015 Merwin Trap F 65 A1FC MT15 11 LRMerwin Y Spawned 4/20 w/ male TN /1/2015 Merwin Trap F 69 A24B MT15 12 LRCedar Y Spawned 4/1 w/ Male TN /1/2015 Merwin Trap F 60 A1FE MT15 13 LRMerwin Y Spawned 4/10 w/ Male MT /6/2015 Merwin Trap F 82 A237 MT15 14 LRMerwin Y Spawned 4/6 w/ Male MT /7/2015 Merwin Trap M 57 A227 MT15 15 LRMerwin Y Spawned 5/4 w/ female MT15 33 LRMerwin /7/2015 Merwin Trap M 62 A23F MT Y Returned to river (poor condition) Coweeman LRCedar /8/2015 Merwin Trap M 75 A1EE MT Y Spawned 5/4 w/ female MT15 34 LRMerwin /10/2015 Merwin Trap F 63 A225 MT LRMerwin Y Spawned 4/20 w/ male MT /13/2015 Merwin Trap M 77 A1E7 MT LRCedar Y Spawned 4/22 w/ female MT /13/2015 Merwin Trap F 74 A21B MT LRCedar Y Spawned 4/14 w/ Male MT /14/2015 Merwin Trap M 86 A209 MT15 21 LRCedar Y Spawned 4/20 w/ female MT15 21 APPENDIX A 1
34 Trap Date Capture Method Gender Fork Length (cm) Pit Tag # DNA Sample # DNA Results Scale Card # Position Returned To River Comments 4/14/2015 Merwin Trap F 73 A24A MT15 22 LRCedar Y Spawned 4/20 w/ male MT /14/2015 Merwin Trap F 64 A221 MT15 23 LRMerwin Y Spawned 4/14 w/ male TN15 35 Coweeman /15/2015 Merwin Trap F 72 A1F5 MT Y Spawned 4/15 w/ male MT15 5 LRCedar KalamW LR 4/21/2015 Merwin Trap M 53 A212 MT Y SH:SU:16:W? LRCedar LRMerwin LR 4/22/2015 Merwin Trap F 57 A1FO MT Y Spawned 4/22 w/ male MT15 19 Cedar /22/2015 Merwin Trap F 58 A222 MT15 27 LRMerwin Y Spawned 4/22 w/ male TN15 6 4/23/2015 Merwin Trap M 60 A1E9 MT15 28 LRMerwin N Spawned 5/12 w/ female MT15 38 LRMerwin /23/2015 Merwin Trap F 54 A1E8 MT Y LrCedar /25/2015 Merwin Trap M 92 A210 MT15 30 LRMerwin Y Spawned 5/4 w/ female MT15 31 LRMerwin /27/2015 Merwin Trap F 64 A1E5 MT Y Spawned 5/4 w/ male MT15 30 Coweeman LRMerwin /27/2015 Merwin Trap F 62 A245 MT Y Spawned 5/15 w/ male MT15 35 LRCedar /27/2015 Merwin Trap F 59 A1EC MT15 33 LRMerwin Y Spawned 5/4 w/ male MT15 15 LRMerwin /27/2015 Merwin Trap F 54 A22E MT Y Spawned 5/4 w/ male MT15 17 LRCedar /27/2015 Merwin Trap M 55 A1F4 MT15 35 LRMerwin Y Spawned 5/15 w/ female MT15 32 LRCedar /28/2015 Tangle Net F 82 BC96082 TN15 54 Y Spawned 5/12 W/ male MT 37 LRMerwin /4/2015 Merwin Trap M 64 A236 MT Y LRhatSUM /5/2015 Merwin Trap M 85 A1F9 MT15 37 LRMerwin Y Spawned 5/12 w/ female TN15 54 LRCedar /5/2015 Merwin Trap F 61 A1ED MT Y Spawned 5/12 w/ male MT15 32 GermCr /11/2015 Merwin Trap M 62 A23A MT15 39 LRMerwin Y Spawned 5/15 w/ female MT /12/2015 Merwin Trap F 54 A223 MT15 40 LRCedar Y Spawned 5/22 w/ male MT15 44 LRCedar /12/2015 Merwin Trap F 57 A20B MT Y Spawned 5/15 w/ male MT15 39 SandyR LRCedar /14/2015 Merwin Trap F 64 A1F6 MT Y Egg goals met released 5/22 LRMerwin Cowman /14/2015 Merwin Trap F 48 A201 MT Y Egg goals met released 5/22 LRMerwin EFLewisR /18/2015 Merwin Trap M 67 A249 MT Y Spawned 5/22 w/ female MT15 40 LRMerwin UPSSant /18/2015 Merwin Trap F 63 A21A MT Y Egg goals met released 5/22 LRCedar /18/2015 Merwin Trap F 75 A242 MT15 46 KalamaW Y Egg goals met released 5/22 APPENDIX A 2
35 Lewis River Hydroelectric Project (FERC Nos. 935, 2071, 2111 & 2213) Hatchery & Supplementation Program Annual Report 2015 APPENDIX B: Genetic Assignment Results from Lewis River Captures at Merwin Trap (MT), Cedar Creek (CC) and Tangle Netting (TN) 2015
36 2015 Genetic Assignment of fish captured at the Merwin Trap, Tangle Netting, and Cedar Creek Weir. Represents Hatchery Influence Capture Primary P(1) Secondary P(2) Tertiary P(3) 4th P(4) NOTES Tangle Netting LRMerwin KalamW EFLewisR LRCedar Tangle Netting LRMerwin LRCedar Tangle Netting LRMerwin LRCedar GrRLC GermCr Tangle Netting LRMerwin LRCedar Tangle Netting LRMerwin LRCedar KalamW GrRLC Tangle Netting LRMerwin LRCedar Tangle Netting LRhatSum Tangle Netting SandyR Cowman LRMerwin Tangle Netting LRMerwin LRCedar KalamW Cowman Tangle Netting LRMerwin Tangle Netting LRMerwin GermCr KalamSu LRCedar Tangle Netting LRMerwin GermCr LRCedar Tangle Netting LRMerwin LRCedar KalamW Tangle Netting LRMerwin LRCedar LRhatW GermCr Tangle Netting LRMerwin LRCedar Tangle Netting LRMerwin LRCedar GermCr KalamW Tangle Netting LRMerwin LRCedar GermCr Tangle Netting LRMerwin LRCedar Tangle Netting Cowman LRMerwin GermCr SandyR Tangle Netting LRMerwin LRCedar GermCr Cowman Tangle Netting LRMerwin LRCedar MillCr GrRLC Tangle Netting LRMerwin LRCedar Tangle Netting GermCr LRCedar LRMerwin Tangle Netting LRMerwin GermCr LRCedar EFLewisR Tangle Netting LRMerwin GrRLC LRCedar MillCr Tangle Netting GermCr LRMerwin LRCedar ElochR Tangle Netting LRCedar LRMerwin GarysR Cowman Tangle Netting LRMerwin LRCedar Tangle Netting LRCedar LRMerwin Tangle Netting LRMerwin KalamW Cowman KalamSu Tangle Netting LRMerwin GermCr LRCedar GrRLC Tangle Netting LRMerwin LRCedar GrRLC Tangle Netting Cowman LRMerwin LRCedar GarysR Tangle Netting KalamW LRMerwin GermCr LRCedar Tangle Netting LRMerwin LRCedar LRhatW Tangle Netting LRMerwin LRCedar KalamW GrRLC Tangle Netting LRMerwin LRCedar GermCr KalamW Tangle Netting LRCedar EFLewisR LRMerwin KalamSu Tangle Netting LRMerwin LRCedar GrRLC KalamW Tangle Netting LRMerwin LRCedar Tangle Netting LRMerwin LRCedar KalamW Tangle Netting KalamW BigCr LRMerwin GrRLC Tangle Netting Cowman LRMerwin LRCedar KalamW Tangle Netting LRMerwin Cowman ElochR GermCr Tangle Netting LRMerwin LRCedar KalamW Tangle Netting MillCr GermCr GrRLC ElochR Tangle Netting LRMerwin LRCedar ElochR EFLewisR Tangle Netting LRMerwin KalamW GermCr LRCedar Tangle Netting LRMerwin LRCedar Cowman KalamW Tangle Netting LRMerwin LRCedar Tangle Netting LRCedar KalamW GermCr Cowman Tangle Netting LRMerwin LRCedar KalamW Tangle Netting LRCedar LRMerwin GrRLC KalamW Merwin Trap LRMerwin LRCedar KalamW KalamSu Merwin Trap GermCr Merwin Trap LRCedar GrRLC MillCr
37 Capture Primary P(1) Secondary P(2) Tertiary P(3) 4th P(4) NOTES Merwin Trap LRMerwin Cowman Merwin Trap NFToutR GrRLC Merwin Trap LRMerwin LRCedar Cowman KalamSu Merwin Trap LRMerwin KalamW Cowman LRCedar Merwin Trap LRMerwin KalamW LRCedar GermCr Merwin Trap LRMerwin LRCedar KalamW Cowman Merwin Trap LRMerwin KalamW Cowman LRCedar Merwin Trap LRCedar LRMerwin Merwin Trap LRMerwin GermCr LRCedar MillCr Merwin Trap LRMerwin Merwin Trap LRMerwin EFLewisR LRCedar KalamW Merwin Trap LRMerwin Cowman LRCedar Merwin Trap LRCedar LRMerwin Cowman KalamW Merwin Trap LRMerwin LRCedar Cowman GrRLC Merwin Trap LRCedar LRMerwin ElochR Clack Merwin Trap LRCedar LRMerwin GermCr GrRLC Merwin Trap LRCedar Cowman LRMerwin Merwin Trap LRCedar LRMerwin Cowman Merwin Trap LRMerwin LRCedar GermCr Merwin Trap Cowman LRCedar LRMerwin GarysR Merwin Trap KalamW LRCedar EFLewisR LRMerwin Merwin Trap LRMerwin LRCedar CowlitzR Cowman Merwin Trap LRMerwin LRCedar LRhatSum Cowman Merwin Trap LRMerwin LRCedar Merwin Trap LRMerwin LRCedar KalamSu SandyR Merwin Trap LRMerwin LRCedar GermCr Merwin Trap LRMerwin Cowman GermCr LRCedar Merwin Trap LRMerwin LRCedar KlickSu Merwin Trap LRMerwin LRCedar Cowman GrRLC Merwin Trap LRMerwin LRCedar Cowman KalamW Merwin Trap LRMerwin GermCr Cowman ElochR Merwin Trap LRMerwin LRhatSum LRCedar KalamSu Merwin Trap LRMerwin KalamW LRCedar Merwin Trap LRCedar GermCr LRMerwin Cowman Merwin Trap LRMerwin Merwin Trap LRCedar Merwin Trap LRCedar SandyR GermCr KalamW Merwin Trap LRCedar LRMerwin KalamSu Cowman Merwin Trap Cowman LRMerwin LRCedar KalamW Merwin Trap EFLewisR LRMerwin Cowman KalamW Merwin Trap UpSSant LRCedar Clack Merwin Trap KalamW KalamSu LRMerwin Merwin Trap LRCedar KalamW LRMerwin GrRLC AD clip, BWT Merwin Trap LRMerwin AD clip, BWT Merwin Trap LRMerwin LRCedar GermCr AD clip, BWT Merwin Trap LRMerwin ElochHat KalamW LRCedar AD clip, BWT Merwin Trap LRMerwin LRhatW LRCedar ElochHat AD clip, BWT Merwin Trap LRMerwin LRCedar KalamW GermCr AD clip, BWT Merwin Trap LRMerwin ElochR LRCedar MillCr AD clip, BWT Merwin Trap LRMerwin LRhatW LRCedar MillCr AD clip, BWT Merwin Trap LRMerwin LRCedar AD clip, BWT Merwin Trap LRMerwin LRCedar AD clip, BWT Merwin Trap LRMerwin LRCedar MillCr GrRLC AD clip, BWT Merwin Trap LRMerwin KalamW ElochR LRCedar AD clip, BWT Merwin Trap LRMerwin ElochR LRCedar GermCr AD clip, BWT Merwin Trap LRMerwin KalamW LRCedar AD clip, BWT Merwin Trap KalamW LRMerwin LRCedar GrRLC AD clip, BWT Skamania H. LRMerwin GermCr LRCedar MillCr AD clip, BWT (sample from head) Cedar Creek KlickSu Cedar Creek KlickSu BigCr Cedar Creek LRCedar Cowman 0.019
38 Capture Primary P(1) Secondary P(2) Tertiary P(3) 4th P(4) NOTES Cedar Creek LRCedar LRMerwin Cedar Creek LRCedar Cowman LRMerwin MillCr Cedar Creek LRCedar LRMerwin KalamW Cedar Creek KalamW GrRLC LRMerwin SFTout Cedar Creek LRCedar LRMerwin ElochR GrRLC Cedar Creek LRCedar LRMerwin GermCr KalamSu Cedar Creek LRMerwin LRCedar Cedar Creek LRCedar MillCr GrRLC Cedar Creek LRhatW Cowman MillCr LRMerwin Cedar Creek LRCedar MillCr LRMerwin Cedar Creek LRCedar KalamW Cedar Creek LRCedar LRMerwin KalamW GrRLC Cedar Creek LRCedar LRMerwin Cowman SandyR Cedar Creek LRMerwin LRCedar Cowman KalamW Cedar Creek LRCedar KalamW GrRLC EFLewisR Cedar Creek LRMerwin LRCedar GermCr KalamW Cedar Creek LRCedar LRMerwin GrRLC SFTout Cedar Creek LRCedar LRMerwin KalamW Cedar Creek MillCr LRMerwin ElochR KalamW Cedar Creek GermCr KalamW MillCr BigCr Cedar Creek LRhatW LRCedar LRMerwin KalamW Cedar Creek LRCedar LRMerwin Cowman Cedar Creek LRMerwin LRCedar Cowman KalamW Cedar Creek LRCedar LRMerwin ElochR ElochHat Cedar Creek LRCedar LRMerwin Cedar Creek MillCr Cowman KalamW LRMerwin Cedar Creek Cowman LRCedar ElochHat LRMerwin Cedar Creek LRCedar LRMerwin KalamW GermCr Cedar Creek LRCedar LRMerwin GrRLC GermCr Cedar Creek LRCedar LRMerwin MillCr GrRLC Cedar Creek LRCedar LRMerwin MillCr GrRLC Cedar Creek EFLewisR LRMerwin GermCr KalamSu Cedar Creek LRCedar MillCr LRMerwin SFTout Cedar Creek LRCedar LRMerwin KalamW Cowman Cedar Creek LRMerwin Cowman ElochR KalamW Cedar Creek LRMerwin LRCedar GermCr KalamW Cedar Creek LRCedar KalamW ElochHat Cedar Creek LRMerwin KalamW LRCedar MillCr Cedar Creek EFLewisR KalamSu GrRLC LRCedar Cedar Creek LRMerwin MillCr LRCedar KalamSu Cedar Creek LRCedar KalamW LRMerwin MillCr Cedar Creek LRCedar LRMerwin KalamW Cedar Creek LRCedar LRMerwin LRhatW Cowman Cedar Creek LRhatW LRCedar BigCr Cowman Cedar Creek LRCedar GermCr KalamW GrRLC Cedar Creek SFTout LRMerwin GrRLC ElochR Cedar Creek LRMerwin MillCr KalamW LRCedar Cedar Creek LRCedar MillCr LRMerwin KalamW Cedar Creek LRCedar LRMerwin Cowman MillCr Cedar Creek LRMerwin LRCedar Cedar Creek GermCr KalamSu LRMerwin KalamW Cedar Creek LRCedar LRMerwin Cowman EFLewisR Cedar Creek LRMerwin LRCedar Cowman KalamW Cedar Creek LRCedar LRMerwin Cowman MillCr Cedar Creek LRCedar LRMerwin Cowman Clack Cedar Creek MillCr EFLewisR KalamSu GermCr Cedar Creek LRCedar LRMerwin GermCr ElochR Cedar Creek LRCedar KalamW LRMerwin Cowman Cedar Creek LRCedar LRhatW LRhatSum LRMerwin Cedar Creek LRMerwin LRCedar Cowman MillCr Cedar Creek MillCr LRCedar LRMerwin ElochR 0.060
39 Capture Primary P(1) Secondary P(2) Tertiary P(3) 4th P(4) NOTES Cedar Creek LRMerwin LRCedar SandyR ElochR Cedar Creek KalamW LRMerwin GermCr SandyR Cedar Creek MillCr LRMerwin KalamW Cowman Cedar Creek LRMerwin LRCedar KalamSu GermCr Cedar Creek LRMerwin LRCedar GrRLC ElochR Cedar Creek LRMerwin LRCedar Cowman Clack Cedar Creek MillCr ElochR GermCr LRCedar Cedar Creek LRCedar KalamSu LRMerwin GrRLC Cedar Creek LRCedar KalamW LRMerwin ElochR Cedar Creek LRCedar LRMerwin LRhatW EFLewisR Cedar Creek MillCr LRMerwin LRCedar KalamW Cedar Creek KlickSu 0.398
40 Lewis River Hydroelectric Project (FERC Nos. 935, 2071, 2111 & 2213) Hatchery & Supplementation Program Annual Report 2015 APPENDIX C Winter Steelhead Spawning Crosses 2015
41 2015 Spawning crosses at the Merwin Hatchery Spawn Date Capture Date Capture Method Gender Fork Length (cm) DNA Sample # DNA Results /26/2015 4/20/2015 4/14/2015 4/22/2015 4/10/2015 4/15/2015 4/6/2015 4/1/2015 4/6/2015 4/6/2015 4/20/2015 4/1/2015 4/20/2015 4/20/2015 4/14/2015 5/4/2015 5/4/2015 4/22/2015 2/9/2015 Merwin Trap M 60 MT15 1 LRMerwin /26/2015 Merwin Trap F 60 MT15 8 LRMerwin /28/2015 Merwin Trap M 87 MT15 10 LRMerwin.827 4/10/2015 Merwin Trap F 63 MT LRMerwin /16/2015 Merwin Trap M 56 MT15 2 LRMerwin /13/2015 Merwin Trap F 74 MT LRCedar /17/2015 Tangle Net M 71 TN15 6 LRMerwin /22/2015 Merwin Trap F 58 MT15 27 LRMerwin /21/2015 Merwin Trap M 69 MT15 4 LRMerwin /1/2015 Merwin Trap F 60 MT15 13 LRMerwin /22/2015 Merwin Trap M 89 MT15 5 LRMerwin /15/2015 Merwin Trap F 72 MT15 24 Coweeman LRCedar LR 3/17/2015 Tangle Net M 91 TN15 16 LRMerwin /3/2015 Merwin Trap F 63 MT15 6 NFToutleR /10/2015 Tangle Net M 76 TN15 15 LRMerwin /10/2015 Tangle Net F 81 TN15 14 LRMerwin /14/2015 Merwin Trap M 75 MT15 7 LRMerwin /6/2015 Merwin Trap F 82 MT15 14 LRMerwin /17/2015 Tangle Net M 77 TN15 17 LRMerwin /30/2015 Tangle Net F 86 TN15 33 LRMerwin /24/2015 Tangle Net M 91 TN15 28 LRCedar /17/2015 Tangle Net F 60 TN15 19 Coweeman /17/2015 Tangle Net M 72 TN15 21 LRMerwin /1/2015 Merwin Trap F 69 MT15 12 LRCedar /24/2015 Tangle Net M 72 TN15 29 LRMerwin /28/2015 Merwin Trap F 58 MT15 9 LRMerwin.4803 KalamW /30/2015 Tangle Net M 92 TN15 34 Coweeman.5601 LRMerwin /31/2015 Merwin Trap F 65 MT15 11 LRMerwin /30/2015 Tangle Net M 76 TN15 35 KalamW.5005 LRMerwin /14/2015 Merwin Trap F 64 MT15 23 LRMerwin /7/2015 Merwin Trap M 57 MT15 15 LRMerwin.561 4/27/2015 Merwin Trap F 59 MT15 33 LRMerwin /8/2015 Merwin Trap M 75 MT15 17 LRCedar LRMerwin /27/2015 Merwin Trap F 54 MT15 34 LRMerwin LRCedar /13/2015 Merwin Trap M 77 MT LRCedar /22/2015 Merwin Trap F 57 MT15 26 LRMerwin LR Cedar APPENDIX C 1
42 19 Spawn Date Capture Date Capture Method Gender Fork Length (cm) DNA Sample # DNA Results 4/20/2015 4/14/2015 Merwin Trap M 86 MT15 21 LRCedar /14/2015 Merwin Trap F 73 MT15 22 LRCedar /12/2015 5/4/2015 5/15/2015 5/12/2015 5/15/2015 5/22/2015 4/23/2015 Merwin Trap M 60 MT15 28 LRMerwin /5/2015 Merwin Trap F 61 MT15 38 LRMerwin /25/2015 Merwin Trap M 92 MT15 30 LRMerwin /27/2015 Merwin Trap F 64 MT15 31 GermCr /27/2015 Merwin Trap M 55 MT15 35 LRMerwin /27/2015 Merwin Trap F 62 MT15 32 LRMerwin LRCedar /5/2015 Merwin Trap M 85 MT15 37 LRMerwin /28/2015 Tangle Net F 82 TN15 54 LRCedar LRMerwin /11/2015 Merwin Trap M 62 MT15 39 LRMerwin /12/2015 Merwin Trap F 57 MT15 41 LRCedar SandyR /18/2015 Merwin Trap M 67 MT15 44 EFLewisR /12/2015 Merwin Trap F 54 MT15 40 LRCedar APPENDIX C 2
43 Lewis River Hydroelectric Project (FERC Nos. 935, 2071, 2111 & 2213) Hatchery & Supplementation Program Annual Report 2015 APPENDIX D NOR winter steelhead spawning log 2015
44 Wild Winter Steelhead Spawning Log 2015 (needs updating from WDFW) Spawn Date Female & Male Release Date Female DNA # Male DNA # Total Egg Weight w/ovarian (grams) Total Egg Weight (g) Estimate Eggs/Female Eyed Egg Eggs/LB Eyed Eggs On Hand Dead Eggs Actual Eggs/Female 3/26/2015 3/26/2015 MT 15 8 MT % /1/2015 4/1/2015 MT TN % /1/2015 4/1/2015 TN TN % /6/2015 4/6/2015 MT MT % /6/2015 4/6/2015 TN TN % /6/2015 4/6/2015 MT 15 6 TN % /10/2015 4/10/2015 MT MT % /13/2015 4/13/2015 MT MT % /14/2015 4/14/2015 MT TN % /15/2015 4/15/2015 MT MT % /20/2015 4/20/2015 MT MT /20/2015 4/20/2015 MT MT /20/2015 4/20/2015 MT TN /20/2015 4/20/2015 MT 15 9 TN /20/2015 4/20/2015 TN TN /22/2015 4/22/2015 MT MT /22/2015 4/22/2015 MT TN /4/2015 5/4/2015 MT MT /4/2015 5/4/2015 MT MT /4/2015 5/4/2015 MT MT /12/2015 5/12/2015 TN MT /12/2015 5/12/2015 MT MT /15/2015 5/15/2015 MT MT /15/2015 5/15/2015 MT MT Percent of Egg Loss Estimate # Fry Ponded APPENDIX D 1
45 Lewis River Hydroelectric Project (FERC Nos. 935, 2071, 2111 & 2213) Hatchery & Supplementation Program Annual Report 2015 APPENDIX E Steelhead Redd Locations, Lewis River, WA 2015

46 APPENDIX E. Redds identified in Reach 1 APPENDIX E. Page 1

47 APPENDIX E. Steelhead Redds identified in Reach 2 APPENDIX E. Page 2

48 APPENDIX E. Redds identified in Reach 3 APPENDIX E. Page 3

49 APPENDIX E. Late winter steelhead redds identified in Reach 4 APPENDIX E. Page 4

50 APPENDIX E. Late winter steelhead redds identified in Reach 5 (1 of 2) APPENDIX E. Page 5

51 APPENDIX E. Late winter steelhead redds identified in Reach 5 (2 of 2) APPENDIX E. Page 6
52 Lewis River Hydroelectric Project (FERC Nos. 935, 2071, 2111 & 2213) Hatchery & Supplementation Program Annual Report 2015 APPENDIX F Revised estimates of 2013 and 2014 coho escapement from tagged carcass surveys in the lower Lewis River.
53 ENVIRONMENTAL & STATISTICAL CONSULTANTS 456 SW Monroe Ave, Suite 106, Corvallis, OR Phone: Date: September 29, 2015 To: Erik Lesko (PacifiCorp) From: Leigh Ann Starcevich (WEST, Inc.) and Jason Shappart (Meridian Environmental, Inc.) Re: Revised Estimates of 2013 and 2014 Coho Adult Escapement from Tagged Carcass Surveys in the Lower Lewis River Introduction Coho salmon spawning surveys (including carcass tagging) are conducted annually from mid October through January by Meridian Environmental, Inc. (Meridian) for PacifiCorp to provide the basis for estimating escapement in the mainstem North Fork Lewis River downstream of Merwin Dam to the downstream end of Eagle Island. The area of interest is divided into 5 reaches ranging from 0.57 to 7.30 miles long, previously defined by Washington Department of Fish and Wildlife (WDFW). Surveys are conducted multiple days per week between mid October and the end of January. Coho carcasses are identified and tagged with an individually numbered plastic disk behind the gills (two tags per carcass) so that re sighting probabilities of tagged carcasses do not differ from untagged carcasses. The tagged carcass is then returned to the river in flowing water to deposit naturally downriver. On successive survey occasions, carcasses are counted by reach. Once re sighted, tagged carcasses are recorded then tails and tags are removed and carcasses are deposited adjacent to the river. Therefore, once a carcass is resighted, it is removed from the tagged population. In this memo, the methods and results of an analysis to estimate coho salmon escapement are outlined. This memo updates the results reported on April 8, Statistical Methods Analysis tools developed for a similar analysis used by California Department of Fish and Wildlife (Bergman et al. 2012) were applied to the carcass data from the Lower Lewis River surveys. These tools account for loss on capture when carcasses are re sighted then removed from the marked population. In the R statistical environment (2014), the rma package (McDonald 2015) was used to apply the super population parameterization (Schwarz and Arnason 1996) of the Jolly Seber model to estimate the total escapement in the population. Escapement is quantified by Schwarz and Arnason (1996) as the total number of gross births in the area of interest, which includes coho present at the beginning of the study, those that move into the study area during the monitoring period, and those that do not survive to the end of the monitoring period. WEST, Inc. 1 Sept. 29, 2015
54 ENVIRONMENTAL & STATISTICAL CONSULTANTS 456 SW Monroe Ave, Suite 106, Corvallis, OR Phone: Intercept only models were used for capture and survival probabilities because preliminary modeling indicated that both the 2013 and 2014 data were too sparse for timedependent models. A nonparametric bootstrap (Manly 2007) was used to obtain the standard error and 95% confidence intervals on total escapement. Results The results of the 2013 and 2014 carcass surveys are provided in Table 1. A total of 328 carcasses were marked in 2013 and 41 were re sighted over 27 sampling occasions. In 2014, 18 of 431 marked carcasses were re sighted over 23 sampling occasions. Escapement (i.e. total carcasses) was estimated in 2013 as 1970 (bootstrap 95% CI: 1523, 2679) and 7805 (bootstrap 95% CI: 5172, 13186) in The coefficient of variation for estimated escapement was 0.15 in 2013 and 0.27 in Table 1. Estimated coho spawner escapement by year to the mainstem North Fork Lewis River from Merwin Dam to the downstream end of Eagle Island, with 95% confidence intervals. Year Number of marked carcasses Number (%) of captured carcasses Est. Gross Population Size Bootstrap SE 95% Confidence Interval (12.5%) (1523, 2679) (4.2%) (5172, 13186) 0.27 CV Discussion Incorporating loss on capture reduced the estimates of escapement from those reported in the April 8, 2015 analysis report. Note that the analysis does not need to account for observed carcasses that were not marked. The mark resight methods applied in this analysis do not require that all encountered carcasses be marked. The coefficient of variation was lower for the 2013 estimate of escapement (0.15) than for the 2014 escapement estimate (0.27). Several factors may influence the precision of the escapement estimates. First, only 4.2% of the marked carcasses were resighted in 2014 compared to a resighting rate of 12.5% in Second, 27 sampling occasions were used in 2013 compared to 23 occasions in Both of these parameters can be highly influenced by environmental conditions. For example, when flows are too high and visibility too low, surveys are not conducted. This was the primary reason for fewer sampling occasions in 2014 compared to In addition, high flows likely reduced carcass detection probability due to depth and decreased water clarity. Flows were substantially higher during the 2014 coho spawning survey season (mid October through January) compared to the 2013 survey season (Figure 1). WEST, Inc. 2 Sept. 29, 2015
55 ENVIRONMENTAL & STATISTICAL CONSULTANTS 456 SW Monroe Ave, Suite 106, Corvallis, OR Phone: Figure 1. USGS Lewis River at Ariel gage mean daily flow (cfs). Precision of escapement estimates may be improved by increasing the number of marked carcass re sight rate, and/or sampling occasions. The Meridian spawning survey crew conducts mainstem Lewis River surveys four days per week during the majority of the coho spawning time. However, environmental variables such as flow may limit the number of surveyable days. PacifiCorp conducts river drawdowns on Wednesdays during the coho and fall Chinook spawning survey season at the request of WDFW to improve WDFW s ability to recover fall Chinook carcasses. During 2013 and 2014, Meridian specifically avoided conducting coho surveys on Wednesday drawdowns at the request of WDFW. The data analysis above suggests that coho carcass recovery rates may be improved during lower flows. Conducting coho carcass surveys during Wednesday drawdowns may increase carcass recovery rates and thereby improve the precision of total carcass estimates. WEST, Inc. 3 Sept. 29, 2015
56 ENVIRONMENTAL & STATISTICAL CONSULTANTS 456 SW Monroe Ave, Suite 106, Corvallis, OR Phone: Literature Cited Bergman, J. M., R. M. Nielson, and A. Low Central Valley in river Chinook salmon escapement monitoring plan. Fisheries Branch Administrative Report Number: California Department of Fish and Wildlife. Sacramento, CA. Manly, B Randomization, Bootstrap, and Monte Carlo Methods in Biology, 3 rd edition. Chapman and Hall, Boca Raton, Florida, USA. McDonald T mra: Analysis of Mark Recapture Data. R package version project.org/package=mra. R Core Team (2014). R: A language and environment for statistical computing. R Foundation for Statistical Computing, Vienna, Austria. URL project.org/. Schwarz, C.J., and A.N. Arnason A general method for analysis of capture recapture experiments in open populations. Biometrics 52: WEST, Inc. 4 Sept. 29, 2015
57 Lewis River Hydroelectric Project (FERC Nos. 935, 2071, 2111 & 2213) Hatchery & Supplementation Program Annual Report 2015 APPENDIX G Estimates of 2015 coho escapement from tagged carcass surveys in the lower Lewis River.
58 Environmental Sciences Regulatory Planning Project Management Memorandum To: Erik Lesko, PacifiCorp From: Jason Shappart, Fisheries Scientist Date: February 25, 2016 Re: NF Lewis River downstream of Merwin Dam spring Chinook and coho spawning survey results (September 2015 through January 2016) Introduction Spring Chinook and coho salmon spawning surveys are conducted annually from September through January by Meridian Environmental, Inc. (Meridian) for PacifiCorp to provide the basis for estimating spawning escapement in the North Fork Lewis River downstream of Merwin Dam. Spring Chinook surveys are conducted from September through mid-october and coho surveys are conducted from mid-october through January. The survey area of the mainstem North Fork Lewis River is divided into five index reaches ranging from 0.57 to 7.30 miles long encompassing the area from the boat barrier downstream of Merwin Dam to the downstream end of Eagle Island (10.84 miles total length). Reaches were defined by Washington Department of Fish and Wildlife (WDFW). North Fork Lewis River tributary coho survey reaches are defined annually by WDFW using a GRTS sample design, drawing about five miles total of tributary survey reaches for each survey season. All surveys are conducted on a weekly basis as environmental conditions allow (flow, turbidity, etc.). This memorandum summarizes spring Chinook and coho spawning survey results for the period from September 2015 through January Survey Conditions Spring Chinook Survey (September through mid-october) Western Washington experienced a drought during 2015, followed by intense and extended precipitation from late fall to early winter. Flow conditions in the North Fork Lewis River were lower than the normal minimum flow during the spring Chinook spawning survey period (as approved through agency consultation). In prior years, a jet boat was used to conduct the spring Chinook surveys. Flows were too low to use a jet boat to effectively and safely conduct surveys during the entire spring Chinook survey season. Therefore, nonmotorized float craft (raft and drift boat) were used to conduct all spring Chinook surveys. Two boats were used for each survey, one boat surveying along each side of the river. All five reaches need to be surveyed within a one day period. Due to the low flow conditions and relatively large number of spring Chinook spawners, it was not possible to collect all data and cover the entire survey length within a 1-day period. Therefore, Reach 5 was truncated (Figure 1) to allow a complete survey of all reaches within a 1-day period (6.45 miles total length instead of miles). The downstream end of Reach 5 was terminated at the Golf Course boat ramp, the furthest downstream accessible boat ramp available 2136 Westlake Ave N, Seattle, WA Tel Fax
59 during the 2015 survey season (Figure 1). Historically, few spring Chinook have been observed spawning downstream of the Golf Course boat ramp. Note that the Eagle Island boat ramp is slightly farther downstream, but was closed for use during the survey period due to low water conditions. Coho Survey (mid-october through January) Minimum flows increased in mid-october, which allowed for jet boat use. Therefore, all coho spawning surveys were conducted via jet boat and all five reaches were surveyed during a single day for each survey, ending at the downstream end of Eagle Island (10.84 miles total). Intense precipitation resulted in spill at Merwin Dam for a brief period in November and extended unsurveyable conditions persisted due to spill for a three week period in December (Figure 2). As a result, mainstem coho surveys were only completed during 12 of the 15 weeks during the survey season. Most tributary reaches were only surveyable during 10 of the 15 weeks during the survey season, being too turbid to survey during a three week period in December, then again during the end of January. Results Spring Chinook Carcass and redd counts were much larger in 2015 than during the prior two years (over 10 times greater). A total of 1,485 spring Chinook redds were counted, primarily in reaches 2, 3, and 4. A total of 792 carcasses were counted, about 84 percent being of hatchery origin (Table 1). All Chinook carcasses encountered during each survey, which were not previously counted (as indicated by a cut tail), were identified by sex and external marks (i.e. fin clips, tags, etc.), and most were scanned for coded wire tags. Only one coded wire tag was found from scanning 569 carcasses. Note that WDFW began Chinook surveys the latter part of September, which over lapped with this survey effort. Therefore, total carcass counts for the survey period summarized in this document are biased low (Table 1). WDFW Chinook carcass counts by reach should be added to those in Table 1 for surveys that WDFW conducted prior to October 12, 2015 (the day of the last survey we conducted). Coho Carcass and redd counts were much lower in 2015 than during the prior two seasons (over 20 times lower). A total of two coho redds were counted within North Fork Lewis River tributary survey reaches during the 2015 season (five tributaries encompassing 4.8 survey miles total). A total of five coho carcasses were observed; four hatchery female and one unmarked male (Table 1). No carcasses contained coded wire tags. All females were spawned out. Of note is that until heavy rains started in November, stream flow in all tributary reaches was very low and may have hindered upstream migration of coho into the tributaries. A total of 12 coho carcasses were observed in the entire mainstem North Fork Lewis River survey area over 18 survey days; eight hatchery female, two hatchery male, and two unmarked male. All were observed in reaches 4 and 5. Two carcasses contained coded wire tags. Ninety percent of female carcasses observed were pre-spawn mortalities. About 83 percent of carcass were of hatchery origin. All 12 coho carcasses observed were marked and 1900 N. Northlake Way, Suite 211, Seattle, WA Tel Fax
60 released to complete the mark-resight estimate of total carcasses. Only two carcasses were resighted. Discussion Flows were substantially lower during the 2015 spring Chinook survey season, but substantially higher during the coho survey season compared to the prior two seasons. During the spring Chinook survey period average daily flow was 850 cfs, but was 1,296 and 3,376 cfs in 2014 and 2013 (respectively). During the coho survey period average daily flow in was 8,429 cfs, but was 7,876 and 4,804 cfs in 2014 and 2013 (respectively). Low flows likely increased detection probability for spring Chinook carcasses and redds in 2015 compared to previous years. However, high flows likely reduced carcass and redd detection probability for coho due to reduced visibility caused by increased depth and turbidity, and increased carcass transport rate downstream due to higher velocities. High flows and associated turbidity precluded coho surveys for nearly the entire month of December. A substantial proportion of all carcasses recovered in the prior two survey years were collected in December; 25% in 2014 and 60% in Coho redd surveys of the mainstem North Fork Lewis River were ineffective at differentiating coho vs. fall Chinook redds due to the very large number of fall Chinook spawning in the North Fork Lewis River compared to coho. Peak counts of live coho spawners and holders were hindered by poor visibility due to high flows and associated turbidity. As in prior years, PacifiCorp conducted river drawdowns on Wednesdays during the coho and fall Chinook spawning survey season (as possible) at the request of WDFW to improve WDFW s ability to recover fall Chinook carcasses. As in prior years, Meridian specifically avoided conducting coho surveys on Wednesday drawdowns (3 drawdowns total this season) at the request of WDFW. Prior data analysis suggests that coho carcass recovery rates may be improved during lower flows. Avoiding coho surveys on Wednesday drawdowns also likely resulted in fewer coho carcass recoveries. Due to the overall very low number of coho carcasses observed for the mark-resight method (12 carcasses marked and 2 resighted), statistical estimates of total carcasses were not generated as results would likely be spurious due to low sample size. In comparison, 41 of 328 marked coho carcasses were resighted in 2013 and 18 of 431 marked carcasses were resighted in The same survey crew conducted all surveys during all three years covering the same reaches and season. This suggests that poor survey conditions due to high flows, as well as overall lower coho returns to the Lewis River basin accounted for the lack of coho observations during the 2015 survey season N. Northlake Way, Suite 211, Seattle, WA Tel Fax


61 Environmental Sciences Regulatory Planning Project Management Figure North Fork Lewis River and tributaries downstream of Merwin Dam spawning survey reach map Westlake Ave N, Seattle, WA Tel Fax
62 Figure 2. USGS Lewis River at Ariel gage mean daily flow (cfs) N. Northlake Way, Suite 211, Seattle, WA Tel Fax

63 Table 1. Summary of spring Chinook and coho salmon spawning surveys downstream of Merwin Dam (September 2015 through January 2016) N. Northlake Way, Suite 211, Seattle, WA Tel Fax
64 Lewis River Hydroelectric Project (FERC Nos. 935, 2071, 2111 & 2213) Hatchery & Supplementation Program Annual Report 2015 APPENDIX H Lewis River Fall Chinook Escapement Report
65 Results of Sampling the North Fork Lewis River Natural Spawning Fall Chinook in Columbia River Progress Report Washington Department of Fish and Wildlife Fish Program-Southwest Region Grand Boulevard Vancouver, Washington Shane Hawkins April
66 Introduction Since 1964, fall Chinook spawning surveys have occurred annually on the Lewis River. Yearly population estimates were derived from these surveys. The annual escapement estimates are used to reconstruct the Lower River Wild (LRW) stock component, of the Columbia River fall Chinook returns. The compiled database is then used in conjunction with harvest estimates to estimate harvest rates relative to Pacific Salmon Treaty and ESA commitments. The LRW stock was listed as threatened under the Endangered Species Act, in March In addition, the escapement database has been combined with the Lewis River Wild Stock Tagging Project (Hawkins 1998a) to monitor river flows and juvenile fall Chinook production. Age and stock composition of the annual Lewis River fall Chinook natural spawn have been estimated since Fish scales are used for aging and coded wire tags (CWT) for stock analysis, and documented by Grimes (1994), Hawkins (1993; 1996a; 1996b; 1996c; 1998; 2013a-i), Hawkins and Roler (1991), Kreitman (1981a; 1981b), Norman (1982; 1983; 1985a; 1985b; 1986; 1987; 1988), and Roler (1990a; 1990b; 1993). As part of compiling this annual escapement estimate, a carcasses mark recapture study was also completed. This report summarizes the data collected from spawning surveys in the fall and early winters of and does not address the carcass tagging study other than to report the additional effort involved. The escapement estimate in this report was based on recent year s methodology. Methods North Fork Lewis River The 2014 fall Chinook sampling included grading by decomposition condition of the carcasses and the attachment of two-numbered plastic operculum tags one for each operculum. Six weekly live, red and dead counts were made on Tuesdays and the data recorded by section (Section 1-5). Three counts were conducted in October and three in late November and early December. For each three count group GPS points of redds were taken. Age and escapement estimates were based on weekly carcasses recoveries from both Tuesday and Wednesday. Besides incorporating two carcass recovery days and a one 1 in 5 sample rate during four peak recovery weeks all other methods were the same as developed in 2003 (Hawkins, 2012) based on carcasses tagging results from (Hawkins, 2012). Weekly flow reductions, discharge rate of 2,000 cfs at Merwin Dam were requested from PacifiCorp to begin in October to assist in carcass recoveries. Additional reductions, to a discharge rate of 1,200 cfs, were requested for November to further assist in carcass recovery. Additional reductions of flows by ~2,000 cfs were requested to assist carcass recoveries in December and early January. Carcass recoveries were first judged on the ability to sample for CWTs and the possibility to recover an operculum tag. Operculum tagged carcasses were considered recoveries and as such previously sampled. Non-operculum tagged carcasses were consider a new carcass and examined for fin clips and possible coded wire tag (CWT) recovery. New carcasses were graded 2, 3 and 4s being of condition fresh enough to be operculum tagged. Carcasses not meeting these grades where then CWT sampled and enumerated as adipose present or absent. Those older carcasses along with those already operculum tagged were deformed buy chopping the carcasses into two pieces. Chopped carcasses were tallied and operculum tags recorded by section. Data was collected from all operculum numbered tagged carcasses. The tag numbers were recorded along with carcass 2
67 condition, length, sex and adipose fin disposition and three scales taken. Cumulative weekly counts of carcasses by section (1-5) were recorded by presence or absence of fin clips. Surveys were spread over 17 weeks and included 44 boat trips ranging from one boat trip per week in September and October and again in late January to 6 boat trips per week during the late November counts. The nose (snout) area was examined electronically with a wand for presence of a CWT from all adipose fin-clipped salmon. The snout was removed from all wand positive carcasses for the CWT recovery. A number label with the recorded date, sex, fork length and species was attached to the snouts recovered. Not all scales taken were used for age analysis for this report. Age analysis used only the fresh (condition 2) carcasses (bright clear eyes) those thought to have spawned since the last survey, the criteria used in recent years. Three scales were placed by operculum tag numbered position on a scale card along with this recorded information; sex, fork length, fin-clips, and CWT label number where pertinent. The sex and fork length, fin-clips and CWT label number were also recorded on a scale card slot for all CWT snouts taken with no accompanying scales, (older carcasses). Ages read from the scales were used to determine the age composition of the weekly natural spawn. The ages read from fresh carcasses were expanded for a 1 in 5 and a 1 in 10 sample rates incorporated during the peak carcass recovery weeks. The 1 in 5 was used for the weeks of (November 12- November 19 and December 10- December 17). The 1in 10 was incorporated for weeks (November 26 and December 3). These expansions assume a random sample and no recovery age bias, as assumed for the older carcasses recovered. The ages read from the less than fresh carcasses (condition 3 and 4) we ignored for this report and treated the same as carcasses not directly aged. The ages, of all carcasses not directly aged were estimated (age assigned). The estimation began by first assigning non aged carcasses to a spawn week. The assignment was accomplished by moving the older carcasses sampled into preceding weeks spawn. The movement was based on weekly tagged carcasses recovered in subsequent weeks, percentage of the combined weeks tags recovered the first, second, third and fourth weeks out. Carcass life ranged from two weeks after being tagged in October to six weeks in December and January (Hawkins, 2012). Once assigned to a spawn week, the age composition derived from that week s scale sample was applied with some adjustment. The adjustment applied was the sum of age bias for all carcass tags recovered. The bias is the difference in recovery rates; 0.13 for 2 year-olds, 0.30 for 3 yearolds, 0.32 for 4 year-olds, 0.39 for 5 year-olds, and 0.54 for 6 year-olds (Hawkins, 2012). The expected age and sample size was proportioned to equal the actual carcasses assigned. The CWTs recovered with assigned carcasses were also assigned a spawn week. The assignment of the CWTs was a little more subjective (single fish versus a percent assigned to a week). While the percentage of tags went with the percentage of carcasses which individual tag went where was arbitrary with some subjectivity utilizing carcass condition. CWTs were used to determine Lewis River wild stock composition. Spawn weeks with only and large number of Lewis River wild (LW) CWTs recoveries were used to generate LW tag rates. These LW rates were then applied to the few LW CWTs recovered in other spawn weeks to account for all the LW carcasses examined. The Lower Columbia River hatchery (LRH) 3
68 contribution to the natural spawn was determined from wand negative adipose clip fish and those adipose fin clipped carcasses with LRH tags. The few adipose wand negative carcasses attributed to the natural spawn after the second week of November (Wk 2) were considered tag loss from LW-CWT. Carcasses with no adipose clips recovered from the spawn prior to November (Wk 2) were considered be Lower Columbia River stock same as LRH but not of hatchery origin and not accounted for by expanded LW-CWTs. Carcasses examined but not accounted for by CWTs in late December through early February were considered non-tagged LW stock (non-cwt). Carcass examination rates;.0229 for 2 year-olds, for 3 year-olds, for 4 year-olds, for 5 year-olds, and for 6 year-olds developed from mark recapture studies (Hawkins, 2012) were applied to carcasses examined for all stocks to estimate escapement. Cedar Creek Cedar Creek LRH and LCR fall Chinook escapement was combined with the Lewis River LRH and LCR estimates, for a combined North Lewis River basin LRH and LCR stock estimate. The Cedar Creek estimate was obtained from two separate estimates: above and below the fish-way ladder trap at river mile 2.6. The first estimate was obtained using carcass mark recapture methods and weekly foot surveys in the lower 2.5 miles of the creek. The escapement estimate for the upper reaches of Cedar Creek was based on live mark recapture methods. Live fish were captured at a fish-way ladder (RM 2.6) with a trap installed just prior to its exit. Upon capture the live/dead fish were sampled using the same protocols as carcasses sampled. Live fish identified to have a CWT were sacrificed for tag recovery. All other live fish counted were marked with a uniquely numbered visual tag and released just upstream of exit. Not all fish use the fish-way and not all the fish using the fish-way spawn above the fish-way. Those fish spawning below with visual tags were considered as part of the lower spawn. The visual tags/fish were expanded by the lower section carcass recovery rates to account for all visual tags in the lower sections spawn. Expanded fall backs were subtracted from fish-way counted fish put upstream. To account for and sample those fish not using the fish-way foot surveys in portions of upper Cedar Creek were preformed weekly to examine carcasses for visual tags. A weir and trap (RM 6.1) were used to increase the number of Chinook examined for visual tags above the fish-way. All newly observed fish/carcasses were aged and CWT sampled. The numbers of fish/carcasses observed above the fish-way with or without visual tags was used to estimate trap efficiency. This efficiency was used to expand the tagged fish upstream for upper Cedar Creek escapement. Results During seventeen weekly surveys, beginning on September 26, 2014 and ending on January 13, 2015, a total of 14,752 fall Chinook carcasses were examined for the recovery of 142 snouts taken for CWTs (Table 1). Scales samples were taken from 2,893 carcasses of which all but seven were also carcass tagged. Forty percent of those carcasses tagged, 1,156 were later recovered. Based on carcass condition (2), only 1,806 of the scale sampled carcasses were actually used in this report for age analysis. Age was determined from 97% of the scale samples collected. The age samples used in report represented 12.2% of all the fall Chinook carcasses examined (Table 2). The scale analysis provided an age composition for each spawn week. The 4
69 summary age composition of the natural spawn was comprised of 5.1% age 2s, 7.7% age 3s, 76.3% age 4s, 7.3% age 5s, and 0.1% age 6s. In addition to the 151 scales taken but were not able to be read an additional 3,368 carcasses were assumed to be part of the spawn week as sampled base on 1 in 5 random sample applied over 2-2 week periods (November 12- November 19 and December 10- December 17) and 2 weeks sampled at 1 in 10 weeks November 26- December 3. The remaining 9,578 carcasses sampled and the associated CWTs were assumed to have been part of a previous spawn weeks and were assigned to a spawn week. Once the carcasses were assigned a spawn week ages were estimated (age assigned). The assignment was based on an expected age composition derived from age specific carcass tag recovery rates applied to the ages read (age actual from scales) from the fresh carcasses recovered during that spawn week. Table 3 combines the age assigned carcasses with the age actual carcasses for age totals sampled for each spawn week. The age summary for all the carcasses examined was estimated to be comprised of 460 age 2s, 1,113 age 3s, 11,899 age 4s, 1,263 age 5s and 16 age 6s. A total of 113 fall Chinook CWTs were read from 124 snouts taken. They included 28 assorted out of basin hatchery origin strays and 85 wild Lewis River (LW-CWT) tags (Table 4). Through the assignment of a spawn week for all CWTs read, based on the subjectivity of carcass condition, stock separation was possible with only some overlap (Table 5). Using the period when 87.1% of the LW-CWTs were recovered tag rates were generated for those CWTs (Table 6). The CWT tag rates generated were for 2012 brood, for 2011 brood, for 2010 brood, for 2009 brood, and 0.0 for 2008 brood. The rates were then used to estimate the LW-CWT contribution to both the earlier spawn and later spawning. The remaining early spawn was further separated by hatchery stray contribution. Adipose fin clips identified 1,086 of the carcasses sampled as hatchery in origin (LRH; Table 7). The CWTs recovered with these clipped (LRH) hatchery carcasses were 22 from Kalama, 1 from Washougal,1 from Big Creek, and 2 from Cowlitz hatcheries. Other stray CWTs were 1 Quinault origin and 1 URB origin above Bonneville Dam. The 10 LW-CWTs and clips were the only ad-clipped carcasses not counted as hatchery origin. All the non-clipped carcasses (2,354) sampled during early spawning were considered to be of wild Lewis River origin. The 10 Lewis River wild CWTs recovered in the early spawn period expanded by the generated tag rates assigned 1,287 of the non-clipped carcasses examined to the LW-CWT escapement. The remaining 1,067 carcasses examined in both October and early November were considered to be of wild LRH type. These same tag rates were then applied to the 1 tag recovered from the late December spawn. All the LW-CWTs recovered estimated the total LW carcasses examined at 11,442. The one late LW- CWT recovered from the late December and January spawn expanded to account for 80 of the 1,237 carcasses examined from this late spawn (Table 8). The remaining 1,157 carcasses were then considered late Lewis River wild stock not represented by CWTs (LW-non-cwt). The combined Lewis River fall Chinook escapement was then estimated by brood specific expansion rates. The expansion rates were applied by brood and sex, to the carcasses examined. The total 2014 North Fork Lewis River fall Chinook escapement was estimated to have totaled 26,410 (Table 9). Of which14,682 were estimated to have been females. The by brood break 5
70 down of the fall Chinook escapement in the Lewis River was; 2,010 2-yr-olds, 2,210 3-yr-olds, 20,387 4-yr-olds, 1,784 5-yr-olds, and 19 6-yr-olds. The wild contribution to the total escapement was estimated to be 24,510 or 92.8%. Sample rate expanded CWTs (145) estimated an escapement of 20,507 LW-CWT wild fall Chinook or 83.7% of the Chinook escapement. The remaining escapement included 1,986 late spawning wild fall Chinook and 2,017 early spawning wild fall Chinook. The 1,901 stray hatchery Chinook accounted for 7.2 percent of the total escapement. The early components of the Lewis River escapement both hatchery and wild were combined with the total Cedar Creek escapements to provide a total Lewis River North Fork basin LRH escapement. The combined basin LRH type fall Chinook escapement totaled 5,619 (Table 10). Based on adipose fin clipped count the combined hatchery contribution to the escapement was 2,811. Since all hatchery fall Chinook in the Lewis River basin are out of basin strays, the accompanying CWTs were considered as one spawn whether it occurred in the Lewis River or Cedar Creek. The combined hatchery CWTs recovered expanded to 52. The wild component of the LRH escapement was estimated at 2,807. Discussion Carcass sampling in 2015 turned out to be the largest ever with just under 15,000 carcasses examined for CWTs. Surveys proceeded weekly beginning in late September through mid- January with no interruption. In late January higher flows ended surveys even though a few carcasses probably would have been recovered. A peak count on November 26 under good conditions provided a count of 5,196. Removing the 107 chopped carcasses a count of 5,089 would be consistent protocol with used for the 5.28 expansion or an estimate of 26,870. The carcass expansion derived in this report estimated the escapement of 26,410 a difference of 1.7%. 6
71 Table 1. Lewis River 2014 spawning survey effort and conditions. Weekly survey data Boat CFS Discharge at Merwin Dates Sampled Aged CWTs CWT/Rate Crews Surveyed Previous Max 26-Sep ,200 1,200 3-Oct ,200 1,200 8-Oct ,200 1, Oct ,200 1, Oct ,000 1, Oct ,580 2,580 5-Nov ,200 4, Nov 1, ,000 10, Nov 2, ,500 4, Nov 2, ,200 6,800 3-Dec 1, ,000 16, Dec 1, ,400 11, Dec 1, ,300 6, Dec ,000 11, Dec ,200 10,000 7-Jan ,600 9, Jan ,600 11,600 Totals 17 14,752 2,
72 Table 2. Lewis River 2014 fall Chinook weekly brood composition of the natural spawn. Age determined from scales taken from fresh carcasses. Weekly brood contribution in percent Aged Percent Date 2s 3s 4s 5s 6s Used * Sampled Aged 26-Sep 0.0% 0.0% 100.0% 0.0% 0.0% % 3-Oct 0.0% 6.1% 81.8% 6.1% 0.0% % 8-Oct 0.8% 12.1% 55.8% 3.4% 0.0% % 15-Oct 2.5% 10.1% 70.6% 6.0% 0.0% % 22-Oct 7.7% 21.8% 104.9% 22.5% 0.0% % 29-Oct 6.3% 2.9% 67.3% 9.3% 0.0% % 5-Nov 4.4% 8.7% 76.9% 3.6% 0.0% 203 1, % 12-Nov 4.1% 5.3% 84.3% 5.7% 0.0% 190 * 2, % 19-Nov 8.5% 13.5% 76.3% 4.8% 0.0% 271 * 2, % 26-Nov 8.0% 9.3% 75.5% 7.4% 0.0% 172 * 1, % 3-Dec 3.5% 1.0% 70.9% 3.4% 0.0% 79 * 1, % 10-Dec 1.7% 3.4% 83.3% 16.0% 0.0% 105 * 1, % 17-Dec 1.5% 7.9% 69.2% 7.7% 1.6% 73 * % 23-Dec 1.2% 2.5% 84.2% 11.0% 0.0% % 30-Dec 0.0% 0.0% 73.7% 26.3% 0.0% % 7-Jan 0.0% 0.0% 57.9% 42.1% 0.0% % 13-Jan 0.0% 0.0% 29.4% 29.4% 0.0% % % 7.7% 76.3% 7.3% 0.1% 1,806 14, % * Scales were taken from relatively fresh carcasses and graded by condition for a Carcass Tagging Study. Only carcasses graded to have spawen within previous seven days were used for this report. These selected scales were then aged and used to calculate the age composition of the weekly natural spawn. Do to the large return and the scope of the tagging study a radon sub-sample collection of scales was necessary for several weeks surveyed. Scale samples used from these weeks were expanded by the sub-sample rates. 8
73 Table 3. The 2014 age composition for all Lewis River fall Chinook carcasses examined. Time The summation of age actual and expected contribution Spawn Adjusted towards the carcasses examined for CWTs Week Sampled CWTs Rate Sept Wk % 0.0% 0.0% 0.0% 0.0% Sept Wk % 0.0% 100.0% 0.0% 0.0% Oct Wk % 15.4% 82.8% 1.8% 0.0% Oct Wk % 16.1% 77.9% 5.4% 0.0% Oct Wk % 10.9% 79.8% 7.8% 0.0% Oct Wk % 13.3% 67.3% 16.7% 0.0% Oct Wk % 3.2% 80.1% 13.0% 0.0% Nov Wk 1 1, % 9.0% 84.0% 4.6% 0.0% Nov Wk 2 2, % 5.1% 85.7% 6.6% 0.0% Nov Wk 3 2, % 12.9% 76.2% 5.4% 0.0% Nov Wk 4 1, % 9.2% 76.8% 8.3% 0.0% Dec Wk 1 1, % 1.2% 91.1% 4.9% 0.0% Dec Wk 2 1, % 3.1% 78.8% 17.2% 0.0% Dec Wk % 8.6% 78.3% 9.6% 2.4% Dec Wk % 2.3% 84.3% 12.7% 0.0% Dec Wk % 0.0% 72.0% 28.0% 0.0% Jan Wk % 0.0% 54.3% 45.7% 0.0% Jan Wk % 0.0% 50.0% 50.0% 0.0% Jan Wk % 0.0% 0.0% 0.0% 0.0% Jan Wk % 0.0% 0.0% 0.0% 0.0% 2014 Examined 14, ,113 11,899 1, The age expected w as derived from assigning a spaw n w eek for the old carcasses examined. Then using the w eek's age actual adjusted by carcass recovery rates derived from, the 2001 and 2002 Lew is River carcass tagging results, age specific recovery rates. 9
74 Table 4. Coded wire tags read from Lewis River fall Chinook spawning surveys in Lewis River Wild Origin Hatchery Origin Recoveries Code Origin Brood Recoveries Code Origin Brood Lewis Cedar Cr Lewis Lewis Kalama Lewis Kalama Lewis Quinault Lewis Cowlitz 10 1 Lost Tag Lewis Kalama Lewis Kalama Lewis Kalama URB Kalama Kalama Washougal Big Cr
75 Table 5. Sampled carcasses and coded wire tags (CWT) adjusted to an assigned to a spawn week, in Sampled carcasses contributing towards the CWTs recovered, by brood Spawn CWT 2s 3s 4s 5s 6s Percent Timing Rate Stock Total Sampled Sept Wk Spr-LRH % Sept Wk Spr-LRH % Oct Wk LRH % Oct Wk LRH LRH % Oct Wk LRH % Oct Wk LRH-LRHw % Oct Wk LRH-LRHw % Nov Wk LRW-CWT , % Nov Wk LRW-CWT , , % Nov Wk LRW-CWT , , % Nov Wk LRW-CWT , , % Dec Wk LRW-CWT , , % Dec Wk LRW-CWT , , % Dec Wk CWT-noCWT % Dec Wk Non-CWT % Dec Wk Non-CWT % Jan Wk Non-CWT % Jan Wk Non-CWT % Jan Wk Non-CWT % 2014 Examined 460 1,113 11,899 1, ,752 The percentages represent the expected age composition of all the carcasses examined from any one w eeks spaw n. The age expected w as derived from assigning a spaw n w eek to old carcasses examined in follow ing w eek. The assignment w as based on the actual age composition of a w eek's natural spaw n and an expected recovery of other carcasses examined in follow ing w eeks from that w eeks specific spaw n. Expected recovery rates w ere derived from the 2001 and 2002 Lew is River Mark Recapture Study using fresh tagged carcasses and their age specific recovery rates. 11
76 Table 6. Lewis River fall Chinook coded wire tag (CWT) rate by brood in CWT sampled by brood Spawn 2s 3s 4s 5s 6s Timing Total Percent Nov Wk % Nov Wk , , % Nov Wk , , % Nov Wk , , % Dec Wk , , % Dec Wk , , % Dec Wk 3 Sum , , % CWTs % Rate October Lewis CWT Wild contribution to carcasses sampled CWTs Sampled 0 0 1, , % Late December Lewis CWT Wild contribution to carcasses sampled CWTs Sampled % Total CWT Lewis R. wild carcasses sampled (Oct-Dec) CWTs MS , , % 12
77 Table 7. Lewis River 2014 Hatchery Fall Chinook Stock Sampled by Brood CWT sampled by brood Spawn 2s 3s 4s 5s 6s Sampled Timing Total Sept Wk Ad-only Oct Wk Ad-only Oct Wk Ad-only Oct Wk Ad-only Oct Wk Ad-only Oct Wk Ad-only Nov Wk ,097 Ad-only SUM , ,440 Sum AD-only (LRH) ,086 LRHw &LRW , ,354 Sept.-October Lewis (LRW) CWT wild contribution to carcasses sampled CWTs Sampled 0 0 1, ,287 Lower river hatchery stock (LRH) Sampled ,086 Lower river hatchery stock (Wild) Sampled ,067 Lower Columbia River hatchery coded wire tags (LRH-CWT) recovered. LRH-LRHw Total CWTs Recovered LRH-Kalama Quinault Big Cr URB LRH-Toutle LRH-Washougal Cowlitz
78 Table 8. Lewis River Wild Fall Chinook(LRW) Non-CWT Group Sampled by Brood, CWT sampled by brood Spawn 2s 3s 4s 5s 6s Sampled Timing Total Dec Wk Dec Wk Jan Wk Jan Wk Jan Wk SUM ,237 Late December Lewis CWT Wild contribution to carcasses sampled CWTs Sampled Late December Lewis non-cwt Wild contribution to carcasses sampled 2014 Sampled ,157 14
79 Table 9. Lewis River 2014 Fall Chinook Escapement by Brood. Escapement Derived from Brood Expansion by Carcass Recovery Rates. Expansion Rates 2s 3s 4s 5s 6s Total Percent Total Lewis River Sampled 460 1,113 11,899 1, ,752 Males , , % Females 242 7, , % Escapement 2,010 2,210 20,387 1, ,410 Males 2,010 1,729 7, ,729 0 Females ,796 1, ,682 1 Lewis River natural spawn split by hatchery and wild escapement. Hatchery (LRH) stray component by age determined from adipose clip Sampled ,086 Escapement , , % Exp CWTs Lewis River wild fall chinook by age Sampled ,042 1, ,666 Escapement 1,975 1,917 18,919 1, , % Lewis River wild natural spawn split by CWT recoveries. Lewis River CWT wild bright fall Chinook (LRB-CWT) by age Sampled , ,442 Escapement 1,639 1,427 16,093 1, , % Exp CWTs Early spawning Lewis River wild fall Chinook (LRHw) not represented by CWTs Sampled ,067 Escapement , , % Late December spawning Lewis River wild fall Chinook (LRB-non-CWT) not represent by CWTs Sampled ,158 Escapement , , % Escapement is base on carcass expansion rates generated from a three year mark recapture study,
80 Table 10. Combined Lewis River and Cedar Creek lower Columbia River hatchery fall Chinook stock (LRH) carcasses examined and estimated escapement, in Estimated lower Columbia River hatchery stock (LRH &LRHw) sampled in the Lewis River. 2s 3s 4s 5s 6s Lewis River Expansion rates Broods Totals Ad-clip sampled Hatchery ,086 Sampled (NMW) Wild ,067 Escapement , ,017 Cedar Creek Sampled Above Trap Ad-clipped Hatchery Non-clipped Wild Sampled Below Trap Ad-clipped Hatchery Non-clipped Wild Total Sampled Cedar Creek Fishway Trap Net Up 0 Upper Escapement 0 Ad-clipped Hatchery Non-clipped Wild Lower Escape Ad-clipped Hatchery Non-clipped Wild Total Cedar Creek Escapement , ,701 Ad-clipped Hatchery Non-clipped Wild North Lewis Basin Escapement , ,619 Ad-clipped Hatchery , ,811 Non-clipped Wild , ,807 Lower Columbia River hatchery CWTs expanded for escapement. LRH-Kalama LRH-Cowlitz LRH-Washougal LRH-Big Creek Sum expanded CWTs Hatchery tag rates Combined early returning Lewis River wild Chinook not represented by CWT (LRHw) LRHw Sampled , ,829 Low er Cedar Creek includes all w aters betw een the mouth and the grist mill fishw ay (2.4 miles) w hile upper Cedar Creek includes all w aters above the grist mill fishw ay. 16
81 Literature cited Grimes, J Lewis River juvenile wild fall chinook population estimates, and Columbia River Laboratory Progress Report number Hawkins, S Results of sampling the Lewis River (North Fork) natural spawning fall chinook population in Columbia River Laboratory Progress Report number Hawkins, S. 1996a. Results of sampling the Lewis River natural spawning fall chinook population in Columbia River Progress Report number Hawkins, S. 1996b. Results of sampling the Lewis River natural spawning fall chinook population in Columbia River Progress Report number Hawkins, S. 1996c. Lewis River wild stock fall chinook tagging project, Columbia River Progress Report number Hawkins, S Results of Sampling the Lewis River Natural Spawning Fall Chinook Population in Columbia River Progress Report number Hawkins, S. 1998a. Lewis River wild fall chinook tagging project, Columbia River Progress Report number Hawkins, S Results of Sampling the Lewis River Natural Spawning Fall Chinook Population in Columbia River Progress Report number Hawkins, S. 2013a. Results of Sampling the Lewis River Natural Spawning Fall Chinook Population in Columbia River Progress Report number Hawkins, S. 2013b. Results of Sampling the Lewis River Natural Spawning Fall Chinook Population in Columbia River Progress Report number Hawkins, S. 2013c. Results of Sampling the Lewis River Natural Spawning Fall Chinook Population in Columbia River Progress Report number Hawkins, S. 2013d. Results of Sampling the Lewis River Natural Spawning Fall Chinook Population in Columbia River Progress Report number Hawkins, S. 2013e. Results of Sampling the Lewis River Natural Spawning Fall Chinook Population in Columbia River Progress Report number Hawkins, S. 2013f. Results of Sampling the Lewis River Natural Spawning Fall Chinook Population in Columbia River Progress Report number Hawkins, S. 2013g. Results of Sampling the Lewis River Natural Spawning Fall Chinook Population in Columbia River Progress Report number Hawkins, S. 2013h. Results of Sampling the Lewis River Natural Spawning Fall Chinook Population in Columbia River Progress Report number
82 Hawkins, S. 2013i. Results of Sampling the Lewis River Natural Spawning Fall Chinook Population in Columbia River Progress Report number Hawkins, S. and R. Roler Results of sampling the North Fork of the Lewis River natural spawning fall chinook population in Columbia River Laboratory Progress Report number Kreitman, G. 1981a. Tag shed and mark rate estimate for the North Fork of the Lewis River wild fall chinook tag codes (by brood year). WDF memorandum to McIsaac. June 9, Kreitman, G. 1981b. Correction to tag shed and mark rate estimates for the North Fork of the Lewis River wild fall chinook tag codes memo. 6/9/81. WDF memorandum to McIsaac. June 12, Norman, G Tag shed and mark rates for North Fork of the Lewis River wild fall chinook returning in WDF memorandum to McIsaac. July 1, Norman, G North Fork of the Lewis River natural spawning fall chinook mark rates, tag shed rates, and age composition, WDF memorandum to McIsaac. November 16, Norman, G. 1985a. North Fork of the Lewis River natural spawning escapement, age composition, stock composition, and mark and tag shed rates, WDF memorandum to McIsaac. August 8, Norman, G. 1985b. North Fork of the Lewis River natural spawning fall chinook escapement, WDF memorandum to McIsaac. October 21, Norman, G North Fork of the Lewis River natural spawning fall chinook escapement estimate and biological data, WDF memorandum to McIsaac. October 14, Norman, G North Fork of the Lewis River natural spawning fall chinook information, WDF memorandum to McIsaac. April 28, Norman, G Results of sampling the North Fork of the Lewis River natural spawning fall chinook population in WDF Progress Report number Roler, R. 1990a. Results of sampling the North Fork of the Lewis River natural spawning fall chinook population in Columbia River Laboratory Progress Report number Roler, R. 1990b. Results of sampling the North Fork of the Lewis River natural spawning fall chinook population in Columbia River Laboratory Progress Report number Roler, R Results of sampling the North Fork of the Lewis River natural spawning fall chinook population in Columbia River Laboratory Progress Report number
83 Lewis River Hydroelectric Project (FERC Nos. 935, 2071, 2111 & 2213) Hatchery & Supplementation Program Annual Report 2015 APPENDIX I WDFW Lewis River Hatchery Complex Operations Program Report 2015.
84
85
86
87
88
89
90
91
92
93
94
95
96
97
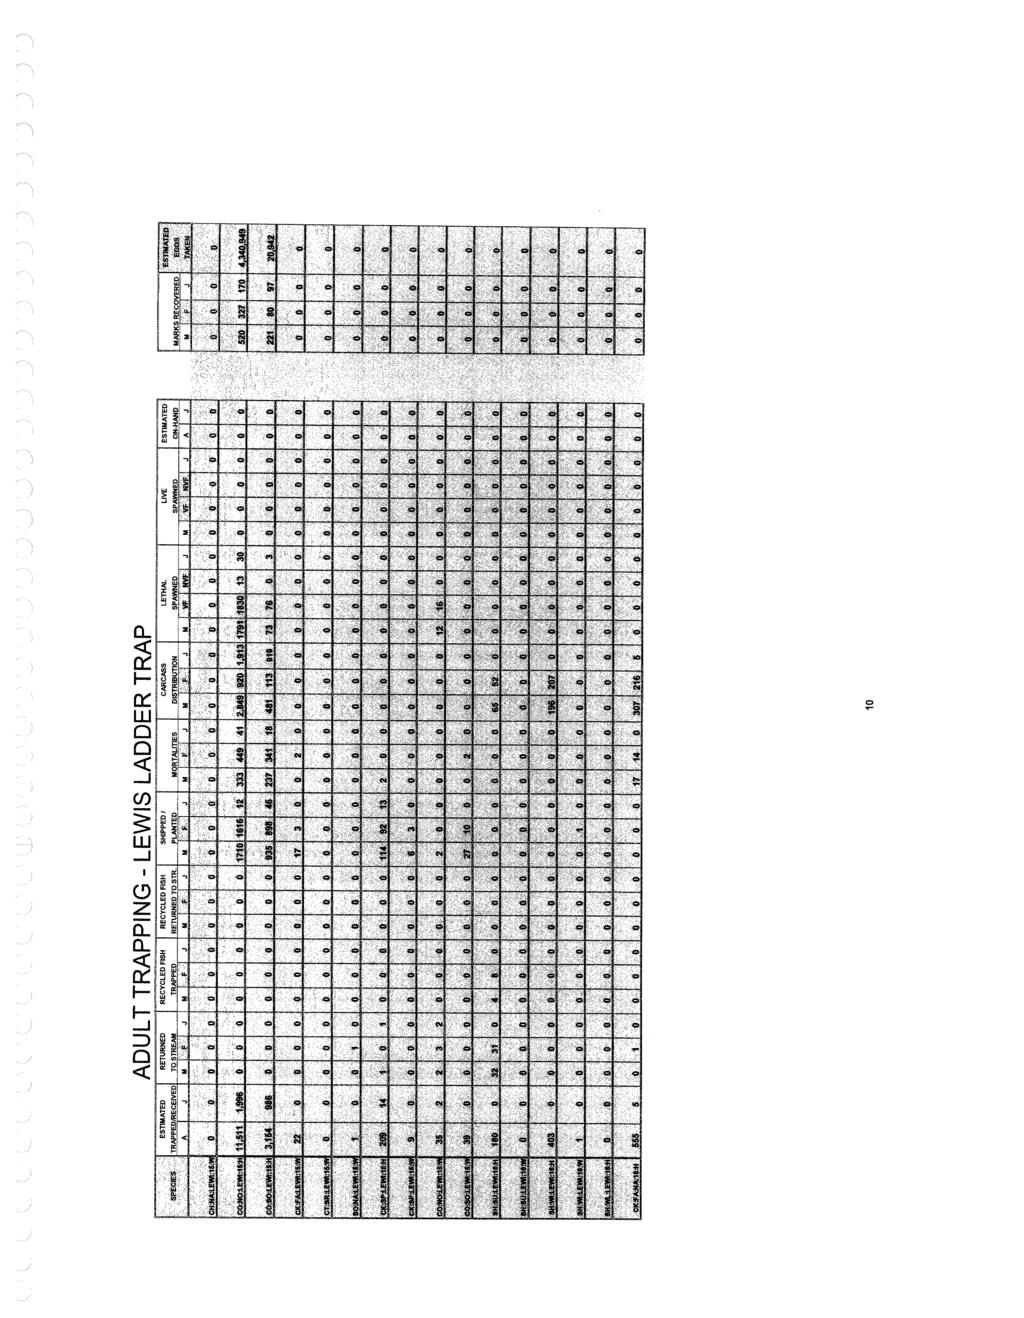
98
99
100
101
102
103
104
105
106
107
108
109
110
111
112
113
114
115
116
117
118
119
120
121
122
123
124
125
126
127
128
129
130
131
132
133
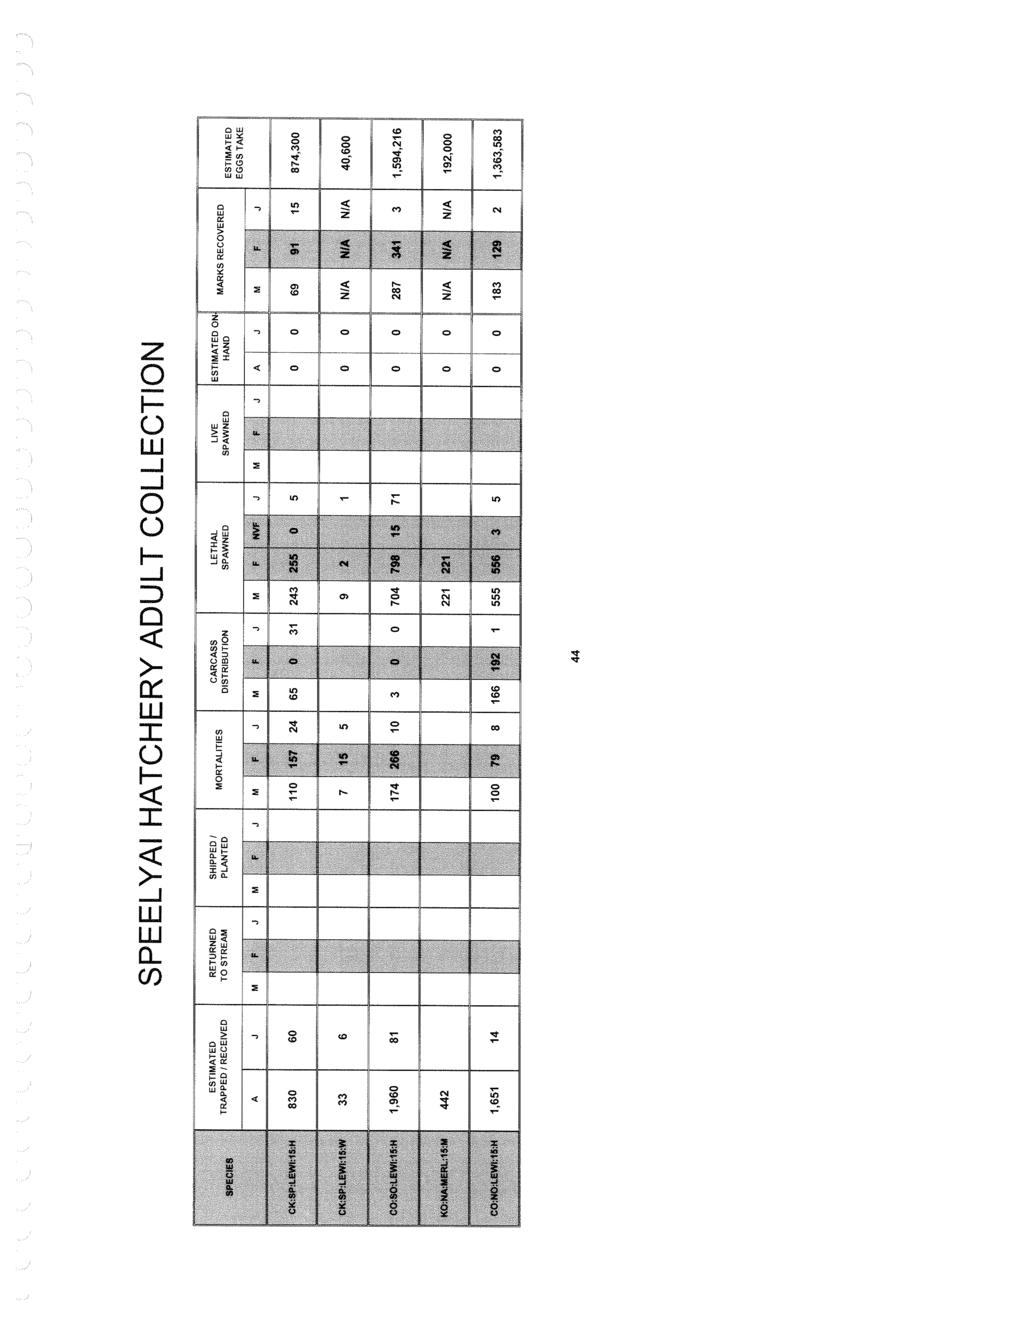
134
135
136
137
138
139
140
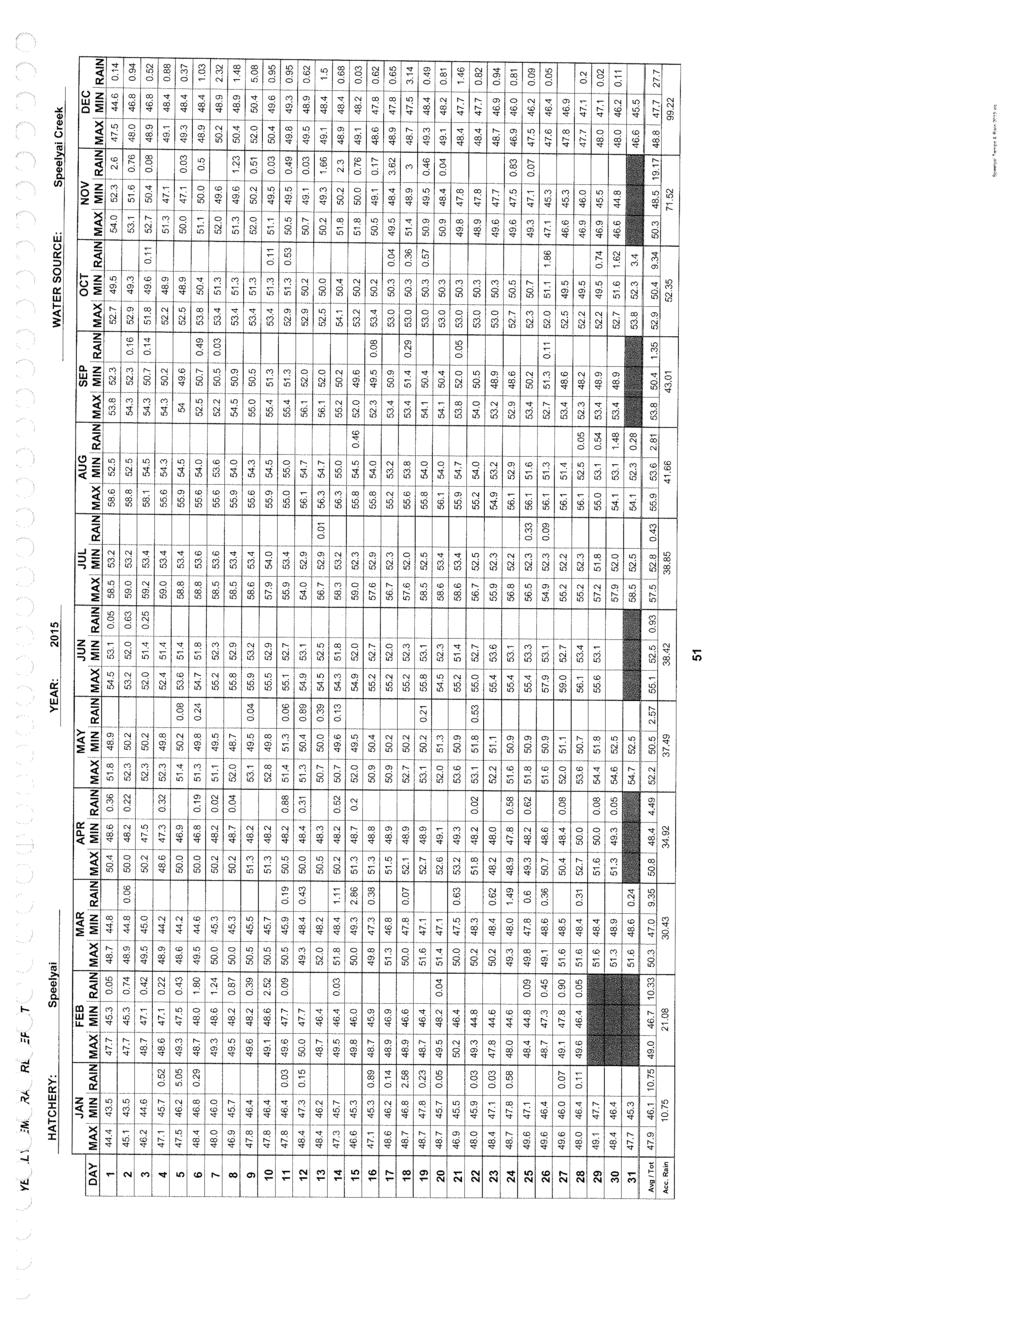
141
Hatchery and Supplementation Program 2013 Annual Report
 Hatchery and Supplementation Program 2013 Annual Report Lewis River Hydroelectric Projects FERC Project Nos. 935, 2071, 2111, 2213 Photograph by Jim Richardson, National Geographic Erik Lesko March 7,
Hatchery and Supplementation Program DRAFT 2014 Report. Lewis River Hydroelectric Projects FERC Project Nos. 935, 2071, 2111, 2213
 Hatchery and Supplementation Program DRAFT 2014 Report Lewis River Hydroelectric Projects FERC Project Nos. 935, 2071, 2111, 2213 Erik Lesko April 2015 TABLE OF CONTENTS 1.0 INTRODUCTION... 1 2.0 WINTER
Lewis River Hydroelectric Projects Settlement Agreement Aquatic Coordination Committee (ACC) Meeting Agenda
 Meeting Agenda") Lewis River Hydroelectric Projects Settlement Agreement Aquatic Coordination Committee (ACC) Meeting Agenda Date & Time: Thursday, September 4, 27 9: a.m. : a.m. Place: CONFERENCE CALL ONLY Contacts: Frank
Lewis River Hydroelectric Projects Settlement Agreement Aquatic Coordination Committee (ACC) Meeting Agenda Date & Time: Thursday, September 4, 27 9: a.m. : a.m. Place: CONFERENCE CALL ONLY Contacts: Frank
2013 WHITE SALMON CHINOOK SALMON VSP MONITORING. Jeremy Wilson Washington Department of Fish and Wildlife
 2013 WHITE SALMON CHINOOK SALMON VSP MONITORING Jeremy Wilson Washington Department of Fish and Wildlife Study Area Outline History of WDFW Chinook Monitoring in WS 2013 Objectives 2013 Study Design 2013
Lewis River Hydroelectric Projects Settlement Agreement Aquatic Coordination Committee (ACC) Meeting Agenda
 Meeting Agenda") Lewis River Hydroelectric Projects Settlement Agreement Aquatic Coordination Committee (ACC) Meeting Agenda Date & Time: Thursday, August, 27 9: a.m. :45 a.m. Place: CONFERENCE CALL ONLY Contacts: Frank
Lewis River Hydroelectric Projects Settlement Agreement Aquatic Coordination Committee (ACC) Meeting Agenda Date & Time: Thursday, August, 27 9: a.m. :45 a.m. Place: CONFERENCE CALL ONLY Contacts: Frank
Hatchery Scientific Review Group Review and Recommendations
 Hatchery Scientific Review Group Review and Recommendations Willamette McKenzie Spring Chinook Salmon Population and Related Hatchery Programs January 31, 2009 Columbia River Hatchery Reform Project -
Grande Ronde Basin Spring Chinook Salmon Captive Broodstock Program: F 1 Generation
 Grande Ronde Basin Spring Chinook Salmon Captive Broodstock Program: F 1 Generation Tim Hoffnagle, Rich Carmichael, Joseph Feldhaus, Deb Eddy, Nick Albrecht and Sally Gee Oregon Department of Fish and
Hatchery Scientific Review Group Review and Recommendations
 Hatchery Scientific Review Group Review and Recommendations Walla Walla River Summer Steelhead Population and Related Hatchery Programs January 31, 2009 Note: Spawning reaches likely vary from those depicted.
Hatchery Scientific Review Group Review and Recommendations
 Hatchery Scientific Review Group Review and Recommendations Lochsa River Spring Chinook Population and Related Hatchery Programs January 31, 2009 Lochsa River Spring Chinook Population Report Page - 1
LIFE HISTORY DIVERSITY AND RESILIENCE
 LIFE HISTORY DIVERSITY AND RESILIENCE SPRING CHINOOK IN THE WILLAMETTE RIVER BASIN Kirk Schroeder Brian Cannon Luke Whitman Paul Olmsted Oregon Department of Fish and Wildlife Corvallis Research Lab Thanks
Lewis River Hydroelectric Projects Settlement Agreement Aquatic Coordination Committee (ACC) Meeting Agenda
 Meeting Agenda") Lewis River Hydroelectric Projects Settlement Agreement Aquatic Coordination Committee (ACC) Meeting Agenda Date & Time: Thursday, February 14, 219 9: a.m. 1:3 a.m. Place: CONFERENCE CALL ONLY Contacts:
Lewis River Hydroelectric Projects Settlement Agreement Aquatic Coordination Committee (ACC) Meeting Agenda Date & Time: Thursday, February 14, 219 9: a.m. 1:3 a.m. Place: CONFERENCE CALL ONLY Contacts:
Hatchery Scientific Review Group Review and Recommendations
 Hatchery Scientific Review Group Review and Recommendations Lower Snake River Fall Chinook Population and Related Hatchery Programs January 31, 2009 Lower Snake River Fall Chinook Population Report Page
Reproductive success of hatchery chinook salmon in the Deschutes River, Washington
 Reproductive success of hatchery chinook salmon in the Deschutes River, Washington Howard Fuss Hatchery Wild Interactions Team Washington Department of Fish and Wildlife Acknowledgments HSRG for providing
LOWER SNAKE RIVER COMPENSATION PLAN: Oregon Spring Chinook Salmon Evaluation Studies 2006 Annual Progress Report
 LOWER SNAKE RIVER COMPENSATION PLAN: Oregon Spring Chinook Salmon Evaluation Studies 2006 Annual Progress Report Oregon Department of Fish and Wildlife Fish Research and Development, NE Region Fred R.
2018 Annual Operating Plan
 2018 Annual Operating Plan FINAL HATCHERY AND SUPPLEMENTATION PROGRAM NORTH FORK LEWIS RIVER Prepared by the North Fork Lewis River Hatchery and Supplementation Subgroup Table of Contents TABLE OF CONTENTS...
PLEASE BRING YOUR LUNCH
 Lewis River Hydroelectric Projects Settlement Agreement Aquatic Coordination Committee (ACC) Meeting Agenda Date & Time: Thursday, July 13, 217 9: a.m. 3: p.m. Place: Merwin Hydro Control Center 15 Merwin
Yakima River Basin Coho Reintroduction Feasibility Study
 Yakima River Basin Coho Reintroduction Feasibility Study Yakima Klickitat Fisheries Project Goals and Mission The purposes of the YKFP are to: enhance existing stocks of anadromous fish in the Yakima and
EVALUATION OF FALL CHINOOK AND CHUM SALMON SPAWNING BELOW BONNEVILLE DAM
 EVALUATION OF FALL CHINOOK AND CHUM SALMON SPAWNING BELOW BONNEVILLE DAM Annual Report 2002-2003 Prepared by Wayne van der Naald Roy Clark Robert Brooks And Cameron Duff Oregon Department of Fish and Wildlife
LOWER COWLITZ ADULT TRIBUTARY ABUNDANCE METHODS
 LOWER COWLITZ ADULT TRIBUTARY ABUNDANCE METHODS WDFW By Chip Nissell Lower Cowlitz Monitoring and Evaluation PRESENTATION OVERVIEW Lower Cowlitz tributary weirs 1. Weir Locations 2. Weir Operations 3.
Hood Canal Steelhead Project A conservation hatchery experiment. Joy Lee Waltermire
 Hood Canal Steelhead Project A conservation hatchery experiment Joy Lee Waltermire Cooperating Project Partners: NOAA: NWFSC Behavioral Ecology Team Long Live the Kings WA Department of Fish and Wildlife
LOWER SNAKE RIVER COMPENSATION PLAN: Oregon Spring Chinook Salmon Evaluation Studies 2007 Annual Progress Report
 LOWER SNAKE RIVER COMPENSATION PLAN: Oregon Spring Chinook Salmon Evaluation Studies 2007 Annual Progress Report Oregon Department of Fish and Wildlife Fish Research and Development, NE Region Joseph W.
Lewis River Hydroelectric Projects Settlement Agreement Aquatic Coordination Committee (ACC) Meeting Agenda
 Meeting Agenda") Lewis River Hydroelectric Projects Settlement Agreement Aquatic Coordination Committee (ACC) Meeting Agenda Date & Time: Thursday, December 14, 2017 9:00 a.m. 11:15 a.m. Place: Merwin Hydro Control Center
Lewis River Hydroelectric Projects Settlement Agreement Aquatic Coordination Committee (ACC) Meeting Agenda Date & Time: Thursday, December 14, 2017 9:00 a.m. 11:15 a.m. Place: Merwin Hydro Control Center
Brian Missildine Natural Resource Scientist Hatchery Evaluation and Assessment Team Lead Washington-British Columbia Annual General Meeting Kelowna,
 Brian Missildine Natural Resource Scientist Hatchery Evaluation and Assessment Team Lead Washington-British Columbia Annual General Meeting Kelowna, BC March 19-22 REFORMER REFORMED WA Dept. of Fish and
ASSESSMENT OF THE STATUS OF NESTUCCA RIVER WINTER STEELHEAD
 ASSESSMENT OF THE STATUS OF NESTUCCA RIVER WINTER STEELHEAD Gary Susac and Steve Jacobs Coastal Salmonid Inventory Project Oregon Department of Fish and Wildlife August 21, 2001 INTRODUCTION This report
APPENDIX D: LEWIS RIVER HATCHERY REVIEW
 APPENDIX D: LEWIS RIVER HATCHERY REVIEW JANUARY 14, 2004 Prepared for PacifiCorp and Cowlitz PUD Prepared by S.P. Cramer & Associates, Inc. 600 NW Fariss Gresham, Oregon 97030 www.spcramer.com D-1 TABLE
Kirt Hughes Washington Department of Fish and Wildlife Region 6 - Fish Program Manager
 Kirt Hughes Region 6 - Fish Program Manager Habitat Hatcheries Harvest Clean Water Act Shorelines Harvest Hydro Habitat Forest Practices Non-regulatory Programs Water Supply & Conservation Growth Management
Addressing Critical Uncertainties in the Reintroduction of Chum Salmon to Oregon Tributaries of the Columbia River. Kris Homel
 Addressing Critical Uncertainties in the Reintroduction of Chum Salmon to Oregon Tributaries of the Columbia River Kris Homel NW Fish Culture Concepts Wilsonville, OR 2015 Historic distribution and abundance
JOINT STAFF REPORT WINTER FACT SHEET NO. 9 Columbia River Compact March 18, 2004
 JOINT STAFF REPORT WINTER FACT SHEET NO. 9 Columbia River Compact March 18, 2004 Purpose: To review ongoing commercial fisheries and consider non-indian commercial fishing seasons for salmon, smelt and
Lewis River Upstream Transport Plan Interim Final. Prepared by Frank Shrier Principal Fish Biologist PacifiCorp Energy.
 Lewis River Interim Final Upstream Transport Plan Lewis River Upstream Transport Plan Interim Final Prepared by Frank Shrier Principal Fish Biologist PacifiCorp Energy December 18, 2009 Page 1 of 31 Table
Yale Reservoir Kokanee (Oncorhynchus nerka) Escapement Report 2016
 Escapement Report 2016") Yale Reservoir Kokanee (Oncorhynchus nerka) Escapement Report 2016 North Fork Lewis River Hydroelectric Project Yale FERC No. 2071 Prepared by: Jeremiah Doyle, PacifiCorp April 4, 2017 1.0 INTRODUCTION
Yale Reservoir Kokanee (Oncorhynchus nerka) Escapement Report 2016 North Fork Lewis River Hydroelectric Project Yale FERC No. 2071 Prepared by: Jeremiah Doyle, PacifiCorp April 4, 2017 1.0 INTRODUCTION
ANNUAL PROGRESS REPORT FISH RESEARCH PROJECT OREGON. PROJECT TITLE: Spring Chinook Salmon in the Willamette and Sandy Rivers
 ANNUAL PROGRESS REPORT FISH RESEARCH PROJECT OREGON PROJECT TITLE: Spring Chinook Salmon in the Willamette and Sandy Rivers PROJECT NUMBER: F-163-R-09 PROJECT PERIOD: October 2003 through September 2004
Steelhead Kelt Reconditioning and Reproductive Success Studies in the Columbia River Basin
 Steelhead Kelt Reconditioning and Reproductive Success Studies in the Columbia River Basin Hatch, 1 D.R., D.E. Fast 2, W.J. Bosch 2, J.W. Blodgett 2, J.L.J. Trammell 2, A.L. Pierce, 1,3 S.R. Everett 4,
THE CONFEDERATED TRIBES OF THE WARM SPRINGS RESERVATION OF OREGON
 THE CONFEDERATED TRIBES OF THE WARM SPRINGS RESERVATION OF OREGON To: Branch of Natural Resources P.0. Box C, Warm Springs, Oregon 97761 Phone (541) 553-2002/2003 Fax (541) 553-1994 The Independent Science
index area in Pine Creek mainstem to establish redd-life
 Pine Creek Bull Trout - 2011 1. Swift Reservoir adult migration estimate 2. Half-duplex Passive Integrated Transponder (PIT) tag antenna arrays in Pine and Rush Creeks 3. Yale tailrace collection and transport
Job Performance Report, Project F-73-R-9 Subproject II: SALMON AND STEELHEAD INVESTIGATIONS Study I: Salmon Spawning Ground Surveys
 FEDERAL AID IN FISH RESTORATION Job Performance Report, Project F-73-R-9 Subproject II: SALMON AND STEELHEAD INVESTIGATIONS Study I: Salmon Spawning Ground Surveys By Judy Hall-Griswold, Fishery Technician
***Please Note*** April 3, Dear advisory committee members:
 April 3, 29 Dear advisory committee members: The fifth meeting of the CHF advisory committee will be held April 13 in Grants Pass from 6:-8:3 PM, and the purpose of this document is to help committee members
Summary of HSRG Findings for Chum Populations in the Lower Columbia River and Gorge
 Summary of HSRG Findings for Chum Populations in the Lower Columbia River and Gorge The Congressionally-established Hatchery and Scientific Review Group (HSRG) developed a foundation of salmon hatchery
BOGUS CREEK SALMON STUDIES 2002
 BOGUS CREEK SALMON STUDIES 2002 BY: JEANNINE RICHEY California Department of Fish and Game KLAMATH RIVER PROJECT 303 SOUTH STREET YREKA, CALIFORNIA 96097 (530) 842-3109 California Department of Fish and
Conditions affecting the 2011 and 2012 Fall Chinook Adult Returns to Spring Creek National Fish Hatchery.
 FISH PASSAGE CENTER 1827 NE 44 th Ave., Suite 240, Portland, OR 97213 Phone: (503) 230-4099 Fax: (503) 230-7559 http://www.fpc.org/ e-mail us at fpcstaff@fpc.org MEMORANDUM TO: Liz Hamilton, NSIA FROM:
Rivers Inlet Salmon Initiative
 Rivers Inlet Salmon Initiative 5-YEAR BUSINESS PLAN C AS E F O R S U P P O R T M AR C H 2 0 1 5 Dedication Rick Hansen had been inspired to go to Rivers Inlet in July 2010 by his good friend, and fellow
c h a p t e r 6 n n n Related to the VAMP
 c h a p t e r 6 n n n Complimentary Studies Related to the VAMP Throughout 27 several fishery studies were conducted to advance the understanding of juvenile salmon abundance and survival in the San Joaquin
Smolt Monitoring Protocol at COE Dams On the Lower Snake and Lower Columbia rivers
 Smolt Monitoring Protocol at COE Dams On the Lower Snake and Lower Columbia rivers 1.0 Introduction There are two primary goals of the Smolt Monitoring Program (SMP); to provide realtime data on juvenile
Susitna-Watana Hydroelectric Project (FERC No ) Salmon Escapement Study Study Plan Section 9.7
 Salmon Escapement Study Study Plan Section 9.7") (FERC No. 14241) Salmon Escapement Study Study Plan Section 9.7 Part D: Supplemental Information to June 2014 Initial Study Report Prepared for Prepared by LGL Alaska Research Associates, Inc. & Alaska
(FERC No. 14241) Salmon Escapement Study Study Plan Section 9.7 Part D: Supplemental Information to June 2014 Initial Study Report Prepared for Prepared by LGL Alaska Research Associates, Inc. & Alaska
FINAL HATCHERY AND GENETIC MANAGEMENT PLAN (HGMP)
") FINAL HATCHERY AND GENETIC MANAGEMENT PLAN (HGMP) Hatchery Program: Sandy Hatchery Spring Chinook Species or Hatchery Stock: Sandy River Spring Chinook (Stock 11) Agency/Operator: Oregon Department of
FINAL HATCHERY AND GENETIC MANAGEMENT PLAN (HGMP) Hatchery Program: Sandy Hatchery Spring Chinook Species or Hatchery Stock: Sandy River Spring Chinook (Stock 11) Agency/Operator: Oregon Department of
Eulachon: State of the Science and Science to Policy Forum
 Eulachon: State of the Science and Science to Policy Forum August 27, 2015 Robert Anderson Eulachon Recovery Coordinator National Marine Fisheries Service FCRPS, Dams, and Water Management in the Columbia
Attachment 1. Agenda Item Summary BACKGROUND
 Attachment 1 Agenda Item Summary BACKGROUND Spring Chinook Salmon: Prior to the late 1970s, non-treaty spring Chinook fisheries in the mainstem Columbia River occurred from February through May and harvested
OREGON AND WASHINGTON DEPARTMENTS OF FISH AND WILDLIFE JOINT STAFF REPORT - FALL FACT SHEET NO.
 OREGON AND WASHINGTON DEPARTMENTS OF FISH AND WILDLIFE JOINT STAFF REPORT - FALL FACT SHEET NO. 3 Columbia River Compact/Joint State Hearing August 28, 2018 Fisheries under consideration: Non-treaty mainstem
Feather River Fish Hatchery spring run Chinook salmon Program: moving toward conservation. Ryon Kurth, Jason Kindopp, Anna Kastner, and A.J.
 Feather River Fish Hatchery spring run Chinook salmon Program: moving toward conservation Ryon Kurth, Jason Kindopp, Anna Kastner, and A.J. Dill Central Valley Spring Run Chinook Central Valley Spring
Monitoring of Downstream Fish Passage at Cougar Dam in the South Fork McKenzie River, Oregon February 8, By Greg A.
 Monitoring of Downstream Fish Passage at Cougar Dam in the South Fork McKenzie River, Oregon 1998- February 8, 2 By Greg A. Taylor Oregon Dept. of Fish & Wildlife 315 E. Main Street Springfield, OR 97478
Work Completed for Compliance With the Biological Opinion for Hatchery Programs in the Willamette Basin, USACE funding: 2003
 Work Completed for Compliance With the Biological Opinion for Hatchery Programs in the Willamette Basin, USACE funding: 2003 J. Firman, R. Schroeder, R. Lindsay, K. Kenaston, and M. Hogansen Task Order:
Don Pedro Project Relicensing
 Don Pedro Project Relicensing M ODESTO I RRIGATION D ISTRICT TURLOCK I RRIGATION D ISTRICT FERC PROJECT N O. 2299 Resident Fish in Don Pedro Reservoir Don Pedro Reservoir Fish Stocking (1971-Present) CDFG
NATIVE FISH CONSERVATION PLAN FOR THE SPRING CHINOOK SALMON ROGUE SPECIES MANAGEMENT UNIT
 Attachment 4 NATIVE FISH CONSERVATION PLAN FOR THE SPRING CHINOOK SALMON ROGUE SPECIES MANAGEMENT UNIT Figures in Draft Plan of February 28, 27 Figure 1. Map of the Rogue River Basin. PASSAGE ESTIMATES
Downstream Migrant Trapping in Russian River Mainstem, Tributaries, and Estuary
 Downstream Migrant Trapping in Russian River Mainstem, Tributaries, and Estuary Introduction In September 2008, the National Marine Fisheries Service issued the Russian River Biological Opinion, which
Preliminary Summary of Out-of-Basin Steelhead Strays in the John Day River Basin
 Preliminary Summary of Out-of-Basin Steelhead Strays in the John Day River Basin Prepared by: James R. Ruzycki and Richard W. Carmichael Oregon Department of Fish and Wildlife La Grande, Oregon Introduction
THE OREGON. PLAN for. Salmon and Watersheds. Assessment of Western Oregon Adult Winter Steelhead Redd Surveys Report Number: OPSW-ODFW
 THE OREGON PLAN for Salmon and Watersheds Assessment of Western Oregon Adult Winter Steelhead Redd Surveys 2013 Report Number: OPSW-ODFW-2013-09 The Oregon Department of Fish and Wildlife prohibits discrimination
Justification for Rainbow Trout stocking reduction in Lake Taneycomo. Shane Bush Fisheries Management Biologist Missouri Department of Conservation
 Justification for Rainbow Trout stocking reduction in Lake Taneycomo Shane Bush Fisheries Management Biologist Missouri Department of Conservation December 14, 2017 Lake Taneycomo was formed by the construction
Downstream Migrant Trapping in Russian River Mainstem, Tributaries, and Estuary
 Downstream Migrant Trapping in Russian River Mainstem, Tributaries, and Estuary Introduction In September 2008, the National Marine Fisheries Service issued the Russian River Biological Opinion, which
CHAPTER 2 - THE COQUILLE FISHERY
 CHAPTER 2 - THE COQUILLE FISHERY TABLE OF CONTENTS A. INTRODUCTION... 2-1 FIGURE 2-1 Life Histories of Anadromous Salmonids in the Coquille River... 2-2 1. Coho Salmon... 2-2 FIGURE 2-2 Coho Packed or
PLEASE BRING YOUR LUNCH
 Lewis River Hydroelectric Projects Settlement Agreement Aquatic Coordination Committee (ACC) Meeting Agenda Date & Time: Thursday, August 11, 216 9: a.m. 3:3 p.m. Place: Merwin Hydro Control Center 15
LEAVENWORTH COMPLEX HATCHERY PROGRAMS. Presentation to the Independent Science Advisory Board
 LEAVENWORTH COMPLEX HATCHERY PROGRAMS Presentation to the Independent Science Advisory Board FACILIT Y LOCATION AND PURPOSE Leavenworth NFH Spring Chinook (unlisted) and YN Coho production Entiat NFH Summer
Juvenile chum migration patterns in the lower Columbia River and estuary
 Juvenile chum migration patterns in the lower Columbia River and estuary Curtis Roegner Dan Bottom Kristen Homel Thanks to the many NOAA and CE colleagues! * Columbia River Estuary Workshop 214 * Collapse
Coho. Oregon Native Fish Status Report 13
 12 Coho Coho salmon are widespread in small, low gradient streams of the coast and lower Columbia. They enter freshwater and spawn after fall rains raise river levels, typically from September through
OREGON DEPARTMENT OF FISH AND WILDLIFE ROGUE FISH DISTRICT REPORT
 OREGON DEPARTMENT OF FISH AND WILDLIFE ROGUE FISH DISTRICT REPORT TITLE: Upper Rogue Smolt Trapping Project, 1999 STREAM: Big Butte, Little Butte, South Fork Big Butte, Slate and West Fork Evans Creeks
Yakima/Klickitat Fisheries Project
 Yakima/Klickitat Fisheries Project Lower Yakima River Supplementation and Research Project Operations and Maintenance Annual Report 2002-2003 March 2004 DOE/BP-00006677-1 This Document should be cited
Perspectives of a State Director Selective fisheries as a tool in fisheries management and salmon recovery
 Perspectives of a State Director Selective fisheries as a tool in fisheries management and salmon recovery Jeffrey P. Koenings, PhD. Washington Department of Fish and Wildlife American Fisheries Society
Upper Columbia Redband Trout: Conservation for the Future
 Upper Columbia Redband Trout: Conservation for the Future Bryan Jones and Holly McLellan Colville Confederated Tribes Fish and Wildlife Department Historic Notes Upper Columbia River Large runs of steelhead,
Salmon and Steelhead Spawning Survey Methods Stratification of Estimates
 Salmon and Steelhead Spawning Survey Methods Stratification of Estimates Oregon Department of Fish and Wildlife Oregon Adult Salmonid Inventory and Sampling Project Corvallis Research Lab September 2016
OXBOW FISH HATCHERY AND HELLS CANYON FISH TRAP
 Hatchery 13 Article 07 OXBOW FISH HATCHERY AND HELLS CANYON FISH TRAP 1 9 8 8 A n n u a l R e p o r t b y Brent R. Snider, Fish Hatchery Superintendent I March 1993 TABLE OF CONTENTS Page ABSTRACT... 1
Recreational Sturgeon Commercial Shad MANAGEMENT GUIDELINES
 OREGON AND WASHINGTON DEPARTMENTS OF FISH AND WILDLIFE JOINT STAFF REPORT - SUMMER FACT SHEET NO. 2 Columbia River Compact/Joint State Hearing June 28, 2005 Fisheries under consideration: Recreational
Sandy River Fisheries Management Update. Todd Alsbury District Fish Biologist (Cascade Unit)
") Sandy River Fisheries Management Update Todd Alsbury District Fish Biologist (Cascade Unit) Presenta(on Outline Remembering Marmot Dam Sandy River Popula(on Es(mates Sandy Spring Chinook Stray Control
Sandy River Fisheries Management Update Todd Alsbury District Fish Biologist (Cascade Unit) Presenta(on Outline Remembering Marmot Dam Sandy River Popula(on Es(mates Sandy Spring Chinook Stray Control
The effects of mainstem flow, water velocity and spill on salmon and steelhead populations of the Columbia River
 The effects of mainstem flow, water velocity and spill on salmon and steelhead populations of the Columbia River Columbia River Inter Tribal Fish Commission October 12, 2006 Jerry McCann and Margaret Filardo
Factors that affect steelhead and salmon catch and release survival in freshwater sport fisheries throughout Washington state
 Factors that affect steelhead and salmon catch and release survival in freshwater sport fisheries throughout Washington state Ian Courter, Thomas Buehrens, Forrest Carpenter, Benjamin Briscoe, Joshua Richards,
OREGON AND WASHINGTON DEPARTMENTS OF FISH AND WILDLIFE JOINT STAFF REPORT: SUMMER FACT SHEET NO. 1 Columbia River Compact June 13, 2012
 OREGON AND WASHINGTON DEPARTMENTS OF FISH AND WILDLIFE JOINT STAFF REPORT: SUMMER FACT SHEET NO. 1 Columbia River Compact June 13, 2012 Fisheries under consideration: Non-Indian commercial salmon Treaty
CUSHMAN RESERVOIRS. Skokomish Watershed Monitoring Conference - Public Meeting Florian Leischner 9/17/2015
 CUSHMAN RESERVOIRS Skokomish Watershed Monitoring Conference - Public Meeting Florian Leischner 9/17/2015 CUSHMAN RESERVOIRS MONITORING Management and monitoring of Tacoma Power reservoirs Lake Cushman
Wild Steelhead Coalition Richard Burge Conservation VP September 11, 2006
 Wild Steelhead Coalition Richard Burge Conservation VP September 11, 2006 The following are talking points for the WDFW SEPA Scoping Meetings regarding the preparation of the State-wide and the Puget Sound
APPENDIX B. Final reports on chinook salmon spawning surveys - Sultan River, Washington Report
 APPENDX B Final reports on chinook salmon spawning surveys - Sultan River, Washington B-1. B-2. 1987 Report. 1988 Report APPENDX B-l Final report on 1987 chinook spawning survey - Sultan River, Snohomish
MID-COLUMBIA FISH DISTRICT ANNUAL REPORT Fish Liberations
 MID-COLUMBIA FISH DISTRICT ANNUAL REPORT 24 Fish Liberations Spring Chinook Deschutes River: The 24 release of 251,674 spring Chinook smolts into the Deschutes River was completed during April, 24 (Table
OREGON AND WASHINGTON DEPARTMENTS OF FISH AND WILDLIFE JOINT STAFF REPORT - WINTER FACT SHEET NO.
 OREGON AND WASHINGTON DEPARTMENTS OF FISH AND WILDLIFE JOINT STAFF REPORT - WINTER FACT SHEET NO. 3a Columbia River Compact/Joint State Hearing February 21, 2018 Fisheries under consideration: Mainstem
Fish Habitat Restoration and Monitoring in Southeast Washington. Andy Hill Eco Logical Research, Inc.
 Fish Habitat Restoration and Monitoring in Southeast Washington Andy Hill Eco Logical Research, Inc. Fish Habitat Restoration and Monitoring in Southeast Washington Talk overview: Restoration projects
Selective Fisheries. What is Selectivity and how is it used in Columbia River Fisheries?
 Selective Fisheries What is Selectivity and how is it used in Columbia River Fisheries? Selective Fisheries What is a Selective Fishery? Mark-Selective Selective: : Harvest limited to retention of fin-marked
Wenatchee Spring Chinook Relative Reproductive Success Study. Andrew Murdoch (WDFW) Michael Ford (NOAA) Michael Hughes (WDFW)
 Michael Ford (NOAA) Michael Hughes (WDFW)") Wenatchee Spring Chinook Relative Reproductive Success Study Andrew Murdoch (WDFW) Michael Ford (NOAA) Michael Hughes (WDFW) Acknowledgements Bonneville Power Administration Chelan PUD Grant PUD Study
Wenatchee Spring Chinook Relative Reproductive Success Study Andrew Murdoch (WDFW) Michael Ford (NOAA) Michael Hughes (WDFW) Acknowledgements Bonneville Power Administration Chelan PUD Grant PUD Study
2015 Winnebago System Walleye Report
 215 Winnebago System Walleye Report Adam Nickel, Winnebago Gamefish Biologist, March 216 As winter passes in the rear view mirror, it won t be long until the spring rush of the 216 walleye run is here.
FINAL Meeting Notes Lewis River License Implementation Aquatic Coordination Committee (ACC) Meeting September 14, 2006 Ariel, WA
 Meeting September 14, 2006 Ariel, WA") ACC Participants Present (19) FINAL Meeting Notes Lewis River License Implementation Aquatic Coordination Committee (ACC) Meeting September 14, 2006 Ariel, WA Craig Burley, WDFW Clifford Casseseka, Yakama
ACC Participants Present (19) FINAL Meeting Notes Lewis River License Implementation Aquatic Coordination Committee (ACC) Meeting September 14, 2006 Ariel, WA Craig Burley, WDFW Clifford Casseseka, Yakama
LOWER MOKELUMNE RIVER UPSTREAM FISH MIGRATION MONITORING Conducted at Woodbridge Irrigation District Dam August 2014 through July 2015.
 LOWER MOKELUMNE RIVER UPSTREAM FISH MIGRATION MONITORING Conducted at Woodbridge Irrigation District Dam August 2014 through July 2015 August 2015 Casey Del Real and Matt Saldate East Bay Municipal Utility
Hatcheries: Role in Restoration and Enhancement of Salmon Populations
 Hatcheries: Role in Restoration and Enhancement of Salmon Populations Hatcheries play a large role in the management, ecology, and evolution of Pacific salmon. Why were/are they built? What are the assumptions
Management Strategies for Columbia River Recreational and Commercial Fisheries: 2013 and Beyond
 Management Strategies for Columbia River Recreational and Commercial Fisheries: 2013 and Beyond Recommendation of the Columbia River Fishery Management Workgroup to the Fish and Wildlife Commissions of
Stock Assessment of Anadromous Salmonids, 2003 Report Number: OPSW-ODFW
 THE OREGON PLAN for Salmon and Watersheds Stock Assessment of Anadromous Salmonids, 3 Report Number: OPSW-ODFW-- The Oregon Department of Fish and Wildlife prohibits discrimination in all of its programs
Importance of water temperature in the management of American river Chinook Salmon and steelhead:
 Importance of water temperature in the management of American river Chinook Salmon and steelhead: How cool does it really need to be and when? Rob Titus California Department of Fish & Wildlife Fisheries
Joint Columbia River Management Staff
 2017 JOINT STAFF REPORT: STOCK STATUS AND FISHERIES FOR SPRING CHINOOK, SUMMER CHINOOK, SOCKEYE, STEELHEAD, AND OTHER SPECIES Joint Columbia River Management Staff Oregon Department of Fish & Wildlife
Strategies for mitigating ecological effects of hatchery programs
 Strategies for mitigating ecological effects of hatchery programs Some case studies from the Pacific Northwest Kathryn Kostow Oregon Department of Fish and Wildlife Ecological risks occur when the presence
TAY DISTRICT SALMON FISHERIES BOARD POLICY ON SALMON STOCKING
 TAY DISTRICT SALMON FISHERIES BOARD POLICY ON SALMON STOCKING August 2011 1 INTRODUCTION This document describes the policy adopted by the Tay District Salmon Fisheries Board for the artificial stocking
Study Update Fish Distribution and Species Composition
 Study Update Fish Distribution and Species Composition Goals and Study Area Gain a better understanding of fish species composition and abundance in waters associated with the Packwood Lake Hydroelectric
Jason Blackburn, Paul Hvenegaard, Dave Jackson, Tyler Johns, Chad Judd, Scott Seward and Juanna Thompson
 Alberta Conservation Association (ACA) Date: 2014-2015 Project Name: Owl River Walleye and Aquatic Habitat Assessment Fisheries Program Manager: Peter Aku Project Leader: Tyler Johns Primary ACA staff
EXHIBIT ARWA-700 TESTIMONY OF PAUL BRATOVICH
 EXHIBIT ARWA-700 TESTIMONY OF PAUL BRATOVICH 1. I am a fisheries biologist employed by the firm of HDR, Inc. I hold a Bachelor of Science degree in Fisheries from the University of Washington, located
MINISTRY OF ENVIRONMENT ENVIRONMENTAL STEWARDSHIP DIVISION FISH AND WILDLIFE BRANCH. Horsefly River Angling Management Plan
 MINISTRY OF ENVIRONMENT ENVIRONMENTAL STEWARDSHIP DIVISION FISH AND WILDLIFE BRANCH Horsefly River Angling Management Plan January 30 th, 2006 Area/Fishery Description The Horsefly River watershed provides
Meeting Summary Fisheries Management Technical Feedback Group Meeting Friday, November 2, 2012
 Meeting Summary Fisheries Management Technical Feedback Group Meeting Friday, November 2, 2012 Bureau of Reclamation, 2800 Cottage Way, Sacramento, CA 95825 Cafeteria Conference Room C1003 FINAL: 2013.1.14
18 March 2016 Oregon Department of Fish and Wildlife
 18 March 2016 Oregon Department of Fish and Wildlife Background Joint OR/WA policy adoption 2012 OR re-adoption of rules 6/13 Transition period (2013-2016) Phased allocation shift Mainstem gillnets allowed
2011 upper Lewis River Bull Trout Investigations. Jim Byrne
 2011 upper Lewis River Bull Trout Investigations Jim Byrne WDFW 2010 & 2011Muddy River spring, summerandfall flow regimes 2500 2000 1500 1000 Daily Flow (cfs) 500 0 1 May 8 May 15 May 22 May 29 May 5 Jun
Staff, Organizations Directly Affected (including but not limited to):
:") 3-2-02.01 Steelhead Stream Classification Effective Date: December 13, 2005 This Policy Replaces: None. Staff, Organizations Directly Affected (including but not limited to): Ministry of Water, Land and
3-2-02.01 Steelhead Stream Classification Effective Date: December 13, 2005 This Policy Replaces: None. Staff, Organizations Directly Affected (including but not limited to): Ministry of Water, Land and
2017 Fall Zone 4-5 Gillnet Fishery WDFW and ODFW Observation Study Sampling Plan
 2017 Fall Zone 4-5 Gillnet Fishery WDFW and ODFW Observation Study Sampling Plan Introduction Columbia River fisheries generate millions of dollars in economic value annually, and are an integral part