CANADIAN TAGGING OF COMMERCIAL GROUNDFISH AND SMALL PELAGIC FISH IN THE VICINITY OF THE SCOTIAN SHELF AND GULF OF ST. LAWRENCE,
|
|
|
- Horatio Roland Lawson
- 5 years ago
- Views:
Transcription
1 CANADIAN TAGGING OF COMMERCIAL GROUNDFISH AND SMALL PELAGIC FISH IN THE VICINITY OF THE SCOTIAN SHELF AND GULF OF ST. LAWRENCE, Wayne T. Stobo and G. Mark Fowler Fisheries and Oceans Canada Bedford Institute of Oceanography P.O. Box 1006 Dartmouth, N.S. B2Y 4A Canadian Technical Report of Fisheries and Aquatic Sciences 2669
2 Canadian Technical Report of Fisheries and Aquatic Sciences Technical reports contain scientific and technical information that contributes to existing knowledge but which is not normally appropriate for primary literature. Technical reports are directed primarily toward a worldwide audience and have an international distribution. No restriction is placed on subject matter and the series reflects the broad interests and policies of Fisheries and Oceans Canada, namely, fisheries and aquatic sciences. Technical reports may be cited as full publications. The correct citation appears above the abstract of each report. Each report is abstracted in the data base Aquatic Sciences and Fisheries Abstracts. Technical reports are produced regionally but are numbered nationally. Requests for individual reports will be filled by the issuing establishment listed on the front cover and title page. Numbers in this series were issued as Technical Reports of the Fisheries Research Board of Canada. Numbers were issued as Department of the Environment, Fisheries and Marine Service, Research and Development Directorate Technical Reports. Numbers were issued as Department of Fisheries and Environment, Fisheries and Marine Service Technical Reports. The current series name was changed with report number 925. Rapport technique canadien des sciences halieutiques et aquatiques Les rapports techniques contiennent des renseignements scientifiques et techniques qui constituent une contribution aux connaissances actuelles, mais qui ne sont pas normalement appropriés pour la publication dans un journal scientifique. Les rapports techniques sont destinés essentiellement à un public international et ils sont distribués à cet échelon. II n'y a aucune restriction quant au sujet; de fait, la série reflète la vaste gamme des intérêts et des politiques de Pêches et Océans Canada, c'est-à-dire les sciences halieutiques et aquatiques. Les rapports techniques peuvent être cités comme des publications à part entière. Le titre exact figure audessus du résumé de chaque rapport. Les rapports techniques sont résumés dans la base de données Résumés des sciences aquatiques et halieutiques. Les rapports techniques sont produits à l'échelon régional, mais numérotés à l'échelon national. Les demandes de rapports seront satisfaites par l'établissement auteur dont le nom figure sur la couverture et la page du titre. Les numéros 1 à 456 de cette série ont été publiés à titre de Rapports techniques de l'office des recherches sur les pêcheries du Canada. Les numéros 457 à 714 sont parus à titre de Rapports techniques de la Direction générale de la recherche et du développement, Service des pêches et de la mer, ministère de l'environnement. Les numéros 715 à 924 ont été publiés à titre de Rapports techniques du Service des pêches et de la mer, ministère des Pêches et de l'environnement. Le nom actuel de la série a été établi lors de la parution du numéro 925.
3 Canadian Technical Report of Fisheries and Aquatic Sciences CANADIAN TAGGING OF COMMERCIAL GROUNDFISH AND SMALL PELAGIC FISH IN THE VICINITY OF THE SCOTIAN SHELF AND GULF OF ST. LAWRENCE, by Wayne T. Stobo and G. Mark Fowler Fisheries and Oceans Canada Bedford Institute of Oceanography P.O. Box 1006 Dartmouth, N.S. B2Y 4A2
4 ii Her Majesty the Queen in Right of Canada, Cat. No. Fs 97-6/0000E ISSN Correct citation for this publication: Stobo, W.T. and G.M. Fowler, Canadian tagging of commercial groundfish and small pelagic fish in the vicinity of the Scotian Shelf and Gulf of St. Lawrence, Can. Tech. Rep. Fish. Aquat. Sci. 2669: xii p.
5 iii TABLE OF CONTENTS LIST OF TABLES...v LIST OF FIGURES...vi LIST OF APPENDICES...viii ABSTRACT...x INTRODUCTION...1 OVERVIEW...2 DATA QUALITY...5 RECOVERY PARAMETERS...7 SPECIES SYNOPSES...10 Atlantic Wolffish (Anarhichas lupus)...10 Atlantic Cod (Gadus morhua)...10 Cunner (Tautogolabrus adspersus)...13 Haddock (Melannogrammus aeglefinus)...14 Atlantic Halibut (Hippoglossus hippoglossus)...15 Herring (Clupea harengus)...16 Mackerel (Scomber scombrus)...18 American Plaice (Hippoglossoides platessoides)...18 Pollock (Pollachius virens)...19 Sea Raven (Hemitripterus americanus)...20 Thorny Skate (Raja radiata)...21 White Hake (Urophycis tenuis)...21 Windowpane Flounder (Scophthalmus aquosus)...22 Winter Flounder (Pseudopleuronectes americanus)...22 Winter Skate (Raja ocellata)...23 Witch Flounder (Glyptocephalus cynoglossus)...23 Yellowtail Flounder (Limanda ferruginea)...25
6 iv REFERENCES...27 Tables...30 Figures...32 Appendix A (Summary of Tagging Activities)...53 Appendix B (Release Location Maps)...63 Appendix C (Release Length Data Summaries)...95 Appendix D (Subsampled Length-Frequencies) Appendix E (Data Formats) Appendix F (Publications)...131
7 v LIST OF TABLES Table 1. Aspects of recovery data quality for different species and tagging programs Table 2. Temporal breakdown of recovery data for different species and tagging programs... 31
8 vi LIST OF FIGURES Figure 1. Map of the area encompassing most of the tagging activities discussed Figure 2. Overview of groundfish tag returns by month from the and tagging programs Figure 3. Recovery locations of Atlantic wolffish (catfish) tagged off southwest Nova Scotia (4Xqr) in May-June Figure 4a. Recoveries locations of Atlantic cod tagged near Seven Islands, Quebec, in October of 1961 and May of Figure 4b. Recoveries from Atlantic cod tagged near Chaleur Bay, New Brunswick, in September of 1961 and May of Figure 5. Recovery locations for cunner tagged in St Margarets Bay, Nova Scotia (4Xm) in July Figure 6. Unpublished movements of haddock tagged on the Scotian Shelf and in the Bay of Fundy during Figure 7. Recoveries from mackerel tagged throughout the Bay of Fundy (July, 1974), Scotian Shelf (October, ), Sydney Bight (July, 1974), and Gulf of St Lawrence (September-October, ) Figure 8. Recoveries from white hake tagged near Souri, PEI, in August of Figure 9. Movements of white hake tagged near Souri, PEI in September Figure 10. Movements of winter flounder tagged in and around Passamaquoddy Bay, New Brunswick, and off Halifax, Nova Scotia, between 1971 and Figure 11. Movements of witch flounder tagged in and around Passamaquoddy Bay, New Brunswick, in the summer of Figure 12. Movements of witch flounder tagged on the Scotian Shelf northwest of Sable Island in April of Figure 13. Movements of witch flounder tagged on Banquereau (4Vc) in March of
9 vii Figure 14. Movements of witch flounder tagged off Cape Canso (4Wd) in February, Figure 15. Movements of witch flounder tagged along the edge of the Laurentian Channel (4Vb) in October of Figure 16. Movements of witch flounder tagged in the northern portion of Sydney Bight, Cape Breton (4Vn) in October, Figure 17. Recovery locations of witch flounder tagged in the Cape Breton Trough, Gulf of St Lawrence (4Tg) in October, Figure 18. Movements of yellowtail flounder tagged on the Scotian Shelf near Sable Island in Figure 19. Recovery locations of yellowtail flounder tagged off southwest Nova Scotia in April, 1972 and off Halifax, Nova Scotia in January-February,
10 viii LIST OF APPENDICES Appendix A. Summary of Tagging Activities Appendix B. Release Location Maps Figure 1. American Plaice Figure 2. American Plaice Figure 3. Windowpane Flounder, Atlantic Wolffish, Cunner, Sea Raven Figure 4. Atlantic Cod Figure 5. Atlantic Cod Figure 6. Atlantic Cod Figure 7. Atlantic Cod Figure 8. Atlantic Cod Figure 9. Atlantic Cod Figure 10. Atlantic Cod Figure 11. Atlantic Cod X/5Z Figure 12. Atlantic Cod X/5Y/5Z Figure 13. Haddock Figure 14. Haddock Figure 15. Haddock Figure 16. Haddock Figure 17. Haddock X/5Y/5Z Figure 18. Atlantic Halibut Figure 19. Atlantic Halibut Figure 20. Atlantic Halibut Figure 21. Atlantic Halibut Subarea Figure 22. White Hake, Thorny Skate, Winter Skate Figure 23. Herring [Scotian Shelf, Bay of Fundy] Figure 24. Herring [Gulf of St Lawrence, Sydney Bight] Figure 25. Atlantic Mackerel Figure 26. Pollock W/4X Figure 27. Pollock W/3Pn Figure 28. Winter Flounder Figure 29. Witch Flounder Figure 30. Yellowtail Flounder Appendix C. Release Length Data Summaries... 95
11 ix Appendix D. Subsampled Length-Frequencies Pollock 1960, 1963, and Pollock Pollock Pollock Herring 1973, 1974, and Herring Herring Herring Appendix E. Data Formats Groundfish Tagging Data Format Groundfish Tagging Release Data Format Groundfish Tagging Recoveries Data Format Tagging Database Structure and Format as of January, Herring Tag/Recovery Data Format Appendix F. Publications
12 x ABSTRACT Stobo, W.T. and G.M. Fowler, Canadian tagging of commercial groundfish and small pelagic fish in the vicinity of the Scotian Shelf and Gulf of St. Lawrence, Can. Tech. Rep. Fish. Aquat. Sci. 2669: xii+ 137 p. We examined marine finfish tagging studies conducted between 1953 and 1985, during which over 556,400 groundfish and small pelagic fish, representing 17 species, were tagged by personnel of the St. Andrews Biological Station and the Bedford Institute of Oceanography. The geographical area involved in these studies extended from the Gulf of St. Lawrence to the northeastern portion of the Gulf of Maine. Over 40,800 tags were recovered by the fishing industry. This report documents tagging procedures, recovery parameters, and database formats developed to provide a permanent record of the work, and release length frequency information on species for which the data were not compatible with the databases. We provide maps detailing the locations, numbers and dates of release of all the species. We provide individual species synopses, in which previously published recovery maps and conclusions on stock movements are updated for a number of tagging studies that were published using incomplete recovery periods, or have not been previously reported. We also provide a comprehensive list of publications and reports produced, related to those tagging studies.
13 xi RÉSUMÉ Stobo, W.T. and G.M. Fowler, Canadian tagging of commercial groundfish and small pelagic fish in the vicinity of the Scotian Shelf and Gulf of St. Lawrence, Can. Tech. Rep. Fish. Aquat. Sci. 2669: xii+ 137 p. Nous avons examiné les études de marquage de poissons de mer effectuées entre 1953 et 1985, au cours desquelles plus de poissons de fond et petits poissons pélagiques, représentant 17 espèces, ont été marqués par le personnel de la Station biologique de St. Andrews et de l Institut océanographique de Bedford. La zone géographique sur laquelle portaient ces opérations de marquage allait du golfe du Saint-Laurent au nord-est du golfe du Maine. Plus de étiquettes ont été récupérées par l industrie de la pêche. Le présent rapport décrit les procédures de marquage, les paramètres de récupération des étiquettes et les formats de la base de données ayant permis de créer un registre permanent des travaux, ainsi que les fréquences de longueur lors de la remise à l eau dans le cas d espèces pour lesquelles les données n étaient pas compatibles avec la base de données. Il contient aussi des cartes détaillées indiquant les lieux et dates de remise à l eau des poissons de chaque espèce ainsi que leur nombre. Nous présentons ici des synopsis par espèce, comprenant des mises à jour des cartes des lieux de récupération et conclusions sur les migrations des stocks établies d après diverses études de marquage publiées qui comportaient des périodes de récupération incomplètes ou d études dont il n avait pas encore été rendu compte. Nous établissons aussi une liste exhaustive des publications et rapports concernant ces études de marquage.
14 xii
15 1 INTRODUCTION Mark-recapture studies have been conducted in the Northwest Atlantic since the late 1800s (Needler, 1930; Templeman, 1963; McFarlane et al, 1990). These early investigations were often secondary objectives on research vessel cruises and were only concerned with elucidating the movements of populations or sub-populations in fairly general terms. In the 1950s, researchers became concerned with the population structure and seasonal movements of commercial fish stocks, and tagging efforts were intensified. Special-purpose cruises by research vessels and commercial charters, and inshore fixed gear, were used to apply large numbers of tags to various demersal and pelagic species of fish. Prior to the mid-1970 s, most of the tagging on the Scotian Shelf and in the western Gulf of St. Lawrence was carried out by researchers from the St. Andrews Biological Station. Although responsibility for conducting tagging studies in these waters subsequently became more dispersed throughout New Brunswick and Nova Scotia, a centralized tag clearing house was established at the Biological Station. A single return address was applied to all tags to reduce the chances of postrecovery data loss, enhance efforts to follow up on missing information, standardize data formatting and processing, improve quality control, and facilitate electronic data entry and accessibility. This resulted in a single database of groundfish mark-recapture data for the Scotian Shelf and Gulf of St. Lawrence areas covering tagging activities conducted from 1953 to Separate database structures were designed to deal with the small pelagic tagging studies. The largest single species tagging effort occurred on herring (Clupea harengus) with over 500,000 tags applied. In a major tagging project on juvenile herring was conducted in the Bay of Fundy using operculum and dorsal fin clip tags. In , a large scale adult herring tagging study was conducted in the southern Gulf of St. Lawrence and off southern Newfoundland (in conjunction with the Newfoundland laboratory) using internal magnetic tags. These studies predated electronic data storage and the data from these studies were never entered into a computer data storage system. Between 1973 and 1982 additional major herring tagging studies were conducted throughout the Gulf of St. Lawrence, Scotian Shelf and Bay of Fundy using the external t-bar tag. The information from these studies was stored in an electronic database. Mackerel (Scomber scombrus) and large pelagic fish (tuna and shark) tagging studies also pre-dated electronic data storage; the release and recovery information on mackerel is, however, included in this report. When tagging of groundfish species was resumed in 1977 following the extension of Canadian marine jurisdiction in 1977, the centralized groundfish tagging data processing procedure was also resumed, but with a revised data format and processing protocol. Thus the groundfish tagged between 1978 and 1985 were maintained on a different database than those tagged during the phase of the program.
16 2 In 1985, it was decided to merge the historical databases for groundfish and small pelagics within a common format to facilitate analyses, and provide comprehensive documentation of the multitude of tagging studies and associated data considerations gathered within this single database (currently maintained by Population Ecology Division, Bedford Institute of Oceanography, Department of Fisheries & Oceans, Dartmouth, Nova Scotia, Canada, B2Y 4A2). It is hoped that this document will serve as a useful guide for researchers interested in such data. Initial results of many of the tagging studies have been described, but the conclusions are often incomplete since they are generally based on only the first few years of recoveries. The incomplete reporting is likely due to the extended time lag between application and virtual completion of recoveries; for most groundfish this lag can be 5 or more years (Fowler and Stobo, 1991; Stobo et. al. 1988). Recoveries from many of the more recent studies have not yet been analysed even though recoveries are complete. It is the purpose of this report to summarize the groundfish and small pelagics tagging studies conducted between 1953 and 1985 throughout the Gulf of St. Lawrence, Scotian Shelf and Bay of Fundy (NAFO Divisions 4R,S,T,V,W,X), and those releases made in the northeastern portion of the Gulf of Maine (NAFO Divisions 5Y,Z and southwestern Newfoundland (NAFO Divisions 3P,N,O) associated with the Scotia-Fundy region. We concentrate on describing the available data, with some comments on the completed tag recovery results, as an overview, and briefly review some of the studies conducted to date. We have also provided an update on publications derived from these data, expanding, or revising, the inferences drawn by the authors, based on the additional recoveries made subsequent to earlier publication. Examinations of the results for species, for which only small numbers were tagged, were included if it was felt these releases might otherwise not warrant separate investigations of their own accord. OVERVIEW Figure 1 provides a depiction of the geographic areas, often referred to in the text as unit areas. Development of these areas was an action taken by both Canada and the United States to provide additional geographical sectioning of the northwestern Atlantic to the areas delineated by the North Atlantic Fisheries Organization (NAFO). Throughout this report we will use the NAFO areas and Canadian Fishing unit areas together without reference to origin. Cod (Gadus morhua) was the prominent groundfish species in both the and groundfish programs, with lesser but consistent effort directed to haddock (Melannogrammus aeglefinus) and American plaice (Hippoglossoides platessoides). Pollock (Pollachius virens) tagging occurred primarily during the period and was directed at juveniles (ages 0-2). White hake (Urophycis tenuis), yellowtail flounder (Limanda ferruginea), witch flounder (Glyptocephalus cynoglossus), and Atlantic halibut (Hippoglossus hippoglossus) were tagged in sufficient numbers for analyses only during the period, and winter flounder
17 3 (Pseudopleuronectes americanus) only during the period. Herring and mackerel were the only two small pelagic species tagged during the study period ( ). The majority of the groundfish tagged throughout and were caught by otter trawl. Handlining and inshore traps were the next most common capture methods; the pollock tagging work relied almost exclusively on commercial and research inshore traps. Most of the herring were captured close to shore by purse seine, using either chartered or commercially active vessels; commercially active weirs and traps were also frequent methods of capture. Mackerel were trapped, seined, or handlined. Upon capture, the herring, mackerel and groundfish in the period were usually tagged with T-bar anchor tags, while groundfish from the period were usually tagged with Petersen discs. The T-bar anchor tags consisted of lengths of machine labelled, coloured, No. 20 vinyl tubing (8 cm long, and yellow the most common colour), attached to a nylon T-bar of the same sort used to attach price tags to clothing. The T-bar was inserted into the dorsal musculature of the fish using a hollow needle, and was applied to fish using a tagging gun, similar to that used in the clothing industry, although with stainless steel parts. Prior to the development of these T-bar tags, the vinyl tube alone, or with a wire inserted the length of the tube, was used as the tag. It was inserted through the dorsal musculature by means of a hollow needle and the ends of the vinyl, or wire, were tied together to form a loop; in this form it was called a spaghetti tag, and both are encountered today in general language and the literature. The T-bar anchor tag is often referred to as a spaghetti tag, as it uses the same vinyl tube. In this manuscript we distinguish the T-bar anchor tags from the older tied spaghetti tags, and sometimes elaborate where the T-bar version is termed a spaghetti tag in the literature. The Petersen disc tags were two 1.8 cm diameter discs of various compositions and colours (again, yellow was the favoured colour, though sometimes a different colour was used for each disc). They were typically secured together by passing a stainless steel wire through the dorsal musculature of the fish by means of a hollow needle, then passing each end of the wire through a disc, and then twisting the ends of the wire with pliers to hold the discs against the sides of the fish. In all cases, the tags were uniquely numbered and thus identified individual fish, as well as containing instructions for returning the tag, with associated recapture information, to obtain a reward. The labelling was English-only for most of the tagging studies considered here, but some of the early Gulf of St. Lawrence studies using Petersen disc tags included examples of French-only and bilingual labelling (by taking advantage of the two disc surfaces). Details of tagging methodology and data processing protocols for groundfish are provided by Beanlands and McGlade (1982) for both groundfish tagging periods, and by Stobo et al (1975) for herring. Parsons and Moores (1973) provide the description of the tagging method used in the mackerel studies we describe in this paper, which was initially reported by Beckett et. al. (1974). The various tagging studies have been tabulated (Appendix A) and mapped (Appendix B) to provide an overview of seasonal and geographic coverage. Numbers recovered are included in the tables to indicate where analyses might be worthwhile. Both groundfish databases included fields for fish length (usually fork length) at both release and recapture. Appendix C provides a summary of the length ranges tagged. The herring database did not incorporate a field for either release or recapture length. Length frequency information is available in the database from tagging studies on all adult pollock but of the juvenile pollock tagged were not measured. Release length frequency information for tagged
18 4 but unmeasured juvenile pollock and all the herring tagging activity was obtained from subsamples of the catch rather than measuring the actual fish being tagged. The pollock length frequencies presented in Appendix C are the actual subsample counts. Much of the herring tagging activity was conducted during ongoing commercial purse seine operations, thus only a few hundred herring were tagged during each of several seine sets during a night of tagging activity; and tagging was conducted over several nights. The herring length frequencies were weighted by catch and combined for the length frequency information presented in this report. Mackerel were not measured. The existence of pollock recovery lengths in the absence of release length data sometimes caused confusion, such as blank lengths at initial capture being mathematically misconstrued as zeros. This departure from other groundfish protocols for pollock should be kept in mind if analyses are conducted on the pollock length data. Appendix D tabulates the subsample length frequencies for the indicated pollock and herring tagging, as this information is not part of the tagging database. Most of the other differences between the tagging databases involve data coding, rather than substantive changes in procedures. Appendix E details the formats of the databases, and includes field summaries and background information for clarification. Two aspects of variation in data processing between tagging programs deserve special mention. Firstly, the groundfish tagging program did not consider day of the month relevant, such that release and recapture dates are only accurate to the month. And secondly, the apparent high precision of herring recovery locations is partially due to the use of a digitization procedure for data entry that created exact coordinates, even though the original data often provided more generalized locations. Preliminary analyses of data fields commonly associated with data processing, and sometimes overlooked during mark-recapture analyses, were conducted to identify any factors that could conceivably bias results. Details of these examinations have been included with the format descriptions of the original databases in Appendix E. The most relevant observations (pervasive or critical) are briefly discussed in the Data Quality section. Simple summaries of data fields that might be of interest to researchers, but are not extensively discussed in this report, have also been incorporated into the format descriptions for the various databases. The Tagging Database Structure and Format as of January, 2006 in Appendix E depicts the latest version of the finfish mark:recapture database. It represents a redesign of the database structure to combine historical and current tagging programs for various groundfish and pelagic species. It includes additional variables and codes beyond those pertaining to the tagging discussed in this report, but comparison with the preceding older database formats in Appendix E should clarify features applicable to post-1985 tagging studies. The PROGRAM code in the current database identifies broad suites of tagging studies, and preserves the specific origins of the data. The tagging studies presented in this report are contained in PROGRAMs 2 ( groundfish tagging), 3 ( groundfish tagging), and 4 ( herring tagging). Many of the species dealt with in this report remained the subjects of tagging studies after 1985, so attention should be paid to the PROGRAM and/or YEAR of tagging when analyses might be affected by incomplete recoveries from more recent studies. This may be especially relevant with respect to cod, haddock, halibut, herring, American plaice, yellowtail flounder, and winter flounder, all of which have been the targets of post-1985 tagging studies.
19 5 As a general guideline to assist researchers in planning analytic approaches to the tagging data, we conducted cursory examinations of geographic and temporal recovery data to address trends in data volume with varying degrees of data precision, and to assess the impact of elapsed time since tagging on conclusions drawn from recovery data (e.g. short-term versus long-term postrelease periods). Results of these analyses are presented in the Recovery Parameters section. Reviews of the status of tagging studies are organized in the Species Synopses, with each species represented by three subsections General Description, Updates to Historical Tagging Studies, and Summary of Unexamined Recoveries. The General Description subsection provides a comprehensive summary of the tagging conducted on a species. A search through the historical literature pertaining directly to the tagging programs described in this paper was conducted in order to flag potentially 'forgotten' releases, to confirm completeness of the present databases, and to update or amend some of the earlier studies. Most of the results of the tagging and much of those for the later studies have been reported (Appendix F). However, many of the reports analyzing the tag recovery data were based on recoveries made within a year of tagging, to portray fish movements in a timely fashion for stock assessments. These reports were commonly presented in the form of Research Documents to bodies deliberating international and national fish conservation measures, typically the International Commission for the Northwest Atlantic Fisheries (ICNAF) and the Canadian Atlantic Fisheries Scientific Advisory Committee (CAFSAC). Further, many of these reports appear only as summaries in ICNAF Annual Proceedings or in Research Station Annual Progress Reports. Since returns from longer periods at large could conceivably provide a more complete description of fish movements and migrations, we re-examined the results of the historical releases using the total recoveries. In the Updates to Historical Tagging Studies subsection we document any discrepancies noted between previously published results and those from analyses of the complete recovery data sets; and, where appropriate, we confirm the conclusions of some past studies that were presented as being of a speculative nature at the time. We do not attempt a comprehensive review of the research to date (Appendix A outlines the associations between the various tagging groups and the historical literature), nor do we comment on discrepancies in earlier work where a subsequent publication has already resolved the issue. We chose 1992 as a cutoff date for the update exercise, as more recent publications would have included all recoveries in their analyses. Tagging data for which we could find no evidence of a report being published, is noted in the Summary of Unexamined Recoveries subsections. Cases of unexamined tagging data from this period relate largely to incidental tagging of fish other than the species that a given study targeted. If there was also no indication of current or pending interest in these species, we conducted basic spatial/temporal analyses of the recoveries, and any further investigations that seemed warranted, on a case by case basis. DATA QUALITY The tagging data comprise a large number of separate tagging studies conducted over a great many years, and were subjected to differing degrees of auditing and editing, and some of
20 6 the original data records no longer exist. This is especially relevant to anyone analysing and interpreting the information associated with tag recoveries. Typically, bad or suspect data will not be clearly resolvable. Typographical entry errors, and imprecise or erroneous data collection procedures, are possible sources of error. Release data were generally subjected to reasonable levels of quality control since they were collected by scientific staff or under supervision of scientific staff. Although some errors in release locations have occurred we have corrected many in the course of this work and thus may no longer be of concern. Release length data likely contain transcription errors, mostly within the range of plausible values, and thus unlikely to be suspected unless subsequently paired with impossible recovery lengths. Very extreme release lengths should be regarded with caution, since we are unable to verify them. Recovery records of unusually small or large fish could be valid, or the result of transcription errors, or imprecise measurement by the individual recovering the fish (e.g. estimation of length rather than true measurement, or lack of documentation of whether the measurement unit was inches or centimeters). Invalid values for minutes of latitude or longitude (e.g. over 60) for recovery locations could be simple typographical errors, or failures to recognize decimal degrees for a returned tag. Another source of recovery location data error, that cannot be easily discerned, is technically valid coordinates, which are, nevertheless, incorrect. These could occur for a multitude of reasons a fish plant worker assuming a fish came from the wrong ship, a fisherman active in more than one area making a guess where a fish was caught, etc. Some errors, such as extreme outliers, or recovery locations on or very near land (most often at or near a fish plant or home address), can be deduced from simple plots. But in many cases we can only speculate whether an unexpected or uncommon recovery location is valid. The expectation of tag recovery from any large-scale marine finfish tagging study is usually low due to a number of factors (e.g. mortality, tag loss, reluctance to submit tags, etc.). In addition, however, there is a reduction in usable recoveries due to incomplete reporting of the recovery information, primarily date or location. As a result of the data omission, a significant proportion of all recovery tags submitted will be of limited use, or unusable, for many investigations. With some species, such as herring, overall chances of recovery are very low, so many thousands of fish have to be tagged to clearly determine movement patterns. As well, the mass processing involved in the herring fishery greatly diminishes the chances of detecting tags relative to the more individuallyhandled groundfish species. Generally, about 60-75% of the recoveries for any major groundfish release will have both month and Cartesian co-ordinates (latitude and longitude) of recapture; only data with these attributes are useful in examining seasonal distribution and movements. The remaining recoveries, however, may still be useful in examining stock range (if geographical coordinates are provided), tag retention (if recovery date is provided), or growth (if recovery date and length are provided). As previously noted, some of the coordinates of geographic recovery location in the herring database (see Table 1) are partly due to the data entry procedure which imposes precision on generalized recovery locations. We note that a data quality code for the herring database identifies only 7660 of the recoveries as 'good'. The remainder break out as 4567 immediate recoveries (any recaptures within two weeks of tagging), 861 without any location data, 470 with incomplete dates, and a further 245 designated as suspect for undefined reasons. These latter 245 recoveries might represent returns for which original geographic co-ordinates were not as precise as those derived
21 7 through digitization, but we suspect that some portion of the good data also had precision added by the digitization procedure. One of the recovery data attributes least likely to be documented is the method of capture. But it is often desireable to identify the actual fishery involved in order to properly weigh the recoveries against catch or to qualify conclusions on distribution against distribution of fishing effort. Although the data field in the database for gear type frequently indicates unknown or other, we have attempted to ascertain likely recapture gears for species for which the likely fishery source can readily be identified from our knowledge of the fisheries or other data supplied with the recovered tag. Angling is the most likely source of other recoveries from the groundfish tagging. Of the 1010 'other' recoveries in the database, 990 have month and Cartesian coordinates of recapture; so high a proportion of returns with such detailed information is only replicated in the case of angling, for which every recovery (800 tags) has similarly precise data. Angling is also the best candidate in cases in which groundfish recoveries caught by 'unknown' gears are associated with known capture depths for both programs. Roughly 75% of groundfish recoveries have capture depth, yet virtually all recoveries by angling have known depths. It would be fairly unusual to know the depth of capture without being aware of the method of capture, and for angled fish, it is easy to apply depths by reference to a pier or other near-shore structure. As well, during the program, there was no data code for angling, and the code only appears to have been used for 2 years (1981 and 1982) of the program. Thus the unknown capture method designation in association with known capture depth may be a result of the absence of a proper code, not knowledge of the gear type. Most of the herring recoveries by undefined gears come from either Passamaquoddy Bay or Chaleur Bay, areas in which weirs and purse seines, respectively, are the most common gears used, and thus the most likely 'unknown' capture methods for these species in these areas. RECOVERY PARAMETERS A major consideration when analyzing temporal aspects of tag returns for any species is a roughly exponential decline in rates of recovery over time (Table 2). Discerning migration or dispersion patterns for groups of fish that take more than 2-3 years for the pattern to fully develop would require the initial application of a few thousand tags. Early studies, like those conducted during the period, rarely exceeded a thousand tags. Compounding this decrease in recovery information over time is the generally high probability of tagged fish being recaptured very soon after release in the same vicinity, providing information of limited value in studies concerned with seasonal migrations or stock boundaries. Usually 10-25% of the total tags recovered from a given groundfish release group, and 66% of a given herring release group will be recaptured within three months of being tagged, and in the area of release. We refer to such recoveries as immediate recoveries, since they generally only provide information on local movements. Exceptions would occur tagging in the absence of fishing activity, or just prior to initiation of migratory activity by the fish being tagged. Herring tend to be highly mobile, so two weeks is commonly used as the time duration for defining an immediate recovery for this species. Using a 2-week immediate recovery period for herring, as opposed to the 3-months commonly
22 8 used for groundfish, would reduce the immediate recapture segment of the herring data from 66% to 33%. In practice, the only way to determine if short-term recoveries for any tagging study provide useful information is to examine them separately from the rest of the recoveries. Longer-term comparisons within a fish stock, such as between a release in the 1950's and another in the 1980's, must consider historical changes in both the fisheries and the tagging programs before interpreting results. Cod, haddock, pollock and plaice were tagged in significant numbers during both the and groundfish programs. Consistently higher recoveries were obtained for the earlier program, which could lead to faulty conclusions without considering several factors related to the tagging that differed between programs. The influences of these disparate conditions of initial capture and release on subsequent recoveries were examined previously (Fowler and Stobo, 1999), so we restrict ourselves in this report to discussing those differences between the two programs that may not be apparent from scrutiny of the transcribed data itself. The greatest difference between the two programs, best reflected by cod and plaice recoveries, was the deliberate avoidance of tagging activity in the presence of an active fishery during The immediate recaptures (i.e. within 3 months of release) are substantially higher for studies (23% of all cod and 27% of all plaice returns) compared with studies (13% of cod and 14% of plaice returns). The net result is that the actual proportions of 'usable' recoveries of cod and plaice for the two programs are much closer than their total recoveries might indicate. A more specific difference between pollock tagging projects was the emphasis on tagging juveniles in their inshore nursery areas during the studies. The earlier (1960) study on pollock predominantly targeted offshore adults. Low returns from the pollock releases relative to the 1960 release of adult pollock could partially reflect the lesser recruitment of the pollock to fisheries throughout their juvenile phase, during which time natural mortality would take its toll. As the individual juvenile pollock tagged were often not measured (see Overview) the contrast in maturity stage between these and other fish (of any species) is not always evident in the data itself. Although pollock tagged as juveniles provided fewer recoveries than pollock tagged as adults, immediate recaptures of the juvenile pollock were quite high (see Table 2) for a groundfish, and subsequent recoveries did not exhibit as great a degree of decline in recovery rates over time as groundfish tagged as adults. The higher immediate recaptures are probably due to the initial availability of juveniles to inshore fisheries (i.e. angling off the pier for harbour pollock), and by virtue of their schooling habit, to weirs, followed by a period of reduced availability to fishing gear when the young pollock are offshore but smaller than commercially sought. Subsequent recruitment to the adult fishery accounts for the lesser decline observed in recovery rates with time. Proportionately more fish may thus remain available a few years after tagging if released as juveniles rather than as adults. Evolution in the fisheries themselves over the years can also impose differences in recovery rates that may be misconstrued as due to some other factor, or simply attributed to sampling variance (thus inflating the error component of contrasts). While draggers (otter trawlers) predominated the groundfish fisheries, longlining, handlining and gillnetting were consistently important. But use of the Danish seine was considerably greater, and that of hook-andline gears drastically less, in commercial fisheries during the period compared to the period. Most of the hook-and-line recoveries (460 out of 540 total) were made during
23 9 Since that time hook-and-line fishing has been virtually eliminated. While the most obvious changes in favoured gear types over time may still serve as a crude index of long-term changes in the fishery, these changes may be less important than innovations within a gear type. In parallel with these changes in the fisheries, and of greater concern to tagging studies, has been evolution in the ways that fish are handled after they are caught. Groundfish recoveries from the program were usually made by fishermen themselves, whereas recoveries from the program were as likely to have been made by a plant worker as a fisherman. This may reflect increasing automation in the fishing industry over the years, such that tags became less likely to be observed by fishermen as on-board processing technology changed. If similar development is assumed for shore-based processing technology, and so long as human observation is necessary to affect discovery, we have the implication of continuously declining likelihoods of recovery of tags over time. The potential impact on tagging studies is perhaps best demonstrated by herring, where the low overall recovery rate of 4% may be a consequence of automated processing employed for the majority of the catch during those recovery periods (capture by purse seine; processed as fish meal). In earlier periods of fisheries activity, a population of fish might disappear from the recovery record for certain months because the fishery was either not directing towards that species, or was unaware of their location. More recently, fisheries management plans often exclude effort from the fishing grounds for certain months when the fish are present as a conservation measure. Change in the application of fishery management practices may also affect the apparent results of tagging studies in more subtle ways. The best example concerns monthly trends in recovery rates. Comparing the total (all species combined) groundfish program recoveries to the groundfish program recoveries for like months (Figure 2), we observed that returns generally peaked around August for the earlier program and around June for the later program. This shift in the monthly probability of recapture between programs may reflect the initiation of Total Allowable Catches (TACs) in the 1970s, motivating fishermen to concentrate their effort on particular species earlier in the year to obtain as much of the higher economic value fish as possible before fisheries could be closed due to quota limits (the race for the fish ). We use this example to draw attention to the biasing influence that fishing effort could have if quantitatively examining recovery data for seasonal trends. With herring, the low recoveries in the Gulf of St. Lawrence and Sydney Bight during February through April correspond to the period of greatest icing over of fishing grounds or inclement sea state conditions in several areas; the drop-off in returns thus may reflect the species' unavailability to the fishery due to seasonal environmental events. In the Bay of Fundy, the herring fishery is prosecuted by gears types which target different phases and seasonal occurrences of herring. Weirs are immobile, restricted to along-the-shore locations, primarily target juvenile herring, and usually operate only from May to October. Gillnets primarily target spawning fish on the spawning grounds so their use is largely limited, both to the late summer-early fall and geographically restricted to the spawning grounds. Purse seines are highly mobile and the boats can follow concentrations of fish through all phases of their life cycle, inclusive of migrations. Thus most recoveries of herring between December and April are made by purse seiners. When examining returns from the perspective of seasonality the extent and duration of ice cover during specific years, and the other factors, would have to be assessed. As well, the anomalous drop in
24 10 recovery rates for December (total 550 returns) relative to November (total 1223 returns) and January (total 2203 returns) represents non-fishing over Christmas, rather than any intrinsic aspect of fish behaviour. SPECIES SYNOPSES Atlantic wolffish (Anarhichas lupus), often referred to as catfish General Description A total of 113 wolffish were tagged, all off southwest Nova Scotia (areas 4Xq,r) in May- June 1963 with spaghetti tags (Appendix B Figure 3). (As opposed to the more recent T-bar anchor tag, often called a spaghetti tag, the tag used in this study was the original spaghetti tag, a thin vinyl tube inserted through the flesh adjacent to the dorsal fin and the ends tied together to form a loop.) The majority of fish were between 88 and 97 cm in length (range: cm). Updates to Historical Tagging Studies We could not find any published information on wolffish tagging results for the Scotian Shelf area. Thus, no updates were possible. Summary of Unexamined Recoveries There were 13 recoveries from the release of 113 wolffish near Yarmouth, N.S. in May- June 1963 (Figure 3). The recovery rate was (Table 1), 7 being recovered within three months of release and all 13 within 4 years. Since all of the recoveries occurred near the release locations, perhaps it was not considered worth a formal report at the time; the species was of little commercial interest in the 1960s. Cod (Gadus morhua) General Description Cod has been the most consistently tagged species in NAFO Subarea 4 during the period (Appendix B Figures 4-12), with tagging activity occurring in 21 of the 33 years (Appendix A). During the period, tagging activity occurred in 6 of the 8 years. Tagging in NAFO Subarea 5 occurred only in the eastern portion (areas 5Zj and 5Yb), and only during Of the almost 81,000 tags applied throughout Subareas 4 and 5, 67% were applied during the period (Table 1). During the 1953 to 1973 period, a combination of tags were used, but Petersen discs were the most prevalent. During the period, T-bar anchor tags were used almost exclusively; a major exception was 1001 Petersen disc tags applied in April 1979 in area 4Vc.
25 11 In area 4X, the releases were mainly in the inshore areas of southwestern Nova Scotia (area 4Xo, 1816 fish) and the Bay of Fundy (area 4Xr, 57 fish; area 4Xs, 1050 fish) during the April to October period (Appendix B Figures 4, 7, 8). Only 107 fish were tagged offshore (areas 4Xn,p), in the vicinity of Brown's Bank (Appendix B Figure 8). Between 1979 and 1985, over 13,600 cod were tagged in area 4X (Appendix B Figures 9-12). Most of these fish were tagged offshore (area 4Xp, fish) during February and March, in an attempt to target spawning components (Appendix B Figures 11, 12). In area 5Zj, over 3,000 cod were tagged on the eastern edge of Georges Bank during February and March, , (Appendix B Figures 11, 12). An additional 350 were tagged offshore, in area 5Yb, near the entrance to the Bay of Fundy (Appendix B Figure 12) in July, Generally, very few cod under 30 cm were tagged; the majority of fish tagged were between cm in all releases and areas. The absence of small fish is more a result of selective fishing than population structure, since areas known or found to contain small fish were avoided. As a result, a skew to larger sizes occurs in the frequency distributions; this was most apparent in the 1984 and 1985 releases near Brown's Bank (4Xp) where a substantial proportion of cod tagged were greater than 70 cm (see Appendix C). The overall recovery rate for the releases was substantially higher (0.279 vs 0.161) than that obtained from the releases (Table 1). In both periods, however, the proportion recovered per year was similar (Table 2), with 60% of the total recoveries being recovered within one year of release and over 95% within four years. Updates to Historical Tagging Studies [Publications List references: 2, 3, 5, 6, 7, 8, 9, 10, 13, 14, 15, 16, 17, 19, 21, 22, 24, 25, 27, 28, 29, 30, 31, 32, 33, 34, 35, 37, 38, 39, 41, 45, 47, 48, 52, 53, 57, 67] Kohler (1975) analysed cod tagging results from the Sydney Bight area and suggested a single stock occupied both 4Vn and 4T, but presented only a gross recoveries plot without any temporal breakdown. Since it is well known that Sydney Bight is an overwintering area for cod, this was doubtless an oversight. An analysis of the complete dataset indicated that the cod tagged in Sydney Bight overwintered there from January to March, entered the Gulf of St. Lawrence in April, then dispersed throughout the Gulf for the rest of the year. More problematic than relevant today, an early paper on cod and haddock mortalities (Paloheimo, 1958) used tag return data to derive natural and fishing mortality estimates. Mortality rates were computed separately for each of three tag types applied in 1953, using recoveries through Unfortunately, the numbers for the Lea hydrostatic and Petersen disc tags for the cod recoveries in this study, were reversed. Beyond some comments comparing results between the two tags that would be reversed, the error did not alter the conclusion, as the estimated natural mortality for cod was considered too dubious in any case. Lastly, in a paper comparing recovery rates between tag types (Fowler & Stobo, 1991), the symbols identifying Petersen disc and T-bar anchor tags (referred to as spaghetti tags in that paper) are reversed in the graphs displaying recovery rates by year. Petersen discs are really depicted by the white symbols and spaghetti tags by the black symbols.
26 12 Summary of Unexamined Recoveries A case of apparently unexamined data relates to cod tagged in the Gulf of St. Lawrence in 1961 and In September-October, 1961 and in May, 1964, cod were tagged off Seven Islands (NAFO area 4Sz), Quebec and in the vicinity of Chaleur Bay (NAFO area 4Tk), New Brunswick, giving the appearance of deliberately paired tagging studies from each side of the Laurentian Channel. The mark:recapture data for these four release events exists in our database. However, in Lettaconnoux (1965) there is also some reference to a tagging event off Seven Islands in September of We have been unable to find any release or recovery data related to that release event. There are several reports and publications which describe the results of the Gulf tagging in this area; but discrete reference to the actual tagging event is often not given and the associated information not helpful in determining which event is being reported. In a 1963 report, Jean described the results of the 1961 Seven Islands tagging, but made no reference to the Chaleur Bay releases made in the same year. Lettaconnoux (1963) provided a brief summary of tagging results for this area of the Gulf, but the report does not identify the tagging events involved, although that report would have to apply to pre-1964 tagging events. There are data in the database for the May, 1964, tagging events off Seven Islands and Chaleur Bay, but we were unable to find any mention of the results of these tagging events in the literature. The only mention of any discrete 1964 Gulf of St. Lawrence tagging we could find, (Lettaconnoux, 1965) refers to S cod tagged in September of 1964, the tagging event for which we could find no data. Somewhat confusingly, we have suggestions from the ICNAF Annual Proceedings for 1962 (Lettaconnoux, 1963) and in Jean (1964) that tagging results indicated that 4S and 4T stocks might not be independent. We cannot determine exactly which of the September-October 1961, May 1964, and September 1964 tagging studies were considered by Jean (1964), but the ICNAF Proceedings could only have relied on the May 1961 tagging, assuming no other studies of which we are unaware. Results of our update analyses (Figure 4a) indicate that the September and October 1961 and May 1964 Gulf of St. Lawrence tagging studies support the interpretation of Jean (1963). The total recoveries indicate that the cod tagged in the two NAFO Divisions exhibited overlap in their ranges for most of a year, but centres of concentration were sufficiently separate that two biological stocks were clearly evident. To clarify the situation we summarized the movements of these cod based solely on recoveries made subsequent to the calendar year in which they were tagged (i.e. excluded recoveries made between Oct-Dec, 1961, and May-Dec, 1964). Thus the suggestion that 4S and 4T stocks might not be independent seems a bit misleading. Possibly it only alludes to their overlapping distributions without intending to imply a stronger relationship. Given the confusion over the identity of the data being considered by Jean (1964) and interpretations of ICNAF (Lettaconnoux,1963), we focused our update analyses on the tagging results reported by Jean (1963), with which we had consistent results and could confirm we had all the data previously analyzed. With the May 1964 tagging in 4Sz and 4Tk not available in time for Jean (1963), and about twice the recoveries from the 1961 tagging as Jean (1963) due to continuing tag returns after publication of results, we could break out individual months where desired, whereas Jean (1963) was limited to a more generalized seasonal (winter, summer, autumn)
27 13 breakdown of recoveries. The 4S fish favoured their area of release from about July through December (Figure 4a), with recoveries on the decline throughout that period. There was extensive movement into the Chaleur region during this period. In January recoveries were made in the southeastern portion of the Gulf of St. Lawrence, with increasing numbers from February through April. The recovery locations were highly concentrated along the west coast of Newfoundland from 3Pn to 4Rc. There were only a few recoveries from the Sydney Bight area. During the May- June period these fish appear to have returned to the Chaleur-4S areas, with recoveries in the Chaleur area slightly predominant. Not apparent to Jean (1963) due to the lesser amount of data available, we think recoveries in the northeastern Gulf suggest that movement through 4S to 4R may have been more common than through 4T. Tag recoveries from cod tagged in the vicinity of the Bay of Chaleur (4Tn, and 4Tk just outside 4Tn) suggest the fish were concentrated in the Chaleur area from roughly May through November, with few recoveries occurring in November and none in December (Figure 4b). Recoveries next appeared in the Sydney Bight area (4Vn), with a few returns in January, but in greater numbers during February and March. During this period some recoveries were also made in the Cape Ray area (Newfoundland side of the Laurentian Channel). In April, recoveries declined, but those recoveries made, were concentrated in the Sydney Bight area. By May most of the recoveries were being made either from Chaleur Bay or the 'Lip', an area in 4Tf where cod tend to emerge from the greater depths of the Laurentian Channel to enter the southern Gulf of St. Lawrence shallows. May and June were months of the greatest dispersion in recoveries as the cod departed the southeastern entrance to the Gulf and returned to the Chaleur area across 4Tf. In overview, both 4S and 4T-tagged fish underwent winter migrations out of the Gulf. During the winter sojourn at the southeastern entrance to the Gulf of St. Lawrence, the 4S cod were rarely recovered from the Sydney Bight fishery, most remaining on the Newfoundland side of the Laurentian Channel, while 4T cod were similarly pre-disposed to remain on the Nova Scotian side of the Channel. Both the 4S and 4T fish returned to the Gulf in the spring. The two groups appeared to mix in the summer-fall when the 4S cod ranged freely into the Chaleur area of 4T. Little reciprocal movement of the Chaleur-tagged cod into 4S was evident. Four cod tagging events conducted between 1979 and 1981 have yet to be reported in the literature. They comprise: winter tagging in 4Wk in 1979; winter tagging in 4Wk in 1980; fall tagging in 4Wh,f in 1981; and fall tagging in Sydney Bight (4Vn) in Cunner (Tautogolabrus adspersus) General Description Forty-seven cunner were tagged with T-bar anchor tags in July, 1980, in St. Margarets Bay in area 4Xm (Appendix B Figure 3). They were caught by research vessel otter trawl. Updates to Historical Tagging Studies We could not find any published information on cunner tagging results for the Scotian Shelf area. Thus, no updates were possible.
28 14 Summary of Unexamined Recoveries The 47 cunner tagged in St. Margarets Bay in July of 1980 produced only three recoveries, all in the vicinity of the tagging location, approximately one week after release (Figure 5). Haddock (Melannogrammus aeglefinus) General Description A total of 43,999 haddock were tagged between 1953 and 1985, the majority in the period (36,373 vs 7626 fish; Table 1). Petersen disc tags were most commonly used in the earlier years ( ) and T-bar anchor tags in later years ( ). In the Gulf of St. Lawrence tagging was limited to September-October, 1956, during which 999 fish were tagged (Appendix B Figure 13). On the Scotian Shelf, haddock tagging was concentrated in the southwest (4WX) between 1953 and 1986 (Appendix B Figures 13-17). Tagging on the central part of the Shelf (4W) was largely restricted to 1959 when 1,297 fish were tagged (Appendix B Figure 15). In the Bay of Fundy (areas 4Xr,s and 5Yb), haddock tagging occurred throughout the period, with releases in the years 1957, 1963, 1966, 1973, 1982 and 1985 of 818, 661, 319, 242, 2893 and 483 tagged fish respectively (Appendix B Figures 14-17). Off southern Nova Scotia (areas 4Xn,o,p) the largest releases occurred with 581, 1392, 251, 900, 3547, and fish tagged in 1953, 1957, 1969, 1971, 1983, 1984 and 1985 respectively. Releases on the eastern edge of Georges Bank (unit areas 5Zj,m; Appendix B Figure 17) occurred in 1984 (3189 fish) and 1985 (2944 fish). The length range of haddock tagged was cm; a single fish was documented as146 cm, but that may have been an entry error. The majority of fish tagged in the Gulf of St. Lawrence in 1956 ranged from cm, similar to those tagged on the Scotian Shelf during the 1950's and 1960's. Generally fish tagged on the eastern Scotian Shelf (4W) and in the Bay of Fundy (unit areas 4Xr,s) tended to have relatively more small fish than those tagged on the southwestern part of the Shelf (unit areas 4Xn,o,p). This tendency was also apparent in the 1970's and 1980's releases. In a small release in February 1980, off Halifax, few fish were greater than 30 cm, and in a much larger release (2893 fish) in June, 1982, in St. Mary's Bay (area 4Xr) few fish were more than 40 cm. Haddock tagged in 1984 and 1985 on the northeast part of Georges Bank (areas 5Zj,m) tended to be slightly larger than southwestern Scotian Shelf fish (modal length of 60 vs 55 cm) tagged during the same period. Recovery rates (Table 1) were much higher during the period than the period (0.124 vs 0.030). In fact, for the period, recoveries from the individual releases were heavily skewed to even lower recovery rates with 19 out of 23 releases having less than 3% recoveries; the higher overall rate was largely due to the recovery rate of 14.4% associated with the 1982 St. Mary's Bay release (Appendix A). The timing of recoveries however was similar between the two release periods; in both cases, over 50% of the recoveries were made within one year of release and over 90% within 3 years (Table 2).
29 Updates to Historical Tagging Studies 15 [Publications List references: 8, 11, 26, 27, 31, 32, 36, 37, 42, 43, 44, 46, 52] None. Summary of Unexamined Recoveries During the process of verifying if tag recoveries had been analyzed in the past and reported in ICNAF Annual Proceedings ( Martin, 1960; Martin, 1961; Beverton and Hodder, 1962; Lettaconnoux, 1963; Lettaconnoux, 1965; Hart, 1966; McCracken, 1973), we came to suspect that some of the apparently unexamined haddock data may have actually been assessed, but results not published if they only served to substantiate conclusions drawn from previous tagging studies. There may also be some ambiguity concerning the identification of tagging studies in some of these reports. Probably all the haddock recoveries from apparently unexamined releases were considered by ICNAF during assessments without being well documented, as they replicate the observations noted for a March 1960 release, recoveries for which were discussed in the ICNAF Annual Proceedings for that year (Martin, 1961). For instance, we expect the March 1959 tagging would have contributed to the 1960 review of haddock movements, yet only the March 1960 tagging is explicitly mentioned. Although the analysis provided in 1960 was extremely cursory and preliminary, the authors observation of lack of movement of haddock from their release locations on the Scotian Shelf is substantiated across the various data sets (Figure 6). This lack of movement also applies to Bay of Fundy releases ( Scotian Shelf may have been used in its context of a management unit, inclusive of the Bay of Fundy). Results from tagging during the period have yet to be published. Atlantic Halibut (Hippoglossus hippoglossus) General Description Halibut tagging was conducted on the Scotian Shelf (4VWX) and southern Grand Banks (3Ps,3NO) during the period. In total, 1296 halibut were tagged (Table 1). The largest single release was on Banquereau (area 4Vs; 704 fish) in March, 1963, just east of Sable Island (Appendix B Figure 18). The next largest- release (149 fish) was at the same location in February, 1964 (Appendix B Figure 19). The remainder of the releases on the Scotian Shelf (198 fish) were relatively small (Appendix B Figures 18-20) and spread across the Shelf. Almost all the halibut tagged off Newfoundland were initially captured near the edge of the continental shelf (Appendix B Figure 21). The largest single release was 81 fish in February 1963 south of the Avalon Peninsula. The remainder (164 fish) of the releases were again relatively small and dispersed along the Shelf edge from St. Pierre and Miquelon Islands to the tail of the Grand Banks. Petersen disc tags were used exclusively. The lengths of the fish tagged ranged from cm. Generally however, few halibut were more than 130 cm, and the majority from the Scotian Shelf were less than 70 cm while the
30 16 majority from off Newfoundland were greater than 70 cm. The overall recovery rate (Table 1) was high (0.224) with recoveries spread over several years. Within 2 years of release, less than 55% of total recoveries had been made and slightly more than 80% within 4 years (Table 2). One fish was recaptured after 18 years at large (Stobo et al. 1988). Updates to Historical Tagging Studies [Publications List references: 18, 69] None. Summary of Unexamined Recoveries None. Herring (Clupea harengus) General Description Between 1973 and 1982 over 341,000 more herring were tagged (Table 1) throughout NAFO Subarea 4 with T-bar anchor tags (Appendix B Figures 23, 24). The fish were caught by purse seines, weirs and traps. Over 66,000 fish were tagged in the Passamaquoddy Bay - Grand Manan region (area 4Xs) of the Bay of Fundy between 1973 and 1981, most during the June- December period. On the Nova Scotia side of the Bay, almost 117,000 herring were tagged, all between 1974 and 1979 during the months of June to September; the tagging sites extended from Minas Basin to south of Yarmouth (areas 4Xr,q). Almost 55,000 herring were tagged along the south shore of Nova Scotia between Chedabucto Bay and Cape Sable Island (areas 4Wd,k and 4Xm,o) during March to August in the period. During the 1976 to 1979 winter fishery seasons (October-March) along the coast of Cape Breton, over 31,000 herring were tagged in the vicinity of Chedabucto Bay (area 4Wd). In the Sydney Bight region (area 4Vn) over 18,000 herring were also tagged during the winter fishery seasons of l977 through 1980 (Appendix B Figure 24). An additional 2975 fish were tagged in April-May 1981 at the entrance to Bras d'or Lakes in Sydney Bight to examine local stock movements. In the Gulf of St. Lawrence, over 56,000 herring were tagged between 1976 and 1981 (Appendix B Figure 24). At the Magdalen Islands (area 4Tf) 9849 fish were tagged during the 1976 spring spawning fishery and in August-September of the same year 27,972 fish were tagged off the Gaspé Bay - Chaleur Bay region (areas 4Tm,n) during the fall spawning fishery. An additional herring were tagged at Souris, PEI (unit area 4Tg) in October of 1978 and 1981 to address herring movements associated with that localized fishery. The herring were not measured individually when tagged, rather random samples of about 100 fish per release group were taken from the capture gear and measured. The lengths ranged from cm with the smallest fish being caught by the traditional "sardine" fisheries in the Bay of Fundy (areas 4Xr,s) and off southwestern Nova Scotia (area 4Xo). Both inshore fixed gear (weirs and
31 17 traps) and more offshore gillnet and purse seine fisheries occur in these areas however, resulting in an extended length range (10-36 cm) of both juveniles and adults being routinely caught. Generally few herring under 18 cm were caught, or tagged, in other areas. The recovery rate for herring was (Table 1), comparable to that obtained in the earlier studies. Over 65% of the recoveries were made within 3 months of release (Table 2), over 90% were made within 1 year and over 97% within 2 years, a shorter time frame than that observed for most groundfish species. Updates to Historical Tagging Studies [Publications List references: 58, 59, 61, 63, 64, 65, 66, 68, 70, 71, 72] A Research Document on herring tagged in the Bay of Fundy (Stobo et al, 1975) merits attention, not for any problems with their conclusions, but rather to clarify the extreme variability in results that disturbed the authors at the time. Observing substantial differences in recovery rates between tagging experiments, ranging from 0.3% to 13.7% across 16 release groups, they unsuccessfully sought an explanation by examining the relationship between recovery rate and fish length. In fact most of the variation between groups was attributable to the combined effects of two factors, neither of which involved fish length. On the one hand, the authors used a data filter prior to analysis to remove immediate recaptures that provided no relevant information on fish movements. By convention, two weeks was used as a breakpoint to remove recoveries made shortly after release and before a suitable period for herring to disperse. Unfortunately the two week exclusion may have been too arbitrary, especially for Mill Cove, Campobello Island releases. Local recoveries were still being made at very high rates beyond the two weeks. Even one more week of exclusion would have fully halved the recovery rates for these releases. Coupled with this difference in the actual duration of immediate recoveries between groups was a problem with non-representation of recoveries from the four August, 1974 releases. These latter fish were tagged just after the fishery was closed, and recoveries were tallied only to mid-april of 1975 (just in time for the stock assessment meetings), which was prior to the June start-up of the purse seine fishery. Had just a few more months passed before counting returns, the total recoveries available for analysis from these four groups would have been 2-3 times those presented. Overall, increasing the immediate recovery period by one week and incorporating recoveries made after April of 1975 removes most of the variability in recovery rates between experiments, although the first two taggings of the study remain anomalously both the lowest (at 0.3%) and highest (at 8.5%). They were also the smallest release groups in the study. If all current recoveries had been available, the immediate recapture period adjusted to three weeks, and the two first and smallest tagging experiments of the study disregarded, the range in recovery rates would have been 0.9% to 4.1%, which seems reasonable variation for this sort of data. Summary of Unexamined Recoveries None.
32 Mackerel (Scomber scombrus) General Description 18 Between October, 1973 and October, 1974 over 12,600 mackerel were tagged (Table 1) using T-bar anchor tags. The Gulf of St. Lawrence releases (2622 fish) were hand- lined from small boats near the north side of Prince Edward Island (areas 4Tg,j), while the Scotian Shelf releases (3421 in area 4Vn, 6448 in area 4Xm and 173 in area 4Xs) were caught in commercial fish traps and weirs(appendix B Figure 25). No length frequencies were taken, but the tagging protocol required that all fish tagged had to be at least 23cm in length. The recovery rate was with almost 95% of the recoveries being made within 1 year of release (Table 2), and all being made within 2 years. Updates to Historical Tagging Studies [Publications List references: 1, 62] A research document (Stobo, 1976) on mackerel tagging off Halifax, N.S., northern Cape Breton, and Prince Edward Island, itself an update of Beckett et al (1974), noted that fisheries throughout NAFO Subareas 3-6 exploited the same fish to some degree at different times of the year, but the author did not consider the data at that time to be sufficient to indicate the extent of intermixing between northern and southern contingents of the stock. A further 14 tags for the November-April recovery months were subsequently turned in, virtually all from the general vicinity of Cape Cod. Overwintering off New England is consistent for all tagged groups regardless of release location, and the wide dispersion of recoveries during the remaining months of the year gives no suggestion that the various releases are discrete from one another (Figure 7). Summary of Unexamined Recoveries None. American Plaice (Hippoglossoides platessoides) General Description A total of 9512 plaice were tagged between 1953 and 1985 (Appendix B Figures 1,2), the majority in the period (6855 vs 2657; Table 1). Tagging was concentrated in the southern Gulf of St Lawrence (areas 4Tf,g,k,i,m,n) with 2185 and 5743 tags applied there in the and periods respectively. On the Scotian Shelf (including the Bay of Fundy) only 1584 tags have been applied, primarily in 3 localized areas and times: 200 in Passamaquoddy Bay in 1966 (area 4Xs), 236 off southern Nova Scotia in 1972 (area 4Xo) and 1065 off Halifax in l98o (area 4Xm). Petersen disc tags were used for most of the releases. In the releases, T- bar anchor tags were used exclusively on the Scotian Shelf, while in the Gulf of St. Lawrence a
33 19 combination of T-bar anchor tags (997) and Petersen discs (1078) were used, the Petersen discs being applied as part of an experiment to compare the retention of tag types on the fish. Generally a wide size range of fish were tagged in all releases (between cm with a single fish at 86 cm), the majority being between cm. The recovery rate was much higher for the early than later period releases (0.354 vs 0.066; Table 1) and for both periods approximately 50% of the total recoveries occurred within 1 year of release; over 90% of total recoveries had occurred within 4 years (Table 2). Updates to Historical Tagging Studies [Publications List references: 7, 8, 23, 25, 26, 54, 55] In a paper comparing recovery rates between tag types (Fowler and Stobo, 1991), the symbols identifying Petersen disc and T-bar anchor tags (referred to as spaghetti tags in the paper) were reversed in the graphs displaying recovery rates by year (Figure 2 of Fowler and Stobo, 1991). Petersen discs are really depicted by the white symbols and spaghetti tags by the black symbols. And within the text, in noting no significant difference between tags for plaice, the two tags were again switched - the spaghetti tag actually gave a marginally higher recovery rate than the Petersen disc. Summary of Unexamined Recoveries No results from post-1963 tagging have been published. Pollock (Pollachius virens) General Description A total of 56,874 pollock were tagged between 1953 and 1985 (Appendix B Figures 25, 26), most in the period (55,865 of them; Table 1). Most of the 1008 fish tagged in the earlier period were caught in July, 1960, near the entrance to Passamaquoddy Bay (area 4Xs) and tagged with Petersen disc tags (Appendix B Figure 26). In the later period, tagging was conducted every year from 1978 to T-bar anchor tags were used exclusively, and almost all were obtained from inshore traps or handlining. Offshore tagging was attempted in 1978 using a bottom trawl, but was unsuccessful. Although the offshore tows were of short duration (averaging 10 minutes per tow), and substantial numbers of pollock were caught, almost all were moribund by the time they were removed from the trawl. Since the species did not appear to be capable of surviving the trawl-based tagging procedures, subsequent tagging efforts were concentrated on shallow inshore areas. The most consistent tagging effort was conducted in the Chedabucto Bay region (area 4Wd), where between 2728 and 5131 fish were tagged during May- June every year between 1979 and An additional 991 and 2942 fish, respectively, were tagged just outside Chedabucto Bay in 1978 and 1979 (Appendix B Figure 27). In the Passamaquoddy Bay region
34 20 (area 4Xs), fish were tagged every year from 1980 to 1984 although the dates and locations changed somewhat between years; the numbers tagged ranged from 800 to Most of the remaining pollock were tagged along the shore of south and southwest Nova Scotia (areas 4Wk, and 4Xm,o,r) between 1978 and A single release (312 fish) was made off southwestern Newfoundland (area 3Pn) in August, 1982 (Appendix B Figure 27). Pollock tagged in the 1960's were relatively large fish, ranging from 52 to 88 cm in length. In contrast, the inshore, or 'harbour pollock' tagged during the period were almost all under 45 cm in length. Clay et al. (1989) suggested that pollock grow to a length of 17 cm during the first year of life and to 30 cm during their second year. That would suggest that most fish tagged in 4Wd and 4Xs were l-year old fish while most of those tagged around southwest Nova Scotia were a mixture of 0-group and l-year olds. Clay et al. (1989) also provide the length ranges of each of the juvenile tagging release groups; those length ranges include both the database and subsample length frequency data presented in this report. The recovery rate of the 1960's releases was double that of the period (0.216 vs 0.101; Table 1). For both periods, over 90% of total recoveries occurred within 4 years (Table 2). But almost 40% of the tag recoveries from the releases occurred within 3 months of release; for the same period, less than 20% of the 1960's releases were recovered. The difference in short-term recovery rates was probably because 0-group and l-year old pollock move little during the first two summers of life and often re-entered traps in which they were originally caught. If the first 3 months of recoveries are removed from the year and total tallies, the revised proportional recovery rates for the 4 years post-release are 0.247, 0.503, and versus 0.470, 0.645, and for the 1978 and 1960's release periods, respectively. With that modification, the proportion recovered from the period is only half. Subsequently, natural mortality would have removed a large proportion of the fish before they recruited to the commercial fishery, while pollock tagged in the 1960's were of commercial fishing size. Updates to Historical Tagging Studies [Publications List references: 4, 8, 49, 50, 51, 60] None. Summary of Unexamined Recoveries None. Sea Raven (Hemitripterus americanus) General Description A total of 20 sea raven were tagged with T-bar anchor tags in January-February in (Table 1). The tagging area was nearshore in areas 4Xm and 4Wk (Appendix B Figure 3). No recoveries have been made.
35 21 Updates to Historical Tagging Studies None. Summary of Unexamined Recoveries None. Thorny Skate (Raja radiata) General Description Fifty-one thorny skate were tagged with T-bar anchor tags in February of 1979 and 1980 nearshore in areas 4Xm and 4Wk (Appendix B Figure 22). No recoveries have been made. Updates to Historical Tagging Studies None. Summary of Unexamined Recoveries None. White Hake (Urophycis tenuis) General Description White hake tagging has been restricted to the south-eastern portion of the Gulf of St. Lawrence (areas 4Tg,h) (Figure 22). Twenty-two hundred and seventy-one were tagged with Petersen discs in August, 1967 and 196 were tagged with T-bar anchor tags in September, The majority of the fish tagged in 1967 were between 52 and 70 cm, with an extended range from 37 to 106 cm. The length range of the fish tagged in 1979 was more restricted (40-82 cm) with the majority between 43 and 60 cm. The recovery rate for the 1967 releases was (Table 1) with almost 90% of the recoveries being made within 2 years of release and over 96% within 4 years (Table 2). Only 4 recoveries were made from the 1979 release, all in the second year. Updates to Historical Tagging Studies [Publications List references: 20] An example of the potential contribution that 'subsequent' recoveries of tags can make to our understanding of a situation is provided by the analysis of white hake movements in the Gulf of St Lawrence. Kohler (1971) used 606 recaptures to the end of 1969 to describe the movements of
36 22 fish tagged in August of Nearly 400 of these fish were of little use since they were 'immediate' recaptures, so the investigation was effectively left with about 200 recoveries made over a two year period. Another 63 recoveries were made during , such that a redundant localized concentration of hake became apparent during June (and once continued into July) in the vicinity of Baie Verte in the Northumberland Strait (Figure 8). This grouping of hake coincides with the timing of spawning for these fish (Markle et al, 1982), and collaborates the belief of local fishermen that white hake spawn in the Strait (Halliday and Pinhorn, 1982; Clay et al, 1985). It also serves to better pinpoint just where in the Strait these fish spawn, and supports the hypothesis put forward by Markle et al (1982), based on larval surveys, that white hake in the southwestern Gulf undergo mass spawning as opposed to the prolonged and dispersed spawning associated with Scotian Shelf hake. Summary of Unexamined Recoveries The 196 white hake released off Pictou Island, N.S. (area 4Tg) in 1979 provided four recoveries, all during July-August of Three were recovered in the northern Nortumberland Strait and one was recovered near the tagging location (Figure 9). Windowpane Flounder (Scophthalmus aquosus) General Description Twenty-eight windowpane were tagged with T-bar anchor tags in August, 1984 (Appendix B Figure 3) in the Passamaquoddy Bay area of the Bay of Fundy (area 4Xs). No recoveries have been made. Updates to Historical Tagging Studies None. Summary of Unexamined Recoveries None. Winter Flounder (Pseudopleuronectes americanus) General Description Of the 1410 winter flounder tagged, forty-four were tagged between 1971 and 1973, the remainder between 1979 and 1985 (Table 1; Appendix B Figure 28). Petersen disc tags were used in the earlier period and T-bar anchor tags in the latter period. The early period tagging was restricted to the Passamaquoddy Bay region of the Bay of Fundy (area 4Xs). In January and February in 1979 and 1980, three hundred and fifty-nine fish were tagged off Halifax and St.
37 23 Margaret's Bay (areas 4Xm and 4Wk), while 1007 were tagged in the Passamaquoddy Bay region (area 4Xs) between August 1984 and November The size of fish tagged ranged from cm with the majority being between cm. The recovery rate was much higher for the early releases (0.114 vs 0.023; Table 1) although due to the limited releases the overall number of recoveries was small. Over 90% of the recoveries had been made within 2 years of release (Table 2). Updates to Historical Tagging Studies None. Summary of Unexamined Recoveries The tagging of winter flounder in and around Passamaquoddy Bay, N.B., and off Halifax, N.S. may have been a deliberate investigation of the species that was never reported in the literature. A total of 1410 fish were released and 37 tags recovered across about 8 tagging studies (most targeting other species). We conducted a casual investigation of the recoveries and concluded that winter flounder movements, of short distances and no discernible pattern, probably represent directionless foraging (Figure 10). One of the fish tagged near Halifax was reported off the north tip of Cape Breton 8 years later. Given the long time period such a recovery is plausible, but we would want to see more occurrences before ruling out that it is merely a reporting error. Winter Skate (Raja ocellata) General Description A total of 12 winter skate were tagged, all in February, 1980, nearshore in area 4Xm (Appendix B Figure 22). No recoveries have been made. Updates to Historical Tagging Studies None. Summary of Unexamined Recoveries None. Witch Flounder (Glyptocephalus cynoglossus) General Description During the and periods, 2731 witch were tagged (Appendix B Figure 29). In 1963, tagging was conducted in October in the southeastern Gulf of St. Lawrence (areas 4Tf,g;
38 fish) and off the northeastern portion of Cape Breton (area 4Vn; 190 fish). In tagging was limited to the eastern Scotian Shelf (areas 4Vb,c,n and 4Wd,h; 2314 fish) during the October- April period. In April, 1972, sixteen fish were tagged off southwest Nova Scotia (area 4Xo), while all of the 1973 releases occurred within the Bay of Fundy (areas 4Xr,s; 66 fish). In the 1960's the size range of fish tagged was extensive (29-90 cm) with no dominant modes in the distribution of lengths. In the 1970's the length range was more limited (41-64 cm) but again with a fairly even distribution of lengths over that range. The recovery rate was (Table 1), but the recovery period has been prolonged, with slightly less than 85% being recovered within 4 years of release (Table 2). Updates to Historical Tagging Studies [Publications List references: 12, 56] None. Summary of Unexamined Recoveries The only reference we could find to any of the witch flounder tagging was a brief mention in the ICNAF Annual Proceedings for 1965 (Hart, 1966), where it was reported that tagged witch stay in the vicinity of the tagging locations. But the only tagging study identified in this report was for 1965, ostensibly referring to both eastern Scotian Shelf studies in that year; however the authors may have also considered the 1964 tagging in forming their conclusions. In either case, some tagging studies were not reported in the literature, and the studies that were commented upon had only provided one or two years of recovery data by We took a preliminary look at all the recoveries (returns were still occurring during the 1970 s) with respect to eight release group definitions, and formed the general impression that most of the witch flounder groups dispersed randomly or with a directional bias; therefore they would not be construed as remaining in the area of release. Some observations related to specific tagging studies: Tagging near Passamaquoddy Bay (Figure 11): only two recoveries recorded, both local. Tagging off Southwest Nova Scotia: no recoveries. Tagging West of Sable Island, 1965 (Figure 12): reasonable numbers of tagged fish were recovered, 53 with coordinates for the recovery location. We suspect that the 24 releases farthest offshore are subject to incorrectly transcribed latitudes, and may belong with the 467 fish tagged directly north of them. Of 4 recoveries from these 24 fish, 3 were located where the northern group were tagged, and the other was recovered to the east of the northern tagging location. If this is correct, then almost all recoveries were local to the tagging area. Two recoveries were reported from the vicinity of the Lip, a small area off Cape North where fish converge in the spring and fall to enter or leave the Gulf of St Lawrence (the Lip represents a cut connecting the Cape Breton Trough and Laurentian Channel). As no witch flounder were recovered in between the release area and the
39 25 Lip, these two recoveries seem dubious. However the intervening areas are also characterized by a preponderance of untrawlable bottom conditions. Tagging in 4Vc (Figure 13): eight recoveries were made, suggesting quite extensive dispersal, especially to the north. One recovery was reported off Scaterie, two at the Lip, and one across the Laurentian Channel in the northern Gulf of St Lawrence (4Ss). Tagging in 4Wd (Figure 14): seven recoveries were made, suggesting quite extensive dispersal, predominantly northeastwards, with five tags reported on or near the edge of the Laurentian Channel in 4Vc (2) and 4Vn (3). We examined the Sydney Bight/Lip area recoveries from the 4W/4Vc releases described in the previous three subsections, checking for commonality in data that might suggest hoarding and subsequent batch submission of tags, as opposed to tags being treated as singular events. Such an occurrence could associate a single reporting error with multiple recoveries. However the Bight/Lip area recovery locations from Scotian Shelf tagging appear generally unique, with only two of the tags representing a common return event. We could still be seeing an effect of boats leaving regular fishing areas on the Shelf to prosecute the seasonally brief but intensive Lip fishery, with undetected, tagged witch in their holds from fishing in the 4W/4Vc area. But the apparent movement of witch flounder from 4W and Banquereau areas to the Sydney Bight area cannot be discounted. Tagging on the Edge of the Laurentian Channel in 1964 (Figure 15): four recoveries were made, suggesting extensive dispersal north and west. It is hard to comment on the possibility of eastward movement down the slope into the Channel, as Channel depths are beyond most fishing. Thus we would not expect to see recoveries from fish moving east unless they crossed over to the Grand Banks. But the absence of recoveries from regularly fished depths and areas to the south (Banquereau) suggests there may be little movement in this direction. Tagging in Northern Sydney Bight (Figure 16): thirteen recoveries were made, twelve indicating local dispersion and one from 3Ps directly across the Laurentian Channel from the release area. Tagging in the Cape Breton Trough (Figure 17): four recoveries were made, three in the vicinity of the release area and one off the Madelene Islands near the edge of the Laurentian Channel. Yellowtail Flounder (Limanda ferruginea) General Description A total of 3185 yellowtail have been tagged (Table 1; Appendix B Figure 30), the majority in June-September 1966 (2596 fish) and May 1967 (452 fish) on Sable Island Bank (areas 4We,f,h,j) and Banquereau (area 4VSc). Of the remaining 137, small numbers were tagged along
40 26 the south coast of Nova Scotia and 116 were tagged in Passamaquoddy Bay (area 4Xs) in In , Petersen disc tags were used while in the period, T-bar anchor tags were used. The length range of the fish tagged was cm with the majority between 30 and 42 cm. The recovery rates (Table 1) were dramatically higher from the earlier period (0.082) with only 1 recovery being made from the more recent releases (0.007). Over 90% of the recoveries were made within 3 years of release (Table 2). Updates to Historical Tagging Studies None. Summary of Unexamined Recoveries None of the yellowtail tagging has been reported in the scientific literature. We looked at two major and two minor release groups. While a cursory examination of plottable recoveries might suggest some very pronounced movements, we concluded that yellowtail flounder probably do not move extensively, but exhibit highly localized random dispersal. We review the data for each release grouping below: Tagging in the vicinity of Sable Island (4We, 4Wh, 4Vc) in 1966 (Figure 18): there were 52 plottable recoveries from tagging in this area, 16 of them depicting long-distance movements, including 11 reports from Georges Bank. However 10 of the Georges Bank recoveries were made from 3 recapture events in the same month that these fish were tagged, and the last recovery was made the following month. It is highly improbable that these 10 fish would have moved from Sable Island to Georges Bank in a month, so that information is probably erroneous. Of the remaining 5 non-local recoveries, 3 were reported from Banquereau and two from adjacent banks. When the improbable recoveries are discounted, the low number of apparently long-range movements suggest that yellowtail flounder are quite sedentary. Tagging in 4Wj and 4Wh in 1967 (Figure 18): of 32 plottable recoveries from these fish, only 4 were both non-local and theoretically possible (we discounted a fifth recovery from 4Vc during the month of release). Tagging off Southwest Nova Scotia (Figure 19): the single yellowtail tagged in 1972 was recovered in the vicinity of the release area in Tagging near Halifax (Figure 19): Only one recovery occurred from the 20 yellowtail flounder tagged in January-February near Halifax, N.S., in the following spring in the vicinity of the tagging site.
41 27 REFERENCES Beanlands, D. and McGlade, J Groundfish tagging procedures. Lab. Ref. 82/3. Beckett, J.S., Stobo, W.T., and Dickson, C.A Southwesterly migration of Atlantic mackerel, Scomber scombrus, tagged off Nova Scotia. ICNAF Res. Doc. 74/94. Beverton, R.J.H. and Hodder, V.M Report of the working group of scientists on fishery assessment in relation to regulation problems. 7. Subarea 4. ICNAF Ann. Proc. 11 (sup): Clay, D., Currie, L., and Hurlbut, T A first assessment of Gulf white hake: NAFO Division 4T/1985. CAFSAC Res. Doc. 85/64. Clay, D., Stobo, W.T., Beck, B., and Hurley, P.C.F Growth of juvenile pollock (Pollachius virens L.) along the Atlantic coast of Canada with inferences of inshoreoffshore movements. J. Northw. Atl. Fish. Sci. 9(1): Fowler, G.M. and Stobo, W.T Comparative recoveries of spaghetti tags and Petersen disc tags on Atlantic cod (Gadus morhua) and American plaice (Hippoglossoides platessoides). J. Northw. Fish. Sci. 11: Fowler, G.M. and Stobo, W.T Effects of release parameters on recovery rates of tagged groundfish species. Can. J. Fish. Aquat. Sci. 56: Halliday, R.G. and Pinhorn, A.T The groundfish resource in the Gulf of St. Lawrence. Can. Tech. Rep. Fish. Aquat. Sci Department of Fisheries and Oceans, Ottawa, Ontario, Canada. Hart, J.L Summaries of research and status of fisheries by subareas, Subarea 4. ICNAF Ann. Proc. 16: Jean, Y Where do Seven Islands cod come from? Trade News 16(2):6-7. Jean, Y Seasonal distribution of cod (Gadus morhua L.) along the Canadian Atlantic coast in relation to water temperature. J. Fish. Res. Bd. 21(3):
42 28 Kohler, A.C Tagging of white hake, Urophycis tenuis Mitchell, in the southern Gulf of St. Lawrence. ICNAF Res. Bull. 8: Kohler, A.C Recoveries from 1969 cod tagging in ICNAF Divisions 4VN. ICNAF Res. Doc. 75/91. Lettaconnoux, R.H Summaries of research, 1962, by subarea. 3. Subarea 4. ICNAF Ann. Proc. 13: Lettaconnoux, R.H Summaries of research and status of fisheries, by subareas for Subarea 4. ICNAF Ann. Proc. 14: Markle, D.F., Methven, D.A., and Coates-Markle, L.J Aspects of spatial and temporal cooccurrence on the life history stages of the sibling hakes, Urophycis chuss (Walbaum 1792) and Urophycis tenuis (Mitchell 1815) (Pisces: Gadidae). Can. J. Zool. 60: Martin, W.R Canadian research report, B. Subareas 4 and 5. ICNAF Ann. Proc. 10, Part III: Martin, W.R Canadian research report, B. Subareas 4 and 5. ICNAF Ann. Proc. 11, Part III: McCracken, F.D Summaries of research and status of fisheries for subareas and seals, Subarea 4. ICNAF Ann. Rep. 23: McFarlane, G.A., Wydoski, R.S., and Prince, E.D Historical review of the development of external tags and marks. Amer. Fish. Soc. Symp. 7:9-29. Needler, A.W.H The migrations of haddock and the interrelationships of haddock populations in North American waters. Contrib. Can. Biol. Fish., N.S., 6(10): Paloheimo, J.E Determination of natural and fishing mortalities of cod and haddock from analysis of tag records off western Nova Scotia. J. Fish. Res. Bd. Can. 15: Parsons, L.S. and Moores, J.A Long-distance migration of an Atlantic mackerel, Scomber scombrus, tagged in Newfoundland waters. Intern. Comm. Northw. Atlant. Fish. Res. Doc. 73/82. Stobo, W.T Movements of mackerel tagged in Subarea 4. ICNAF Res. Doc. 76/VI/49. Stobo, W.T., Scott, J.S., and Hunt, J.J Movements of herring tagged in the Bay of Fundy. ICNAF Res. Doc. 75/38.
43 29 Stobo, W.T., Neilson, J.D., and Simpson, P.G Movements of Atlantic halibut (Hippoglossus hippoglossus) in the Canadian North Atlantic. Can. J. Fish. Aquat. Sci. 45: Templeman, W Comparison of returns from different tags and methods of attachment used in cod tagging in the Newfoundland area, 1954 and ICNAF Spec Publ. 4:
44 30 Table 1. Aspects of recovery data quality for different species and tagging programs. Species Program Number Released Number Recovered Percent Recovered Number with NAFO Division plus Year plus NAFO Unit Area plus Month plus Latitude and Longitude Percent Recovered ATLANTIC WOLFFISH % % ATLANTIC COD % % % % CUNNER % % HADDOCK % % % % ATLANTIC HALIBUT % % HERRING % % MACKEREL % % AMERICAN PLAICE % % % % POLLOCK % % % % SEA RAVEN % THORNY SKATE % WHITE HAKE % % % % WINDOWPANE FLOUNDER % WINTER FLOUNDER % % % % WINTER SKATE % WITCH FLOUNDER % % YELLOWTAIL FLOUNDER % % % %
45 31 Table 2. Temporal breakdown of recovery data for different species and tagging programs. NUMBERS AND PERCENTS OF RECOVERIES Species Program Number Released Number Recovered with Date Known to Month Within 3 Months of Release Between 3 Months and 1 Year of Release Between 1 and 2 Years of Release Between 2 and 3 Years of Release Between 3 and 4 Years of Release Over 4 Years after Release ATLANTIC WOLFFISH % 1 7.7% % 0.0% 1 7.7% _ ATLANTIC COD % % % % % % % % % % % % CUNNER % _ HADDOCK % % % % % % % % % % % % ATLANTIC HALIBUT % % % % % % HERRING % % % % 75.6% 34.3% MACKEREL % % 9 5.1% _ AMERICAN PLAICE % % % % % % % % % % % % POLLOCK % % % % % 8 3.9% % % % % % % SEA RAVEN THORNY SKATE WHITE HAKE % % % % % % % 0.0% % _ WINDOWPANE FLOUNDER WINTER FLOUNDER % % % _ % % % 2 6.7% 0.0% 1 3.3% WINTER SKATE WITCH FLOUNDER % % % % 7 5.3% % YELLOWTAIL FLOUNDER % % % % 7 2.9% 9 3.7% % 0.0% % _
46 32
47 Number of Recoveries P rogram P rogram Jan Feb Mar A pr May Jun Jul A ug S ep Oct Nov D ec Month of Recovery Figure 2. Overview of groundfish tag returns by month from the and tagging programs.
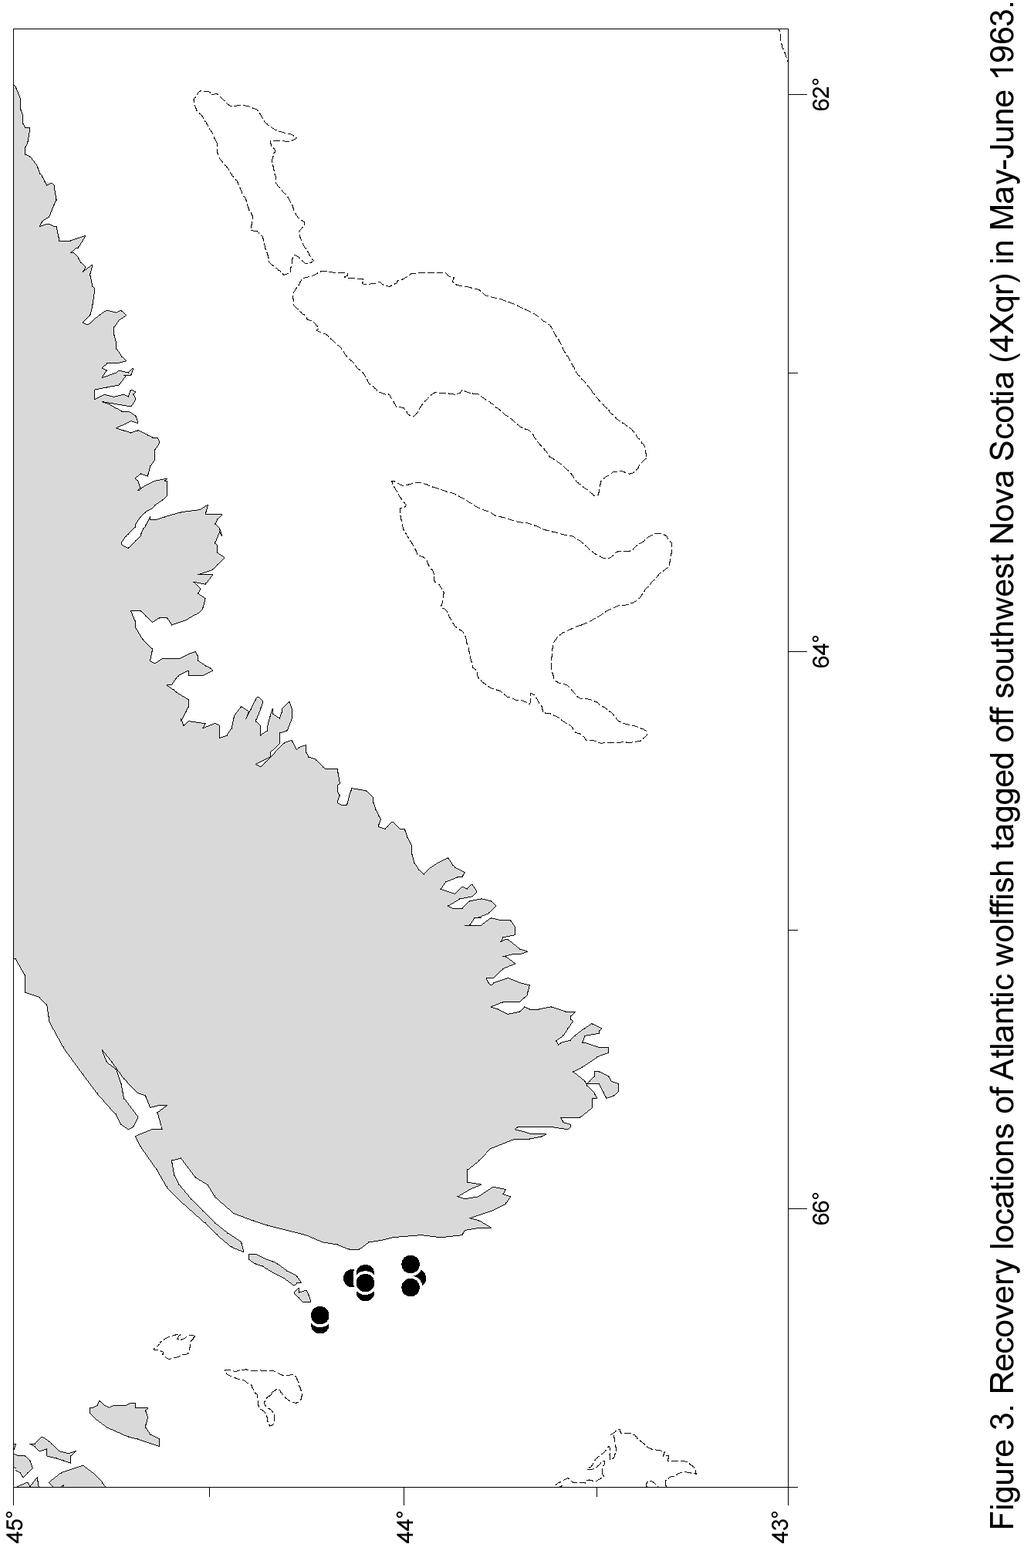
48 34
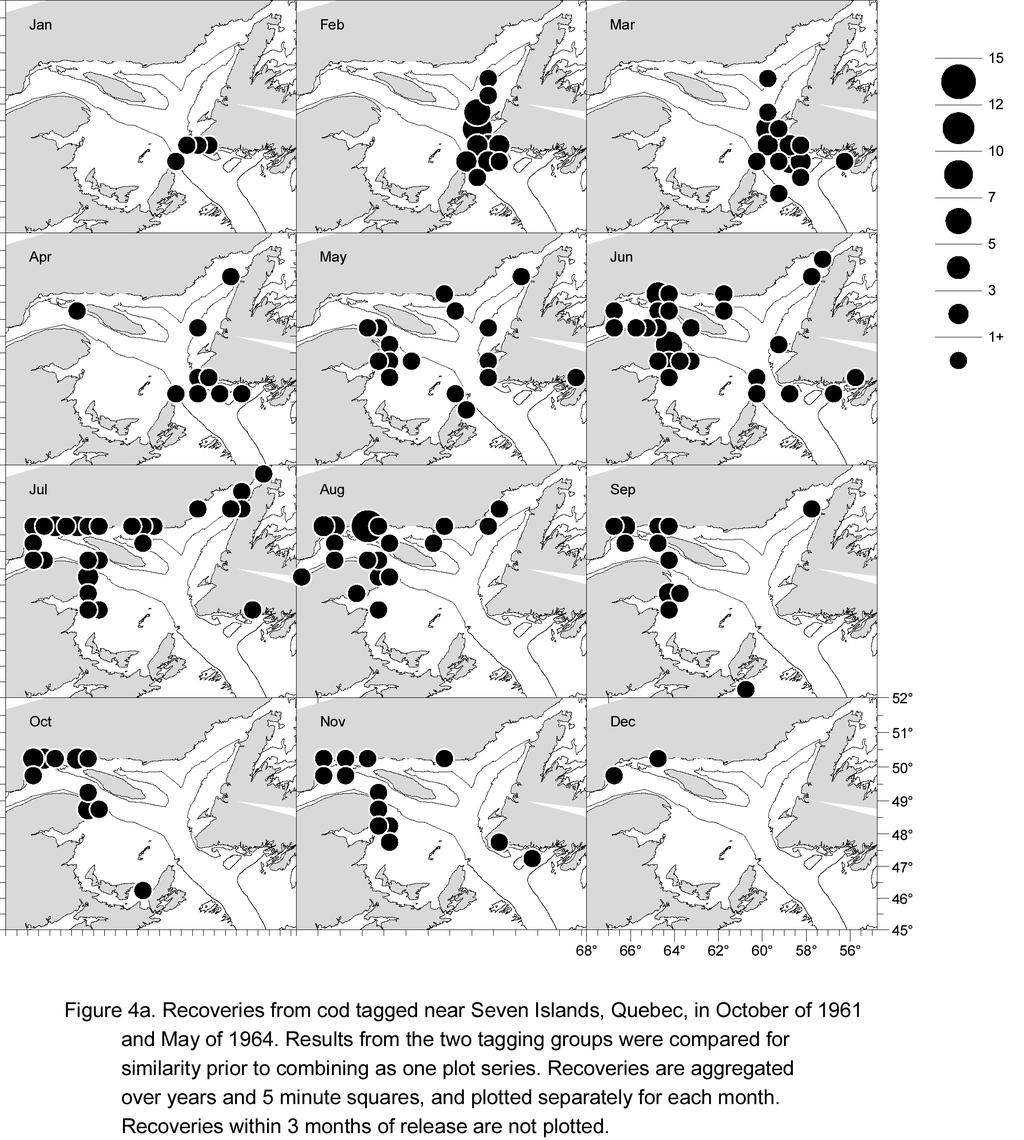
49 35
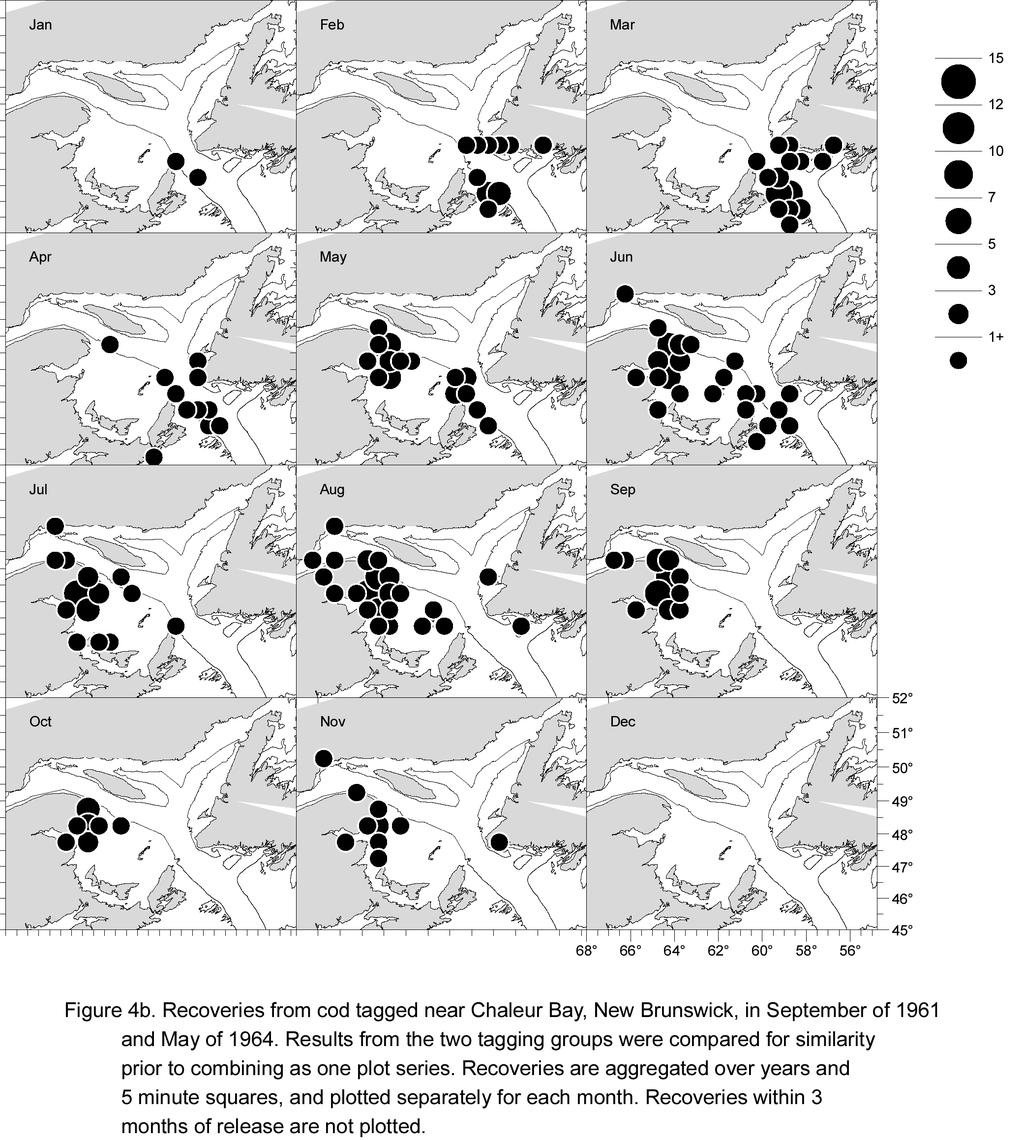
50 36
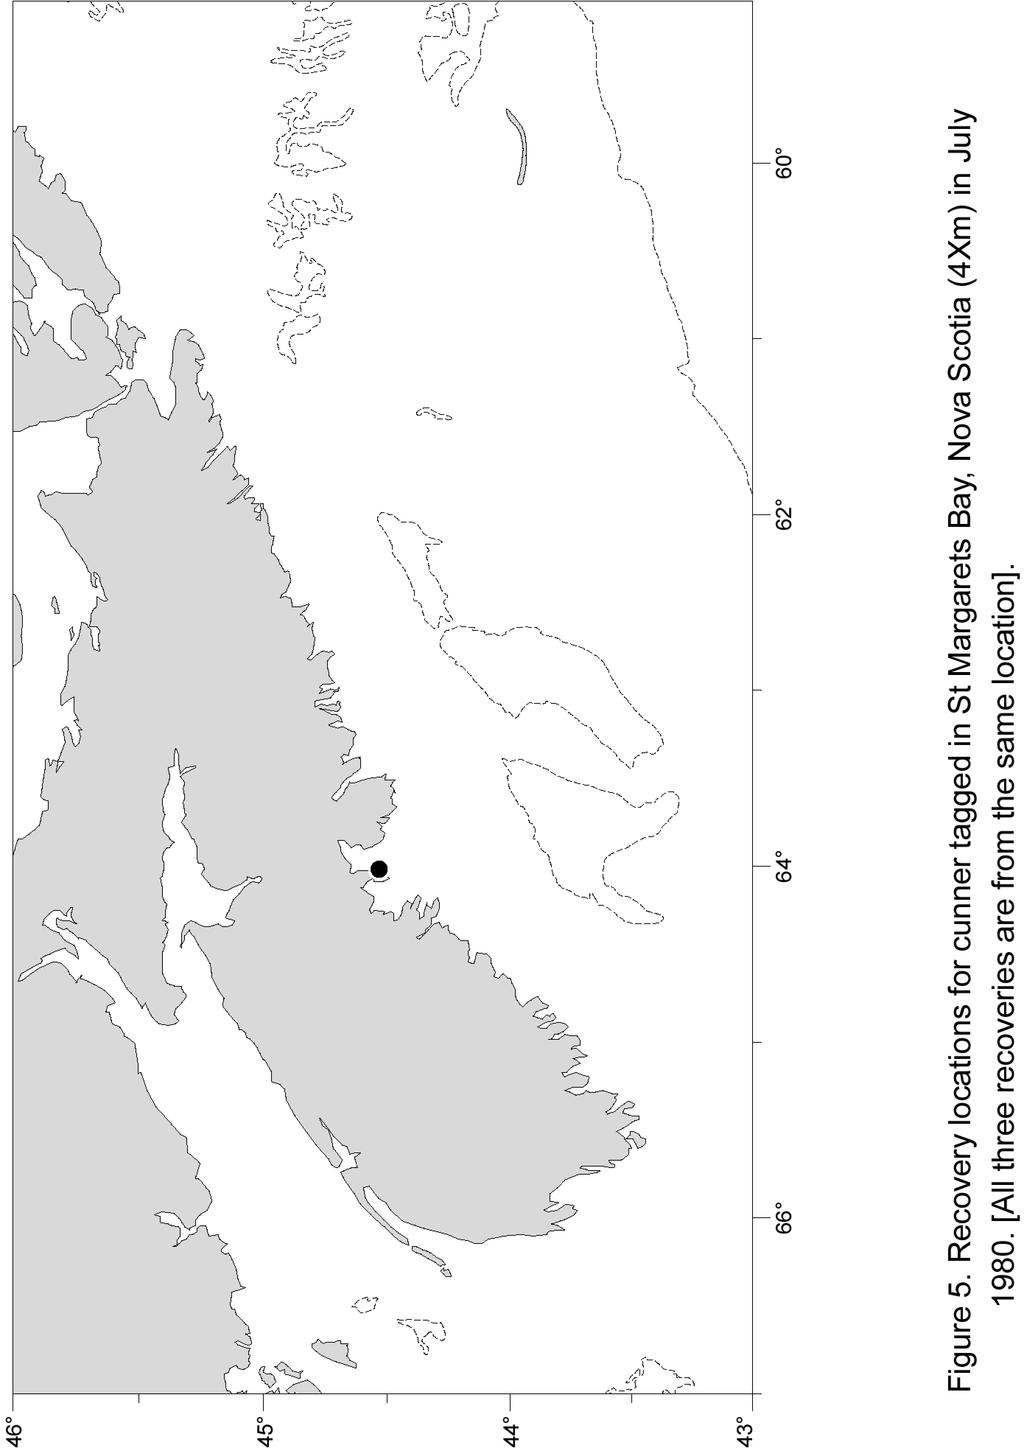
51 37
52 38
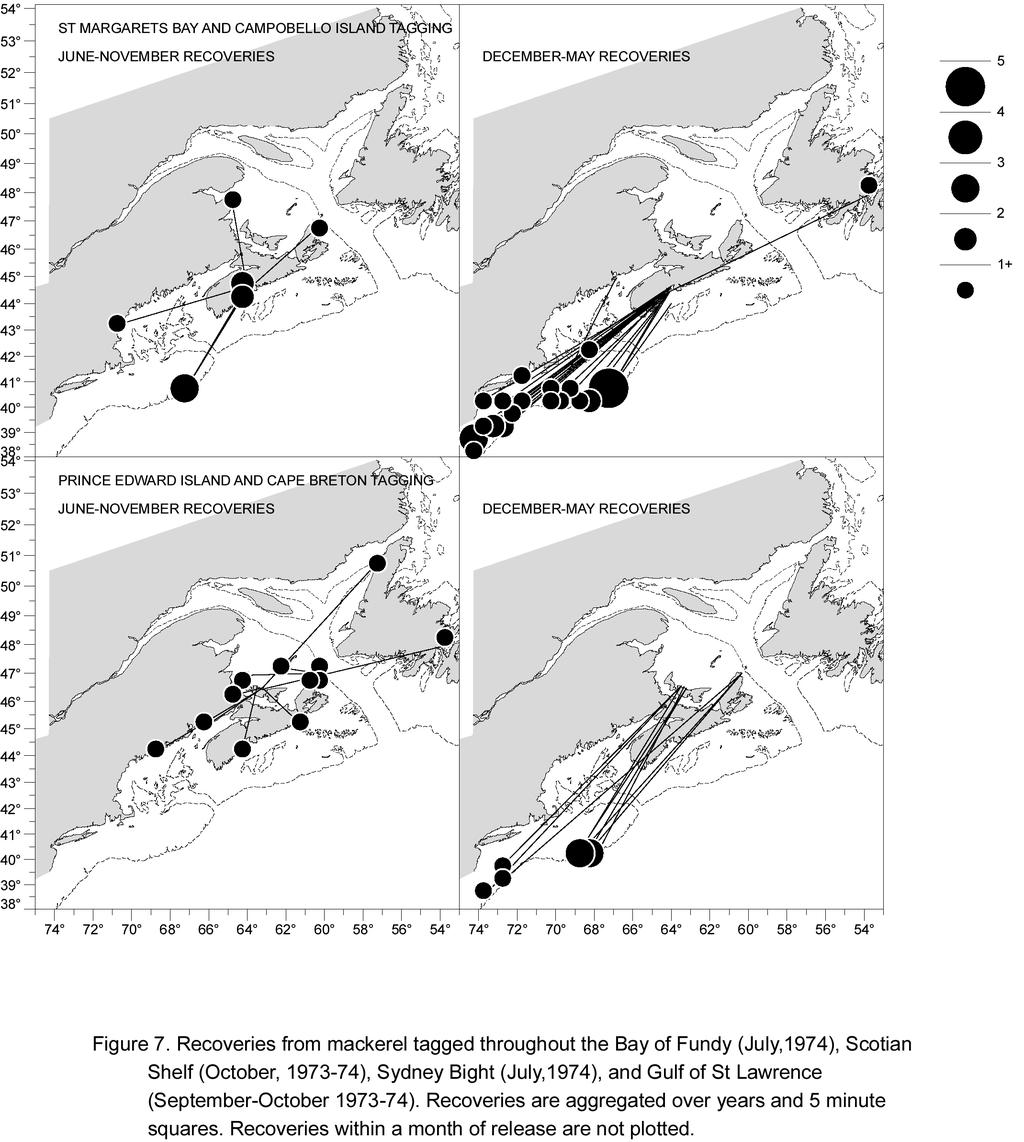
53 39
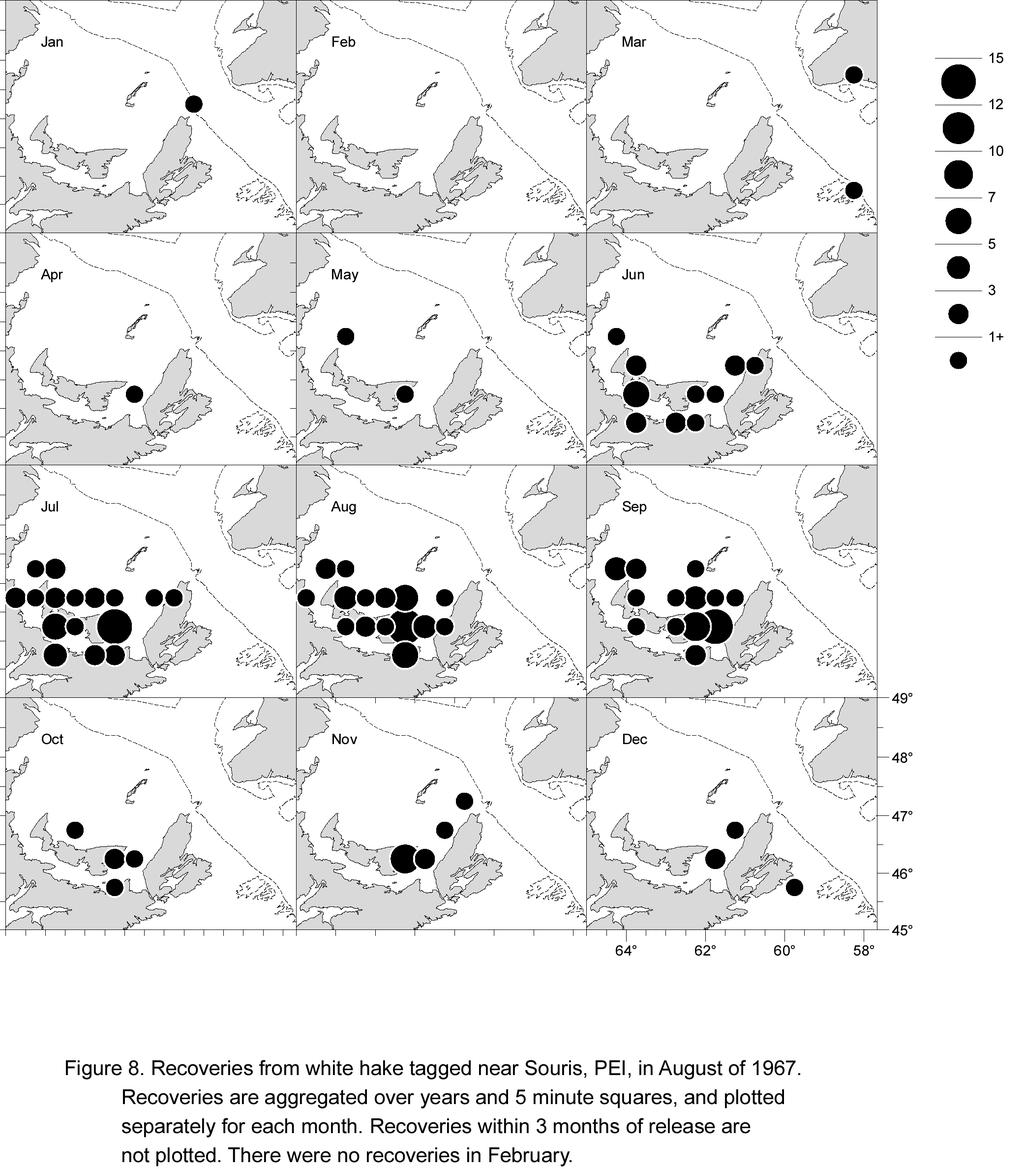
54 40
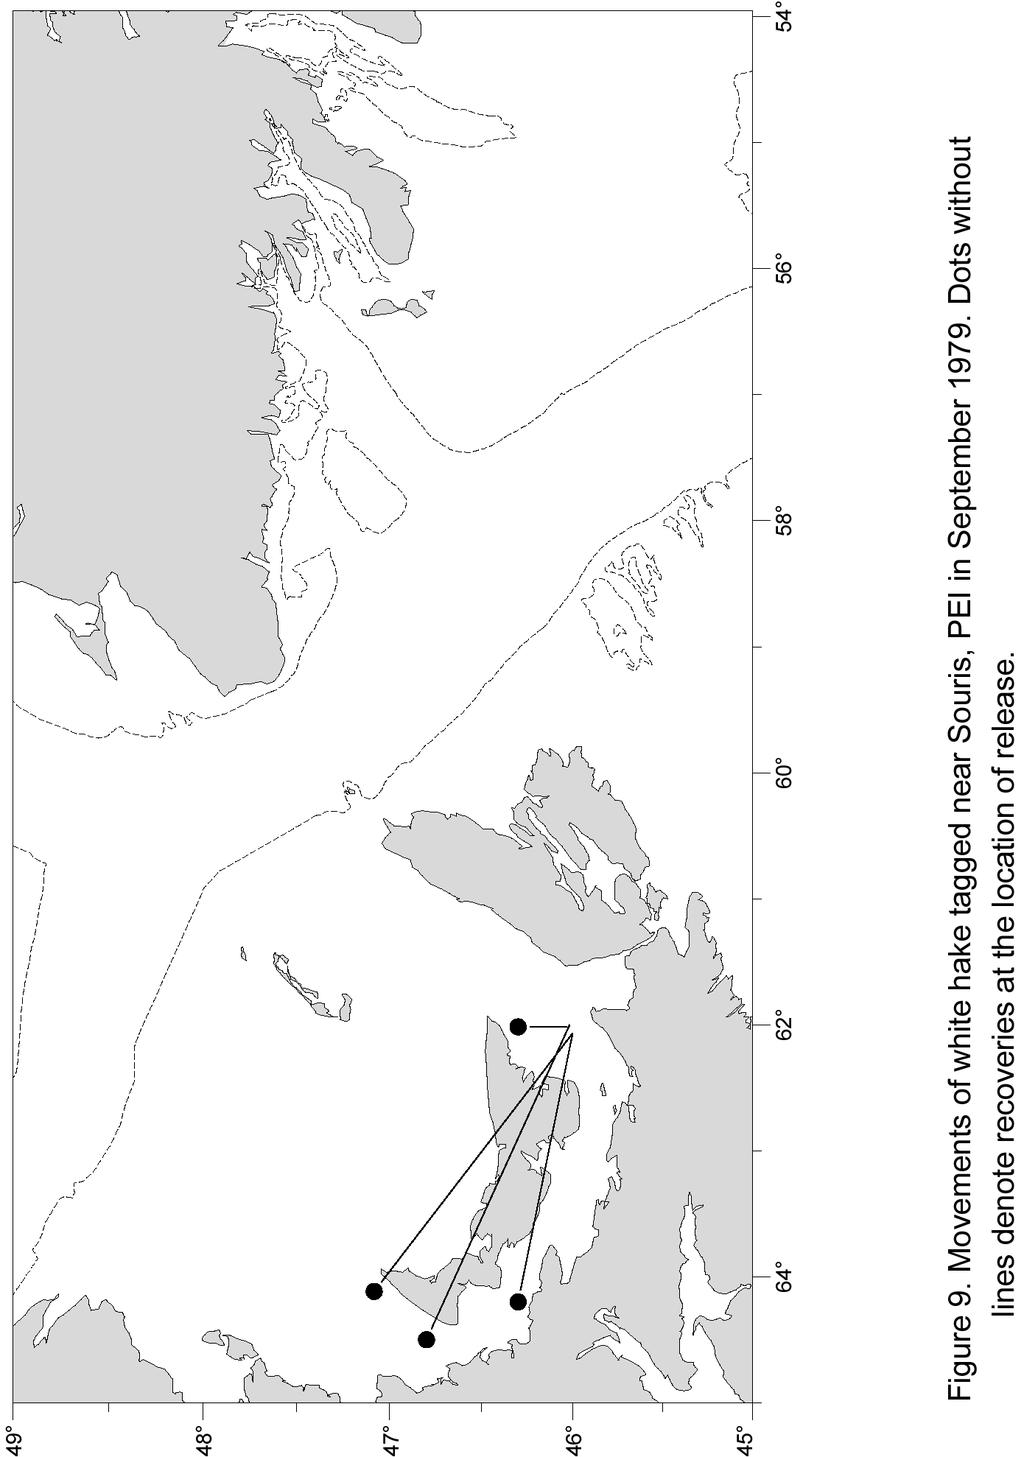
55 41
56 42
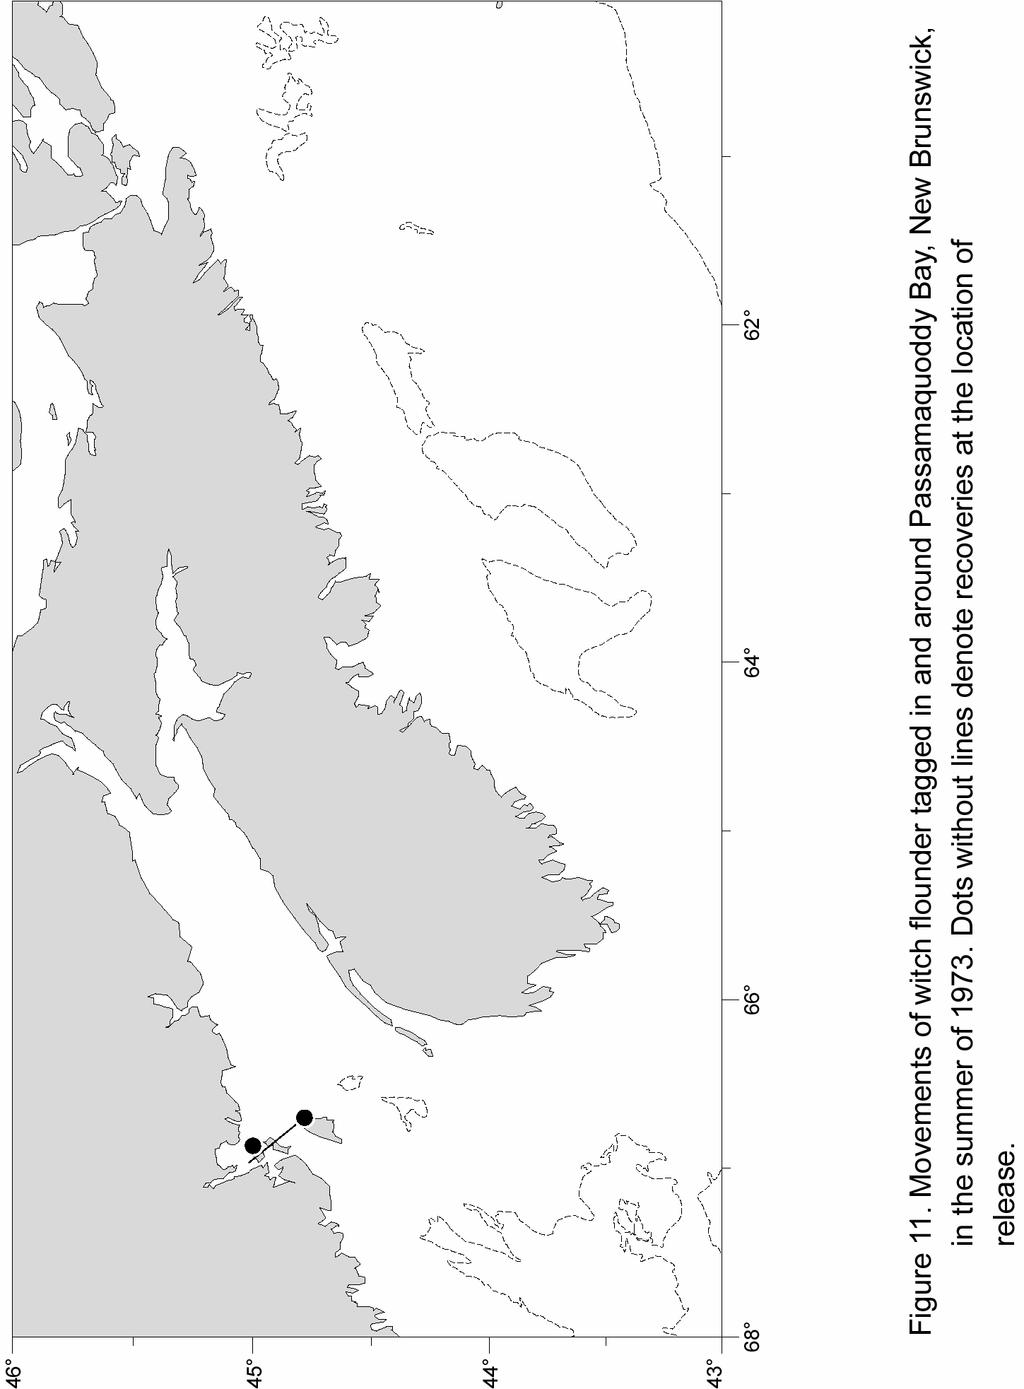
57 43
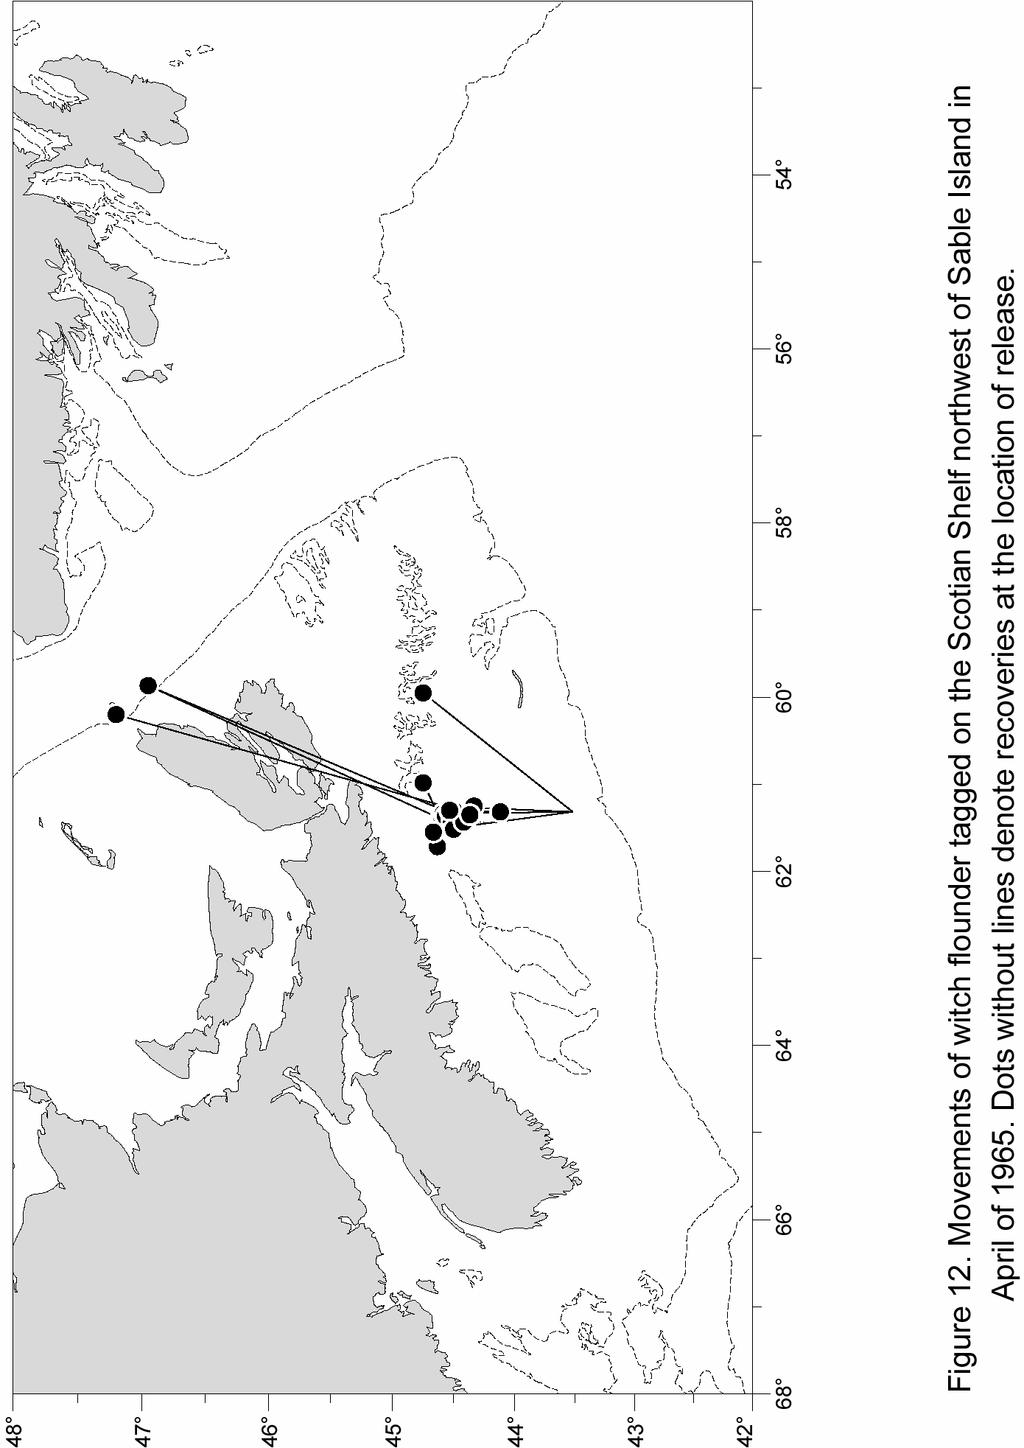
58 44
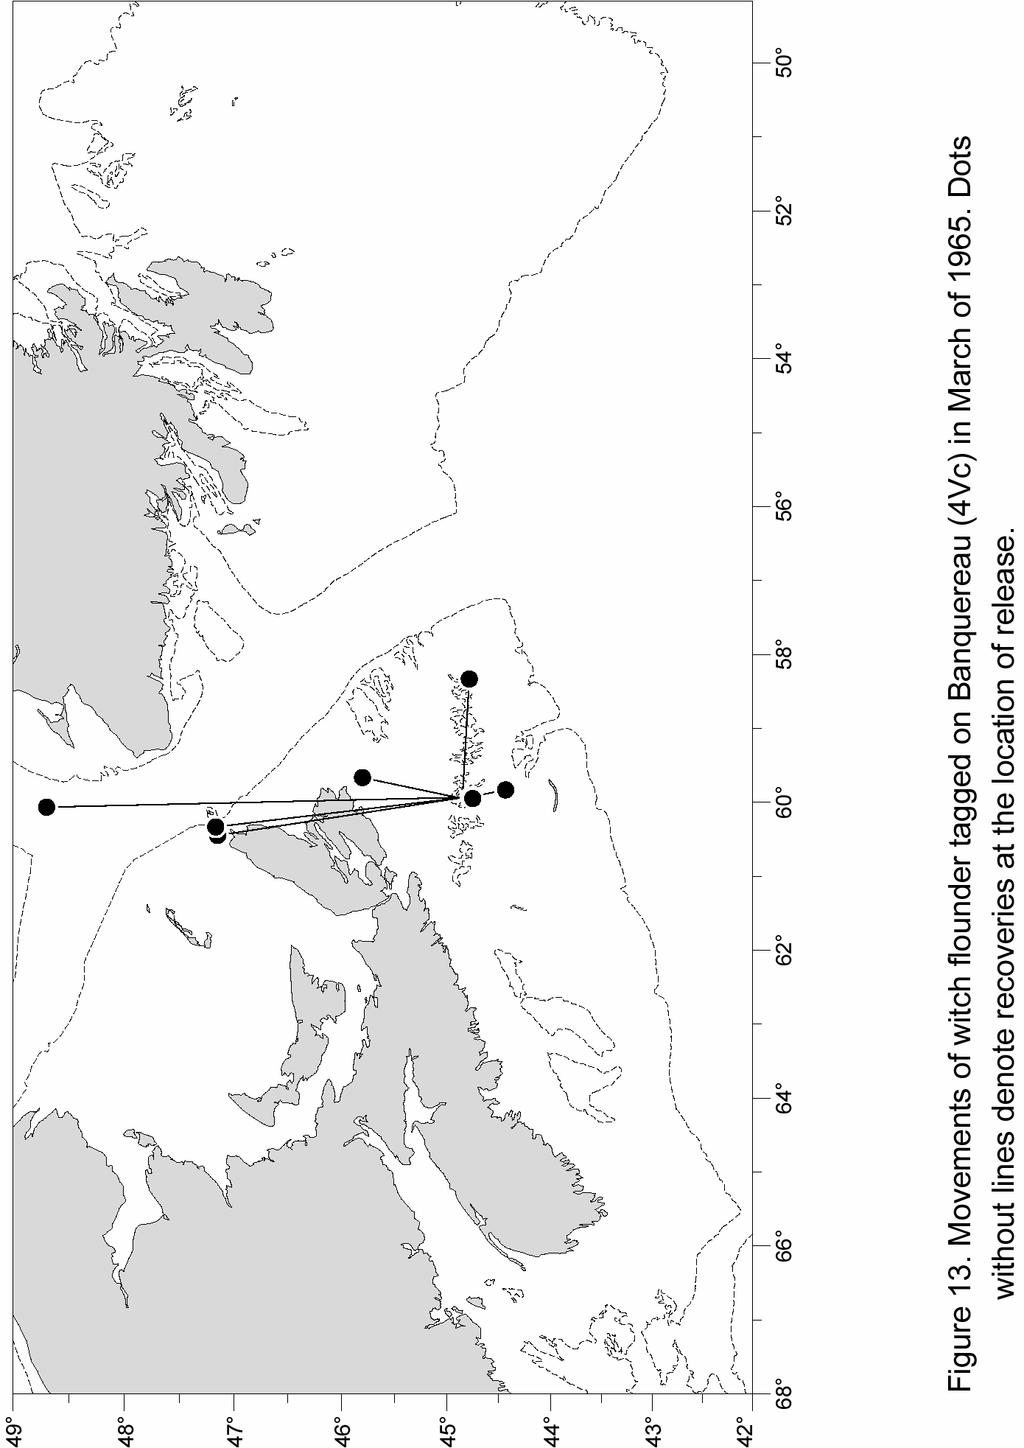
59 45
60 46
61 47
62 48
63 49
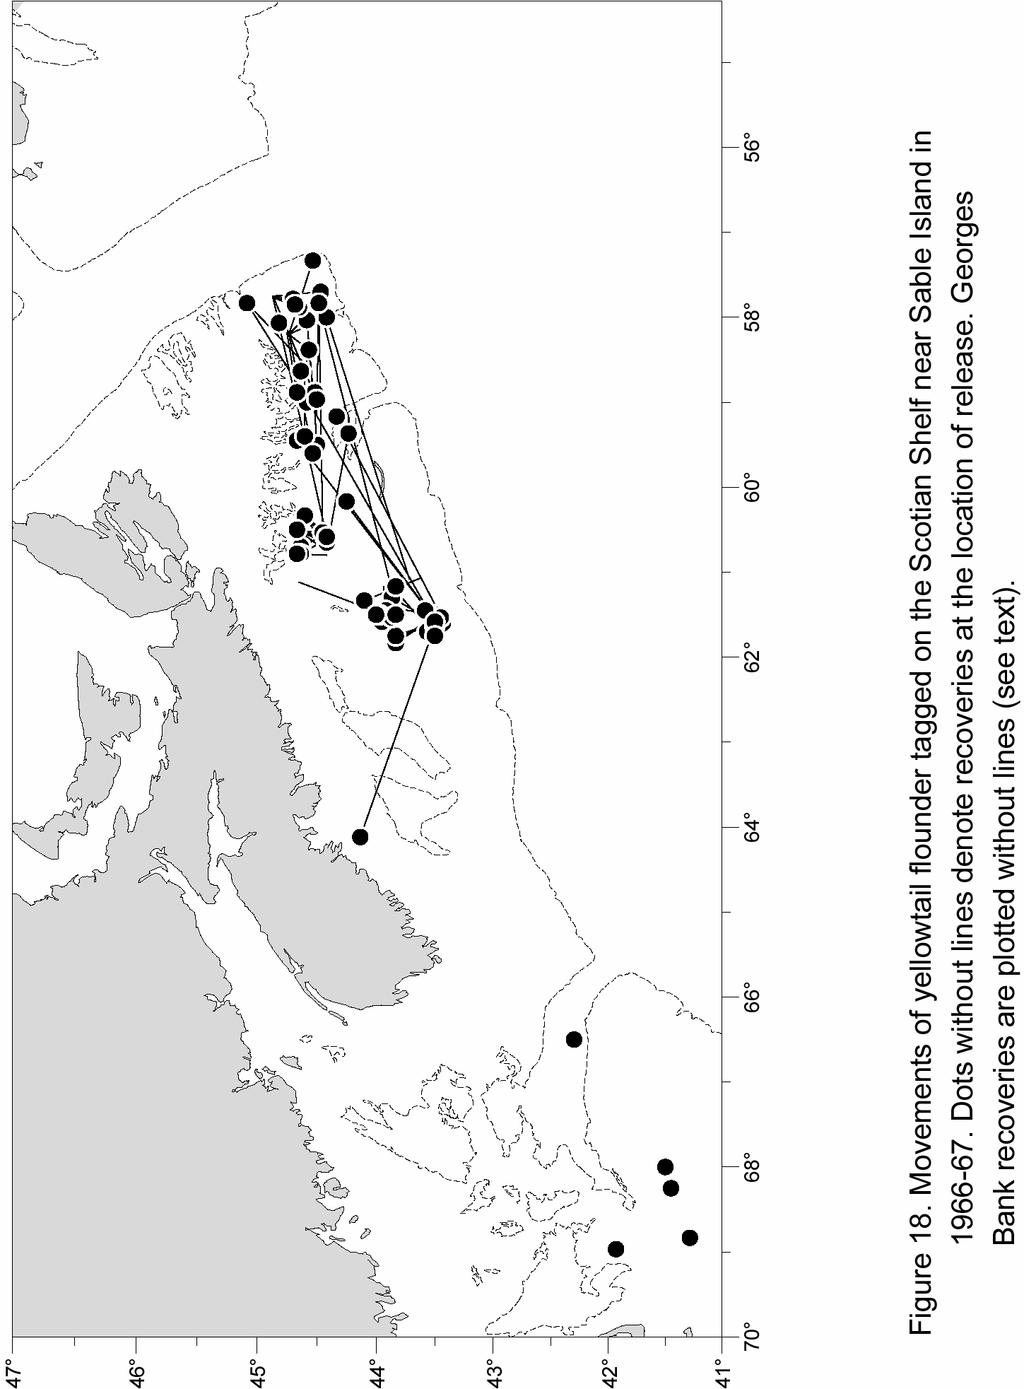
64 50
TAC Reported Landings * - By-catch only
 DFO Atlantic Fisheries Stock Status Report 96/68E 4Vn 3Ps 4W 4Vs EASTERN SCOTIAN SHELF HADDOCK Background Haddock on the eastern Scotian Shelf and southern Gulf of St. Lawrence are considered as a single
Witch Flounder (Divs. 4RST)
") DFO Science Stock Status Report A-() Witch Flounder (Divs. ST) Background 4T 4S Pn 4Vn Ps Witch flounder are found in the deeper waters of the North Atlantic. In the Northwest Atlantic, witch range from
DFO Science Stock Status Report A-() Witch Flounder (Divs. ST) Background 4T 4S Pn 4Vn Ps Witch flounder are found in the deeper waters of the North Atlantic. In the Northwest Atlantic, witch range from
ASSESSMENT OF THE WEST COAST OF NEWFOUNDLAND (DIVISION 4R) HERRING STOCKS IN 2011
 HERRING STOCKS IN 2011") Canadian Science Advisory Secretariat Science Advisory Report 212/24 ASSESSMENT OF THE WEST COAST OF NEWFOUNDLAND (DIVISION 4R) HERRING STOCKS IN 211 Context Figure 1. Map of unit areas of NAFO Division
Canadian Science Advisory Secretariat Science Advisory Report 212/24 ASSESSMENT OF THE WEST COAST OF NEWFOUNDLAND (DIVISION 4R) HERRING STOCKS IN 211 Context Figure 1. Map of unit areas of NAFO Division
HADDOCK ON THE SOUTHERN SCOTIAN SHELF AND IN THE BAY OF FUNDY (DIV. 4X/5Y)
") Canadian Science Advisory Secretariat Science Advisory Report 26/47 HADDOCK ON THE SOUTHERN SCOTIAN SHELF AND IN THE BAY OF FUNDY (DIV. 4X/5Y) Context Haddock (Melanogrammus aeglefinus) are found on both
Canadian Science Advisory Secretariat Science Advisory Report 26/47 HADDOCK ON THE SOUTHERN SCOTIAN SHELF AND IN THE BAY OF FUNDY (DIV. 4X/5Y) Context Haddock (Melanogrammus aeglefinus) are found on both
Witch Flounder (Divs. 4RST)
") Stock Status Report /5 4S 4R Witch Flounder (Divs. 4RST) Background 4T Pn 4Vn Ps Witch flounder are found in the deeper waters of the North Atlantic. In the Northwest Atlantic, witch range from the lower
Stock Status Report /5 4S 4R Witch Flounder (Divs. 4RST) Background 4T Pn 4Vn Ps Witch flounder are found in the deeper waters of the North Atlantic. In the Northwest Atlantic, witch range from the lower
2012 UPDATE OF THE CANADIAN BLUEFIN TUNA FISHERY AND CPUE SERIES
 SCRS/2013/174 Collect. Vol. Sci. Pap. ICCAT, 70(2): 543-555 (2014) 2012 UPDATE OF THE CANADIAN BLUEFIN TUNA FISHERY AND CPUE SERIES A. Hanke 1, I. Andrushchenko, G. Melvin and D. Busawon SUMMARY This document
Southern Gulf of St. Lawrence (4T) Herring
 Herring") Stock Status Report 24/23 Southern Gulf of St. Lawrence (4T) Herring Background Herring are a pelagic species which form schools during feeding and spawning periods. Herring in the southern Gulf of St.
Stock Status Report 24/23 Southern Gulf of St. Lawrence (4T) Herring Background Herring are a pelagic species which form schools during feeding and spawning periods. Herring in the southern Gulf of St.
Southern Gulf of St. Lawrence (4T) Herring
 Herring") Fisheries Pêches and Oceans et Océans DFO Science Stock Status B3-1 (22) Southern Gulf of St. Lawrence (4T) Herring Background Herring are a pelagic species which form schools during feeding and spawning
Fisheries Pêches and Oceans et Océans DFO Science Stock Status B3-1 (22) Southern Gulf of St. Lawrence (4T) Herring Background Herring are a pelagic species which form schools during feeding and spawning
Commercial Bycatch Rates of Shortfin Mako (Isurus oxyrinchus) from Longline Fisheries in the Canadian Atlantic
 from Longline Fisheries in the Canadian Atlantic") ICCAT Working Paper for Shark Stock Assessment Meeting 2008 Commercial Bycatch Rates of Shortfin Mako (Isurus oxyrinchus) from Longline Fisheries in the Canadian Atlantic G.M. Fowler and S.E. Campana Population
ICCAT Working Paper for Shark Stock Assessment Meeting 2008 Commercial Bycatch Rates of Shortfin Mako (Isurus oxyrinchus) from Longline Fisheries in the Canadian Atlantic G.M. Fowler and S.E. Campana Population
S C C S. Research Document 2004/108 Document de recherche 2004/108. R. Branton and G. Black
 C S S Canadian Science dvisory Secretariat S C C S Secrétariat canadien de consultation scientifique Research Document 24/8 Document de recherche 24/8 Not to be cited without Permission of the authors
ASSESSMENT OF HERRING IN THE SOUTHERN GULF OF ST. LAWRENCE (NAFO DIV. 4T)
") Canadian Science Advisory Secretariat Science Advisory Report 27/5 ASSESSMENT OF HERRING IN THE SOUTHERN GULF OF ST. LAWRENCE (NAFO DIV. 4T) Context The stock area for southern Gulf of St. Lawrence herring
Canadian Science Advisory Secretariat Science Advisory Report 27/5 ASSESSMENT OF HERRING IN THE SOUTHERN GULF OF ST. LAWRENCE (NAFO DIV. 4T) Context The stock area for southern Gulf of St. Lawrence herring
Distribution and recruitment of demersal cod (ages 0+, 1+ and 2+) in the coastal zone, NAFO Divisions 3K and 3L
 in the coastal zone, NAFO Divisions 3K and 3L") Citation with Citation par permission of the authors 1 autorisation des auteurs 1 DFO Atlantic Fisheries MPO Peches de l'atlantique Research Document 95/68 Document de recherche 95/68 Distribution and
Citation with Citation par permission of the authors 1 autorisation des auteurs 1 DFO Atlantic Fisheries MPO Peches de l'atlantique Research Document 95/68 Document de recherche 95/68 Distribution and
ASSESSMENT OF THE WEST COAST OF NEWFOUNDLAND (DIVISION 4R) HERRING STOCKS IN 2013
 HERRING STOCKS IN 2013") Canadian Science Advisory Secretariat Quebec Region Science Advisory Report 214/56 ASSESSMENT OF THE WEST COAST OF NEWFOUNDLAND (DIVISION 4R) HERRING STOCKS IN 213 Quebec 4Ra 4S 4R 4Rc 4Rb U.S.A. (Maine)
Canadian Science Advisory Secretariat Quebec Region Science Advisory Report 214/56 ASSESSMENT OF THE WEST COAST OF NEWFOUNDLAND (DIVISION 4R) HERRING STOCKS IN 213 Quebec 4Ra 4S 4R 4Rc 4Rb U.S.A. (Maine)
Southern Gulf of St. Lawrence Herring
 Fisheries Pêches and Oceans et Océans DFO Science Stock Status Report B3-1(2) Background Southern Gulf of St. Lawrence Herring Herring are a pelagic species which form schools during feeding and spawning
ASSESSMENT OF SCALLOPS (PLACOPECTEN MAGELLANICUS) IN SCALLOP FISHING AREA (SFA) 29 WEST OF LONGITUDE 65 30'W
 IN SCALLOP FISHING AREA (SFA) 29 WEST OF LONGITUDE 65 30'W") Canadian Science Advisory Secretariat Science Advisory Report 2013/055 ASSESSMENT OF SCALLOPS (PLACOPECTEN MAGELLANICUS) IN SCALLOP FISHING AREA (SFA) 29 WEST OF LONGITUDE 65 30'W Figure 1. Location of
Canadian Science Advisory Secretariat Science Advisory Report 2013/055 ASSESSMENT OF SCALLOPS (PLACOPECTEN MAGELLANICUS) IN SCALLOP FISHING AREA (SFA) 29 WEST OF LONGITUDE 65 30'W Figure 1. Location of
SA2 + Div. 3K Redfish
 Fisheries and Oceans Pêches et Océans Canada Canada DFO Science Stock Status Report A2-15(21) entered the fishery in 1975 and averaged about 16,5 t from 1978-1986. The steady reduction in catches from
2010 ASSESSMENT OF 4VWX HERRING
 Canadian Science Advisory Secretariat Science Advisory Report 21/38 21 ASSESSMENT OF 4VWX HERRING Context: Figure 1. 4VWX herring management area and stock component locations. In support of scientific
Gulf of St. Lawrence (4RST) Greenland Halibut
 Greenland Halibut") Fisheries and Oceans Science Pêches et Océans Sciences DFO Science Stock Status Report A4-3 () 52 5 48 46 Québec Nouveau-Brunswick Québec 4T 4S 4R 3Pn 4Vn Terre-Neuve 3Ps 3K 3L Gulf of St. Lawrence (4RST)
Fisheries and Oceans Science Pêches et Océans Sciences DFO Science Stock Status Report A4-3 () 52 5 48 46 Québec Nouveau-Brunswick Québec 4T 4S 4R 3Pn 4Vn Terre-Neuve 3Ps 3K 3L Gulf of St. Lawrence (4RST)
2017 CONSERVATION HARVESTING PLAN Atlantic Halibut (4RST) Prince Edward Island fixed gear fleet Less than meters
 Prince Edward Island fixed gear fleet Less than meters") Approved on July 13, 2017 APPLICATION This Conservation Harvesting Plan (CHP) applies to all Prince Edward Island (PEI) fixed gear licence holders fishing Atlantic halibut in NAFO Divisions 4RST with vessels
Approved on July 13, 2017 APPLICATION This Conservation Harvesting Plan (CHP) applies to all Prince Edward Island (PEI) fixed gear licence holders fishing Atlantic halibut in NAFO Divisions 4RST with vessels
Pacific Herring Coded Wire Tagging Study: 2005 Recoveries
 Pacific Herring Coded Wire Tagging Study: 2005 Recoveries L. Flostrand and J.F. Schweigert Fisheries and Oceans Canada Science Branch, Pacific Region Pacific Biological Station Nanaimo, British Columbia
THORNY SKATE IN DIVISIONS 3L, 3N, 3O AND SUBDIVISION 3Ps
 Newfoundland and Labrador Region Stock Status Report 2003/023 stomachs of skate captured in the vicinity of commercial fisheries. THORNY SKATE IN DIVISIONS 3L, 3N, 3O AND SUBDIVISION 3Ps Background There
The Emerging View of New England Cod Stock Structure
 Cod Population Structure and New England Fisheries Symposium: Furthering our understanding by integrating knowledge gained through science and fishing Putting it All Together: The Emerging View of New
Year Avg. TAC Can Others Totals
 SKATE IN DIVISIONS 3L, 3N, 3O AND SUBDIVISION 3Ps Background There are 8 to 1 species of skate in the waters around Newfoundland. Of these, thorny skate (Raja radiata) is by far the most common, comprising
NEWFOUNDLAND AND LABRADOR REGION GROUNDFISH STOCK UPDATES
 Stock Status Report 24/47 NEWFOUNDLAND AND LABRADOR REGION GROUNDFISH STOCK UPDATES Background In Newfoundland and Labrador, Science Branch of the Department of Fisheries and Oceans is responsible, either
West Coast of Newfoundland Atlantic Herring (Division 4R)
") DFO Science Stock Status Report B-1 5 59 5 57 QUEBEC LOWER NORTH SHORE 51 Meters Ra STRAIT OF BELLE NEW FEROLLE ST. JOHN'S BAY POINT RICHE West Coast of Newfoundland Atlantic Herring (Division R) 5 BEAUGE
DFO Science Stock Status Report B-1 5 59 5 57 QUEBEC LOWER NORTH SHORE 51 Meters Ra STRAIT OF BELLE NEW FEROLLE ST. JOHN'S BAY POINT RICHE West Coast of Newfoundland Atlantic Herring (Division R) 5 BEAUGE
A Combined Recruitment Index for Demersal Juvenile Cod in NAFO Divisions 3K and 3L
 NAFO Sci. Coun. Studies, 29: 23 29 A Combined Recruitment Index for Demersal Juvenile Cod in NAFO Divisions 3K and 3L David C. Schneider Ocean Sciences Centre, Memorial University St. John's, Newfoundland,
Cod in the Northern Gulf of St. Lawrence
 DFO Sciences Stock Status Report A4-1 (1998) 52. 51. 5. Latitude 49. 48. 47. 4S 4R 3Pn Background Cod in the northern Gulf of (Divisions 3Pn, 4RS) undertake distant annual migrations. In winter, the fish
NEWFOUNDLAND REGION GROUNDFISH OVERVIEW
 DFO Science Stock Status Report A2-19 (1998) NEWFOUNDLAND REGION GROUNDFISH OVERVIEW Background In Newfoundland, Science Branch of the Department of Fisheries and Oceans is responsible, either directly
ANNUAL MEETING - JUNE Distribution and abundance of witch flounder (Glyptoce halus cynoglossus) 1n ubarea an 1V1Slons n re a lon 0 e 1$ ery
 1n ubarea an 1V1Slons n re a lon 0 e 1$ ery") International Commission for II the NOT TO BE CITED WITHOUT frior REfiRENCE TO TIlE AUTHOR(S) Northwest Atlantic Fisheries Serial No. 5383 ICNAF Res. Doc. 79/VI/44 ANNUAL MEETING - JUNE 1979 Distribution
International Commission for II the NOT TO BE CITED WITHOUT frior REfiRENCE TO TIlE AUTHOR(S) Northwest Atlantic Fisheries Serial No. 5383 ICNAF Res. Doc. 79/VI/44 ANNUAL MEETING - JUNE 1979 Distribution
Gulf of St. Lawrence (4RST) Greenland Halibut in 2003
 Greenland Halibut in 2003") Fisheries and Oceans Canada Science Pêches et Océans Canada Sciences Stock Status Report 2004/014 52 50 48 46 Québec Nouveau-Brunswick Québec 4T 4S 4R 3Pn 4Vn Terre-Neuve 3Ps 3K 3L Background Greenland
Fisheries and Oceans Canada Science Pêches et Océans Canada Sciences Stock Status Report 2004/014 52 50 48 46 Québec Nouveau-Brunswick Québec 4T 4S 4R 3Pn 4Vn Terre-Neuve 3Ps 3K 3L Background Greenland
Map Showing NAFO Management Units
 Map Showing NAFO Management Units Unique biological characteristics dark coloration on both sides compared to almost all other flatfish species left eye not fully migrated giving it an unusually wide
Map Showing NAFO Management Units
 Map Showing NAFO Management Units Biology Are 6 species of seals in Atlantic Canadian waters, all of which occur in Newfoundland Two Arctic Species (Ringed, Bearded) Two temperate (Grey, Harbour) Two migratory
INFORMATION ON FISHING EFFORT IN THE NRA FOR 2006 By George Campanis NAFO Secretariat
 NOT TO BE CITED WITHOUT PRIOR REFERENCE TO THE AUTHOR(S) Northwest Atlantic Fisheries Organization Serial No. N5400 NAFO SCR Doc. 07/48 INFORMATION ON FISHING EFFORT IN THE NRA FOR 2006 By George Campanis
NORTHWEST SCIENCE AND INFORMATION
 Science and Information Branch NORTHWEST SCIENCE AND INFORMATION Aquatics Update 2002-1 Fall Walleye Index Netting (FWIN) and Trap Netting Summary for Niobe Lake, 2000 by T. Cano Introduction Since 1981,
Eastern and South Shore Nova Scotia Lobster LFAs The Fishery. DFO Atlantic Fisheries Stock Status Report 96/117E.
 Maritimes Region DFO Atlantic Fisheries Stock Status Report 96/117E Eastern and South Shore Nova Scotia Lobster LFAs 31-33 Background Lobsters first entering the fishery in LFAs 31, 32, and 33 are probably
A Preliminary Report of Research Results. SRSF Research Report #5. Prepared by
 An Interdisciplinary Study of St. Georges Bay Fish Harvesters Ecological Knowledge: White Hake (Urophycis tenuis) Predation on Juvenile American Lobster (Homarus americanus). Phase II A Preliminary Report
SCIENTIFIC COUNCIL MEETING - JUNE Polish Research Report, by A. J. Paciorkowski Sea Fisheries Institute Gdynia Poland.
 NOT TO BE CITED WITHOUT PRIOR REFERENCE TO THE,SECRETARIAT Northwest Atlantic Fisheries Organization Serial No. N17 NAFO SCS Doc. 80/VI/ SCIENTIFIC COUNCIL MEETING JUNE 1980 Polish Research Report, 1979
STOCK STATUS REPORT LAURENTIAN REGION. Maurice Lamontagne Institute P.O. Box 1000, Mont-Joli, Québec, G5H 3Z4, CANADA
 STOCK STATUS REPORT LAURENTIAN REGION Maurice Lamontagne Institute P.O. Box 1000, Mont-Joli, Québec, G5H 3Z4, CANADA DFO, Atlantic Fisheries, June 199 6 CAPELIN IN THE GULF OF ST. LAWRENC E BIOLOGY The
Framework Adjustment 56. to the. Northeast Multispecies FMP
 to the Northeast Multispecies FMP Calculation of Northeast Multispecies Annual Catch Limits, FY 2017 FY II-1 II-2 This appendix documents the calculation of Northeast Multispecies Overfishing Levels (OFLs),
ATLANTIC SALMON NEWFOUNDLAND AND LABRADOR, SALMON FISHING AREAS 1-14B. The Fisheries. Newfoundland Region Stock Status Report D2-01
 Fisheries Pêches and Oceans et Océans DFO Science Newfoundland Region Stock Status Report D2-01 ATLANTIC SALMON NEWFOUNDLAND AND LABRADOR, SALMON FISHING AREAS 1-14B Background There are 15 Atlantic salmon
Estimation of gillnet selectivity for Atlantic herring (Clupea harengus harengus L.) from the west coast of Newfoundland,
 from the west coast of Newfoundland,") Estimation of gillnet selectivity for Atlantic herring (Clupea harengus harengus L.) from the west coast of Newfoundland, 1997-2001 F. Grégoire and L. Lefebvre Department of Fisheries and Oceans Science
Estimation of gillnet selectivity for Atlantic herring (Clupea harengus harengus L.) from the west coast of Newfoundland, 1997-2001 F. Grégoire and L. Lefebvre Department of Fisheries and Oceans Science
Fishery Stock Status Fishing Mortality
 Northeast Groundfish Interim Findings: Ecological Indicators Version: February 2014 Fishery Stock Status Fishing Mortality This indicator measures the rate at which fishing removed fish each stock. This
Nancy E. Kohler, Danielle Bailey, Patricia A. Turner, and Camilla McCandless SEDAR34-WP-25. Submitted: 10 June 2013
 Mark/Recapture Data for the Atlantic Sharpnose Shark (Rhizoprionodon terranovae), in the Western North Atlantic from the NEFSC Cooperative Shark Tagging Program Nancy E. Kohler, Danielle Bailey, Patricia
ICES Advice on fishing opportunities, catch, and effort Celtic Seas and Greater North Sea ecoregions Published 30 June 2016
 ICES Advice on fishing opportunities, catch, and effort Celtic Seas and Greater North Sea ecoregions Published 30 June 2016 5.3.57 Sea bass (Dicentrarchus labrax) in divisions 4.b c, 7.a, and 7.d h (central
Plaice (Pleuronectes platessa) in Division 7.e (western English Channel)
 in Division 7.e (western English Channel)") Celtic Seas and Greater North Sea ecoregions Published 30 June 2016 Version 2: 15 May 2017 5.3.51 Plaice (Pleuronectes platessa) in Division 7.e (western English Channel) ICES stock advice ICES advises
Celtic Seas and Greater North Sea ecoregions Published 30 June 2016 Version 2: 15 May 2017 5.3.51 Plaice (Pleuronectes platessa) in Division 7.e (western English Channel) ICES stock advice ICES advises
Atlantic Mackerel of the Northwest Atlantic
 Fisheries and Oceans Canada Science Pêches et Océans Canada Sciences DFO Science Laurentian Region Stock Status Report B4-4 (21) CANADA Labrador Atlantic Mackerel of the Northwest Atlantic Background In
SCALLOP FISHERY AREA/TIME CLOSURE TO PROTECT COD SPAWNING AGGREGATIONS IN 5Z (GEORGES BANK)
") Canadian Science Advisory Secretariat Maritimes Region Science Response 2014/023 SCALLOP FISHERY AREA/TIME CLOSURE TO PROTECT COD SPAWNING AGGREGATIONS IN 5Z (GEORGES BANK) Context The requirement to account
Canadian Science Advisory Secretariat Maritimes Region Science Response 2014/023 SCALLOP FISHERY AREA/TIME CLOSURE TO PROTECT COD SPAWNING AGGREGATIONS IN 5Z (GEORGES BANK) Context The requirement to account
Capelin in the Estuary and Gulf of St. Lawrence
 DFO Sciences Stock Status Report B4-3 DIVISIONS ST ESTUARY AND GULF OF ST. LAWRENCE Capelin in the Estuary and Gulf of St. Lawrence P.E.I FOUNDLAND Background The capelin fishery in the Estuary and Gulf
SMOOTH HAMMERHEAD SHARK (HHS)
") SMOOTH HAMMERHEAD SHARK (HHS) (Sphyrna zygaena) HHS1 1. FISHERY SUMMARY Smooth hammerhead sharks (Sphyrna zygaena) are not currently managed under the QMS. No assigned fishing allowances exist. However,
SMOOTH HAMMERHEAD SHARK (HHS) (Sphyrna zygaena) HHS1 1. FISHERY SUMMARY Smooth hammerhead sharks (Sphyrna zygaena) are not currently managed under the QMS. No assigned fishing allowances exist. However,
Eastern Scotian Shelf Haddock (Div. 4TVW)
") Stock Status Report A3-6(22) 4T 4Vn 3Pn 3Ps Background Eastern Scotian Shelf Haddock (Div. 4TVW) 4W 4Vs The haddock (Melanogrammus aeglefinus) resource on the eastern Scotian Shelf and southern Gulf of
Stock Status Report A3-6(22) 4T 4Vn 3Pn 3Ps Background Eastern Scotian Shelf Haddock (Div. 4TVW) 4W 4Vs The haddock (Melanogrammus aeglefinus) resource on the eastern Scotian Shelf and southern Gulf of
SCTB16 Working Paper FTWG 5
 0 SCTB16 Working Paper FTWG 5 Fishery-related attributes associated with FAD and log fishing practices conducted by the U.S. purse seine fleet in the central-western Pacific Ocean, 1997 2002. Al Coan Jr.
Why has the cod stock recovered in the North Sea?
 Why has the cod stock recovered in the North Sea? Summary The expansion of European fisheries during the 1970s and 1980s resulted in high fishing pressure on stocks of cod, haddock, whiting and saithe
SHRIMP OF THE ESTUARY AND GULF OF ST. LAWRENCE IN 2004
 Canadian Science Advisory Secretariat Science Advisory Report 25/35 SHRIMP OF THE ESTUARY AND GULF OF ST. LAWRENCE IN 24 Figure 1: Shrimp fishing areas in the Estuary and the Gulf of St. Lawrence. Context
New England Fishery Management Council
 FOR IMMEDIATE RELEASE December 7, 2017 PRESS CONTACT: Janice Plante (607) 592-4817, jplante@nefmc.org Council Approves Groundfish Framework 57 With Annual Catch Limits, Halibut/Southern Windowpane AMs,
ICES WGCSE REPORT
 ICES WGCSE REPORT 2009 291 6 Irish Sea 6.1 Area overview Description of fisheries Fishing effort and vessel numbers within the Irish Sea have declined in recent years by around 28% and 15% respectively
Serial No. N4859 NAFO SCR Doc. 03/41 SCIENTIFIC COUNCIL MEETING JUNE 2003
 NOT TO BE CITED WITHOUT PRIOR REFERENCE TO THE AUTHOR(S) Northwest Atlantic Fisheries Organization Serial No. N4859 NAFO SCR Doc. 03/41 SCIENTIFIC COUNCIL MEETING JUNE 2003 Results of a Greenland Halibut
Habitat Omnibus Amendment DEIS draft sections relative to recreational fishery DRAFT. Omnibus Essential Fish Habitat Amendment 2
 DRAFT Omnibus Essential Fish Habitat Amendment 2 Amendment 14 to the Northeast Multispecies FMP Amendment 14 to the Atlantic Sea Scallop FMP Amendment 4 to the Monkfish FMP Amendment 3 to the Atlantic
2015 STOCK STATUS UPDATE OF LOBSTER (HOMARUS AMERICANUS) IN THE BAY OF FUNDY (LOBSTER FISHING AREAS 35-38)
 IN THE BAY OF FUNDY (LOBSTER FISHING AREAS 35-38)") Canadian Science Advisory Secretariat Maritimes Region Science Response 2015/030 2015 STOCK STATUS UPDATE OF LOBSTER (HOMARUS AMERICANUS) IN THE BAY OF FUNDY (LOBSTER FISHING AREAS 35-38) Context The status
Canadian Science Advisory Secretariat Maritimes Region Science Response 2015/030 2015 STOCK STATUS UPDATE OF LOBSTER (HOMARUS AMERICANUS) IN THE BAY OF FUNDY (LOBSTER FISHING AREAS 35-38) Context The status
Note on the yearly catches by country and gear of the FISM (France Ivory Coast Senegal - Morocco) fleet during the period
 fleet during the period") Document SCRS/28/181 Note on the yearly catches by country and gear of the FISM (France Senegal - Morocco) fleet during the 1969-199 period 1. Introduction E. Chassot 1, A. Fonteneau 2, R. Pianet 3, P.
Document SCRS/28/181 Note on the yearly catches by country and gear of the FISM (France Senegal - Morocco) fleet during the 1969-199 period 1. Introduction E. Chassot 1, A. Fonteneau 2, R. Pianet 3, P.
Annual Pink Shrimp Review
 Annual Pink Shrimp Review Oregon Department of Fish and Wildlife ODFW Marine Region, Marine Science Dr., Bldg. #3, Newport, OR 97365 (503) 867-4741 TO: FROM: OREGON SHRIMP INDUSTRY BOB HANNAH, PINK SHRIMP
INTERNATIONAL COMMISSION FOR THE NORTHWEST ATLANTIC FISHERIES RESTRICTED. ICNAF Res. Doc Serial No (D. c. 9) ANNUAL MEETING - JUNE 1966
 ANNUAL MEETING - JUNE 1966") RESTRICTED INTERNATIONAL COMMISSION FOR THE NORTHWEST ATLANTIC FISHERIES Serial No. 1669 (D. c. 9) ICNAF Res. Doc. 66-60 ANNUAL MEETING - JUNE 1966 Changes in the Atlantic halibut fishery (Hippoglossus
RESTRICTED INTERNATIONAL COMMISSION FOR THE NORTHWEST ATLANTIC FISHERIES Serial No. 1669 (D. c. 9) ICNAF Res. Doc. 66-60 ANNUAL MEETING - JUNE 1966 Changes in the Atlantic halibut fishery (Hippoglossus
ICES advises that when the MSY approach is applied, catches in 2019 should be no more than tonnes.
 Advice on fishing opportunities, catch, and effort Celtic Seas, Greater North Sea, and Oceanic Northeast Atlantic ecoregions Published 29 June 2018 Version 2: 4 September 2018 https://doi.org/10.17895/ices.pub.4487
Evaluating the Influence of R3 Treatments on Fishing License Sales in Pennsylvania
 Evaluating the Influence of R3 Treatments on Fishing License Sales in Pennsylvania Prepared for the: Pennsylvania Fish and Boat Commission Produced by: PO Box 6435 Fernandina Beach, FL 32035 Tel (904)
ICES Advice on fishing opportunities, catch, and effort Celtic Seas and Greater North Sea Ecoregions Published 24 October 2017
 ICES Advice on fishing opportunities, catch, and effort Celtic Seas and Greater North Sea Ecoregions Published 24 October 2017 DOI: 10.17895/ices.pub.3334 Seabass (Dicentrarchus labrax) in divisions 4.b
New England Fishery Management Council MEMORANDUM
 New England Fishery Management Council 50 WATER STREET NEWBURYPORT, MASSACHUSETTS 01950 PHONE 978 465 0492 FAX 978 465 3116 John Pappalardo, Chairman Paul J. Howard, Executive Director MEMORANDUM DATE:
Mackerel (Scomber scombrus) in subareas 1 8 and 14, and in Division 9.a (the Northeast Atlantic and adjacent waters)
 in subareas 1 8 and 14, and in Division 9.a (the Northeast Atlantic and adjacent waters)") ICES Advice on fishing opportunities, catch, and effort Ecoregions in the Northeast Atlantic and Arctic Ocean Published 29 September 2017 DOI: 10.17895/ices.pub.3023 Mackerel (Scomber scombrus) in subareas
ICES Advice on fishing opportunities, catch, and effort Ecoregions in the Northeast Atlantic and Arctic Ocean Published 29 September 2017 DOI: 10.17895/ices.pub.3023 Mackerel (Scomber scombrus) in subareas
Cedar Lake Comprehensive Survey Report Steve Hogler and Steve Surendonk WDNR-Mishicot
 Cedar Lake- 2006 Comprehensive Survey Report Steve Hogler and Steve Surendonk WDNR-Mishicot ABSTRACT Cedar Lake is a 142 acre lake located in the southwest corner of Manitowoc County. It is a seepage lake
Commercial Bycatch Rates of Blue Shark (Prionace glauca) from Longline Fisheries in the Canadian Atlantic
 from Longline Fisheries in the Canadian Atlantic") ICCAT Working Paper for Shark Stock Assessment Meeting 2008 Commercial Bycatch Rates of Blue Shark (Prionace glauca) from Longline Fisheries in the Canadian Atlantic G.M. Fowler and S.E. Campana Population
ICCAT Working Paper for Shark Stock Assessment Meeting 2008 Commercial Bycatch Rates of Blue Shark (Prionace glauca) from Longline Fisheries in the Canadian Atlantic G.M. Fowler and S.E. Campana Population
Haddock (Melanogrammus aeglefinus) in divisions 7.b k (southern Celtic Seas and English Channel)
 in divisions 7.b k (southern Celtic Seas and English Channel)") ICES Advice on fishing opportunities, catch, and effort Celtic Seas, Greater North Sea, and Oceanic Northeast Atlantic ecoregions Published 29 June 2018 https://doi.org/10.17895/ices.pub.4453 Haddock (Melanogrammus
ICES Advice on fishing opportunities, catch, and effort Celtic Seas, Greater North Sea, and Oceanic Northeast Atlantic ecoregions Published 29 June 2018 https://doi.org/10.17895/ices.pub.4453 Haddock (Melanogrammus
Preliminary analysis of yellowfin tuna catch, effort, size and tagging data using an integrated age-structured model
 Preliminary analysis of yellowfin tuna catch, effort, size and tagging data using an integrated age-structured model Introduction John Hampton Secretariat of the Pacific Community Noumea, New Caledonia
Groundfish Operational Assessments 2017 Overview
 Groundfish Operational Assessments 2017 Overview Northeast Fisheries Science Center http://www.nefsc.noaa.gov/groundfish/operational-assessments-2017/ Summary Presentation Operational Assessment Process
STOCK STATUS OF SOUTHERN BLUEFIN TUNA
 7 th Expert Consultation on Indian Ocean Tunas, Victoria, Seychelles, 9-14 November, 1998 STOCK STATUS OF SOUTHERN BLUEFIN TUNA Tsuji, S. 1 Introduction The Commission for the Conservation of Southern
Shrimp of the Estuary and the Gulf of St. Lawrence
 DFO Science Stock Status Report C4-6 54 52 North Shore Latitude 5 48 12 New Brunswick 1 Gaspé Peninsula Anticosti P.E.I. 9 8 Newfoundland Shrimp of the Estuary and the Gulf of St. Lawrence 46 44 Nova Scotia
The fishery for jack mackerel in the Eastern Central Pacific by European trawlers in 2008 and 2009
 Eighth International Meeting: SWG: Jack Mackerel Sub-Group SP-08-SWG-JM-01 The fishery for jack mackerel in the Eastern Central Pacific by European trawlers in 2008 and 2009 Ad Corten Corten Marine Research
Fisheries and Oceans Canada. Pêches et Océans Canada Science. Sciences
 Fisheries and Oceans Canada Pêches et Océans Canada Science Sciences A T L A N T I C G R O U N D F I S H 2 A T L A N T I C G R O U N D F I S H 2 Atlantic Groundfish Groundfish so-called because they generally
WORKING GROUP ON STOCK ASSESSMENTS 5 TH MEETING DOCUMENT SAR-5-08 TARGET SIZE FOR THE TUNA FLEET IN THE EASTERN PACIFIC OCEAN
 INTER-AMERICAN TROPICAL TUNA COMMISSION COMISIÓN INTERAMERICANA DEL ATÚN TROPICAL WORKING GROUP ON STOCK ASSESSMENTS 5 TH MEETING LA JOLLA, CALIFORNIA (USA) 11-13 MAY 2004 DOCUMENT SAR-5-08 TARGET SIZE
Southern Gulf of St. Lawrence Sea Scallop
 DFO Science Stock Status Report C3-16 (1998) 21 22 23 24 Southern Gulf of St. Lawrence Sea Scallop Background The sea scallop (Placopecten magellanicus), is a bivalve mollusc found only in the north-western
Atlantic Salmon Inner Bay of Fundy SFA 22 & part of SFA 23
 Fisheries Pêches and Oceans et Océans DFO Science Maritimes Region Stock Status Report D3-12 Atlantic Salmon Inner Bay of Fundy Background Atlantic salmon (Salmo salar) of the inner Bay of Fundy rivers
Dauphin Lake Fishery. Status of Walleye Stocks and Conservation Measures
 Dauphin Lake Fishery Status of Walleye Stocks and Conservation Measures Date: December, 21 Dauphin Lake Fishery Status of Walleye Stocks and Conservation Measures Background: Walleye stocks in Dauphin
SOUTH PACIFIC COMMISSION. TWENTY-SECOND REGIONAL TECHNICAL MEETING ON FISHERIES (Noumea, New Caledonia, 6-10 August 1990)
") Page 1 ORIGINAL : ENGLISH SOUTH PACIFIC COMMISSION TWENTY-SECOND REGIONAL TECHNICAL MEETING ON FISHERIES (Noumea, New Caledonia, 6-10 August 1990) STOCK STATUS OF SKIPJACK TUNA IN THE WESTERN TROPICAL
Page 1 ORIGINAL : ENGLISH SOUTH PACIFIC COMMISSION TWENTY-SECOND REGIONAL TECHNICAL MEETING ON FISHERIES (Noumea, New Caledonia, 6-10 August 1990) STOCK STATUS OF SKIPJACK TUNA IN THE WESTERN TROPICAL
12. School travel Introduction. Part III Chapter 12. School travel
 12. School travel 12.1 Introduction This chapter presents the evidence on changes in travel patterns for the journey to school in the three towns over the period of the Sustainable Travel Town project.
Estimating Proportion of Large Salmon on Harry s River, Newfoundland Using a DIDSON Acoustic Camera
 Estimating Proportion of Large Salmon on Harry s River, Newfoundland Using a DIDSON Acoustic Camera Geoff Veinott and Don Caines Science Branch Department of Fisheries and Oceans P.O. Box 5667 St. John
Canadian Science Advisory Secretariat Gulf Region Science Advisory Report 2016/036
 Canadian Science Advisory Secretariat Gulf Region Science Advisory Report 2016/036 ASSESSMENT OF THE SOUTHERN GULF OF ST. LAWRENCE (NAFO DIV. 4T) SPRING AND FALL SPAWNER COMPONENTS OF ATLANTIC HERRING
Update on Selected Scallop Production Areas (SPA s) in the Bay of Fundy
 in the Bay of Fundy") DFO Science Stock Status Report C3-63(2000) Areas (SPA s) in the Bay of Fundy SPA 1 Inner/Upper Bay of Fundy... 4 SPA 2 Southwest Bank... 7 SPA 3 Brier Island/Lurcher Shoal, St. Mary s Bay... 8 SPA 5 Annapolis
DFO Science Stock Status Report C3-63(2000) Areas (SPA s) in the Bay of Fundy SPA 1 Inner/Upper Bay of Fundy... 4 SPA 2 Southwest Bank... 7 SPA 3 Brier Island/Lurcher Shoal, St. Mary s Bay... 8 SPA 5 Annapolis
LOBSTER (HOMARUS AMERICANUS) OFF THE ATLANTIC COAST OF NOVA SCOTIA (LOBSTER FISHING AREAS 27-33): 2017 STOCK STATUS UPDATE
 OFF THE ATLANTIC COAST OF NOVA SCOTIA (LOBSTER FISHING AREAS 27-33): 2017 STOCK STATUS UPDATE") Canadian Science Advisory Secretariat Science Response 2017/026 LOBSTER (HOMARUS AMERICANUS) OFF THE ATLANTIC COAST OF NOVA SCOTIA (LOBSTER FISHING AREAS 27-33): 2017 STOCK STATUS UPDATE Context The scientific
Canadian Science Advisory Secretariat Science Response 2017/026 LOBSTER (HOMARUS AMERICANUS) OFF THE ATLANTIC COAST OF NOVA SCOTIA (LOBSTER FISHING AREAS 27-33): 2017 STOCK STATUS UPDATE Context The scientific
DECISION DOCUMENT. Framework Adjustment 53. Council Meeting November 17-20, for. to the Northeast Multispecies. Fishery Management Plan (FMP)
") DECISION DOCUMENT for Framework Adjustment 53 to the Northeast Multispecies Fishery Management Plan (FMP) Council Meeting November 17-20, 2014 Framework 53 Decision Document 1 November 2014 NEFMC Meeting
DECISION DOCUMENT for Framework Adjustment 53 to the Northeast Multispecies Fishery Management Plan (FMP) Council Meeting November 17-20, 2014 Framework 53 Decision Document 1 November 2014 NEFMC Meeting
Gulf of Maine Research Institute Responsibly Harvested Seafood from the Gulf of Maine Region Report on Atlantic Sea Scallops (Inshore Canada)
") Gulf of Maine Research Institute Responsibly Harvested Seafood from the Gulf of Maine Region Report on Atlantic Sea Scallops (Inshore Canada) The fishery is managed by a competent authority and has a management
Gulf of Maine Research Institute Responsibly Harvested Seafood from the Gulf of Maine Region Report on Atlantic Sea Scallops (Inshore Canada) The fishery is managed by a competent authority and has a management
AGENCY: National Marine Fisheries Service (NMFS), National Oceanic and Atmospheric
, National Oceanic and Atmospheric") This document is scheduled to be published in the Federal Register on 05/30/2013 and available online at http://federalregister.gov/a/2013-12869, and on FDsys.gov BILLING CODE 3510-22-P DEPARTMENT OF COMMERCE
This document is scheduled to be published in the Federal Register on 05/30/2013 and available online at http://federalregister.gov/a/2013-12869, and on FDsys.gov BILLING CODE 3510-22-P DEPARTMENT OF COMMERCE
3.4.3 Advice June Barents Sea and Norwegian Sea Cod in Subareas I and II (Norwegian coastal waters cod)
") 3.4.3 Advice June 2013 ECOREGION STOCK Barents Sea and Norwegian Sea Cod in Subareas I and II (Norwegian coastal waters cod) Advice for 2014 ICES advises on the basis of the Norwegian rebuilding plan,
3.4.3 Advice June 2013 ECOREGION STOCK Barents Sea and Norwegian Sea Cod in Subareas I and II (Norwegian coastal waters cod) Advice for 2014 ICES advises on the basis of the Norwegian rebuilding plan,
Advice June 2014
 5.3.23 Advice June 2014 ECOREGION STOCK Celtic Sea and West of Scotland Plaice in Division VIIa (Irish Sea) Advice for 2015 Based on ICES approach to data-limited stocks, ICES advises that catches should
West Coast of Newfoundland Atlantic Herring (Division 4R)
") Pêches et Océans Canada Sciences Fisheries and Oceans Canada Science DFO Sciences Stock Status Report B4-1 (1999) 52 6 59 58 57 51 QUEBEC LOWER NORTH SHORE 2 Meters 4Ra STRAIT OF BELLE ISLE ST. JOHN'S
Pêches et Océans Canada Sciences Fisheries and Oceans Canada Science DFO Sciences Stock Status Report B4-1 (1999) 52 6 59 58 57 51 QUEBEC LOWER NORTH SHORE 2 Meters 4Ra STRAIT OF BELLE ISLE ST. JOHN'S
Whiting (Merlangius merlangus) in divisions 7.b c and 7.e k (southern Celtic Seas and western English Channel)
 in divisions 7.b c and 7.e k (southern Celtic Seas and western English Channel)") ICES Advice on fishing opportunities, catch, and effort Celtic Seas, Greater North Sea, and Oceanic Northeast Atlantic ecoregions Published 30 June 2017 Version 2: 07 July 2017 DOI: 10.17895/ices.pub.3269
ICES Advice on fishing opportunities, catch, and effort Celtic Seas, Greater North Sea, and Oceanic Northeast Atlantic ecoregions Published 30 June 2017 Version 2: 07 July 2017 DOI: 10.17895/ices.pub.3269
Warmer temperatures, molt timing and lobster seasons in the Canadian Maritimes
 Warmer temperatures, molt timing and lobster seasons in the Canadian Maritimes John Tremblay 1, Jean Lavallee 2 and Ross Claytor 1 1 Population Ecology Division, Fisheries and Oceans, Bedford Institute
2009 UPDATE ON CANADA S BLUEFIN TUNA FISHERIES
 SCRS/9/162 Collect. Vol. Sci. Pap. ICCAT, 65(3): 858-863 () 9 UPDATE ON CANADA S BLUEFIN TUNA FISHERIES Stacey D. Paul, Sean C. Smith and John D. Neilson 1 SUMMARY This document provides a brief update
Report on the Comparative Fishing Trial Between the Gadus Atlantica and Teleost
 NAFO Sci. Coun. Studies, 29: 81 92 Report on the Comparative Fishing Trial Between the Gadus Atlantica and Teleost William G. Warren Science Branch, Department of Fisheries and Oceans P. O. Box 5667, St.
NOMINAL CPUE FOR THE CANADIAN SWORDFISH LONGLINE FISHERY
 SCRS/2008/178 NOMINAL CPUE FOR THE CANADIAN SWORDFISH LONGLINE FISHERY 1988-2007 S. Smith and J. D. Neilson SUMMARY An update is presented of the nominal catch rate series and fishery distributions for
NOMINAL CATCH RATES FOR CANADIAN BLUEFIN TUNA IN 2006
 SCRS/2007/33 Collect. Vol. Sci. Pap. ICCAT, 62(4): 2-7 (2008) NOMINAL CATCH RATES FOR CANADIAN BLUEFIN TUNA IN 2006 S.D. Paul, S. Smith and J.D. Neilson SUMMARY Updated nominal catch rates are presented
TRAC. Document de référence 2011/03 Reference Document 2012/03
 CERT Comité d'évaluation des ressources transfrontalières TRAC Transboundary Resources Assessment Committee Document de référence 2011/03 Reference Document 2012/03 Ne pas citer sans autorisation des auteurs
Pelagic fishery for Sebastes mentella in the Irminger Sea
 3.2.6.d Pelagic fishery for Sebastes mentella in the Irminger Sea The stock structure of deep-sea redfish S. mentella in Sub-area XII, Division Va and Sub-area XIV and NAFO Div. 1F remains generally uncertain.
ASMFC Stock Assessment Overview: Red Drum
 Introduction This document presents a summary of the 217 stock assessments for red drum. These assessments were initially conducted through the Southeast Data, Assessment and Review (SEDAR) process using